Estimating the Effective Reproduction Number of COVID-19 by Country
Louis Rossouw
2023-02-25 00:45:11 GMT
1 Introduction
This paper contains estimates for the effective reproduction number
\(R_{t,m}\) over time \(t\) in various countries \(m\) of the world. This is done using the
methodology as described in [1]. These
have been implemented in R using EpiEstim package [2] which is what is used here. The methodology
and assumptions are described in more detail here.
This paper and it’s results should be updated roughly daily and is available online.
2 Updates
As this paper is updated over time this section will summarise significant changes. The code producing this paper is tracked using Git. The Git commit hash for this project at the time of generating this paper was 6cab0e089bd06c9688728ab585072be9bce67169.
The following major updates have been made:
- On 29 May 2021 all plots and maps were updated to consistently not plot reproduction number estimates where the 95% confidence interval associated with that estimate is wider than 1.
3 Data
Data are downloaded from [3]. Minor formatting is applied to get the data ready for further processing.
4 Basic Exploration
Below cumulative case count is plotted on a log scale by continent.
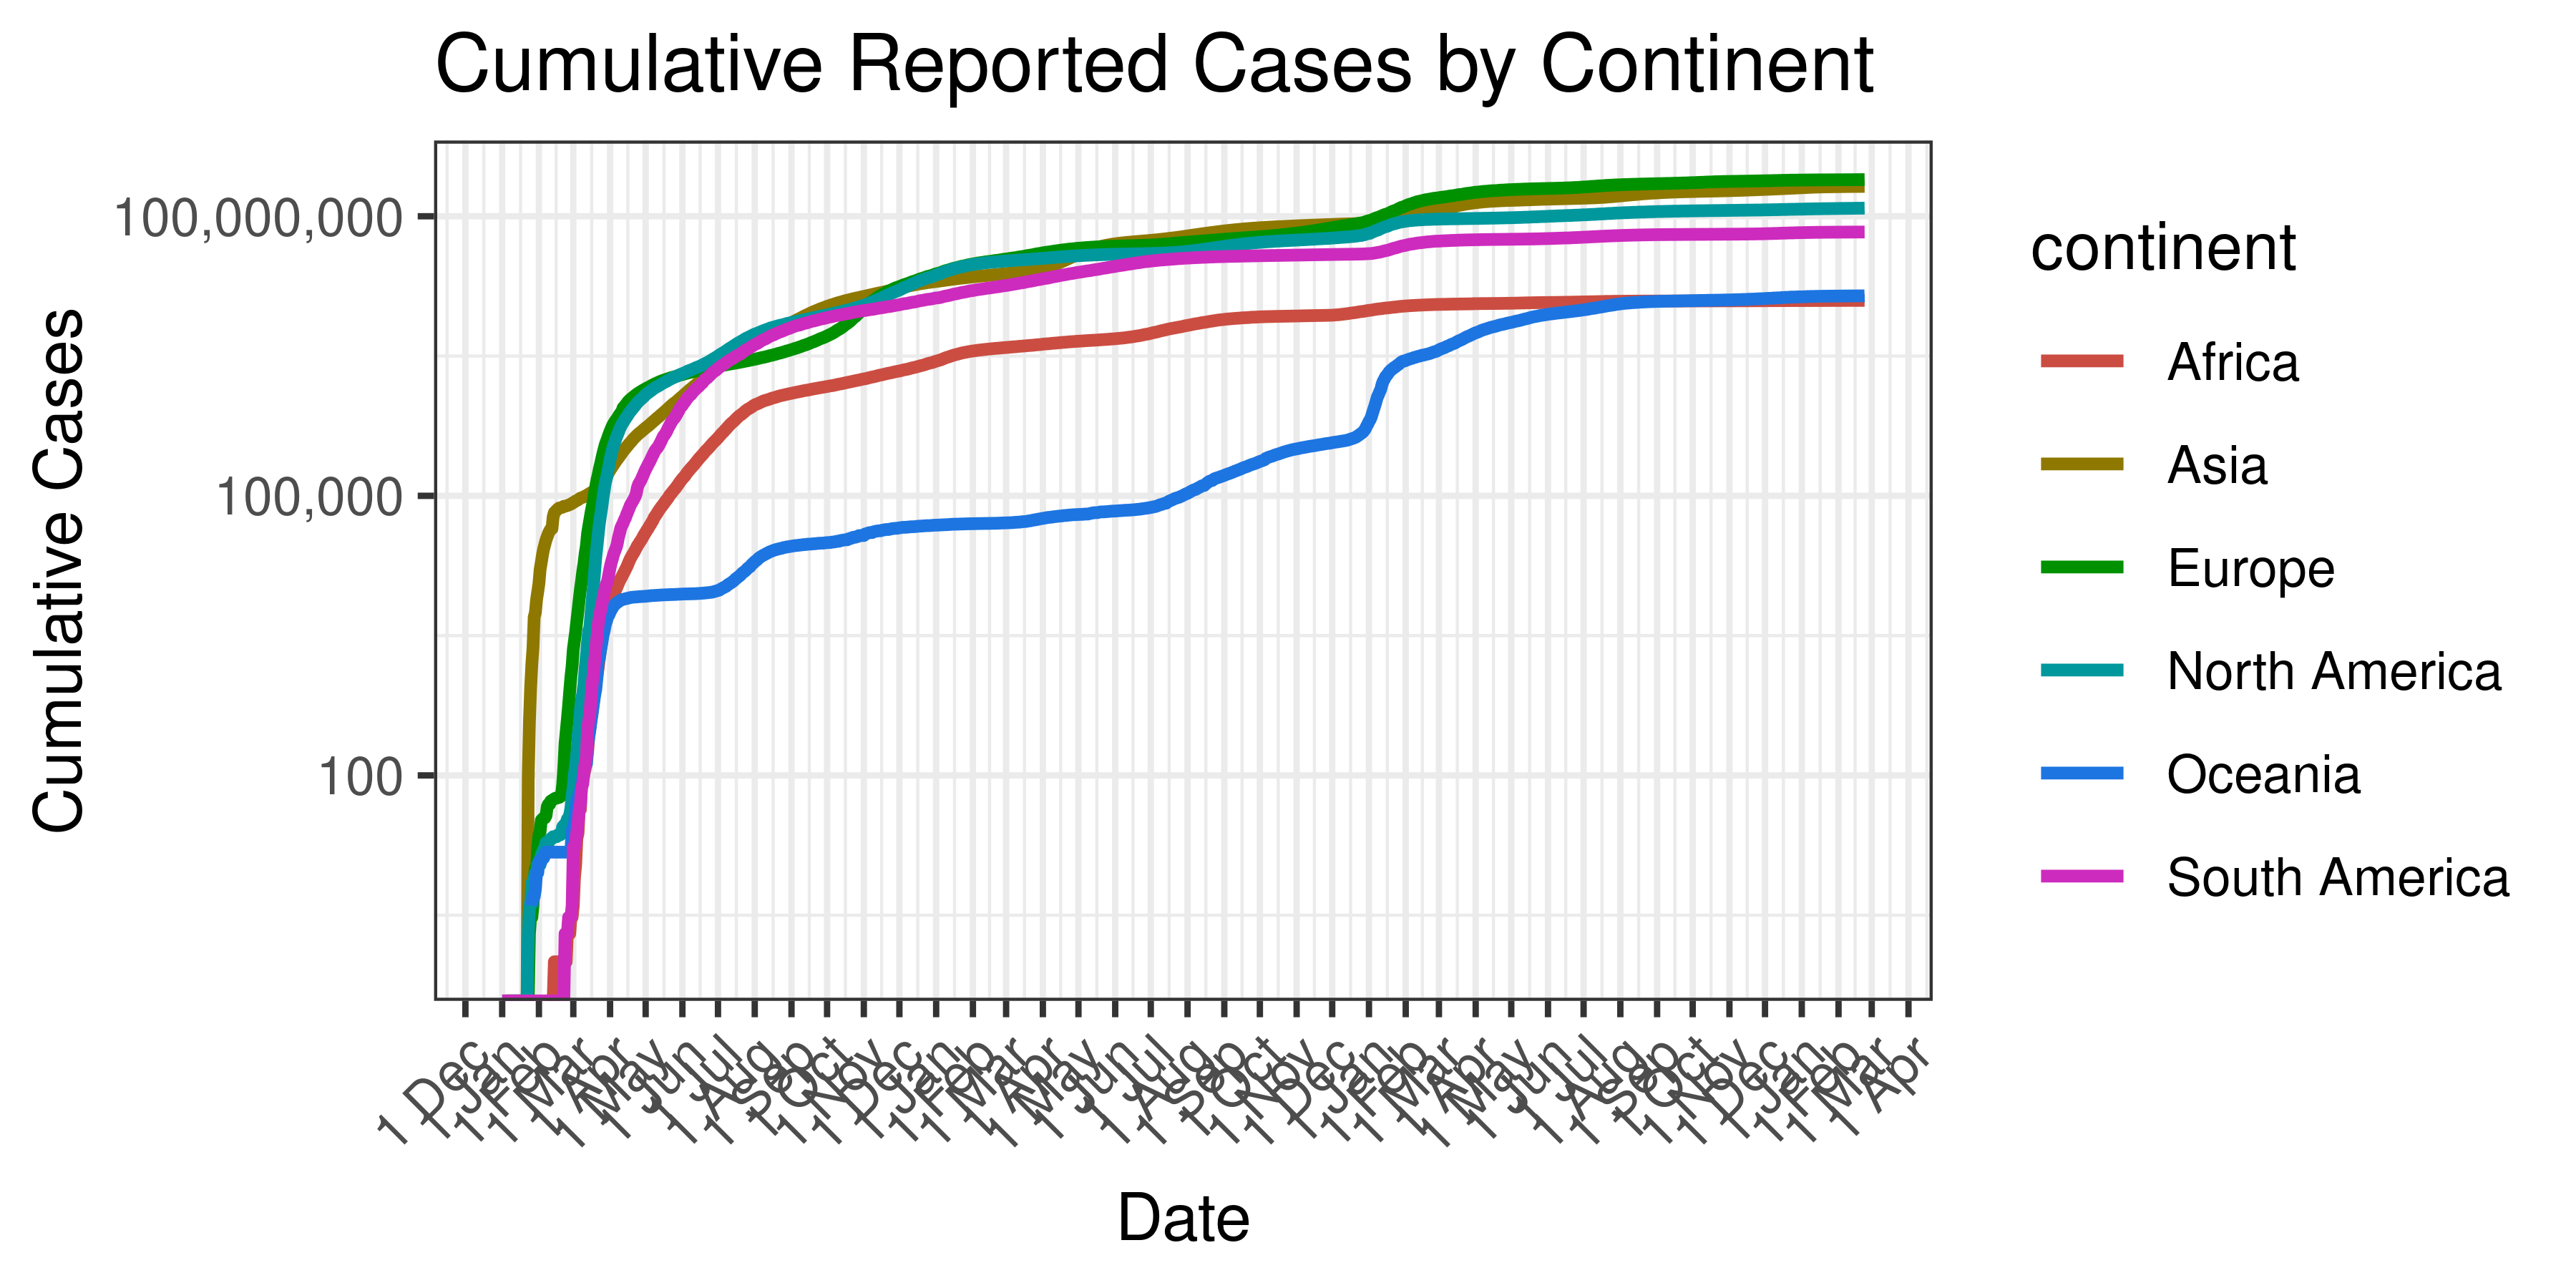
Cumulative Reported Cases by Continent
Below a 7-day moving average of daily case count is plotted on a log scale by continent.
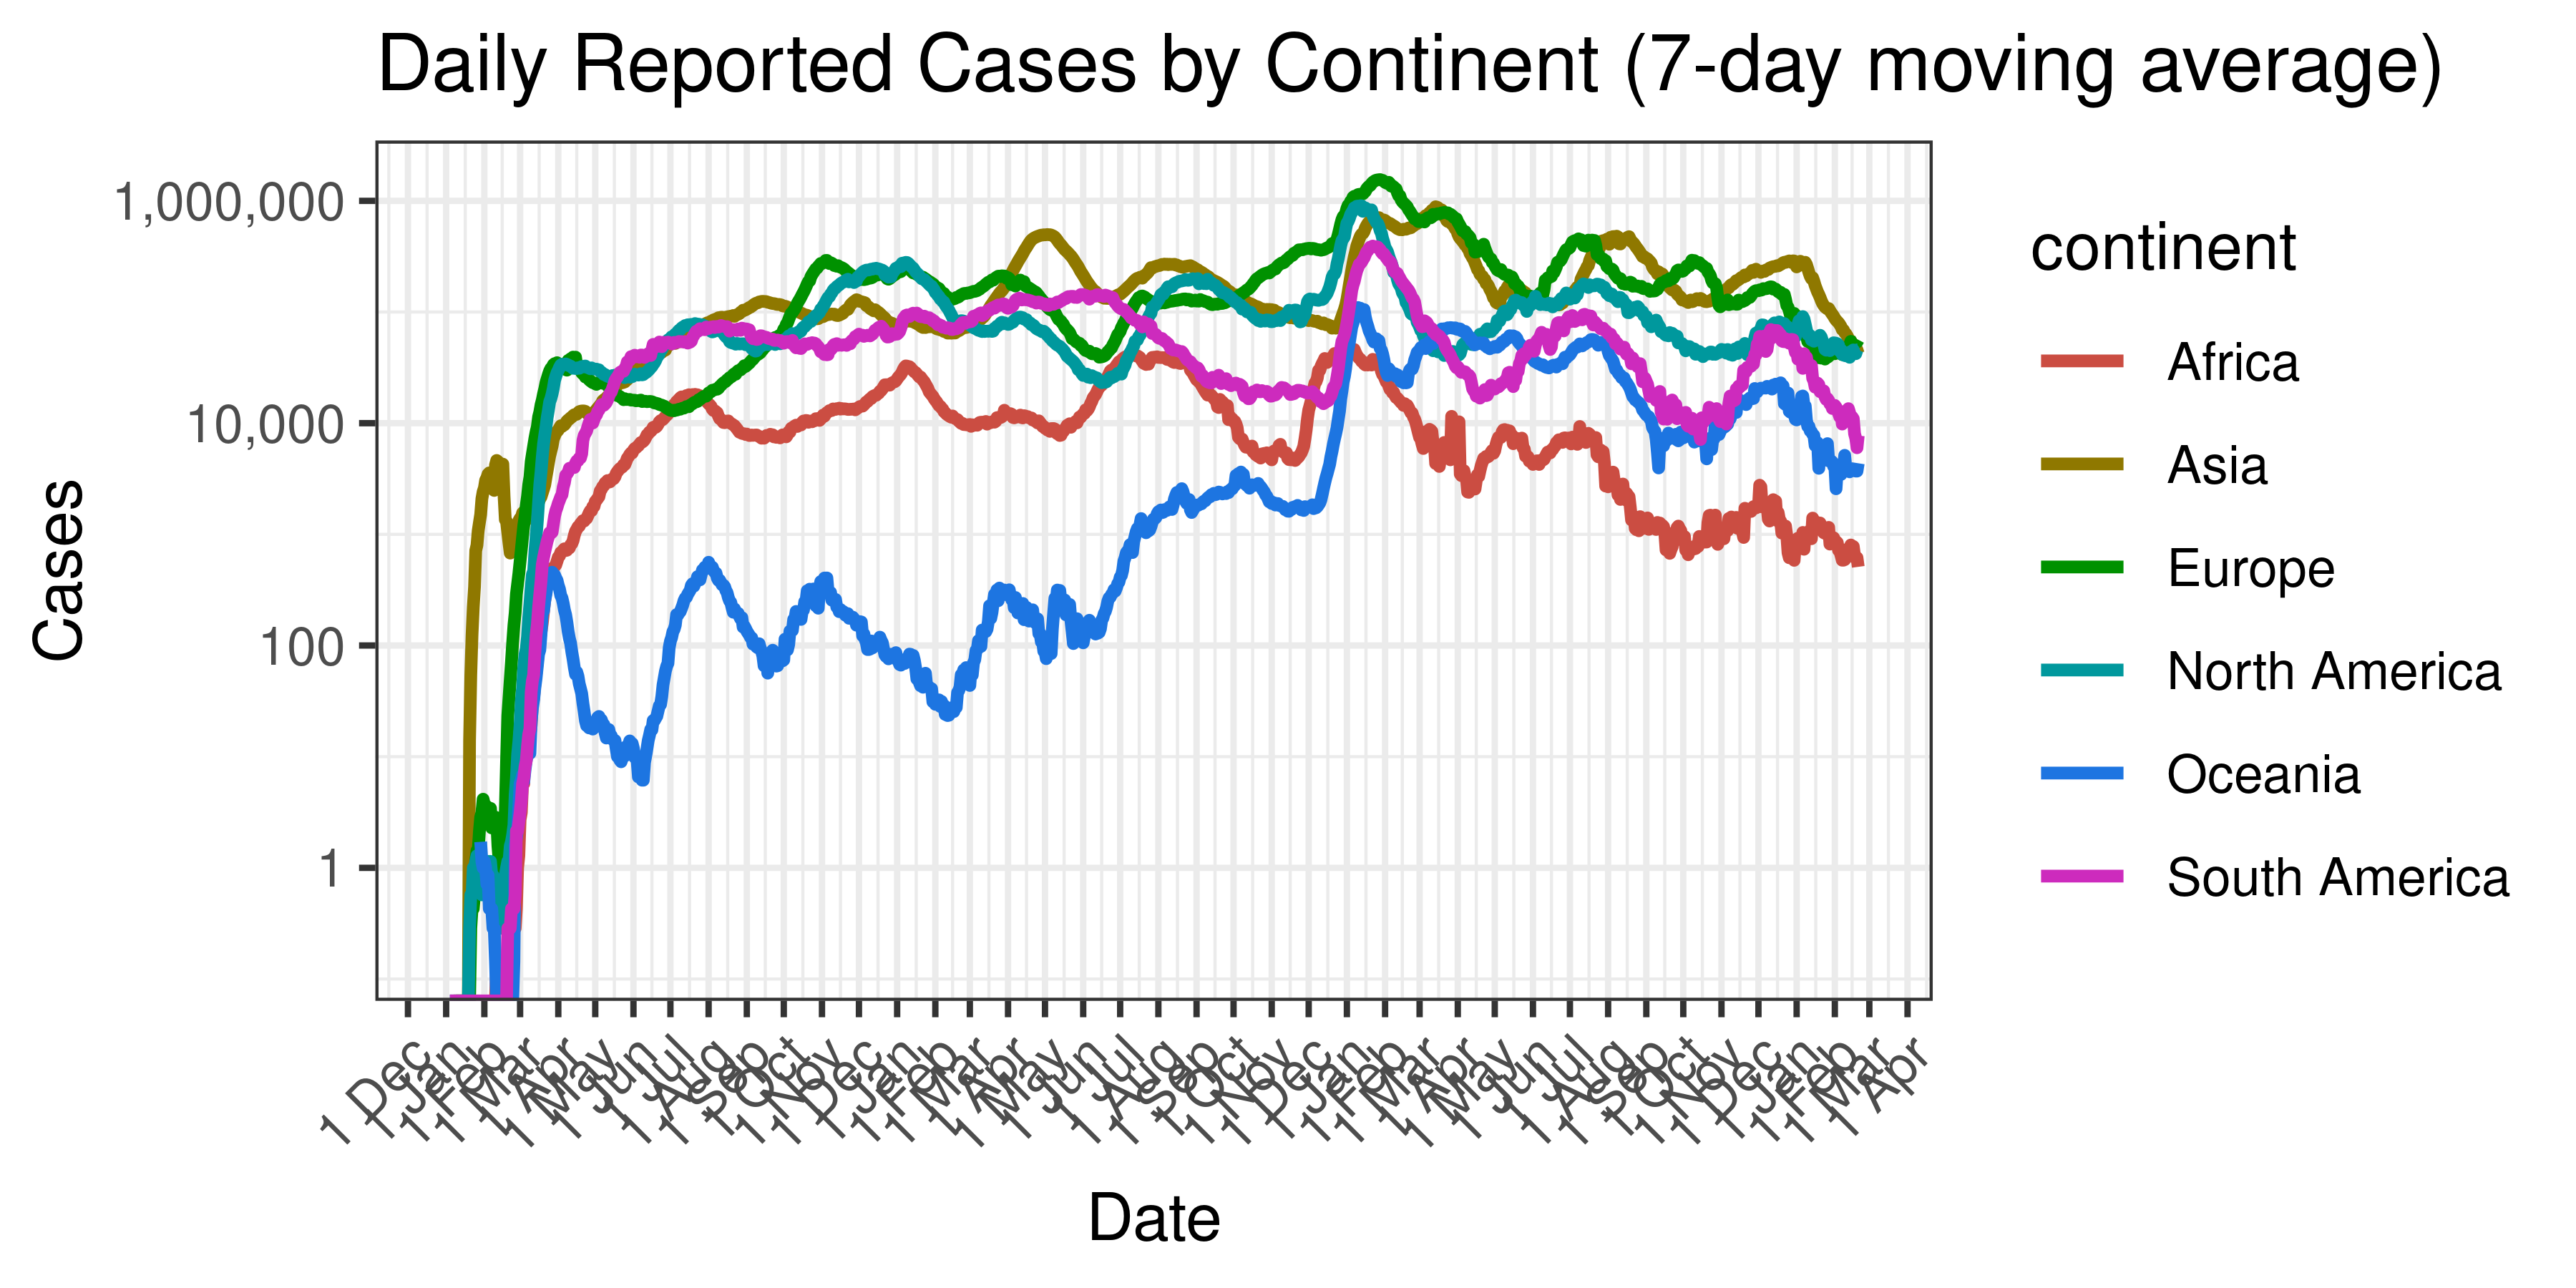
Daily Reported Cases by Continent (7-day moving average)
Below cumulative deaths by country is plotted on a log scale:
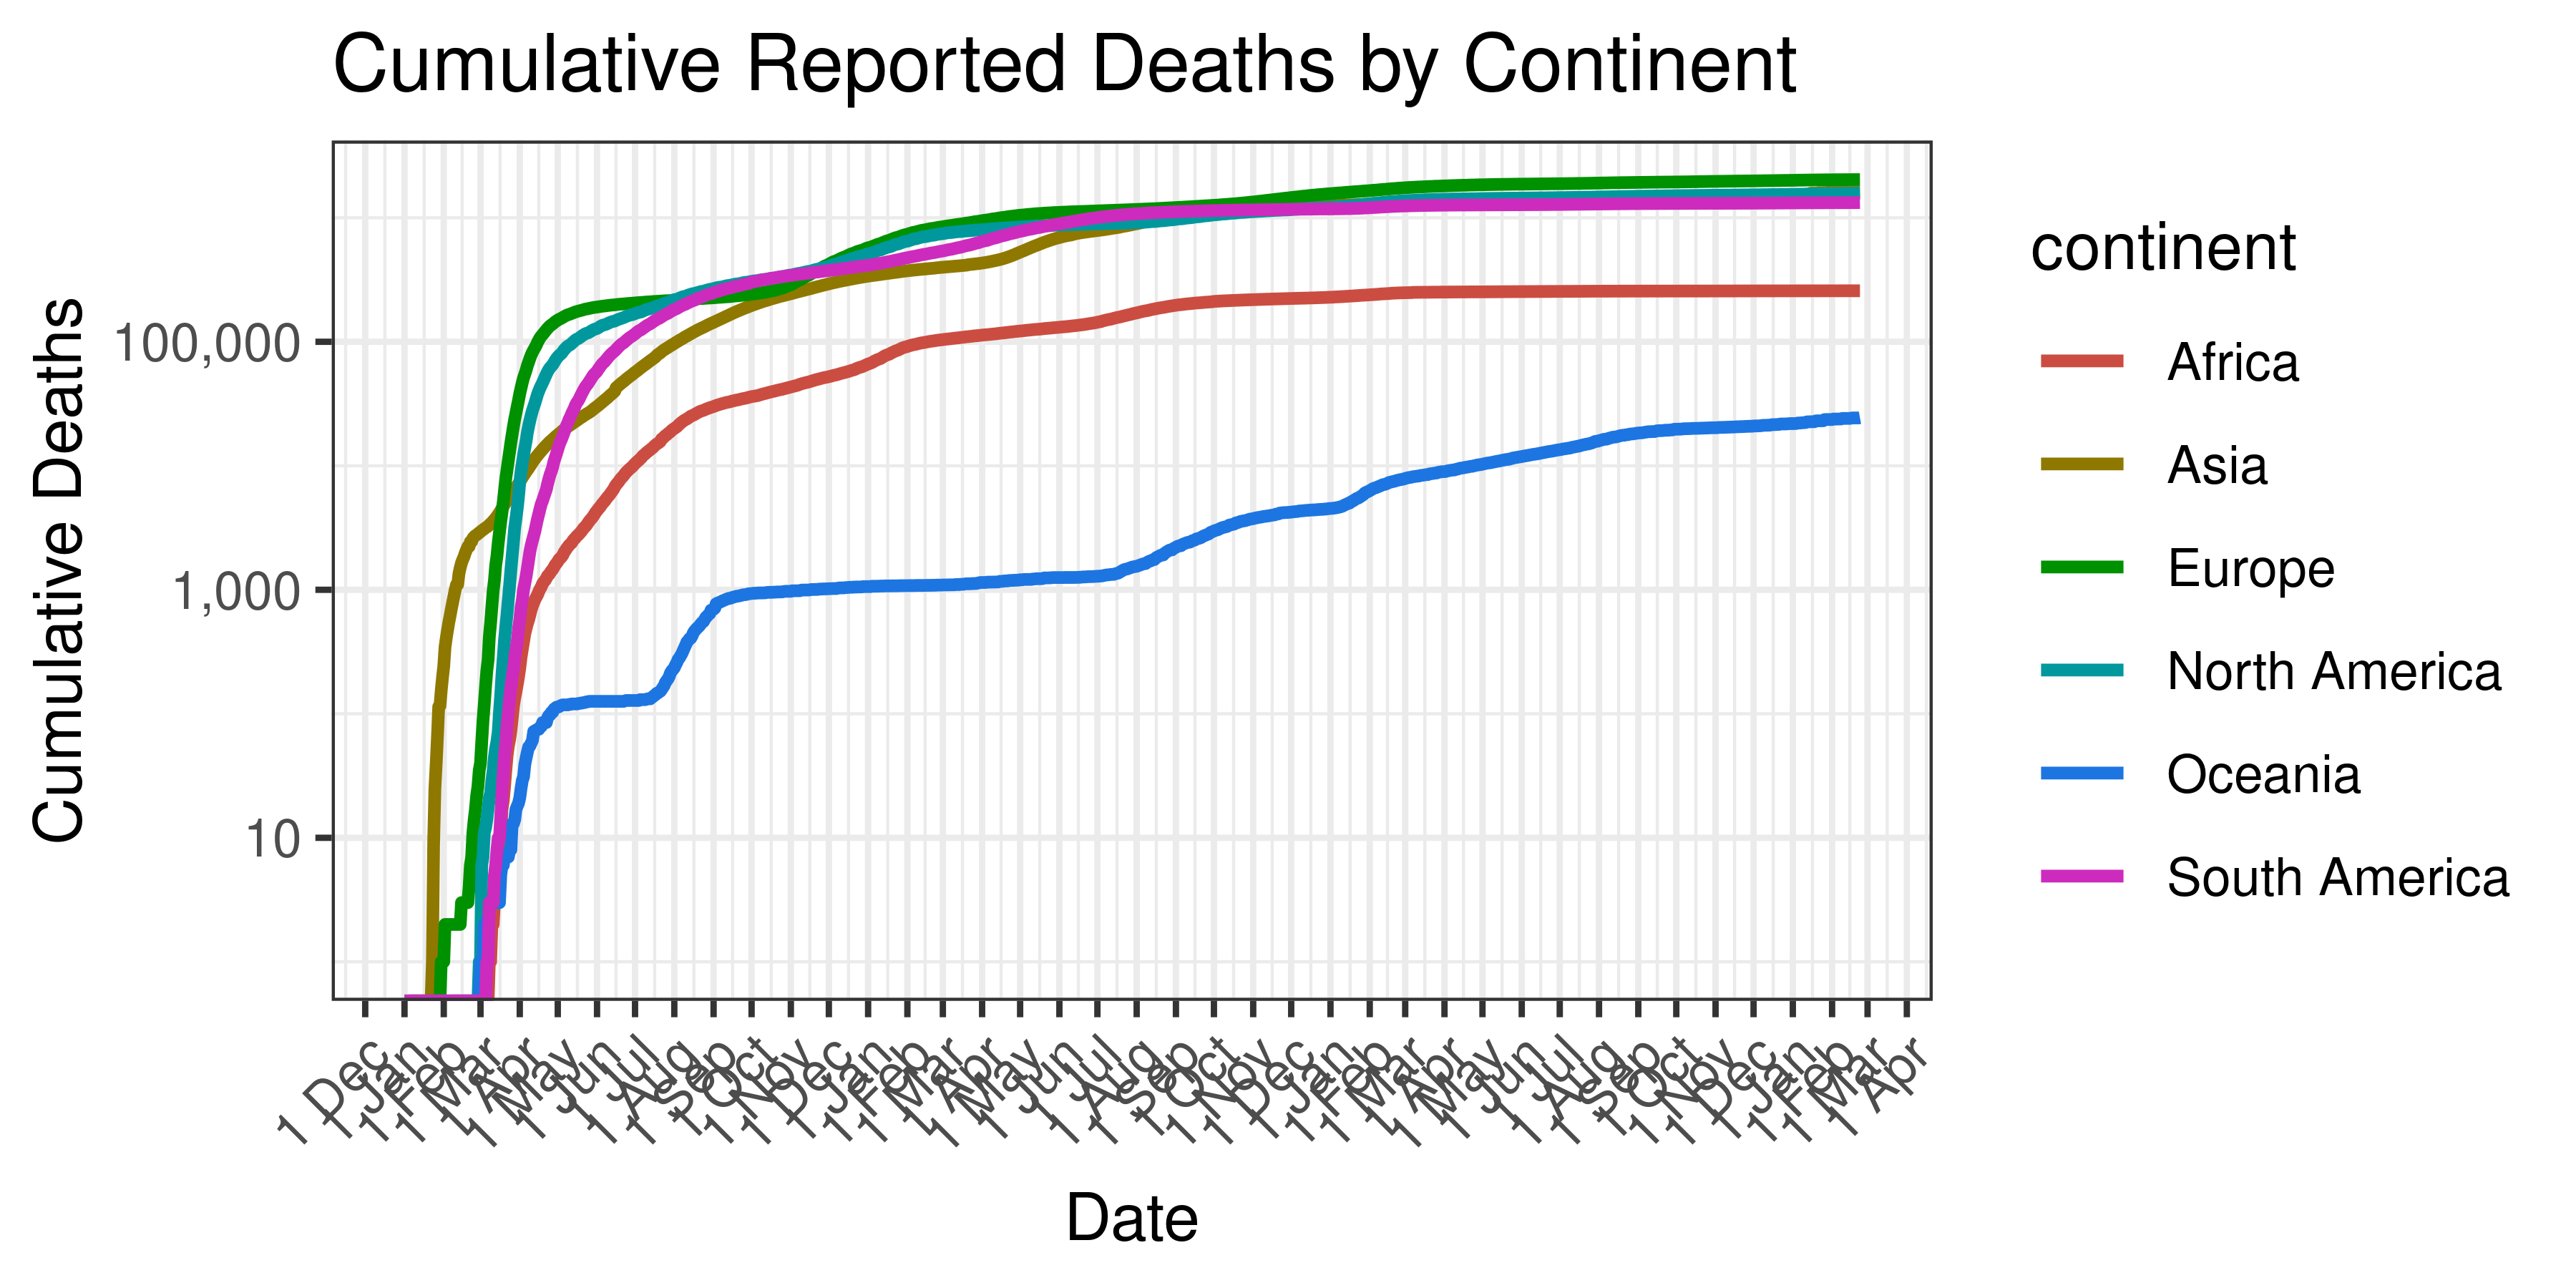
Cumulative Reported Deaths by Continent
Below a 7-day moving average of daily deaths by country is plotted on a log scale:
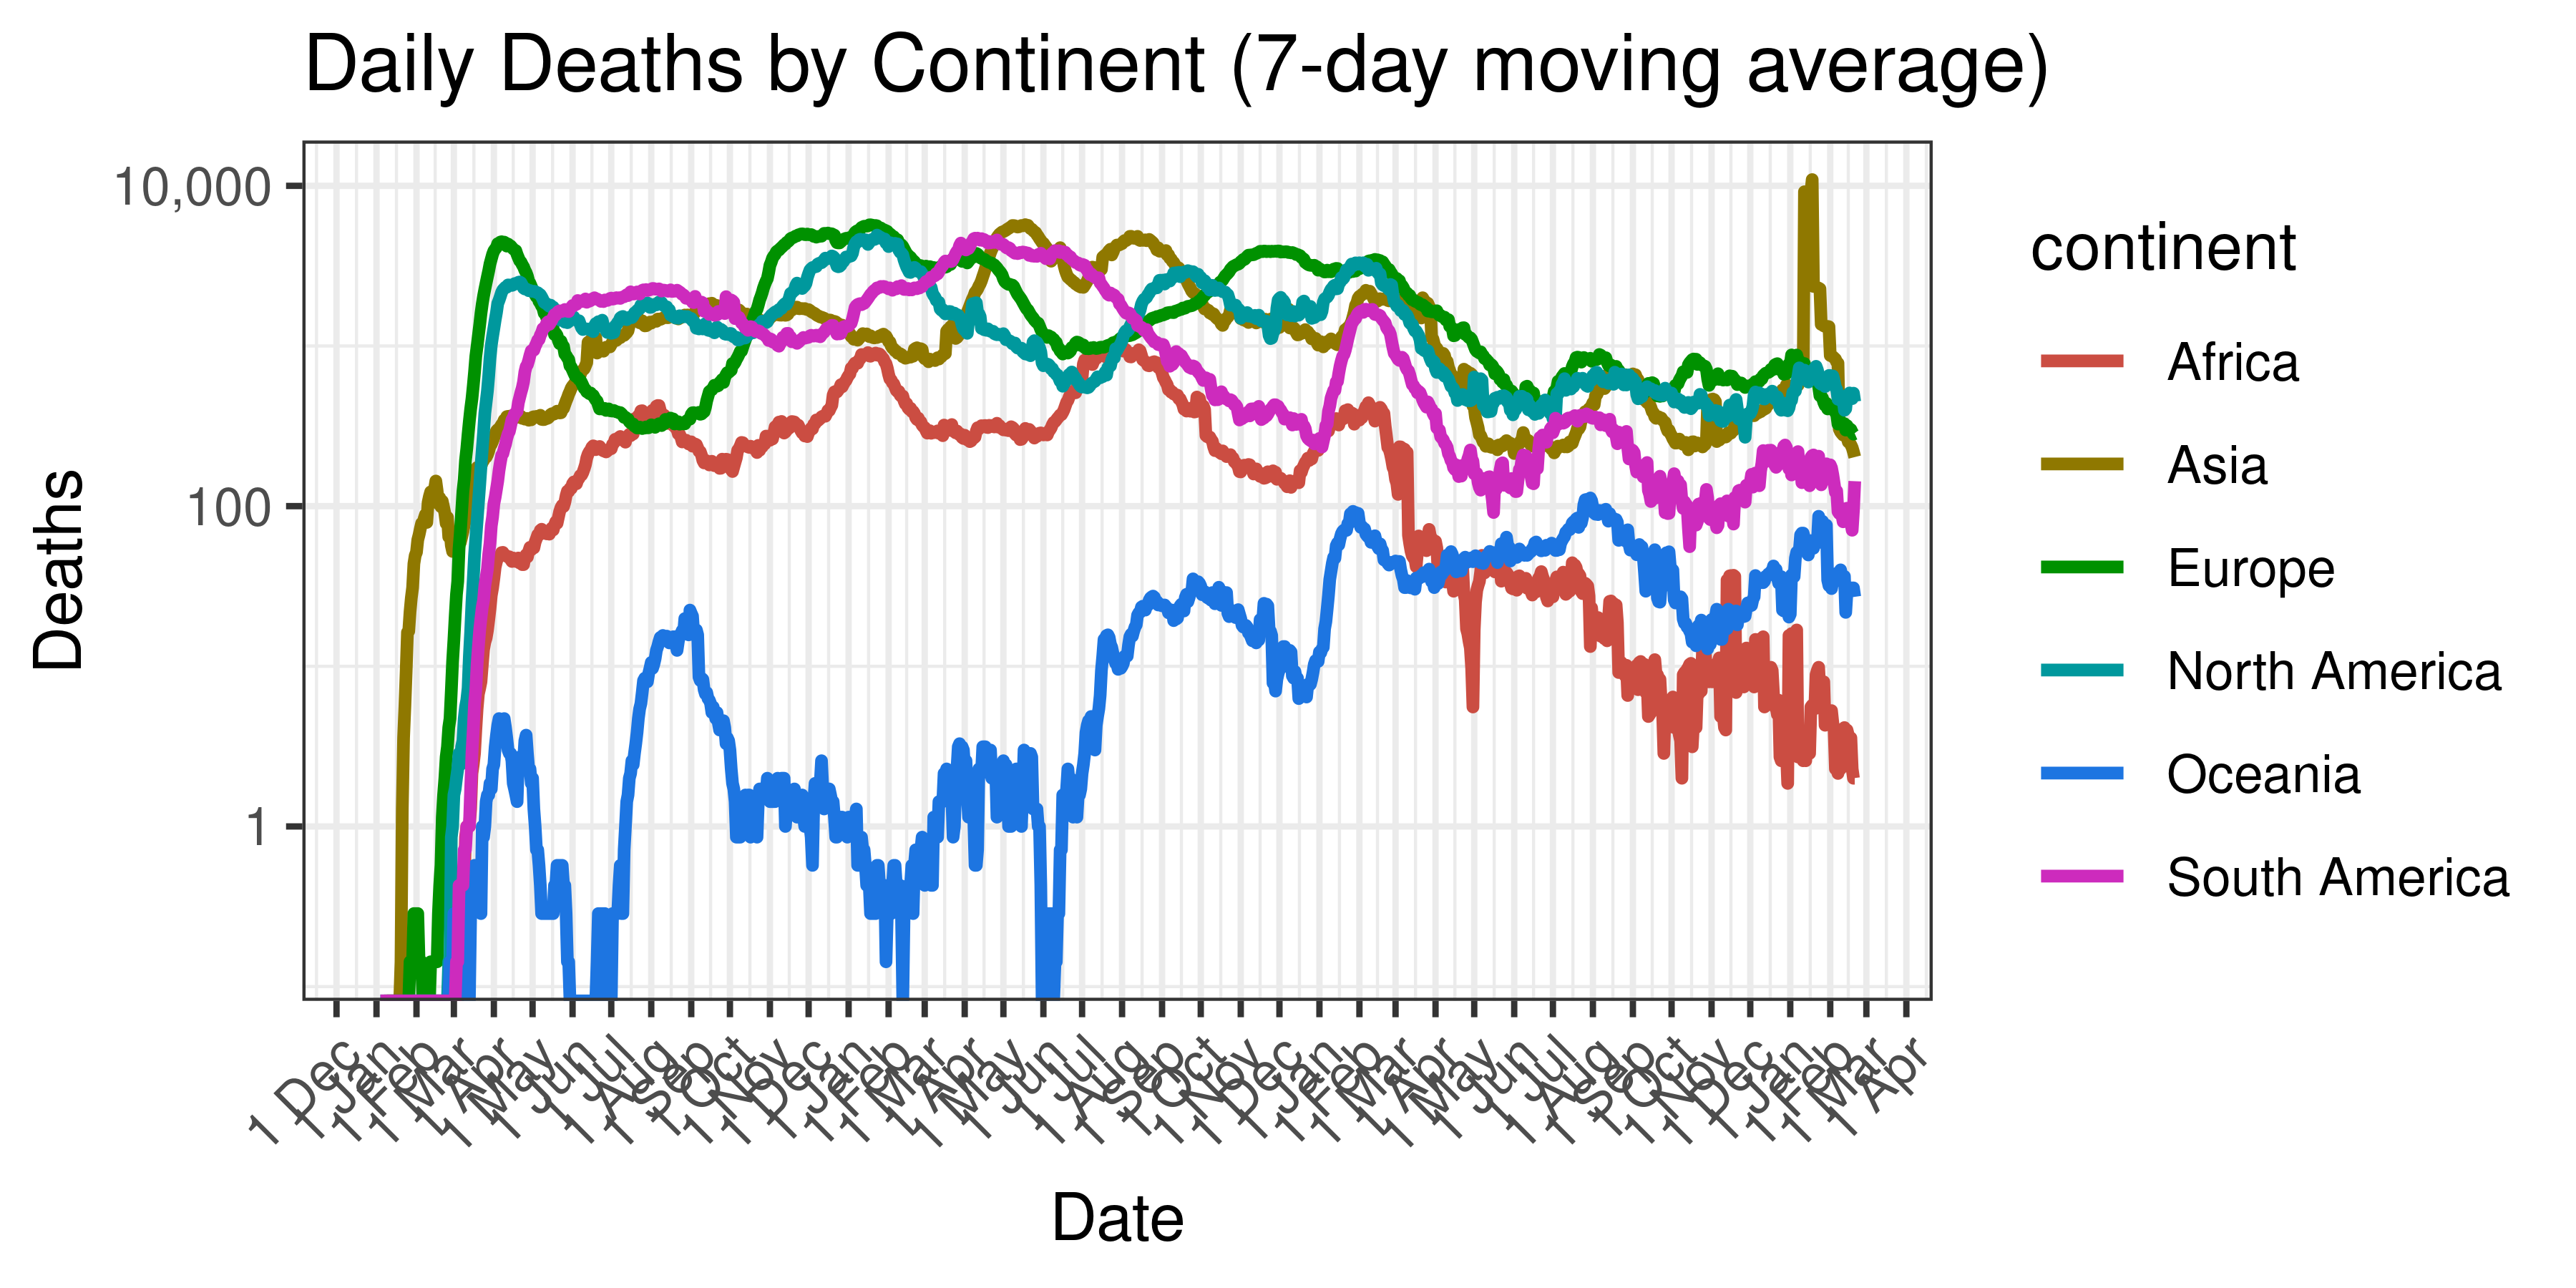
Daily Deaths by Continent (7-day moving average)
5 Method & Assumptions
The methodology is described in detail here.
Countries with populations of less than 500 000 are excluded.
6 Results
6.1 World-wide
| Estimated Type | Daily Count (Last Week) | Week Ending | Reproduction Number [95% Confidence Interval] |
|---|---|---|---|
| cases | 157,030 | 2023-02-23 | 0.96 [ 0.95 - 0.97] |
| deaths | 1,107 | 2023-02-23 | 0.95 [ 0.92 - 0.97] |
6.2 Current reproduction number estimates by country
Below current (last weekly) reproduction number estimates are plotted on a world map.
6.2.0.1 Cases
6.2.1 Deaths
6.3 Top 10 countries
Below we show various extremes of reproduction number estimates where the confidence interval does not exceed 1.
6.3.1 Lowest reproduction number estimates based on deaths
| Country | Estimated Type | Daily Count (Last Week) | Week Ending | Reproduction Number [95% Confidence Interval] |
|---|---|---|---|---|
| Lower middle income | deaths | 21 | 2023-02-23 | 0.68 [ 0.57 - 0.79] |
| Japan | deaths | 106 | 2023-02-23 | 0.72 [ 0.66 - 0.78] |
| Asia | deaths | 202 | 2023-02-23 | 0.77 [ 0.70 - 0.83] |
| South Korea | deaths | 14 | 2023-02-23 | 0.78 [ 0.64 - 0.95] |
| Taiwan | deaths | 50 | 2023-02-23 | 0.85 [ 0.76 - 0.94] |
| Australia | deaths | 24 | 2023-02-23 | 0.87 [ 0.74 - 1.01] |
| High income | deaths | 864 | 2023-02-23 | 0.88 [ 0.86 - 0.91] |
| Oceania | deaths | 27 | 2023-02-23 | 0.90 [ 0.77 - 1.03] |
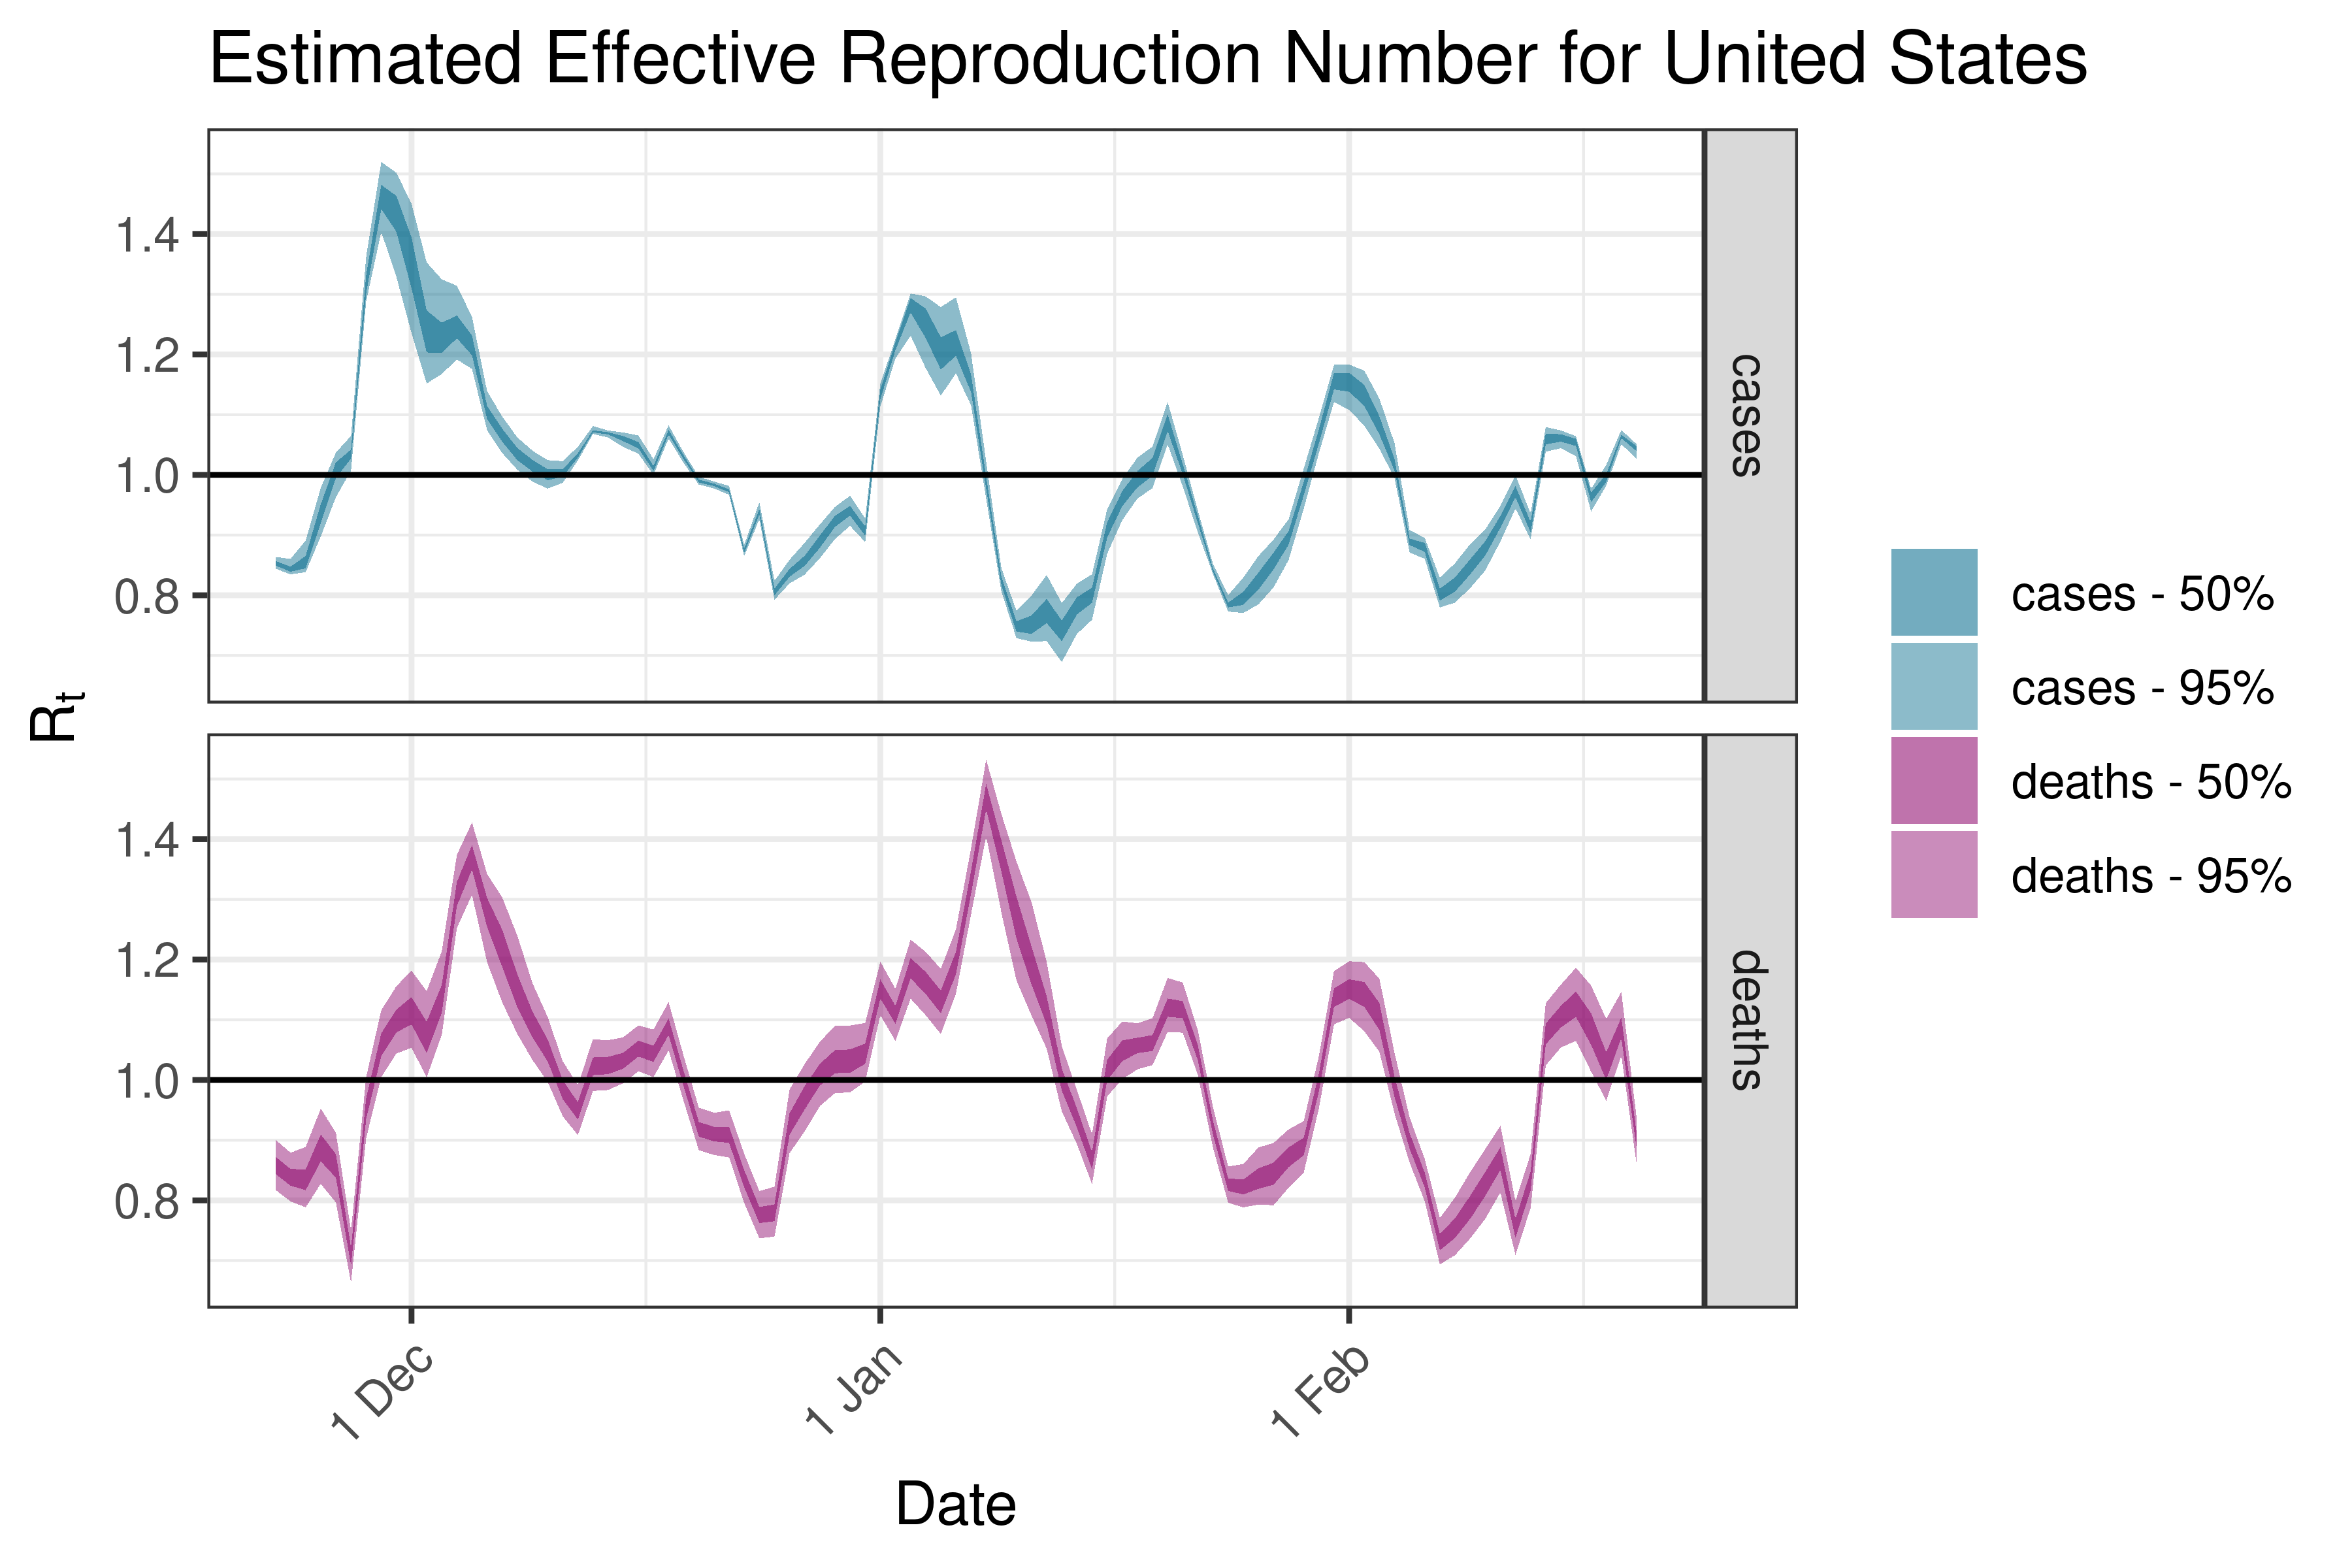
| United States | deaths | 374 | 2023-02-23 | 0.90 [ 0.86 - 0.94] |
| Germany | deaths | 73 | 2023-02-23 | 0.92 [ 0.83 - 1.00] |
6.3.2 Lowest reproduction number estimates based on cases
| Country | Estimated Type | Daily Count (Last Week) | Week Ending | Reproduction Number [95% Confidence Interval] |
|---|---|---|---|---|
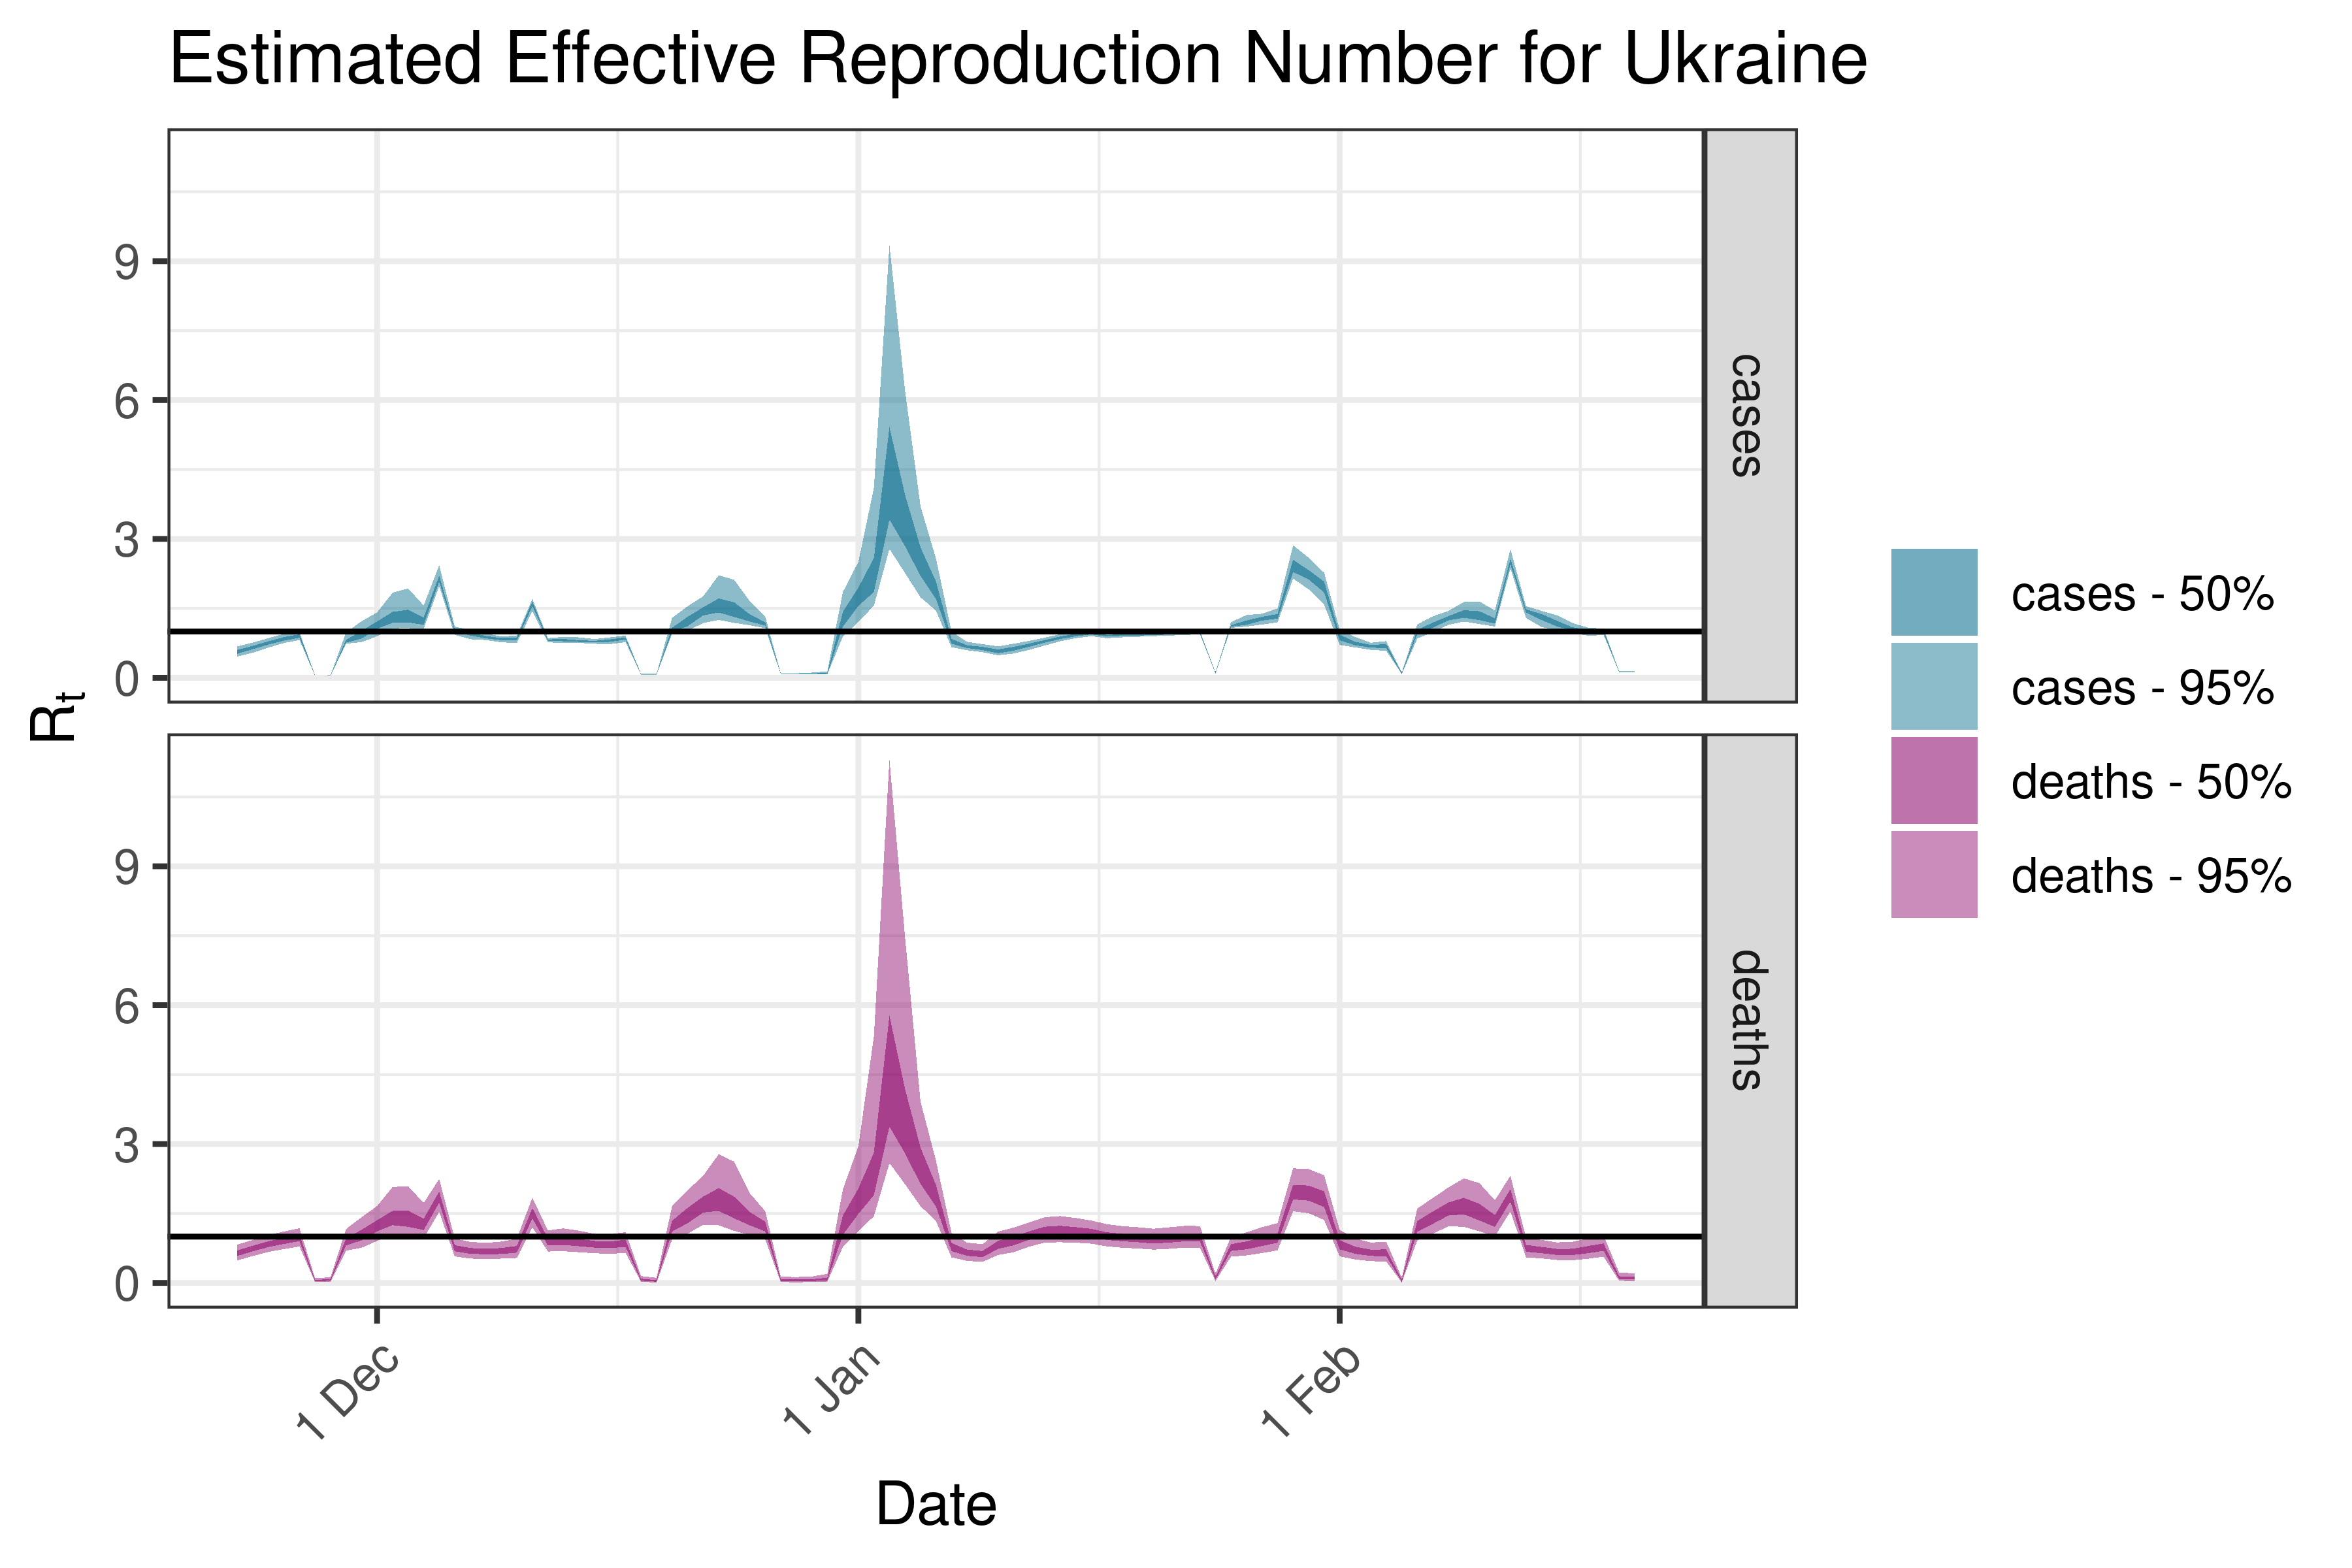
| Ukraine | cases | 114 | 2023-02-23 | 0.13 [ 0.12 - 0.15] |
| South Africa | cases | 144 | 2023-02-23 | 0.38 [ 0.33 - 0.45] |
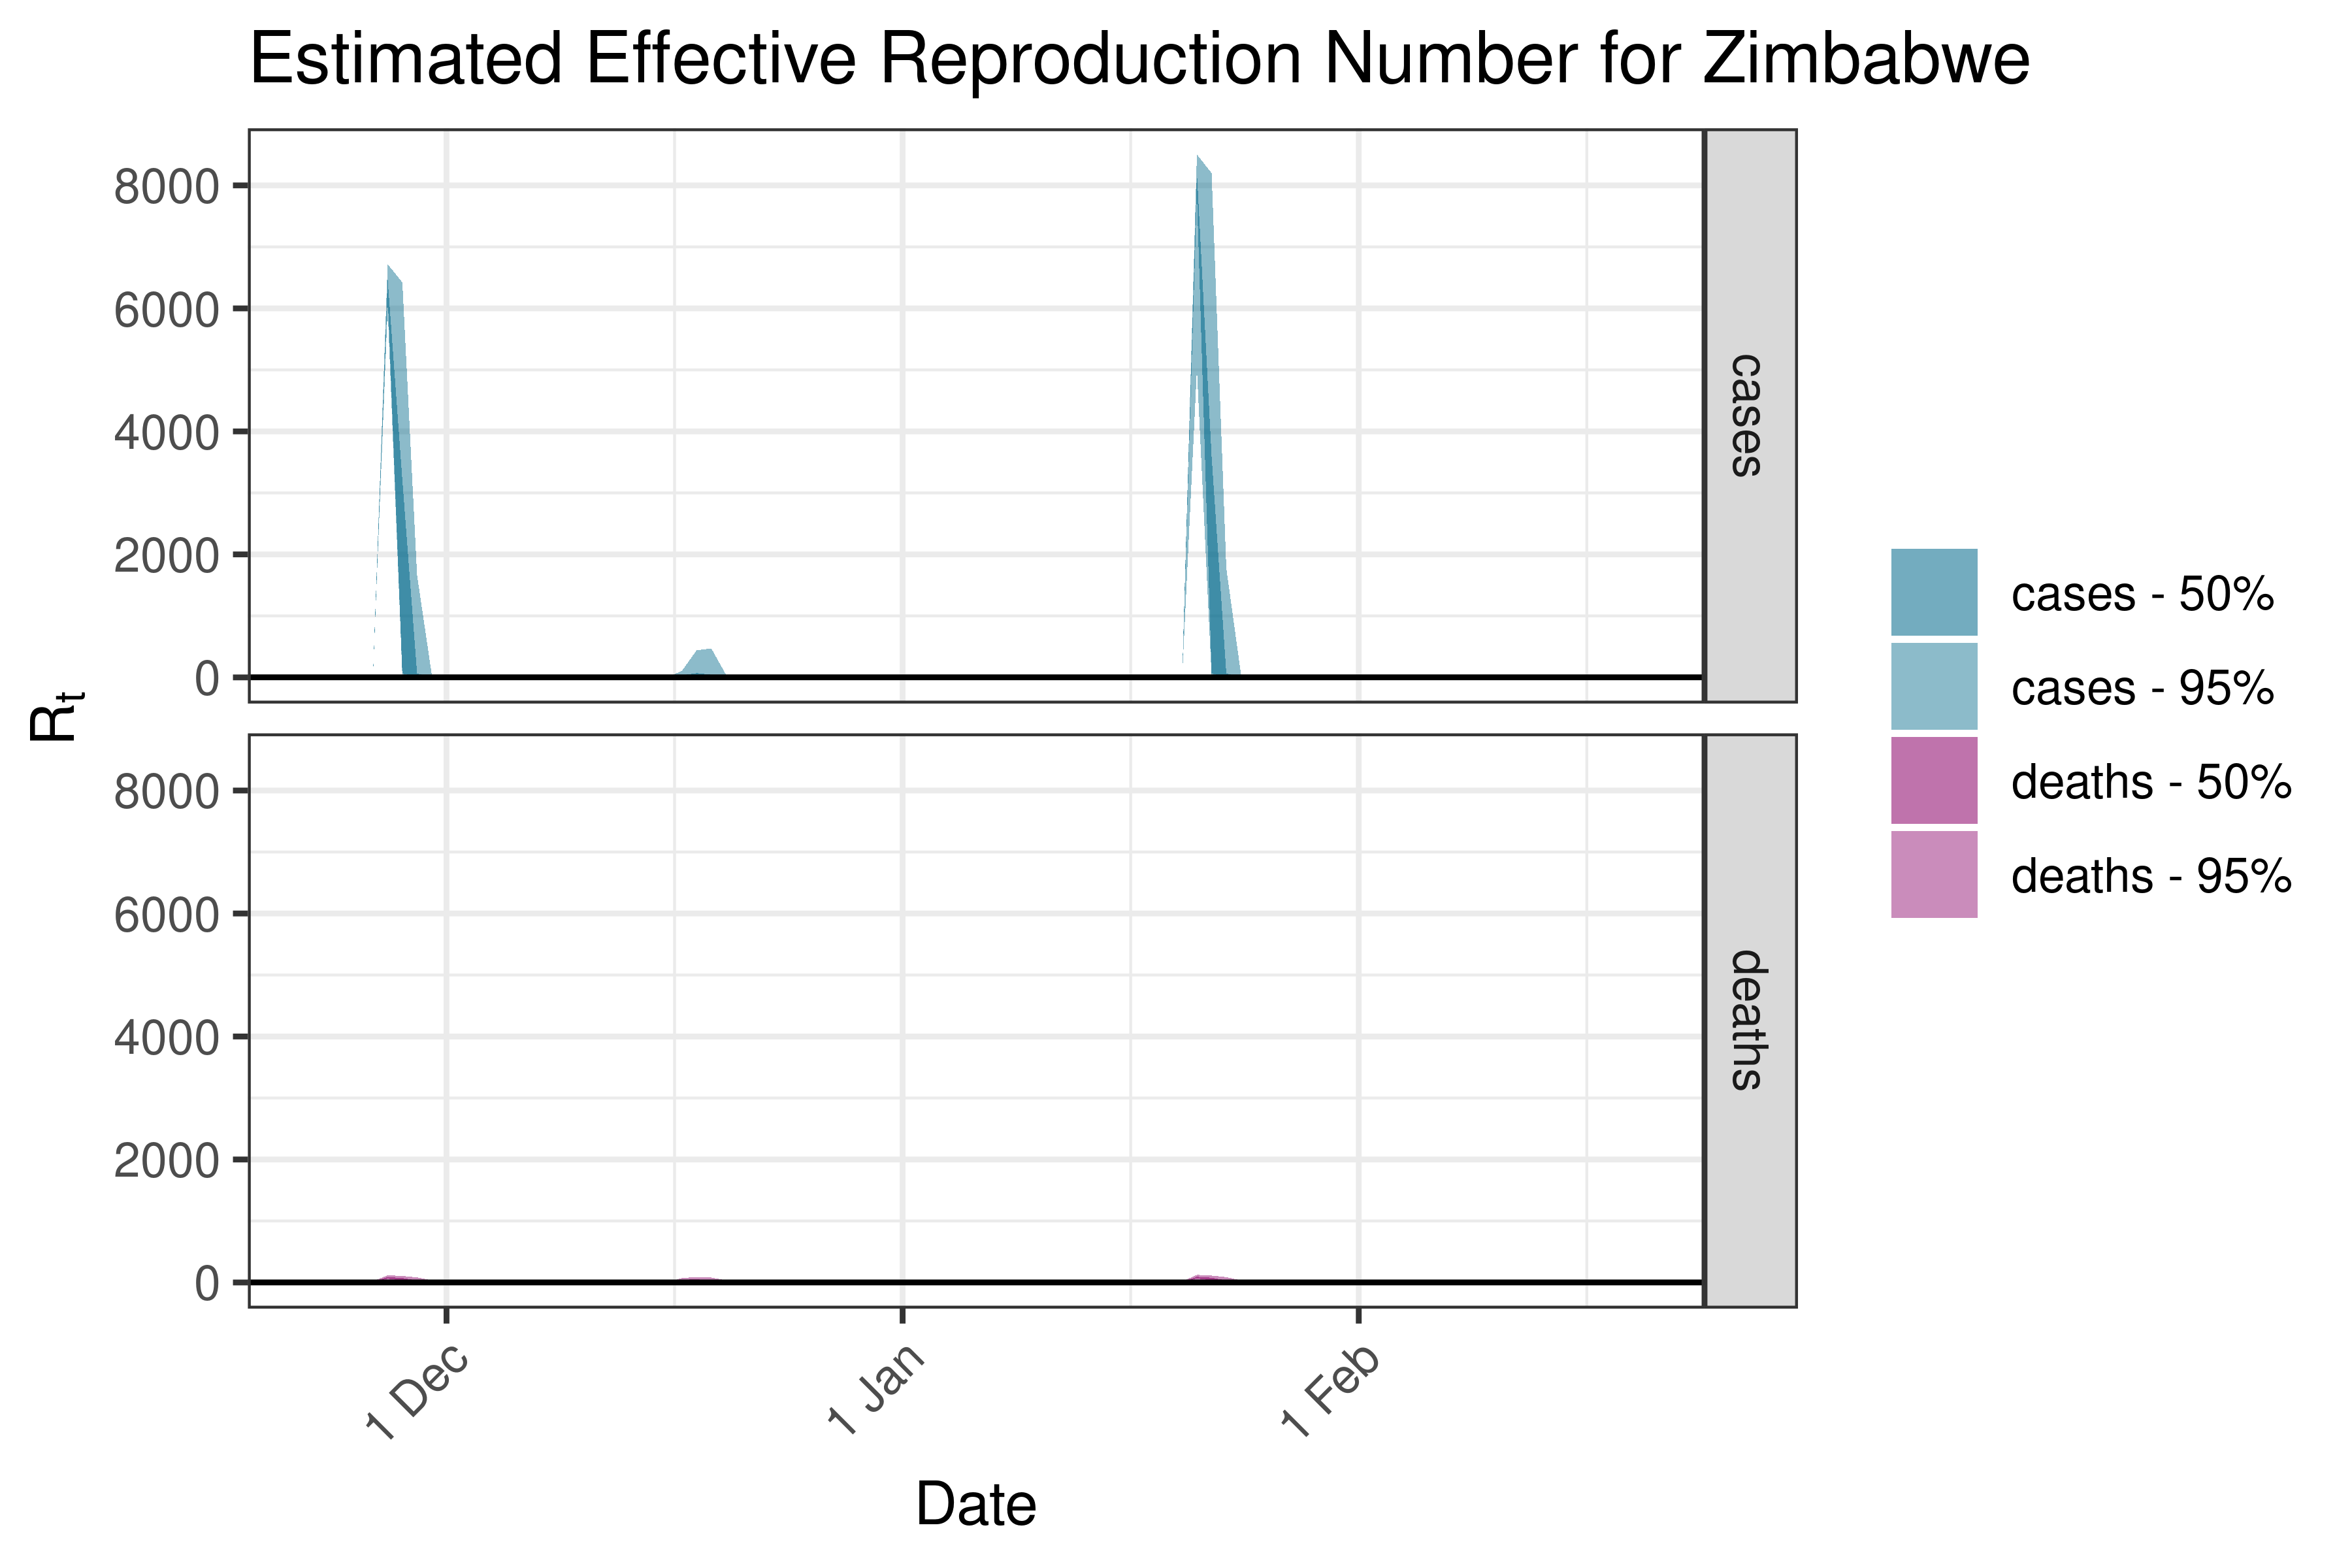
| Zimbabwe | cases | 40 | 2023-02-23 | 0.49 [ 0.43 - 0.55] |
| Peru | cases | 77 | 2023-02-23 | 0.49 [ 0.45 - 0.55] |
| Uruguay | cases | 40 | 2023-02-23 | 0.55 [ 0.48 - 0.62] |
| Lower middle income | cases | 1,169 | 2023-02-23 | 0.55 [ 0.52 - 0.57] |
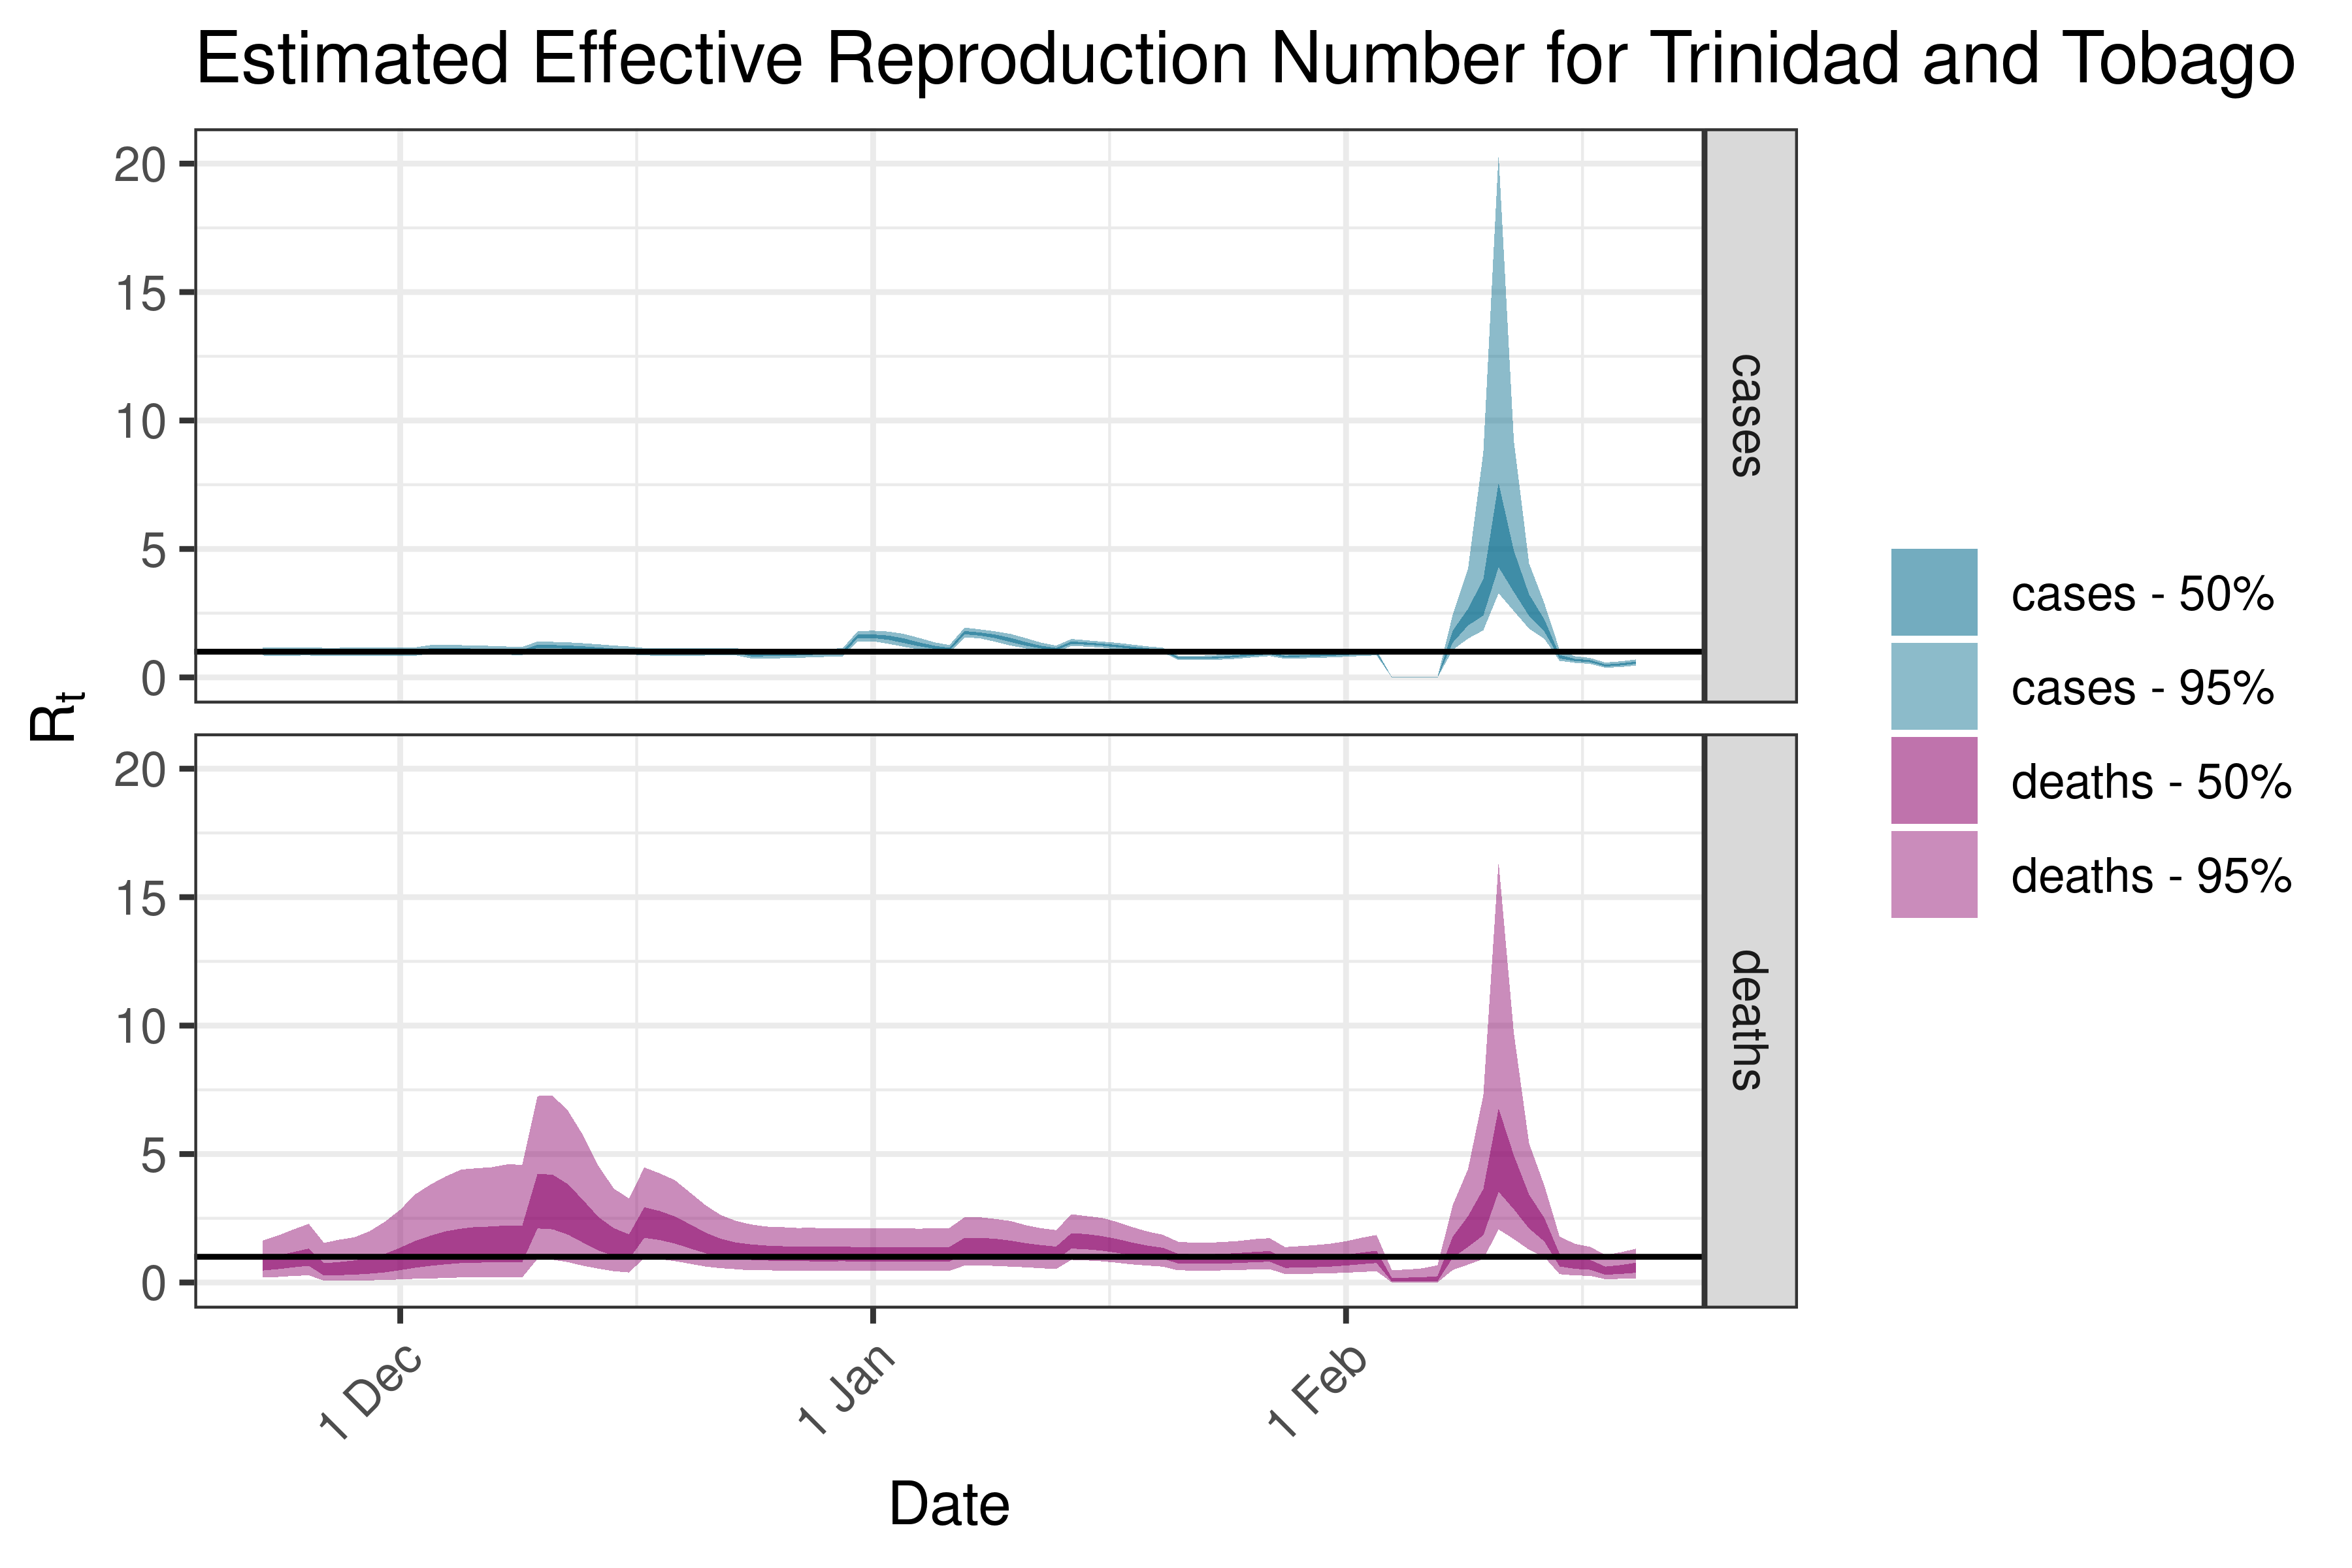
| Trinidad and Tobago | cases | 32 | 2023-02-23 | 0.57 [ 0.46 - 0.70] |
| Croatia | cases | 31 | 2023-02-23 | 0.58 [ 0.51 - 0.66] |
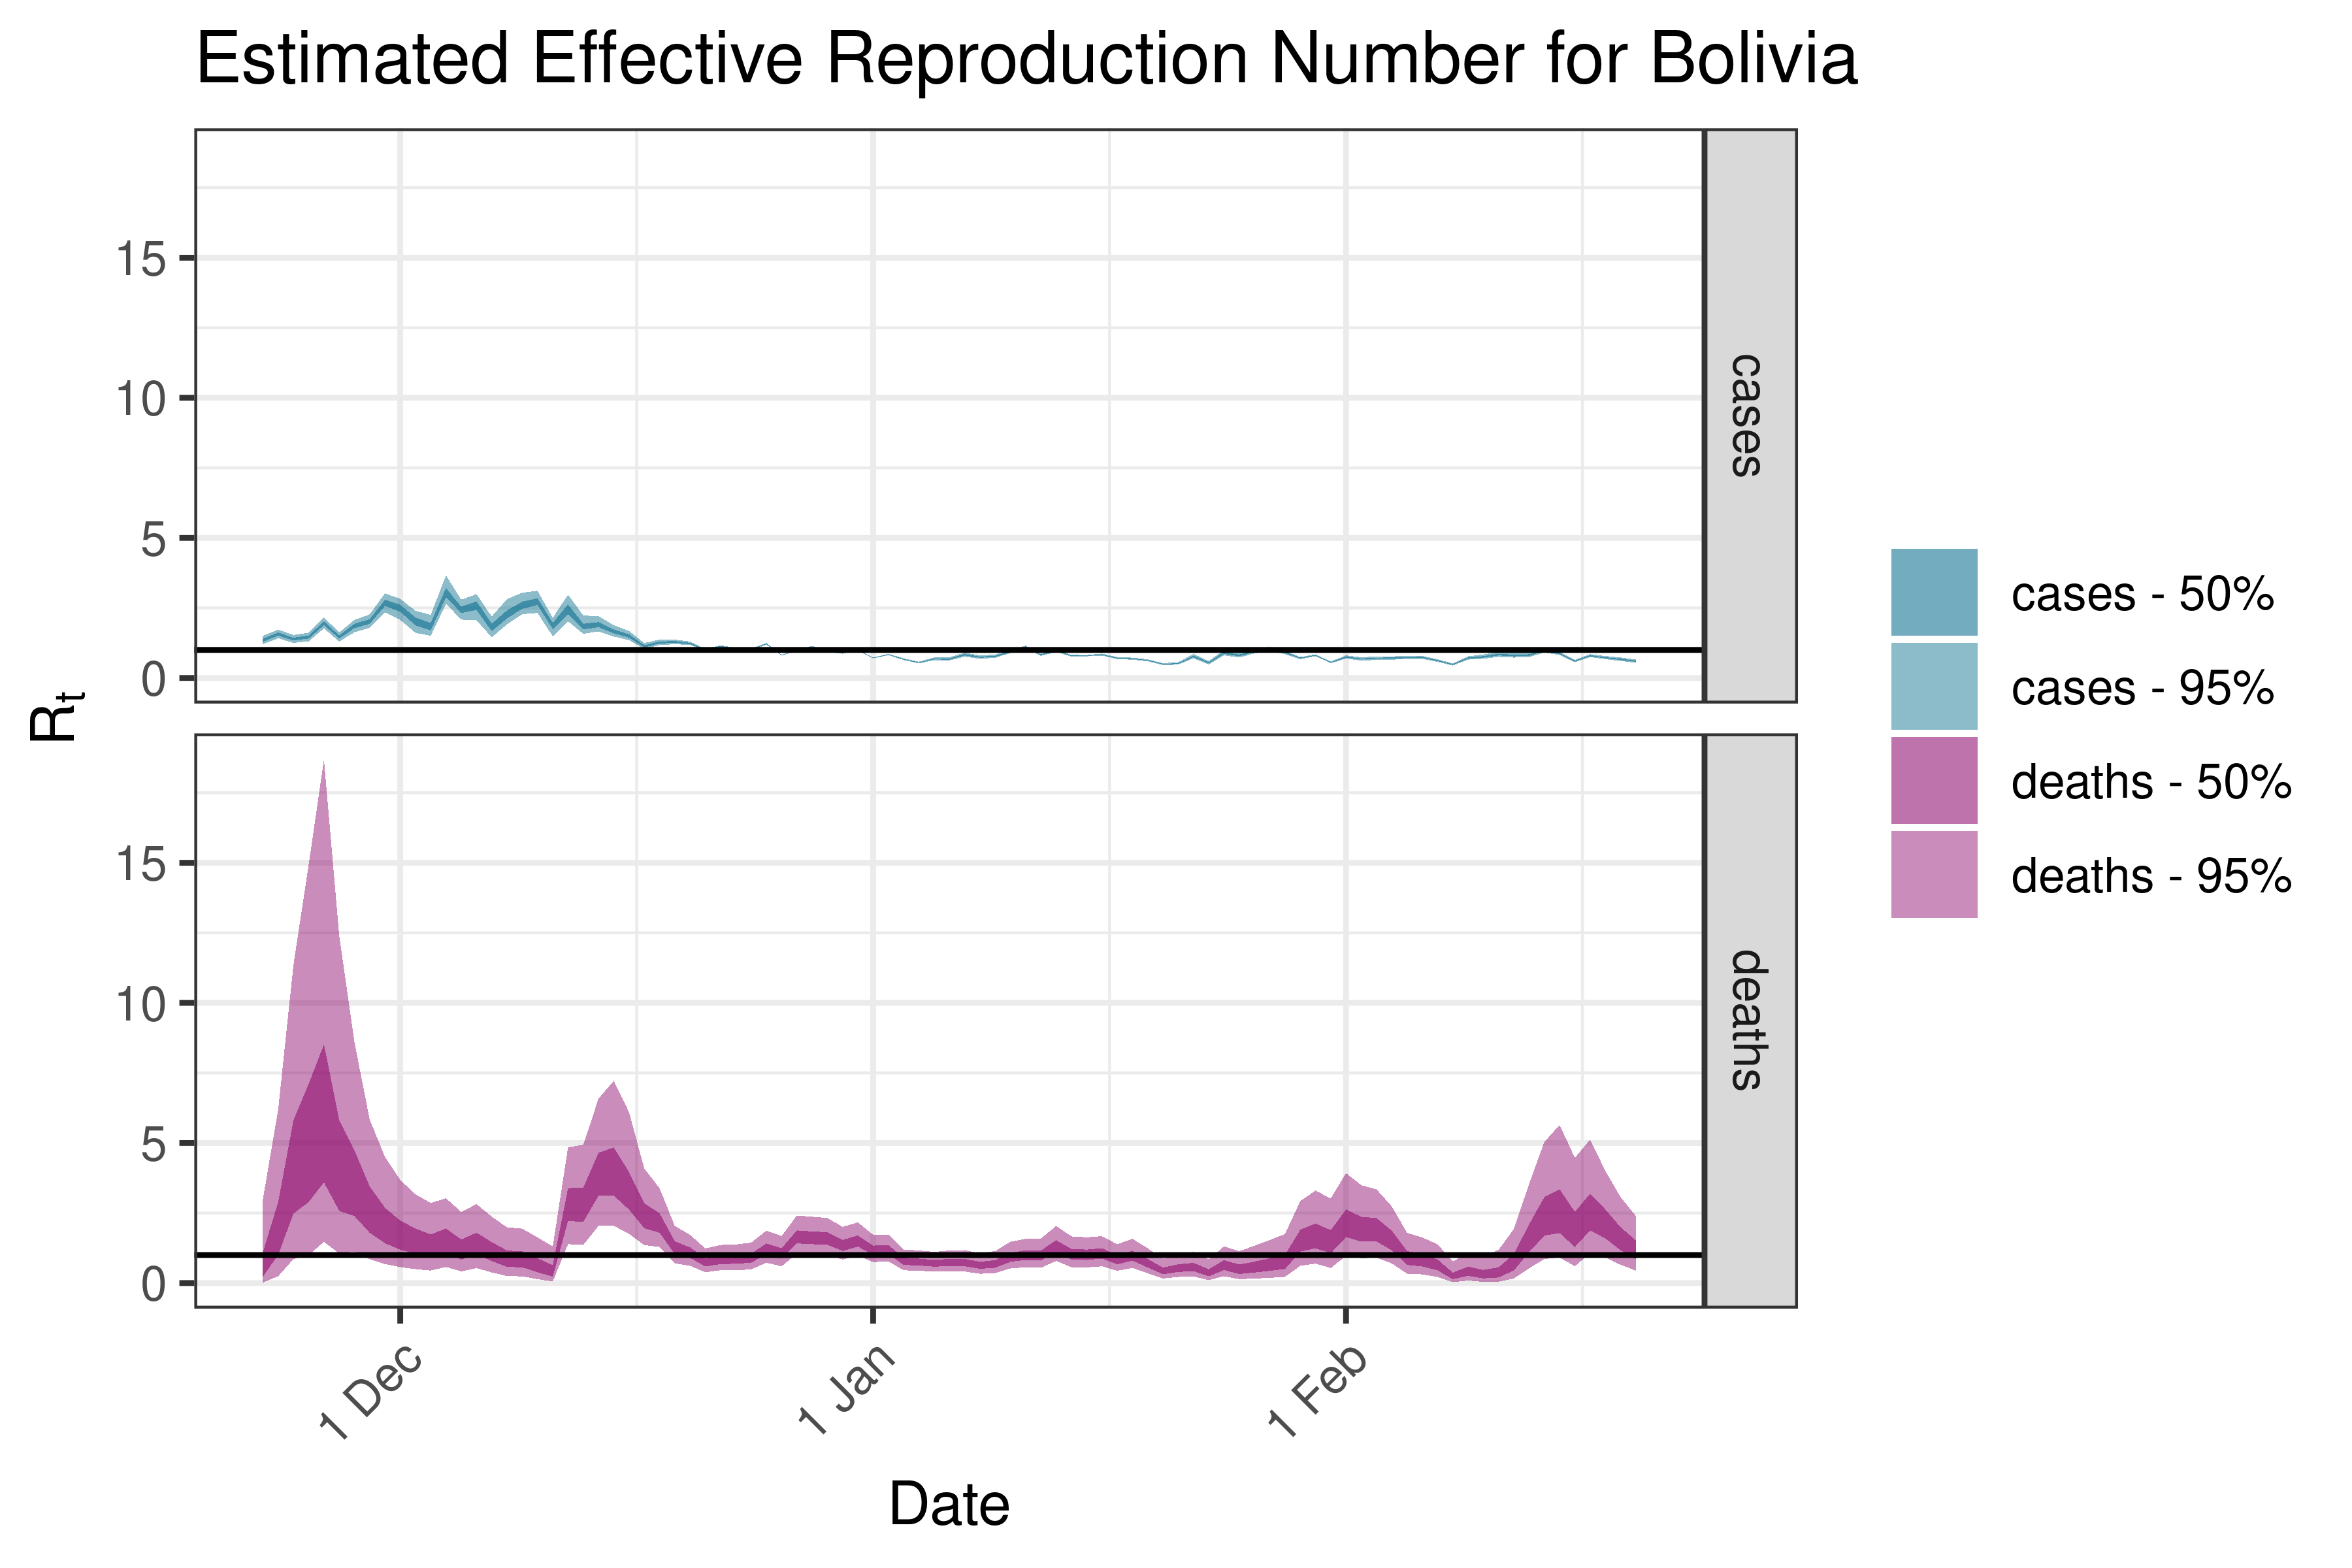
| Bolivia | cases | 95 | 2023-02-23 | 0.60 [ 0.54 - 0.66] |
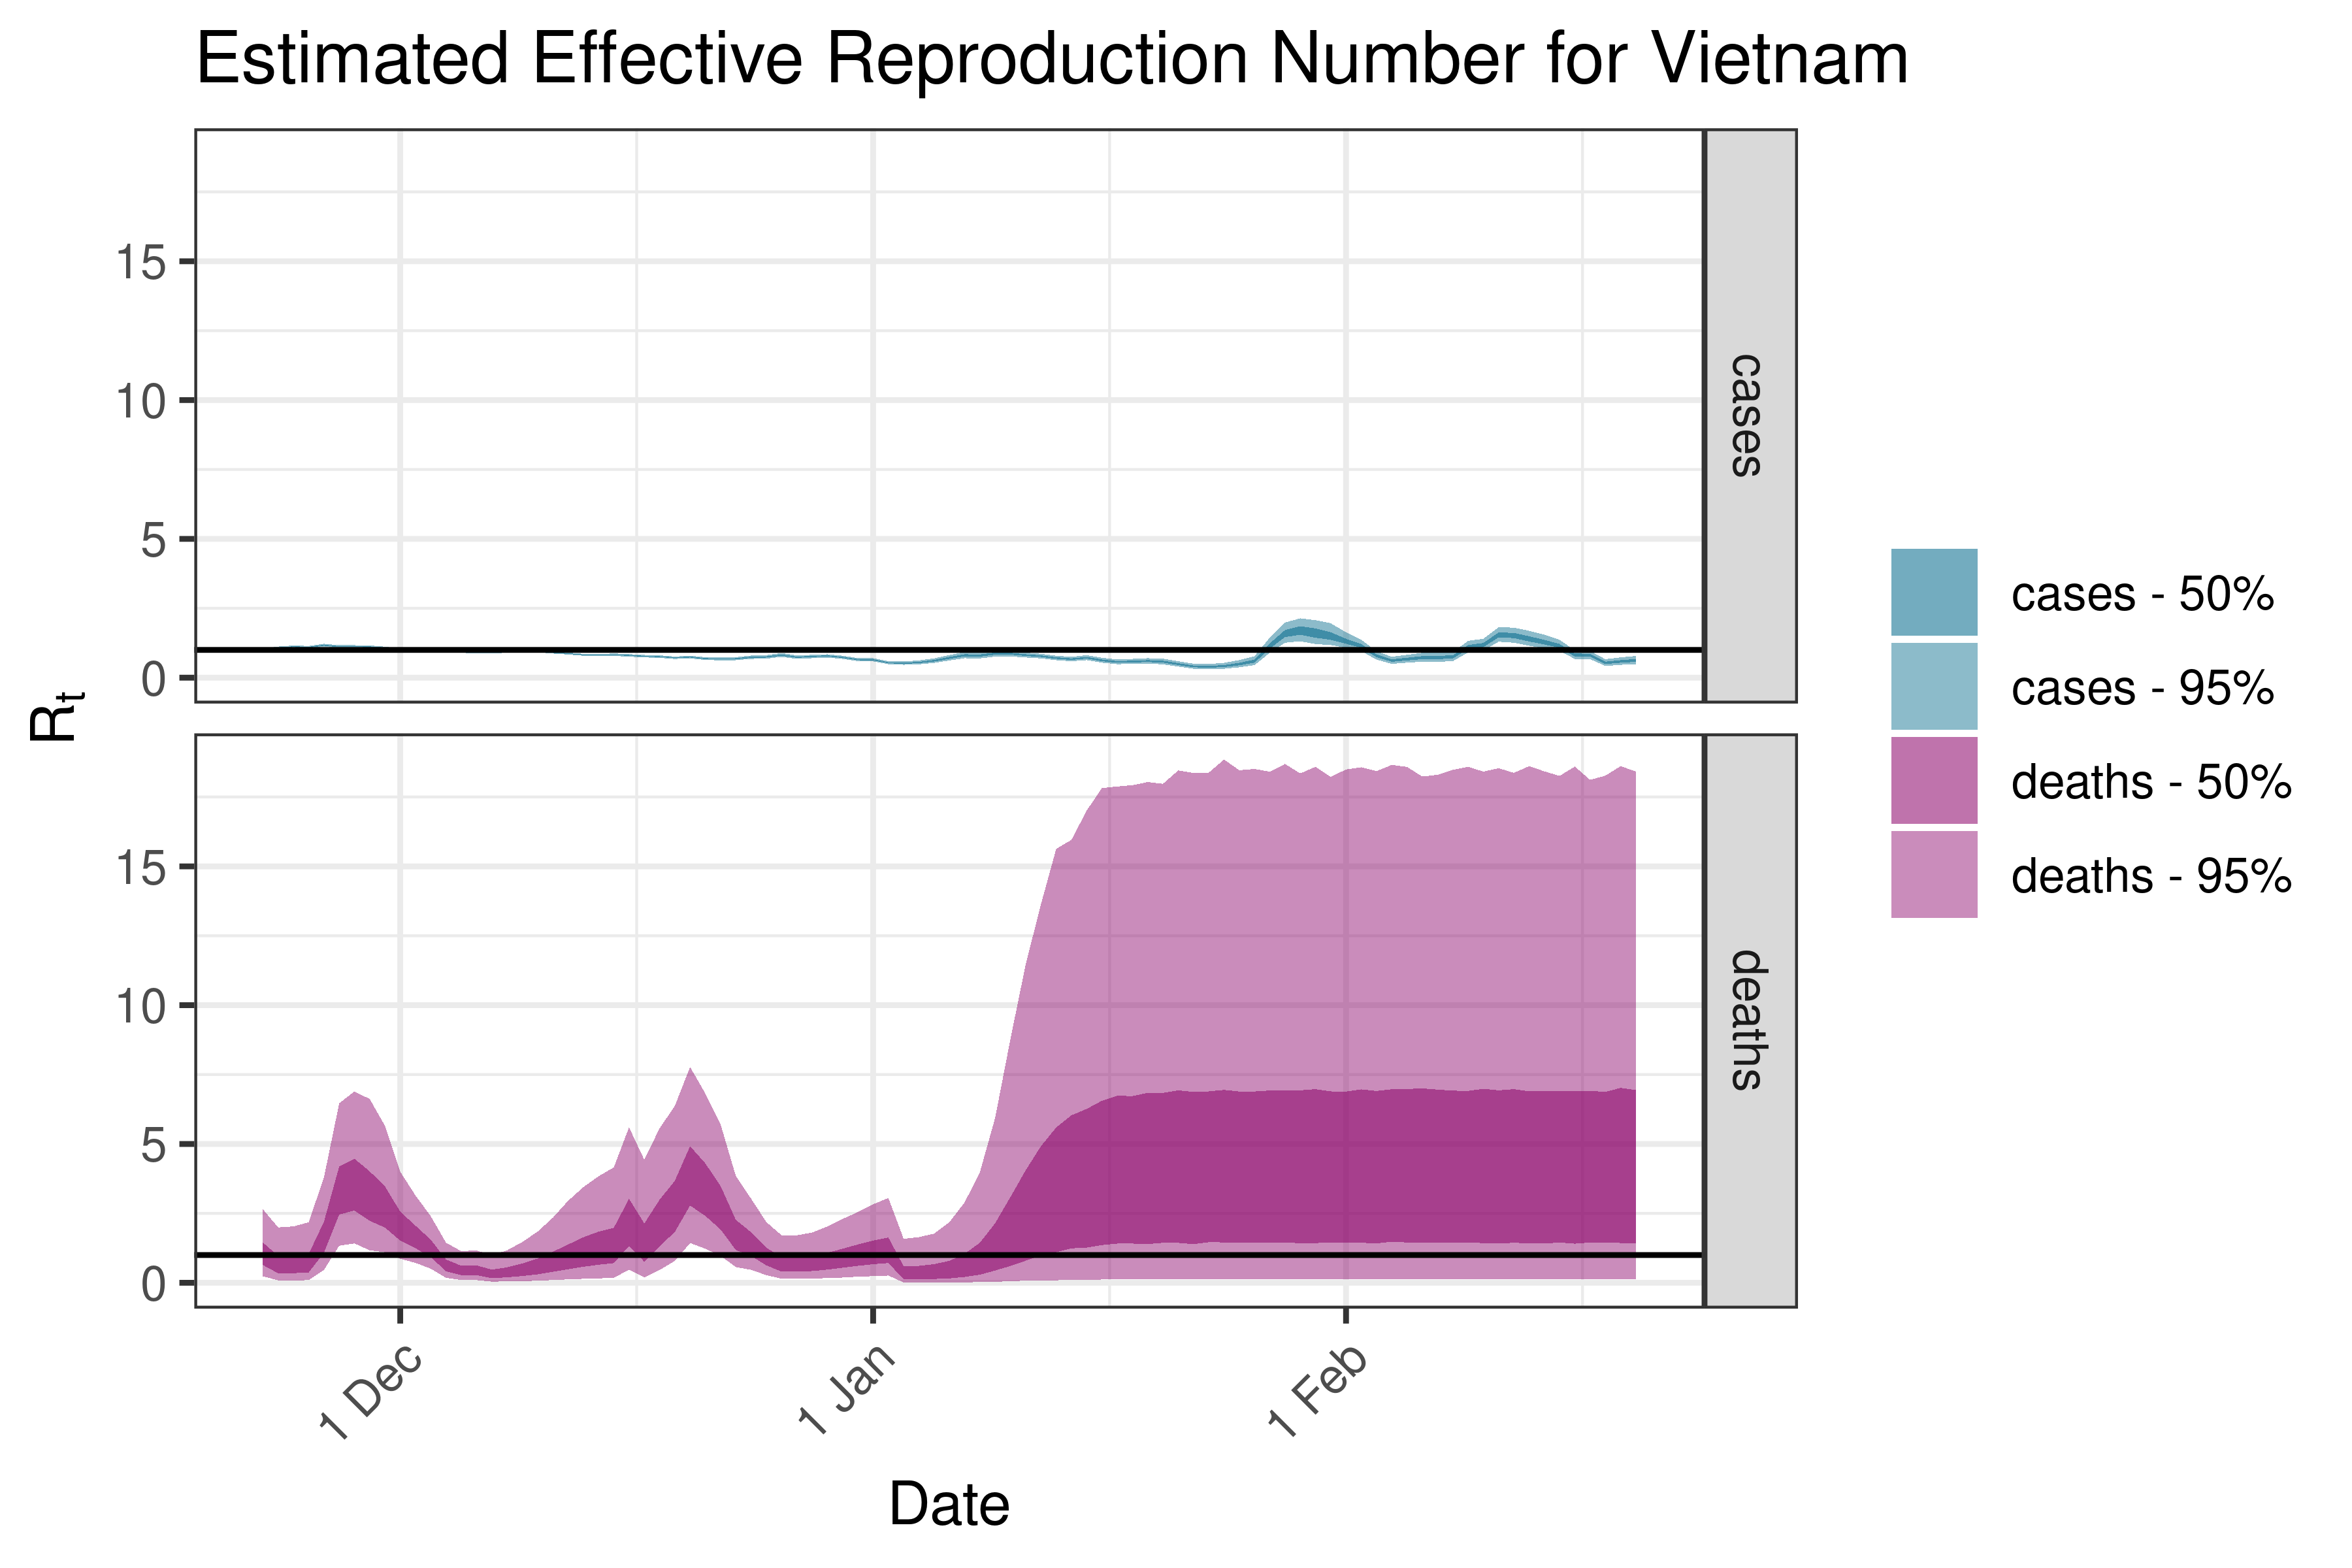
| Vietnam | cases | 12 | 2023-02-23 | 0.62 [ 0.49 - 0.78] |
6.3.3 Highest reproduction number estimates based on deaths
| Country | Estimated Type | Daily Count (Last Week) | Week Ending | Reproduction Number [95% Confidence Interval] |
|---|---|---|---|---|
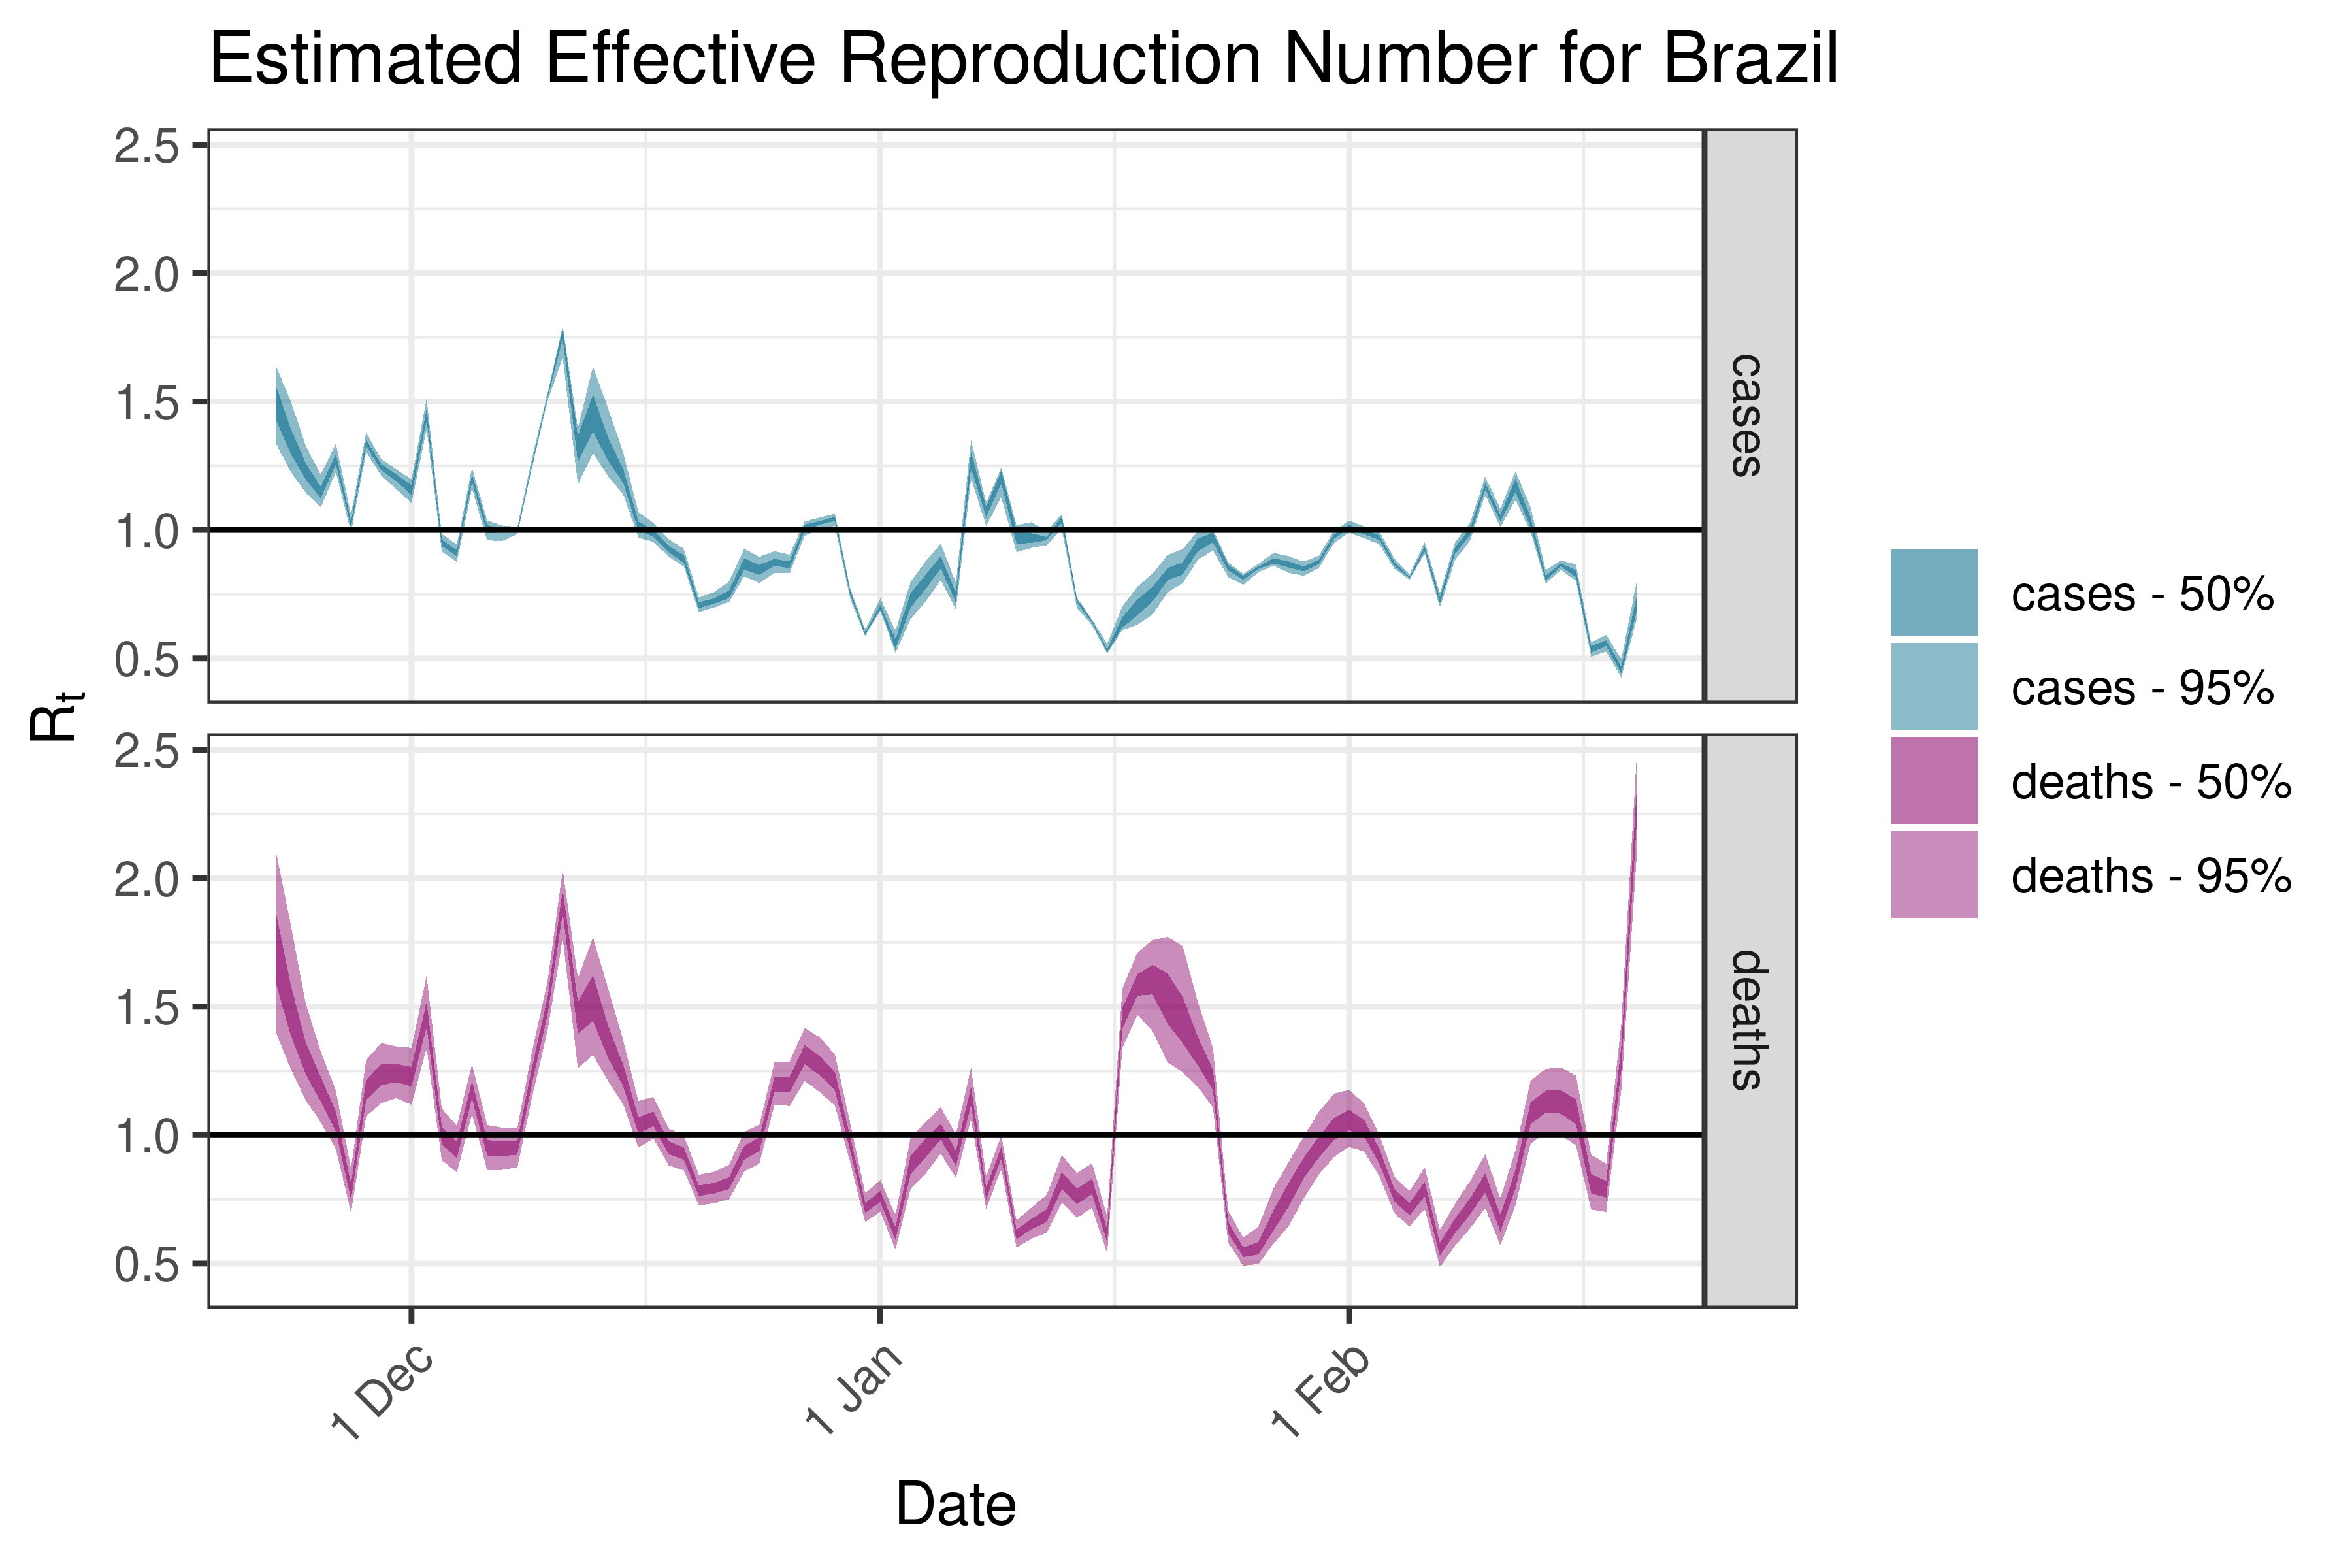
| Brazil | deaths | 117 | 2023-02-23 | 2.27 [ 2.07 - 2.46] |
| South America | deaths | 143 | 2023-02-23 | 1.62 [ 1.50 - 1.74] |
| Upper middle income | deaths | 220 | 2023-02-23 | 1.40 [ 1.26 - 1.49] |
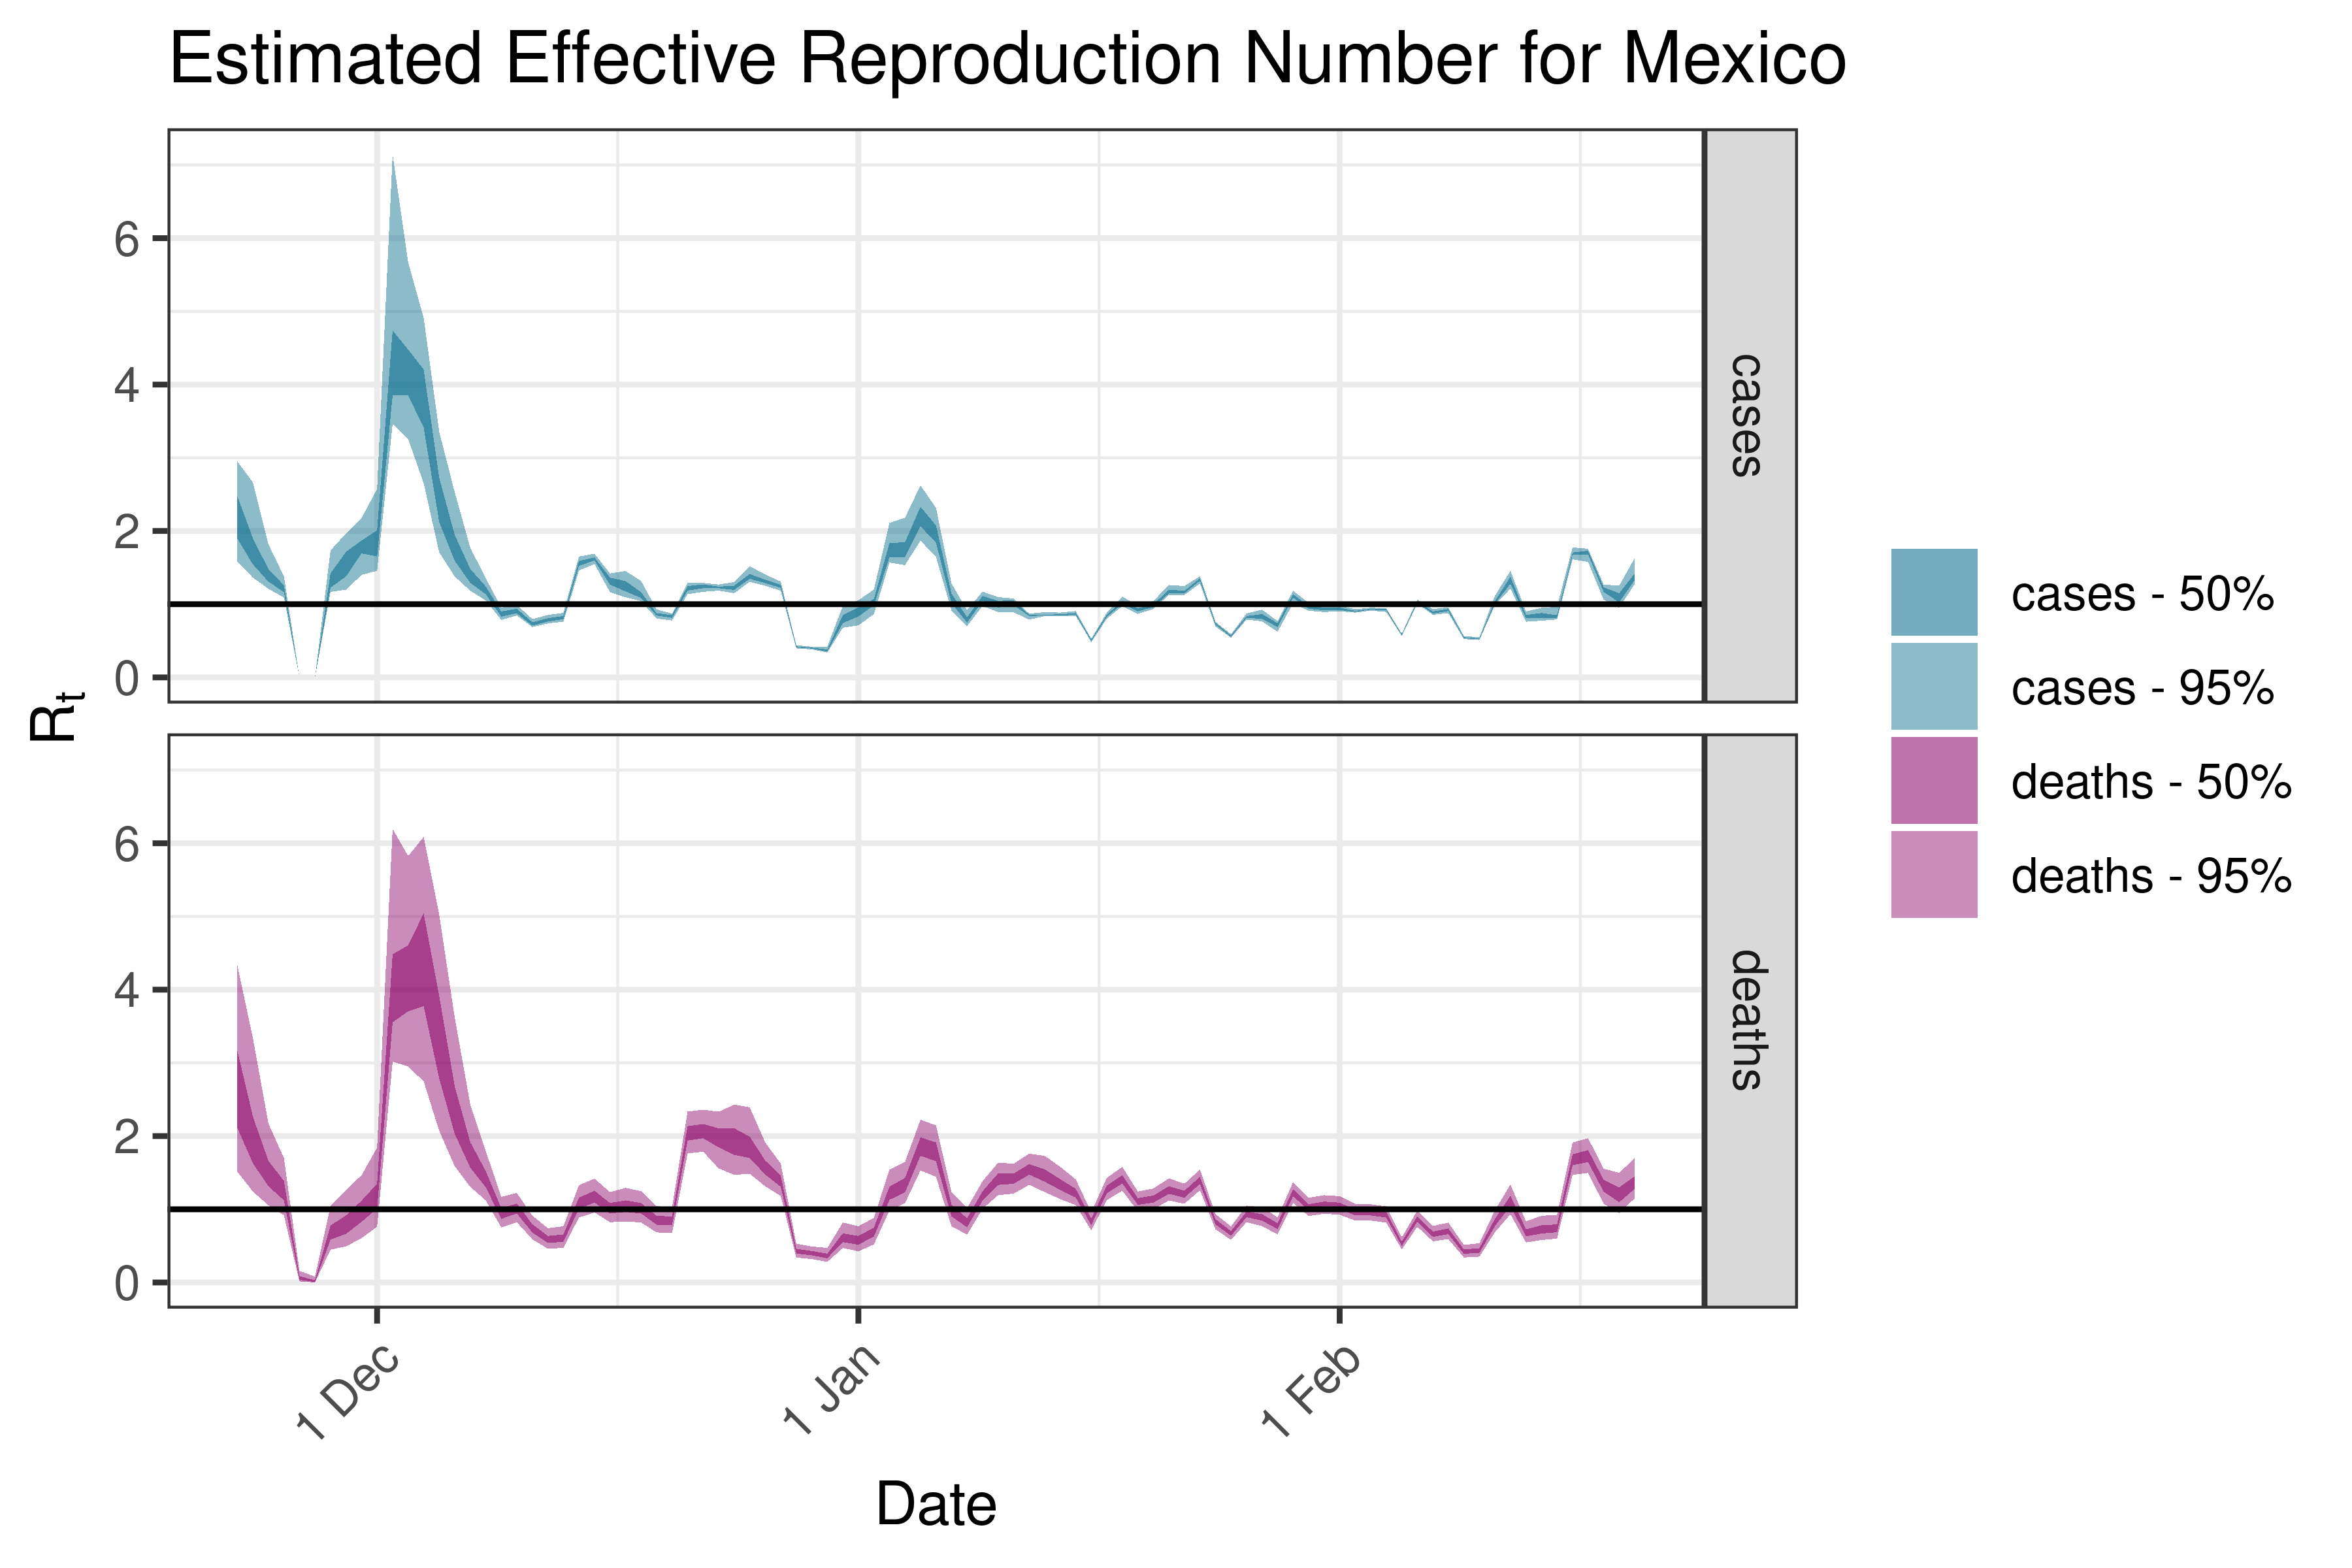
| Mexico | deaths | 35 | 2023-02-23 | 1.37 [ 1.15 - 1.70] |
| Canada | deaths | 34 | 2023-02-23 | 1.11 [ 0.97 - 1.26] |
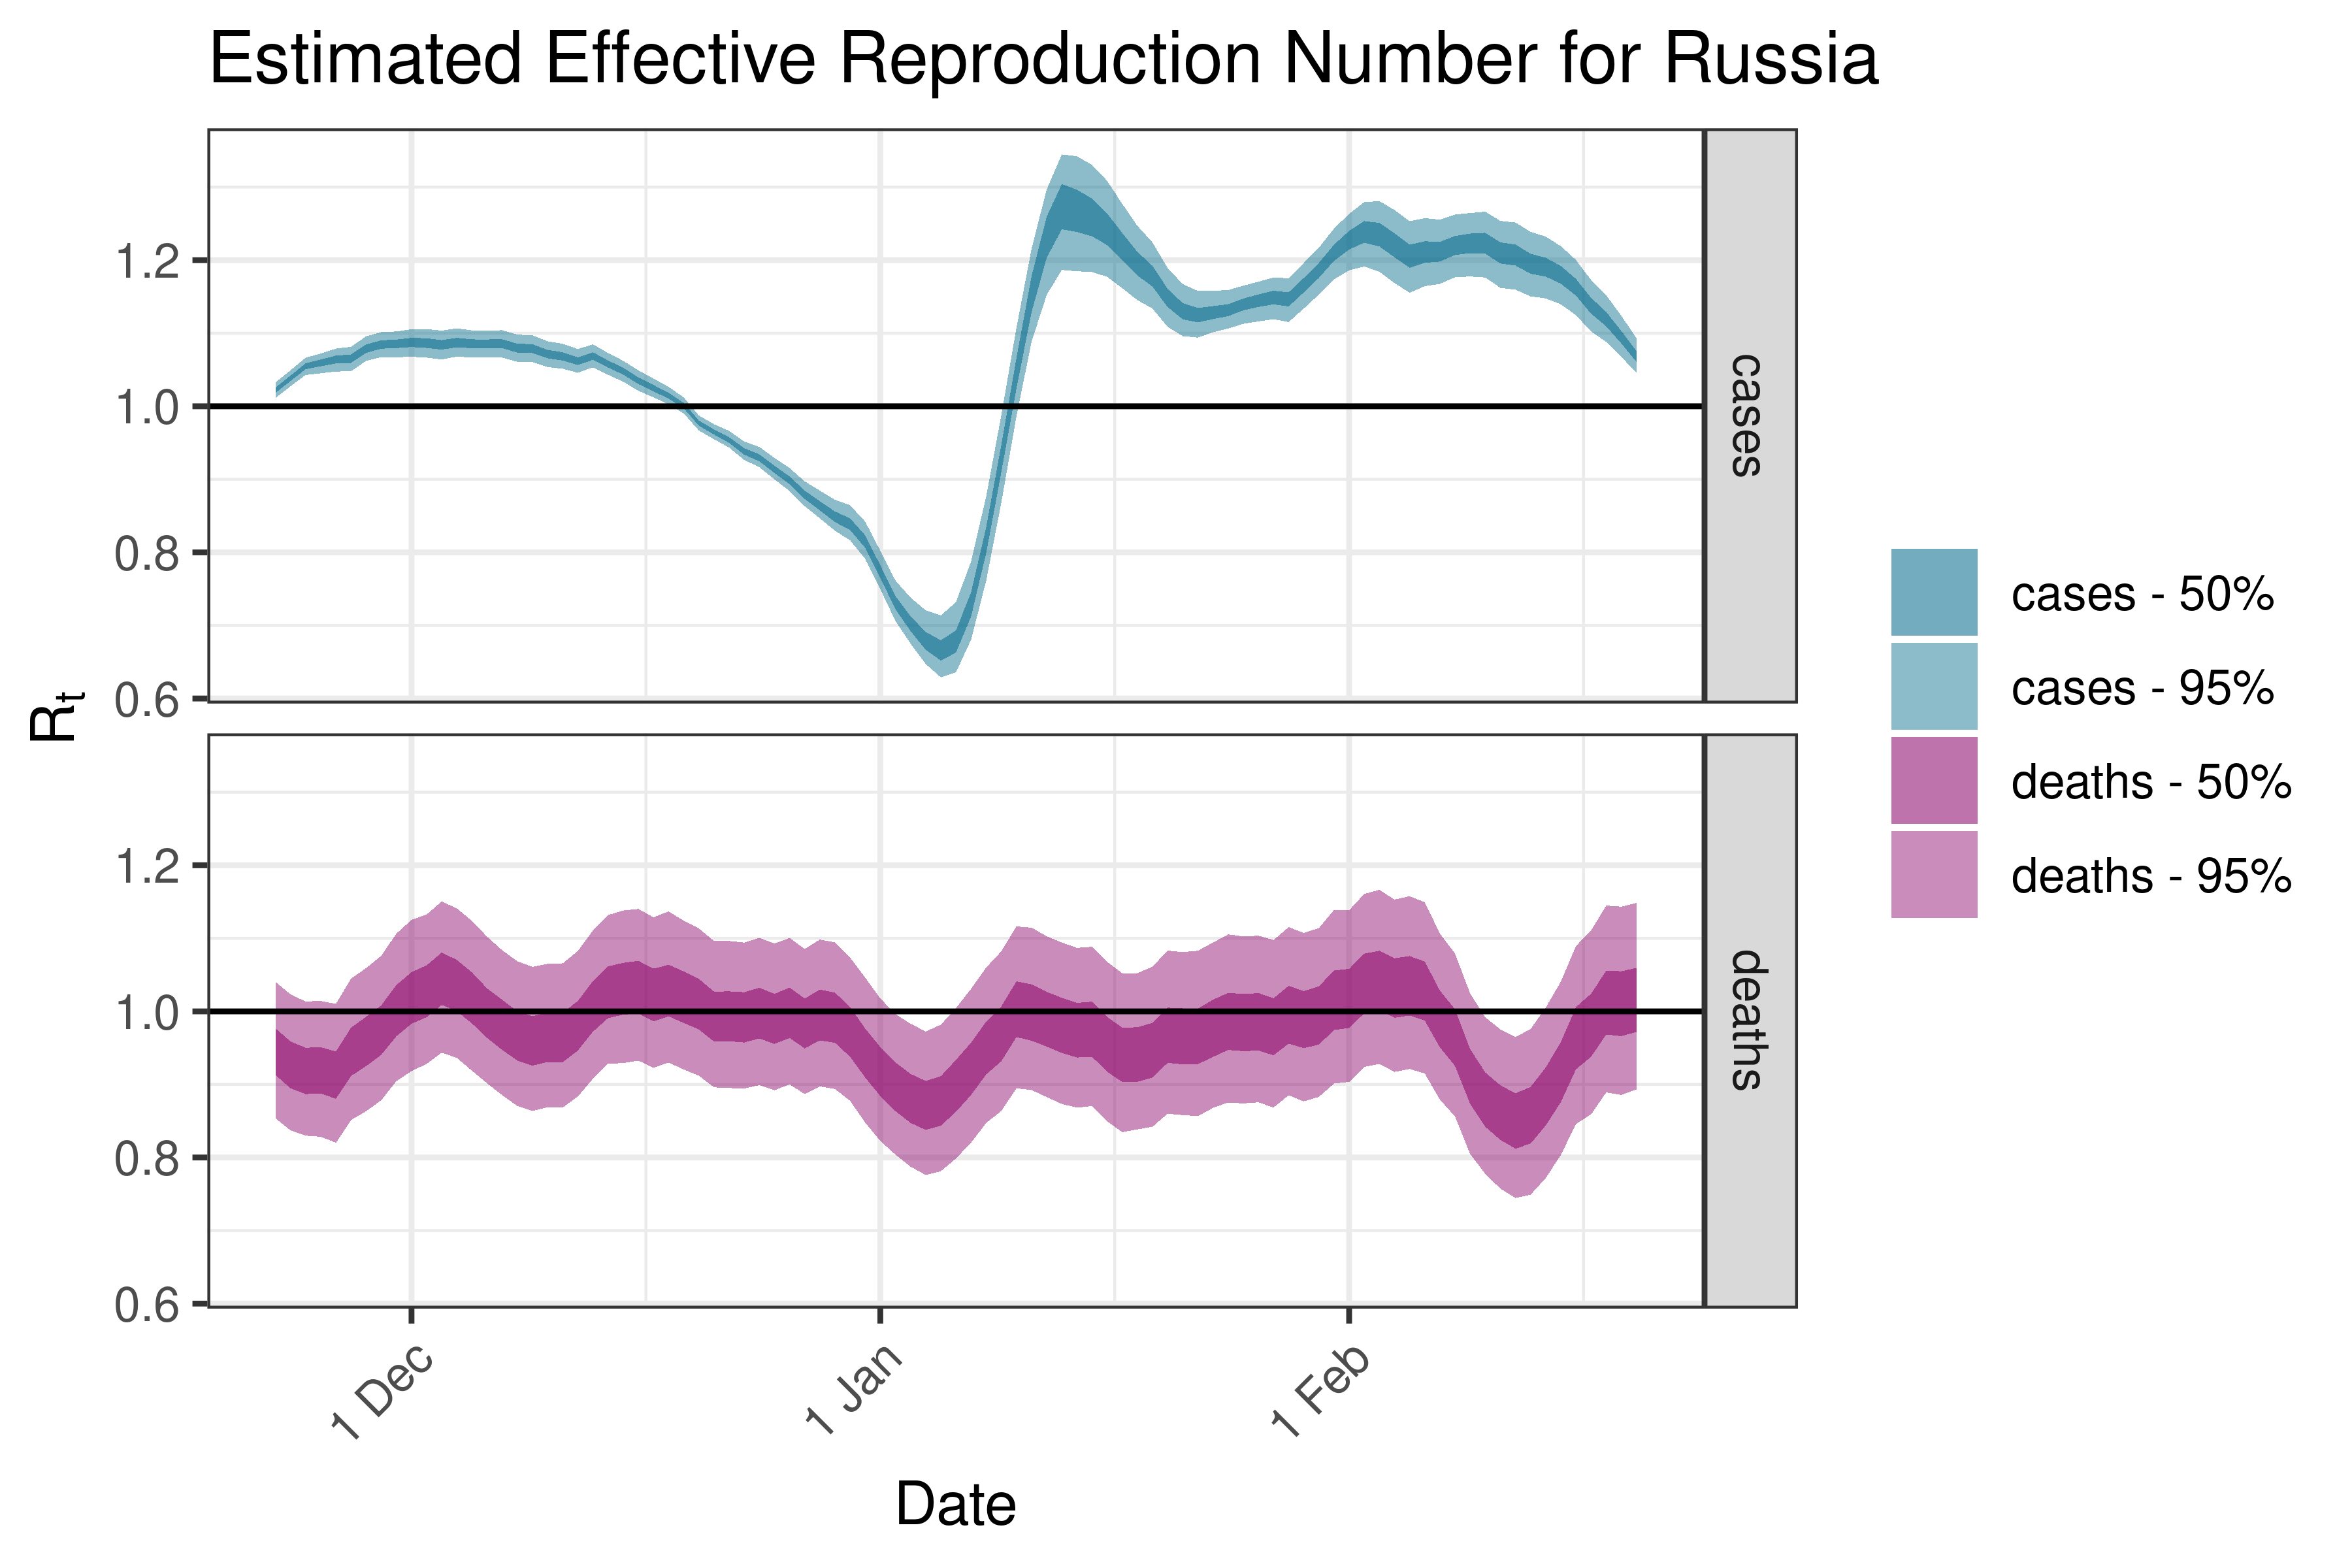
| Russia | deaths | 35 | 2023-02-23 | 1.02 [ 0.89 - 1.15] |
| Italy | deaths | 43 | 2023-02-23 | 1.01 [ 0.90 - 1.13] |
| Chile | deaths | 13 | 2023-02-23 | 0.99 [ 0.79 - 1.20] |
| Peru | deaths | 11 | 2023-02-23 | 0.97 [ 0.76 - 1.20] |
| France | deaths | 23 | 2023-02-23 | 0.96 [ 0.82 - 1.11] |
6.3.4 Highest reproduction number estimates based on cases
| Country | Estimated Type | Daily Count (Last Week) | Week Ending | Reproduction Number [95% Confidence Interval] |
|---|---|---|---|---|
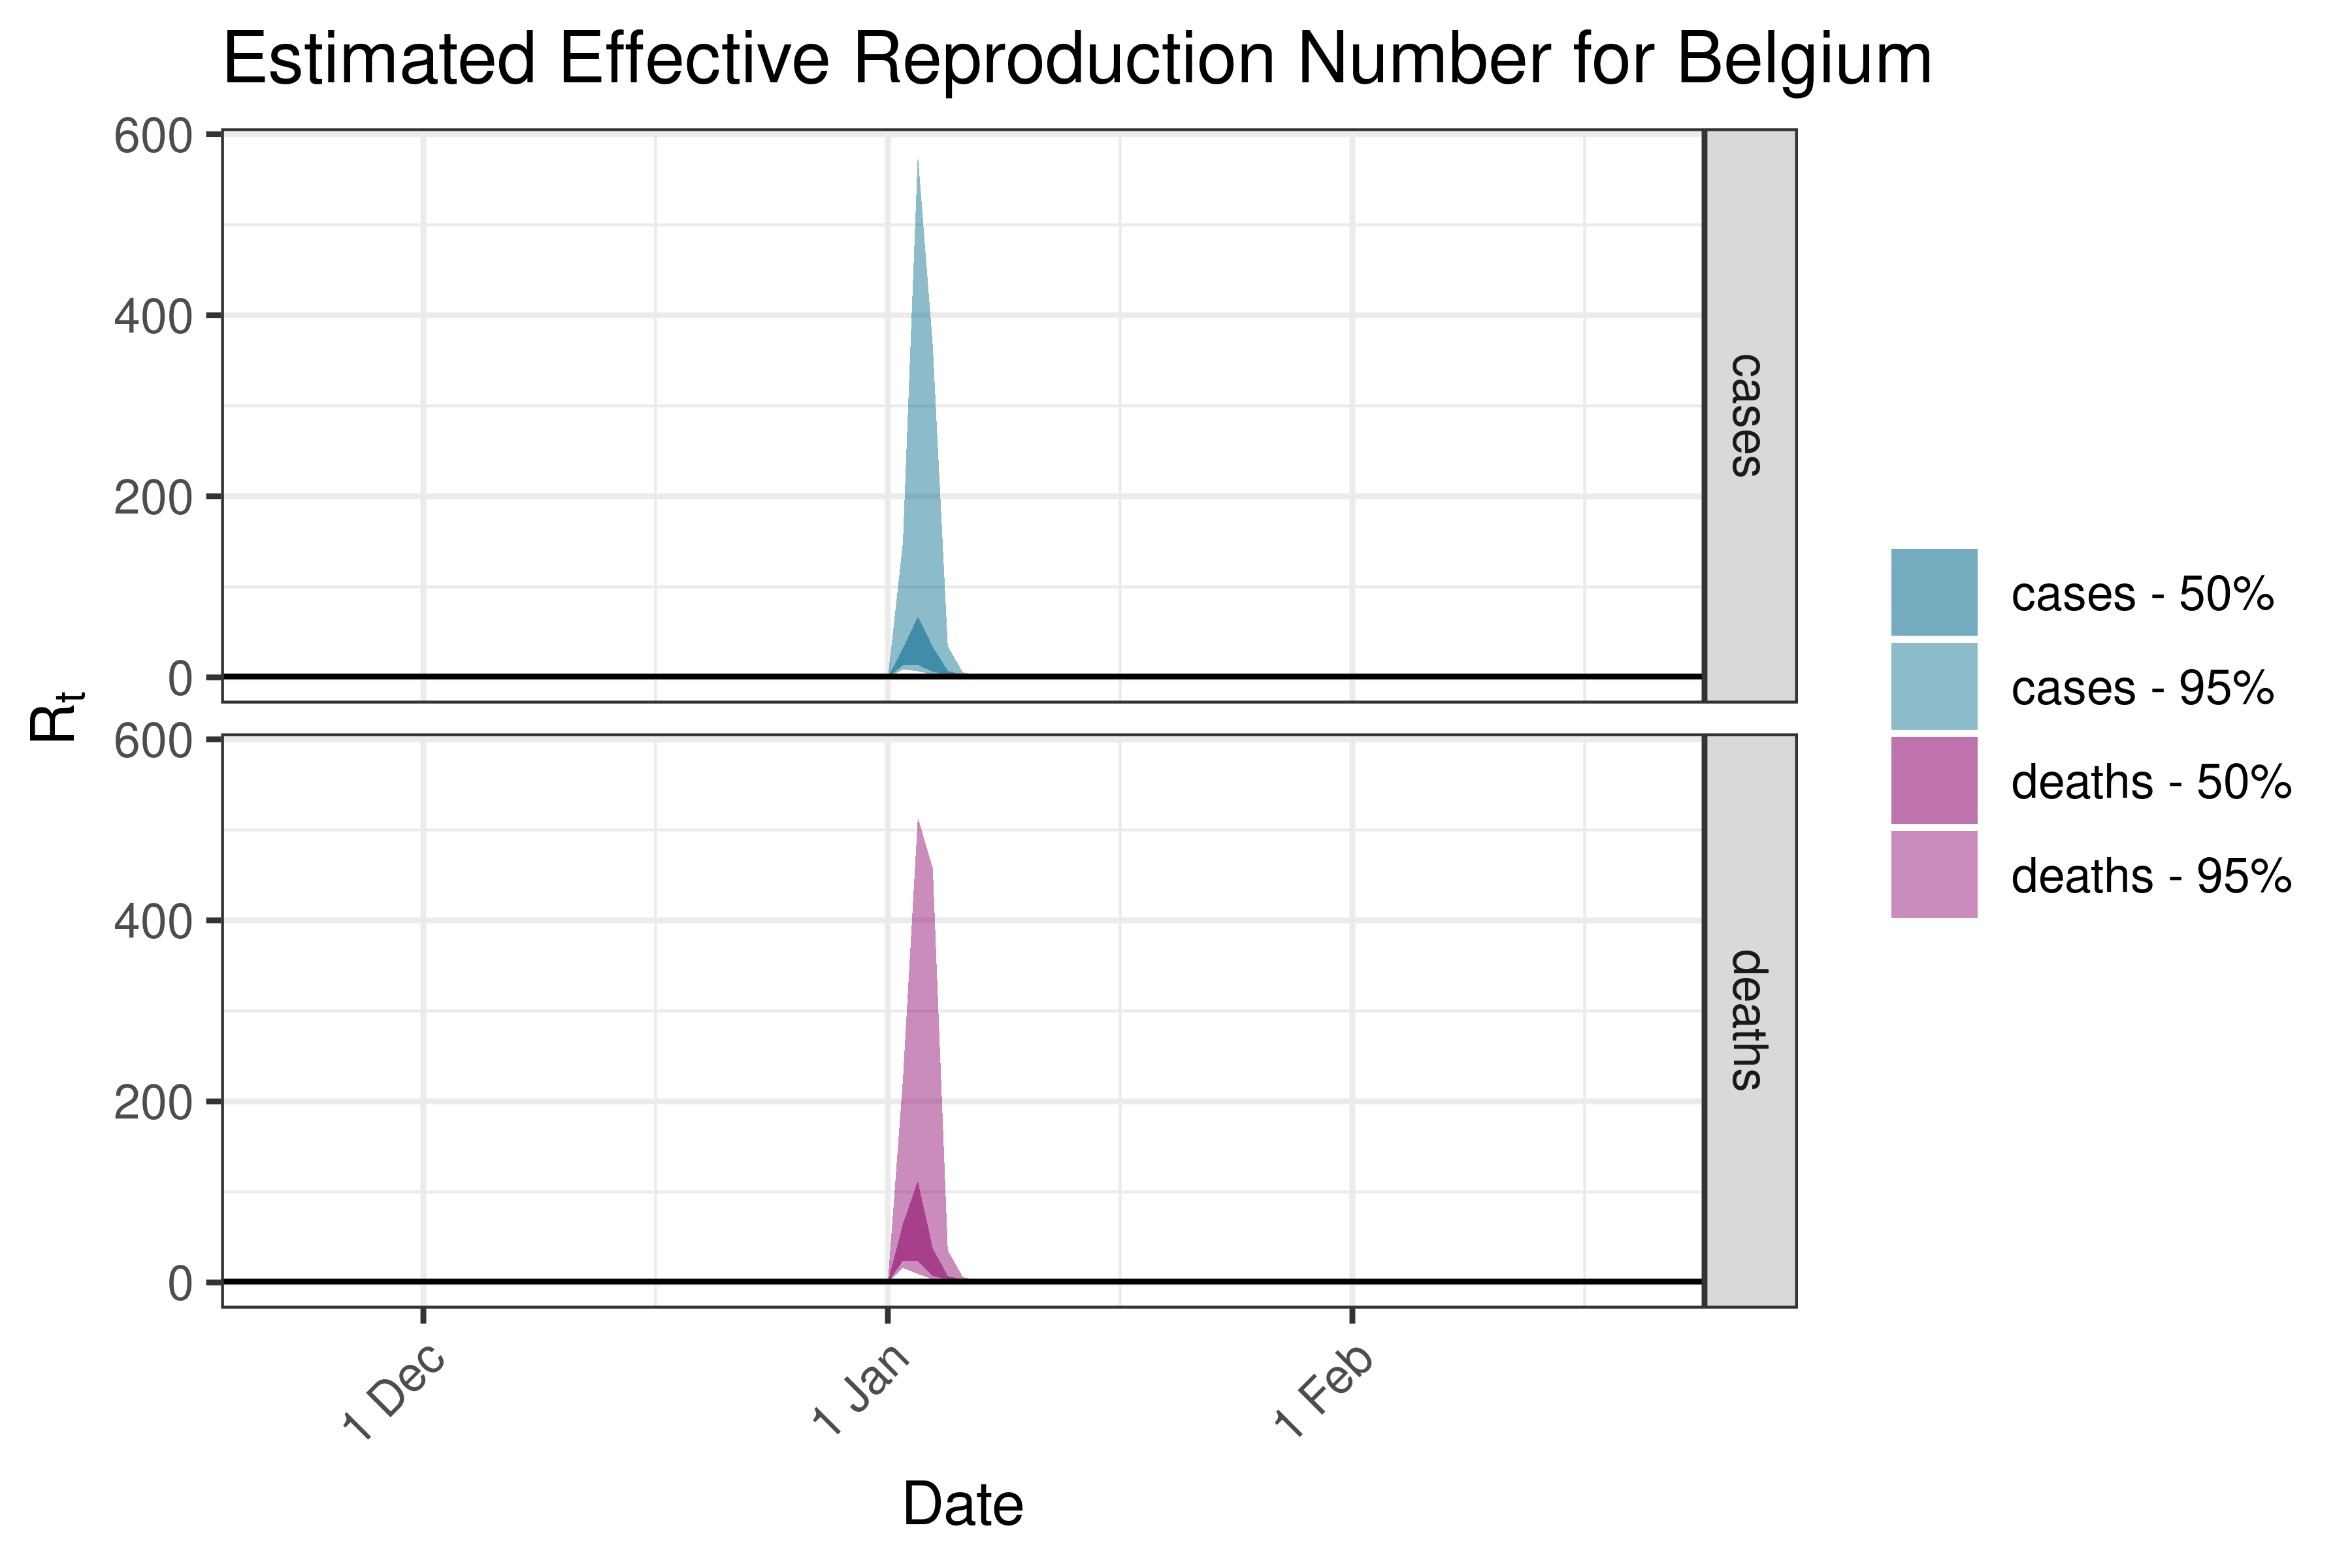
| Belgium | cases | 2,387 | 2023-02-23 | 2.62 [ 2.43 - 2.89] |
| Moldova | cases | 405 | 2023-02-23 | 1.99 [ 1.66 - 2.17] |
| Mali | cases | 16 | 2023-02-23 | 1.57 [ 1.25 - 1.94] |
| Mauritius | cases | 40 | 2023-02-23 | 1.45 [ 1.12 - 1.86] |
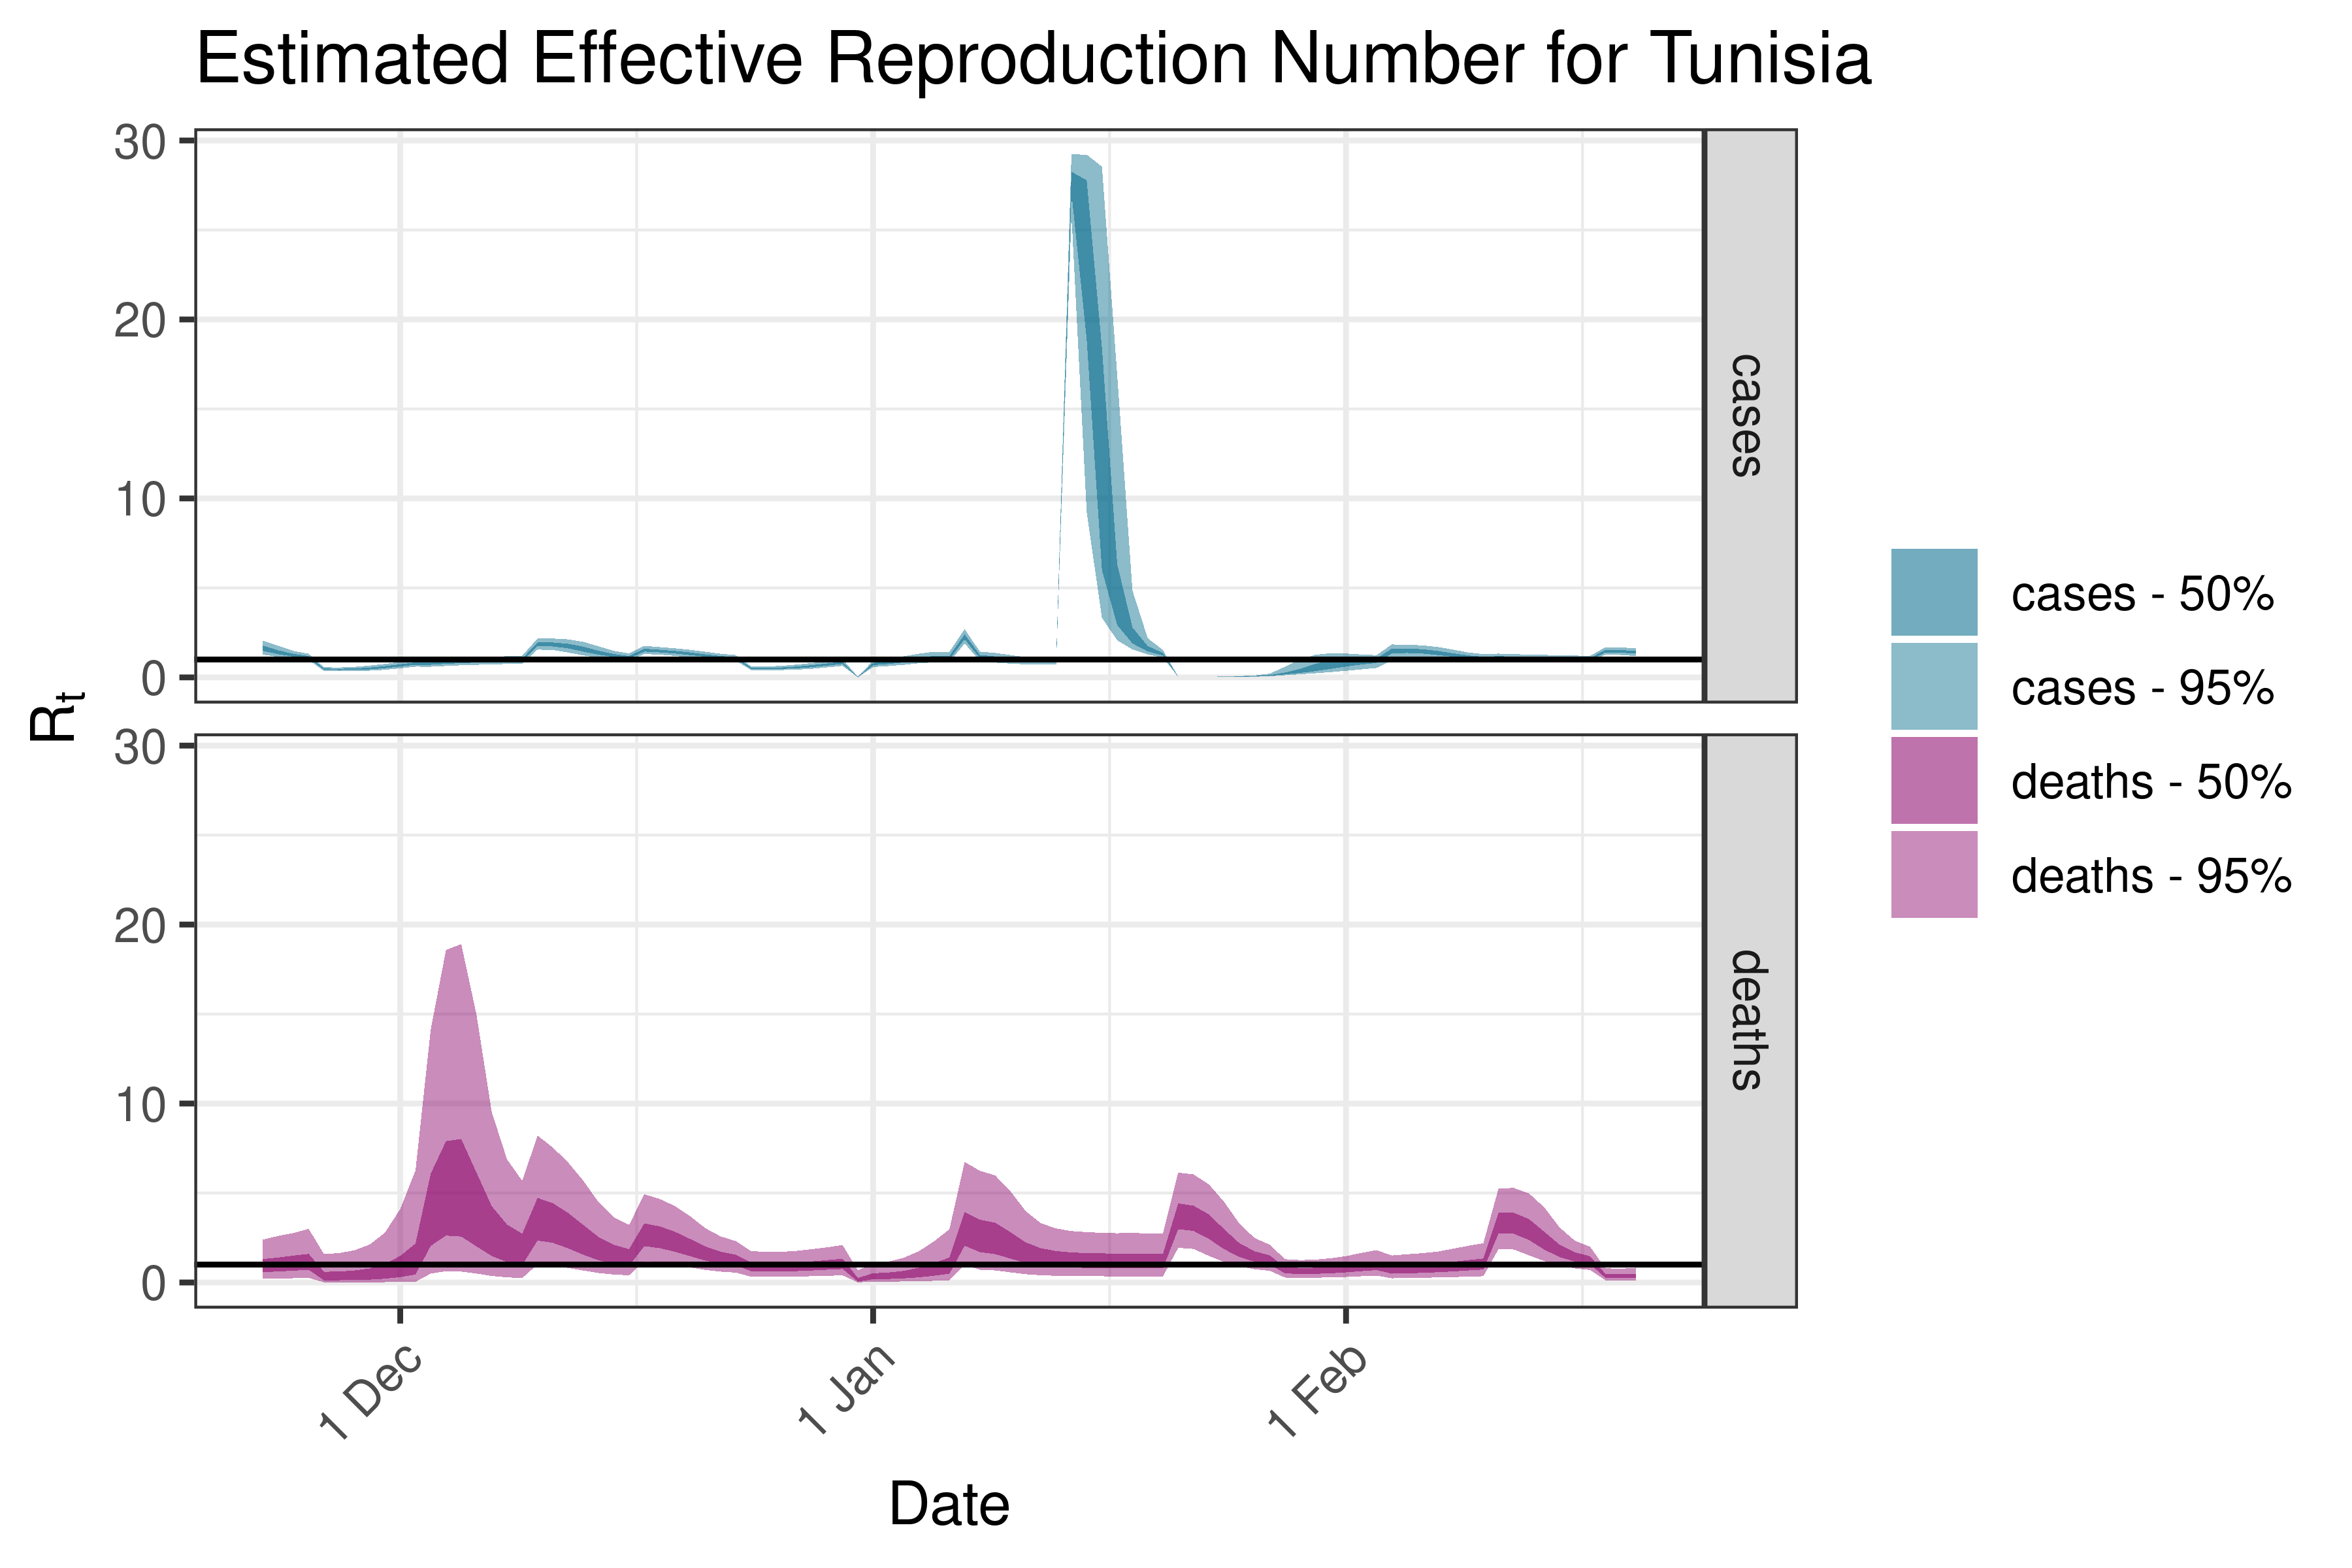
| Tunisia | cases | 27 | 2023-02-23 | 1.41 [ 1.19 - 1.63] |
| Mexico | cases | 4,033 | 2023-02-23 | 1.39 [ 1.28 - 1.63] |
| Poland | cases | 1,929 | 2023-02-23 | 1.35 [ 1.29 - 1.42] |
| Australia | cases | 3,138 | 2023-02-23 | 1.28 [ 1.26 - 1.30] |
| Iran | cases | 173 | 2023-02-23 | 1.23 [ 1.12 - 1.33] |
| Azerbaijan | cases | 22 | 2023-02-23 | 1.23 [ 1.04 - 1.43] |
6.4 Risk Quadrants
The plots below show weekly cases (or deaths) on the X-axis and the reproduction number on the Y-axis. By dividing this into 4 quadrants we can identify countries with high cases and high reproduction numbers, or high cases and low reproduction numbers etc.
Values where the reproduction number exceeds 3 are plotted at 3.
6.4.1 Cases
Risk Quadrants - Cases
6.4.2 Deaths
Risk Quadrants - Deaths
6.5 Country Plots by Continent
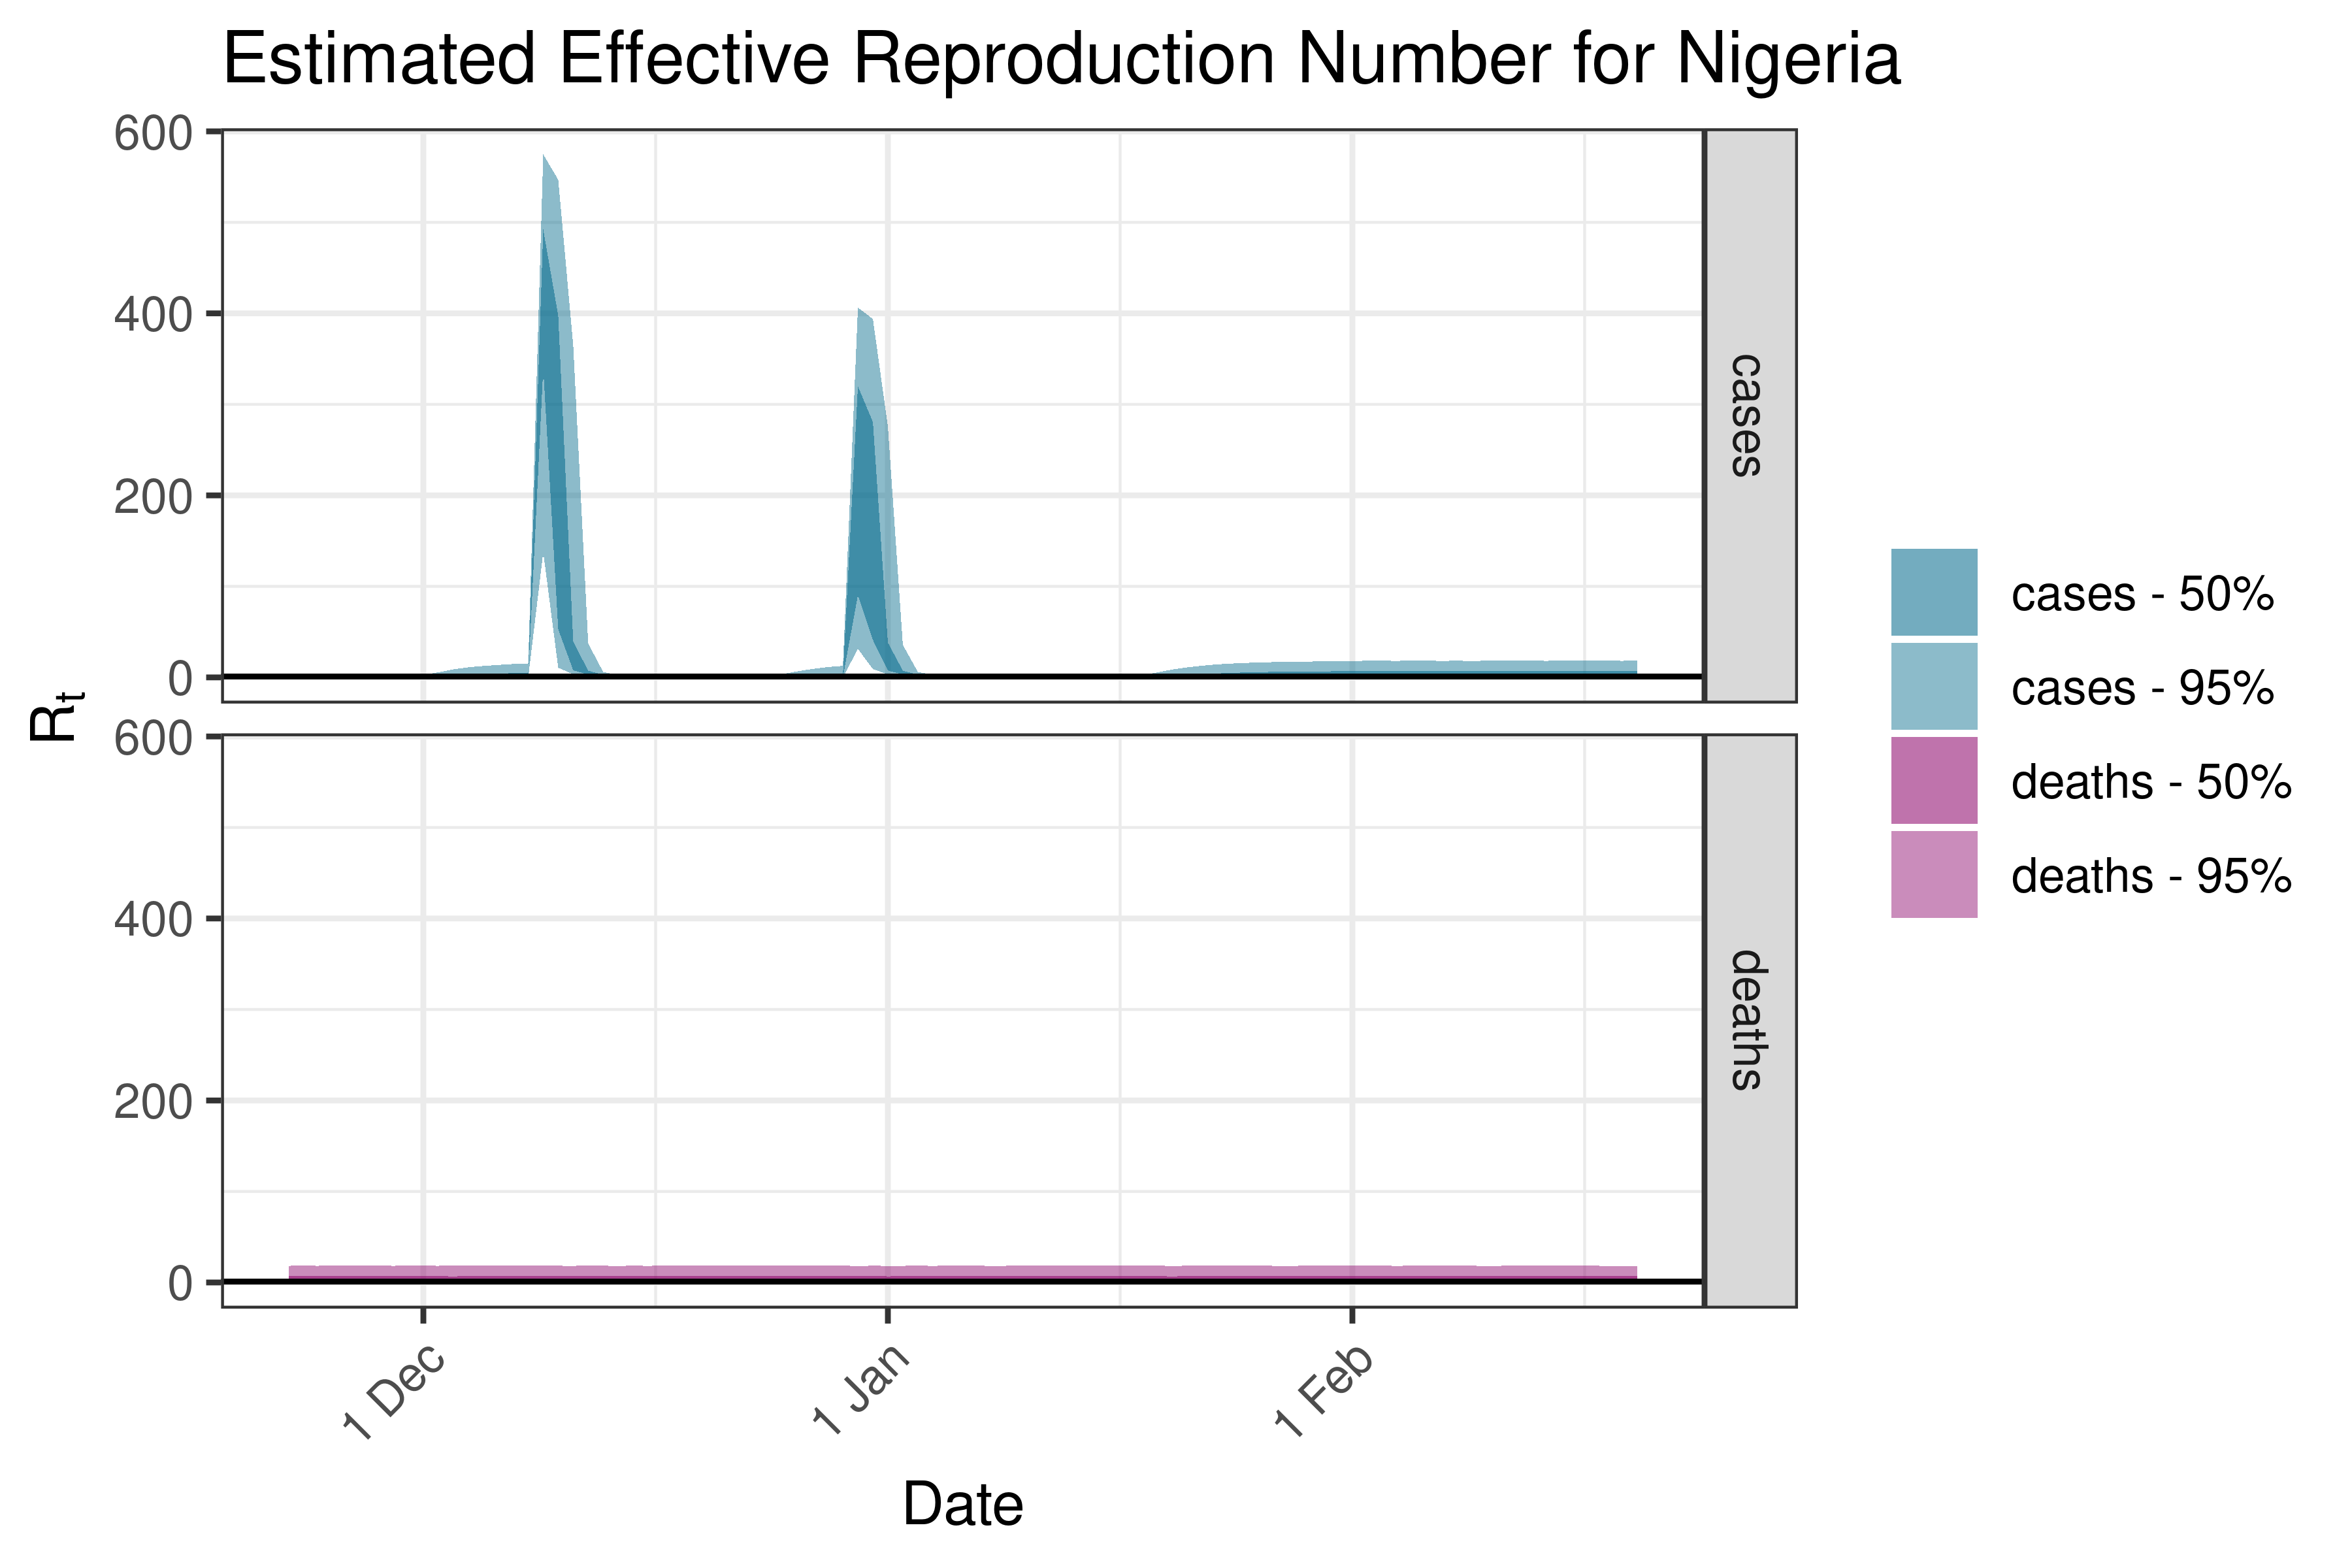
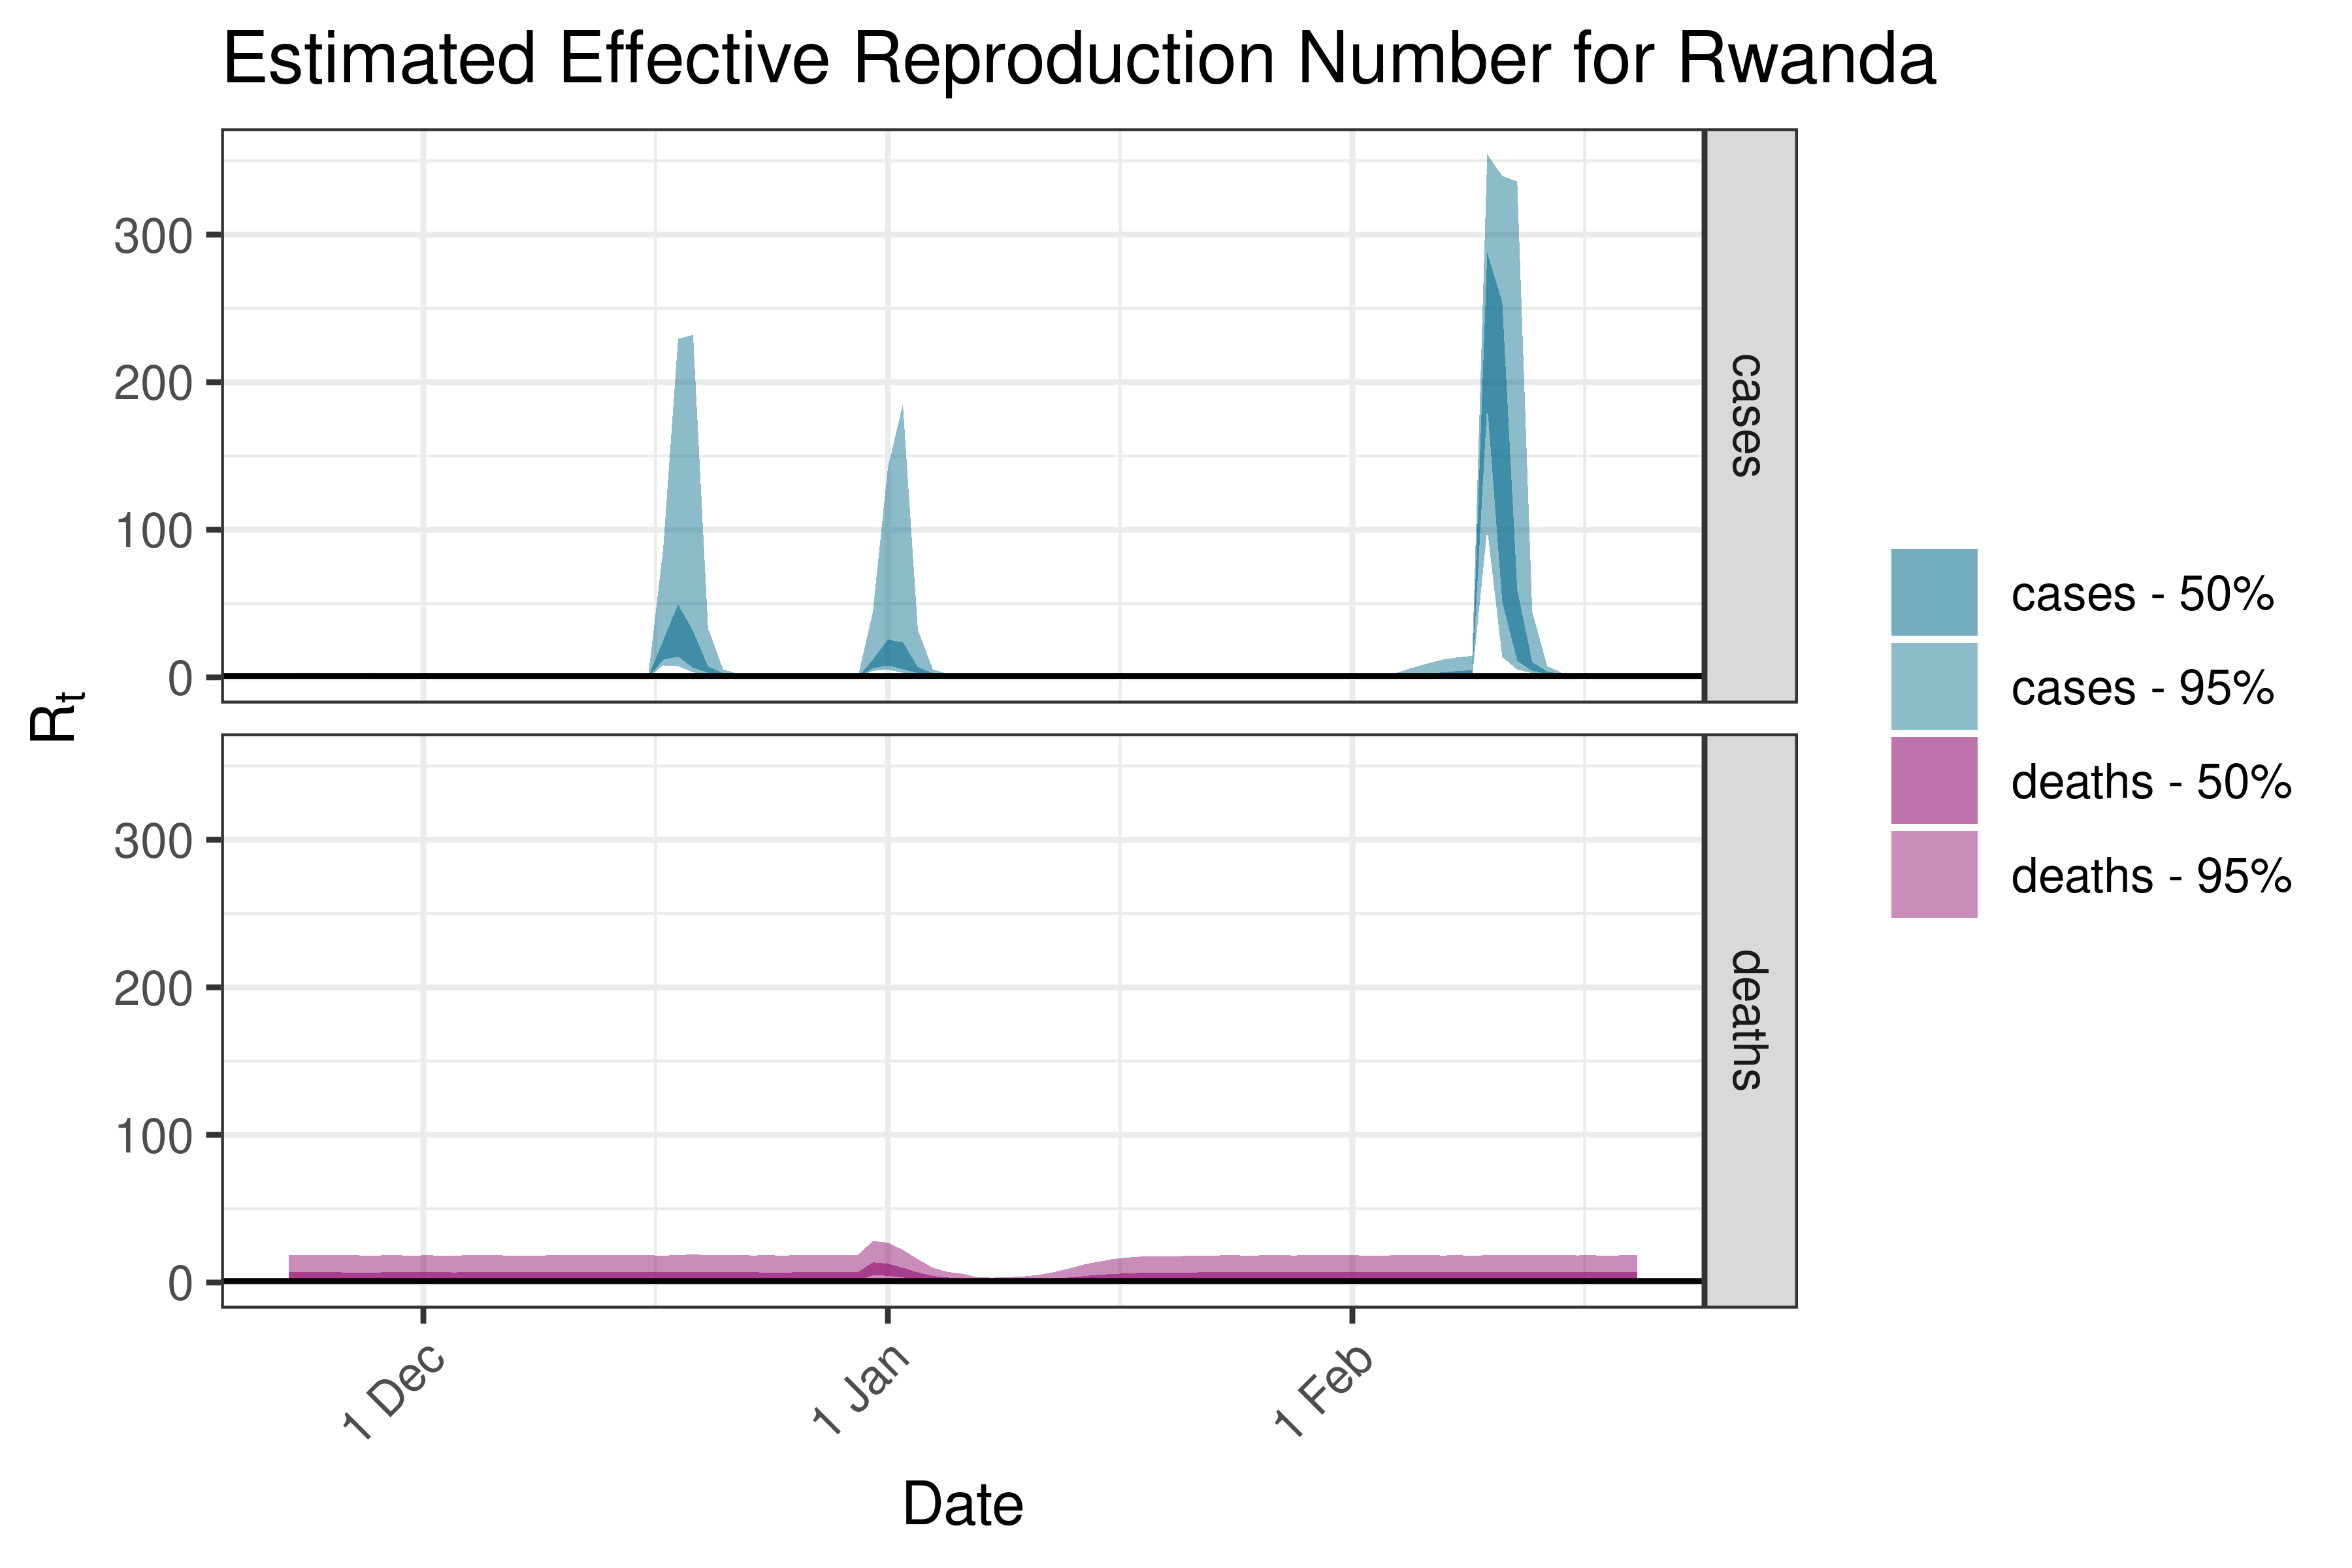
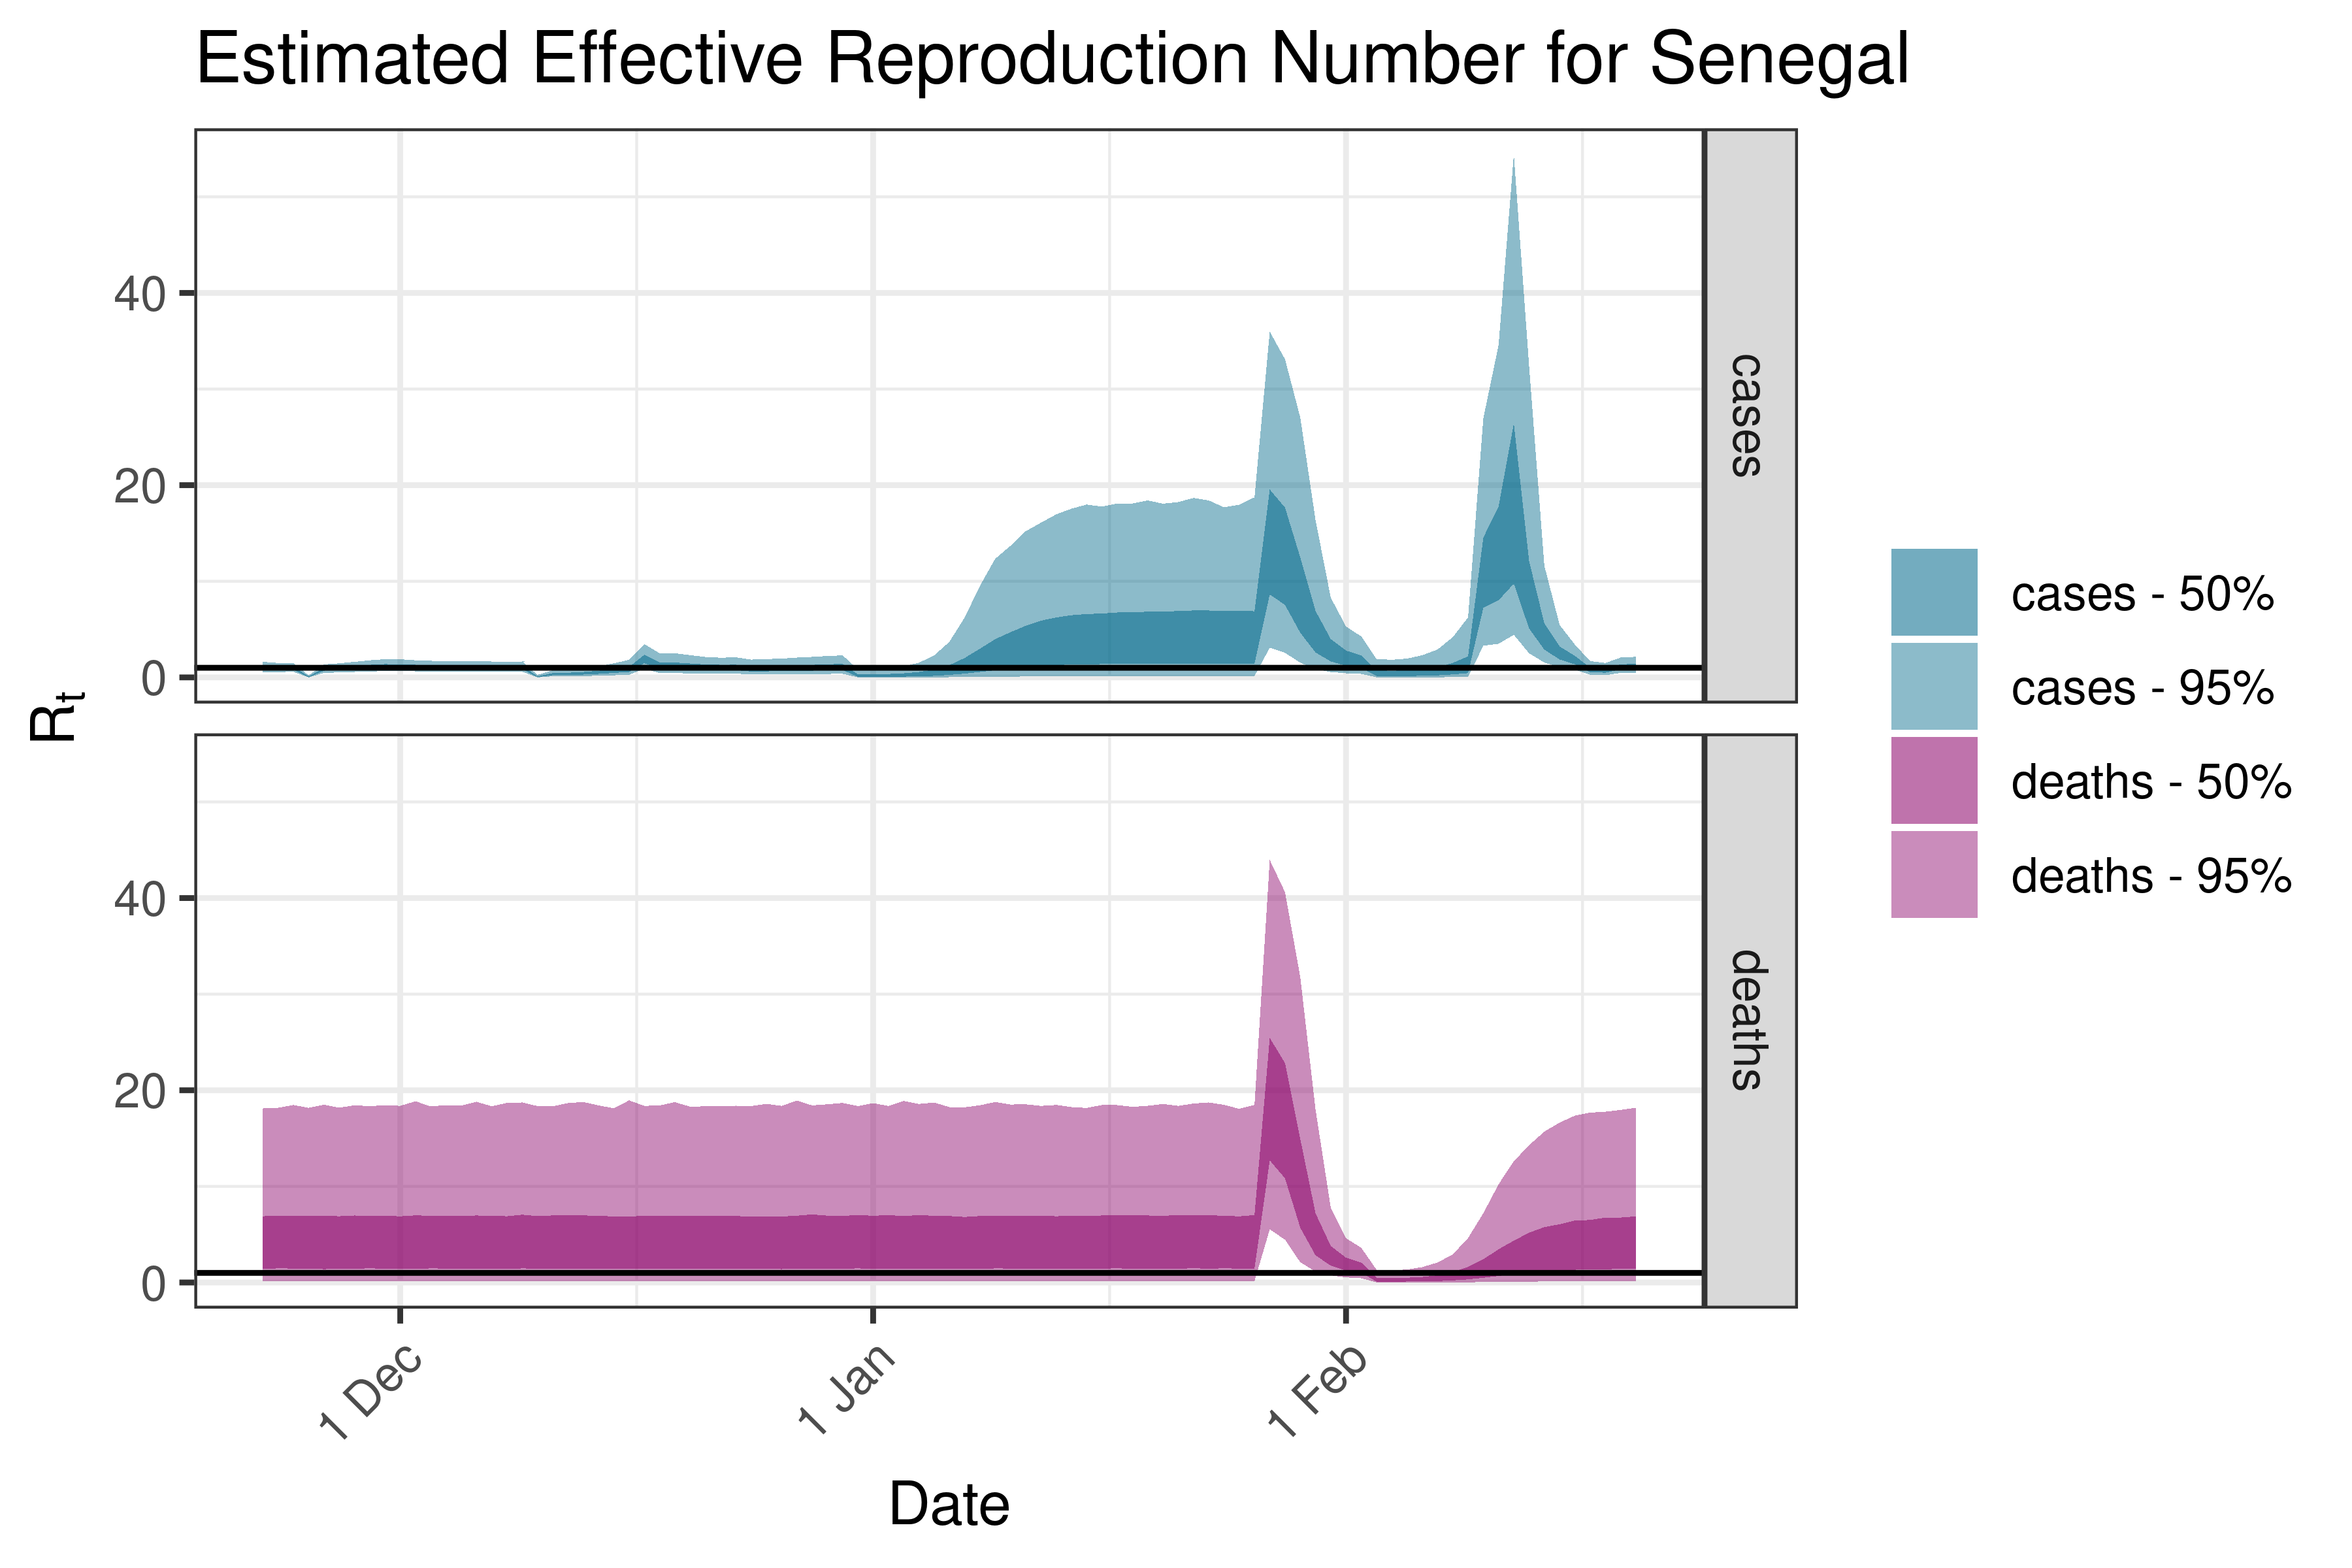
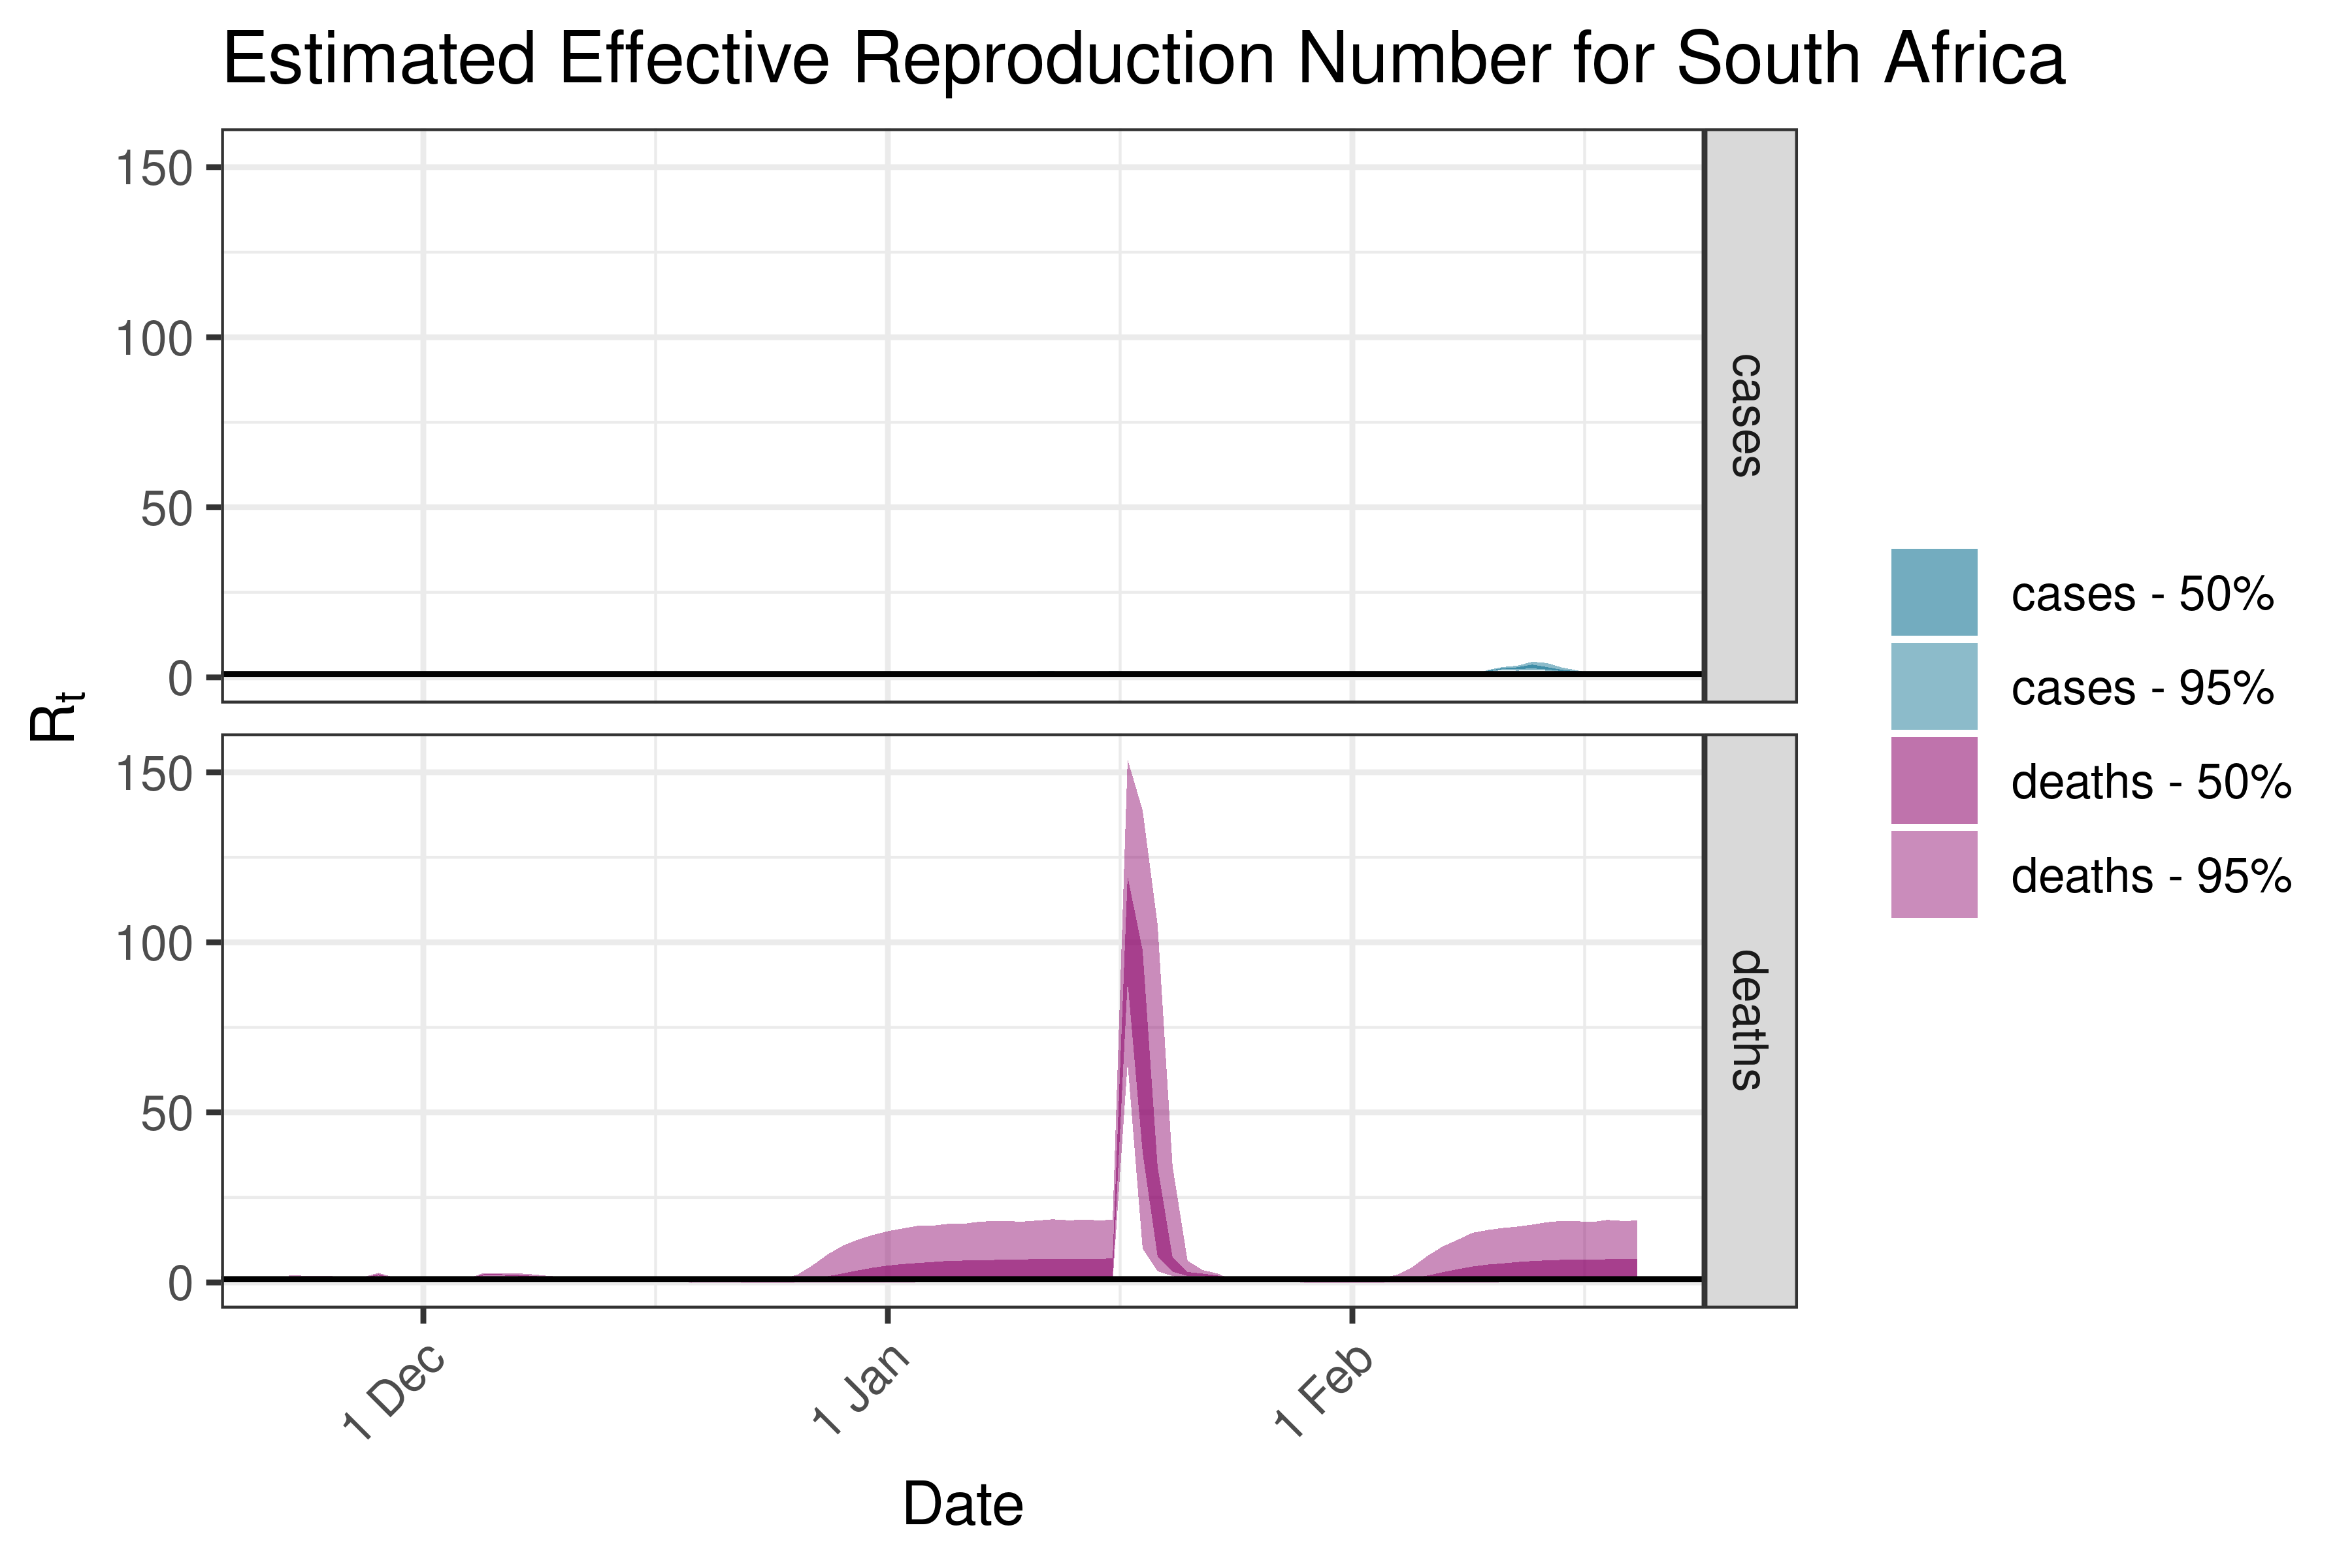
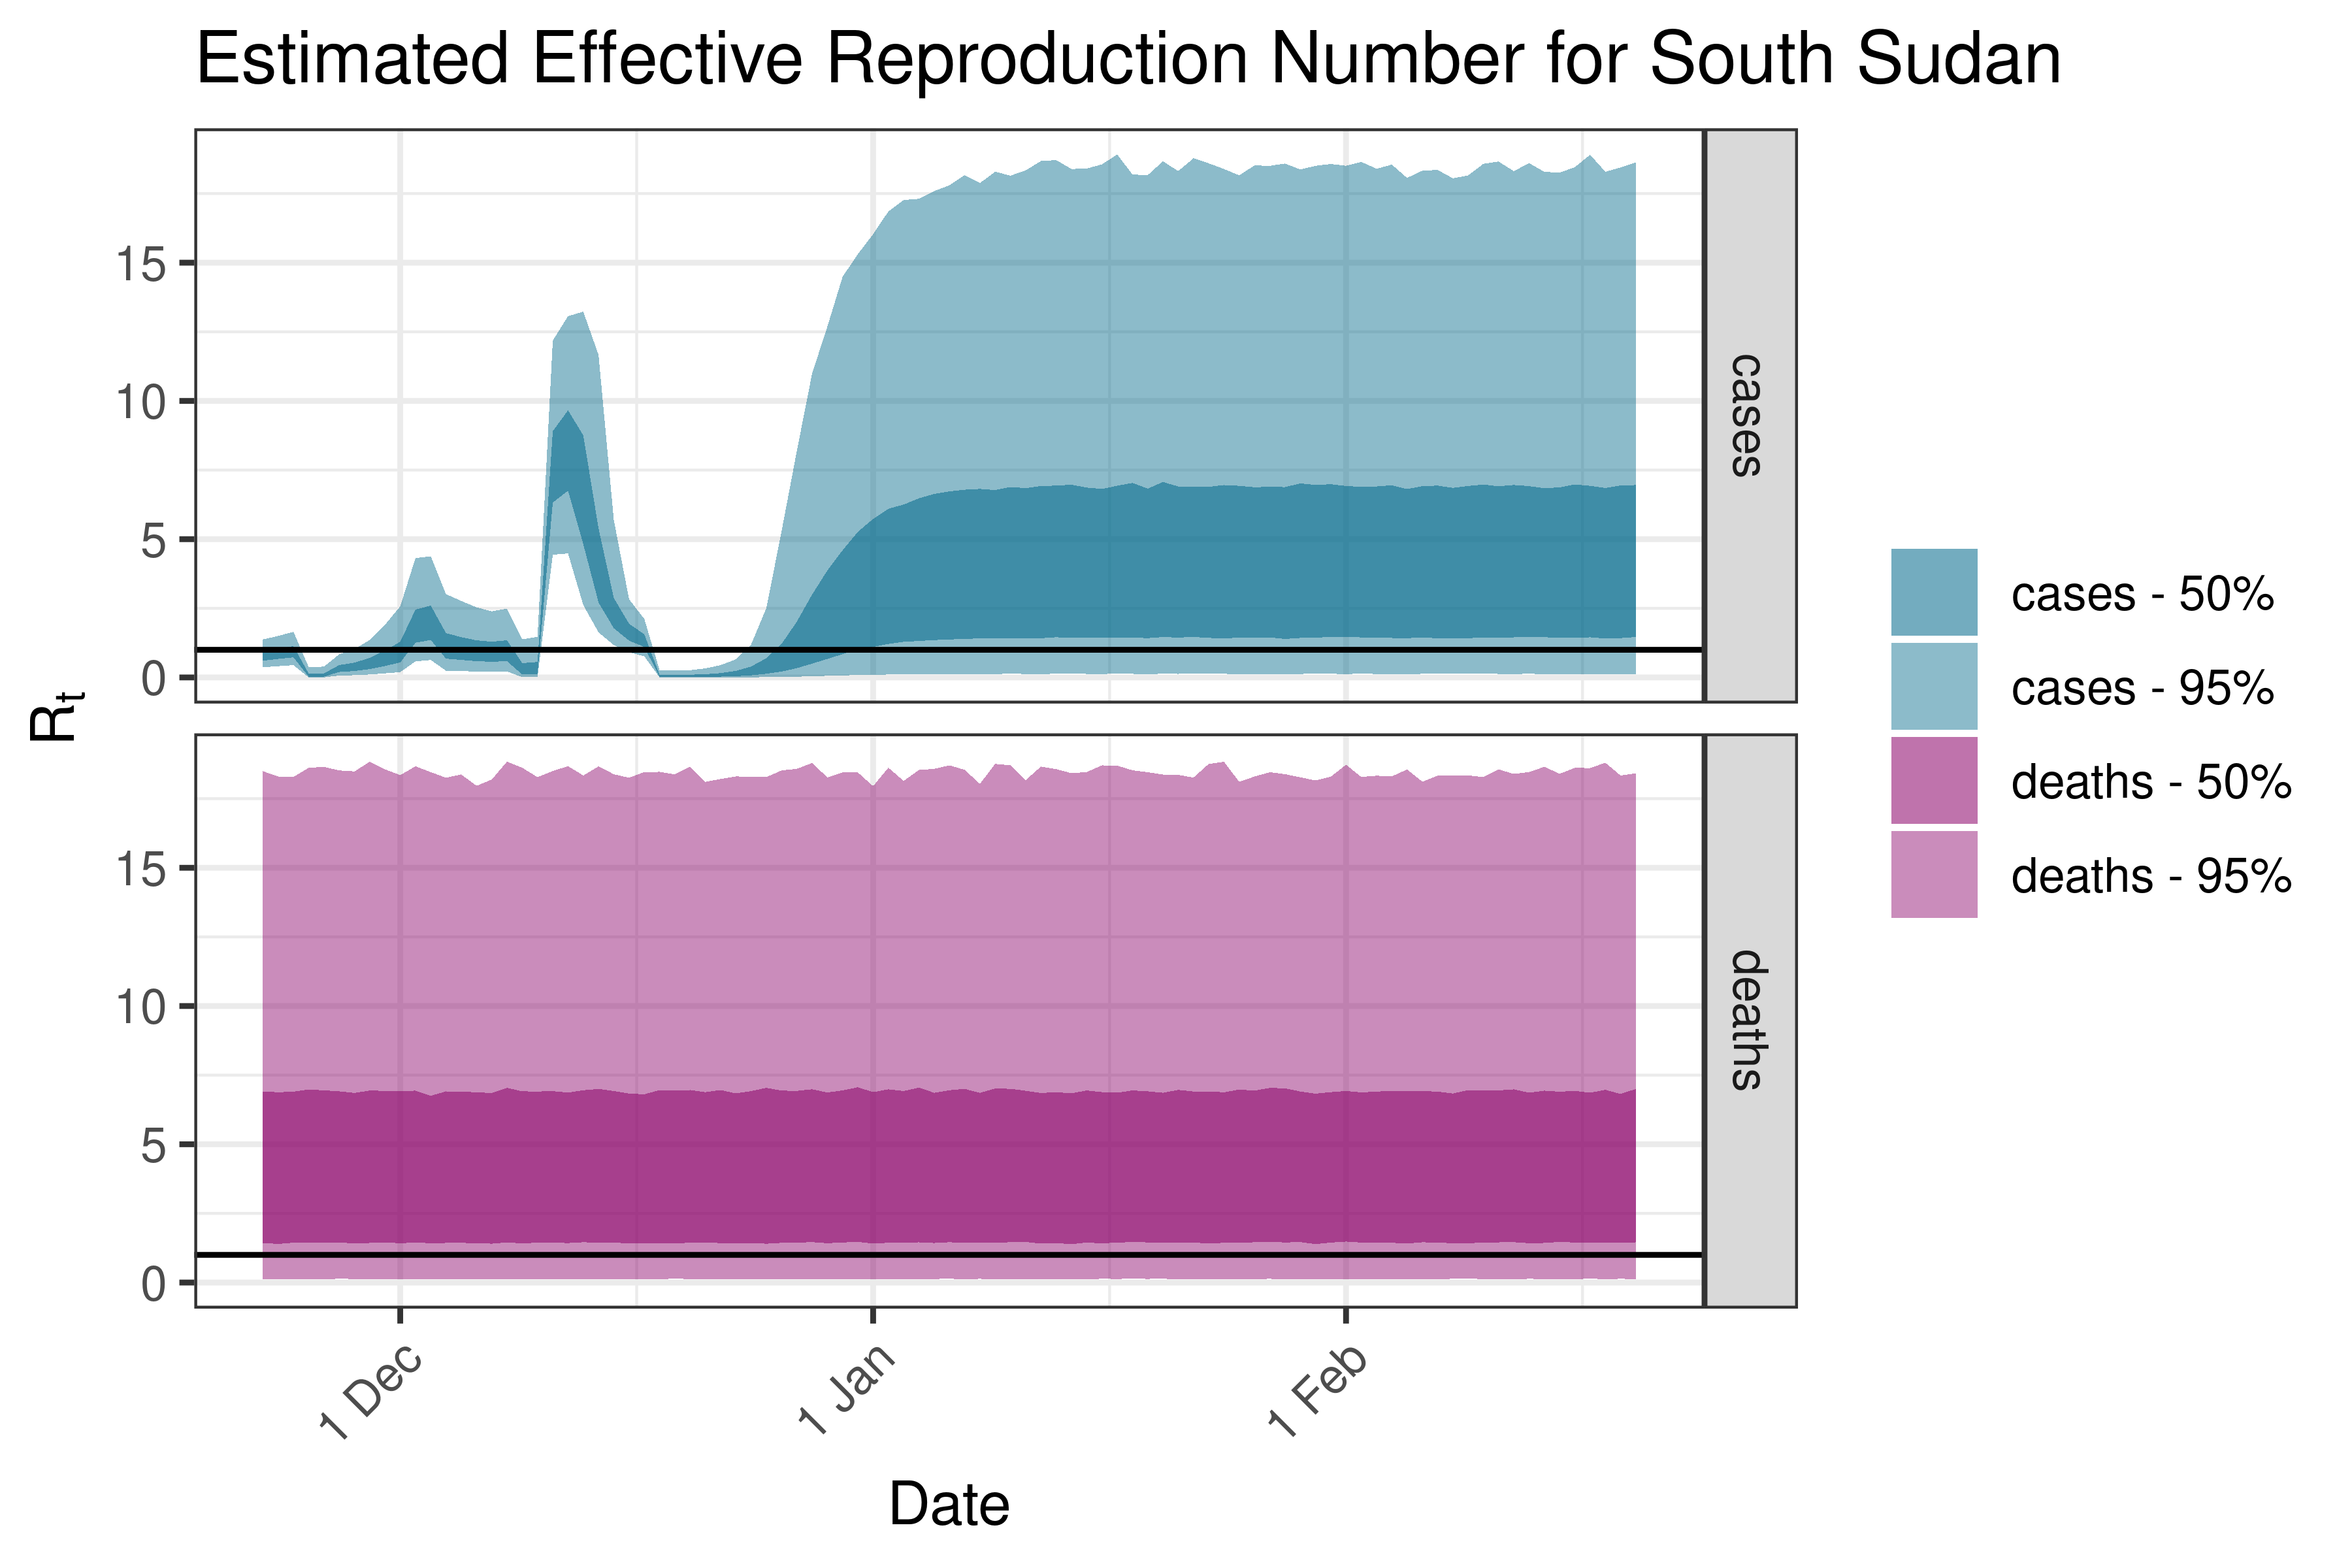
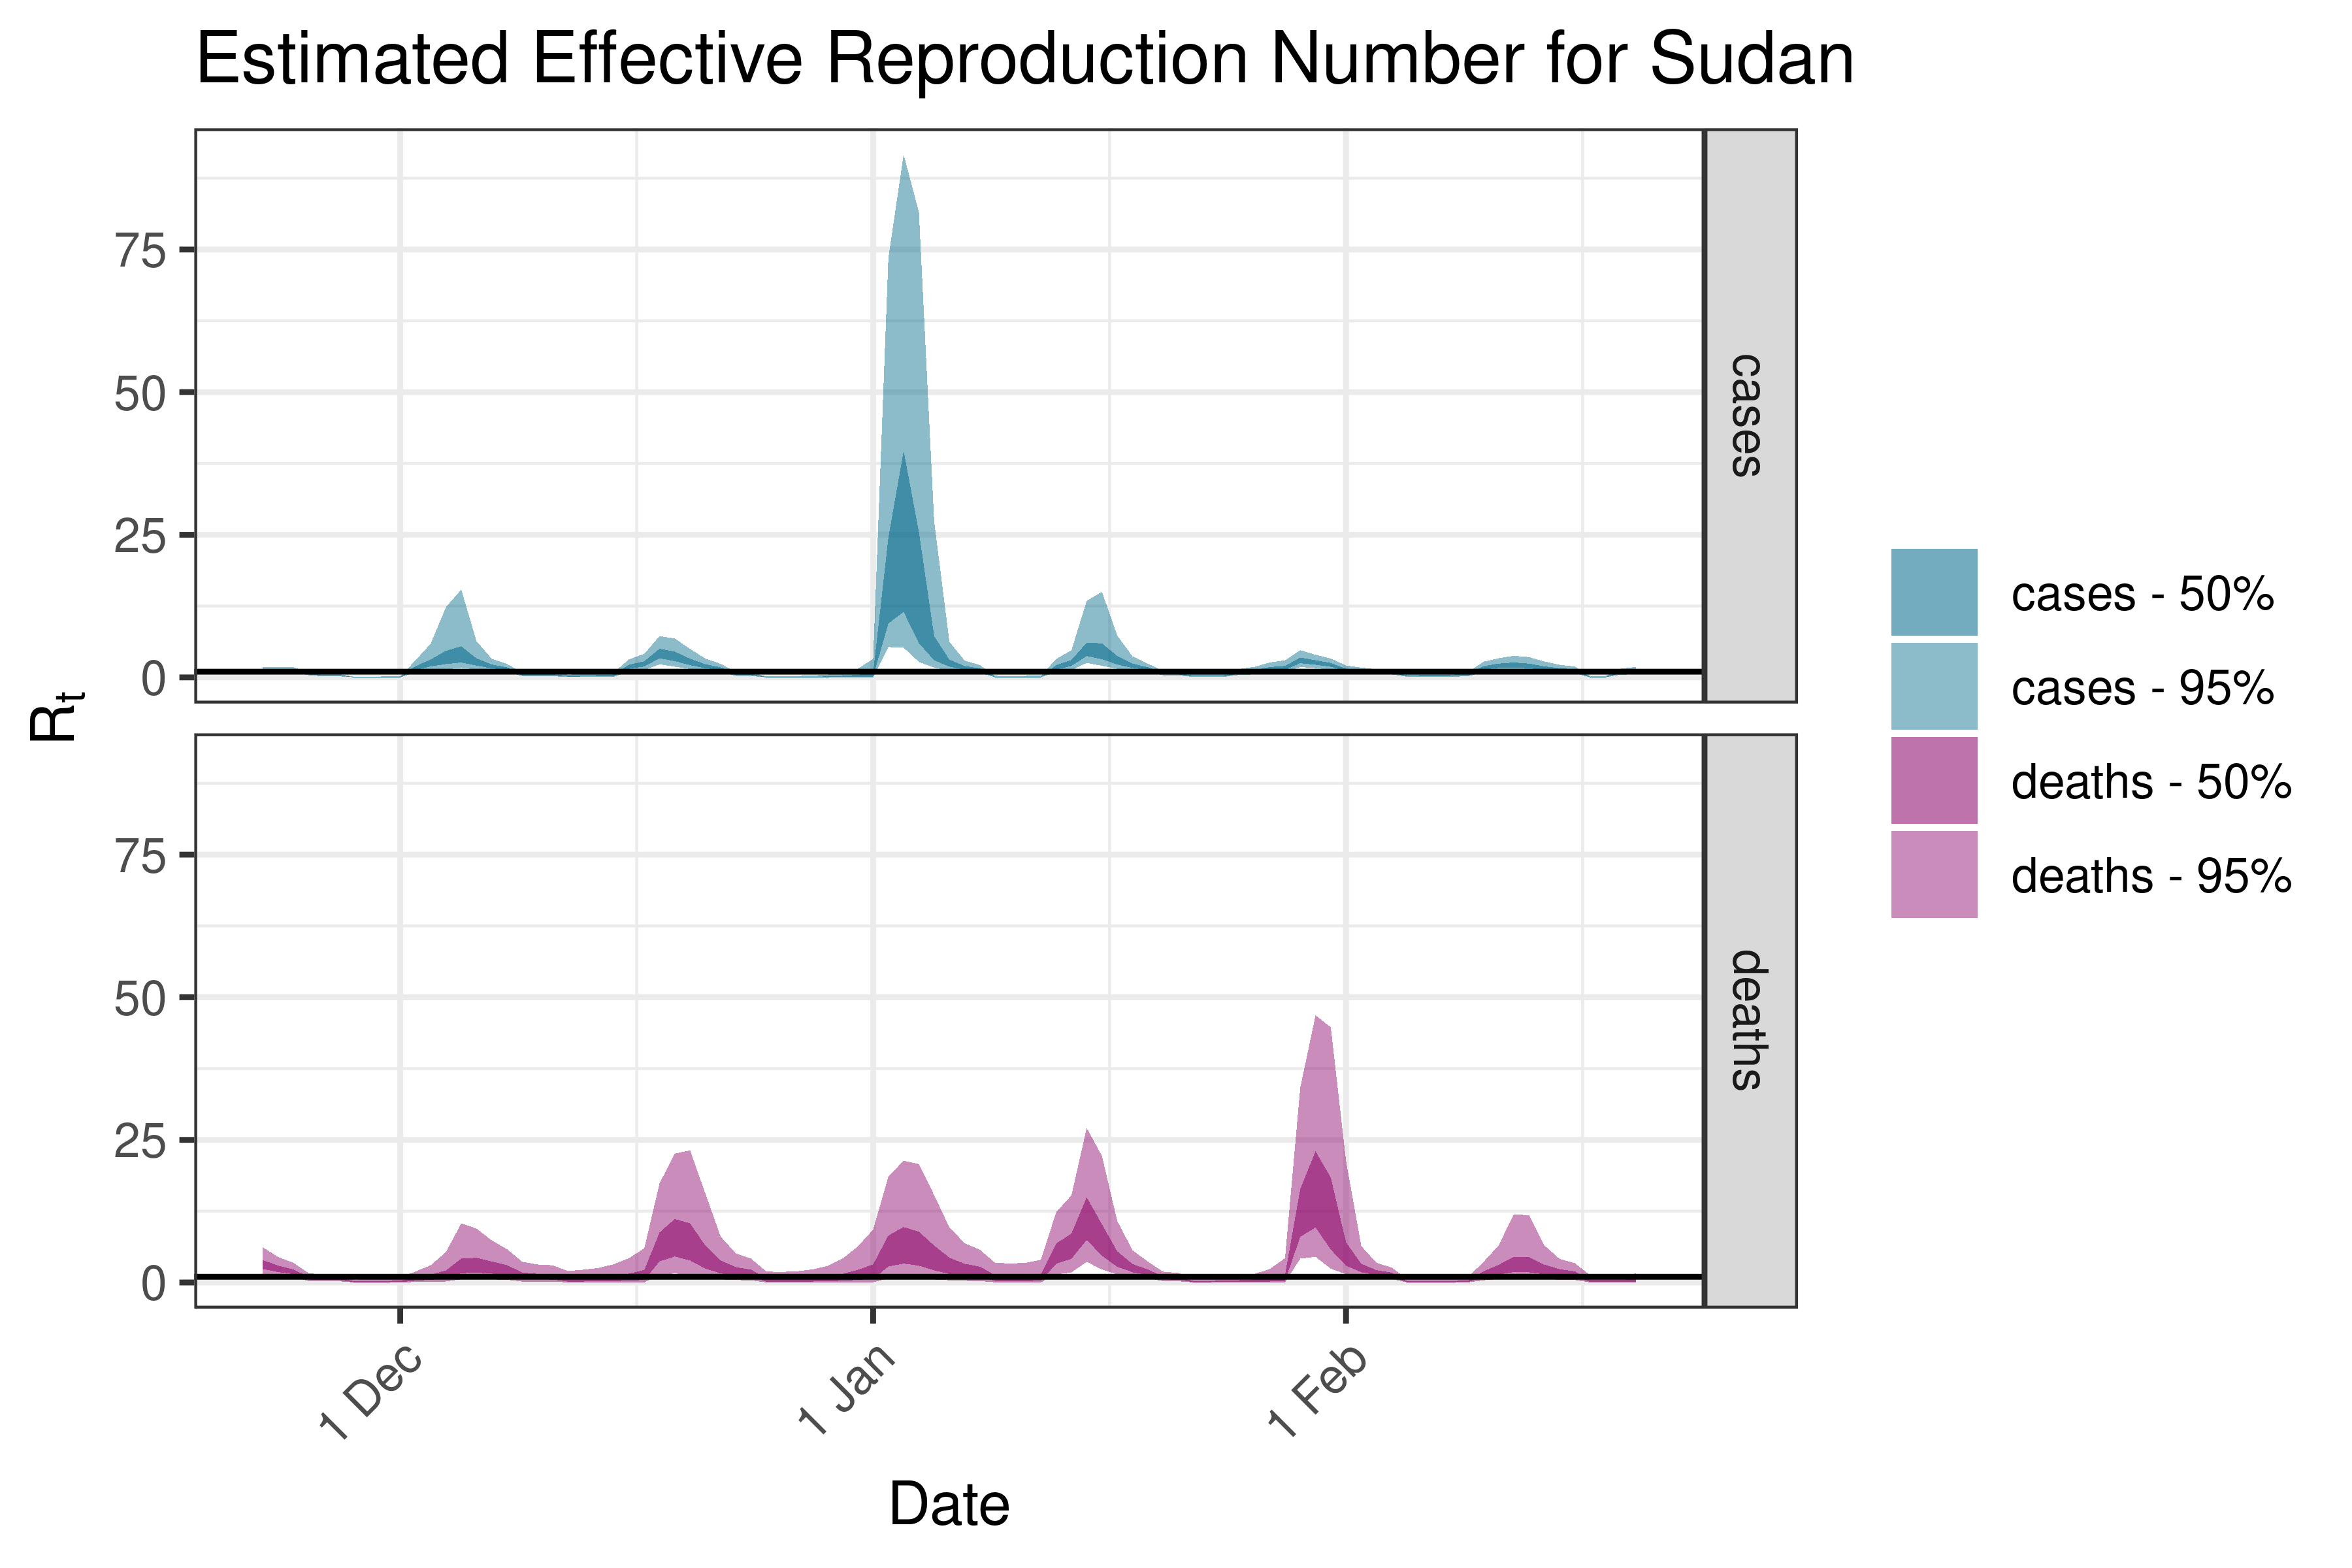
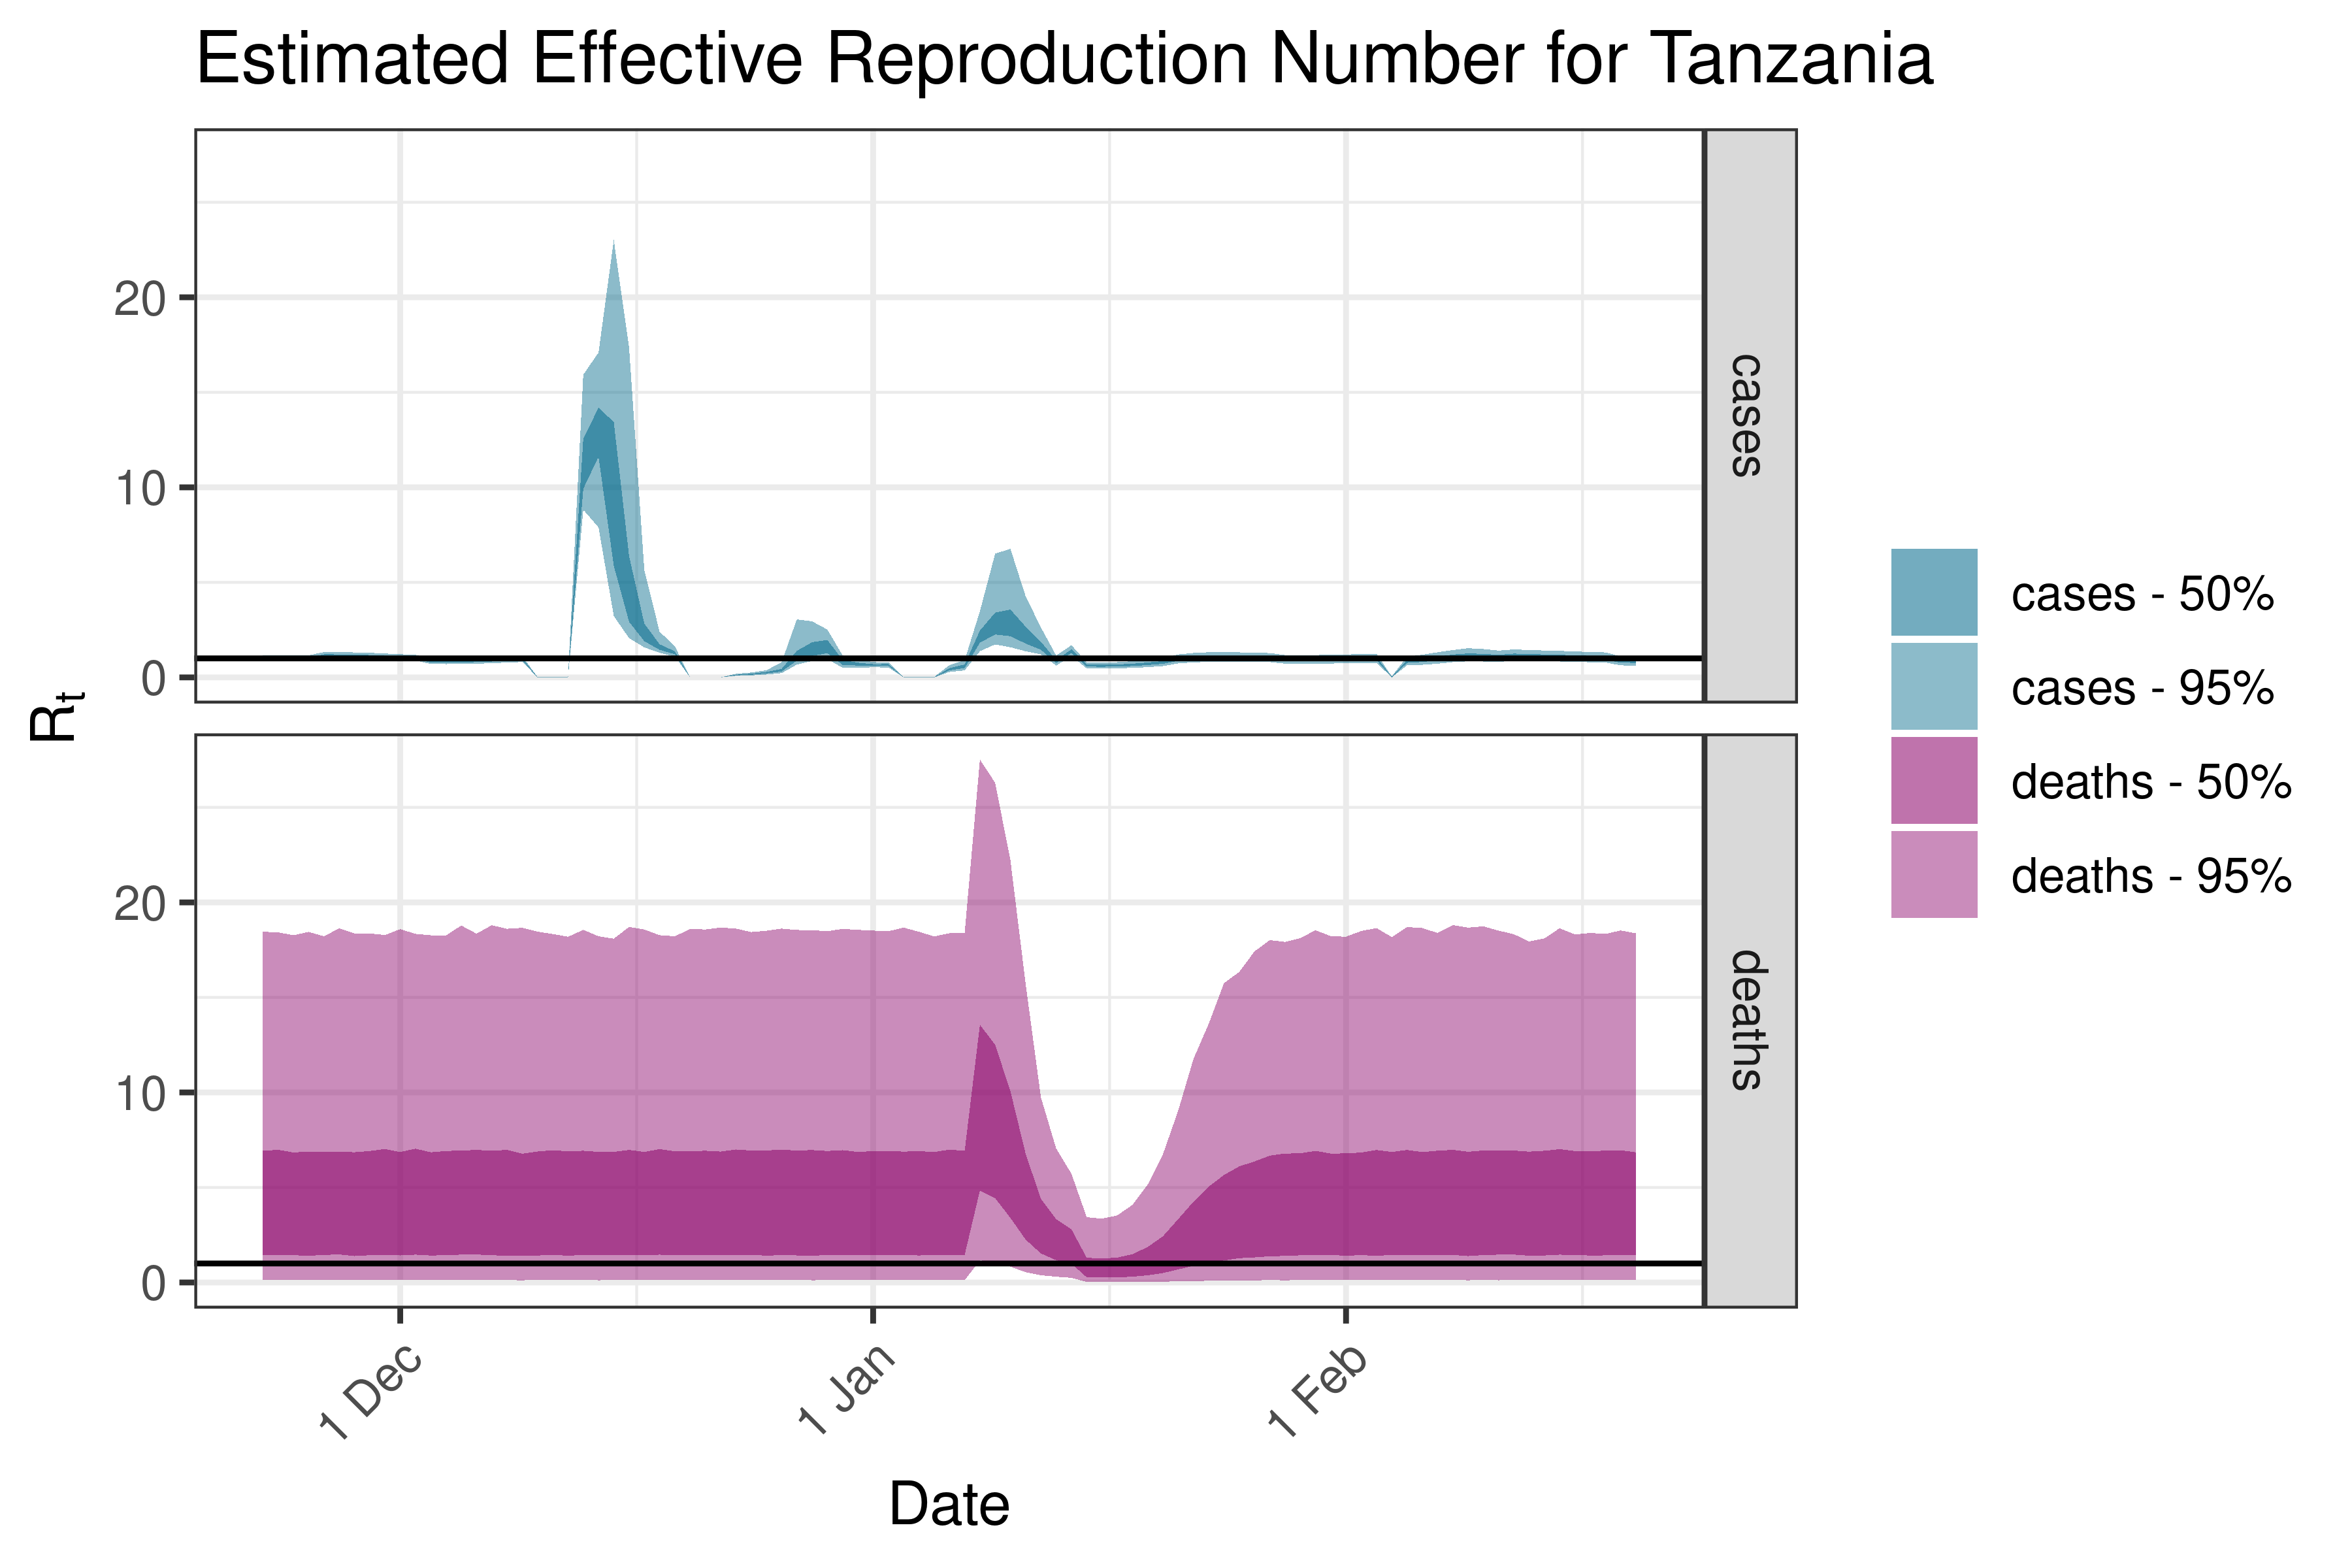
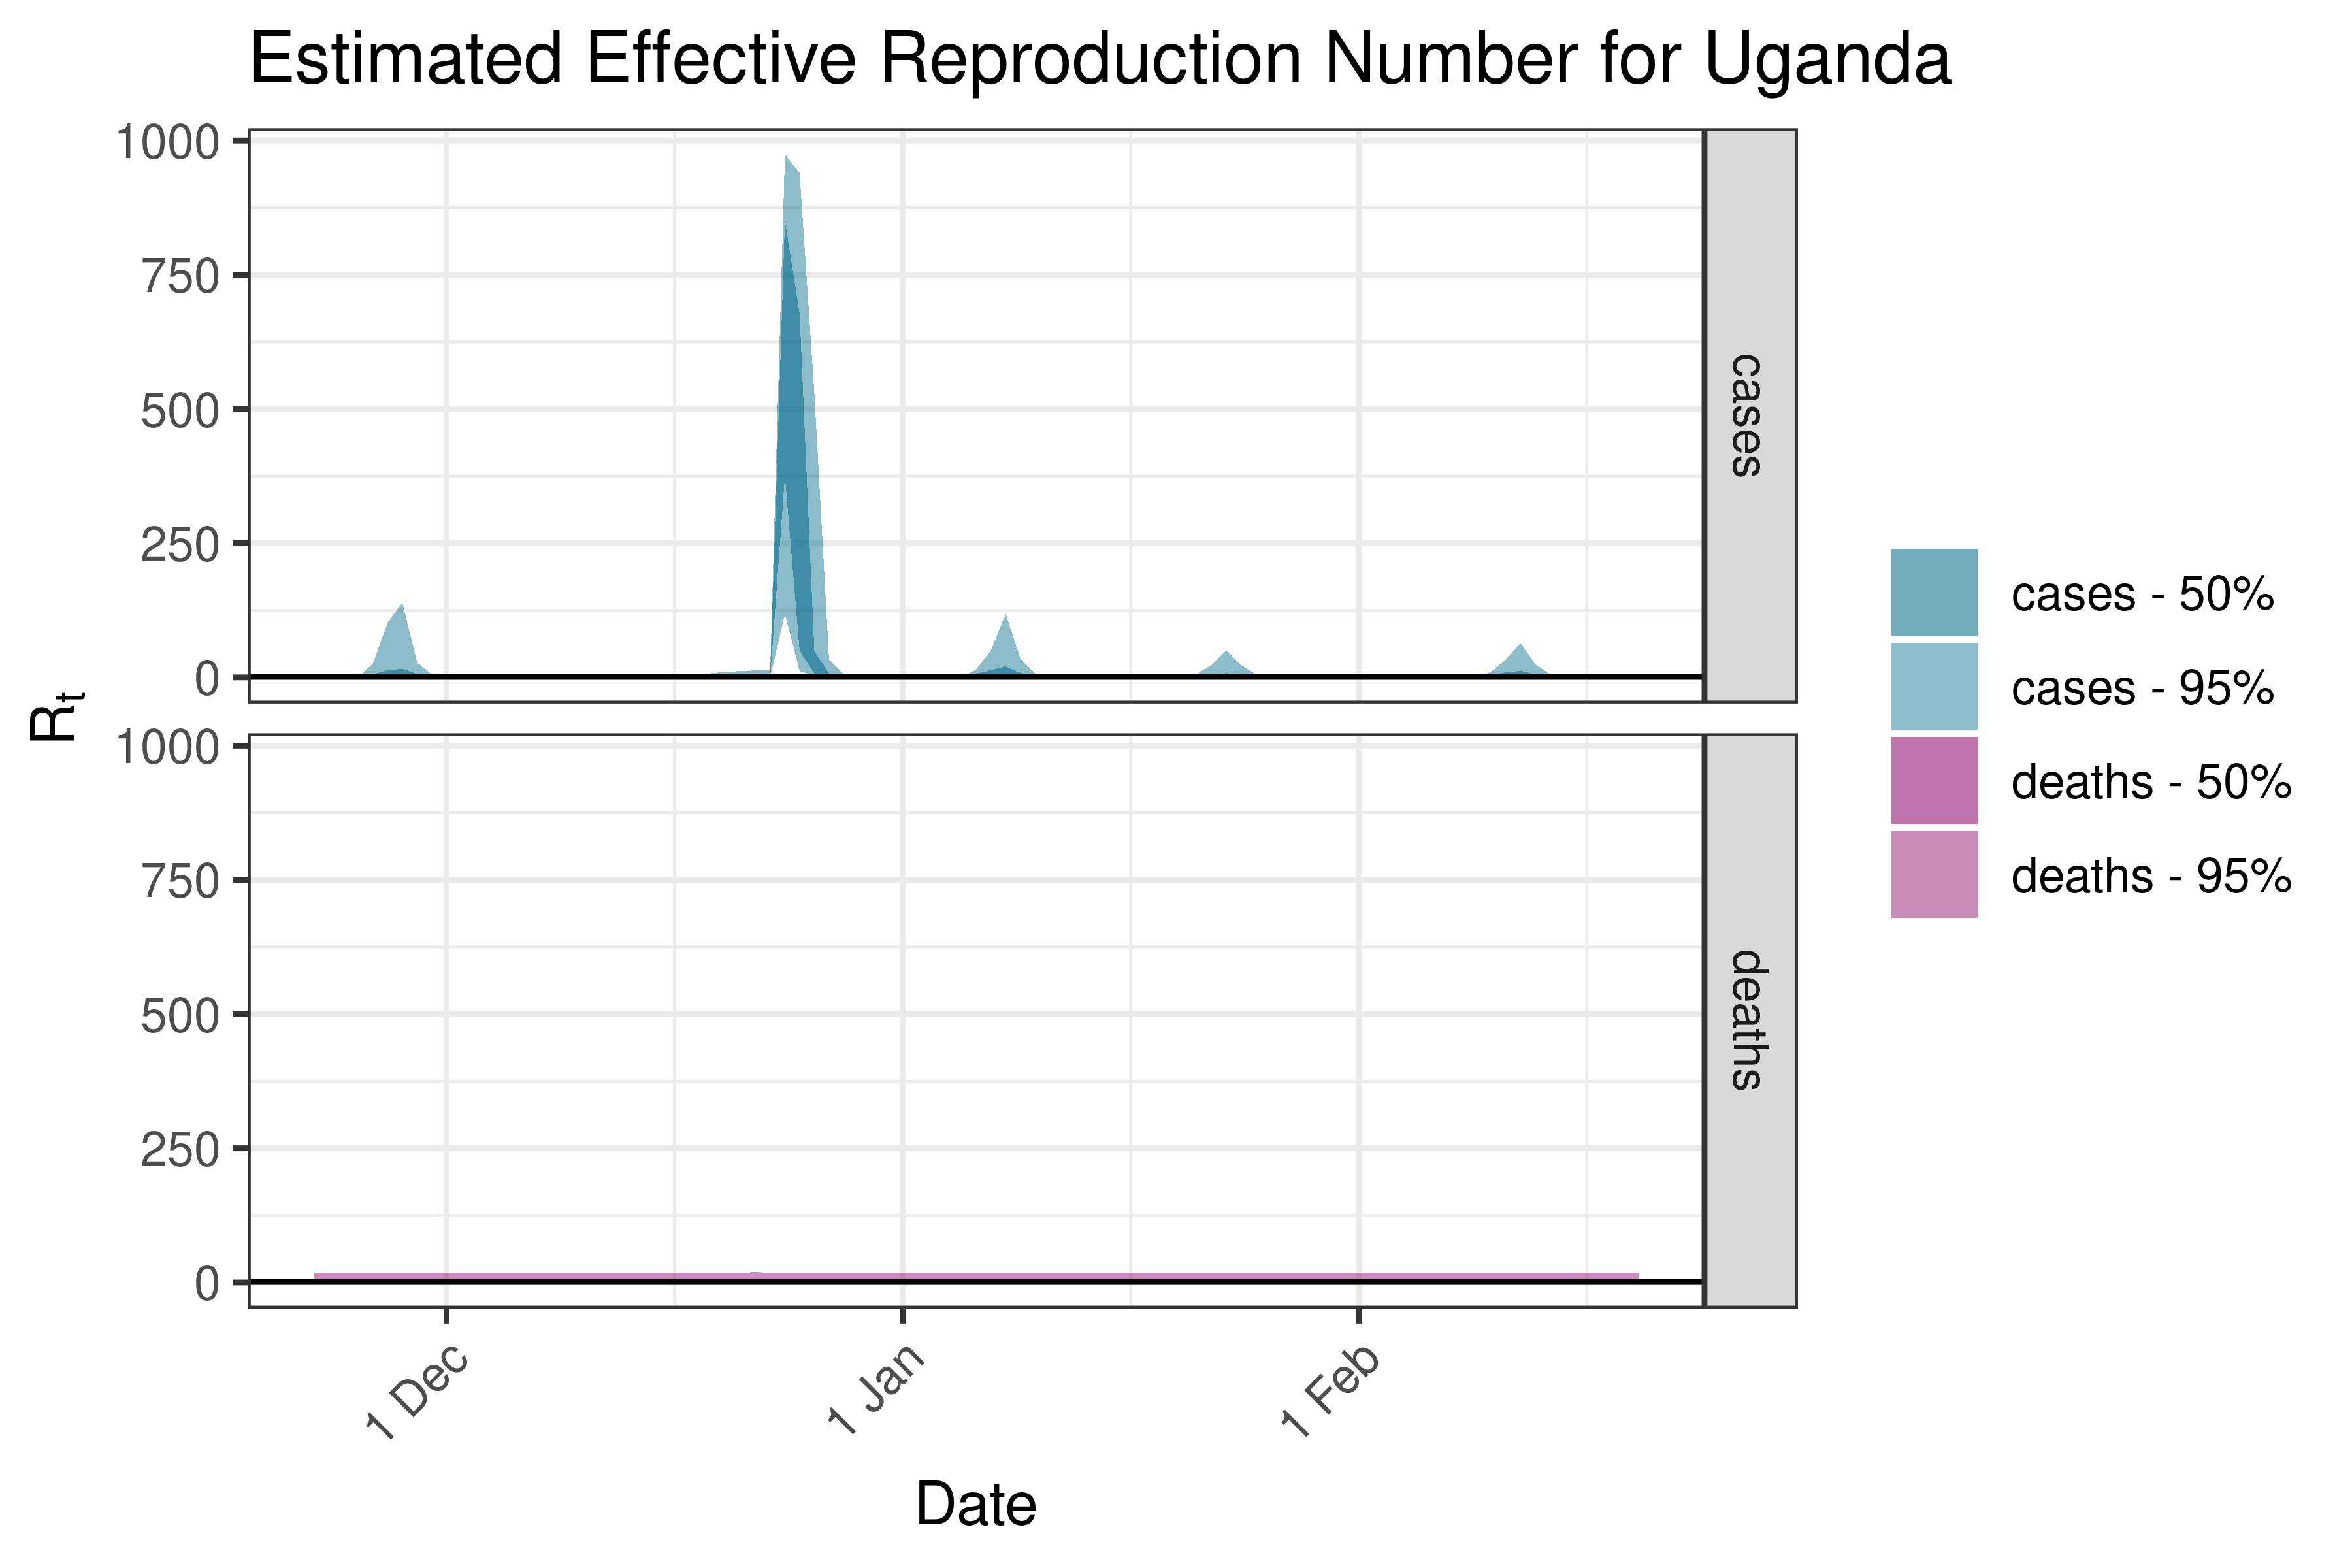
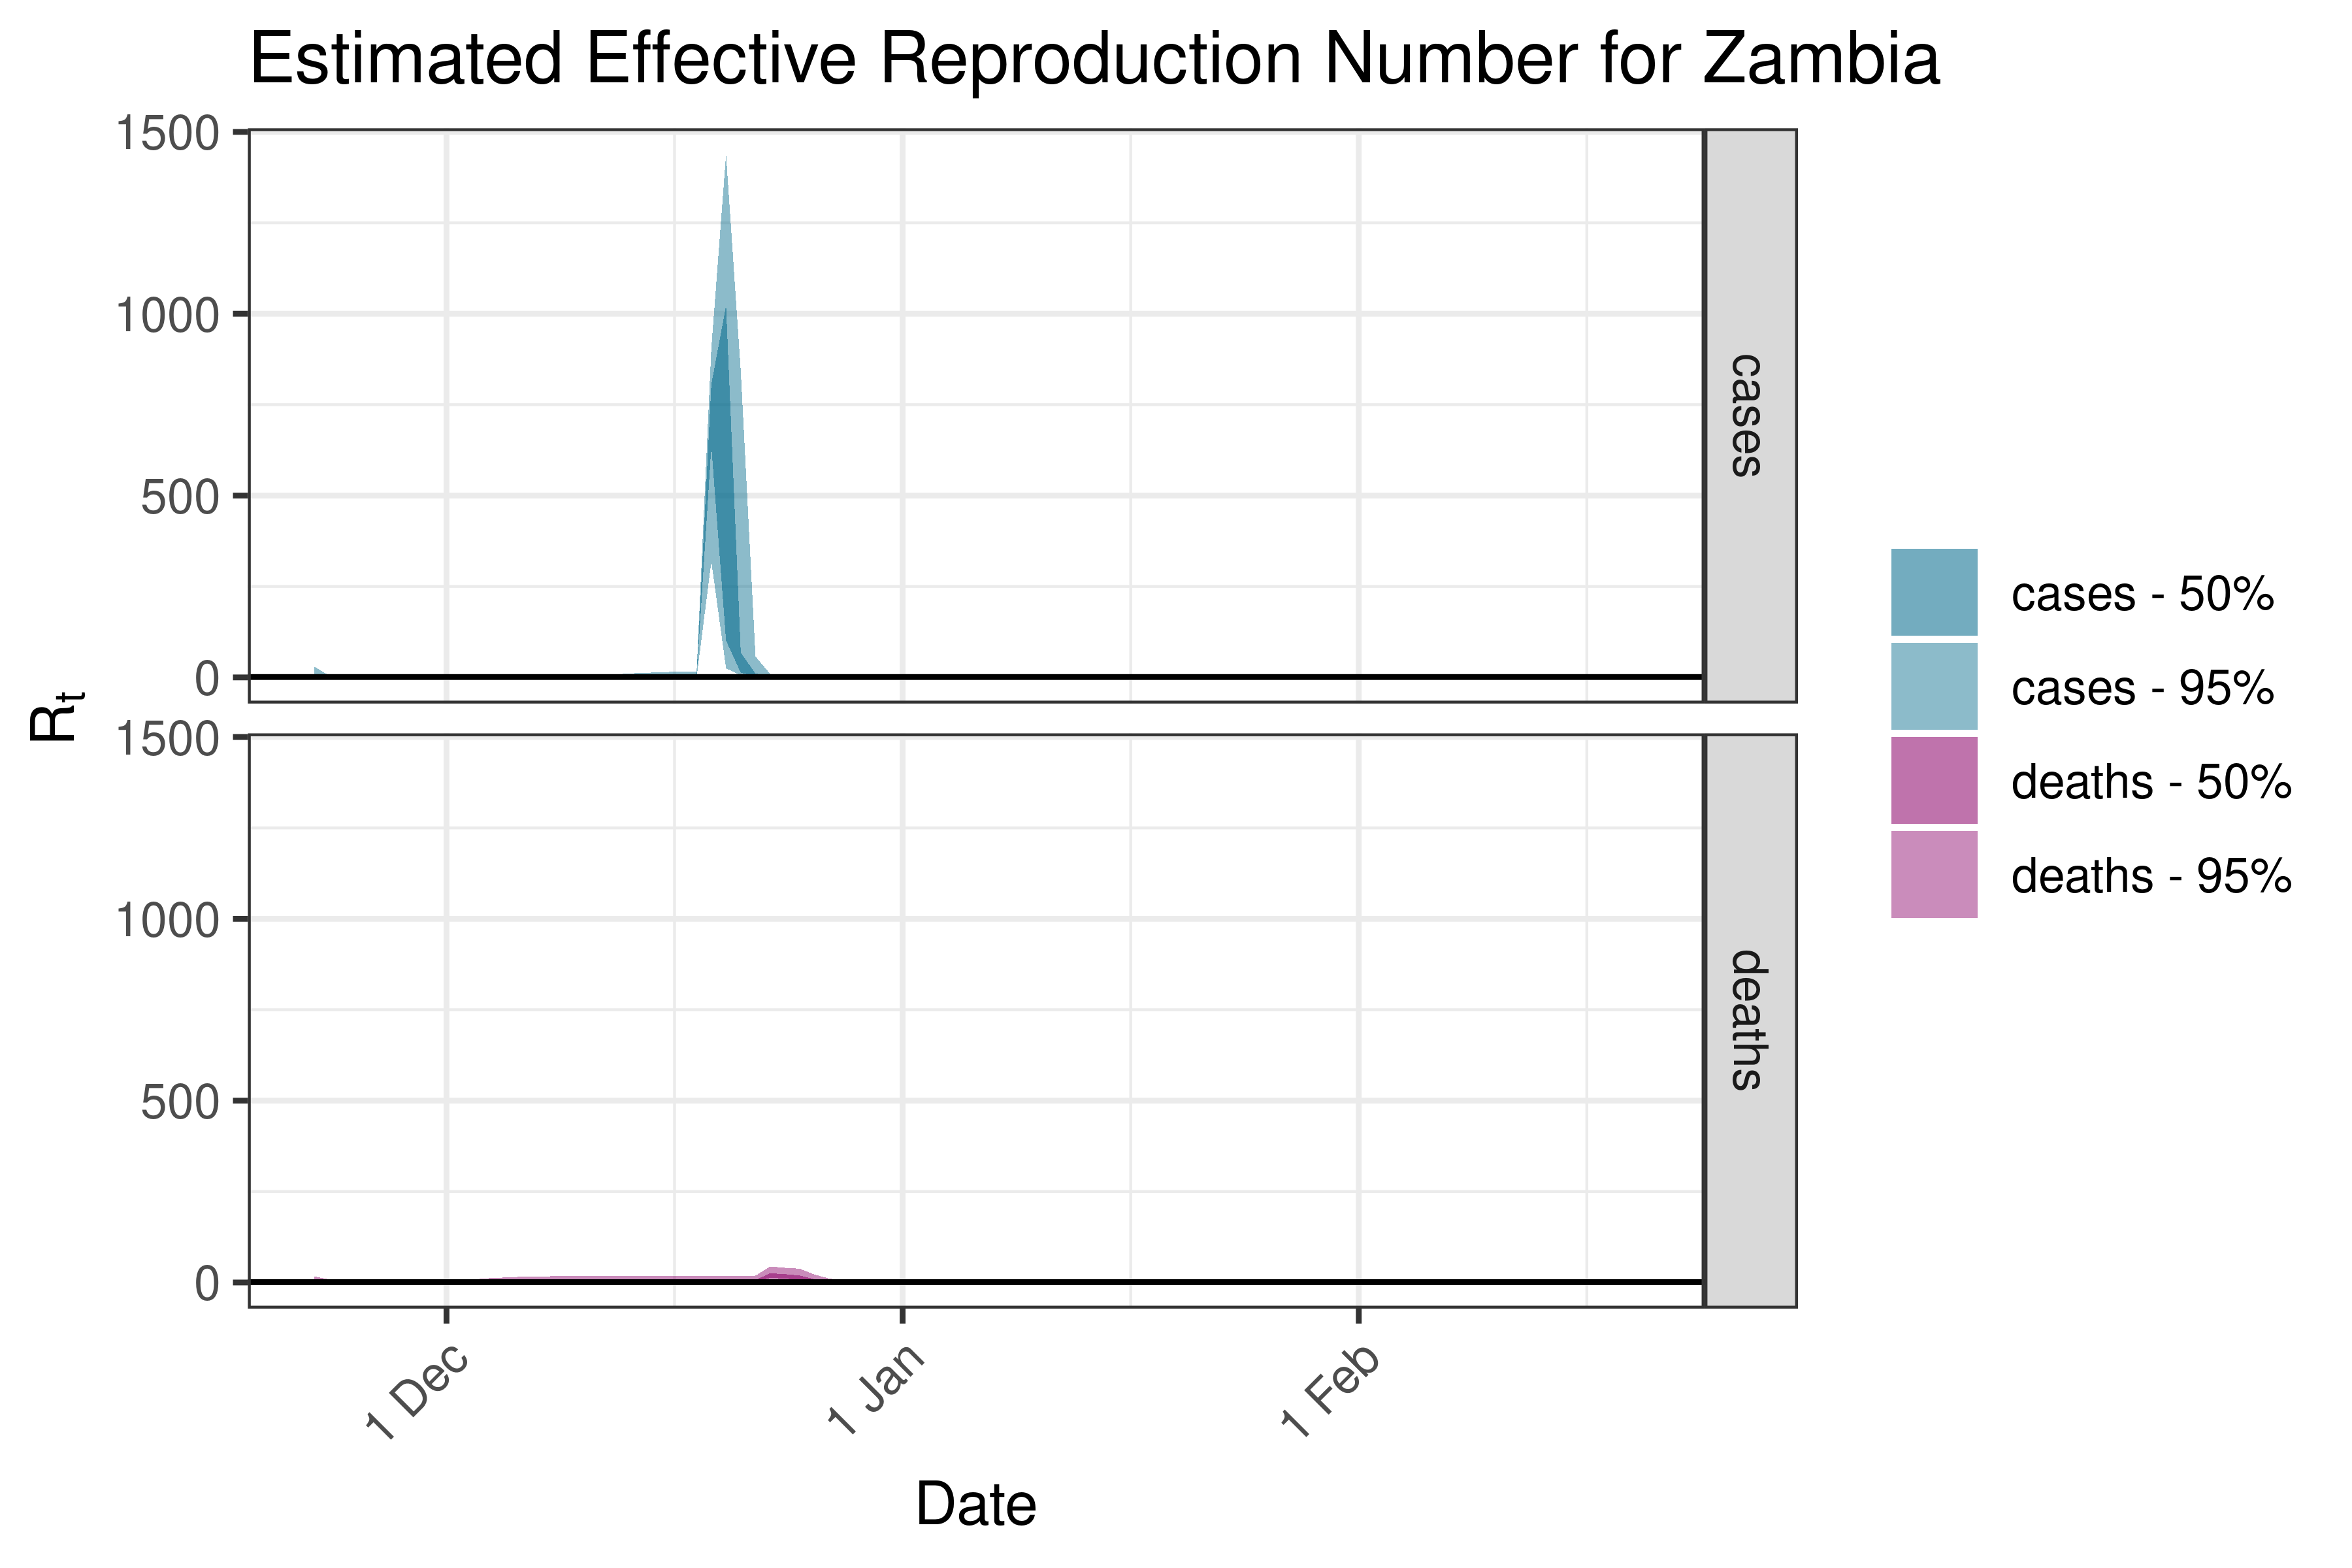
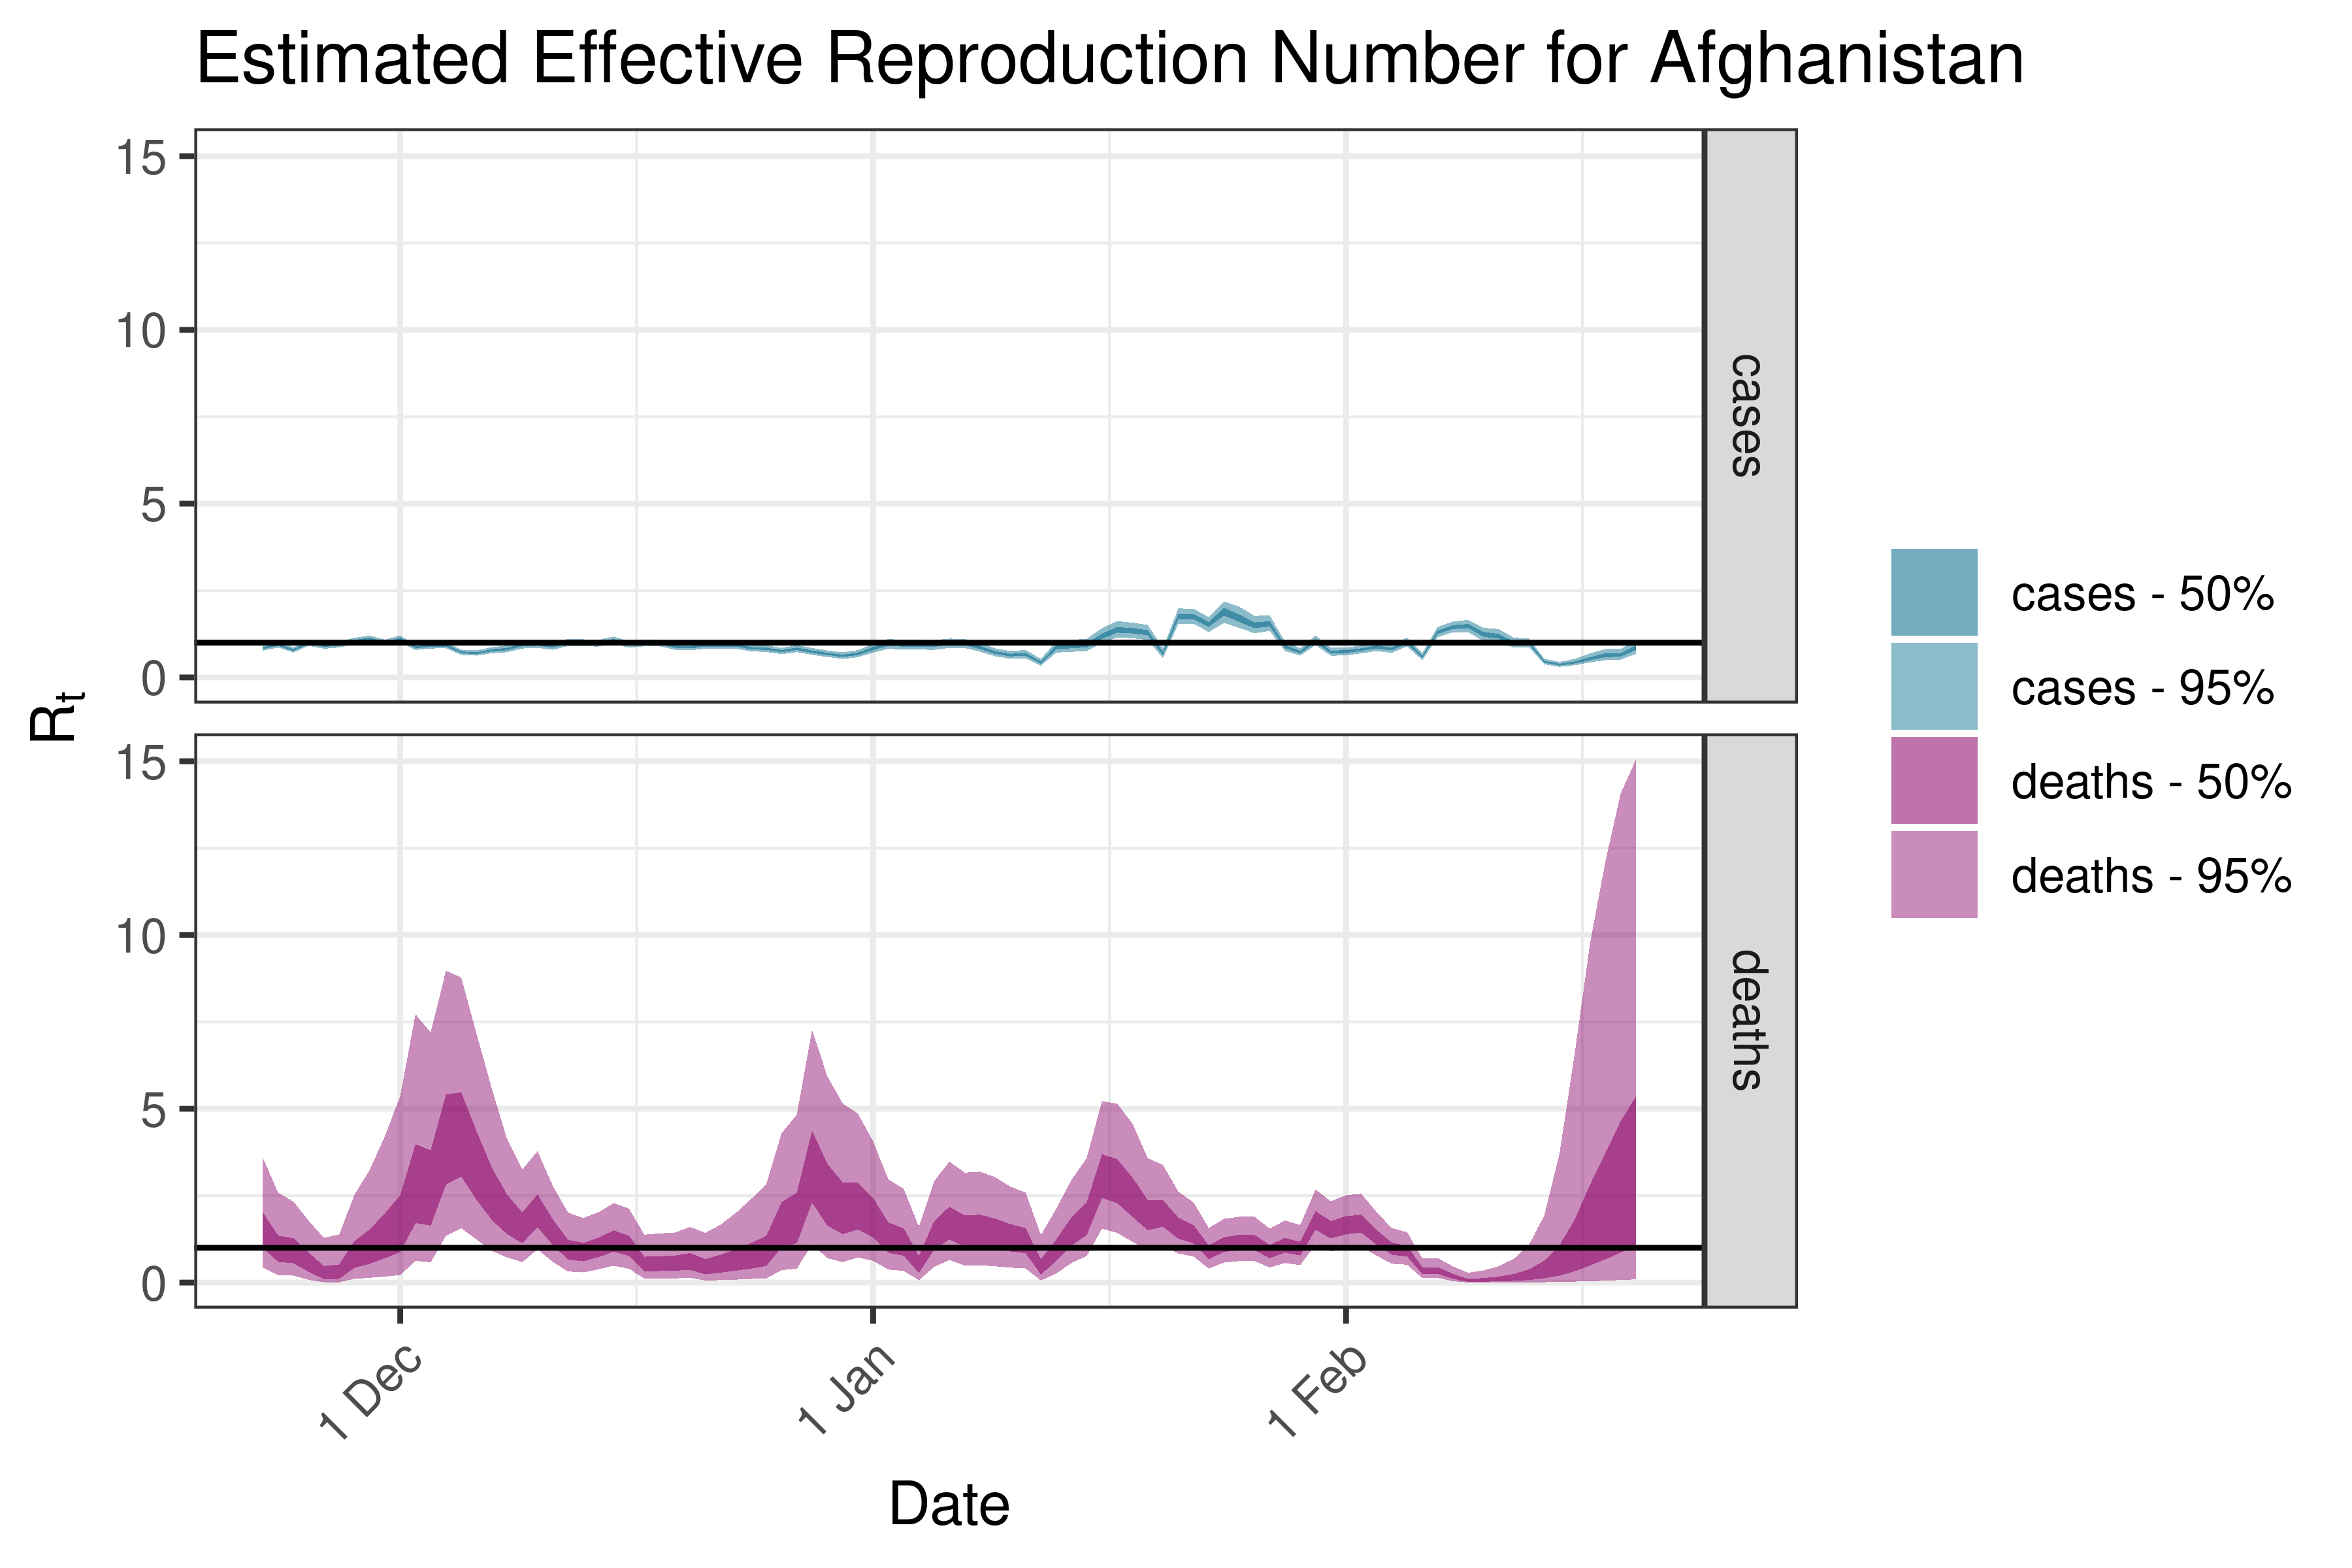
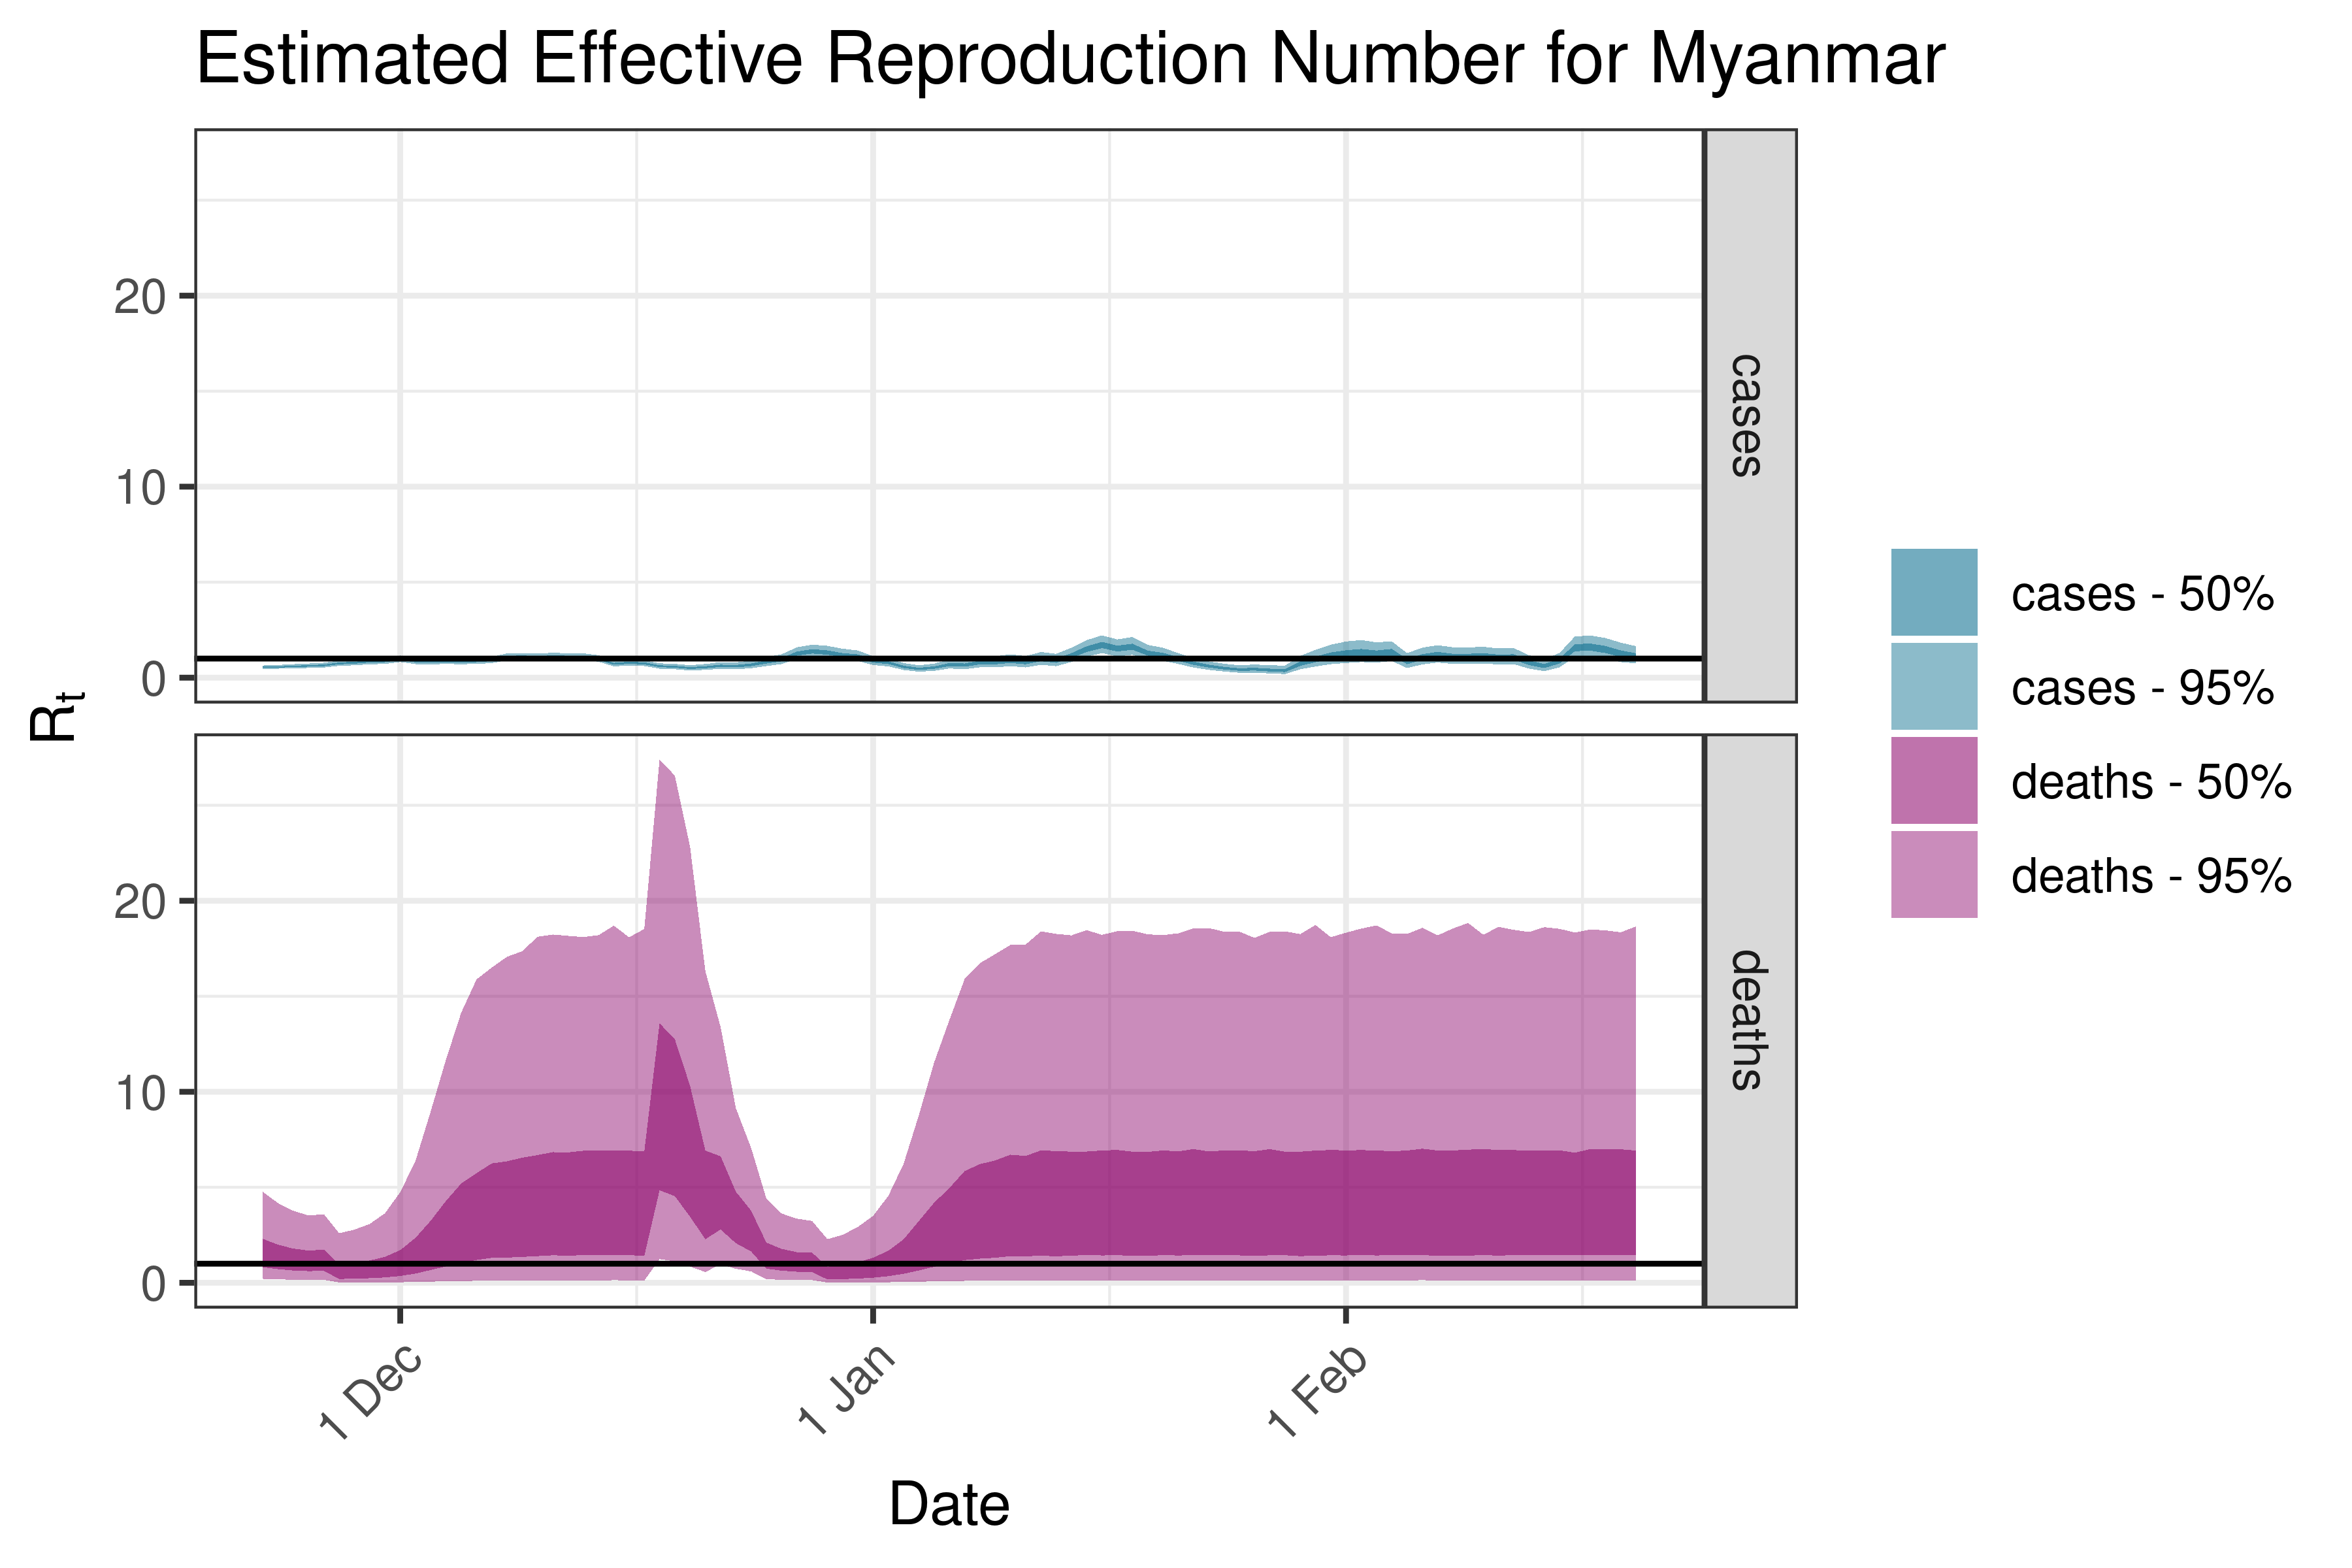
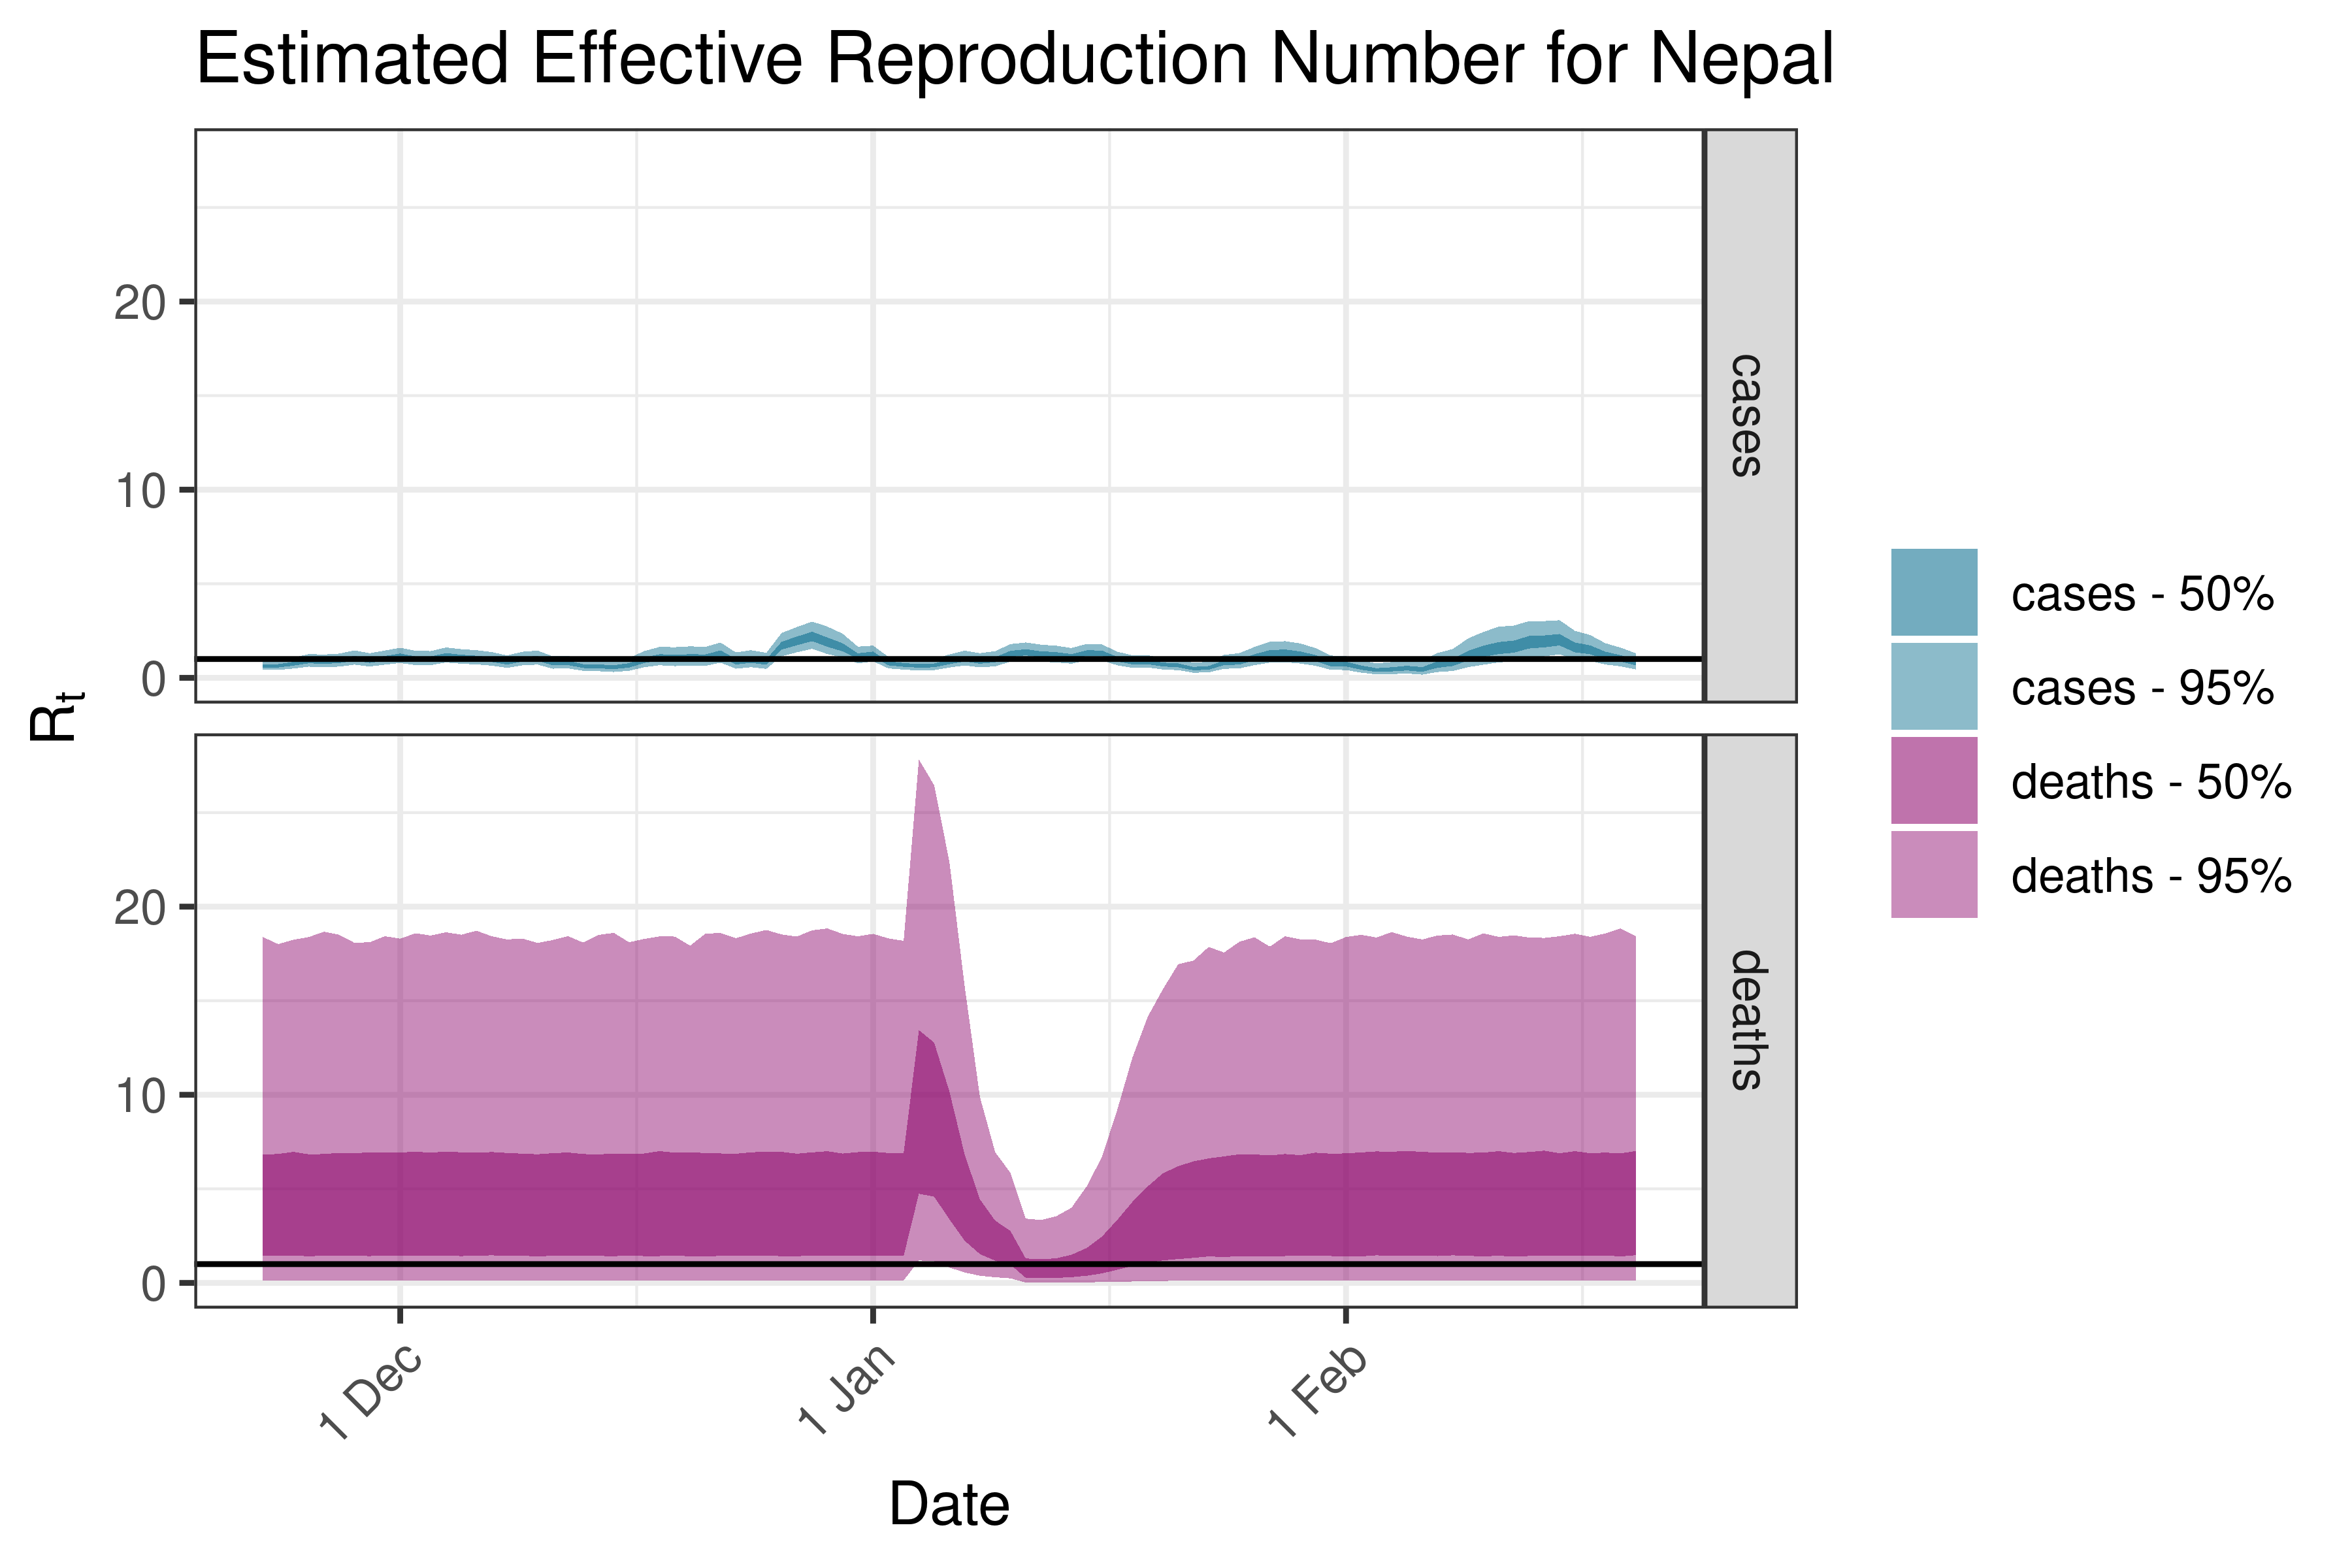
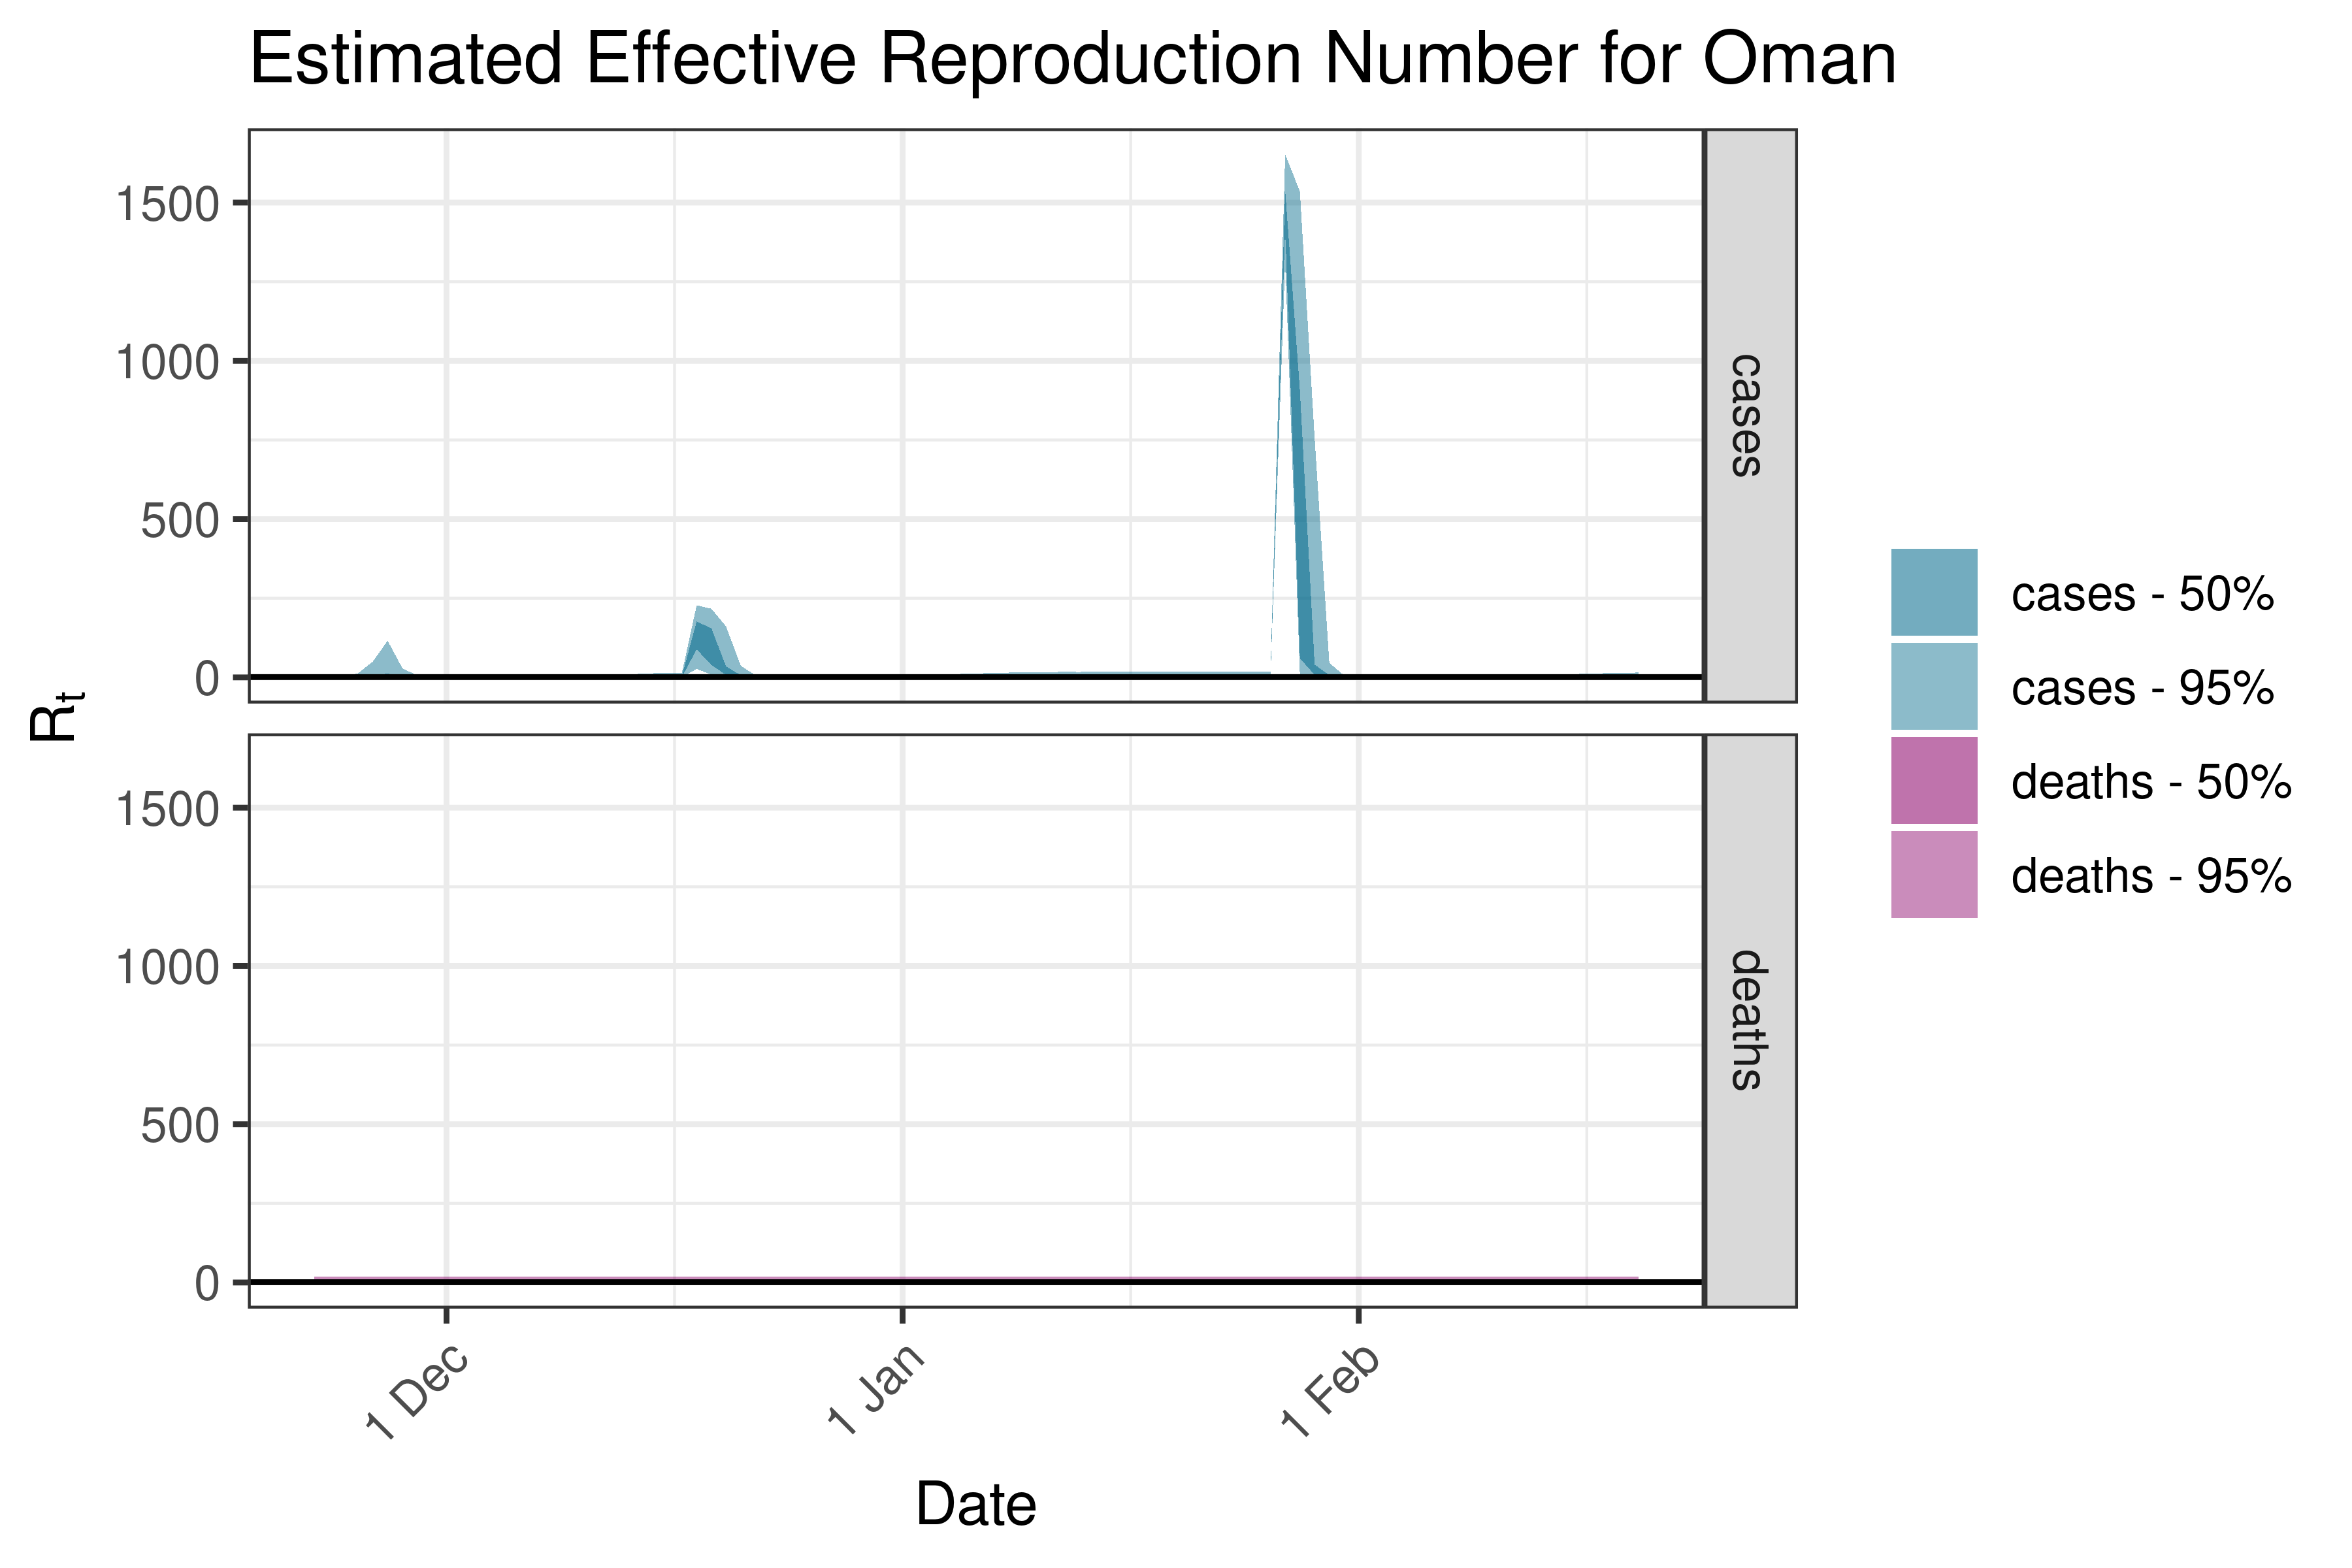
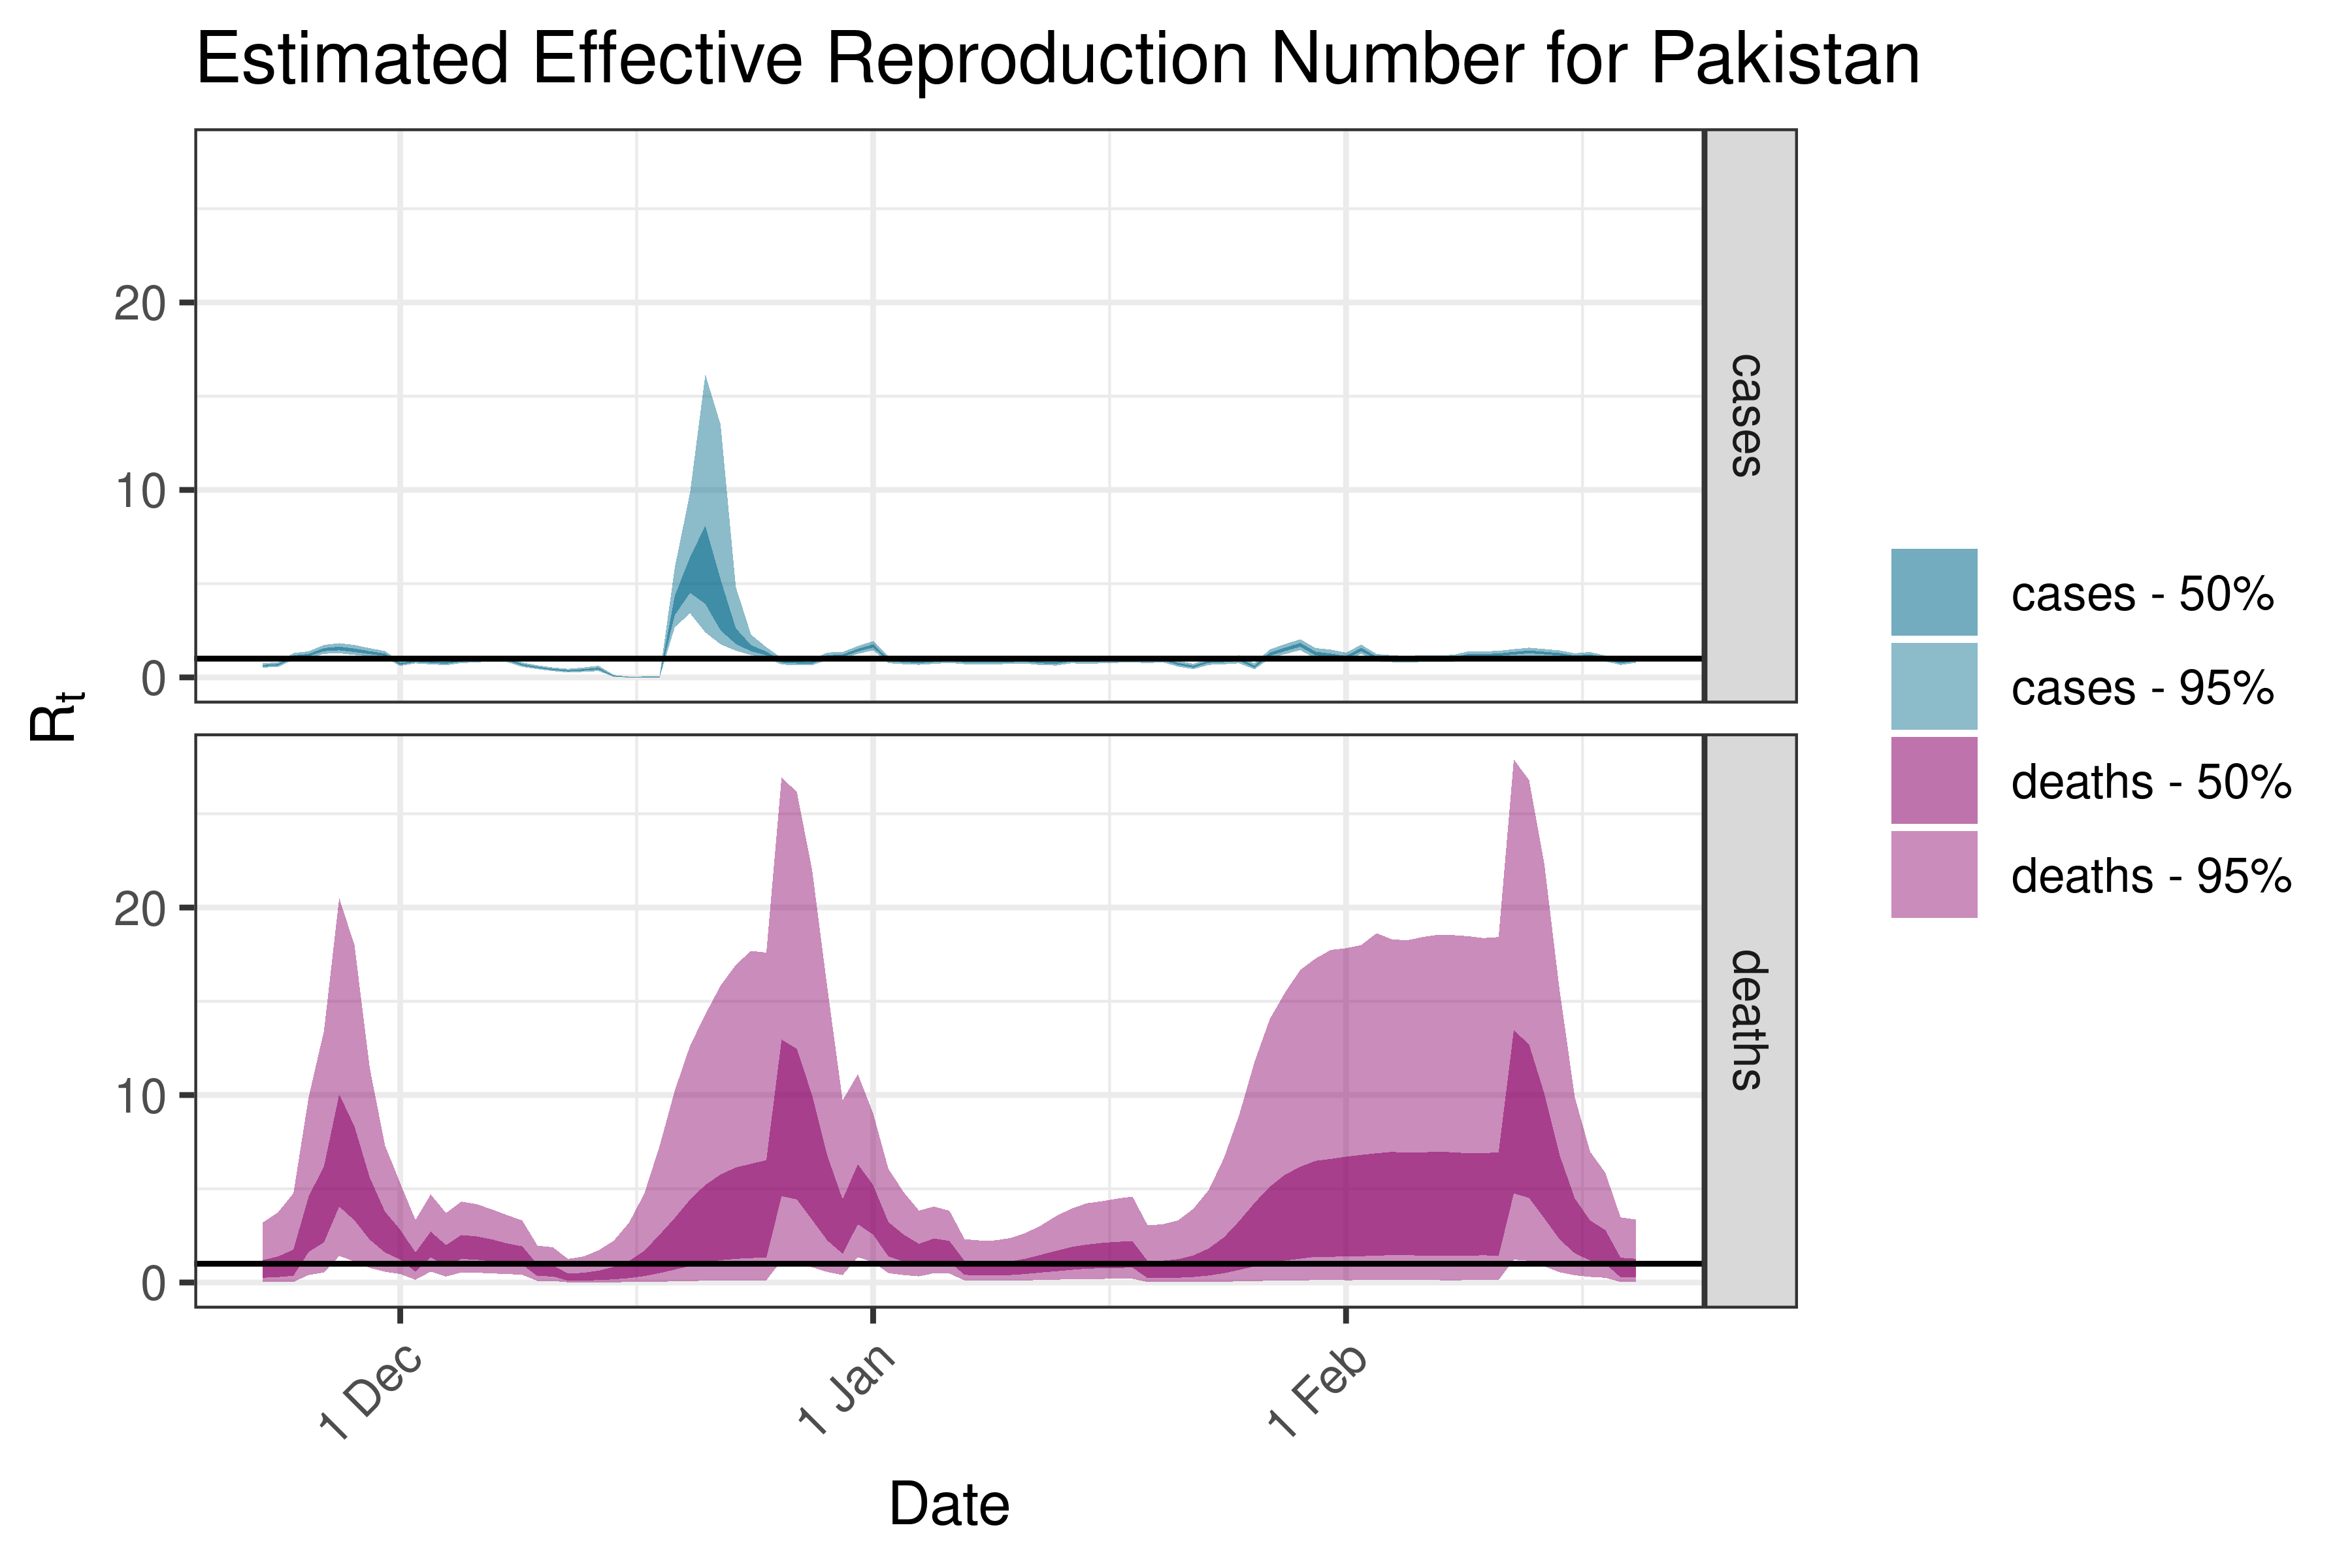
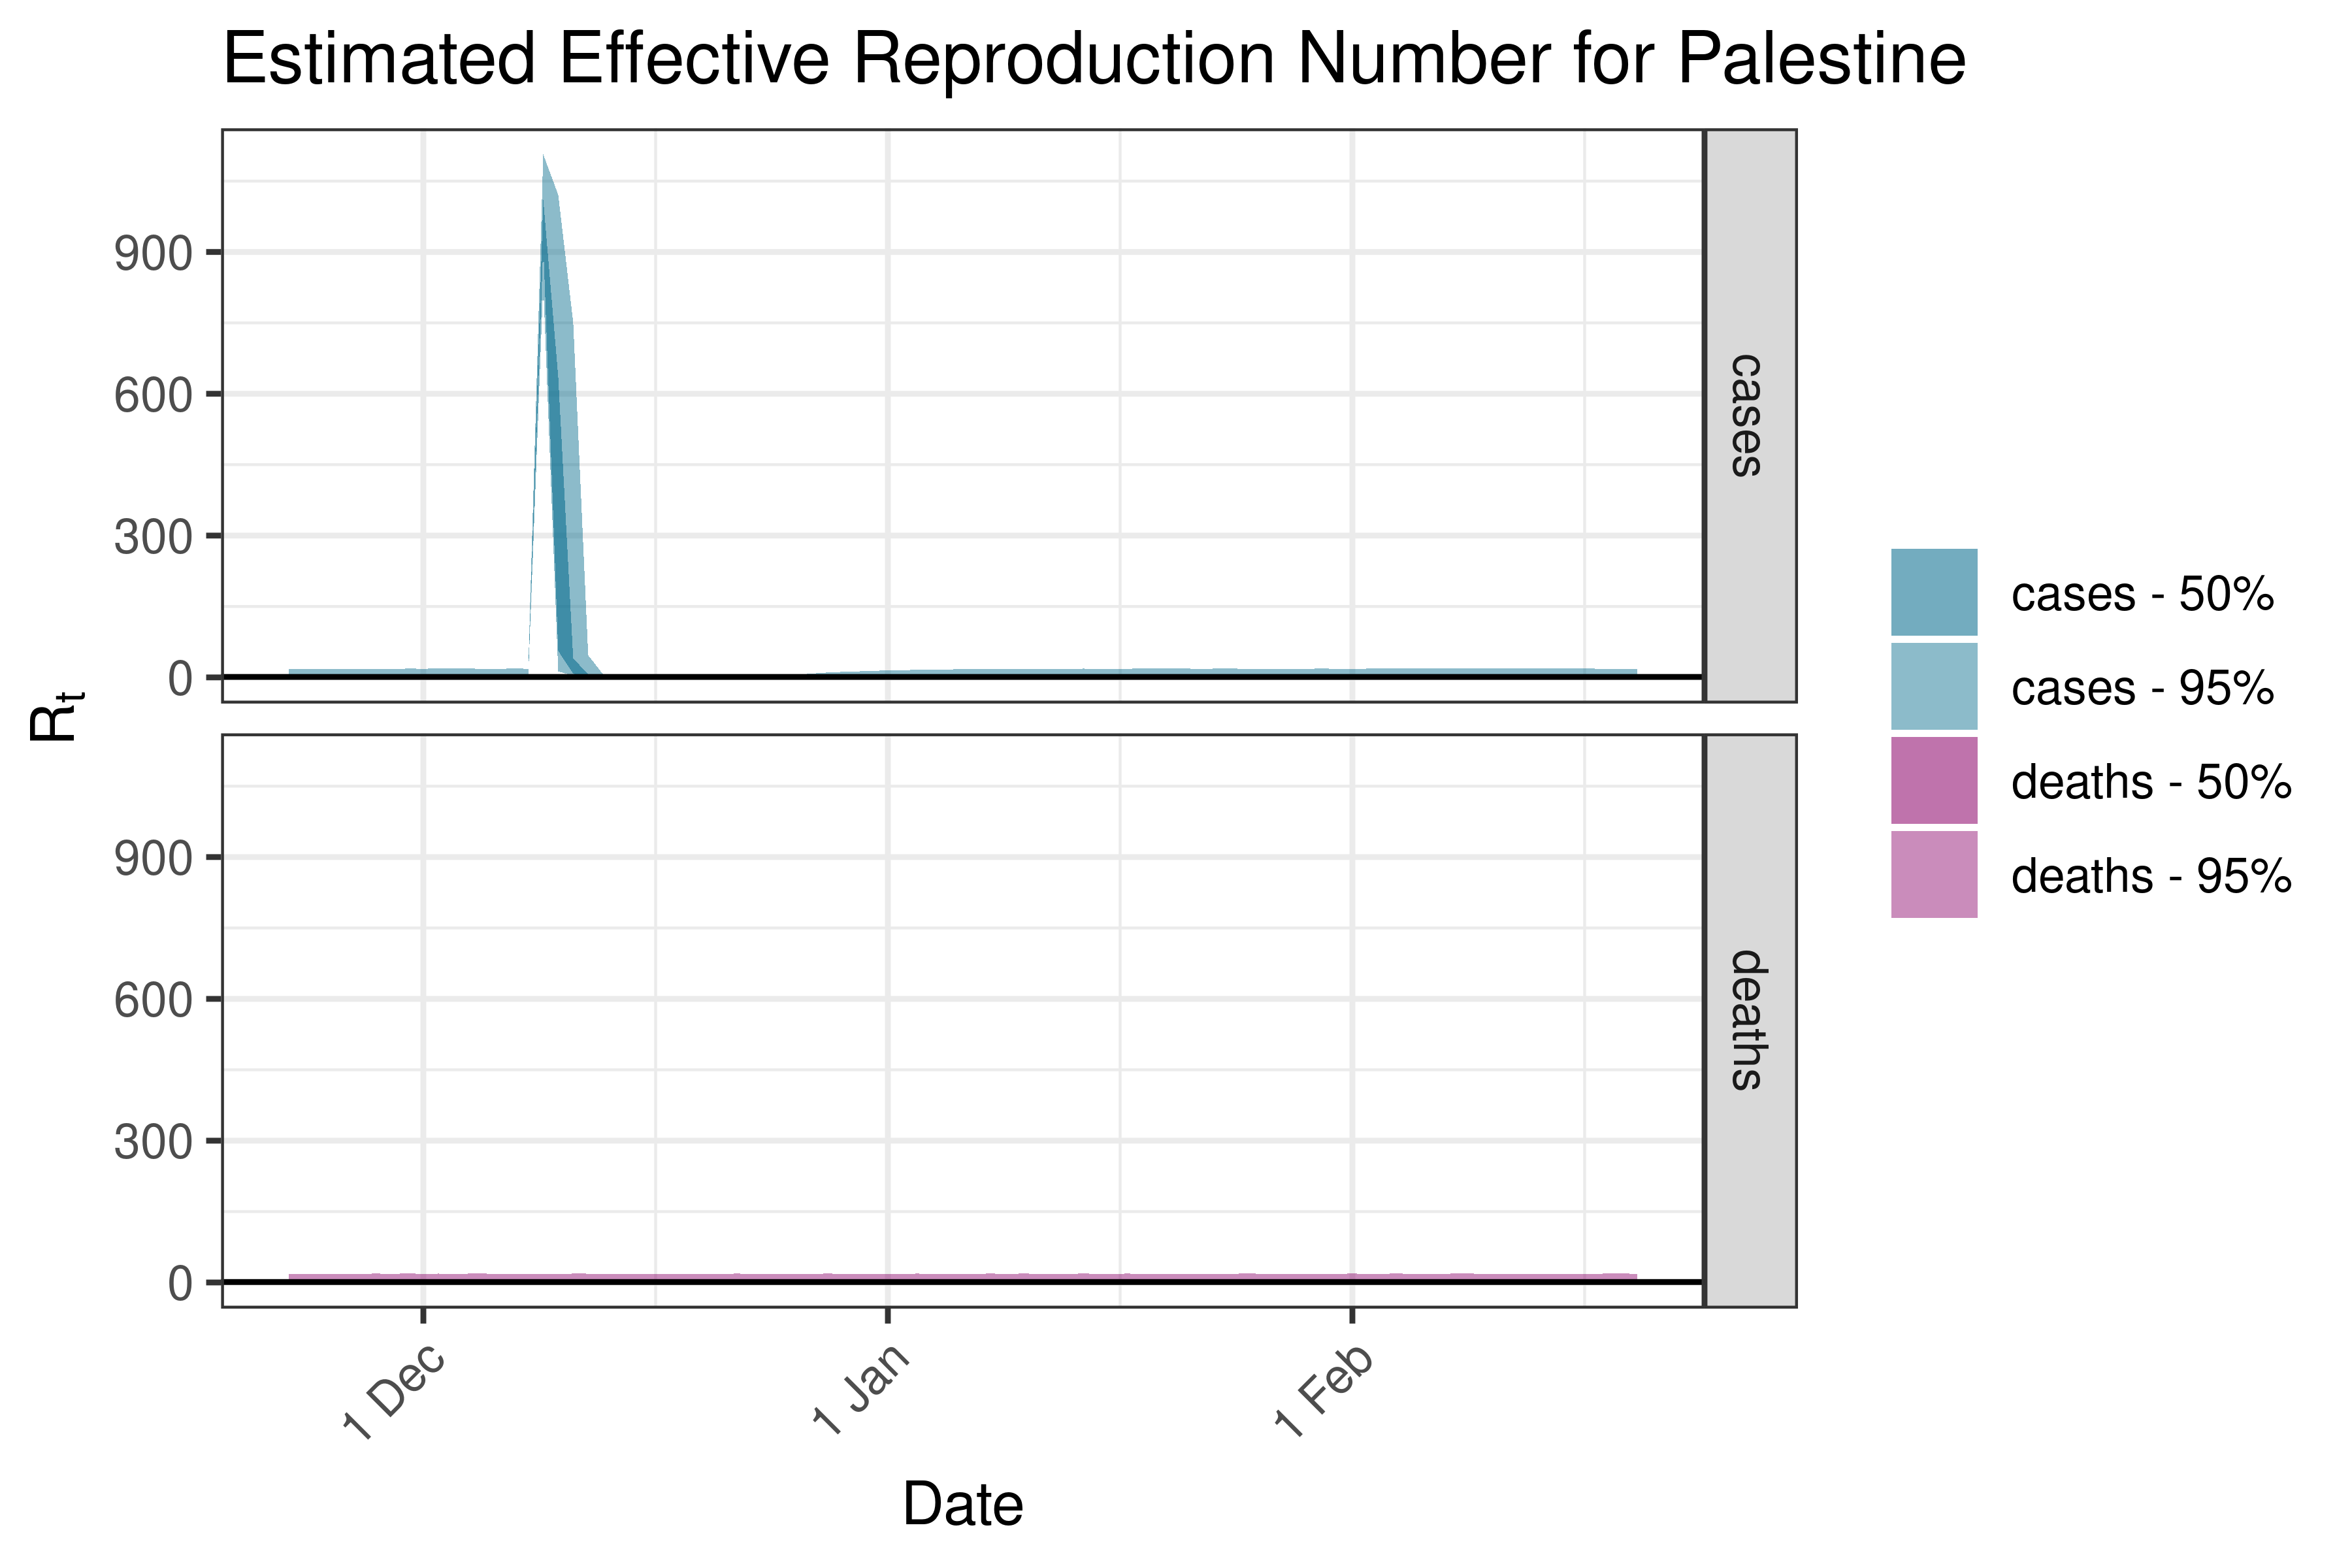
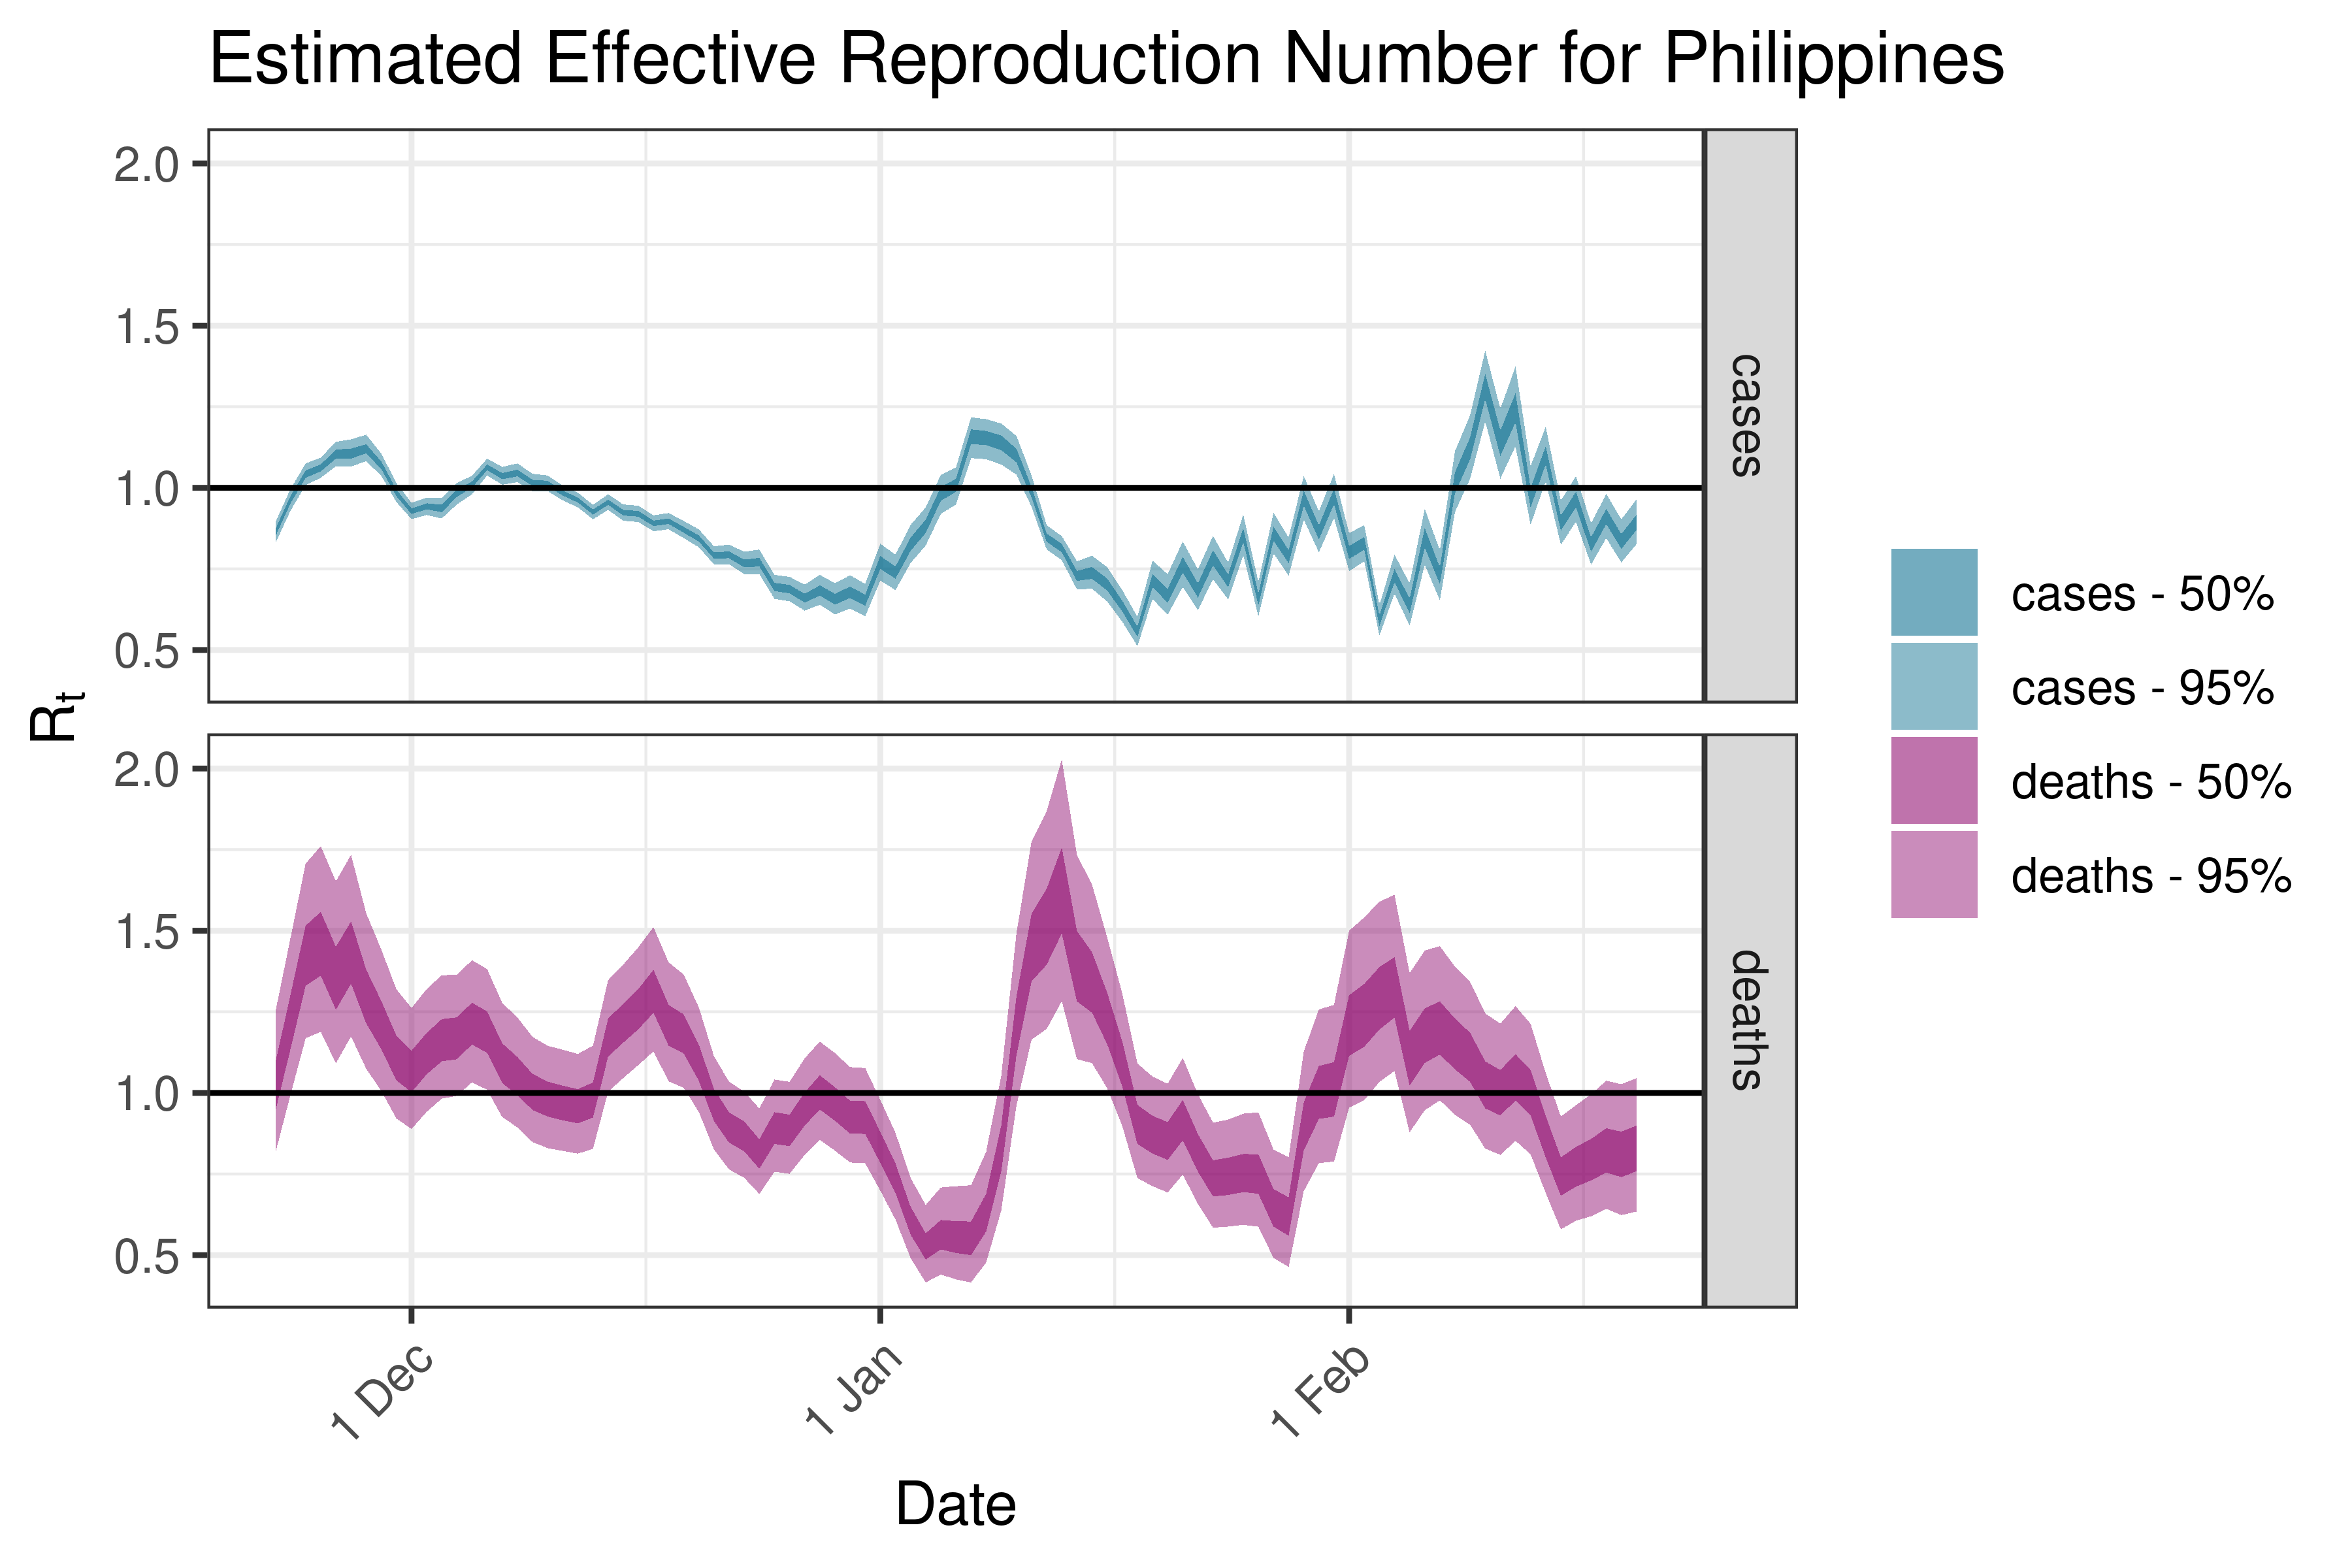
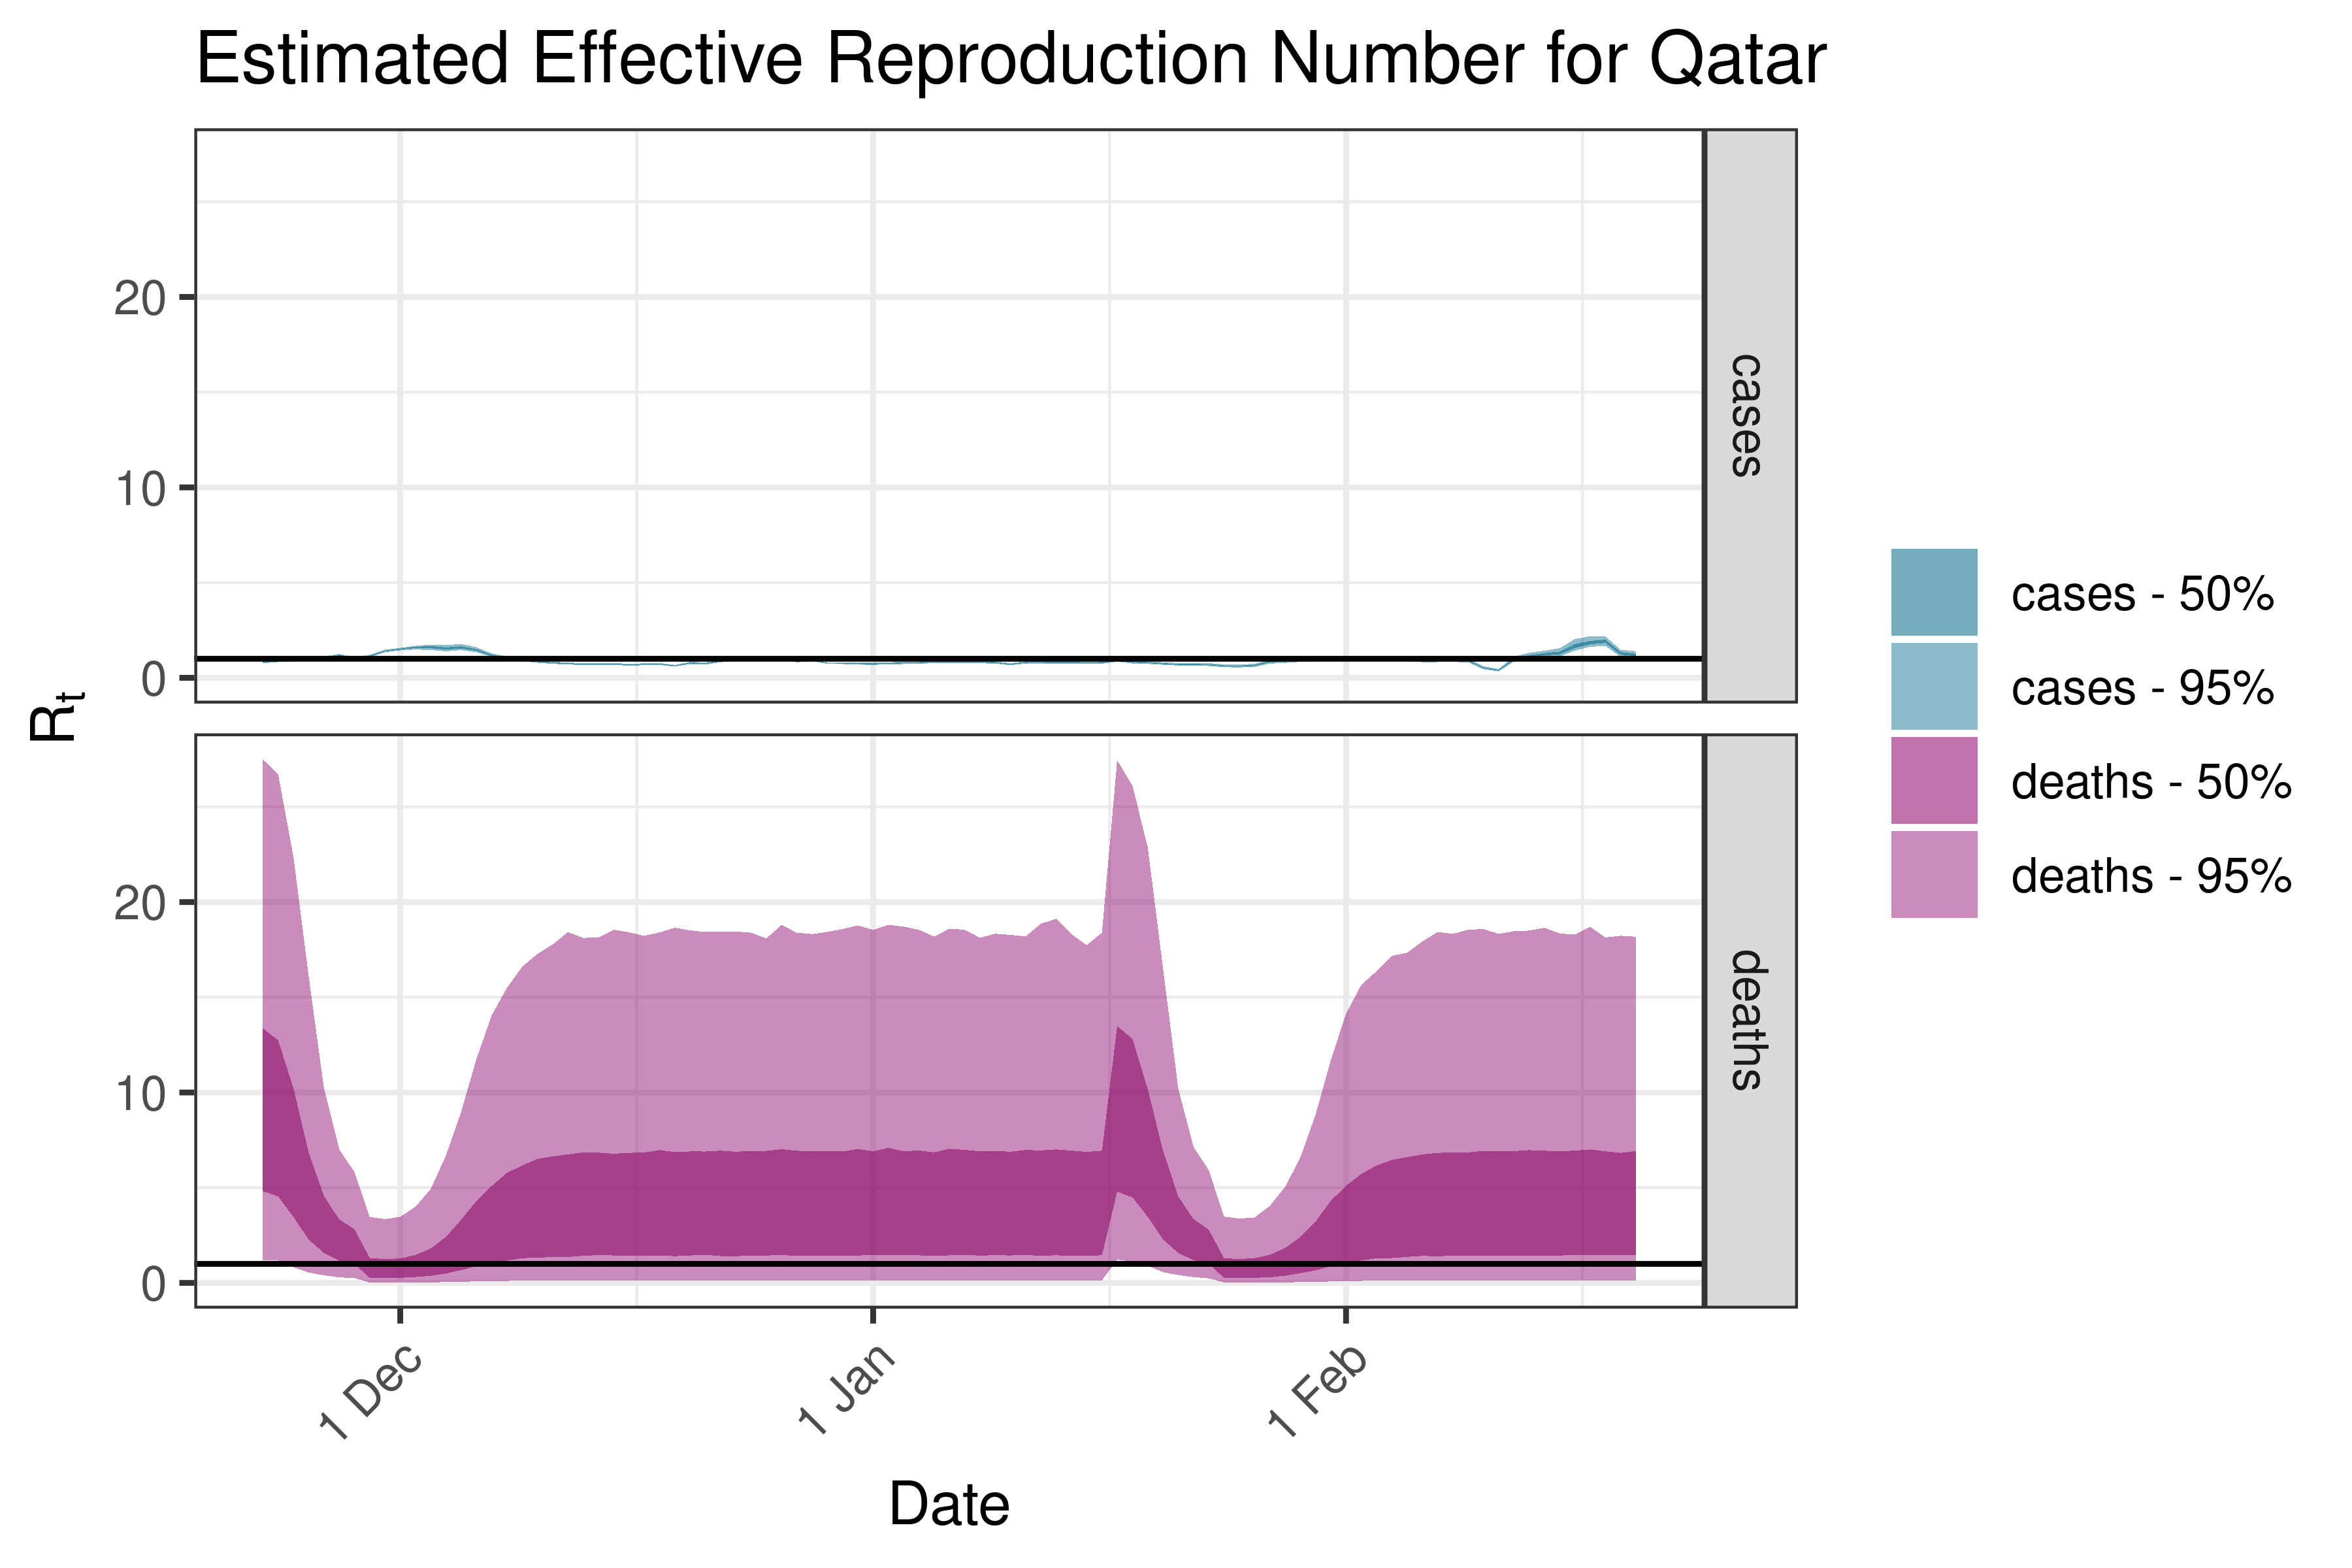
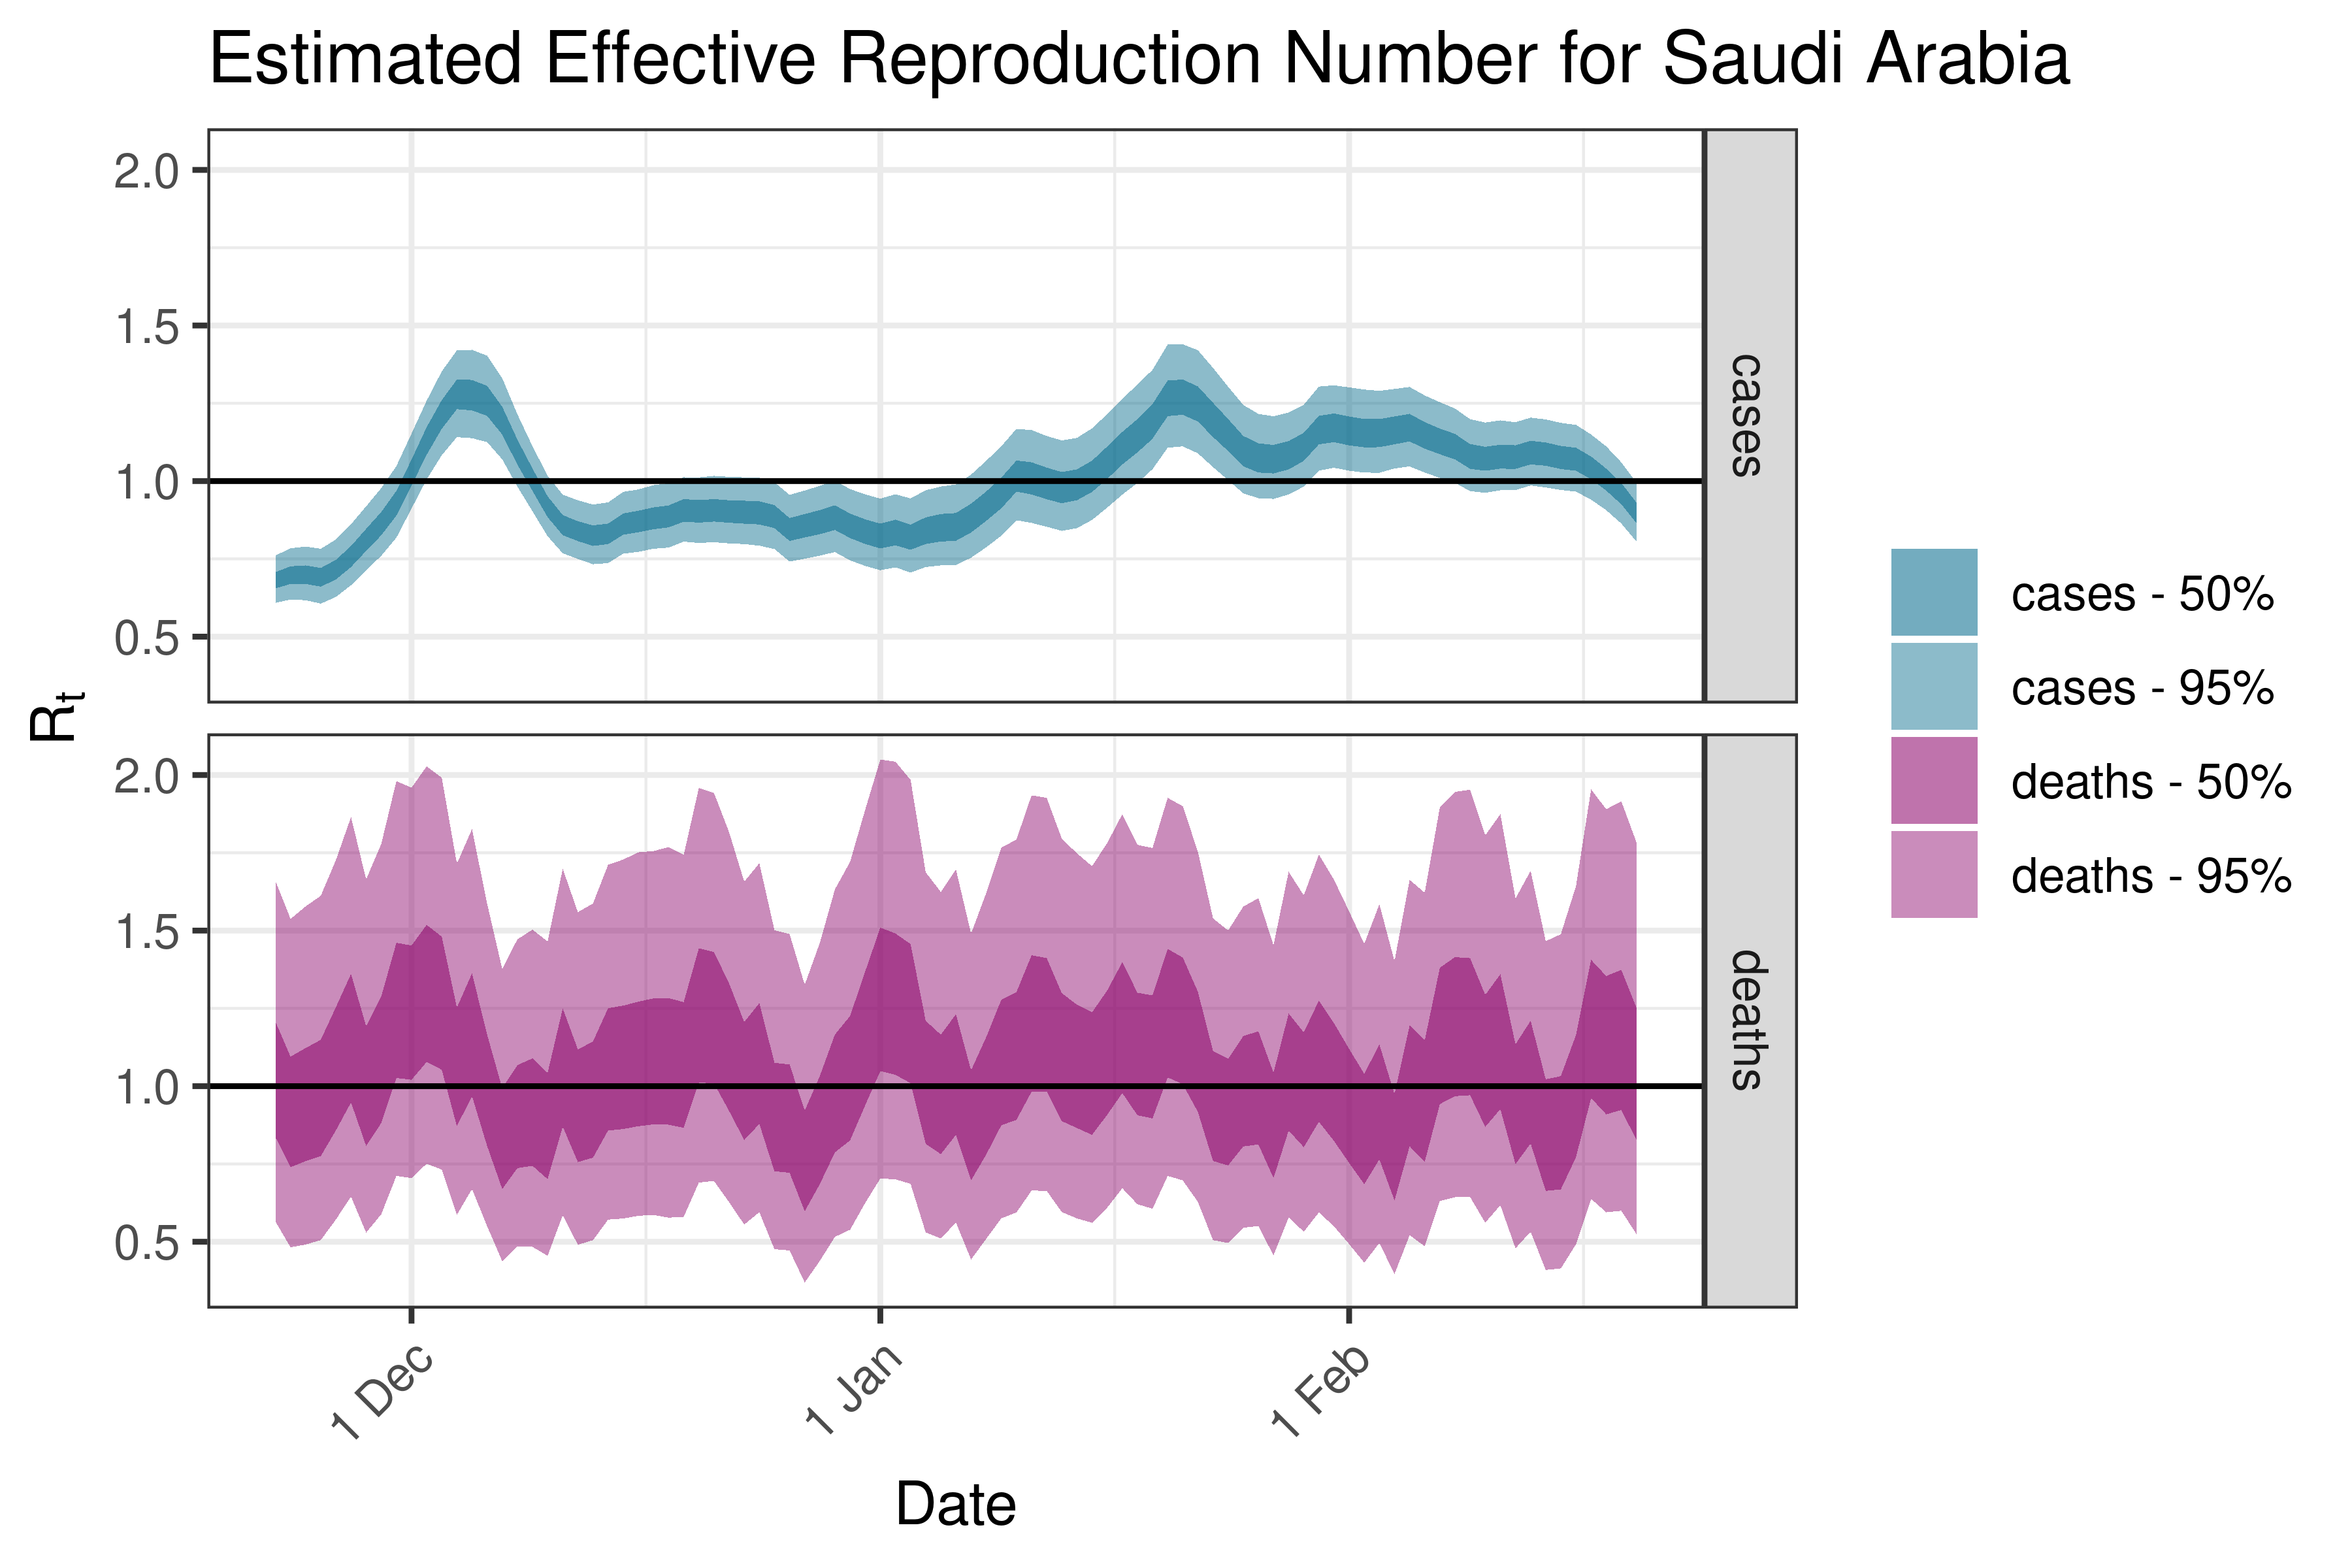
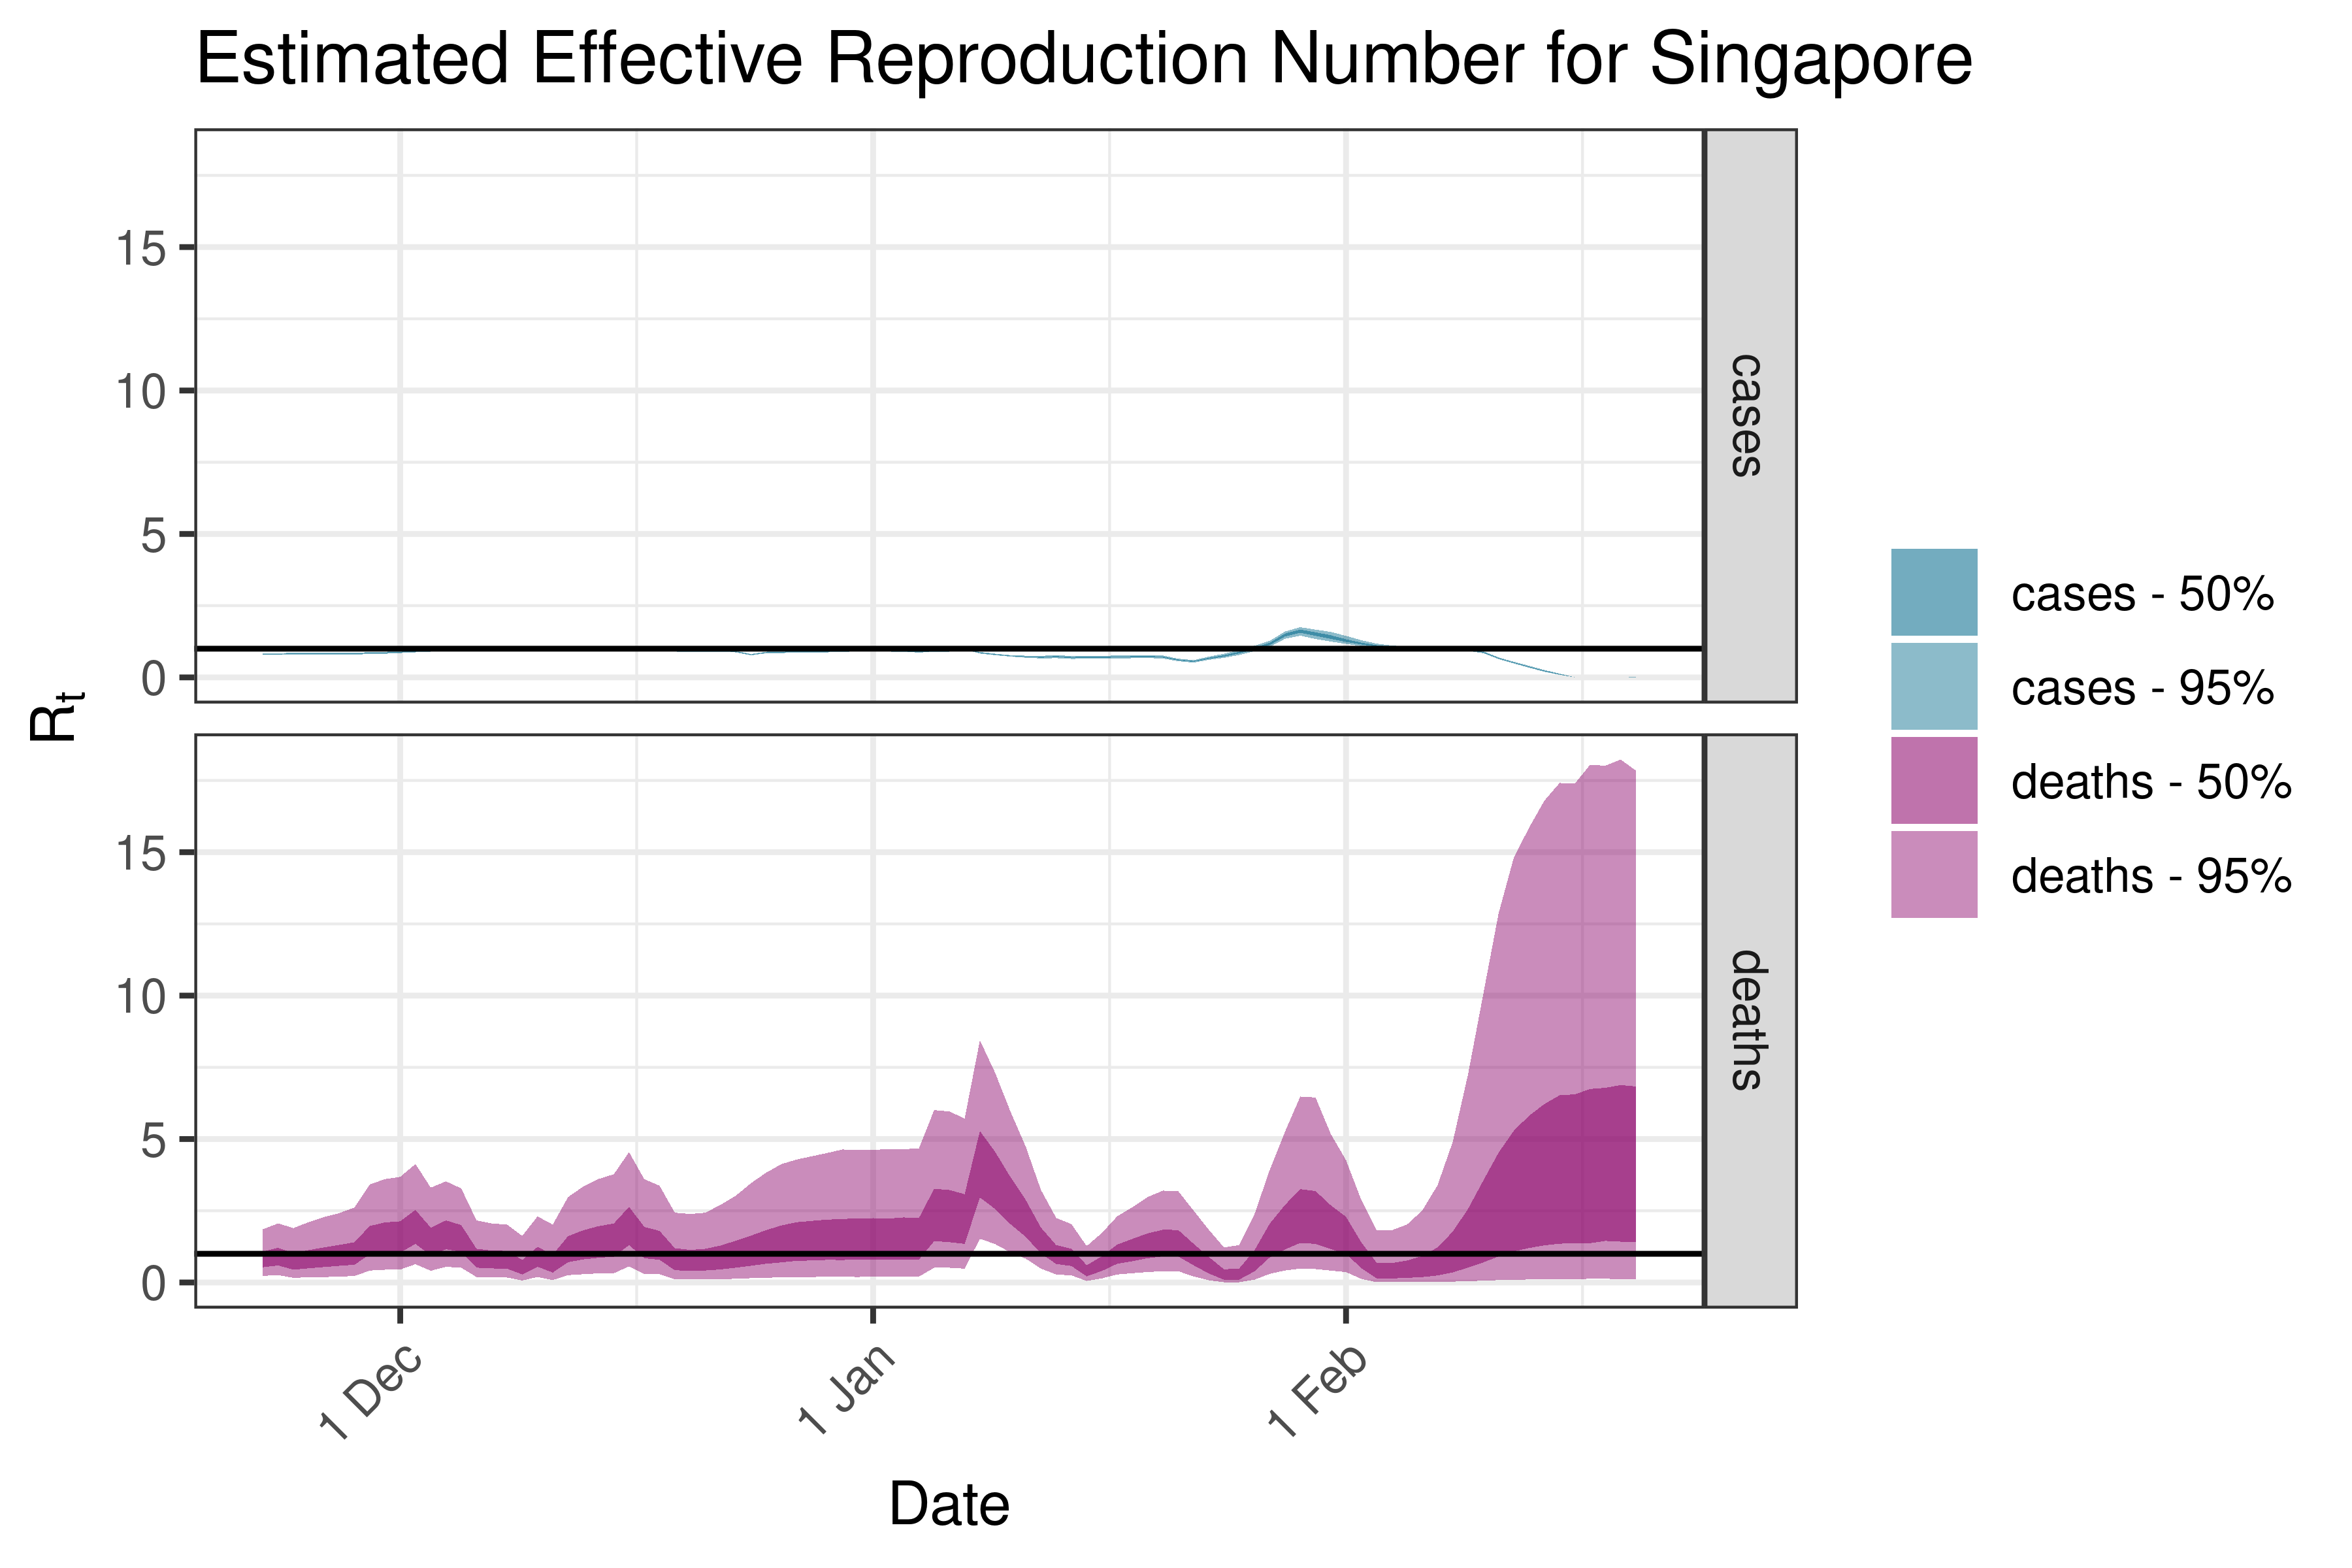
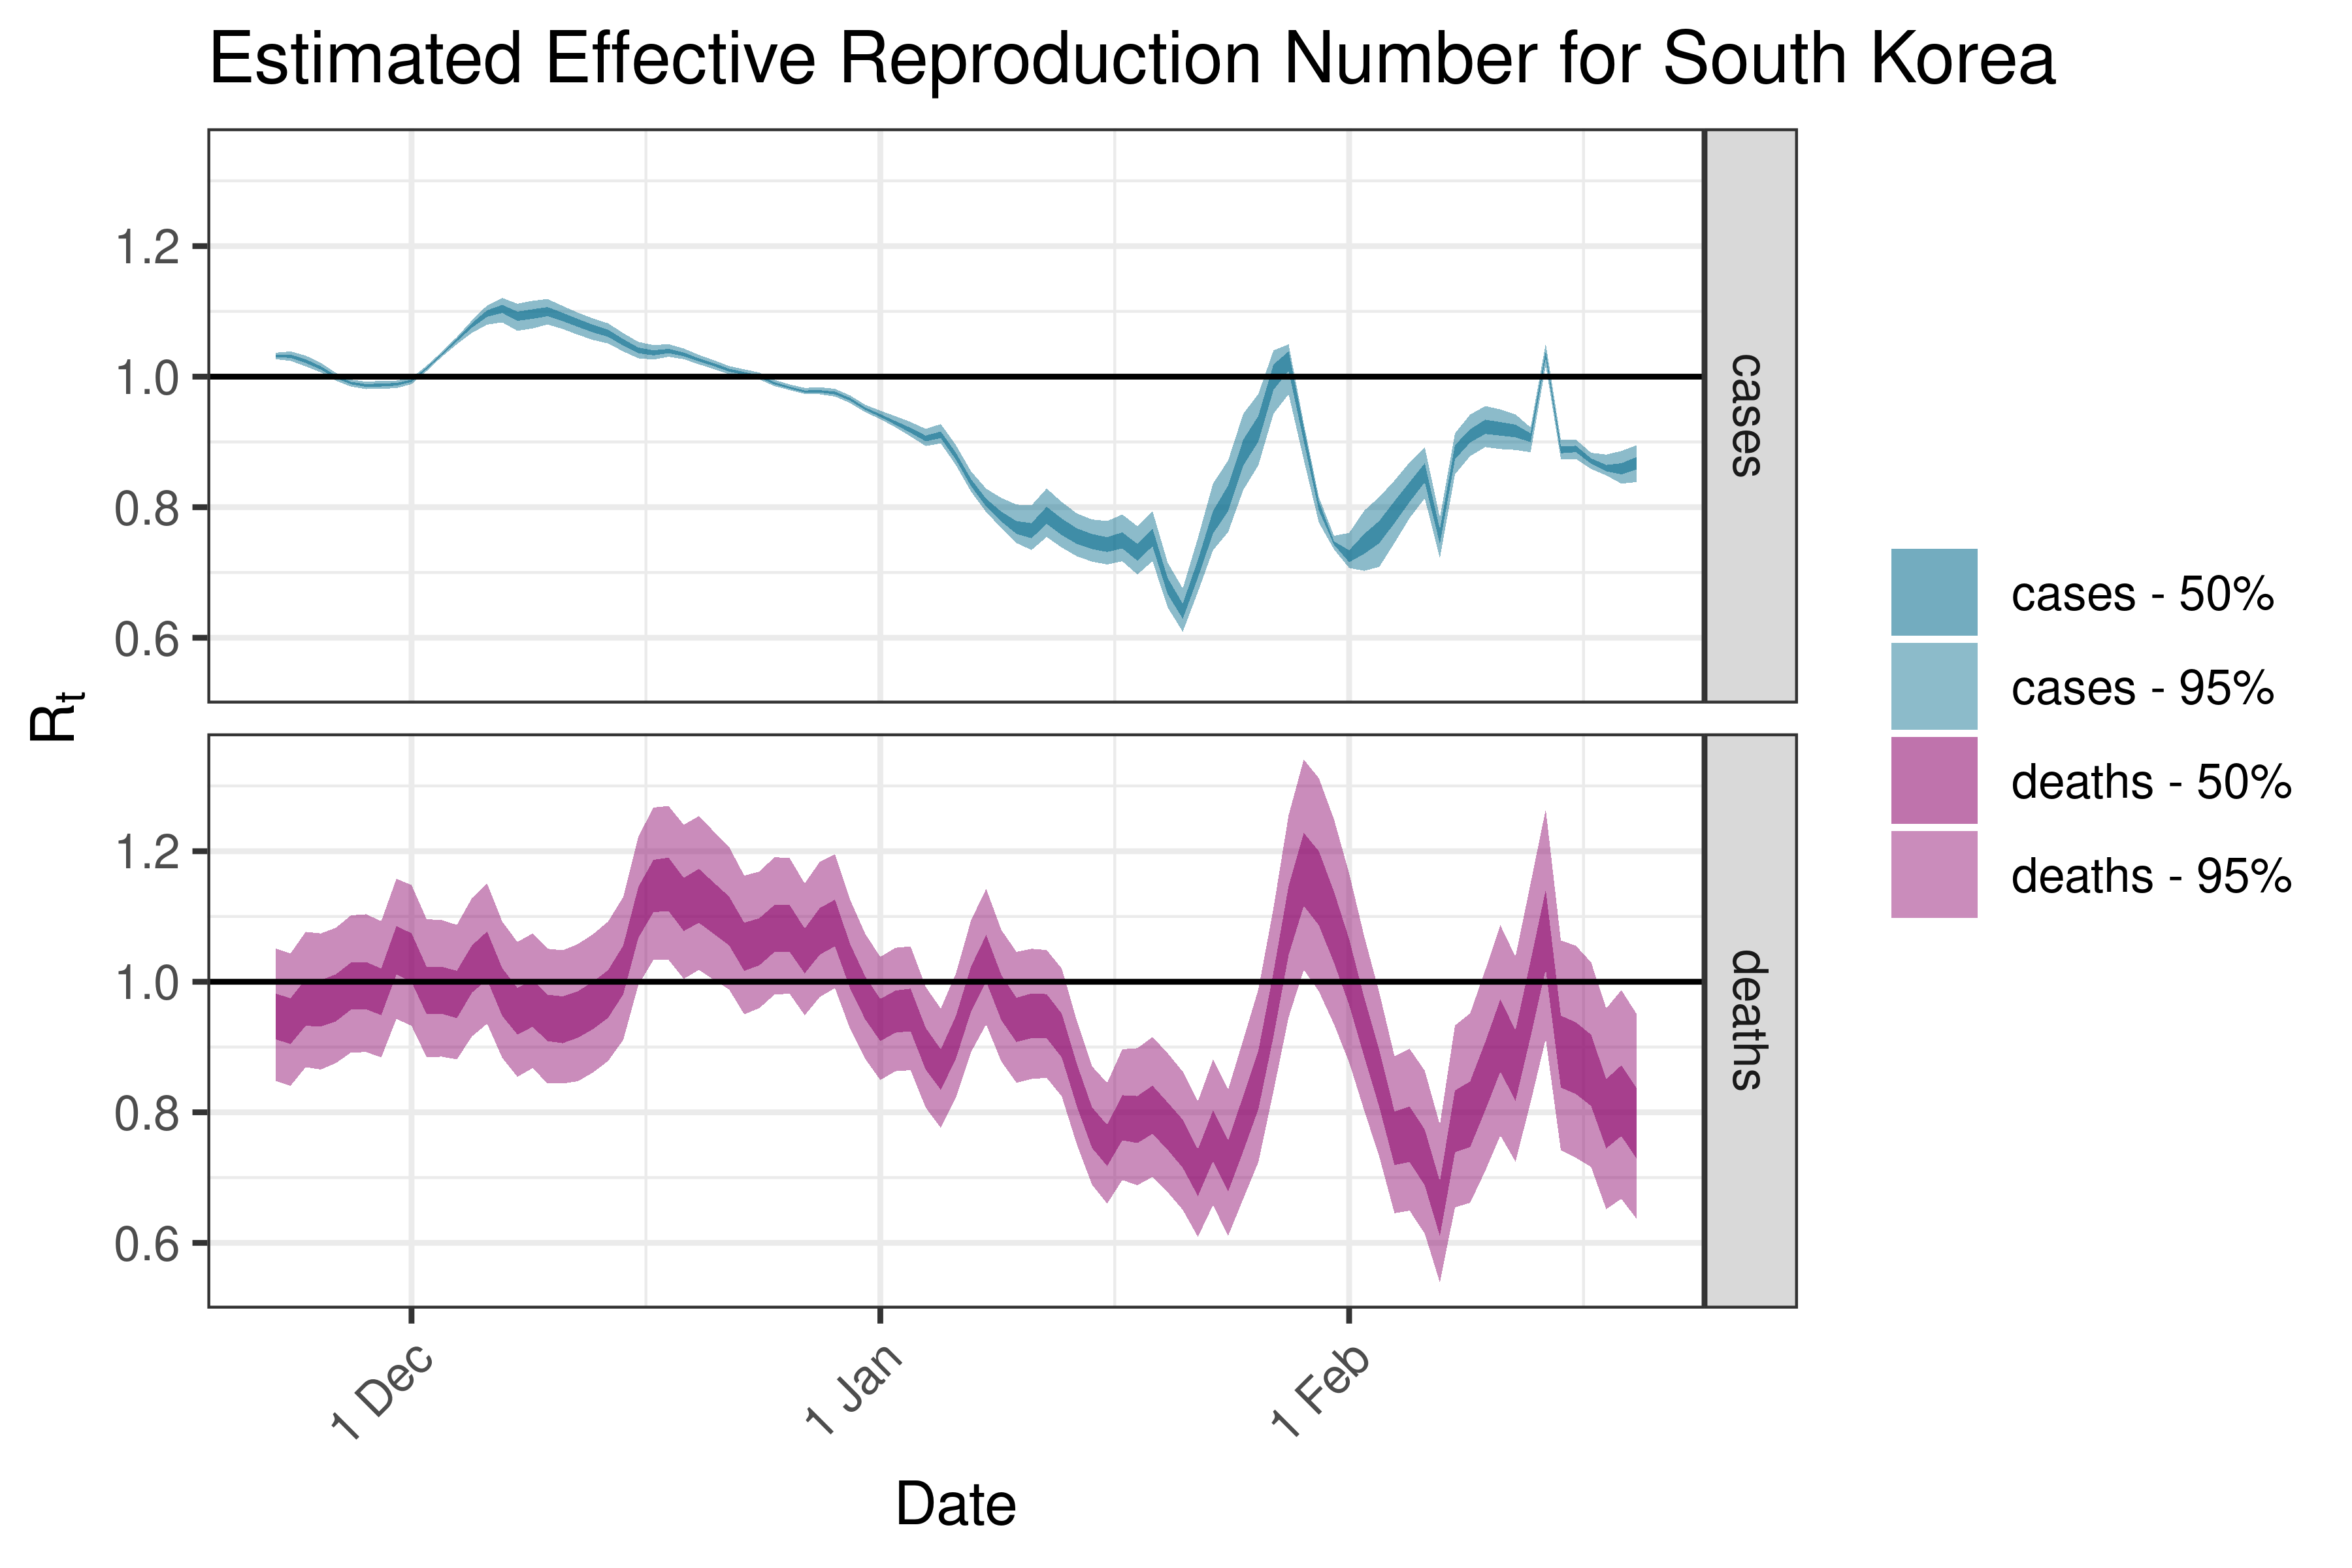
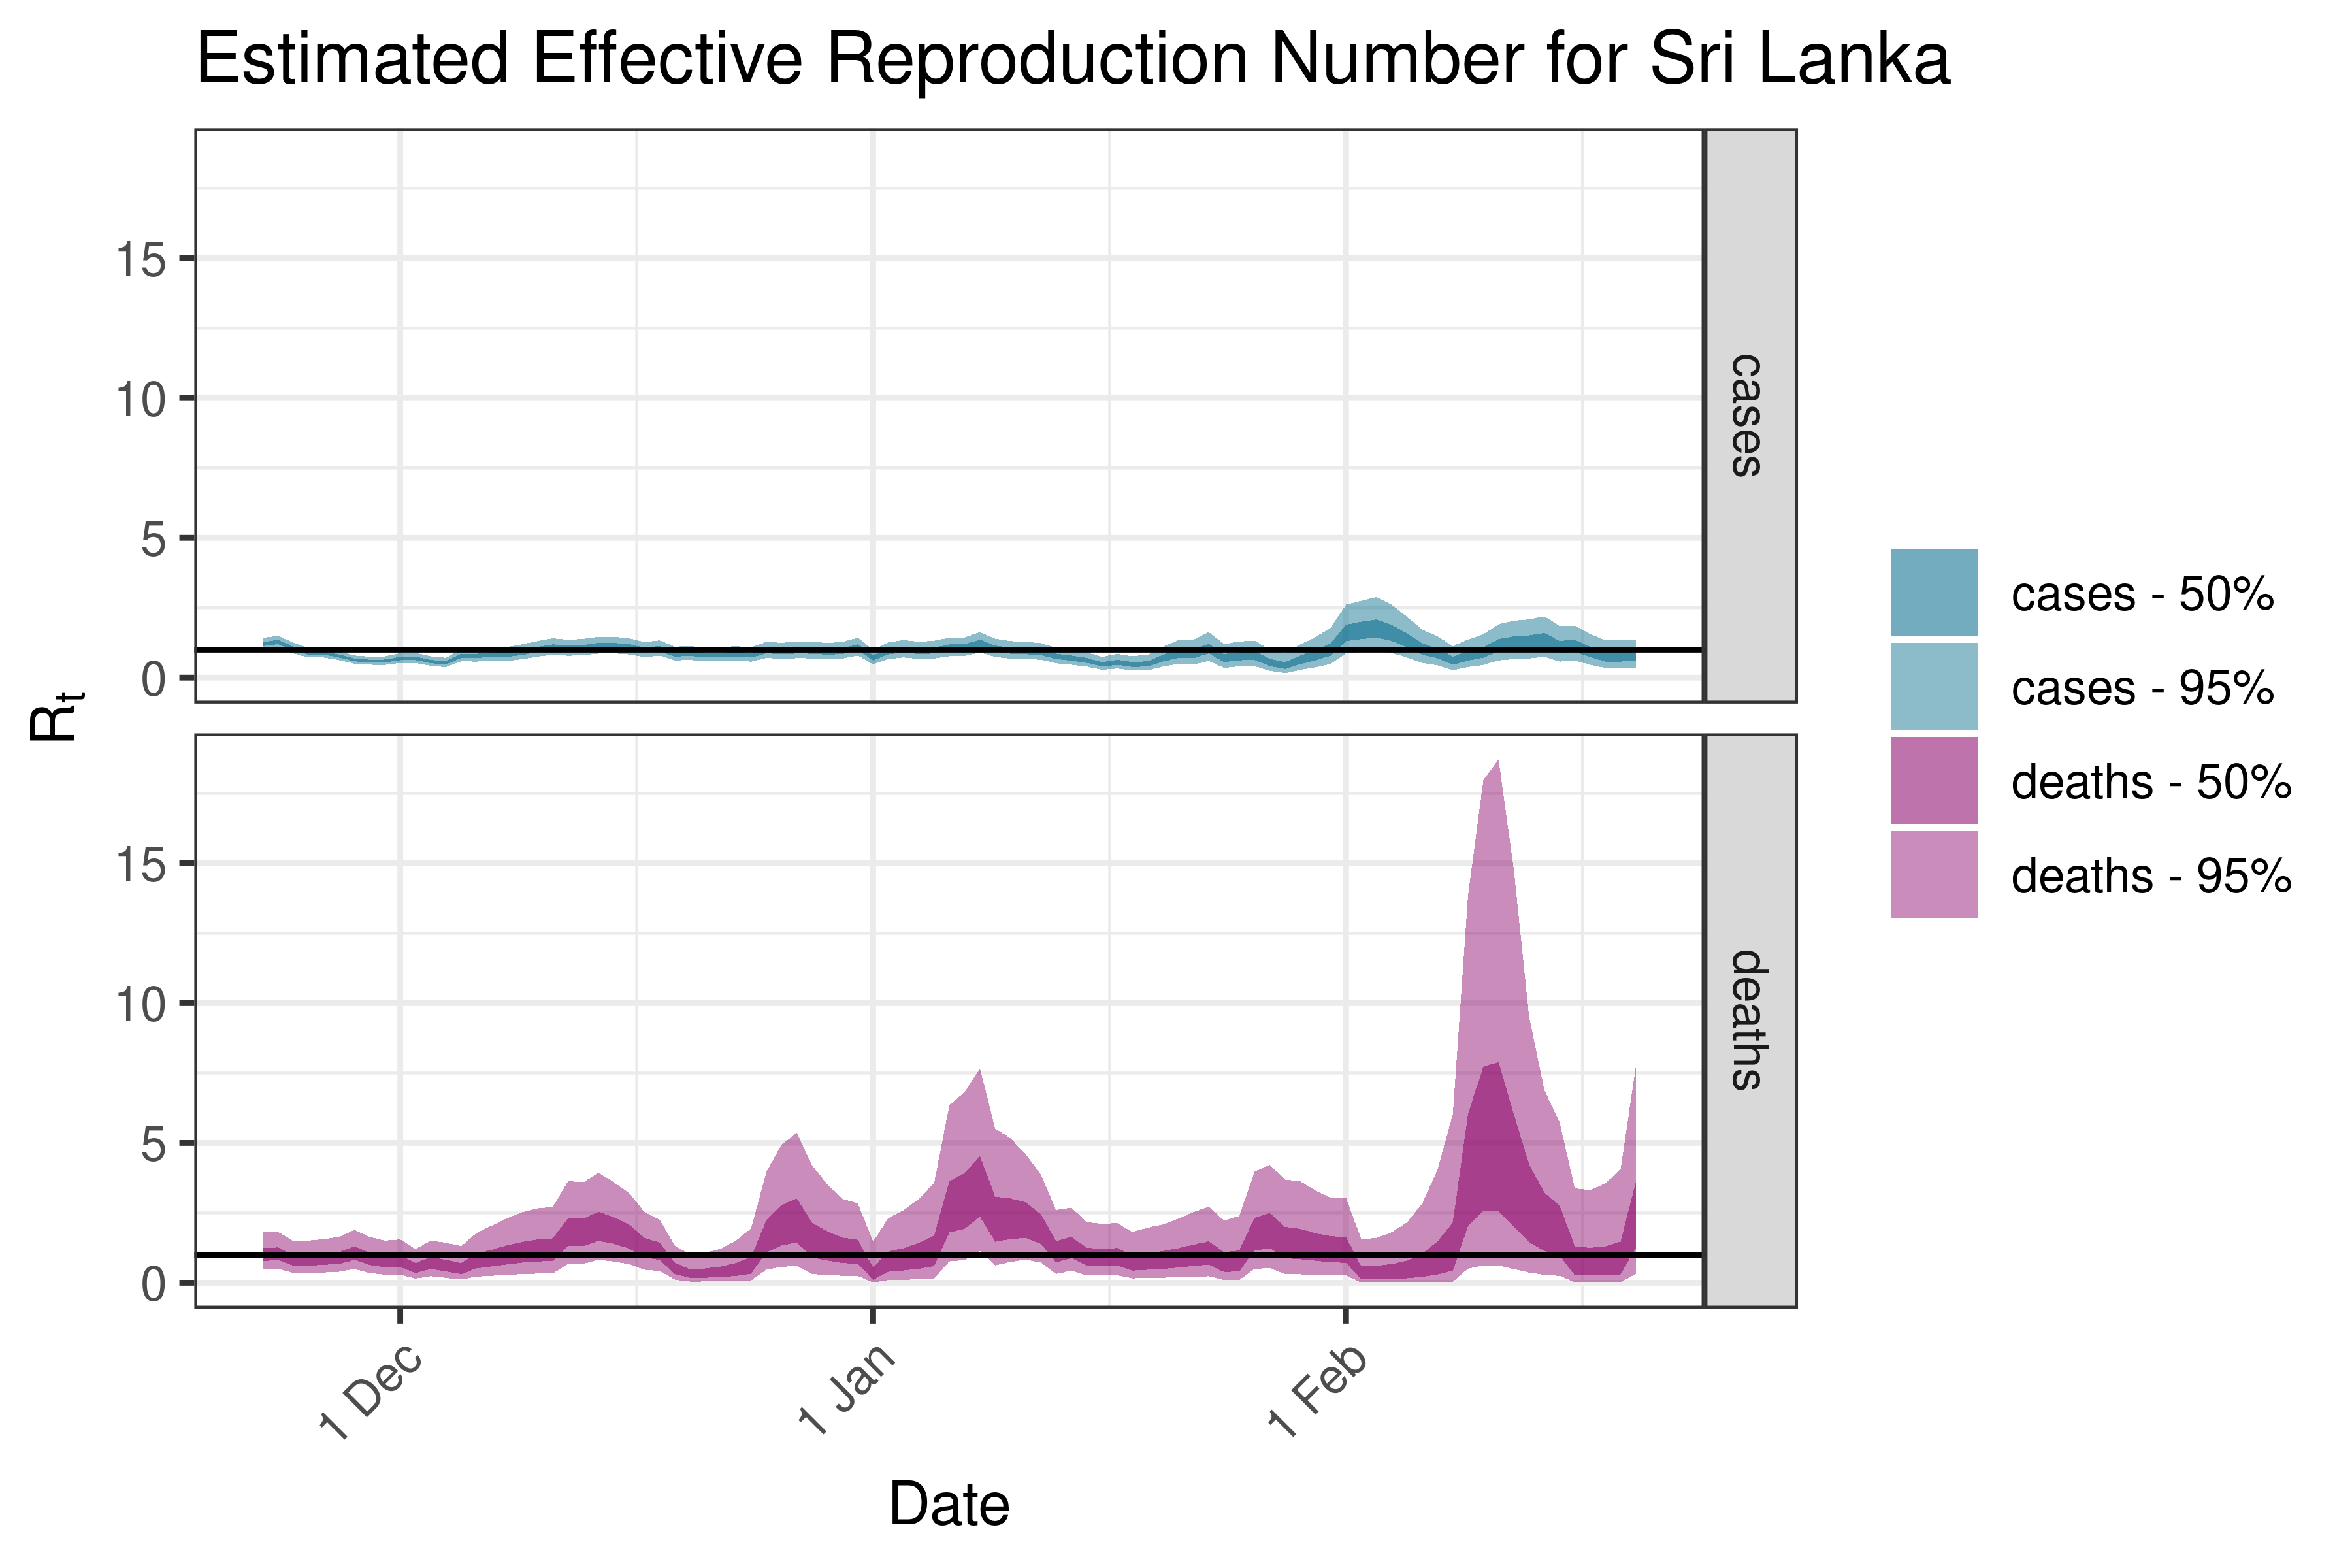
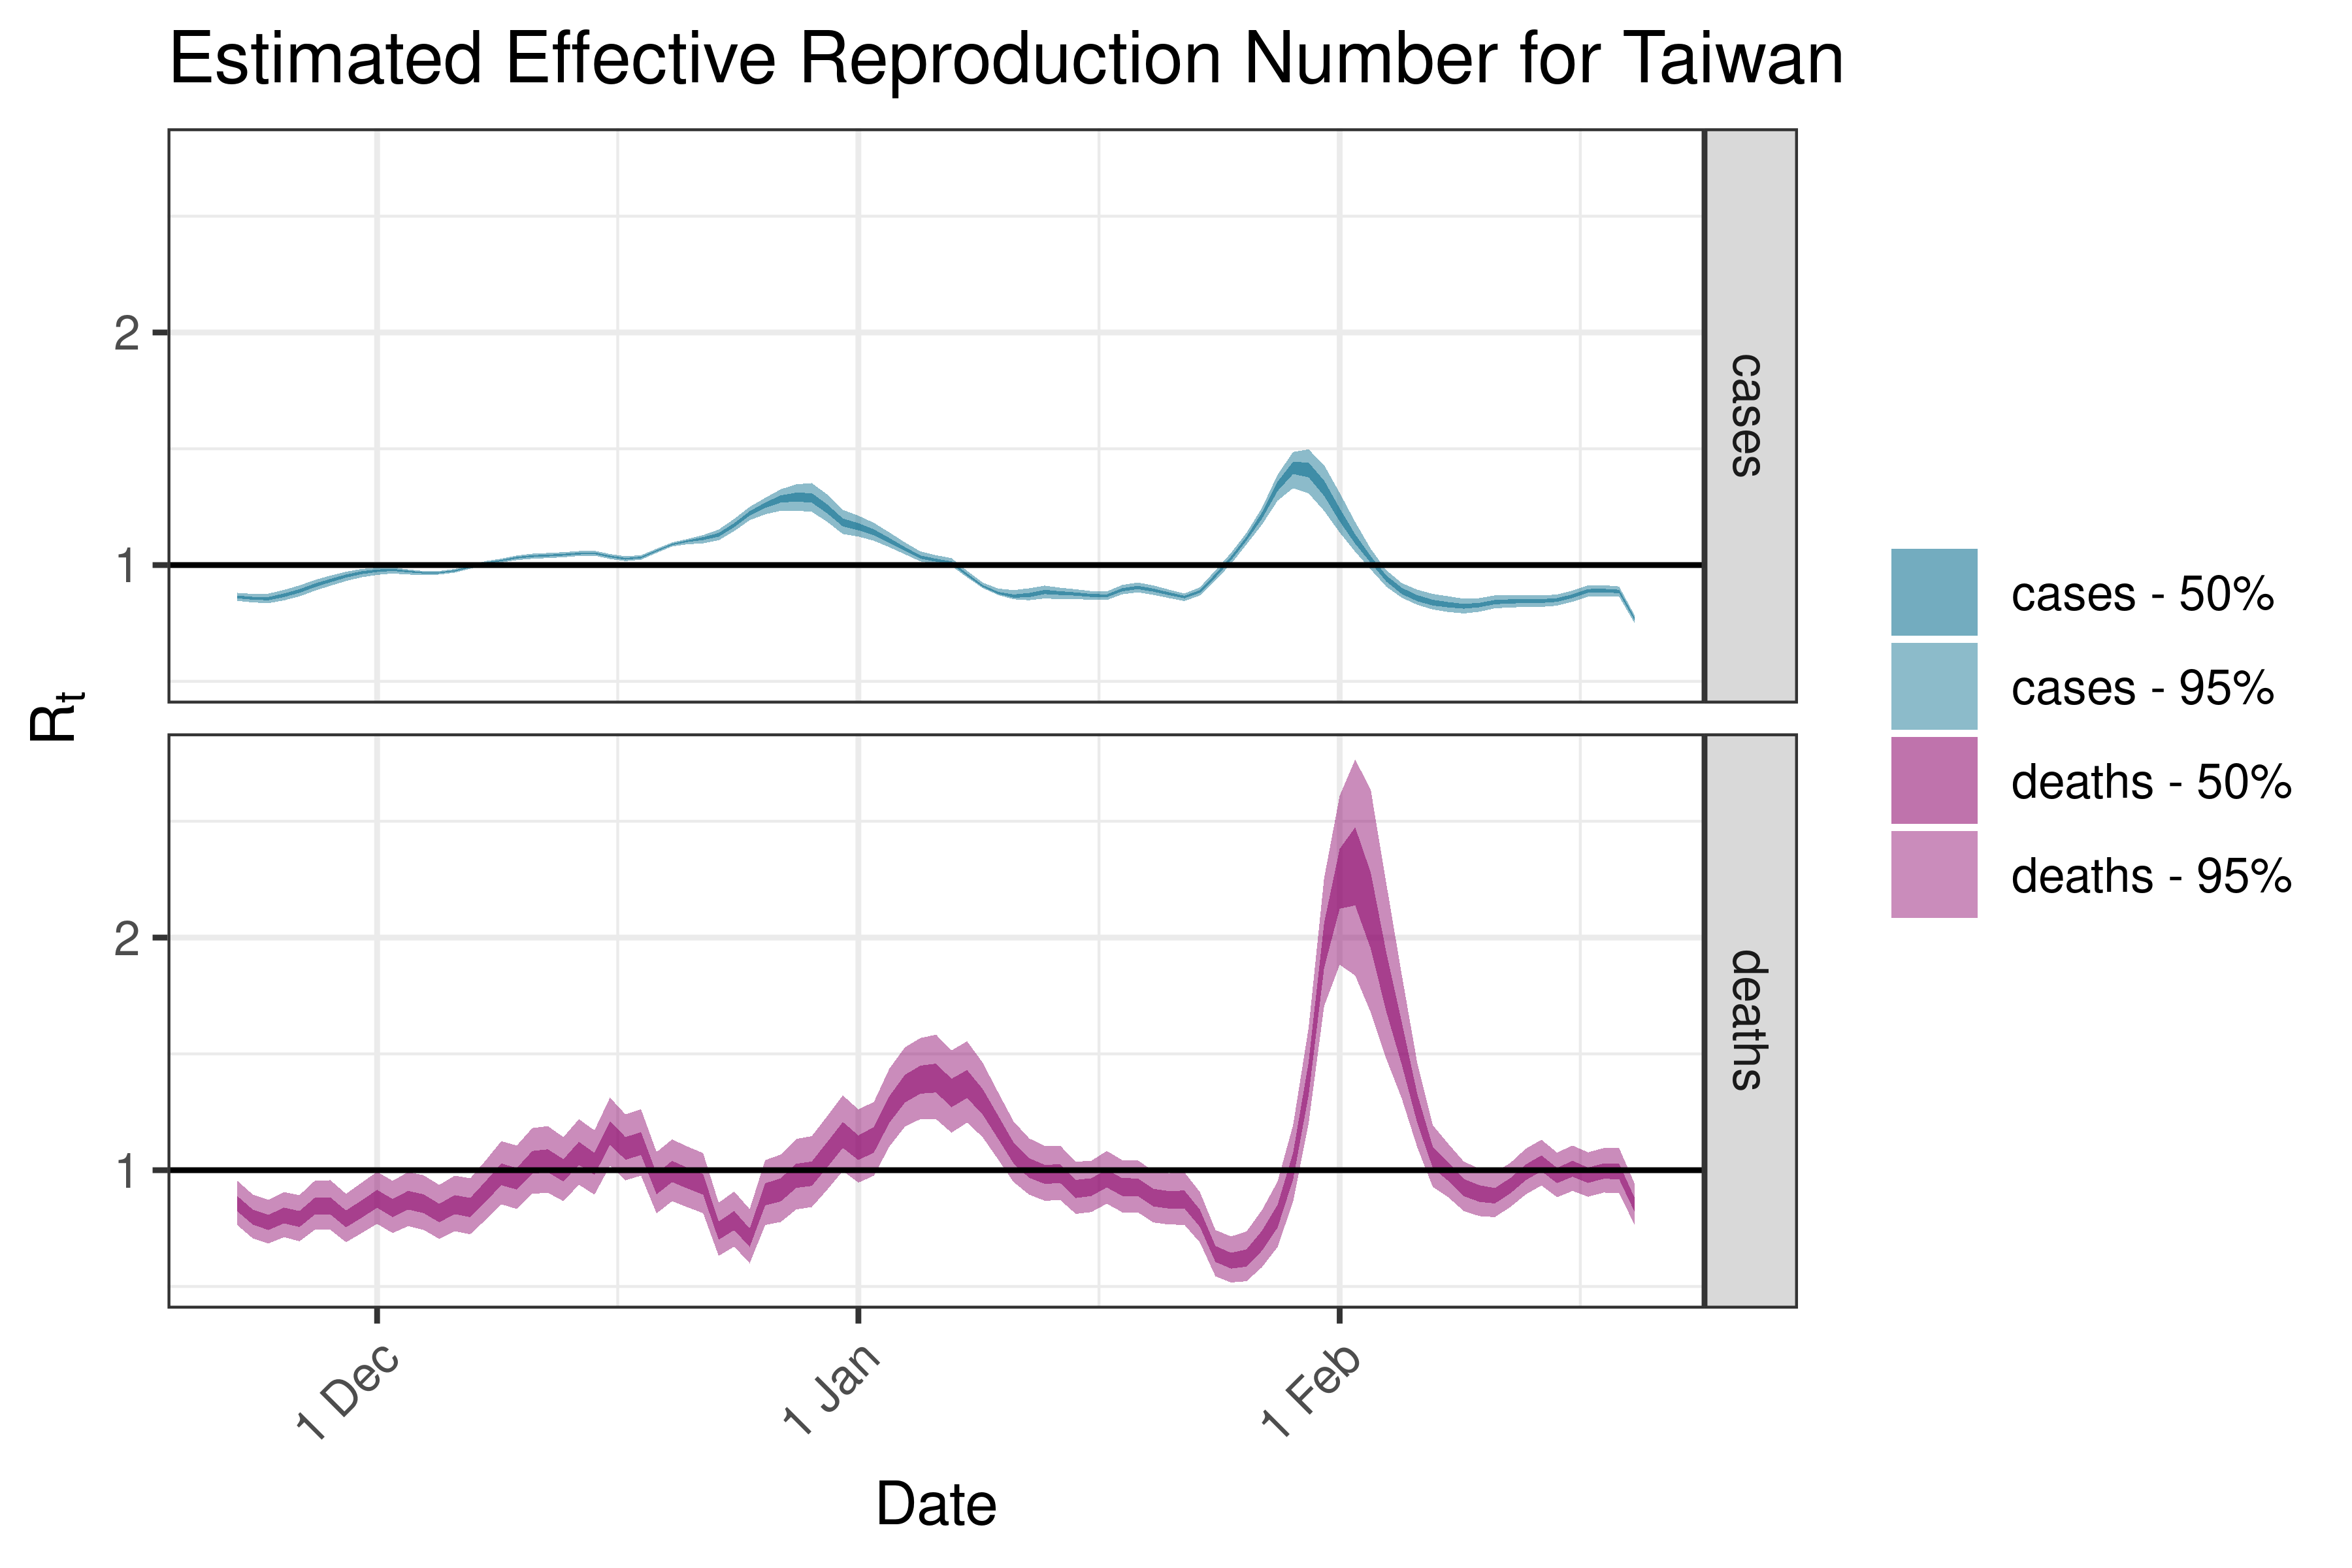
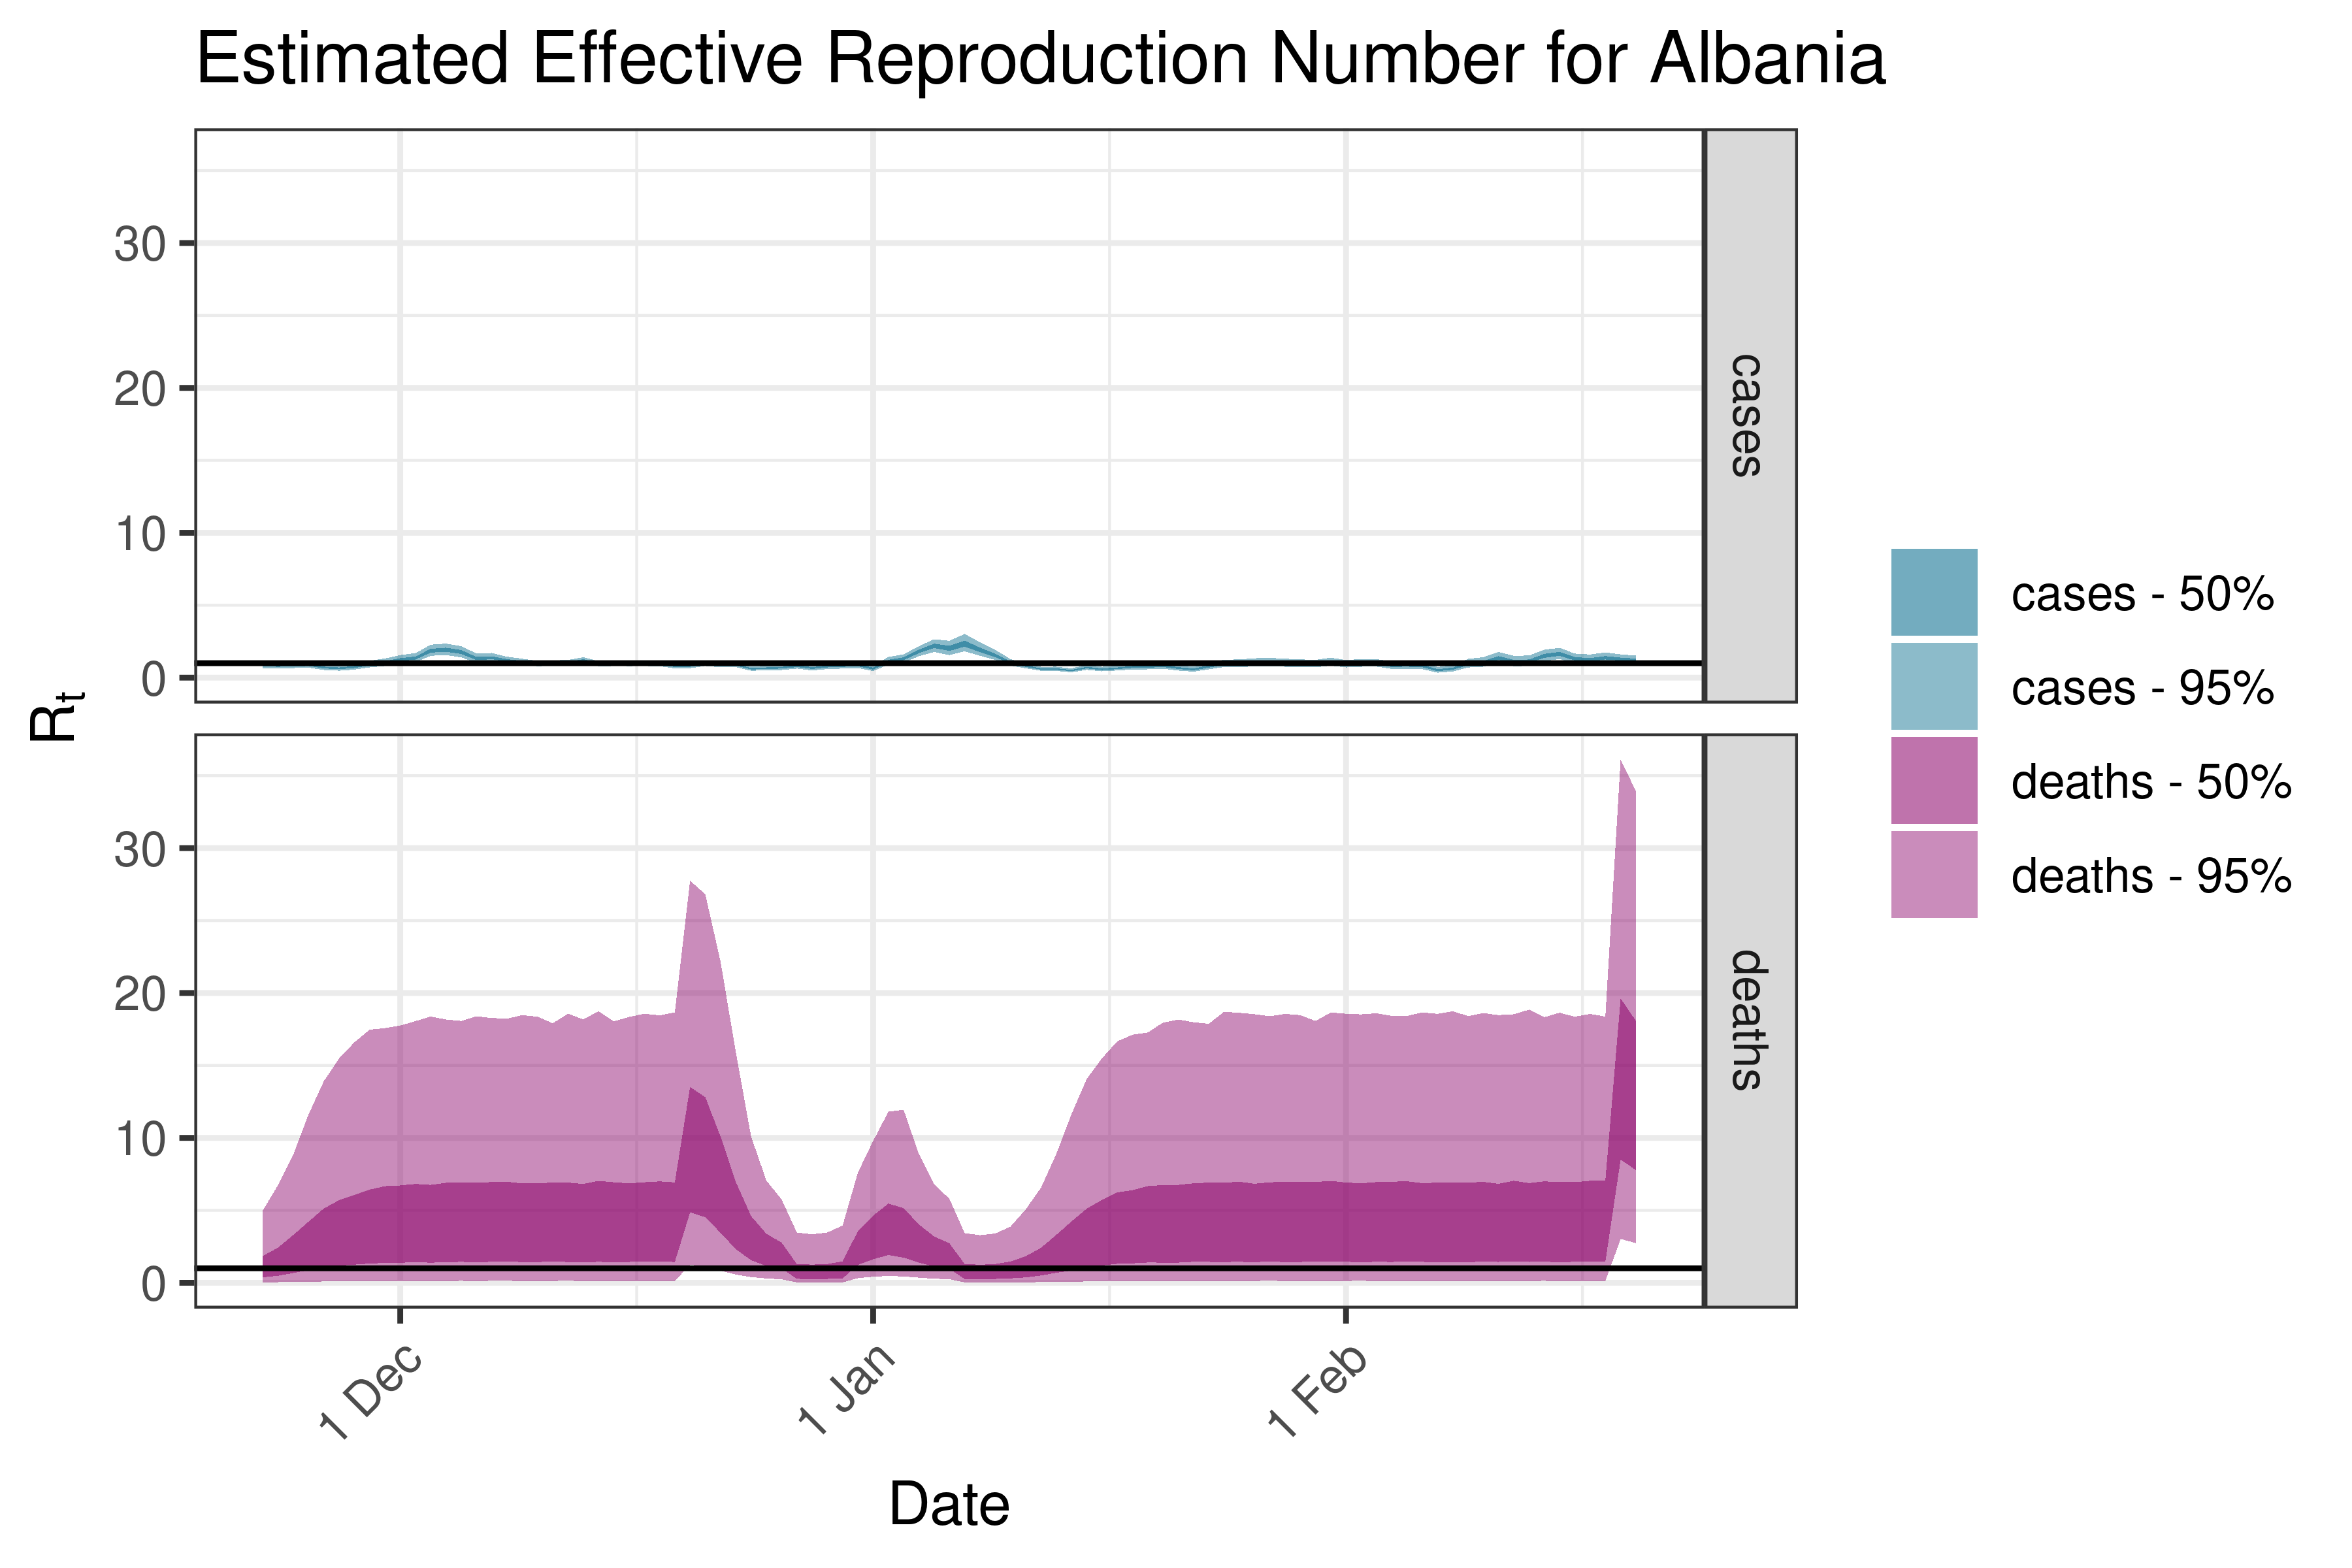
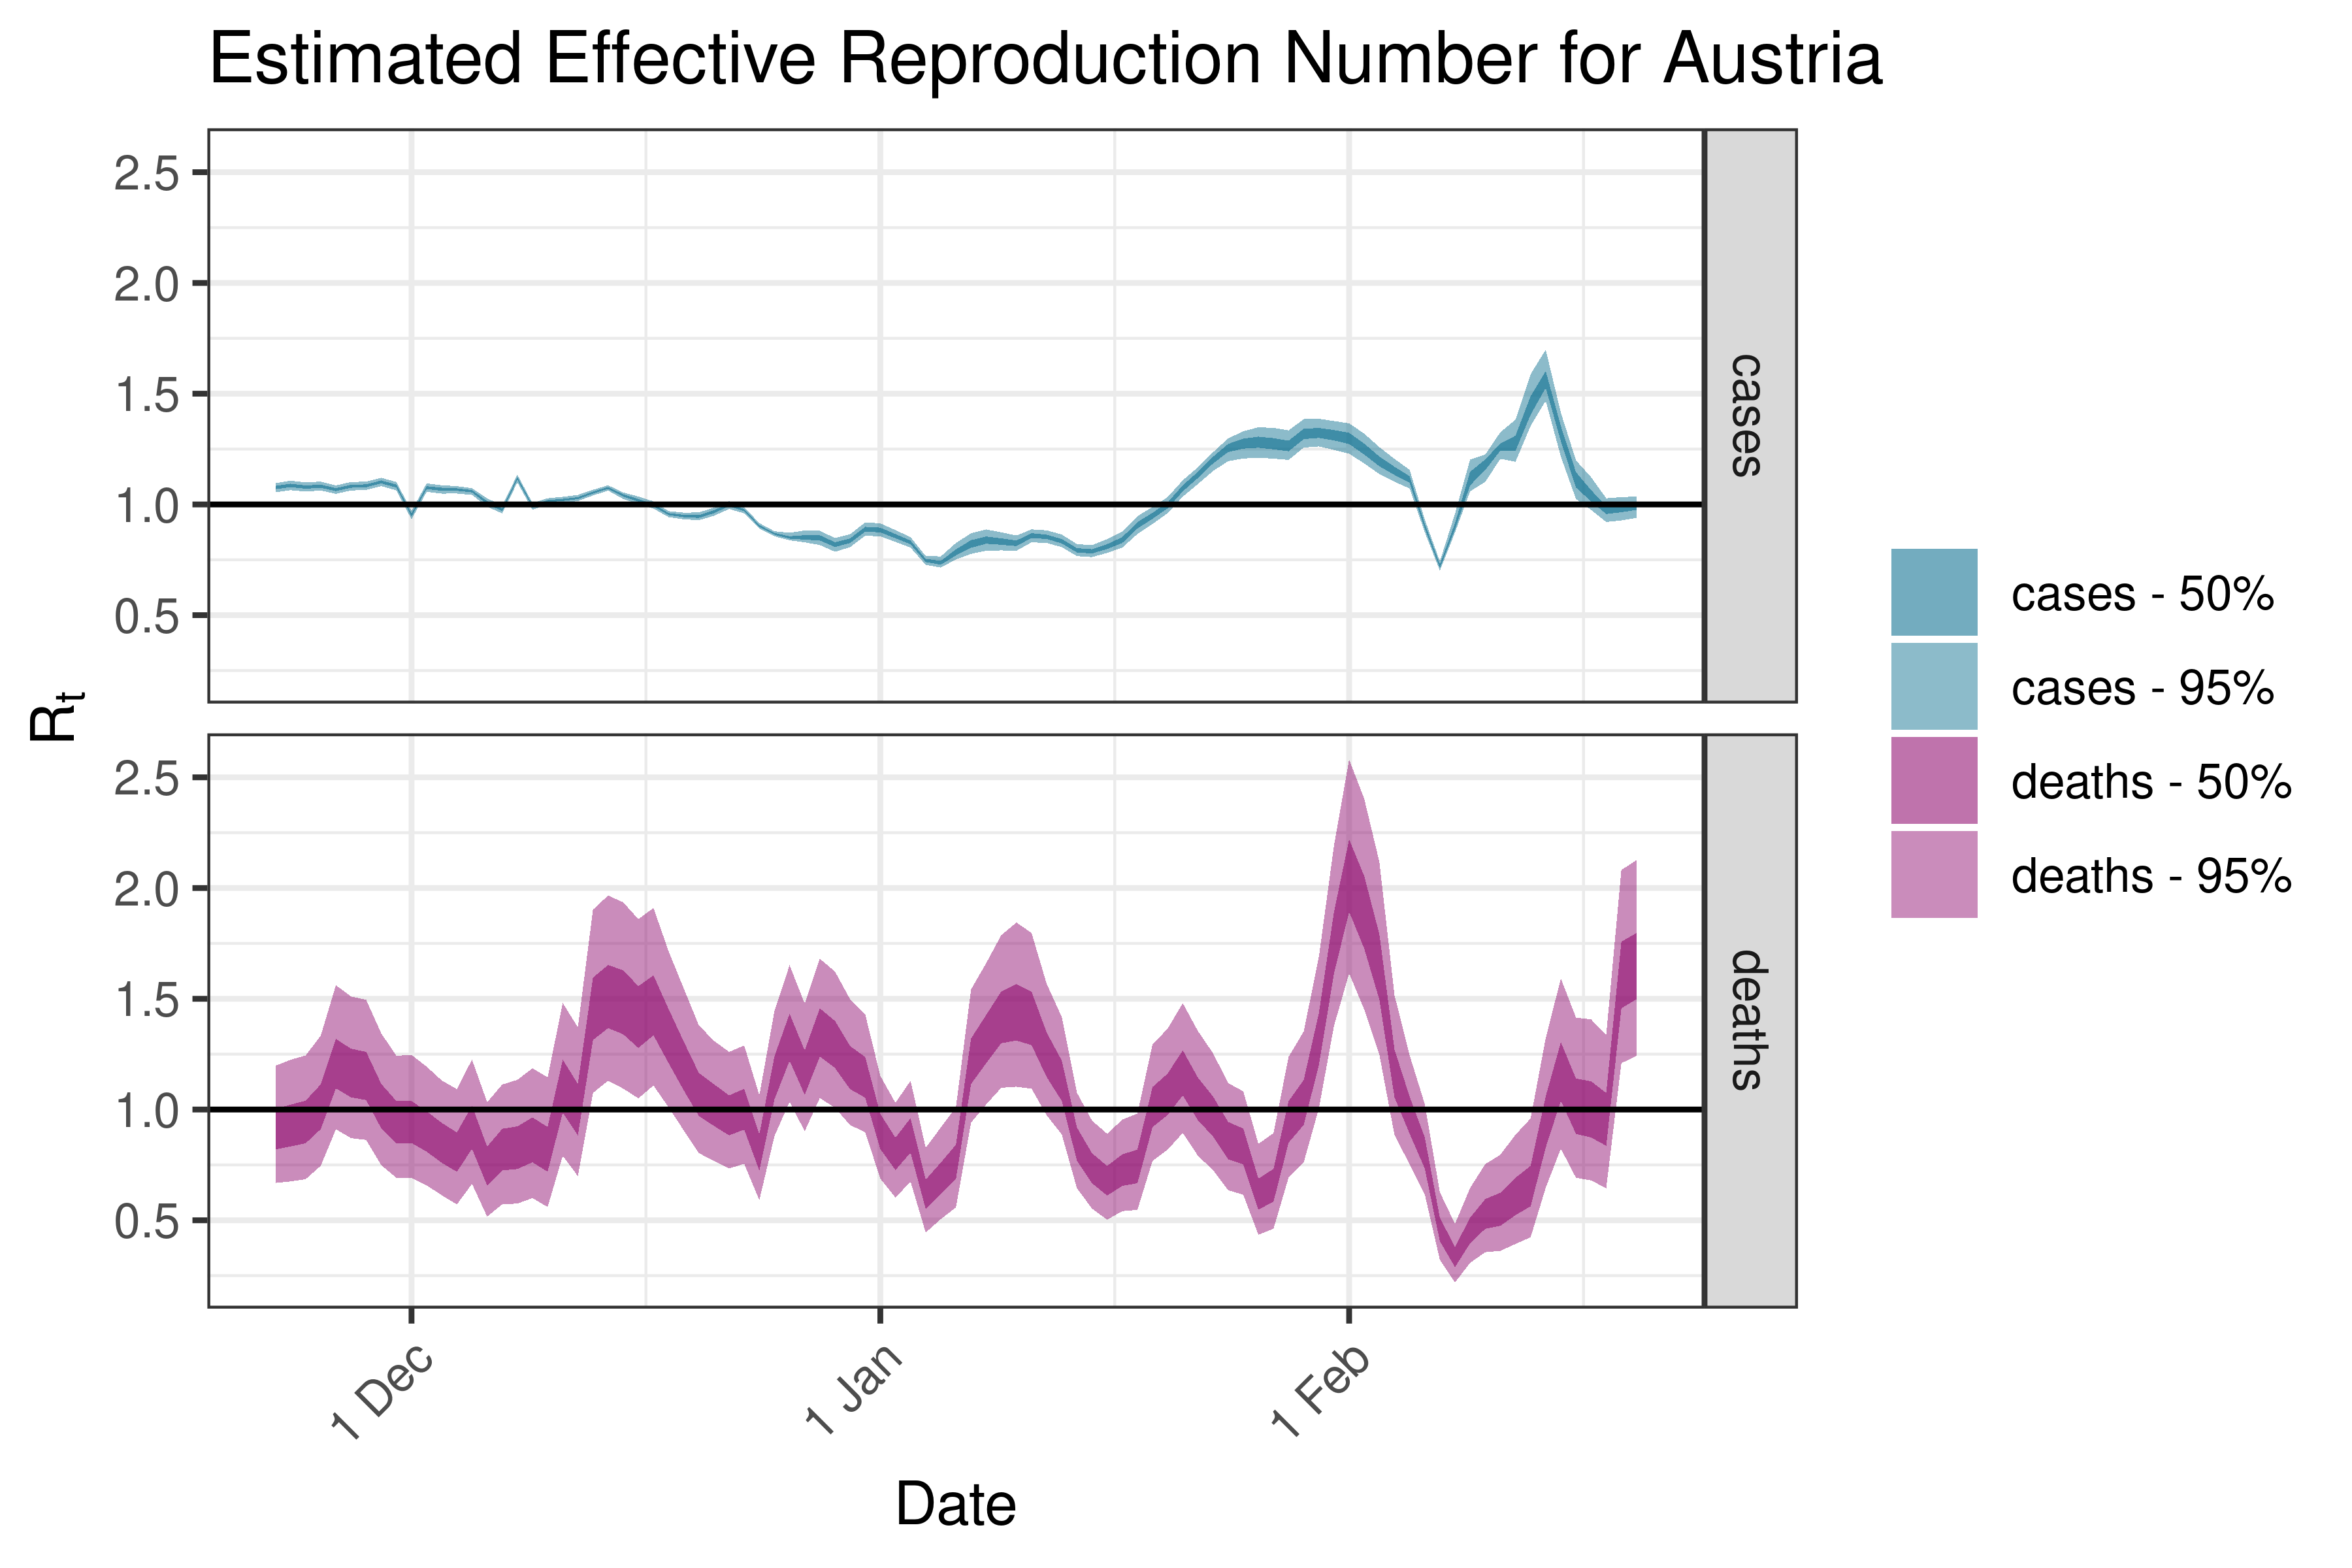
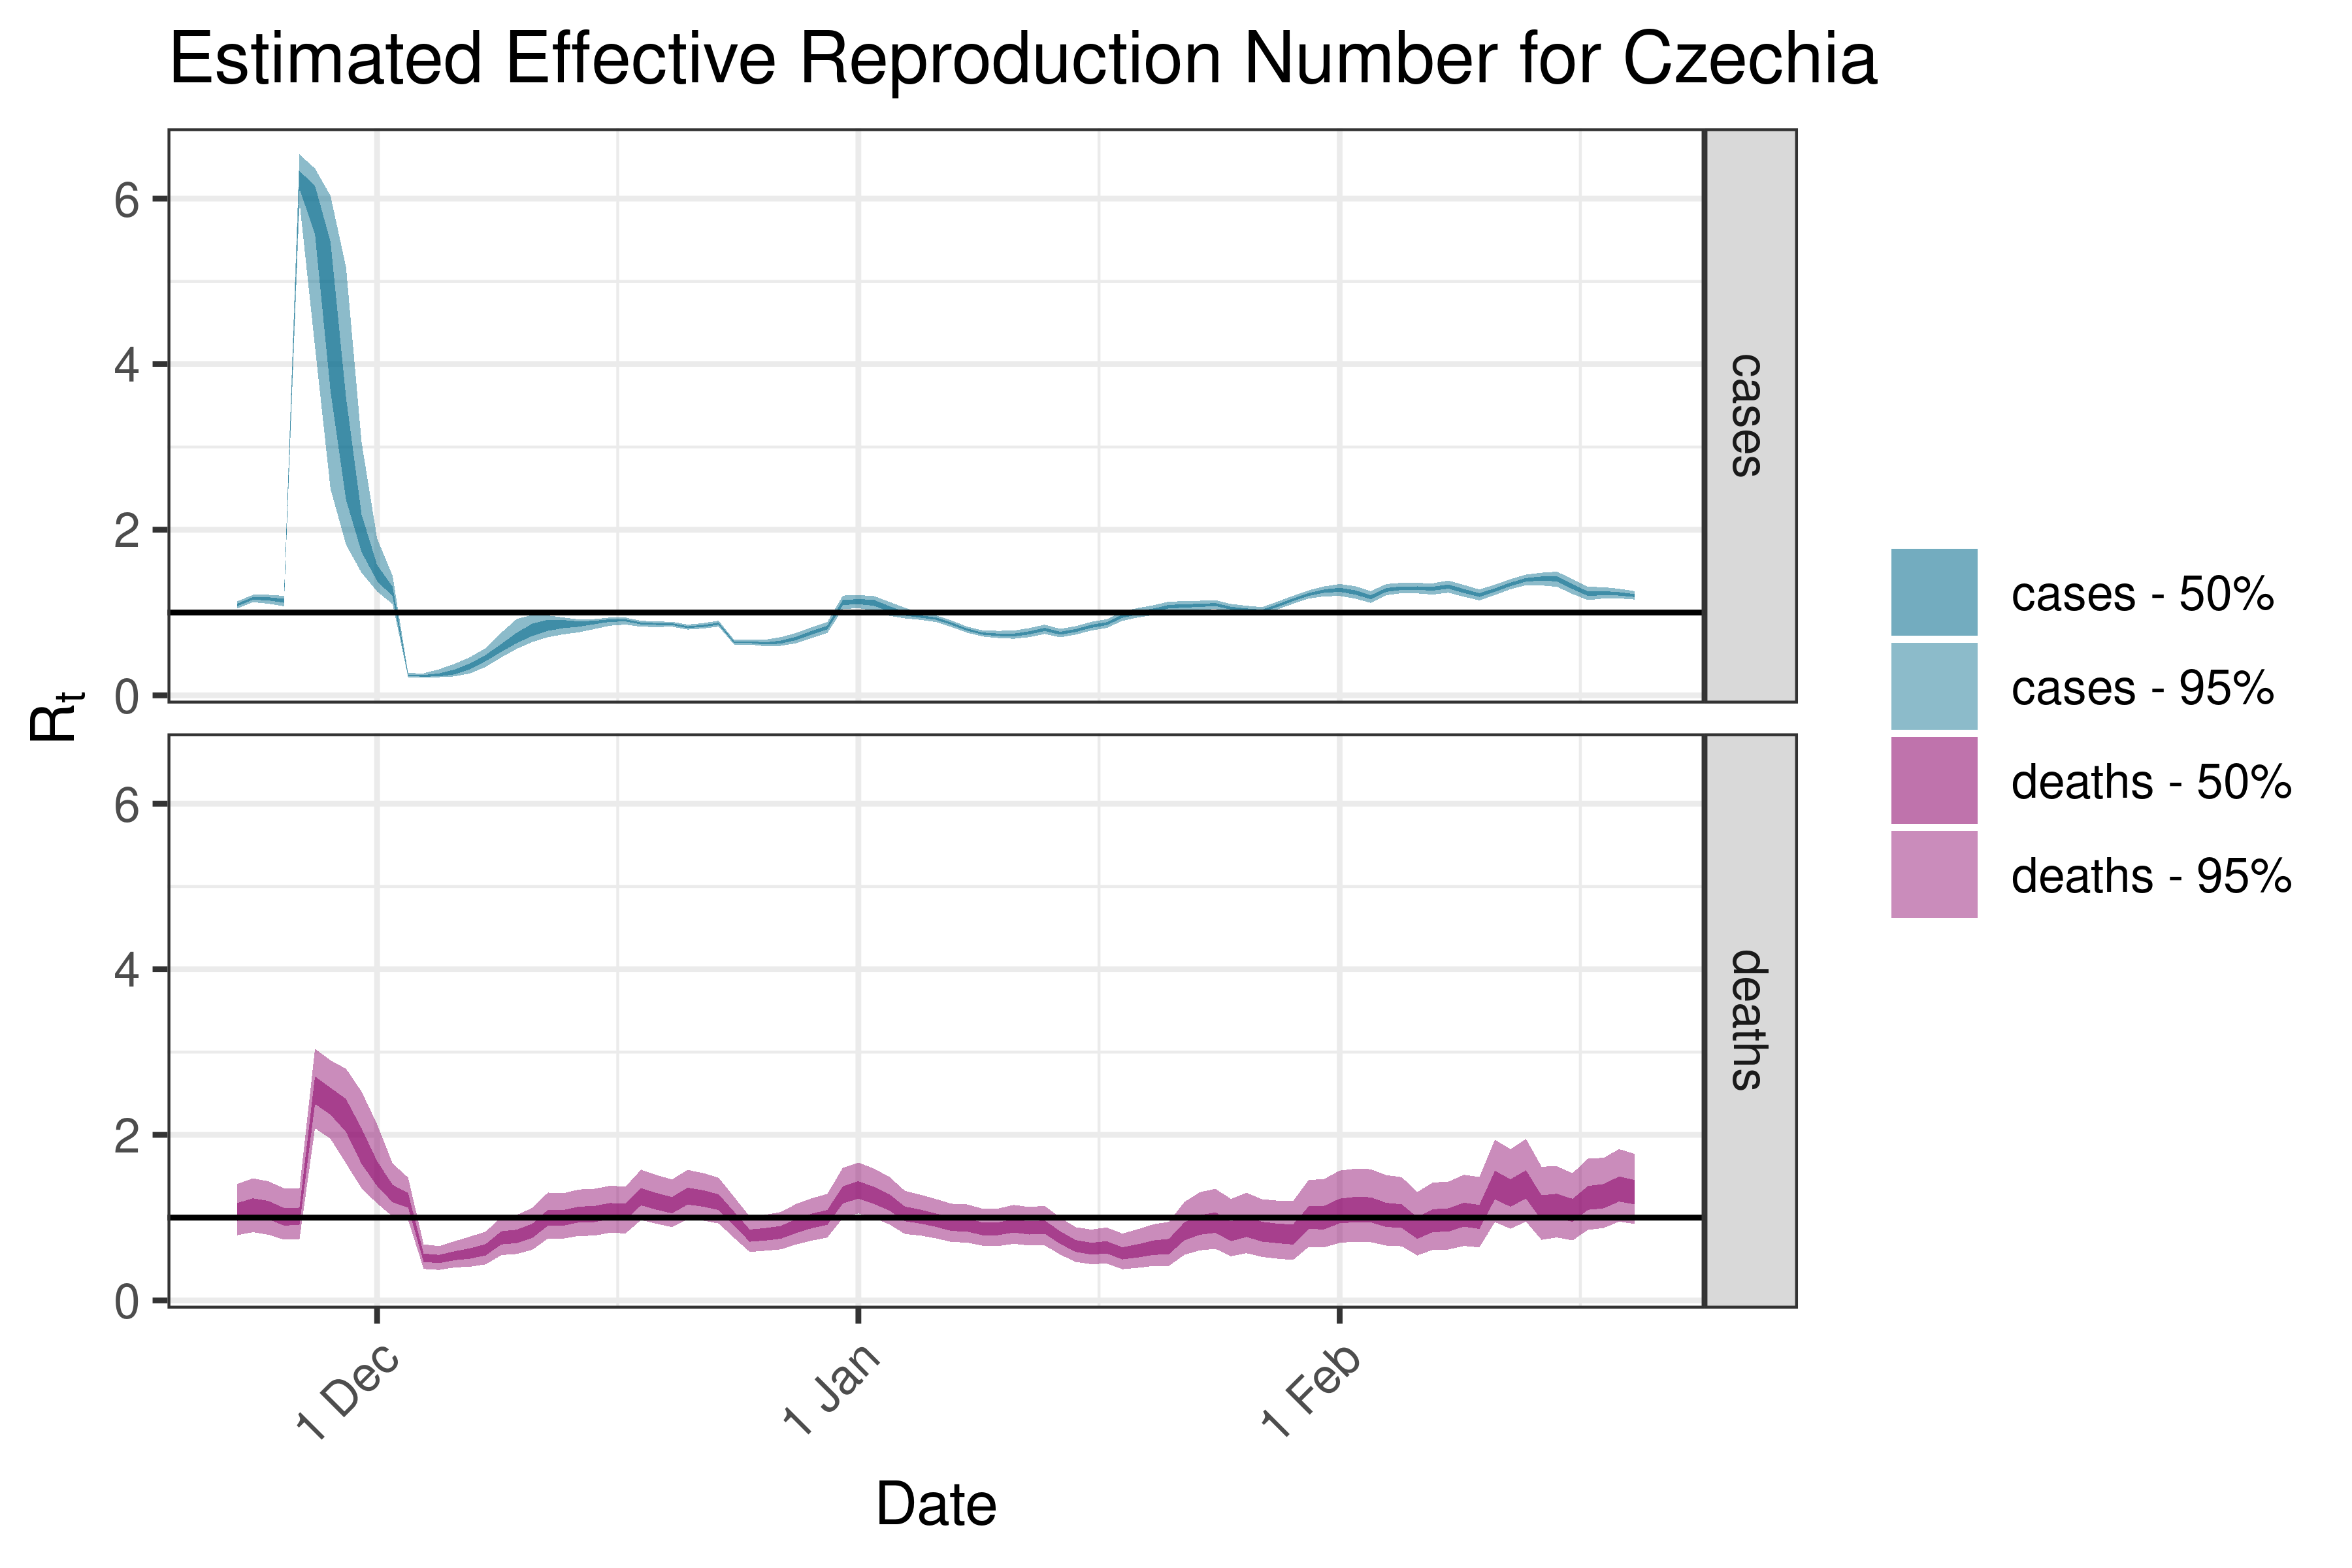
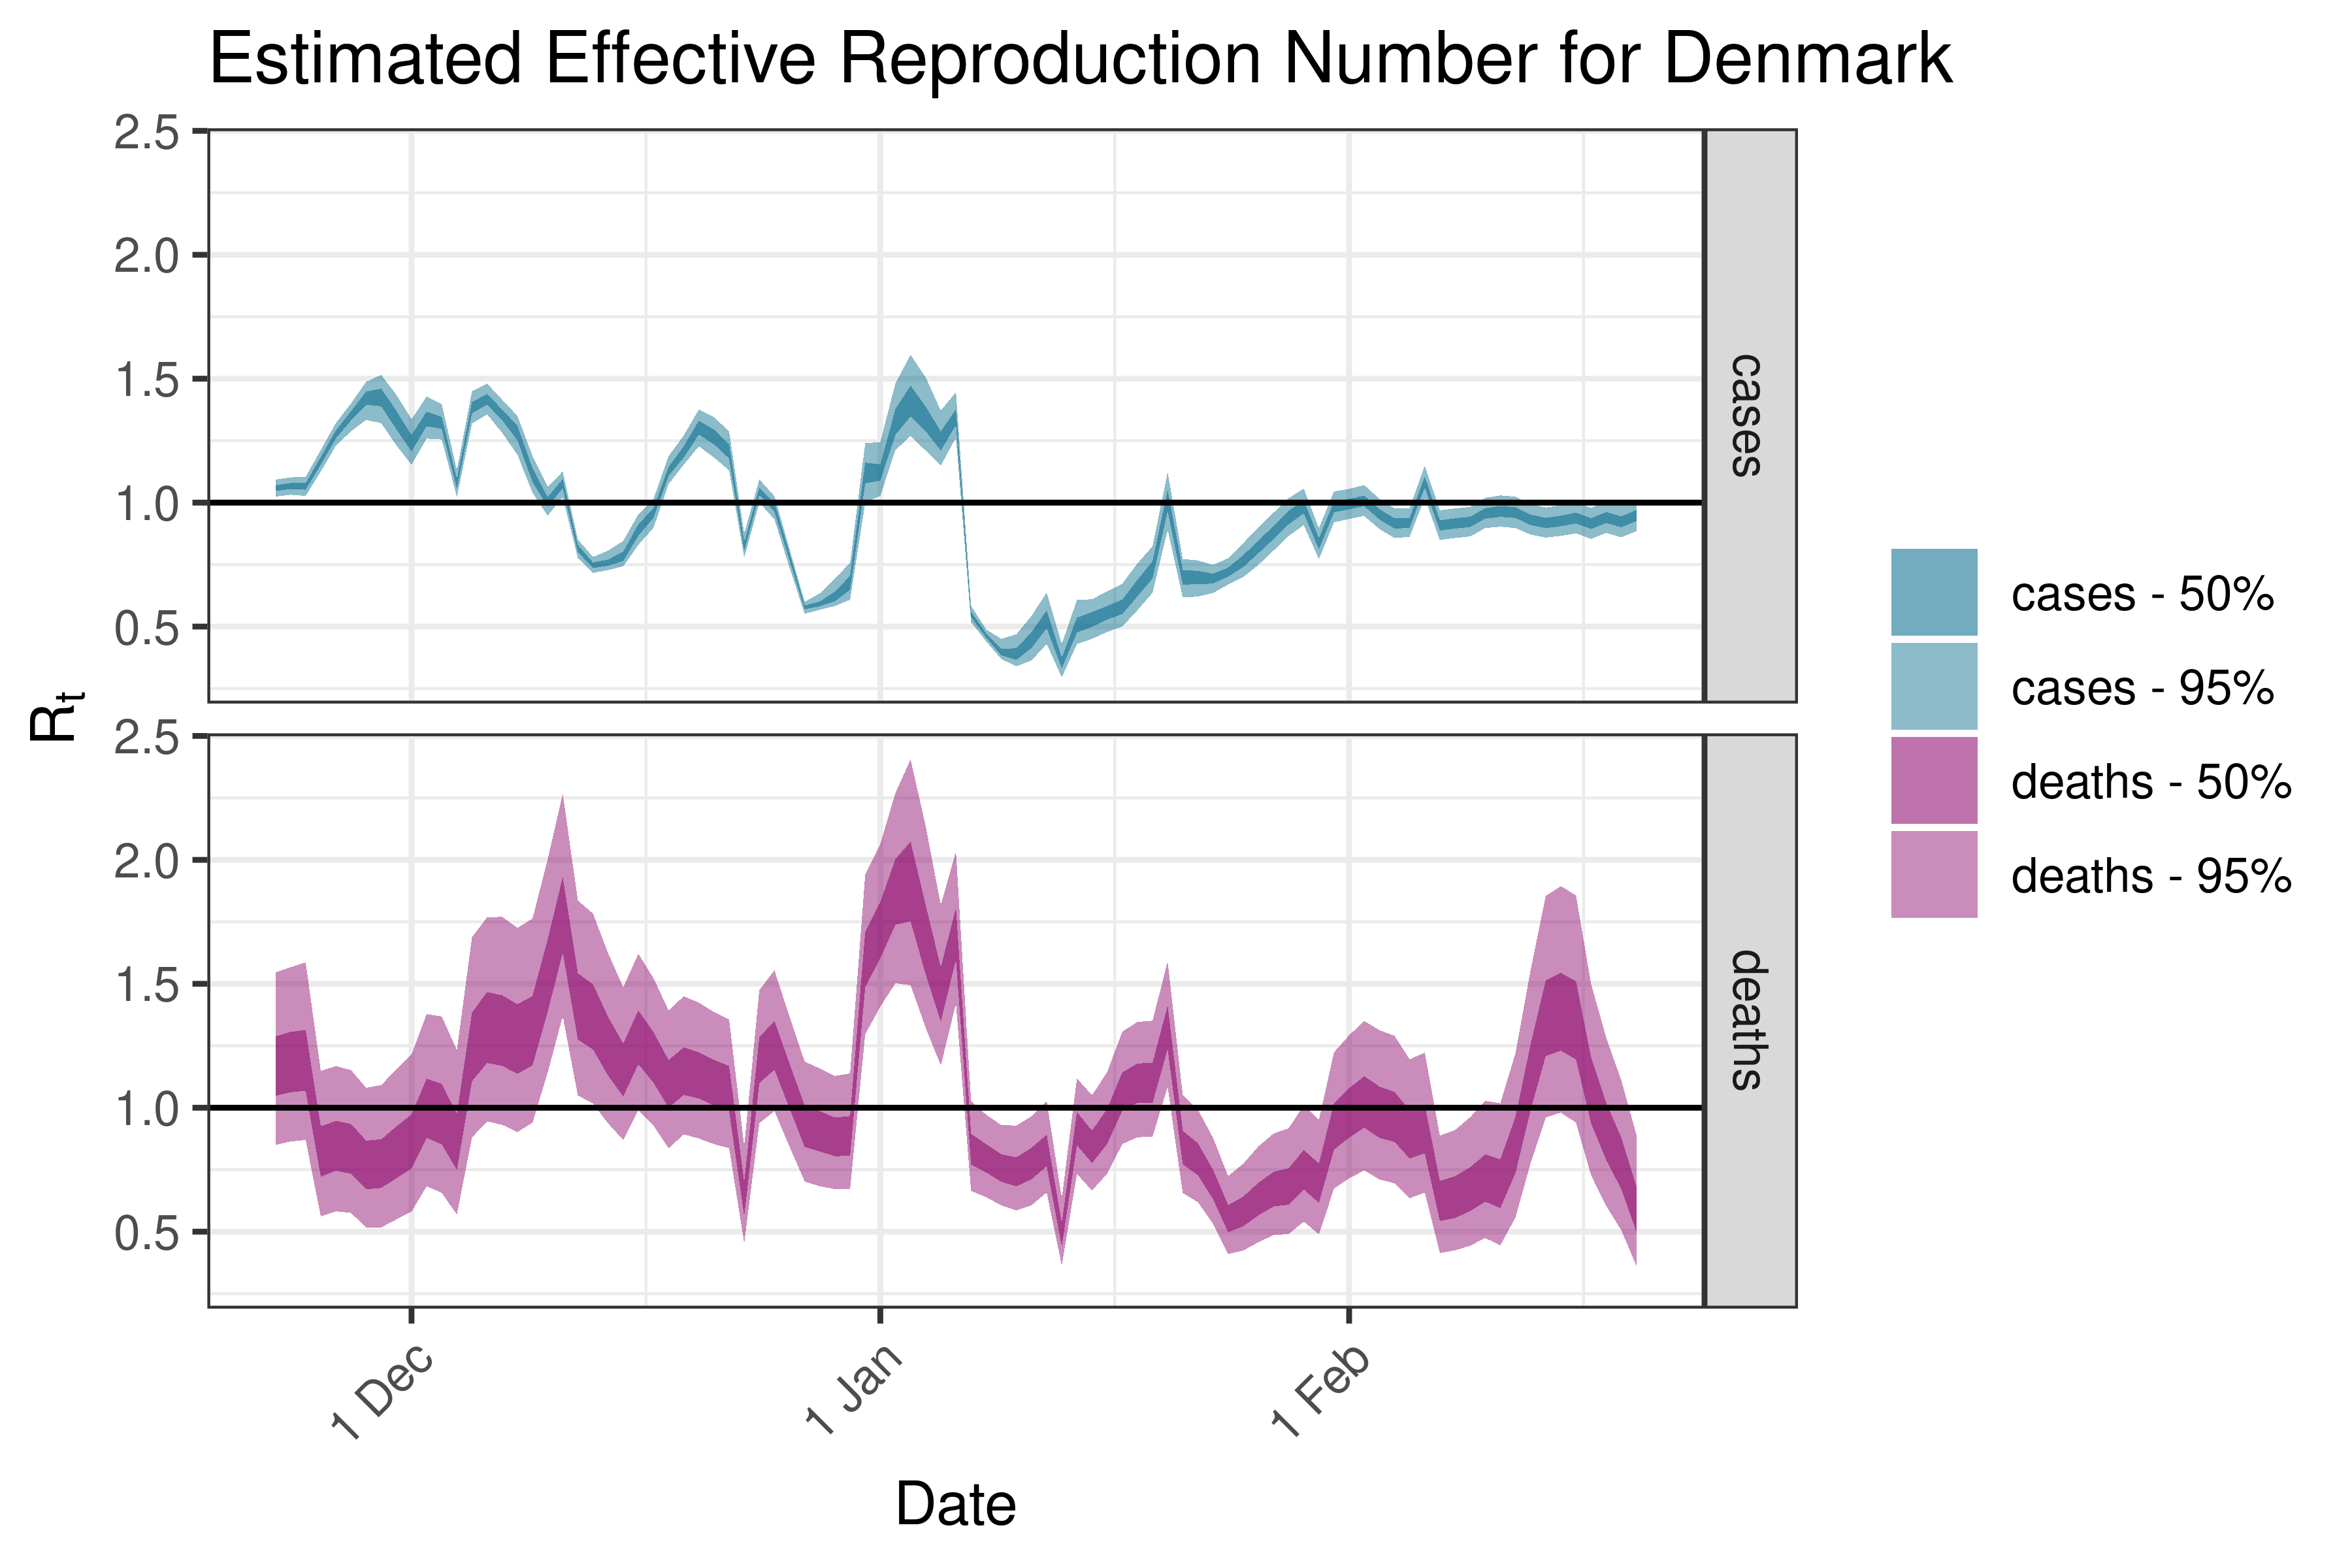
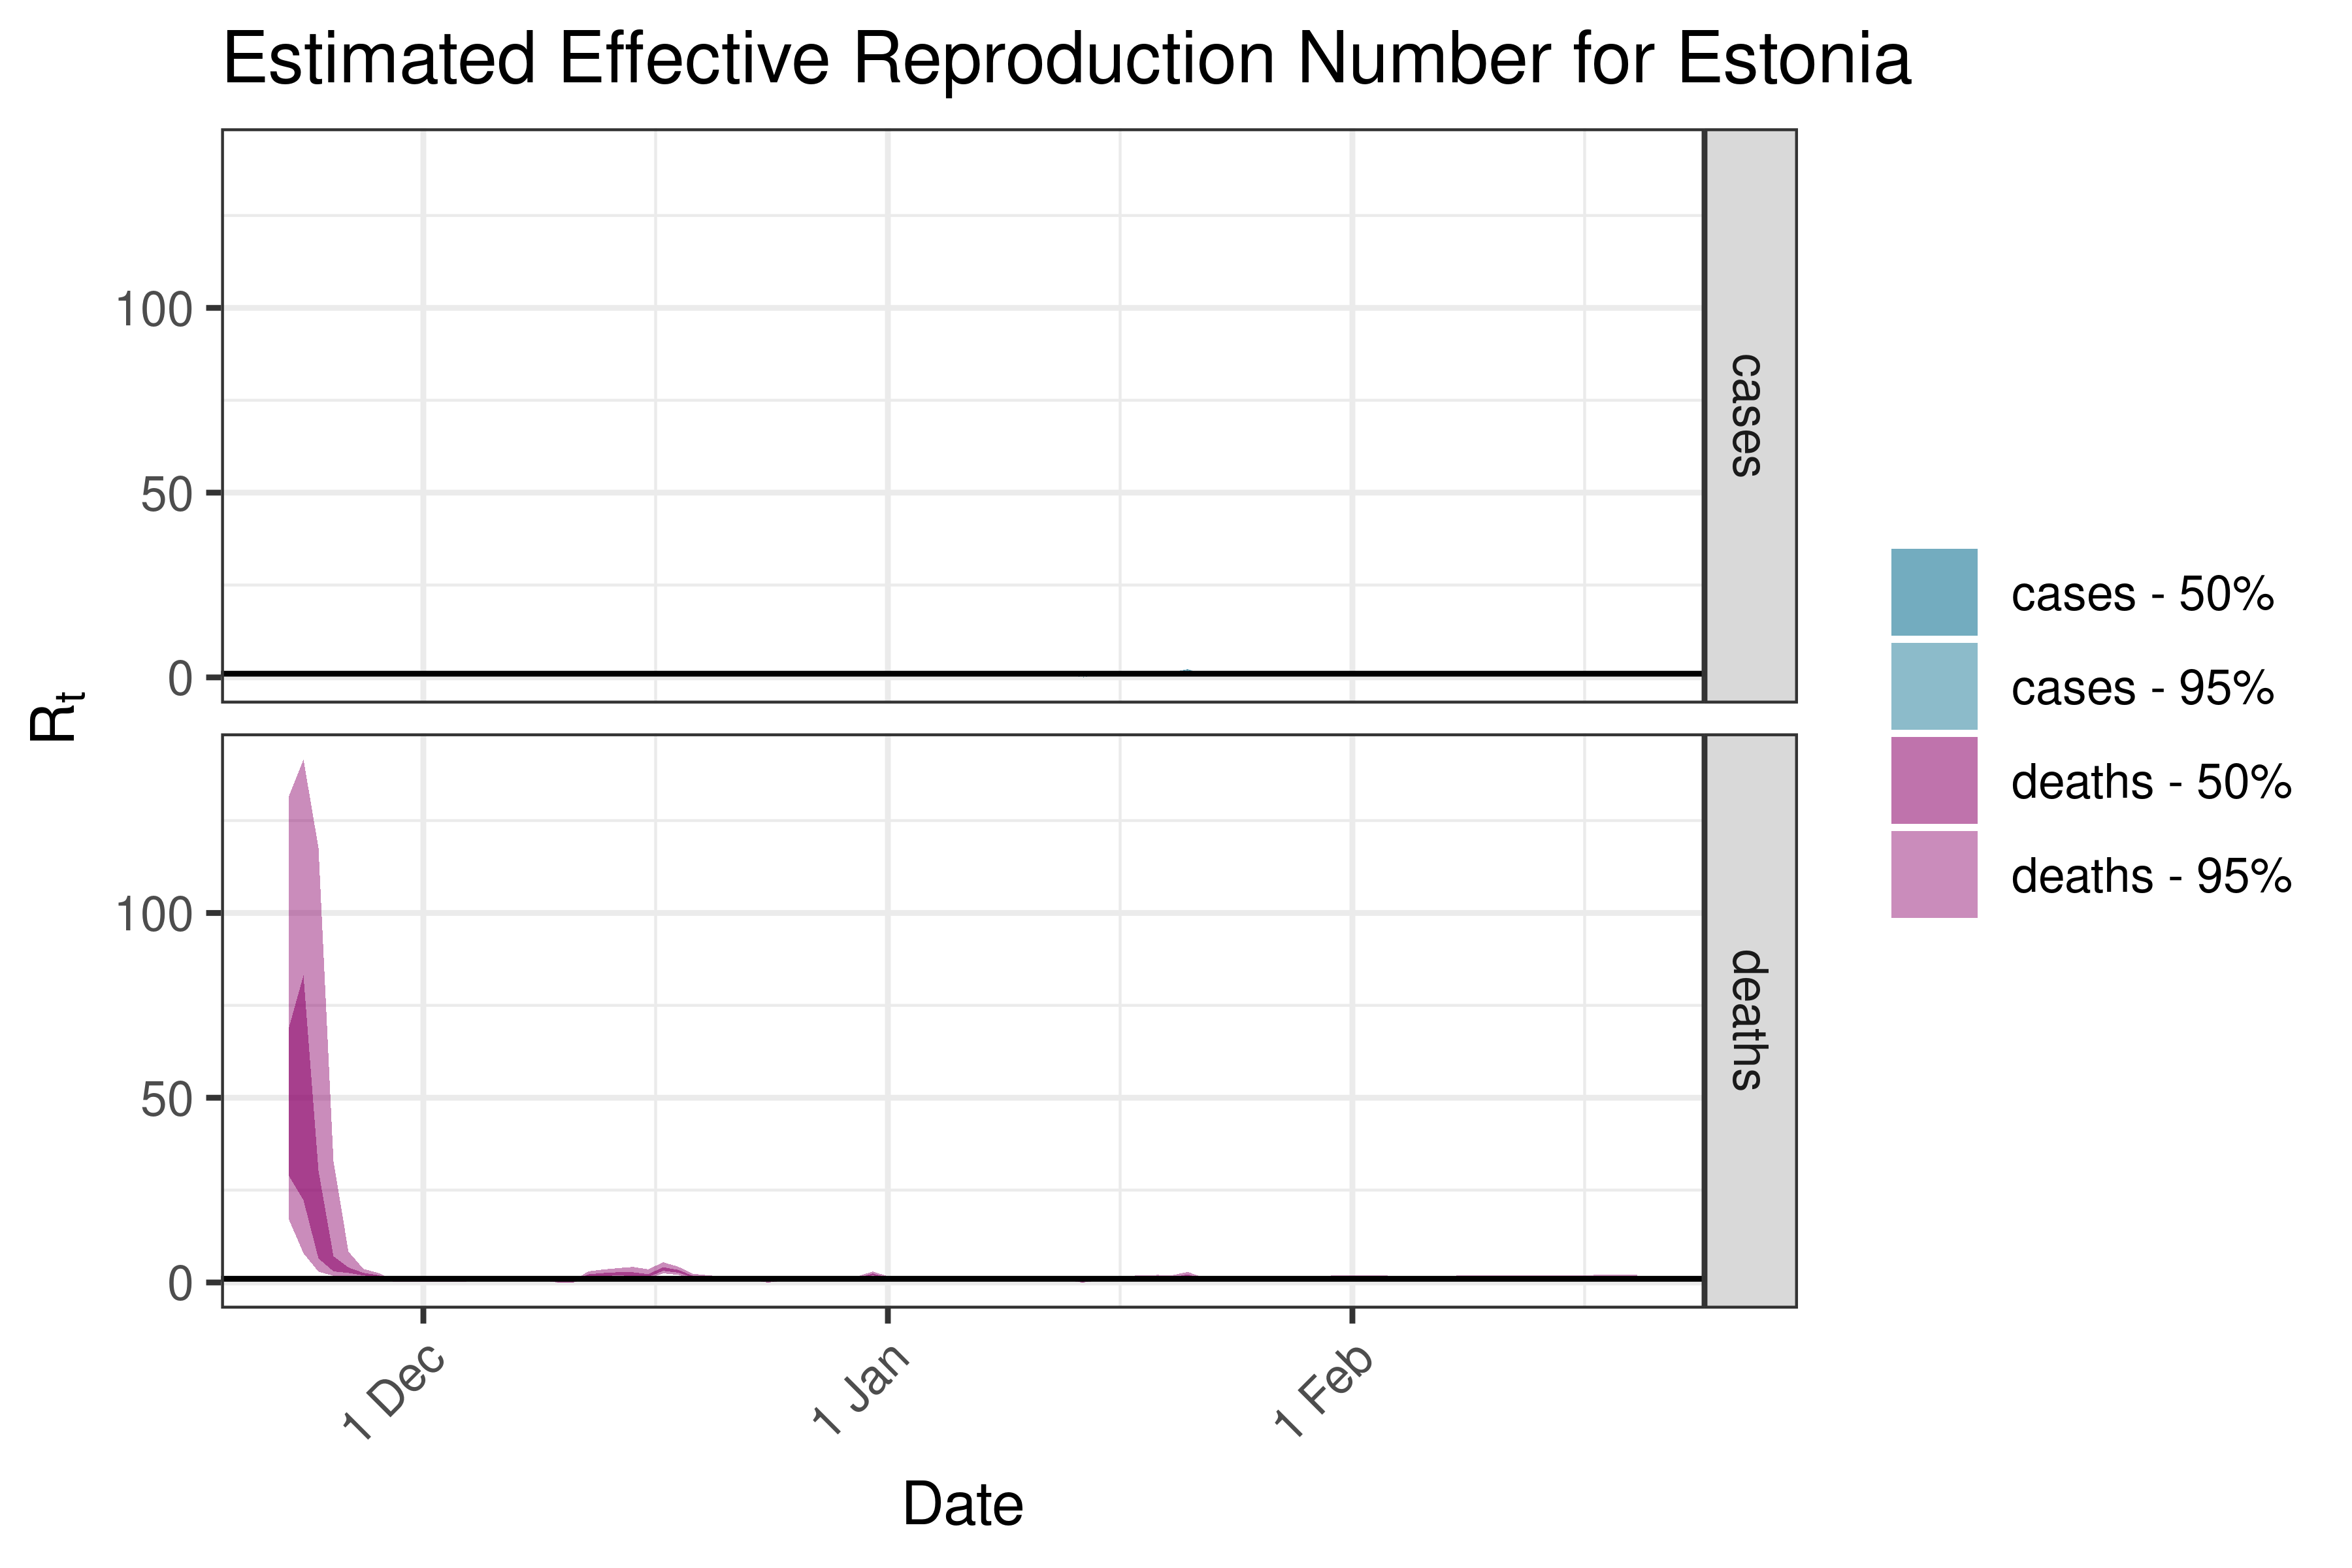
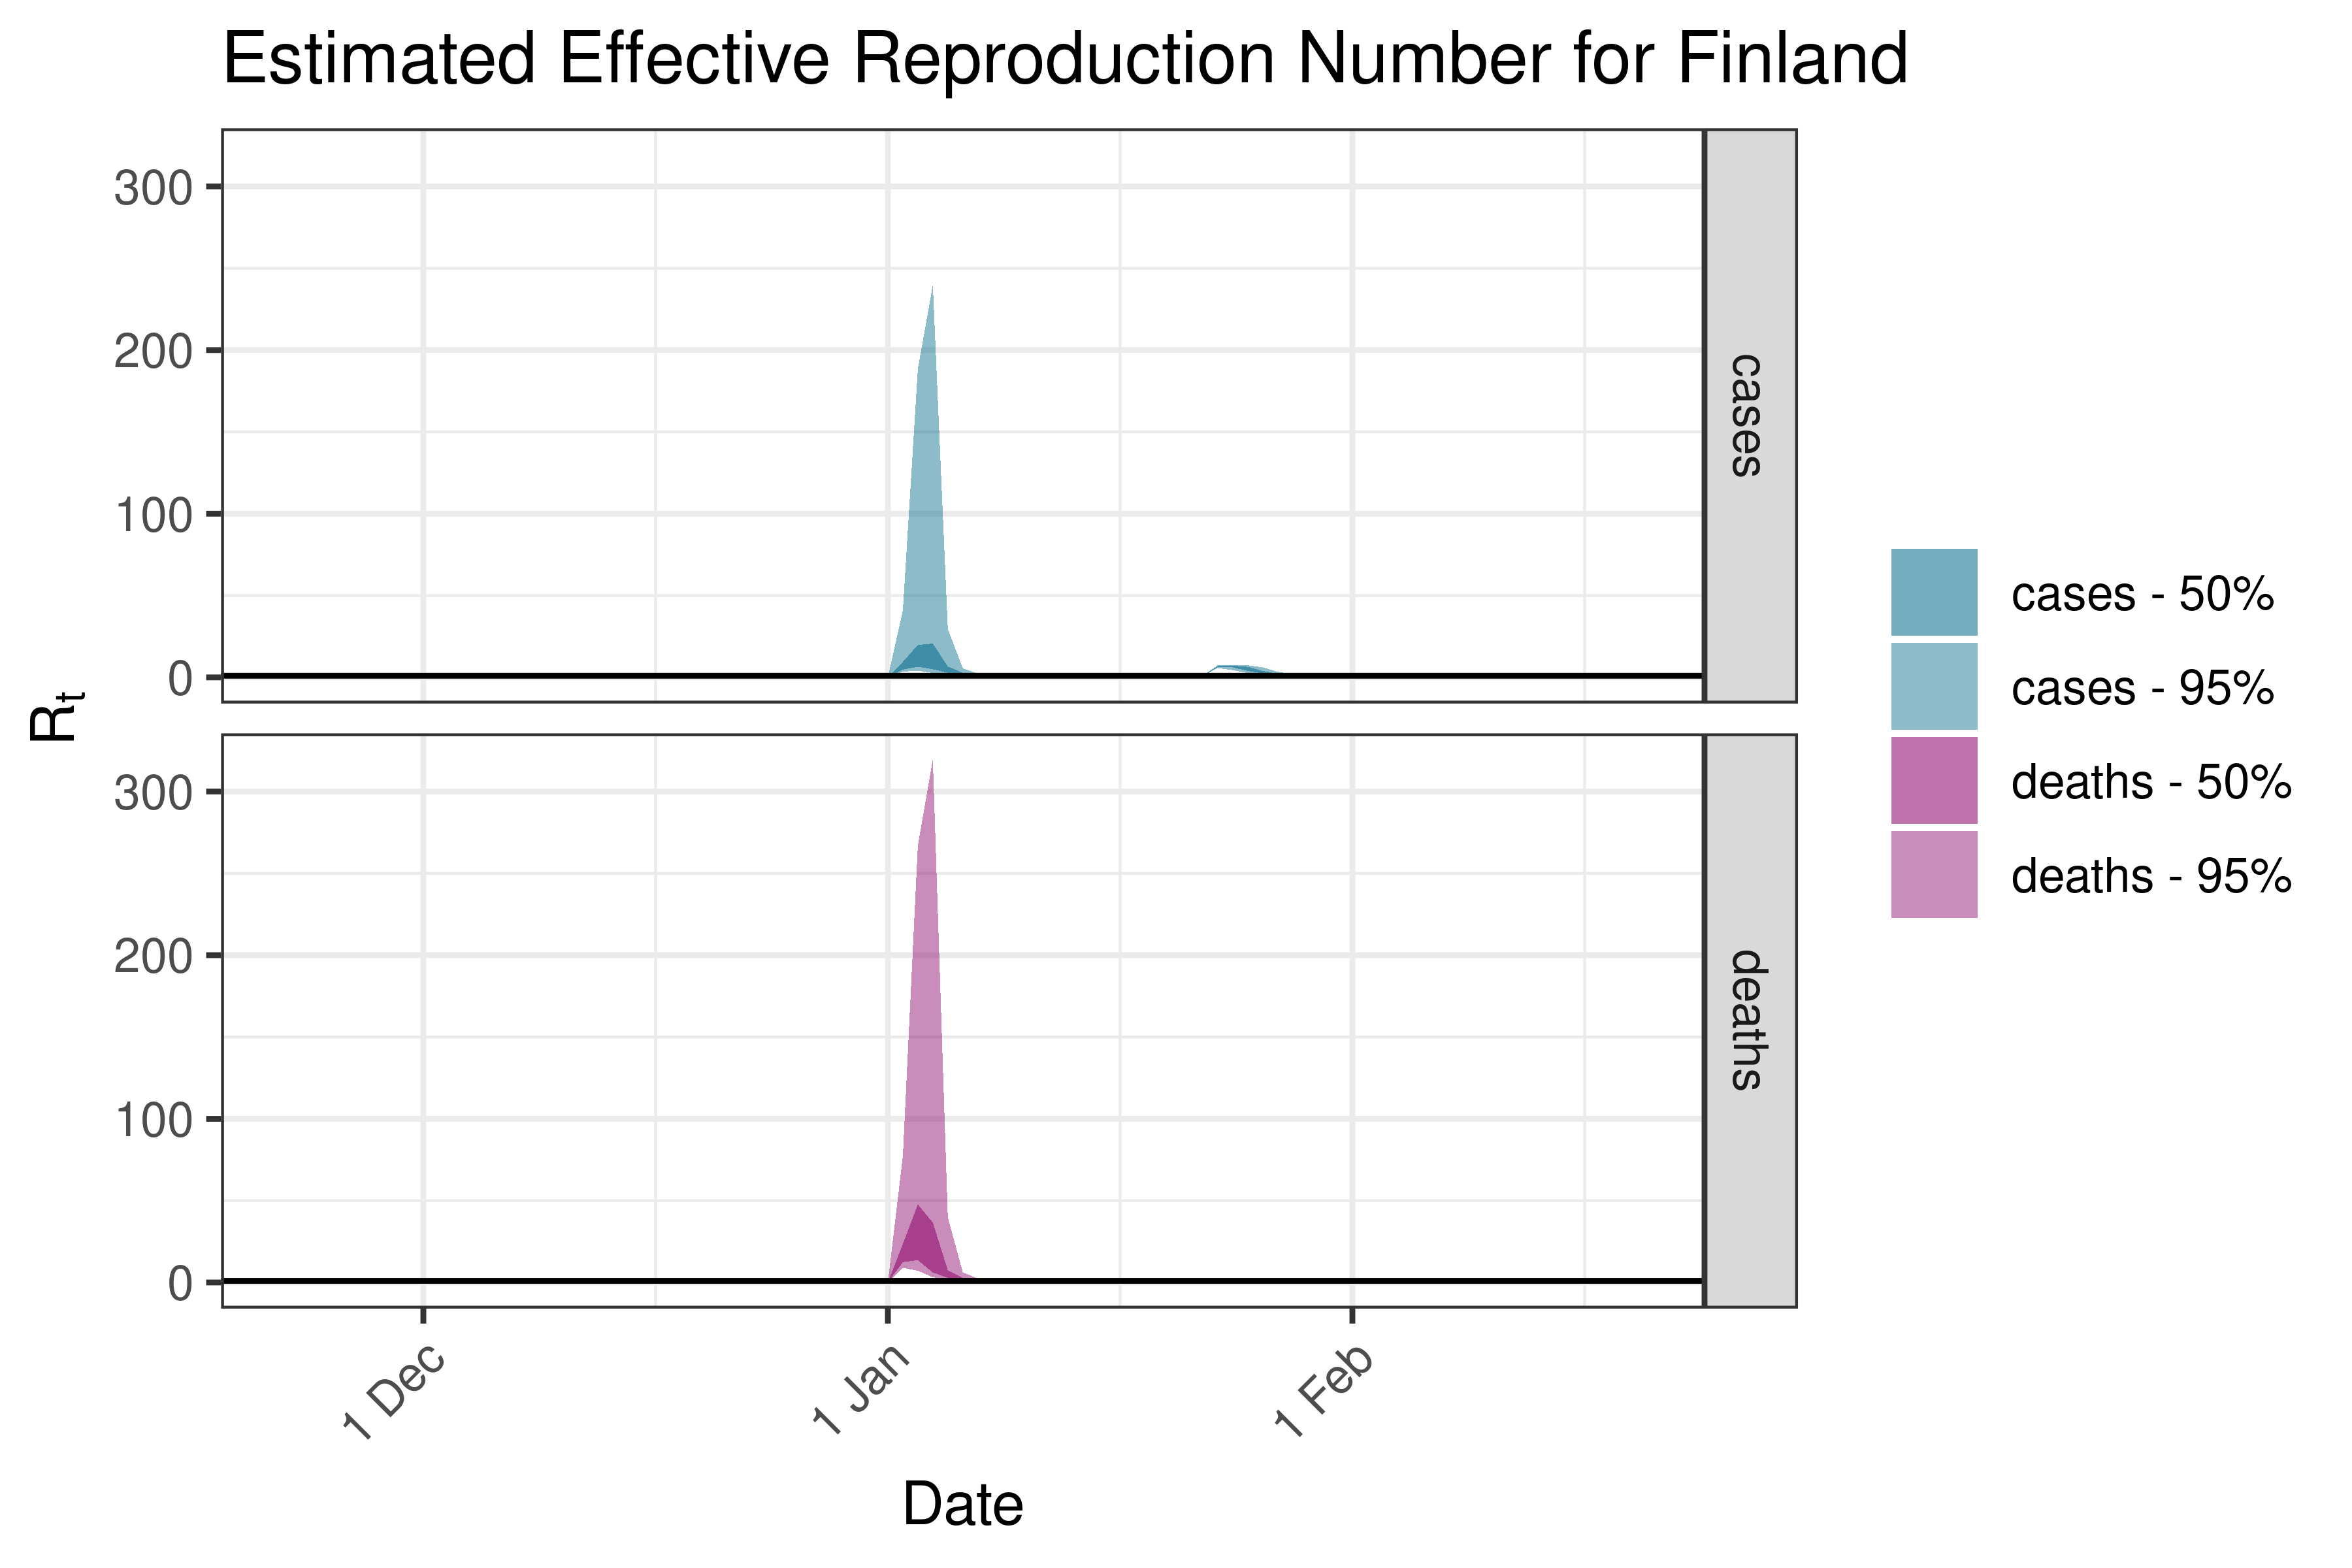
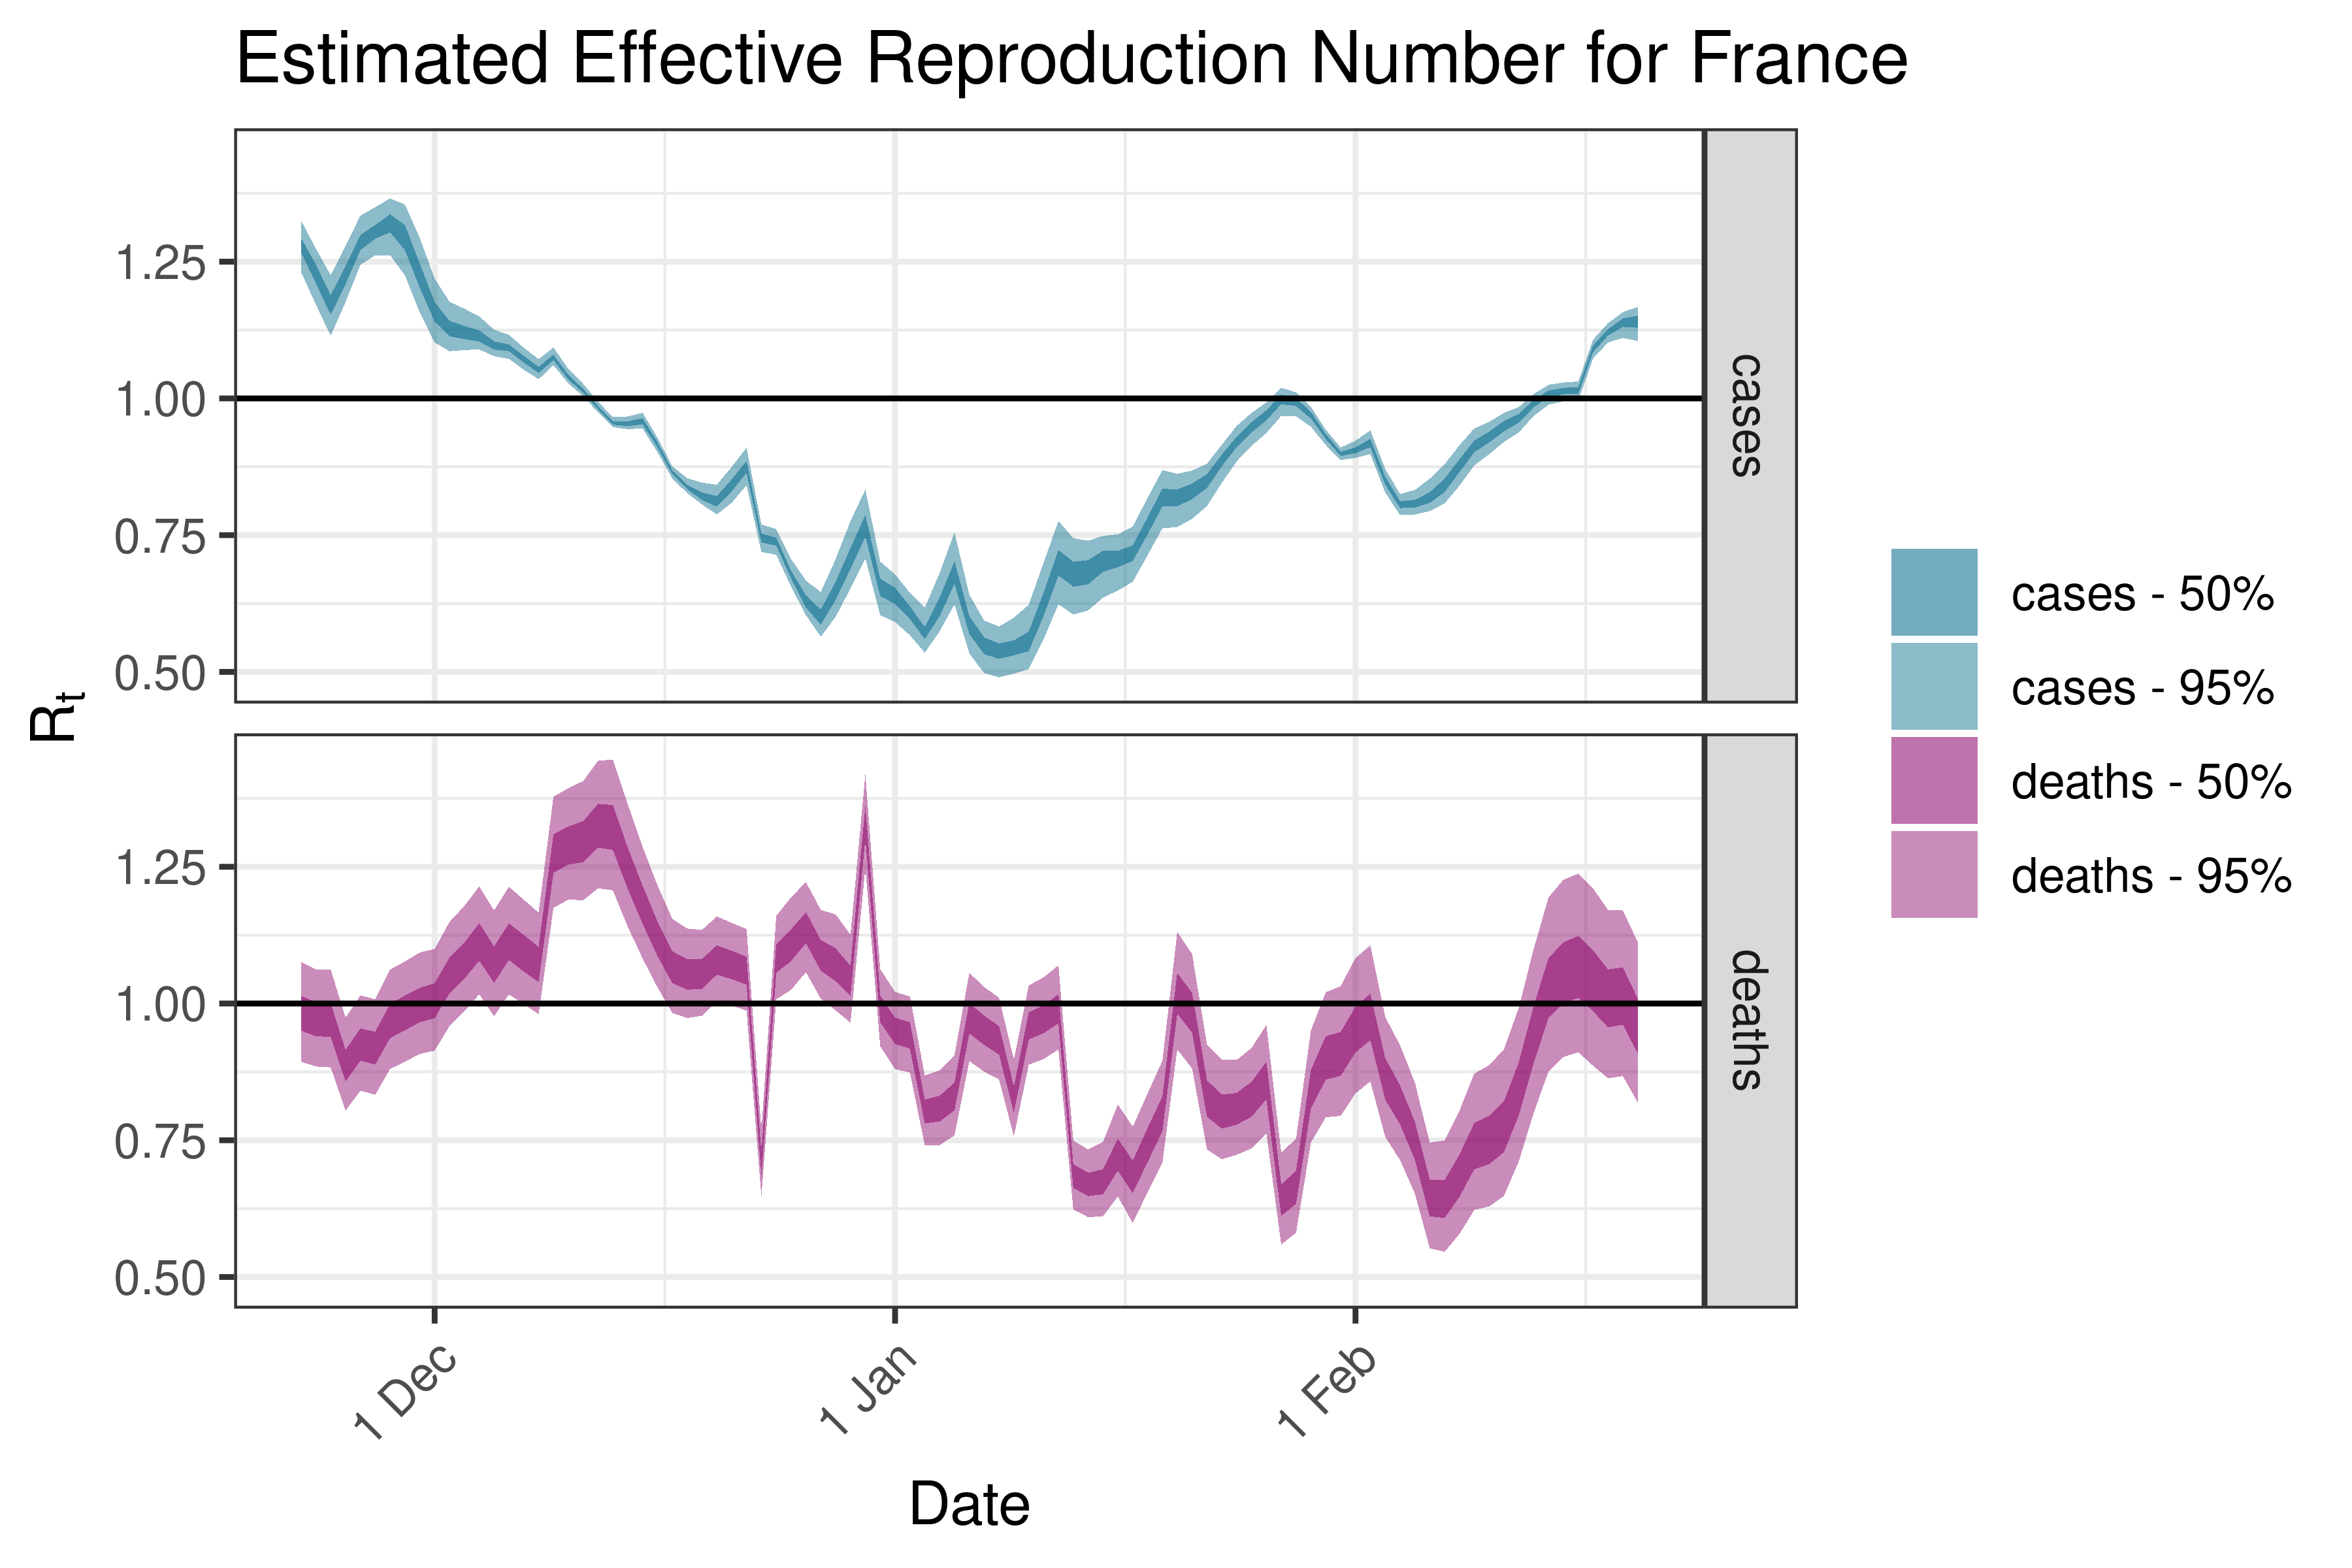
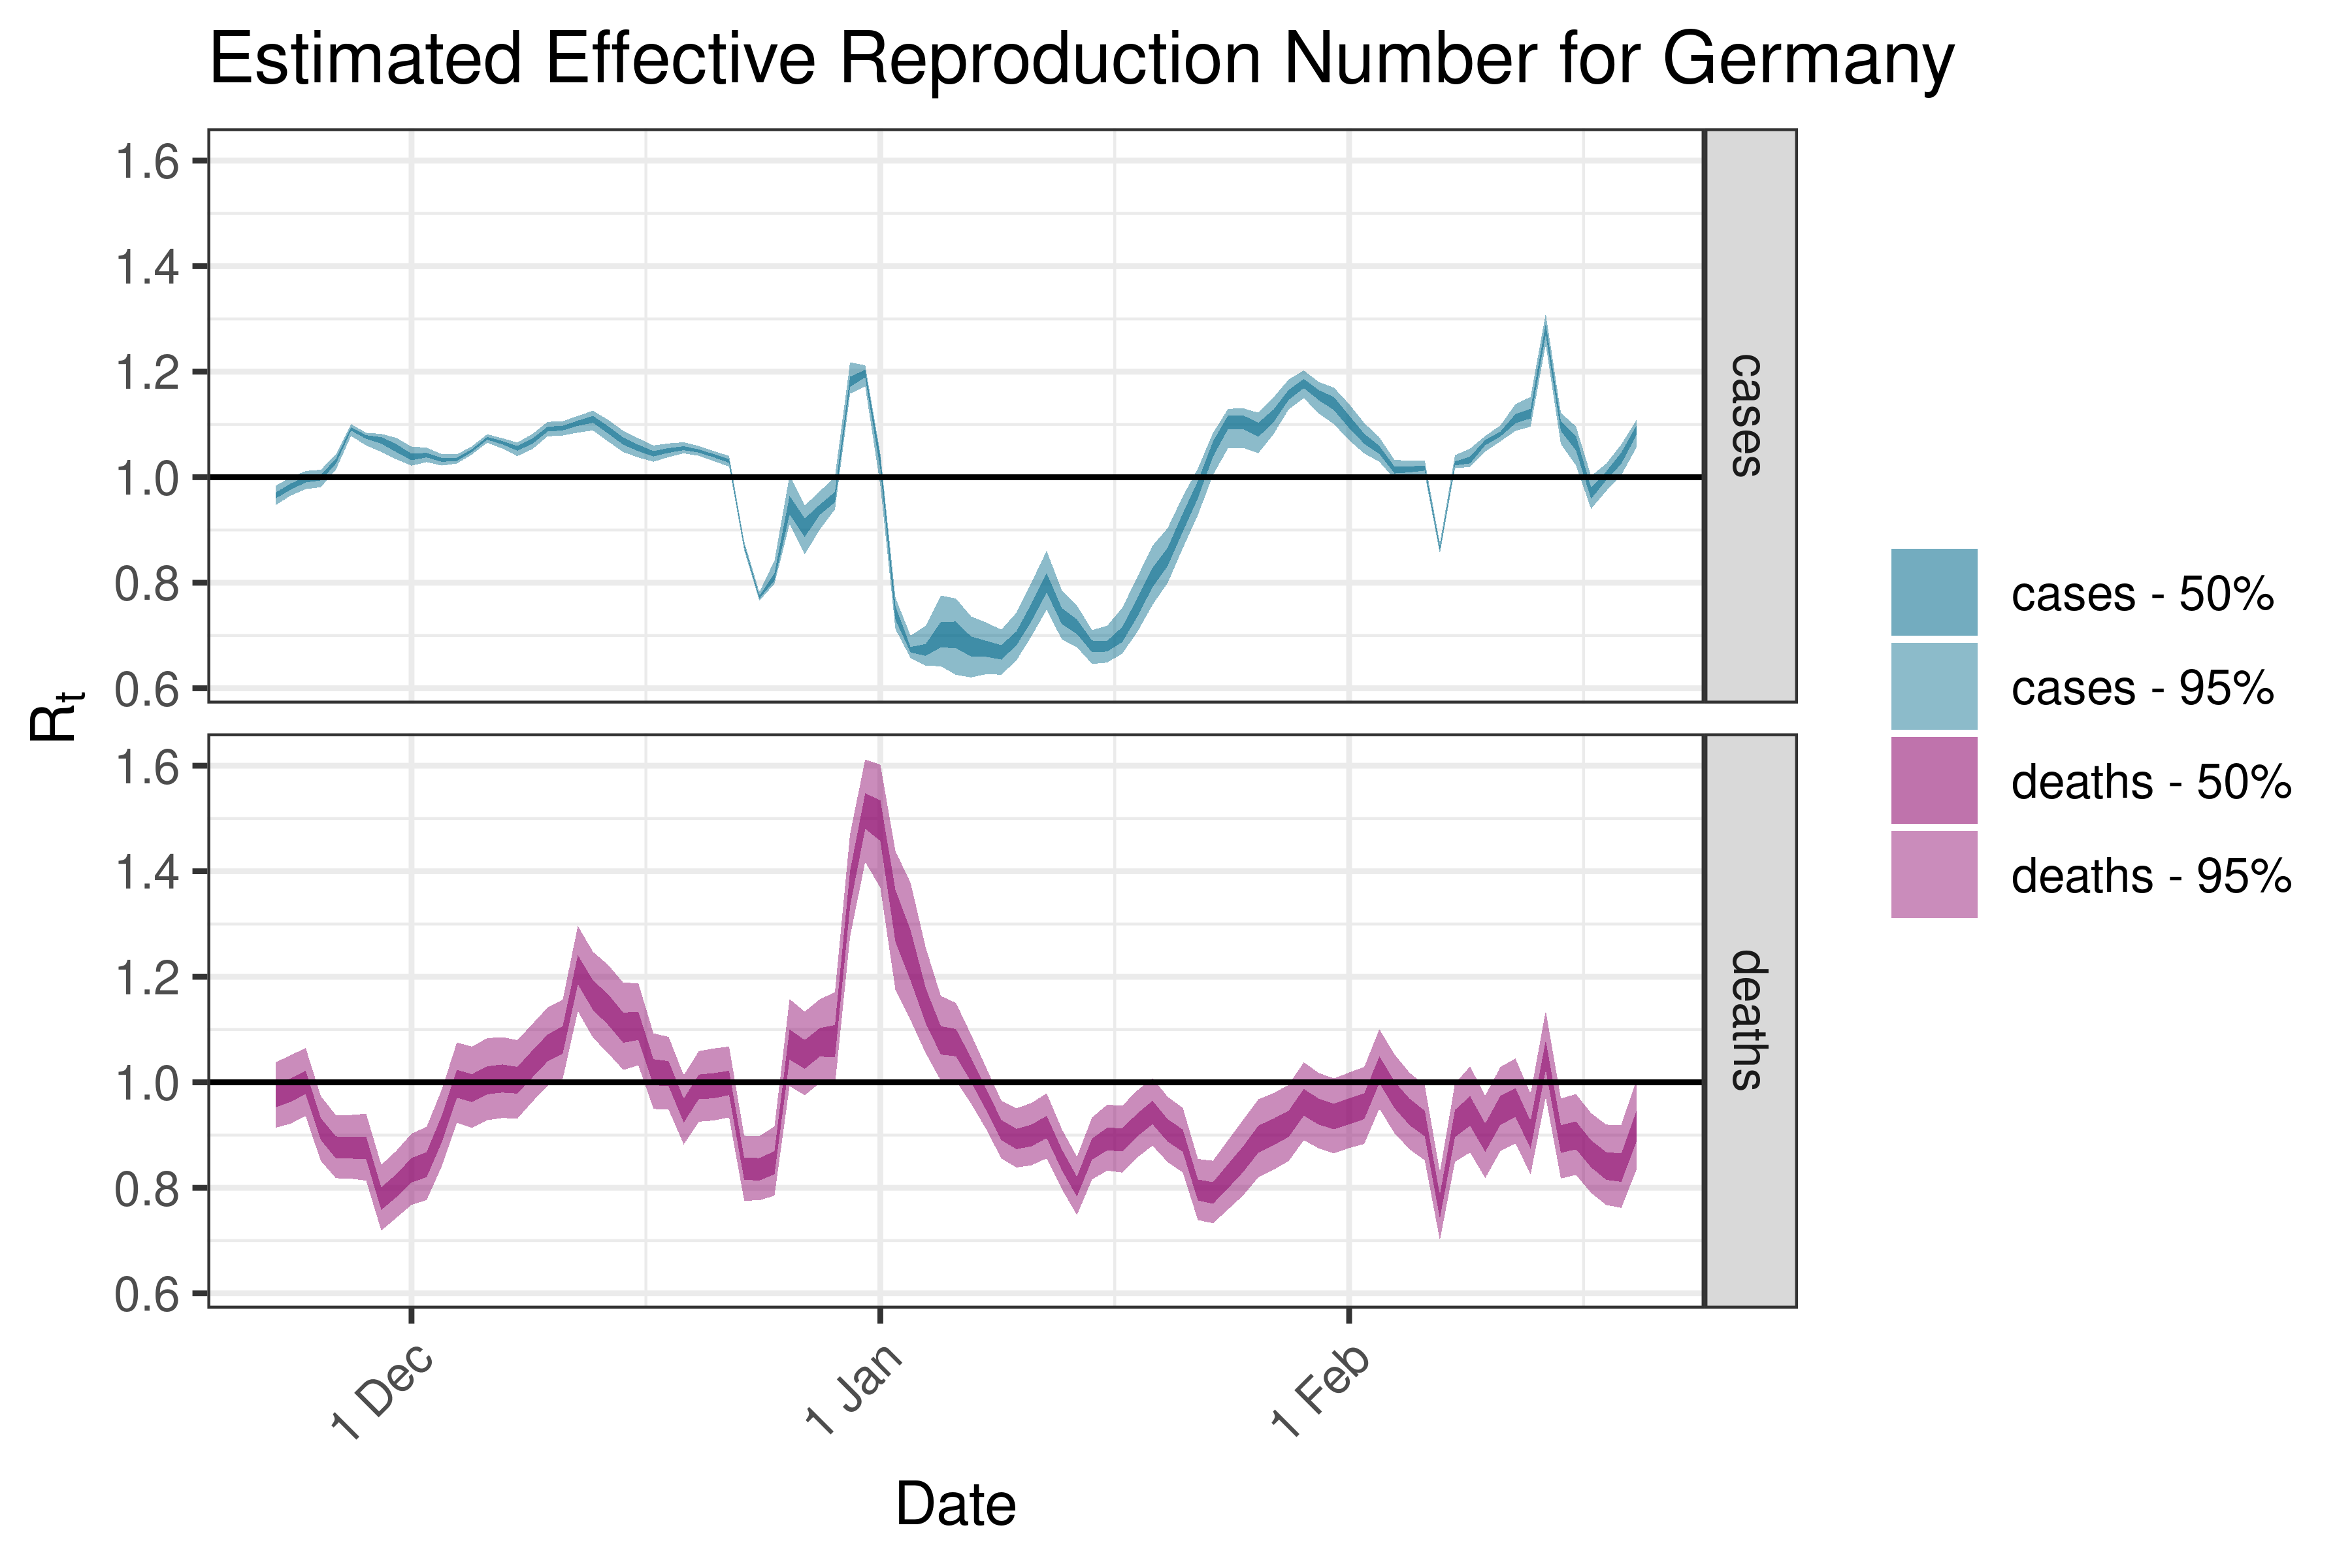
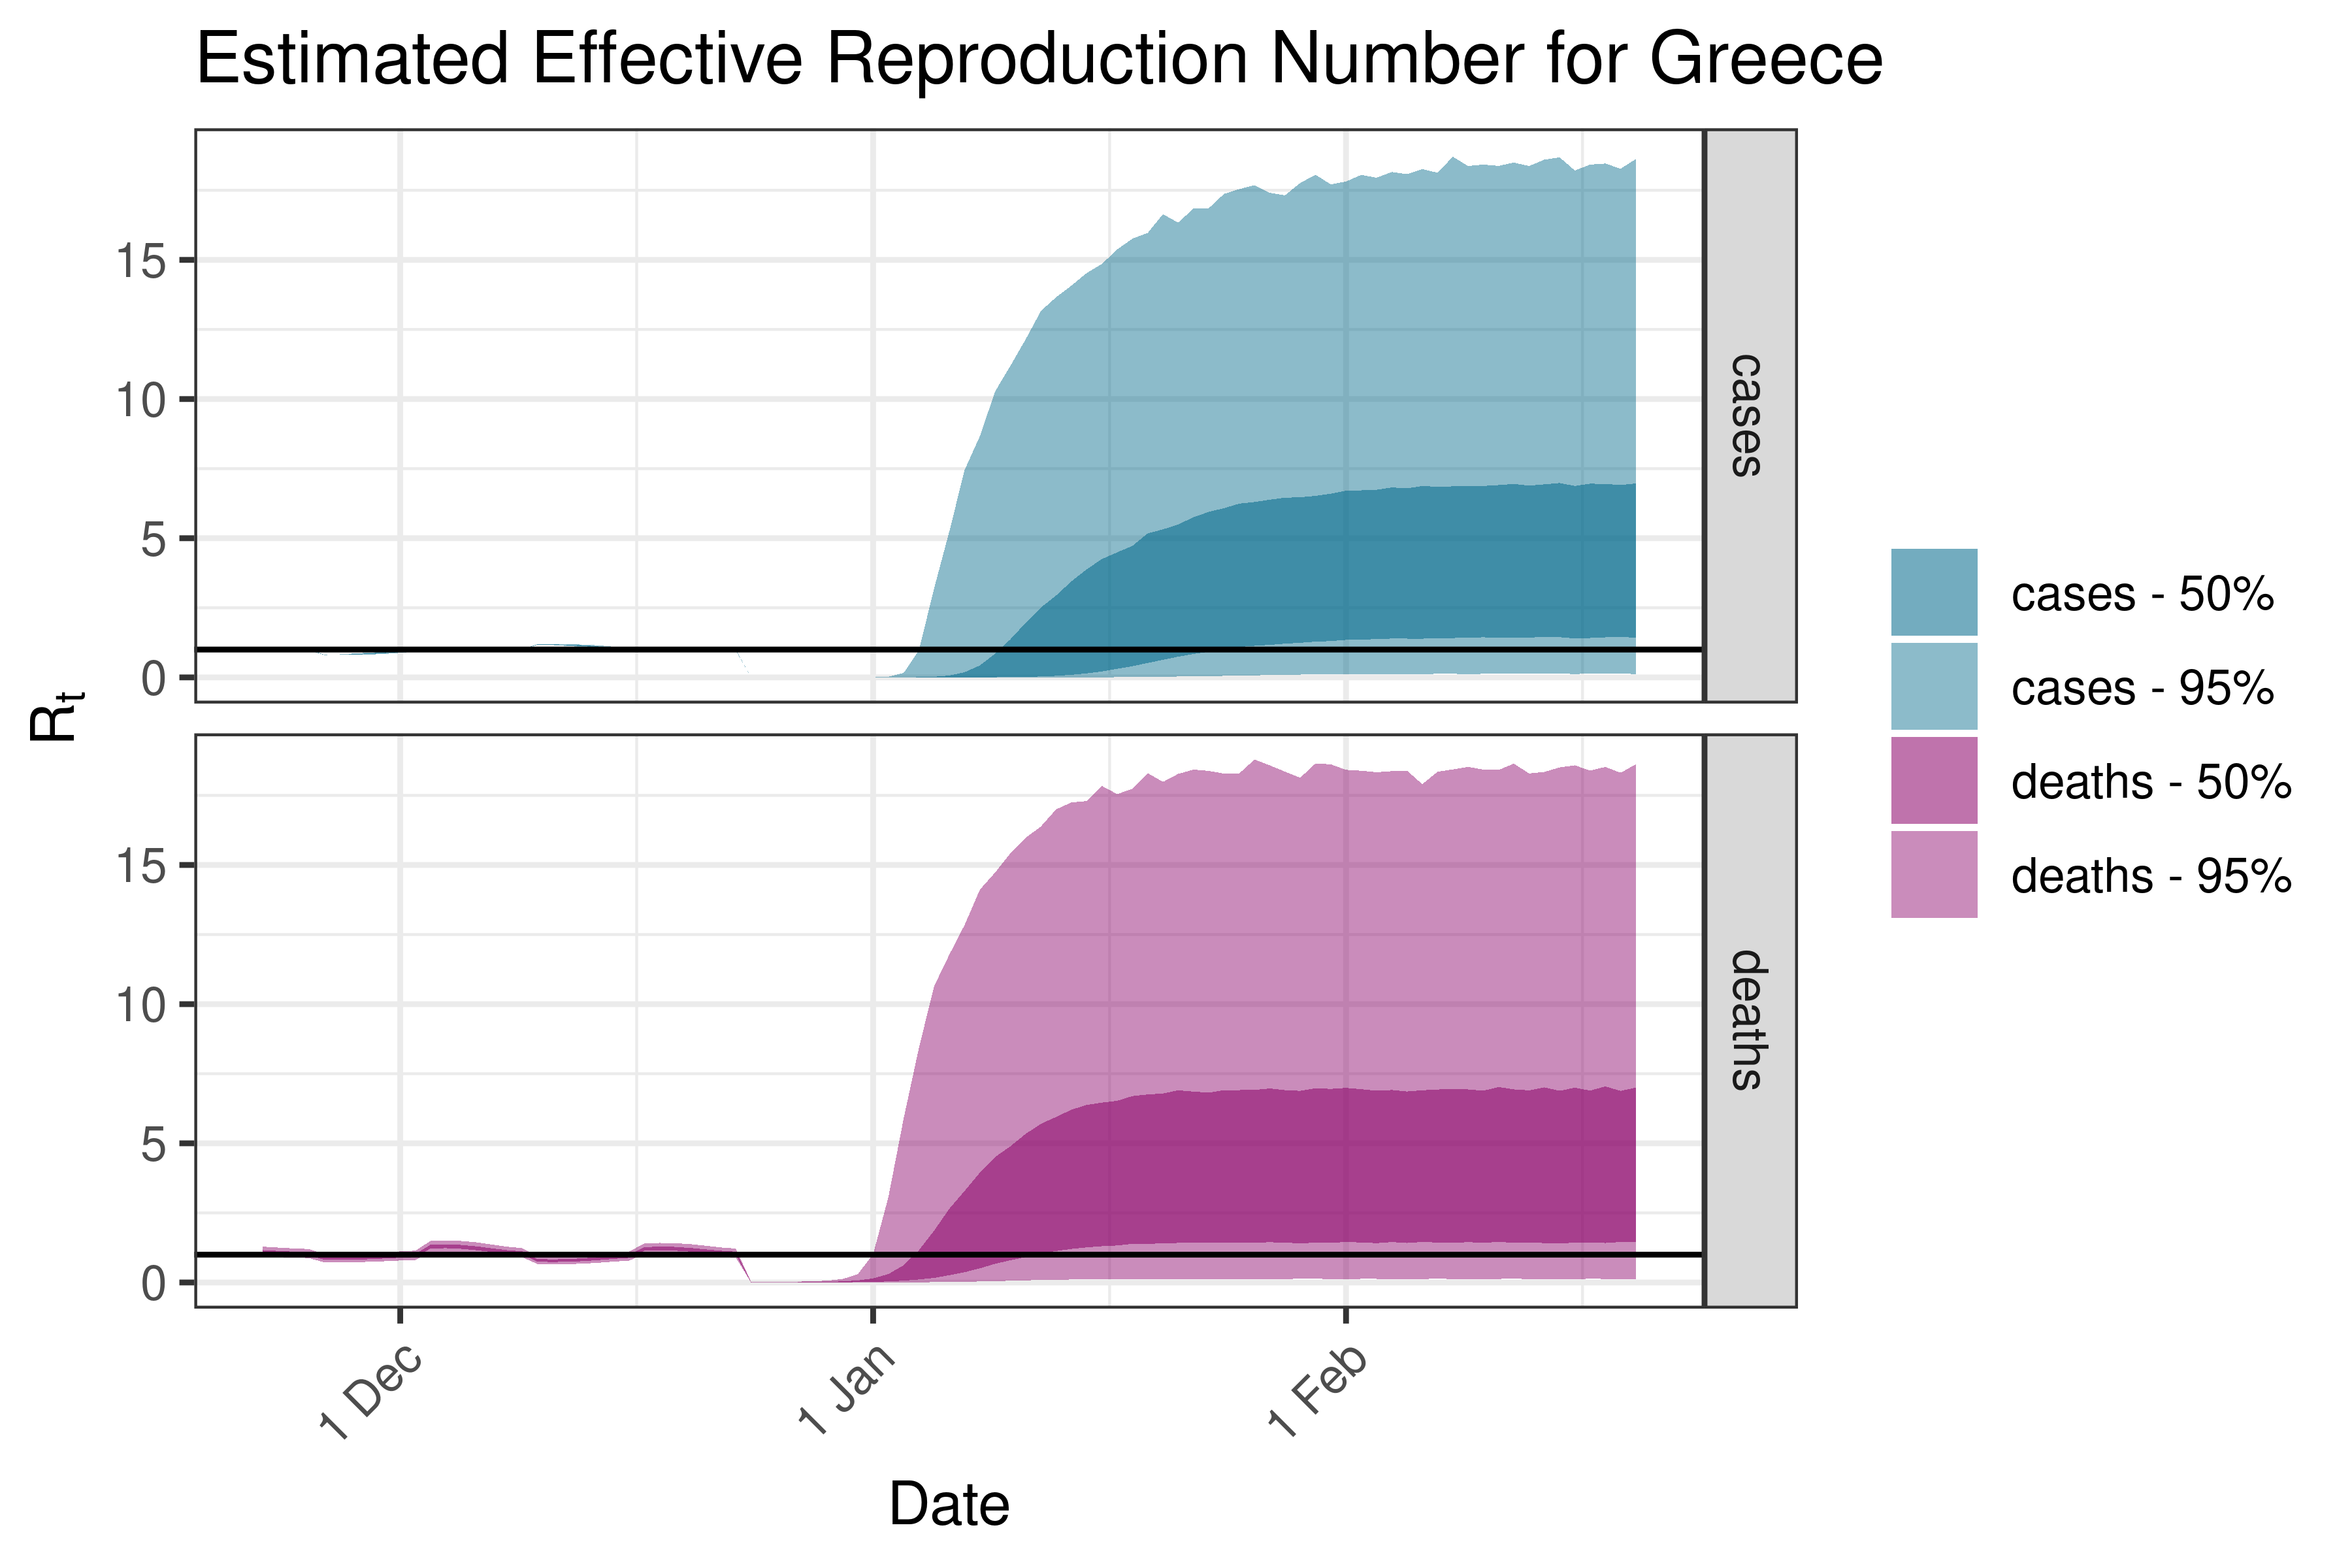
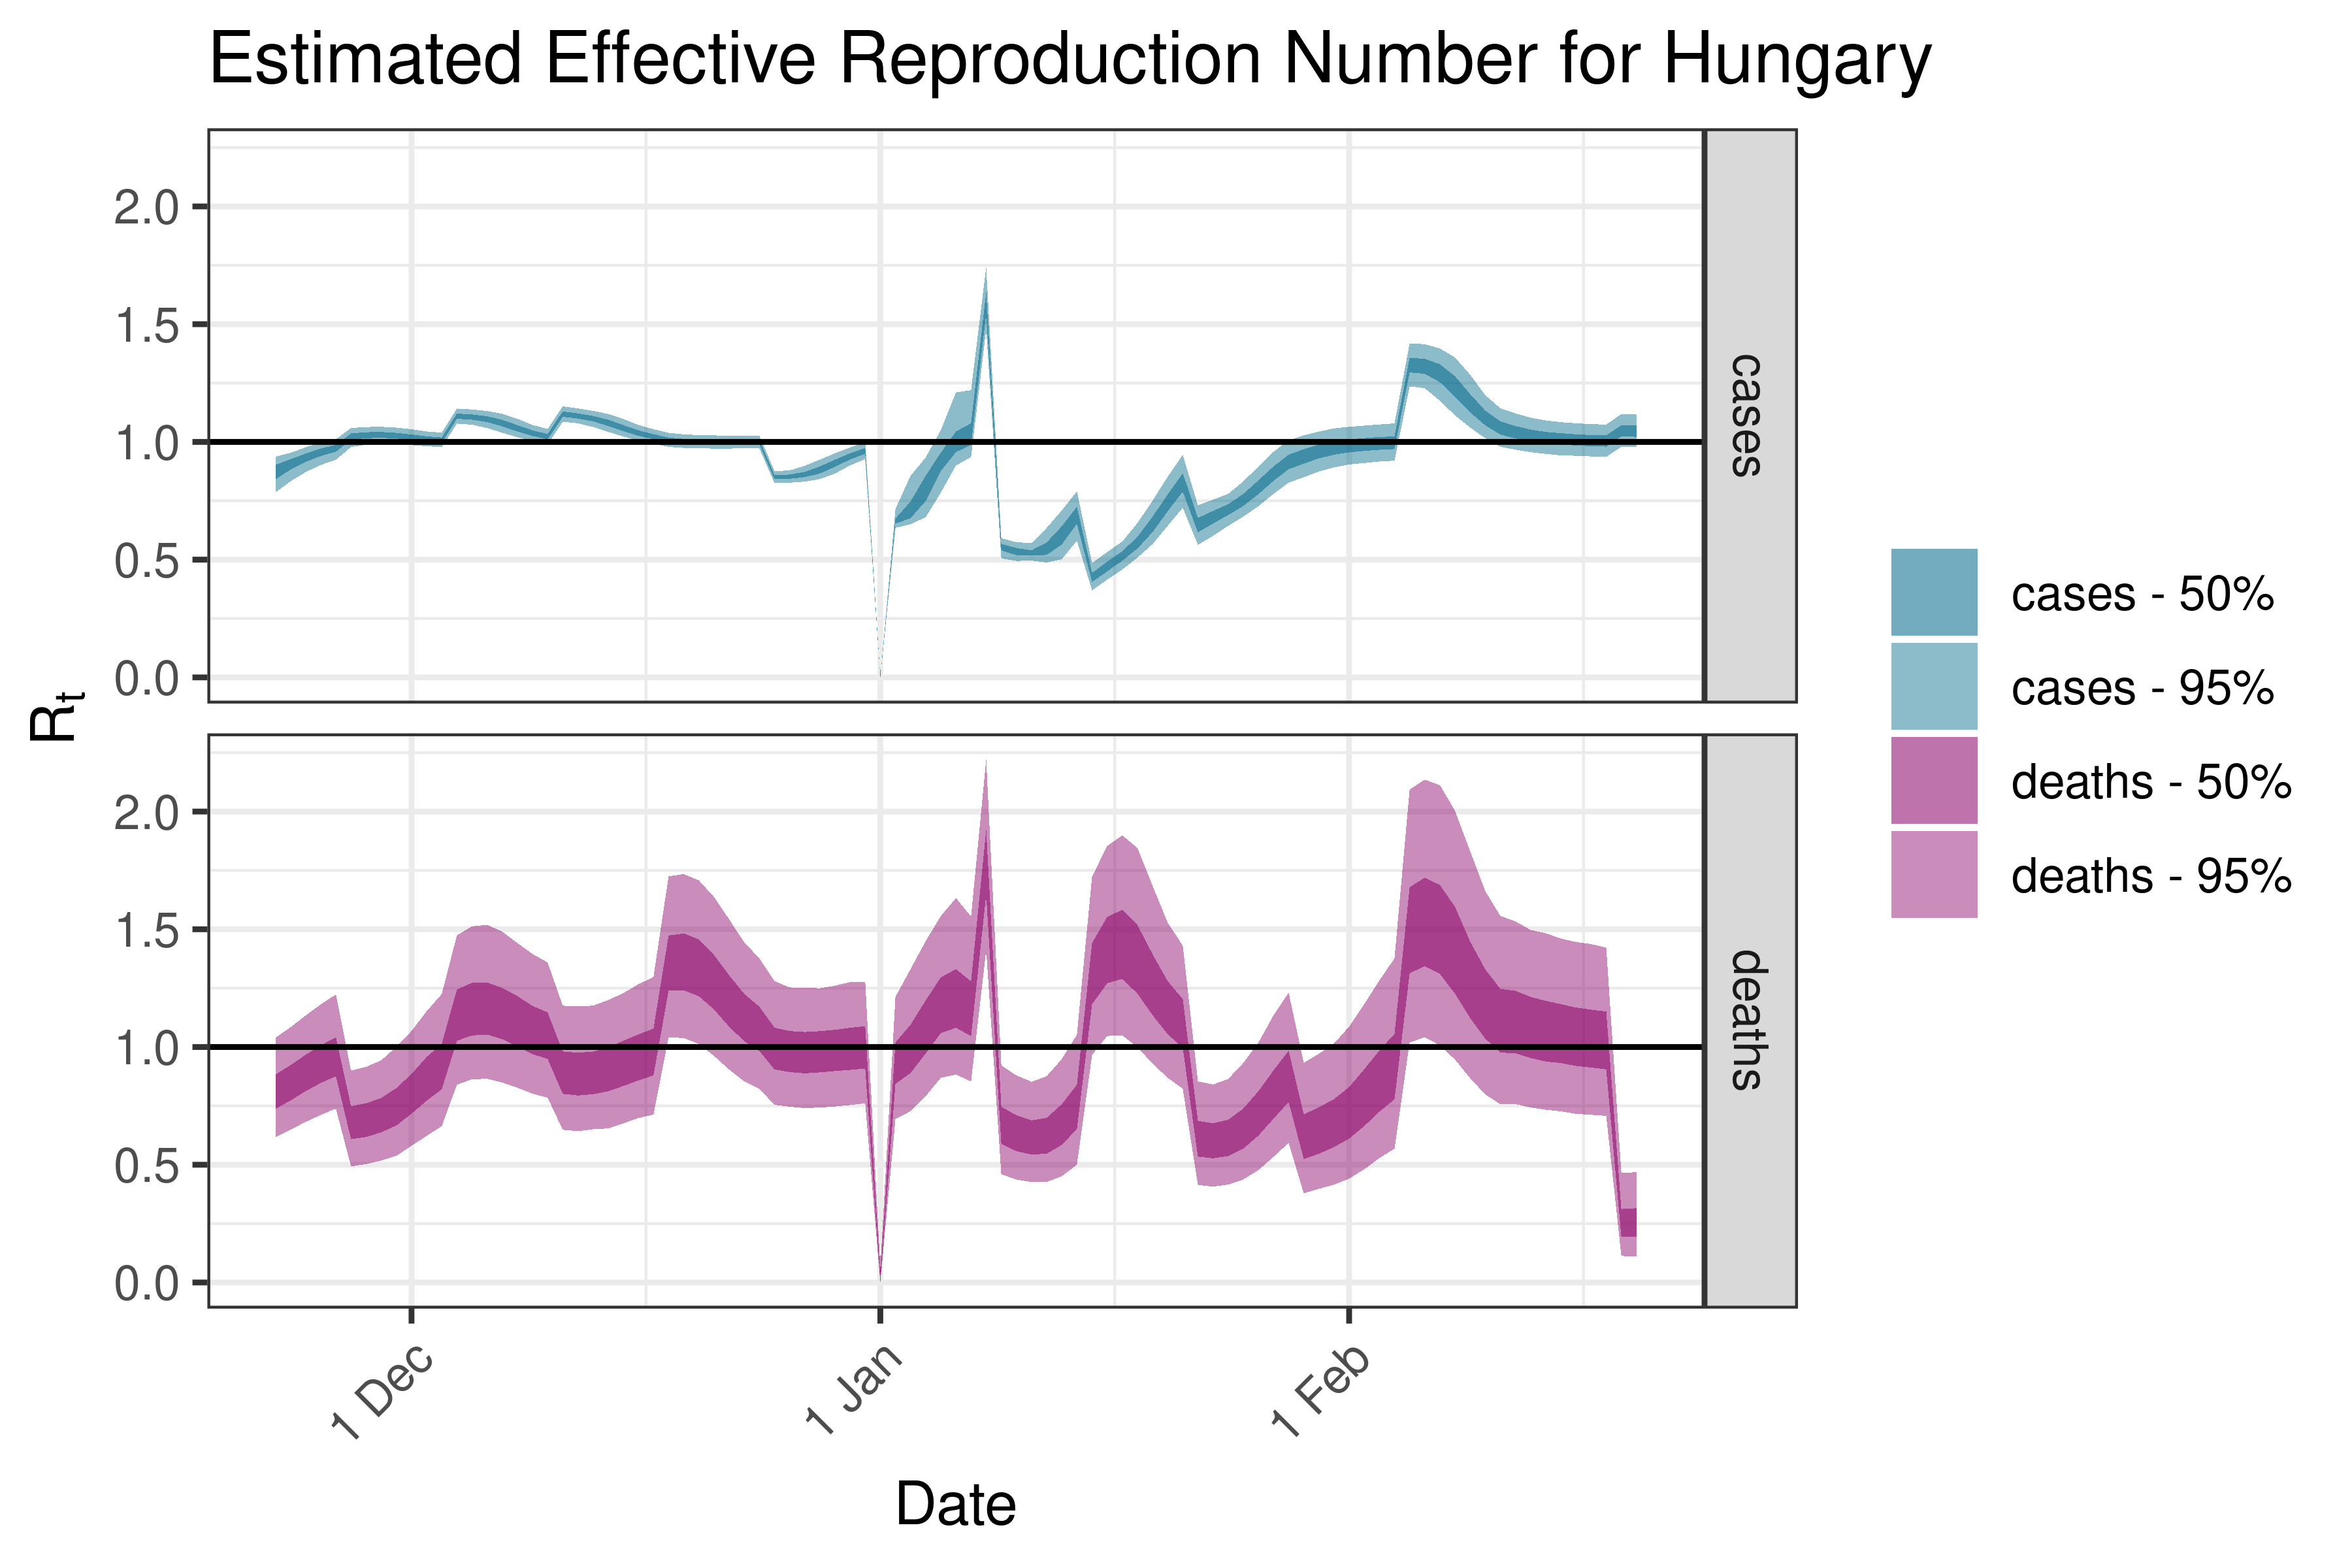
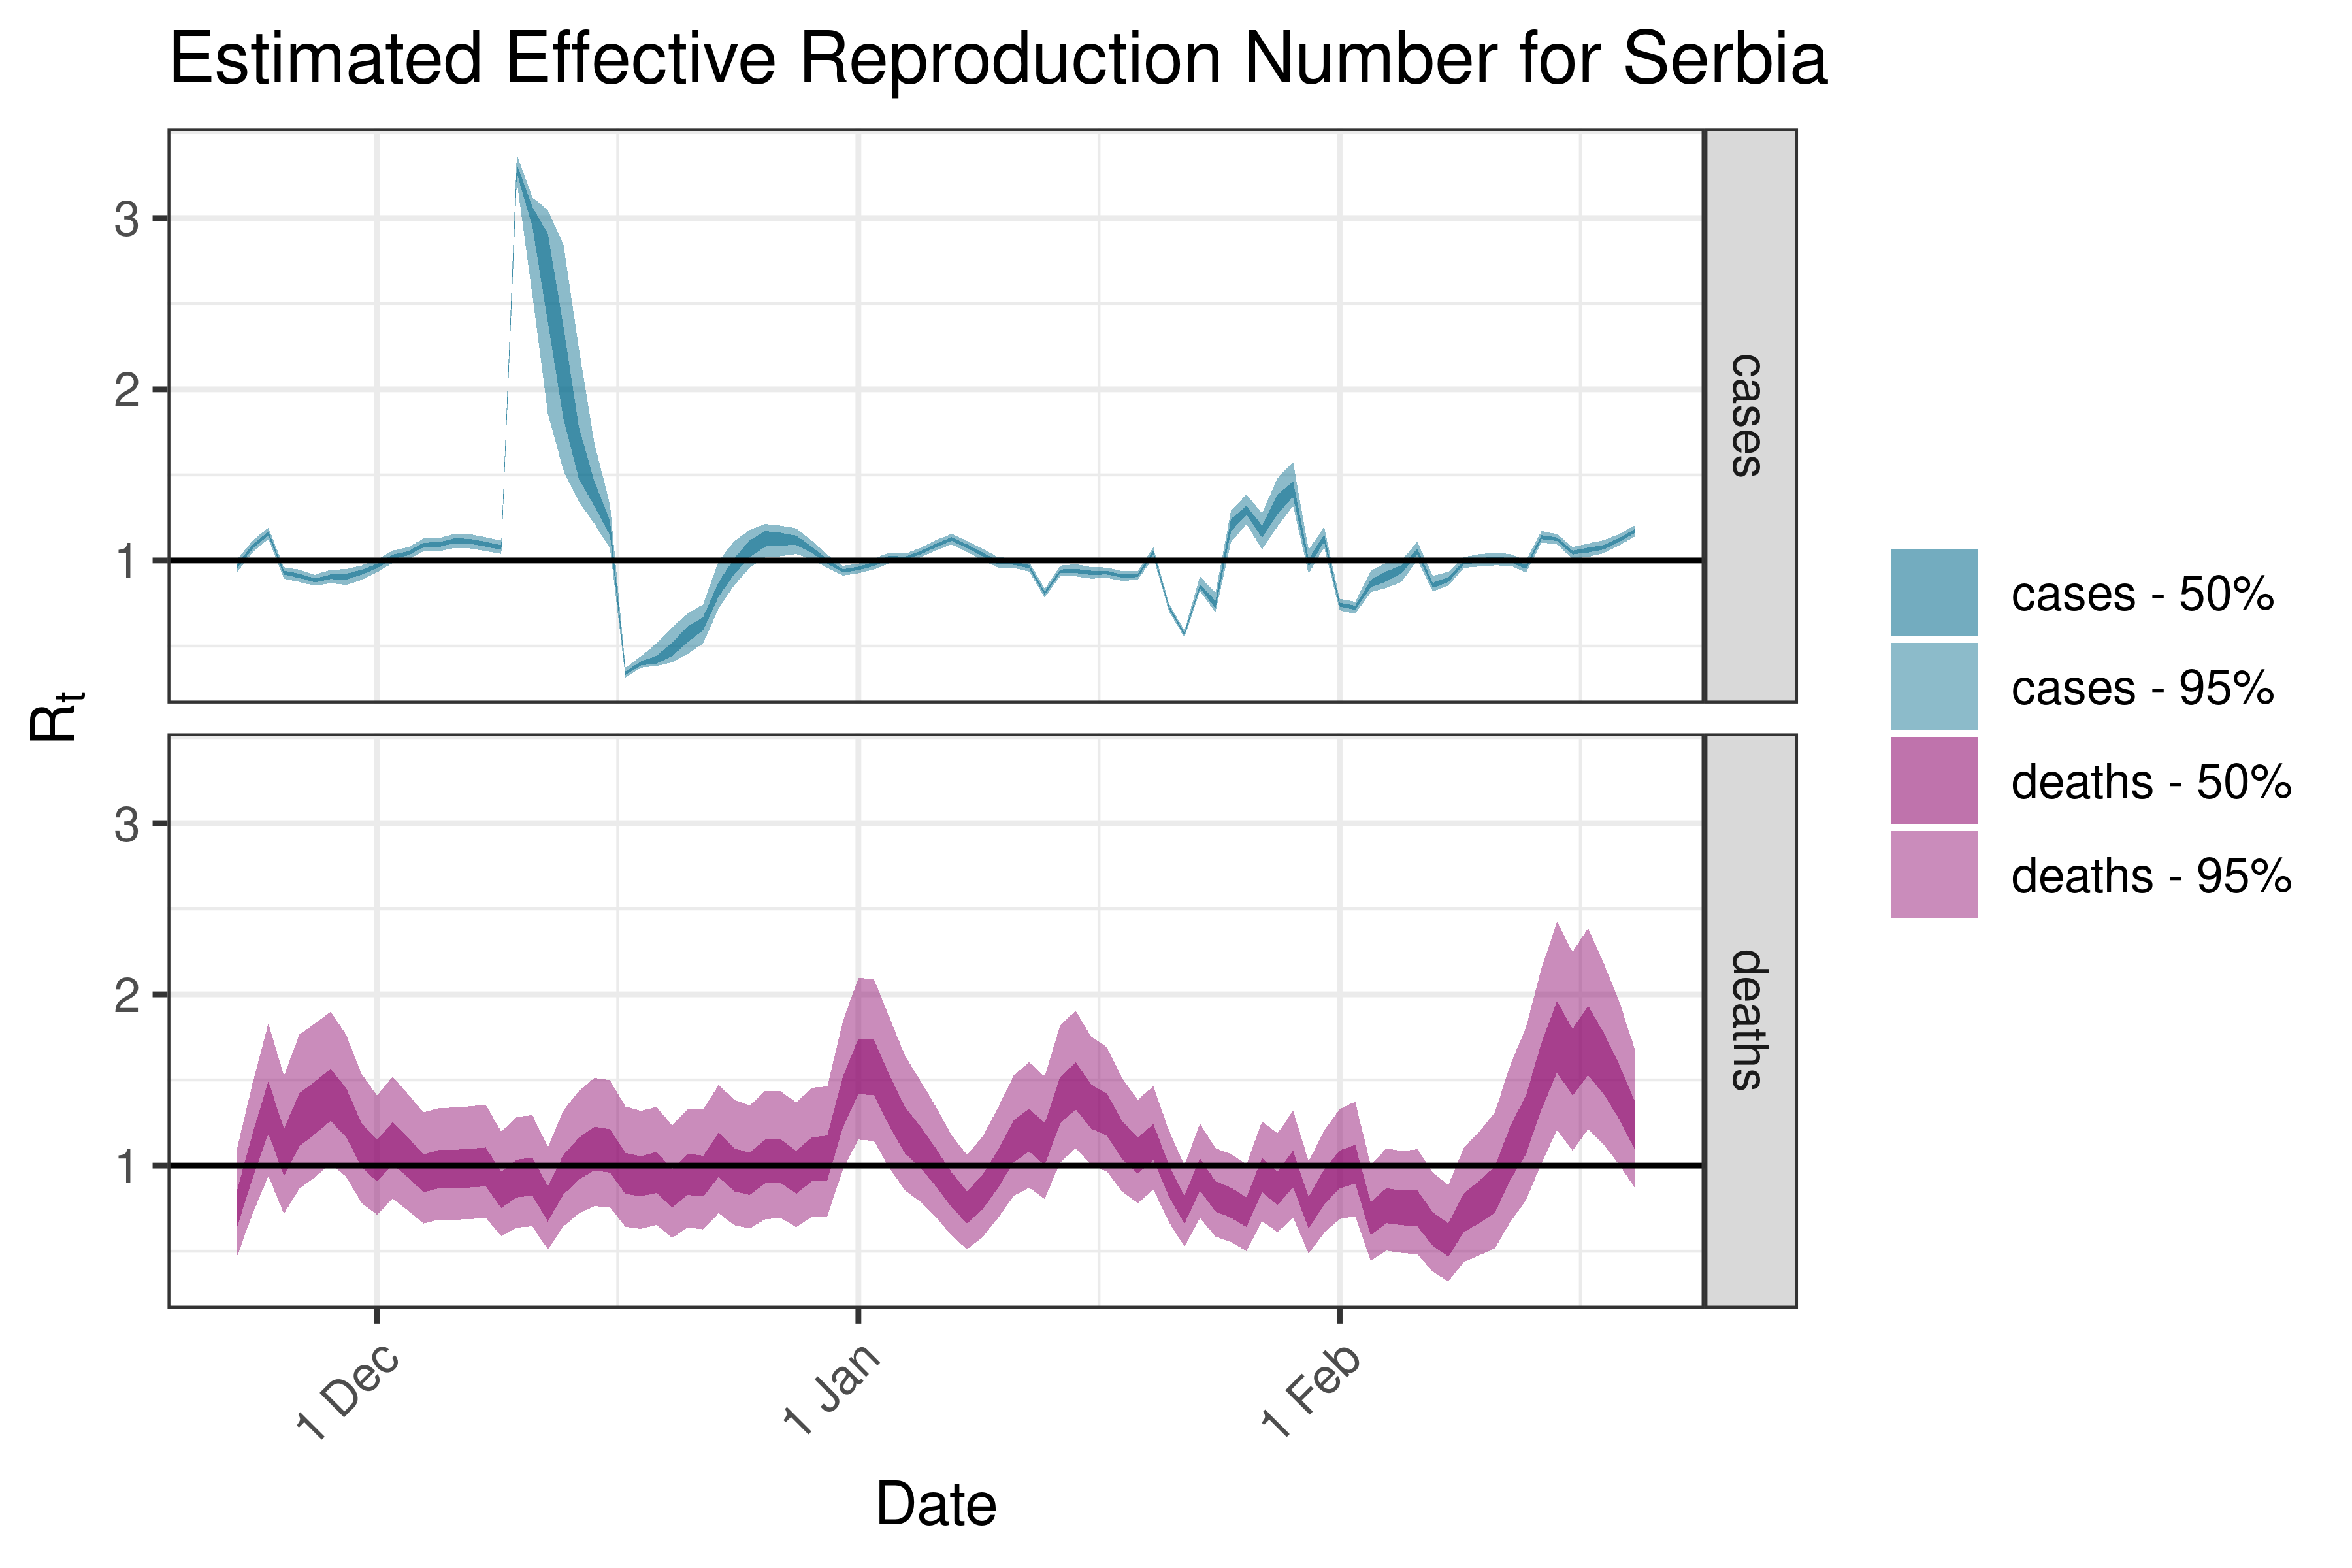
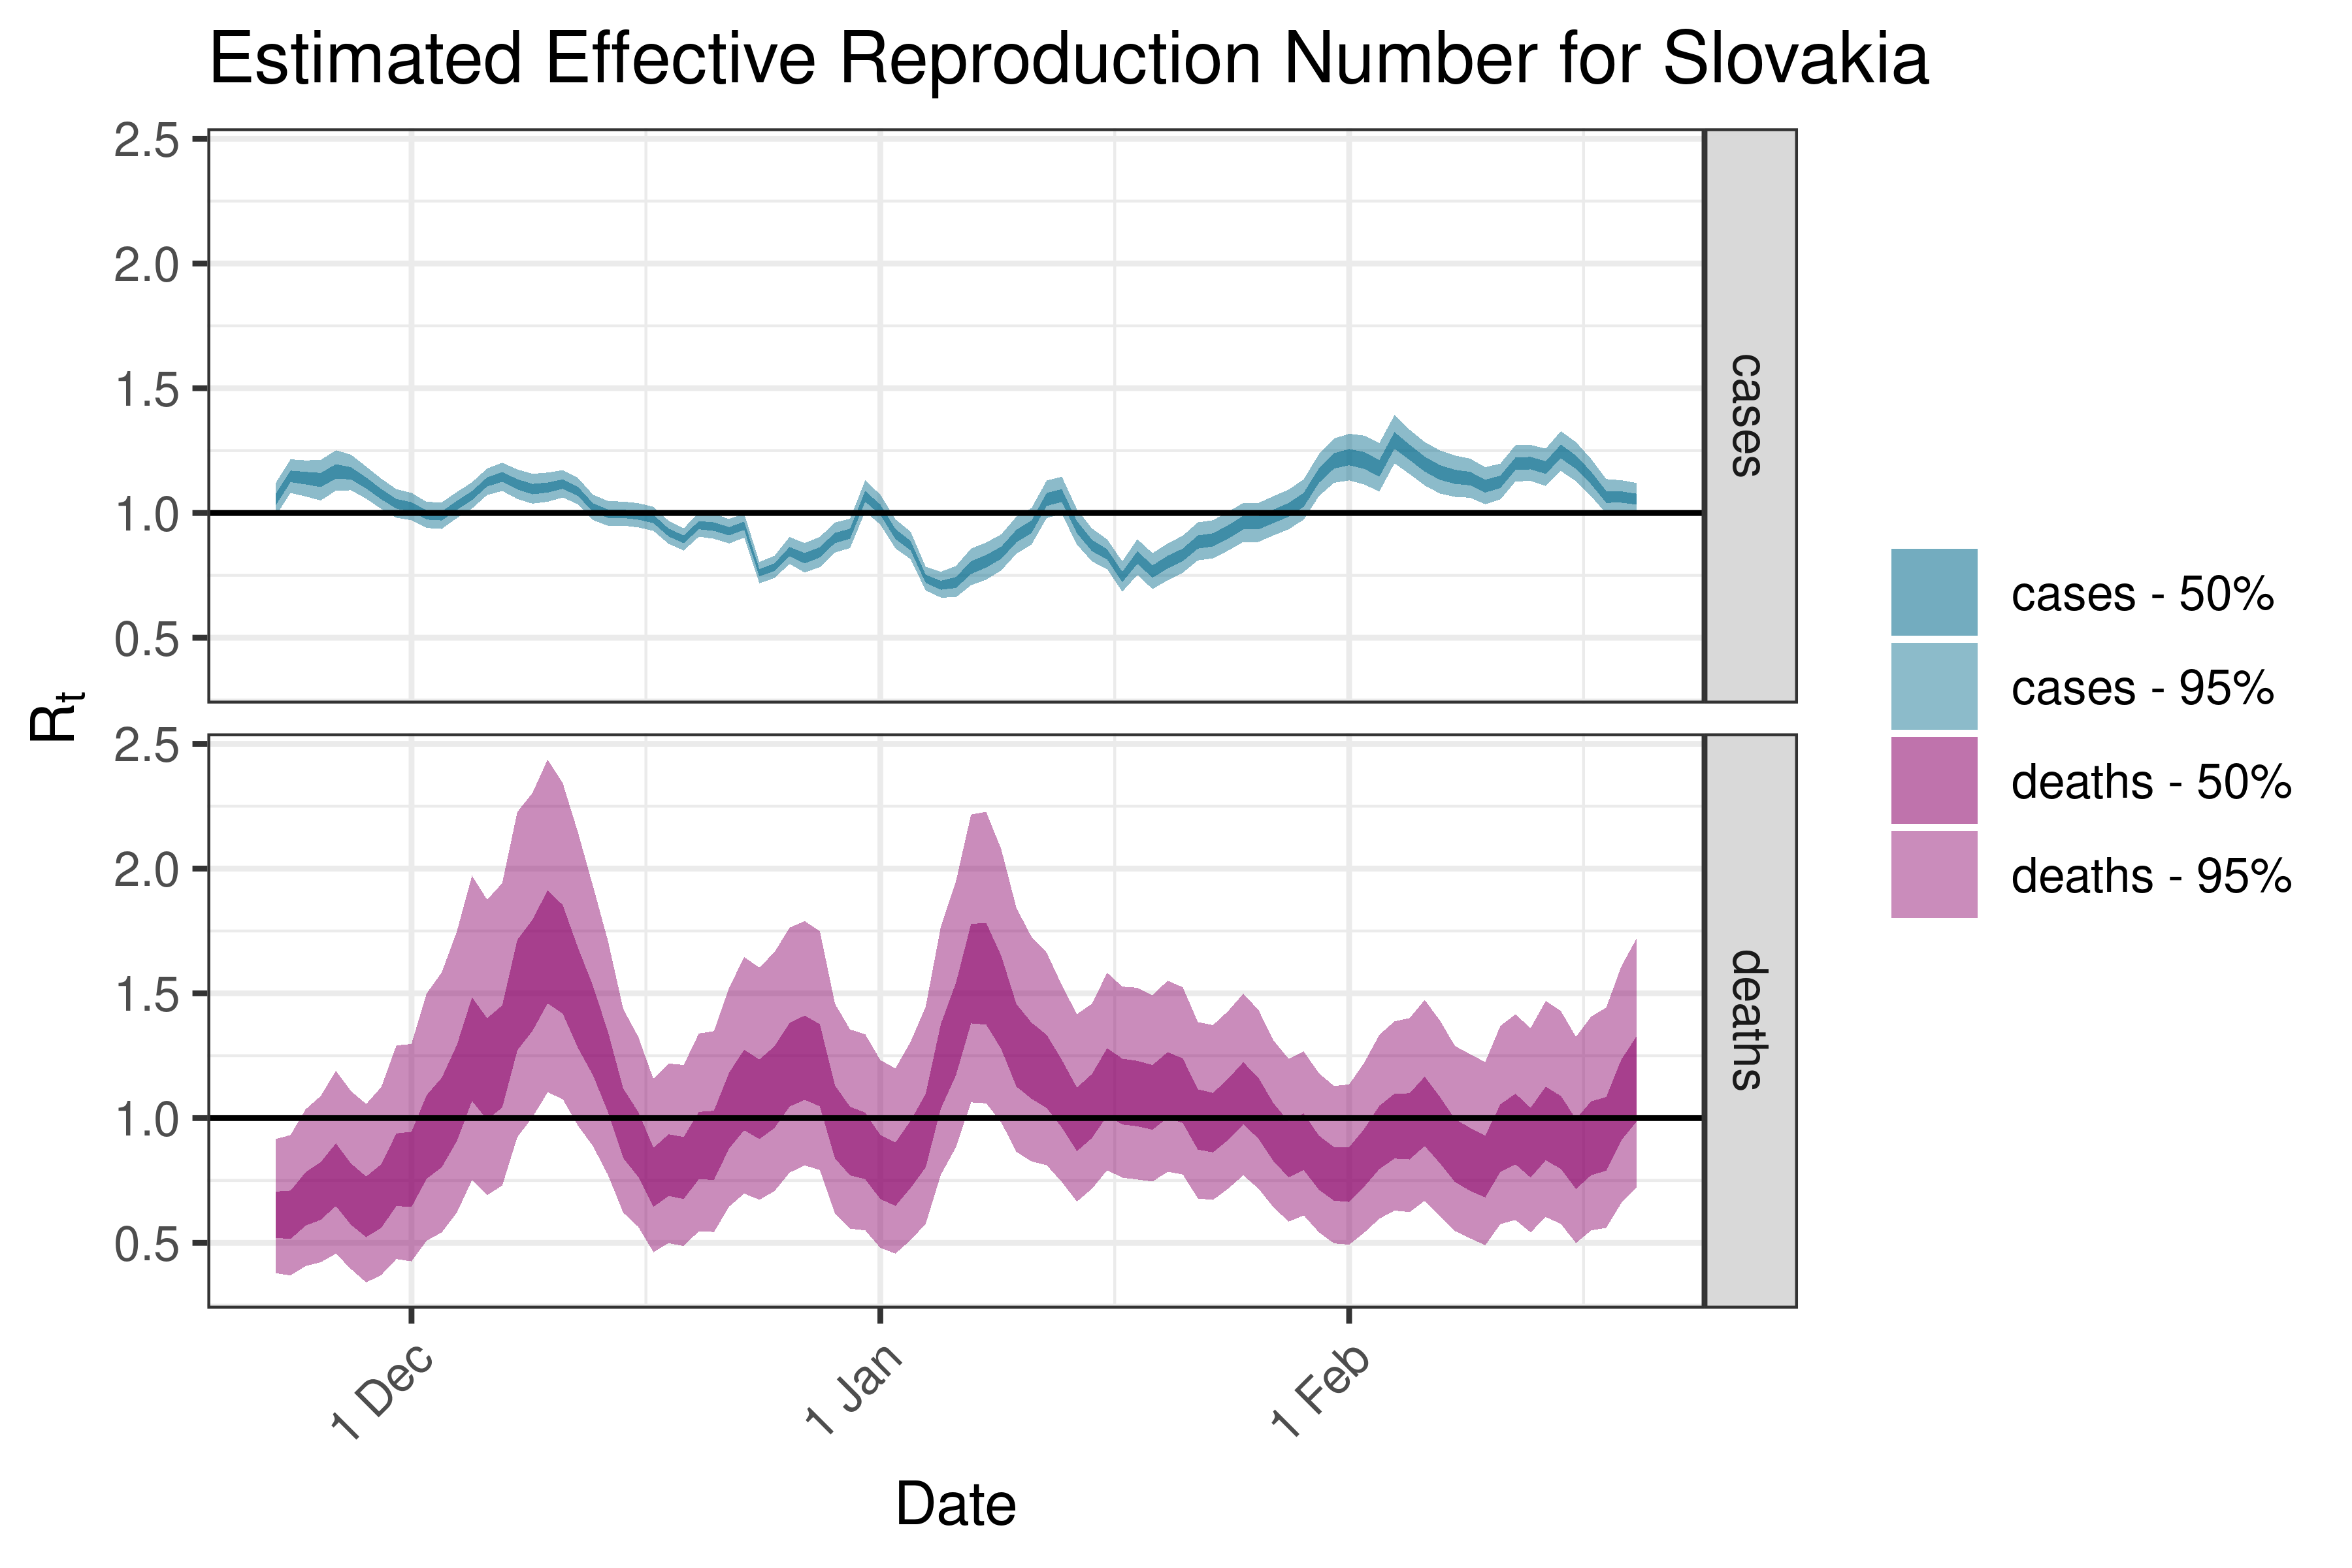
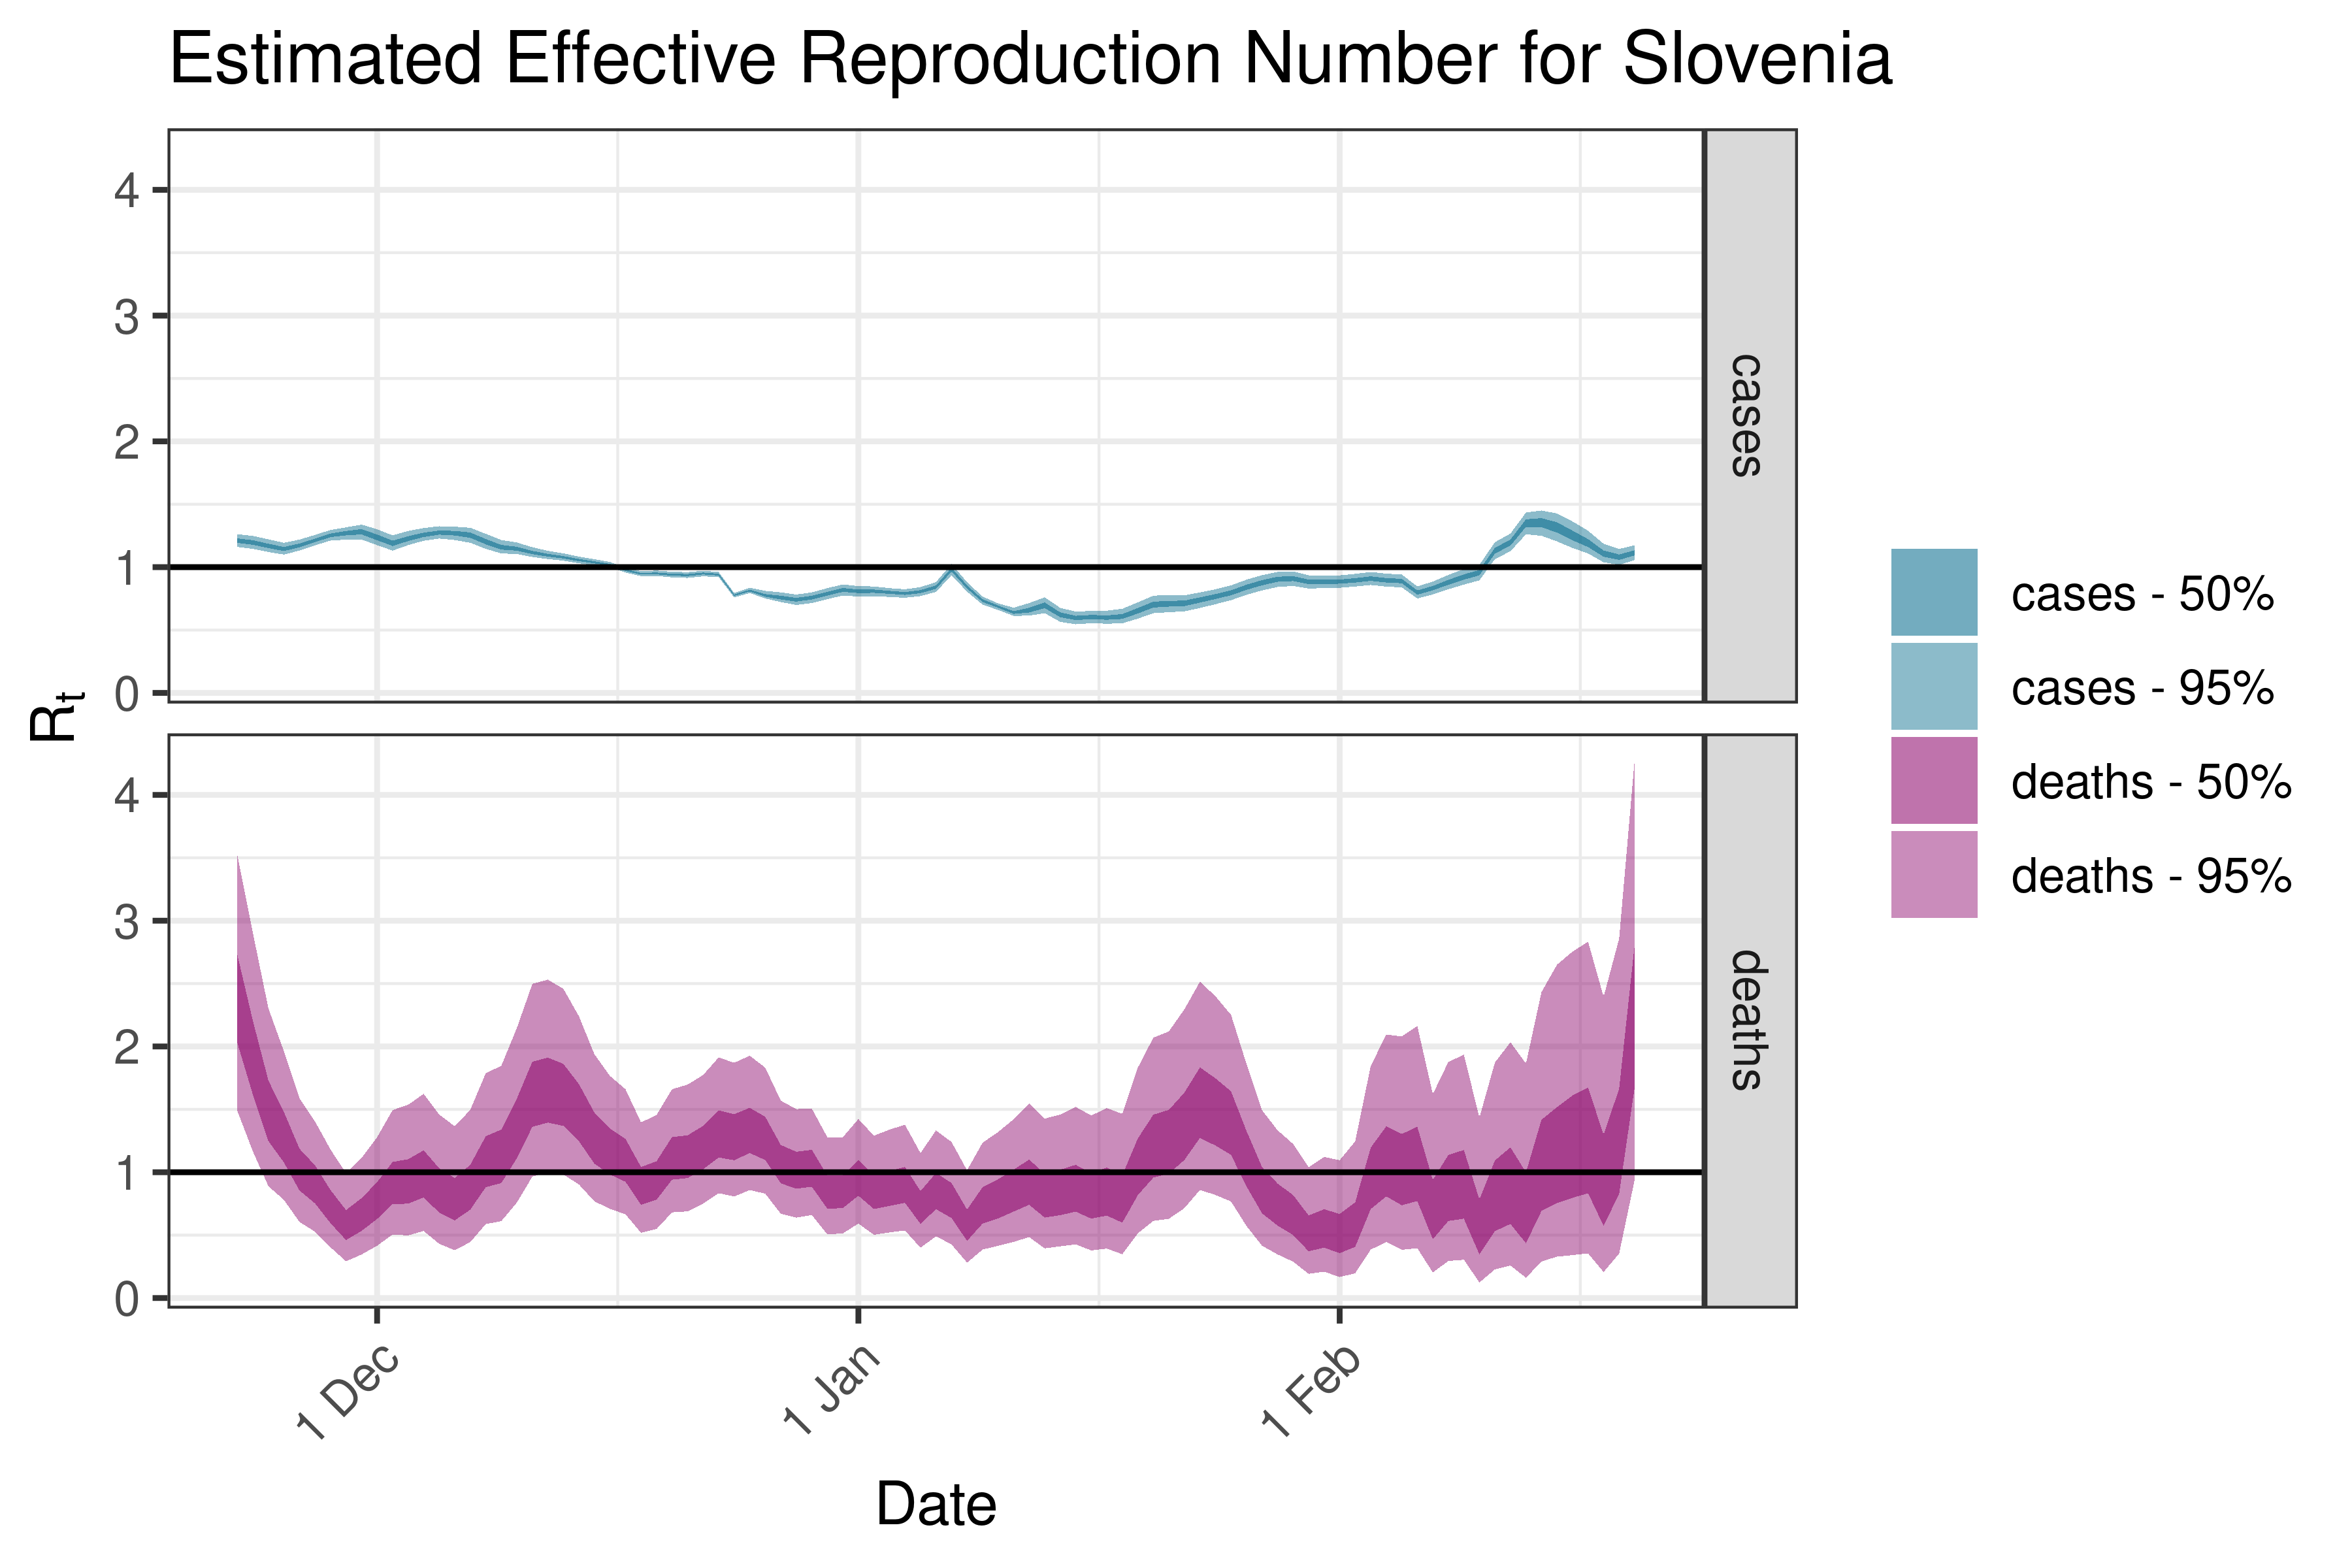
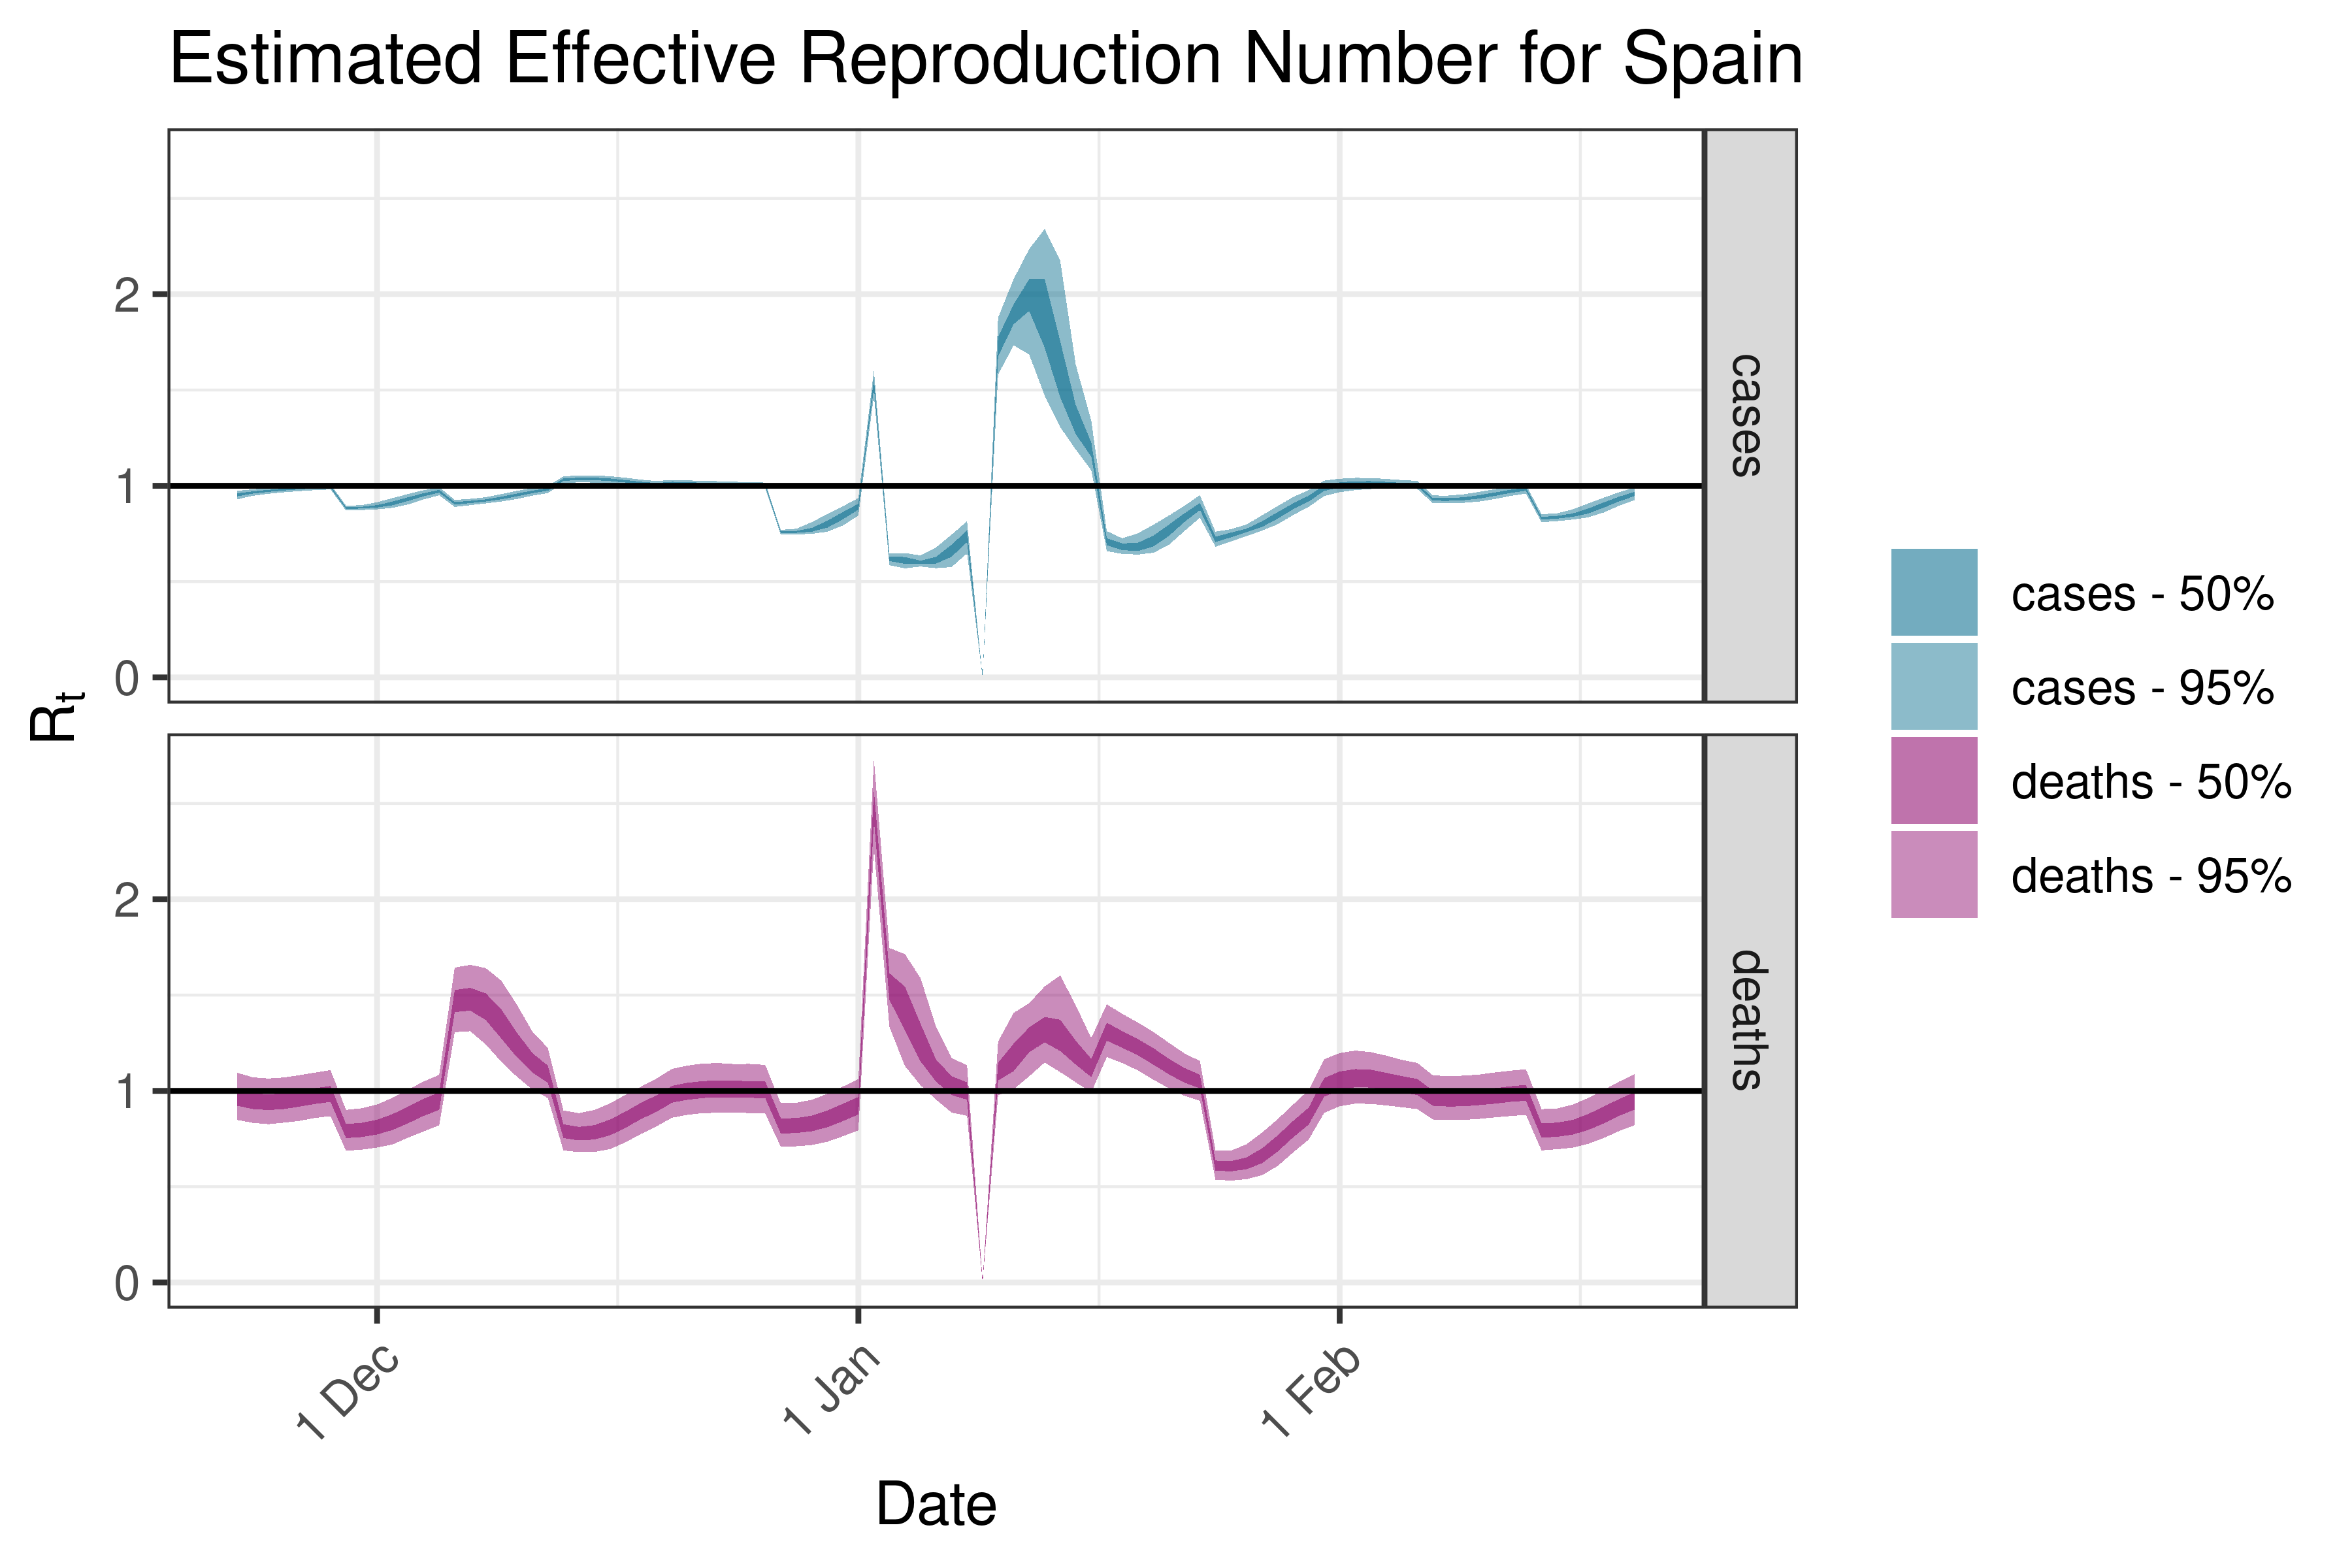
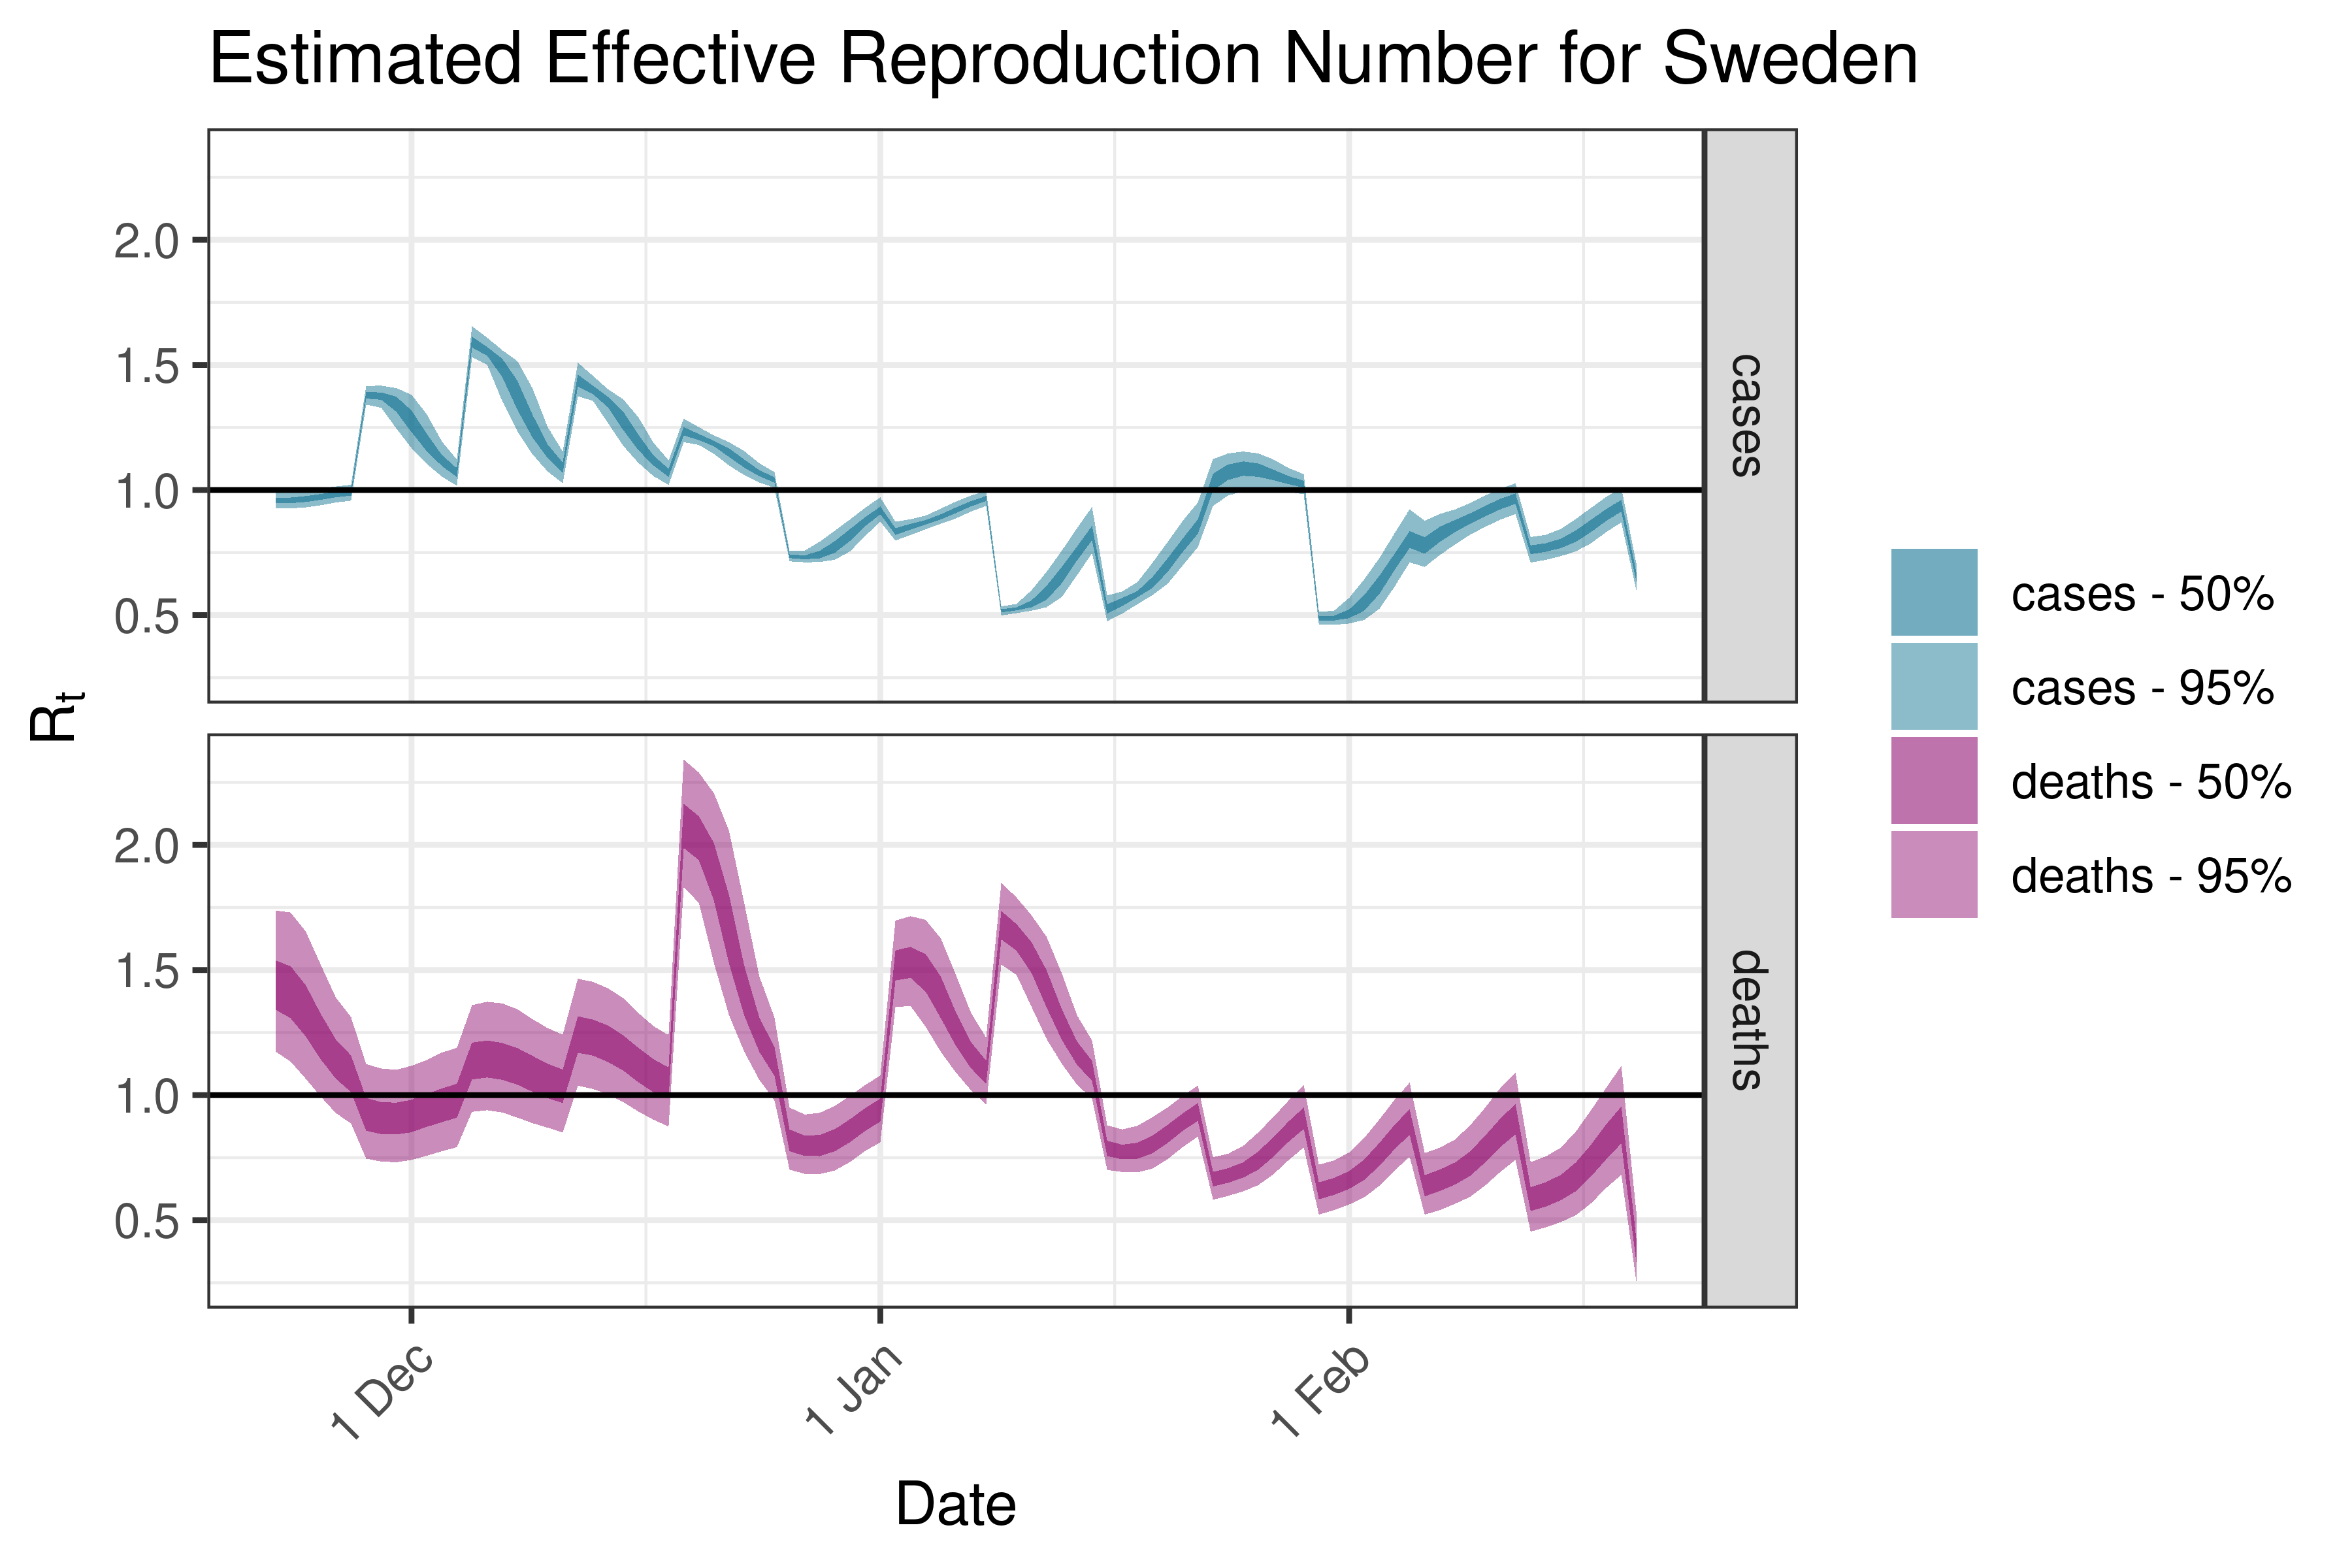
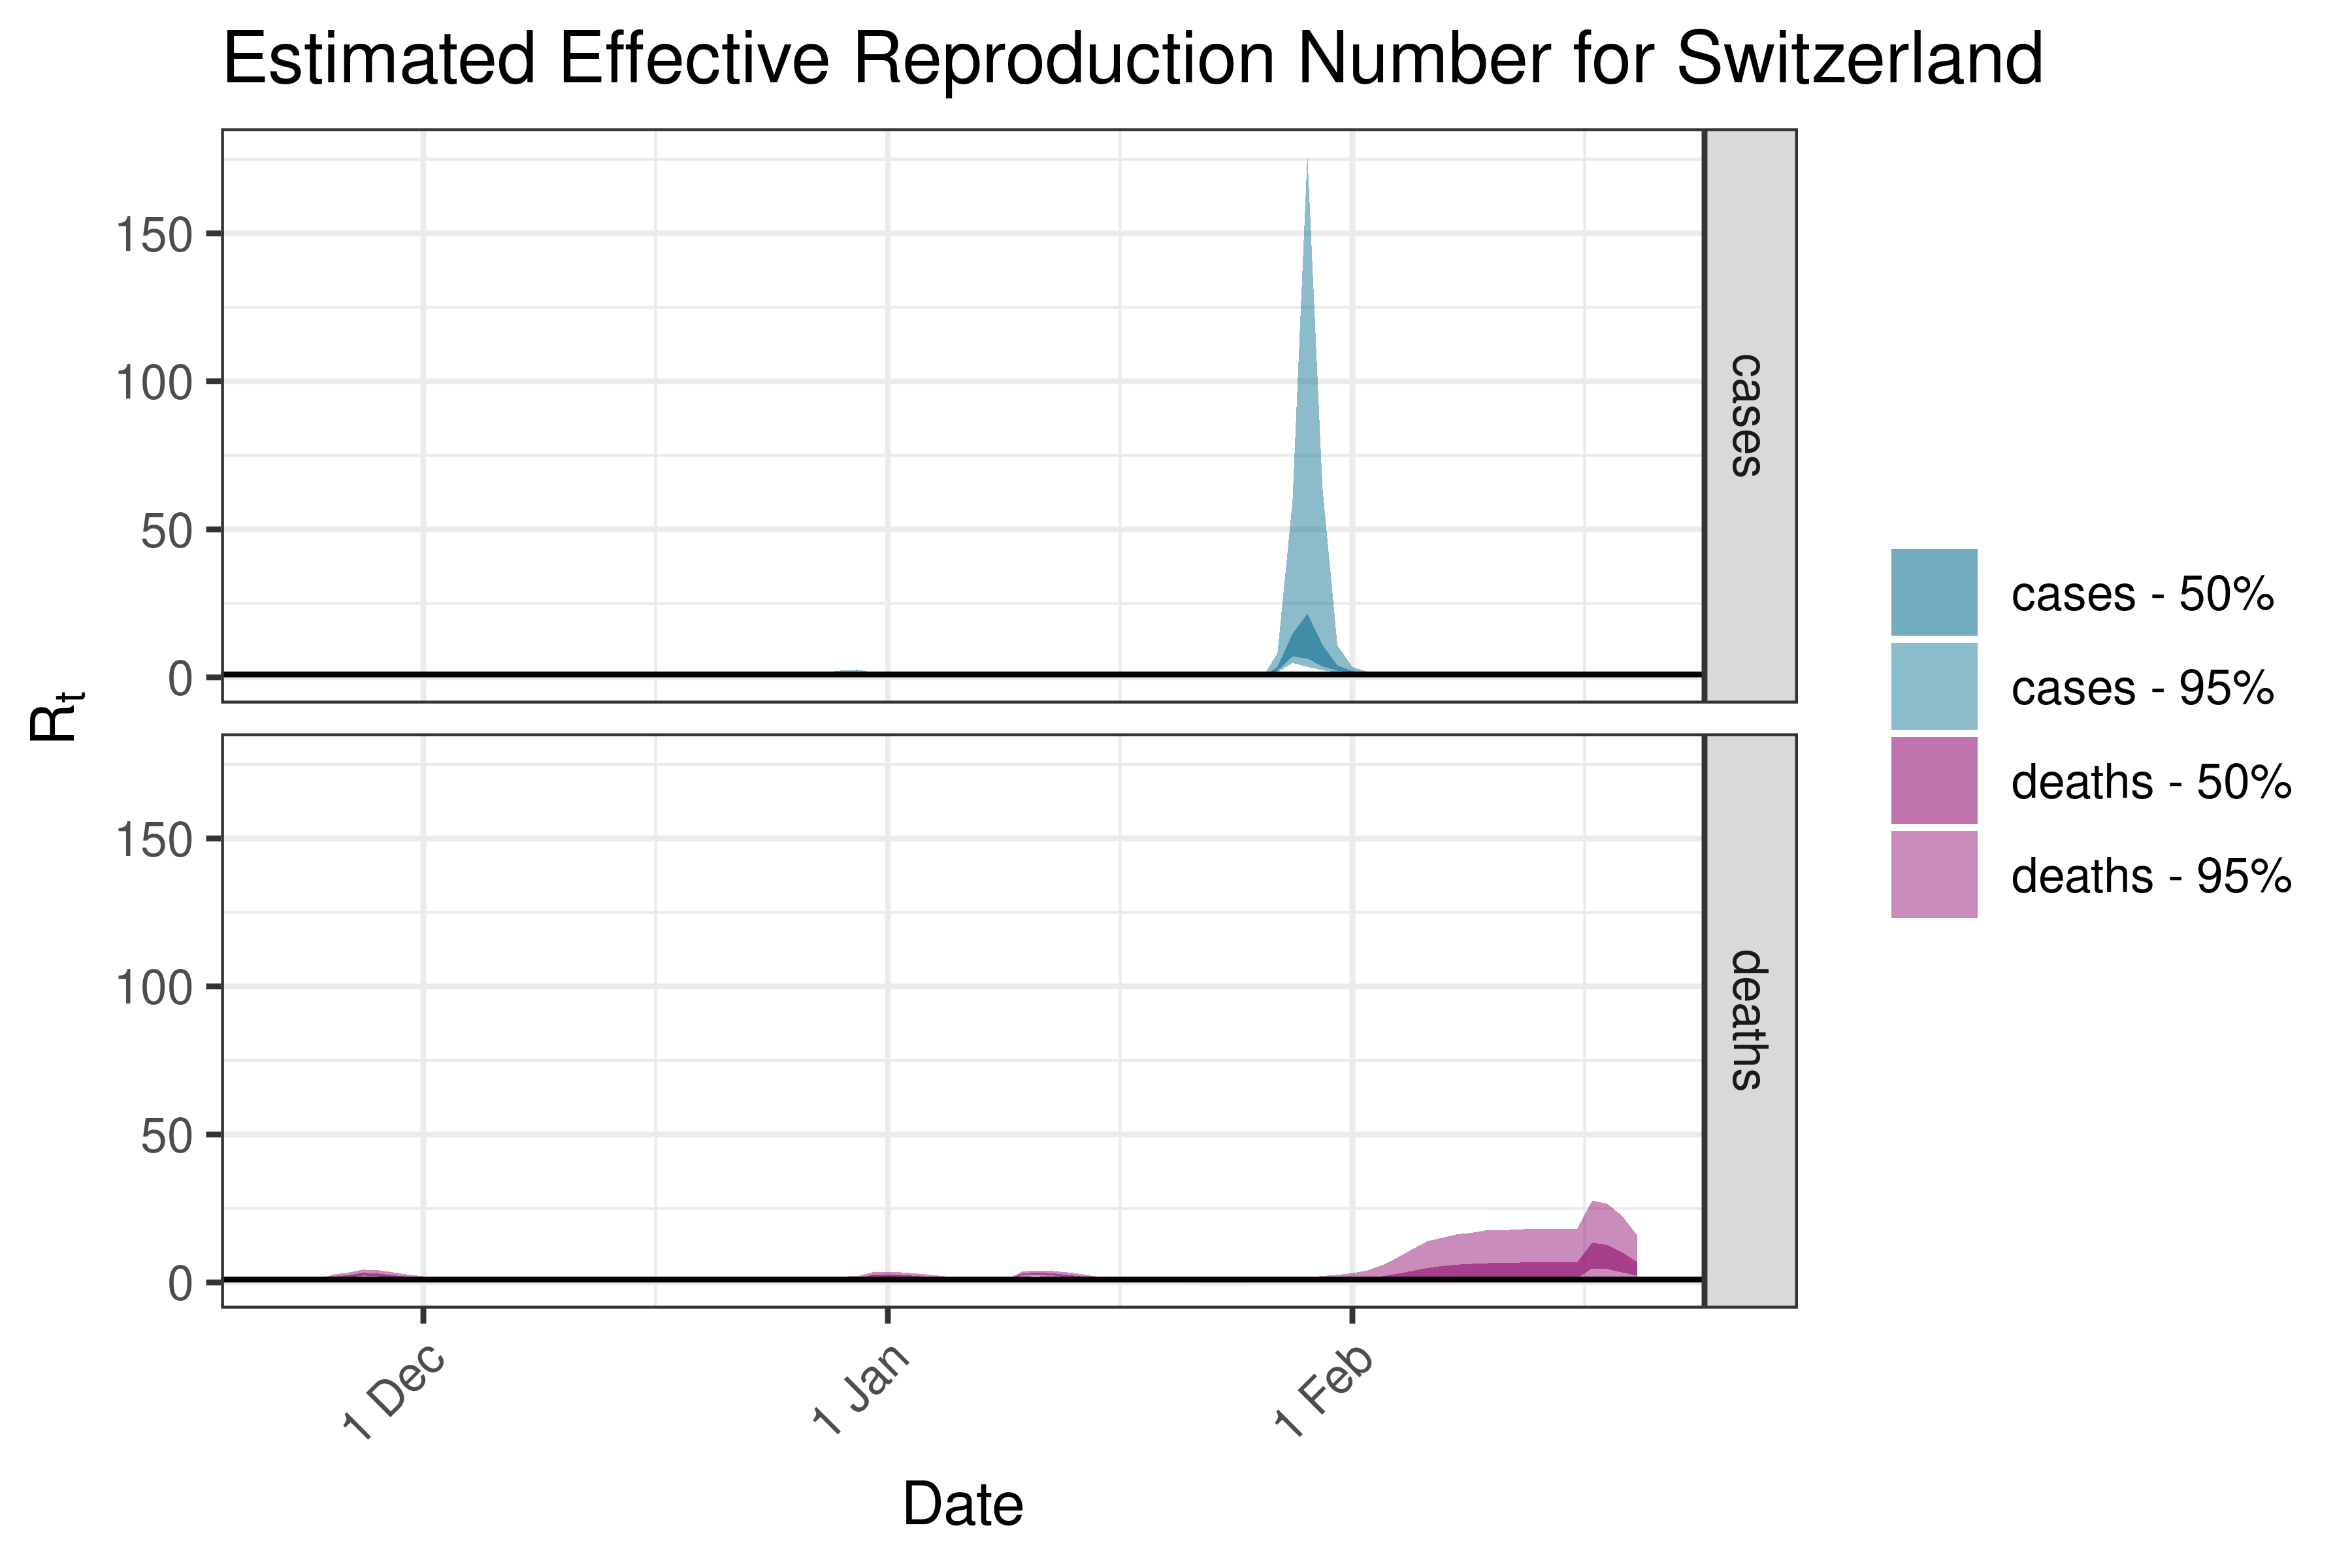
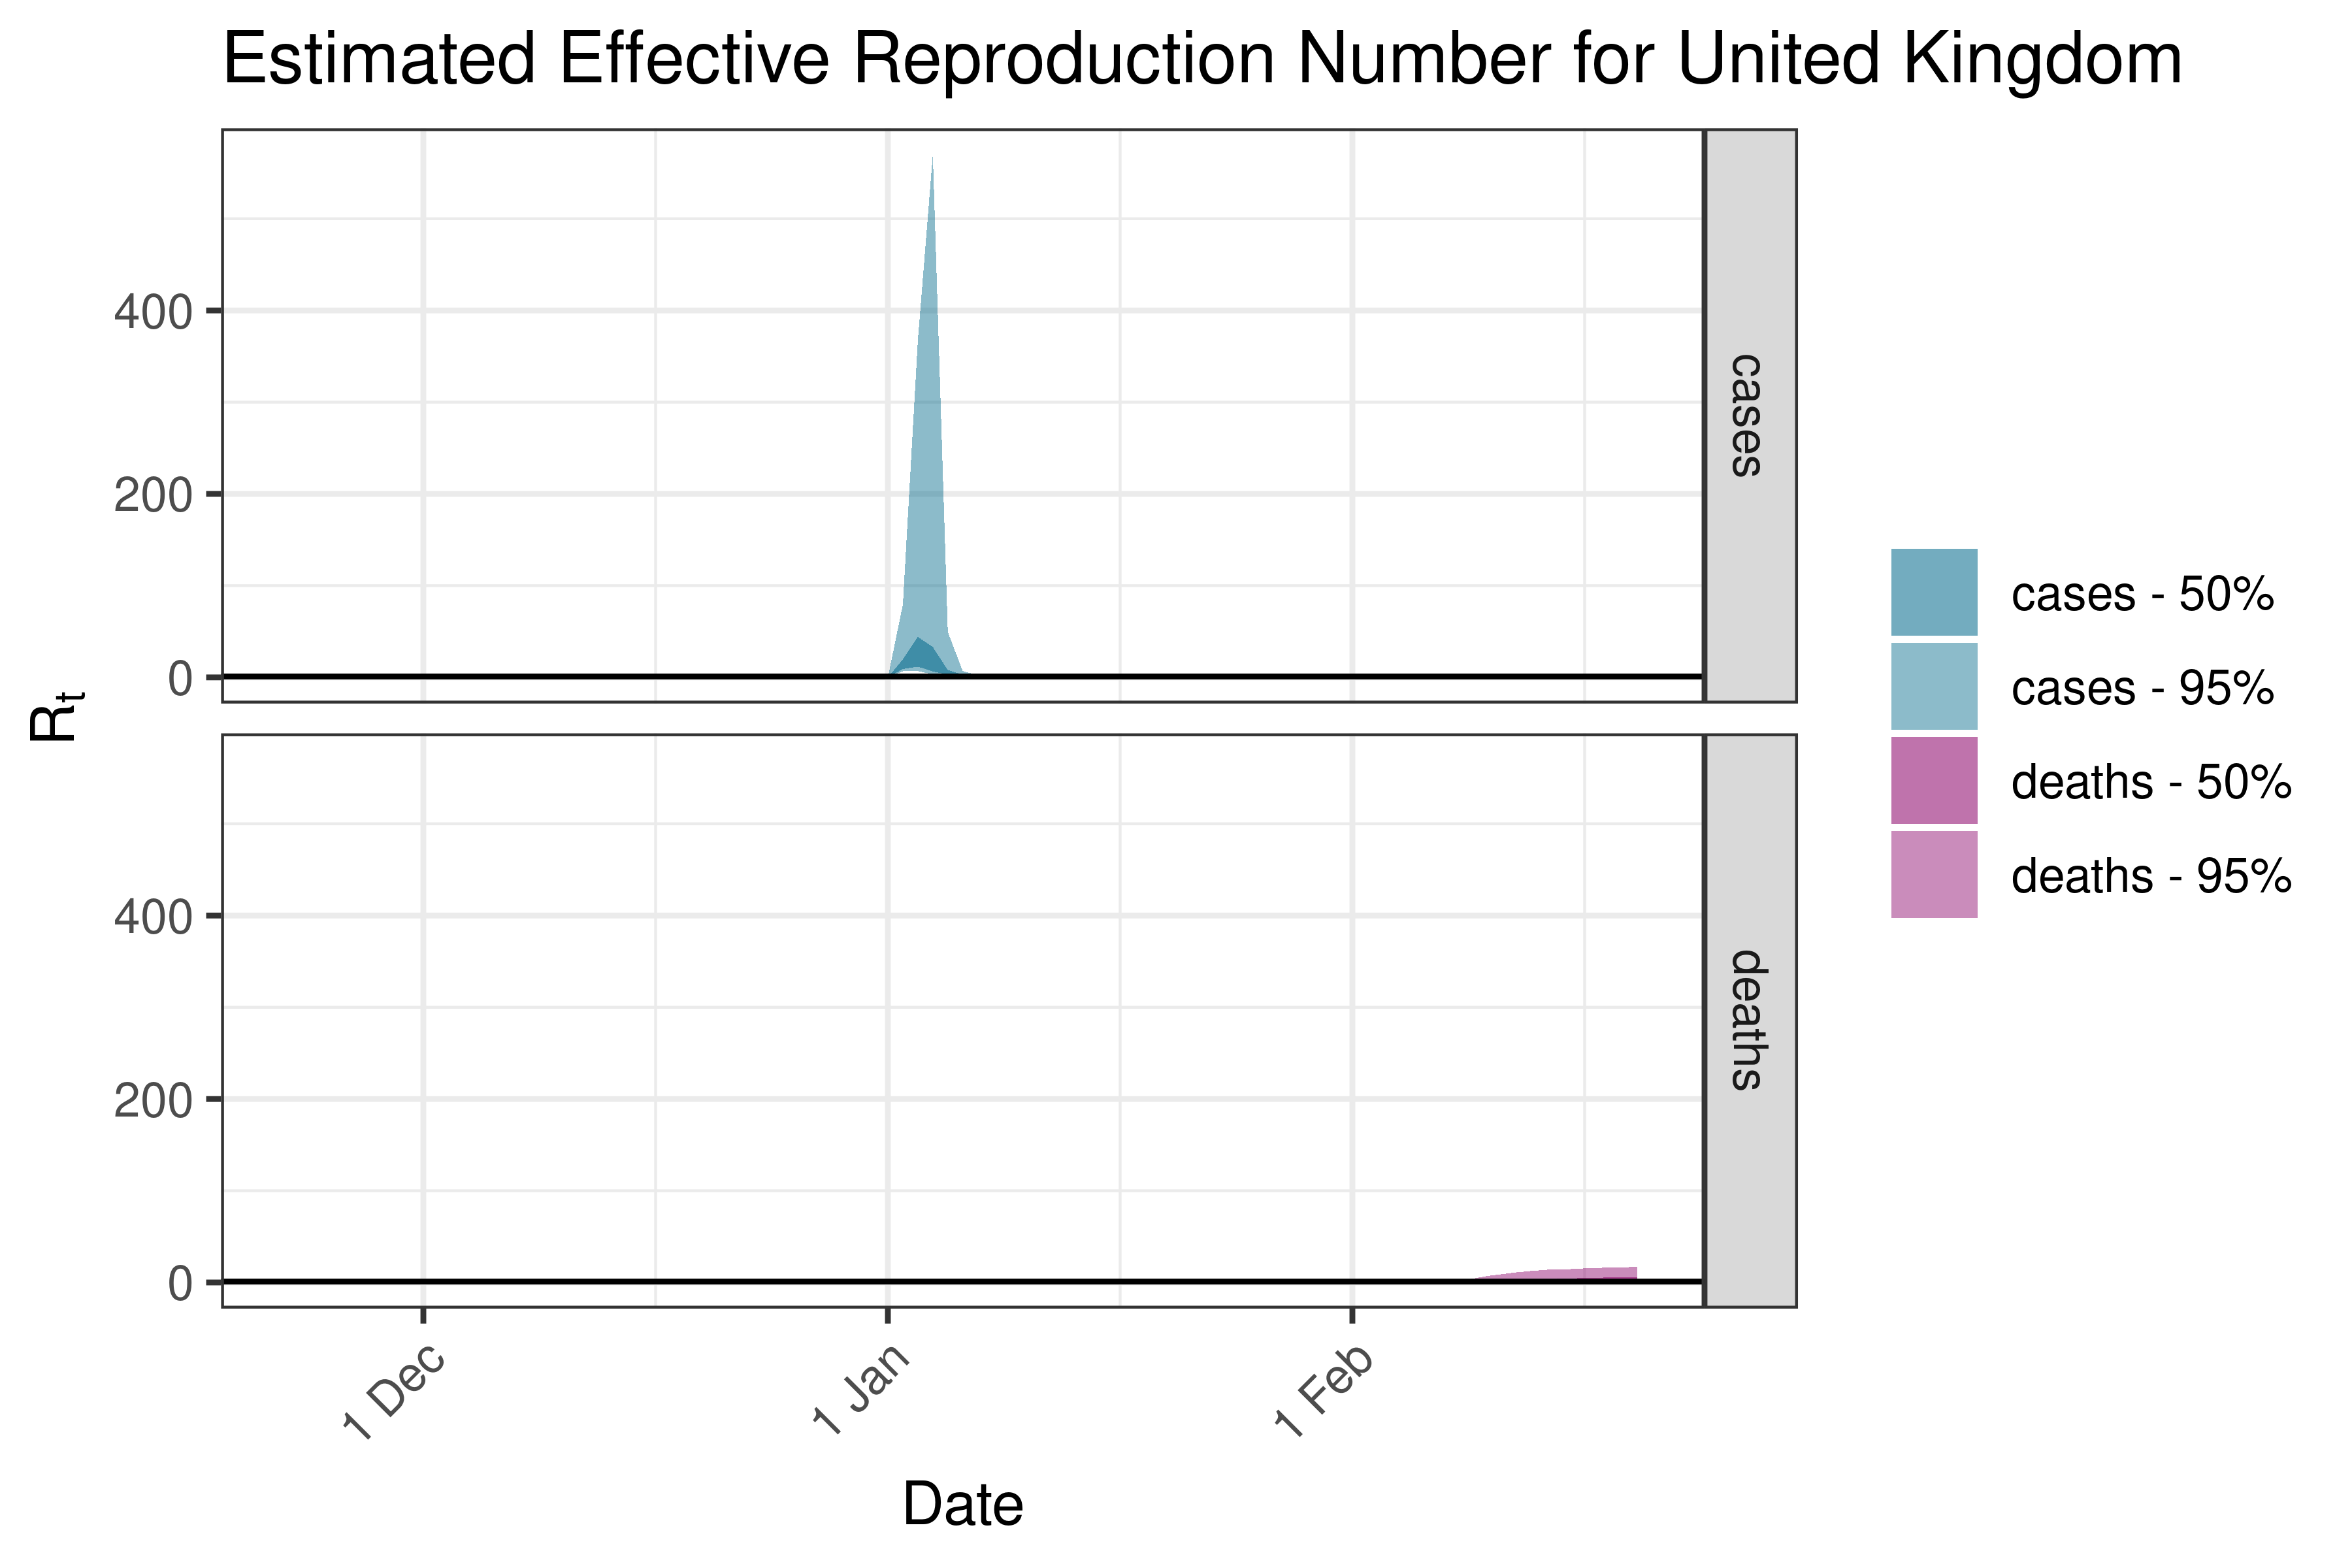
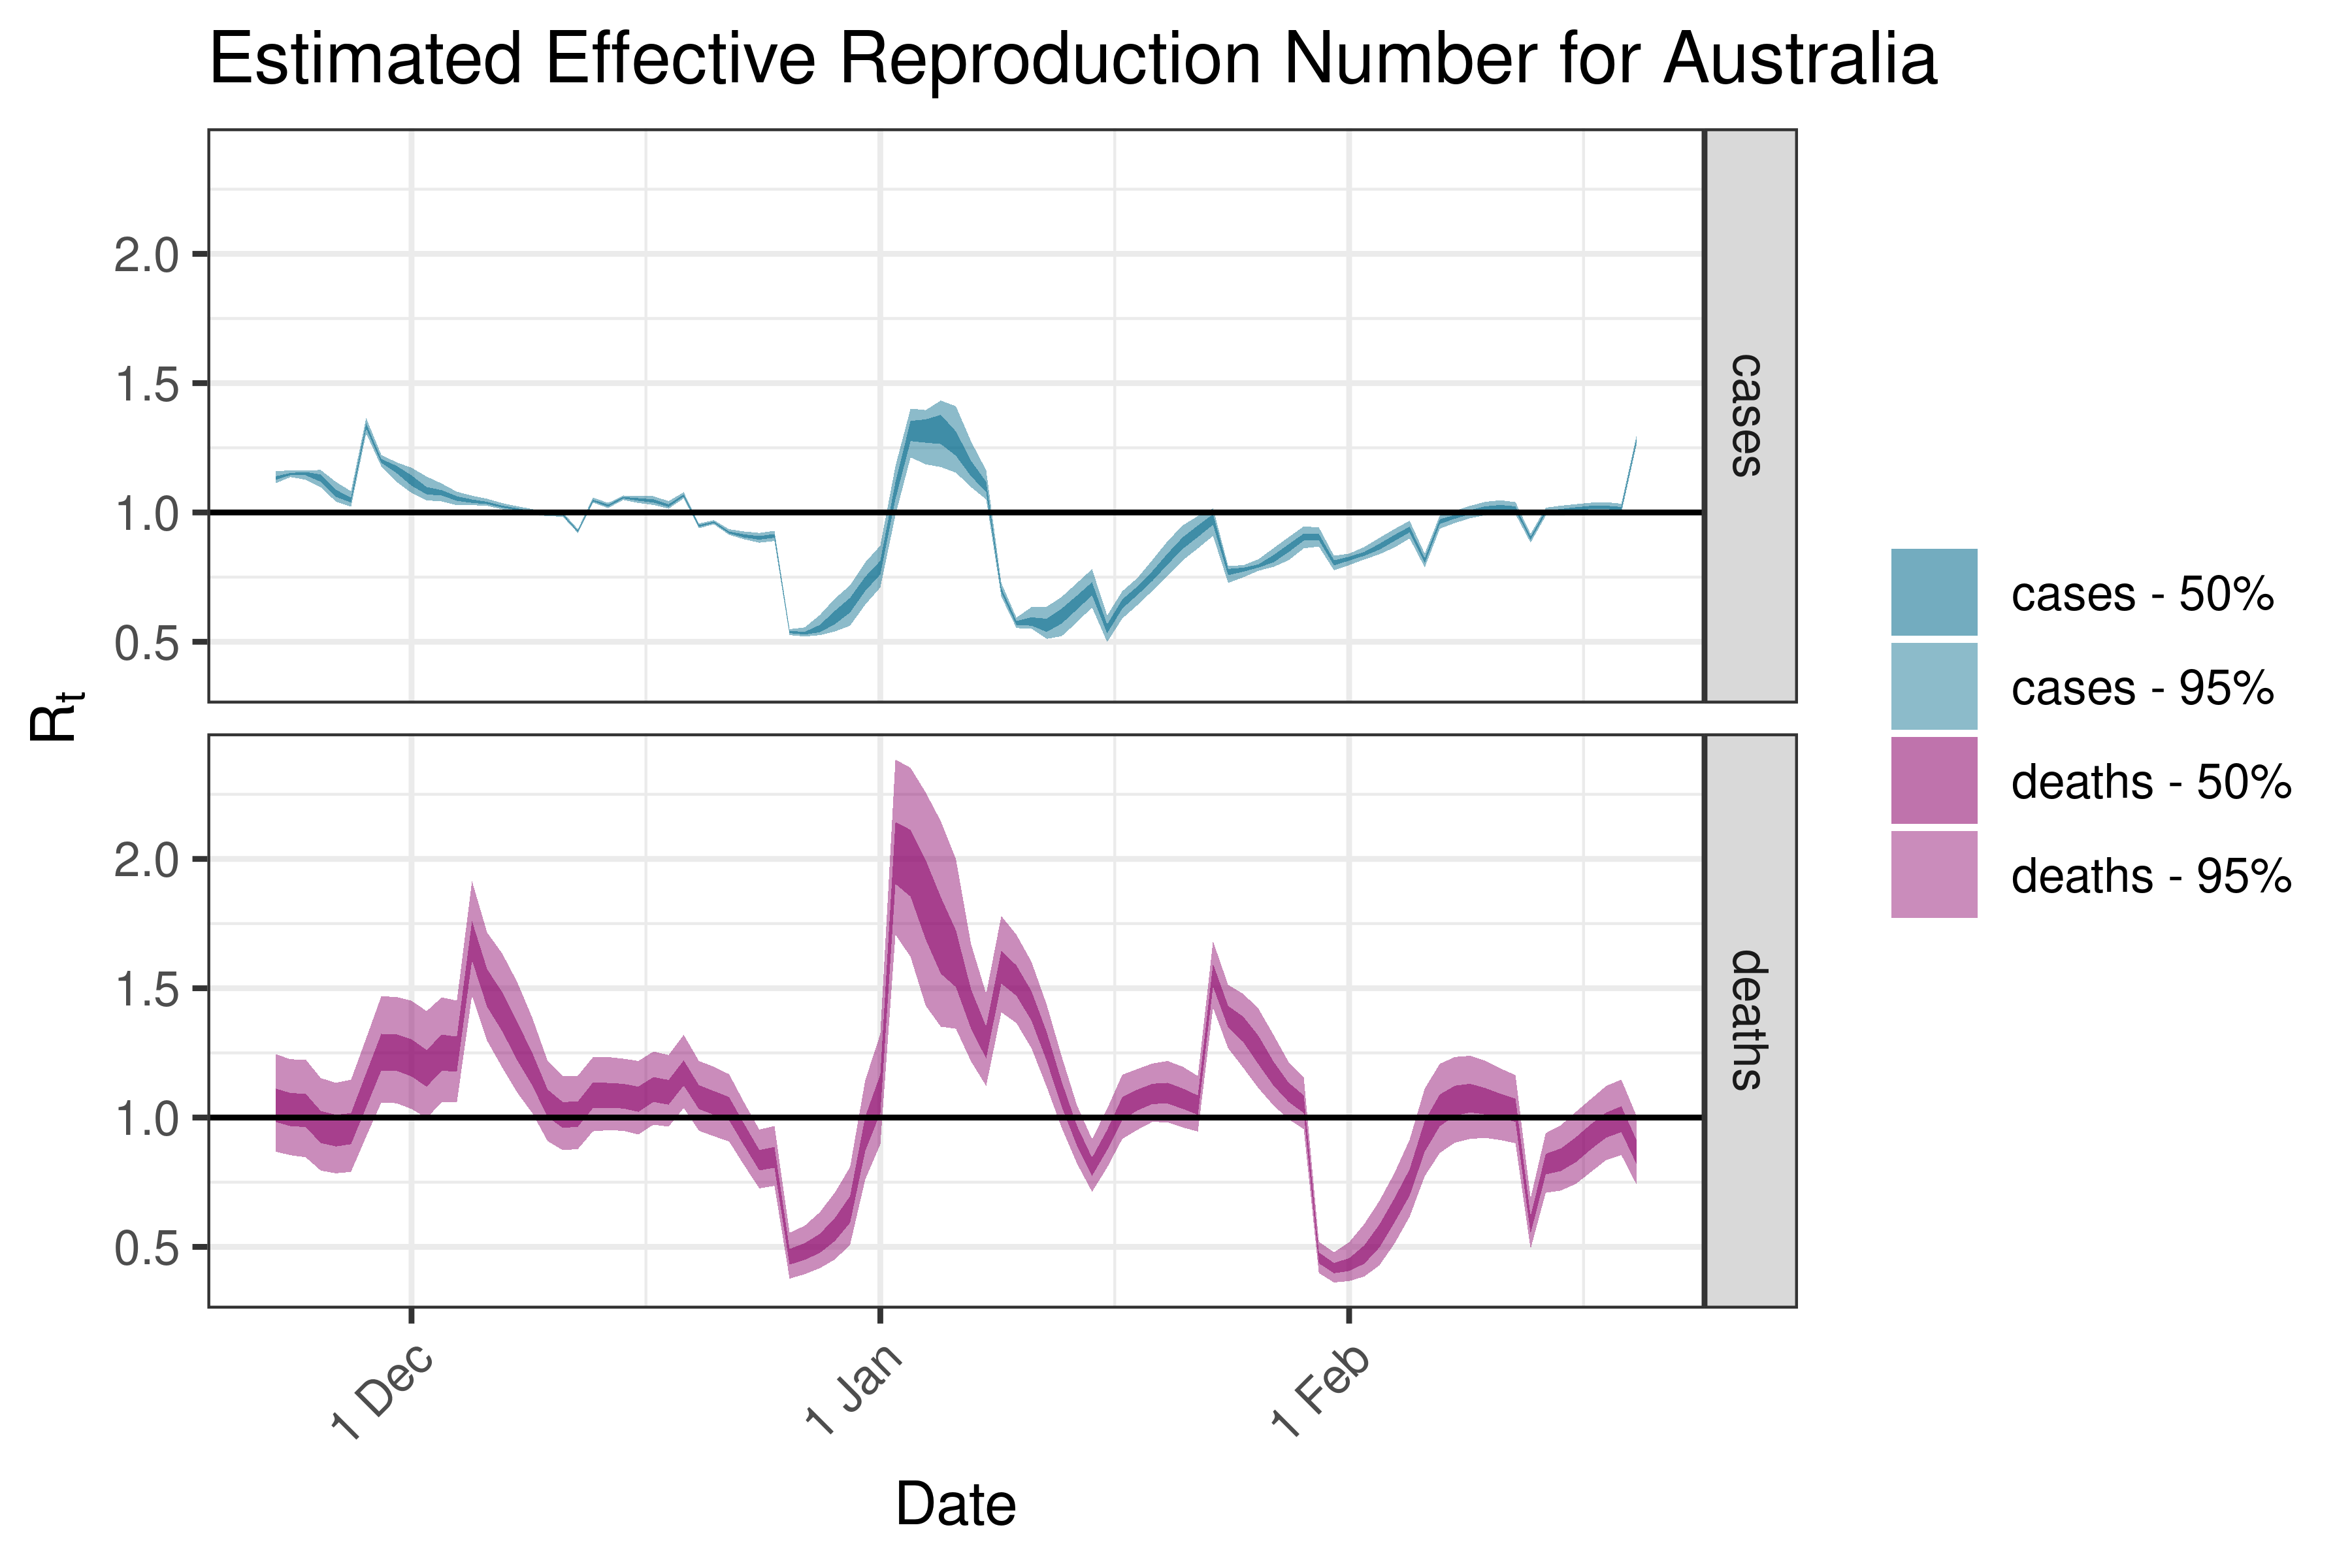
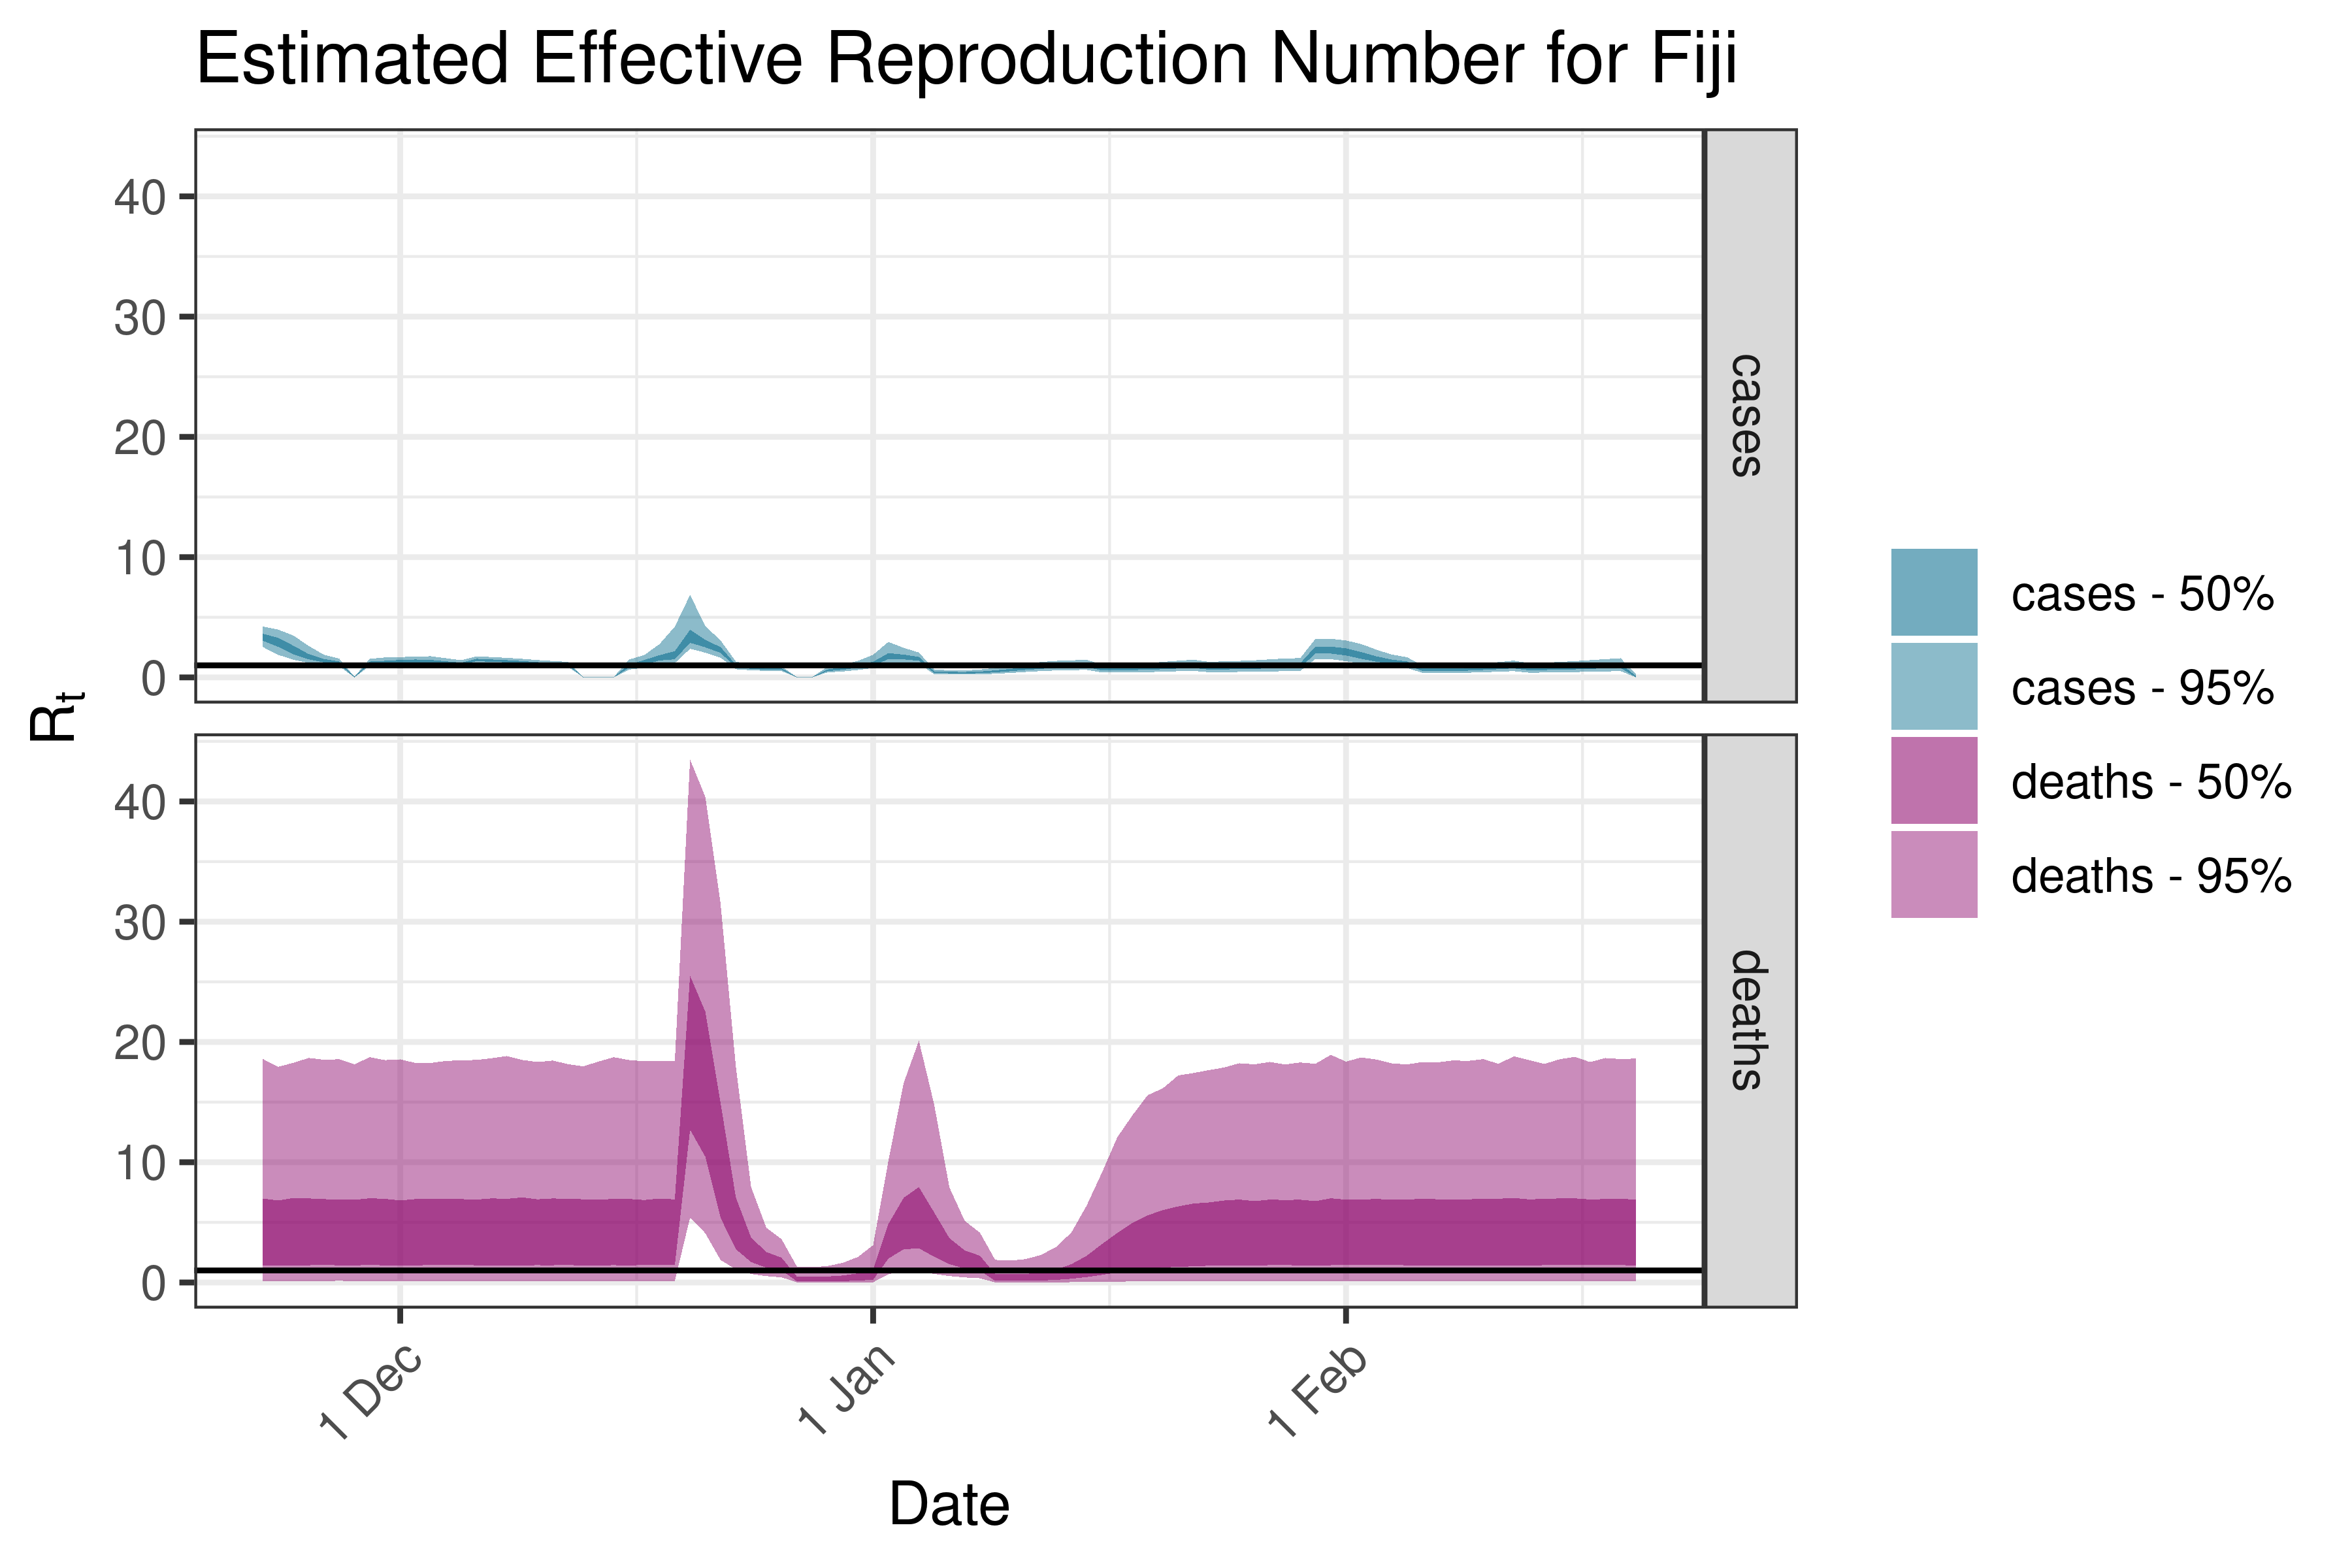
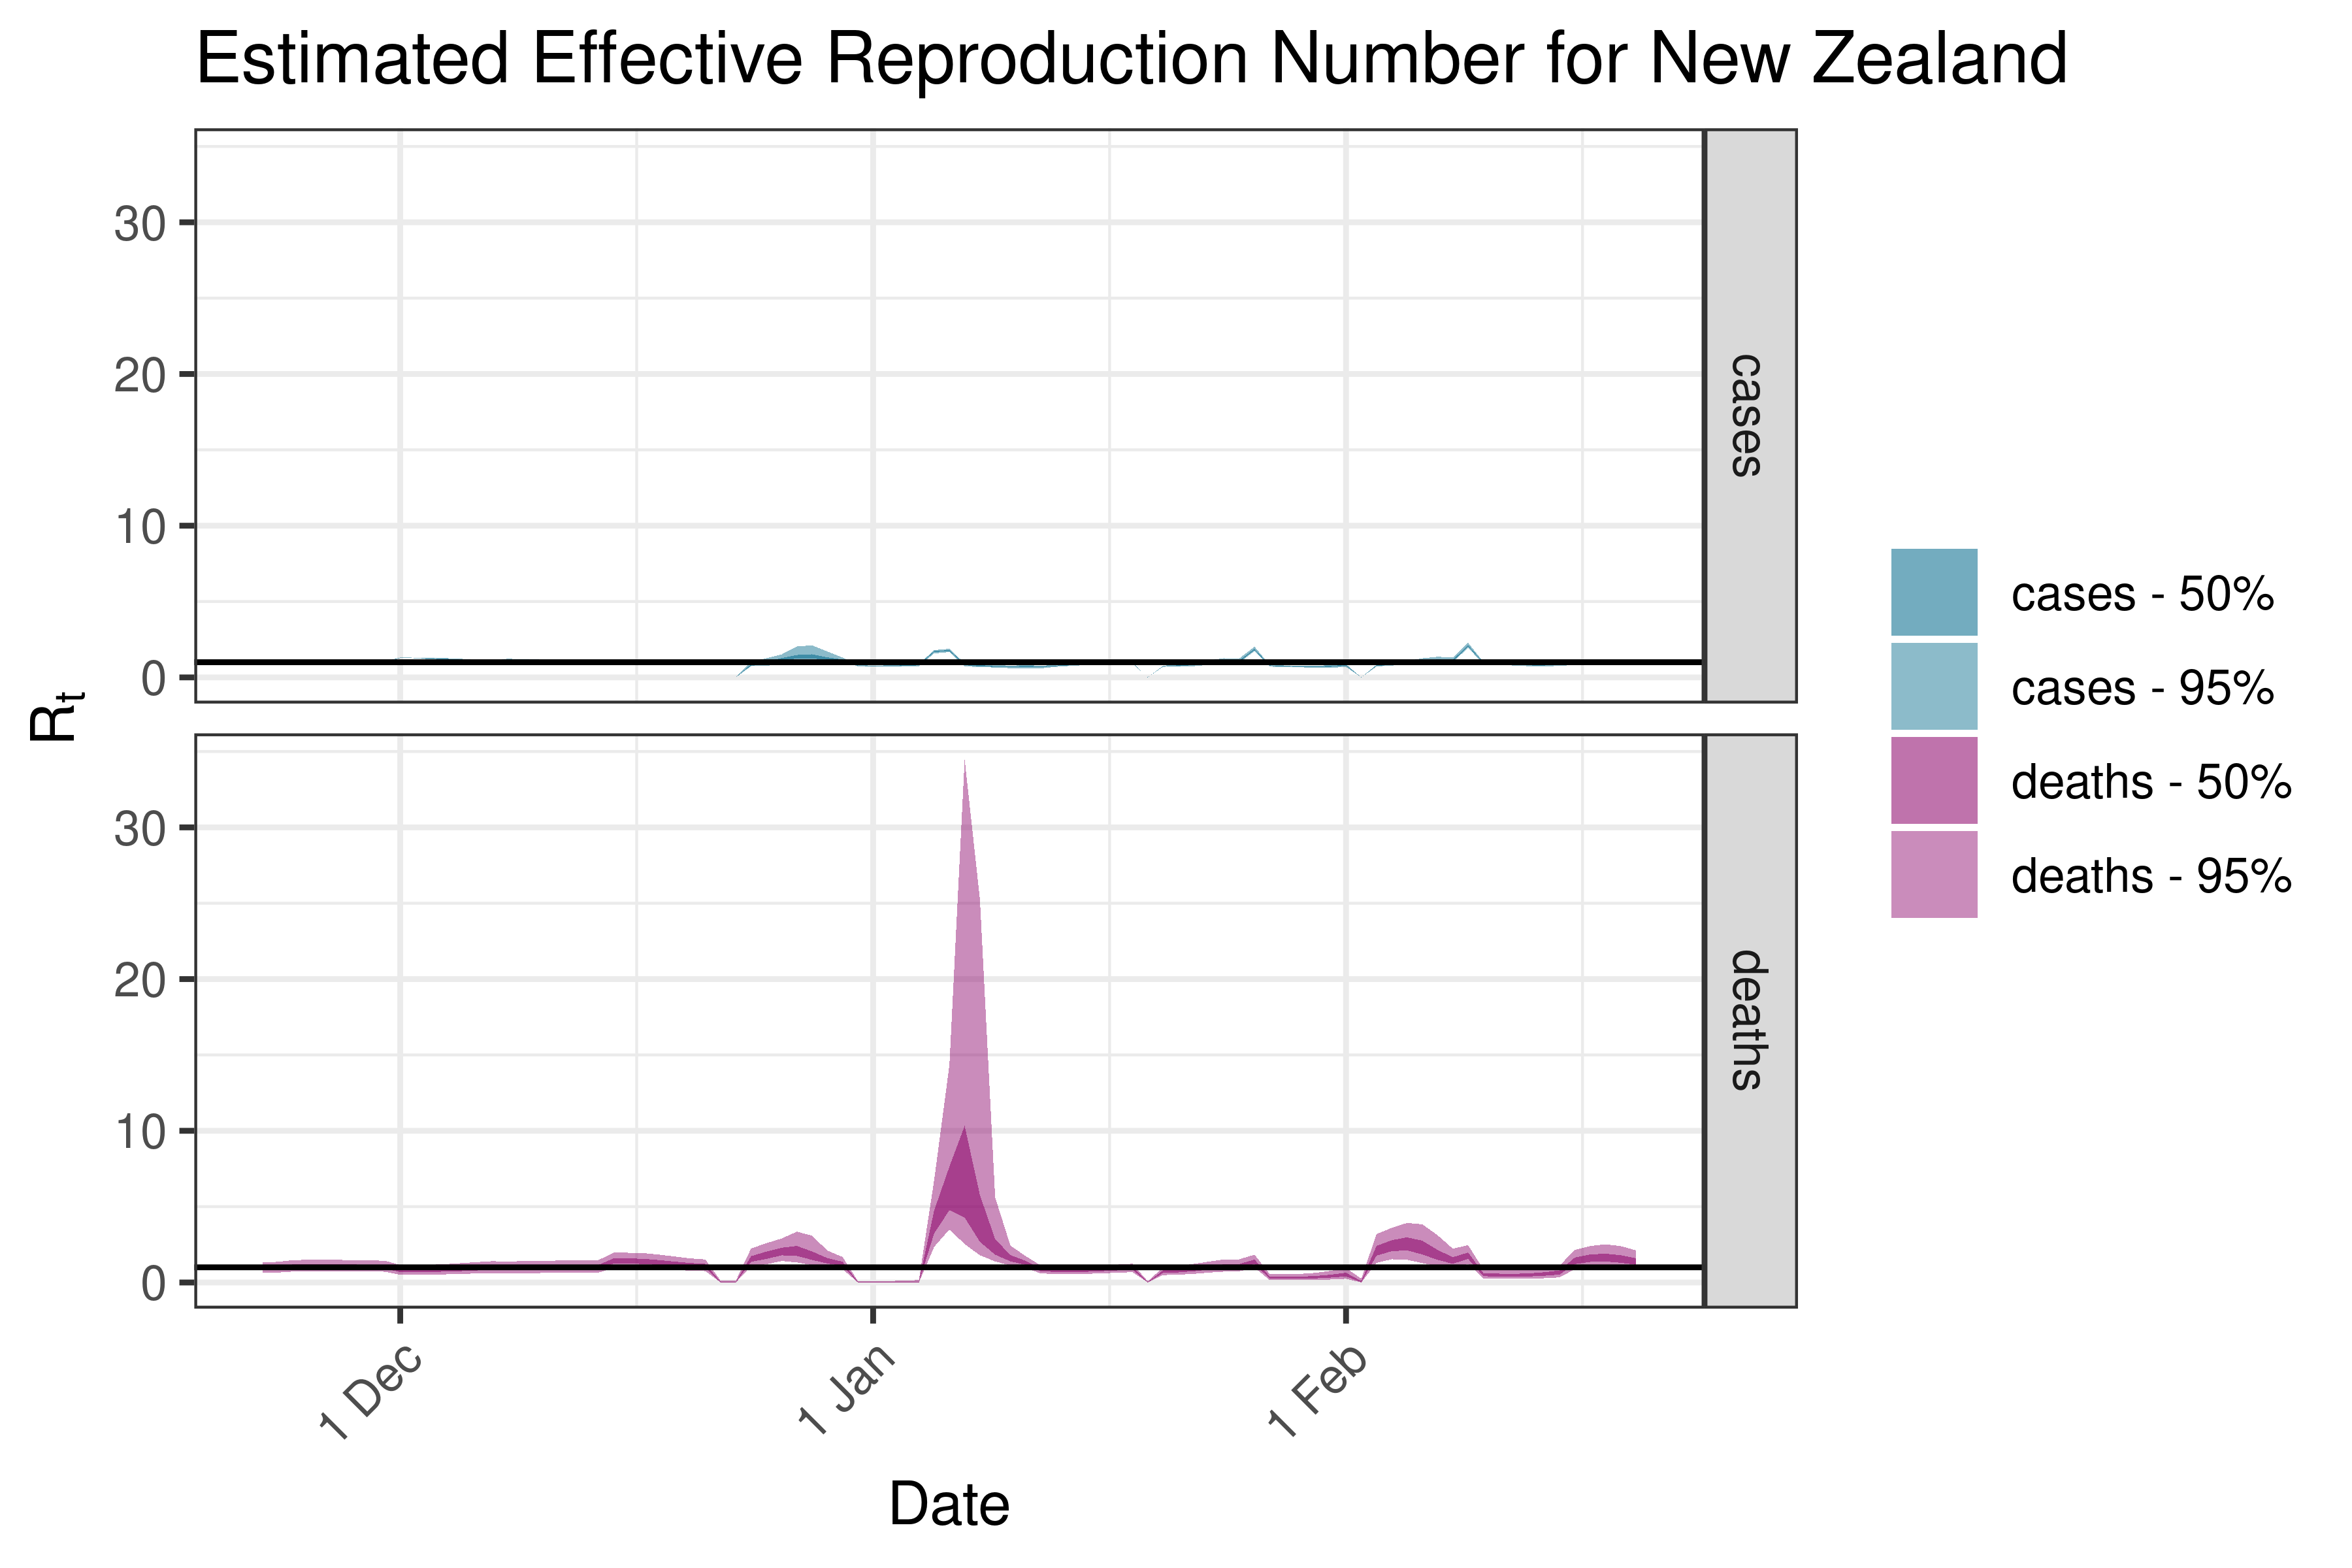
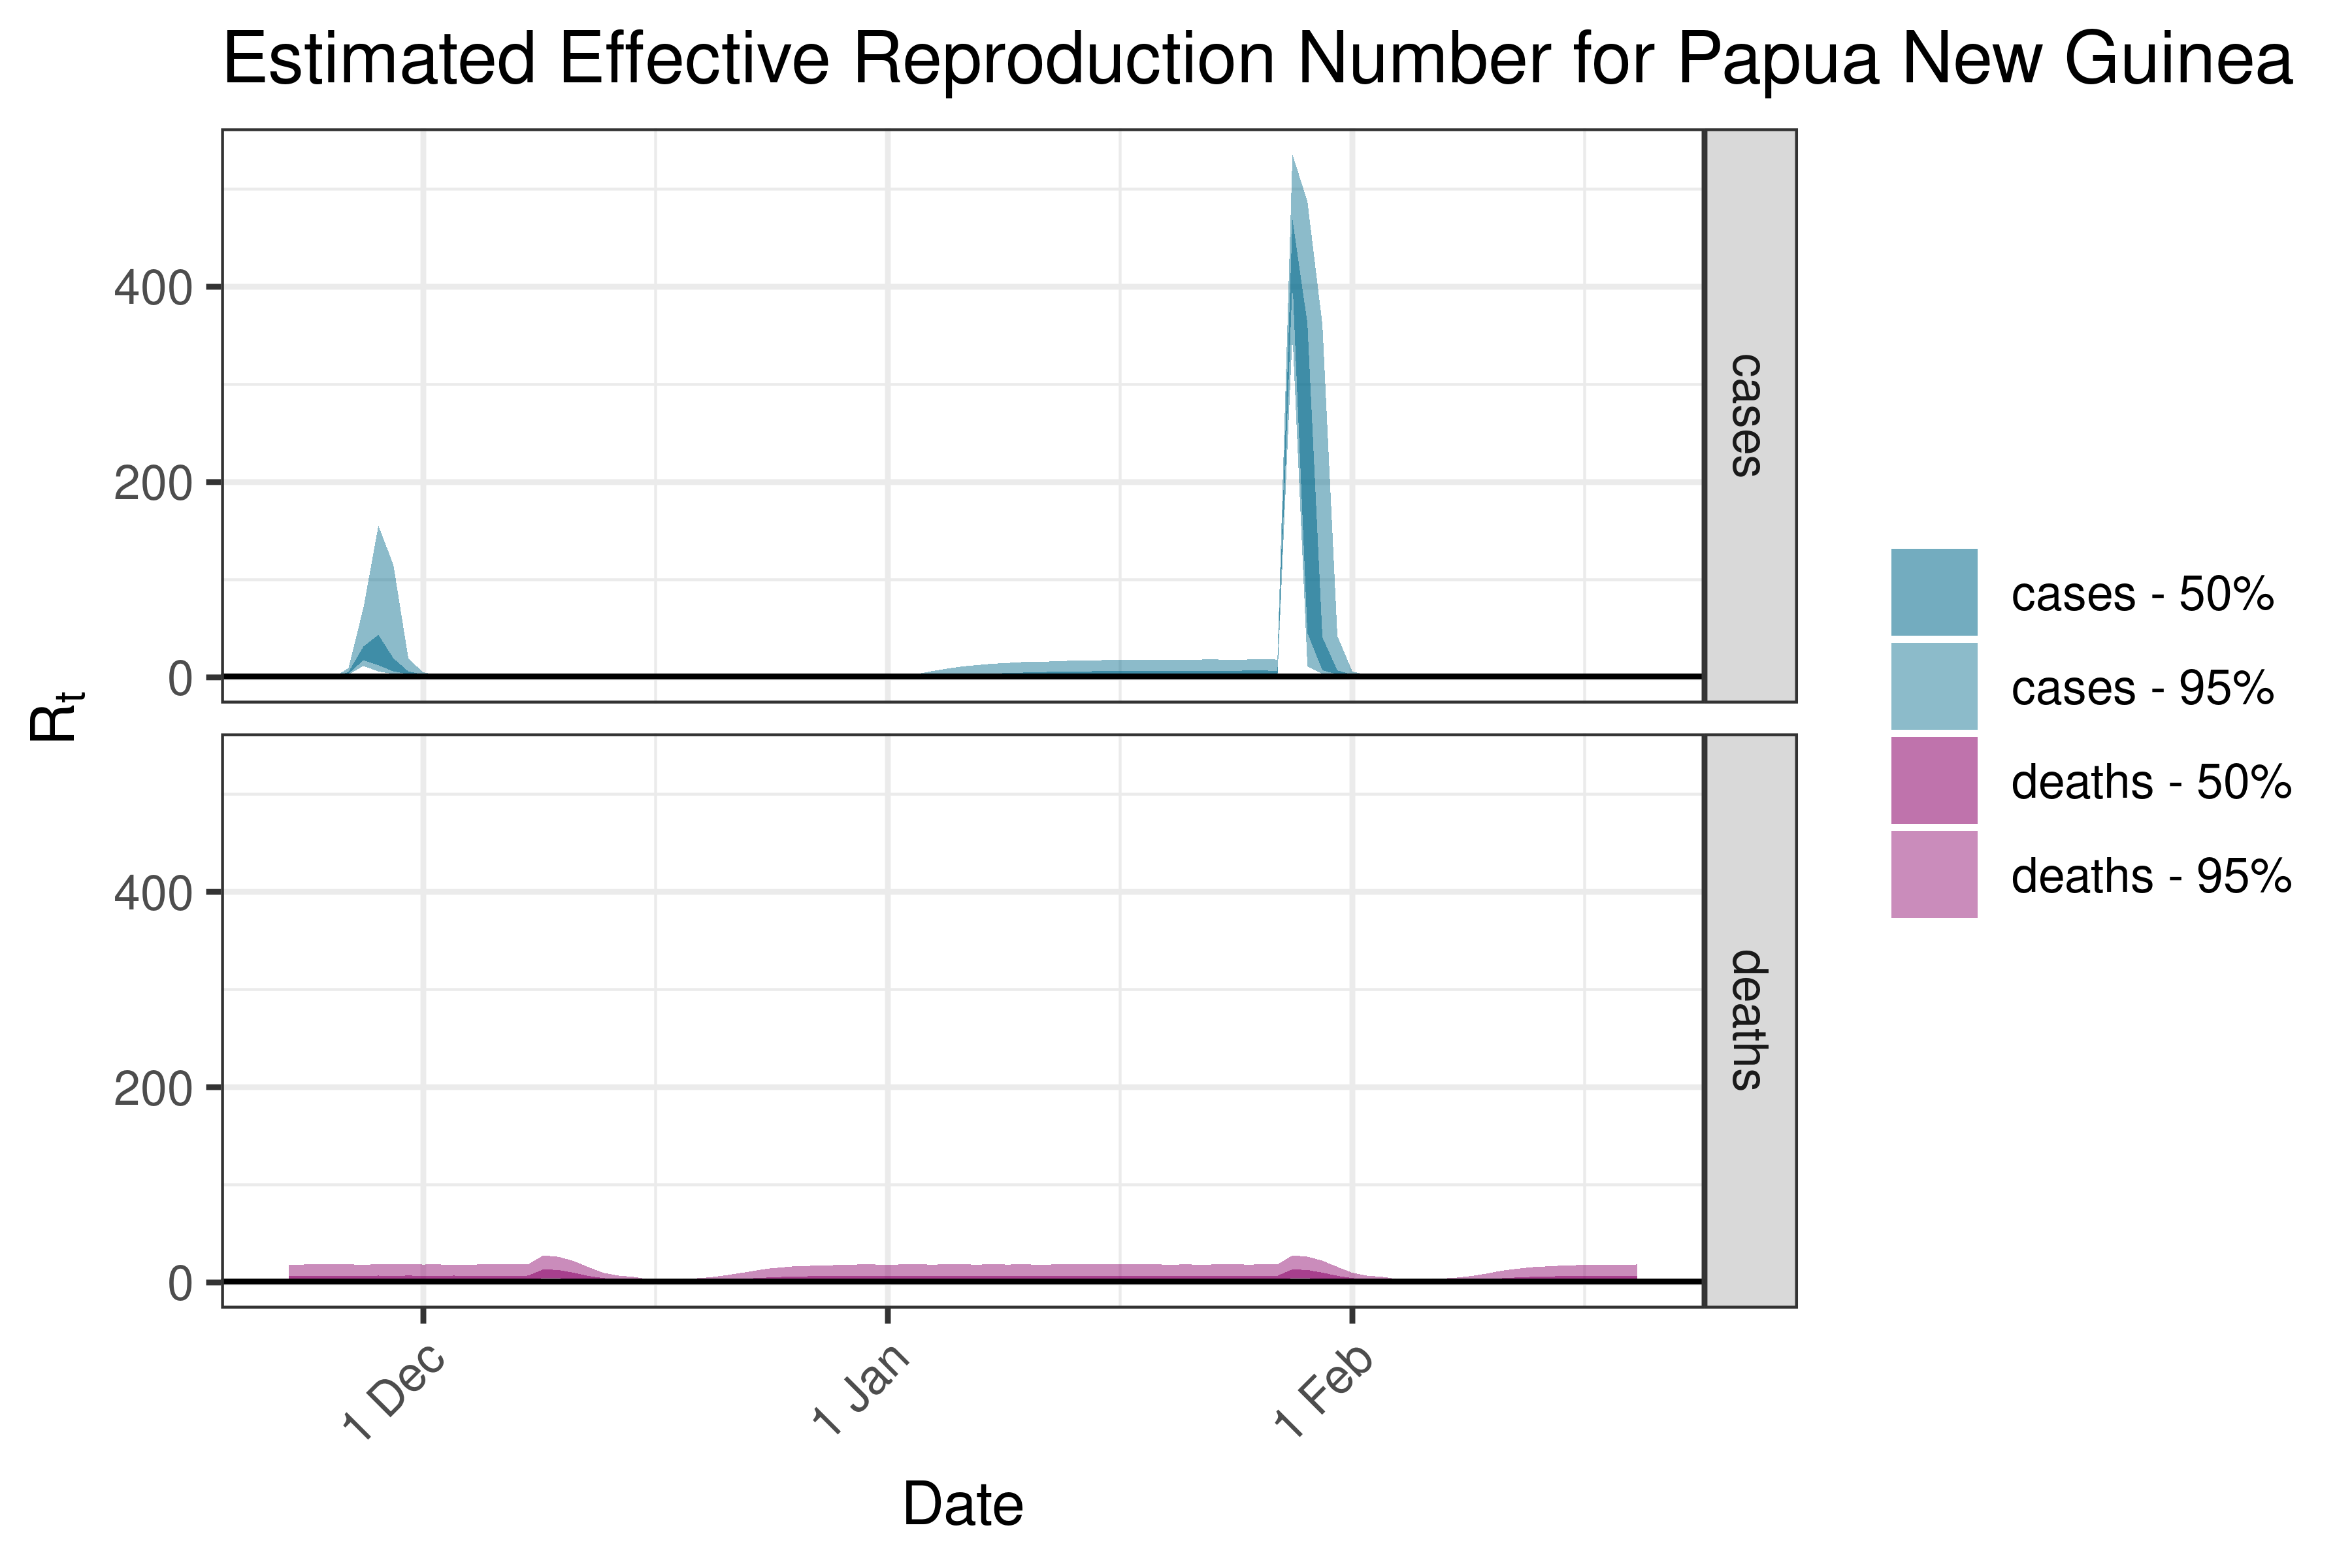
Below we plot results for each country/province in a list. Values larger than 3 are plotted at 3.
6.5.1 Africa
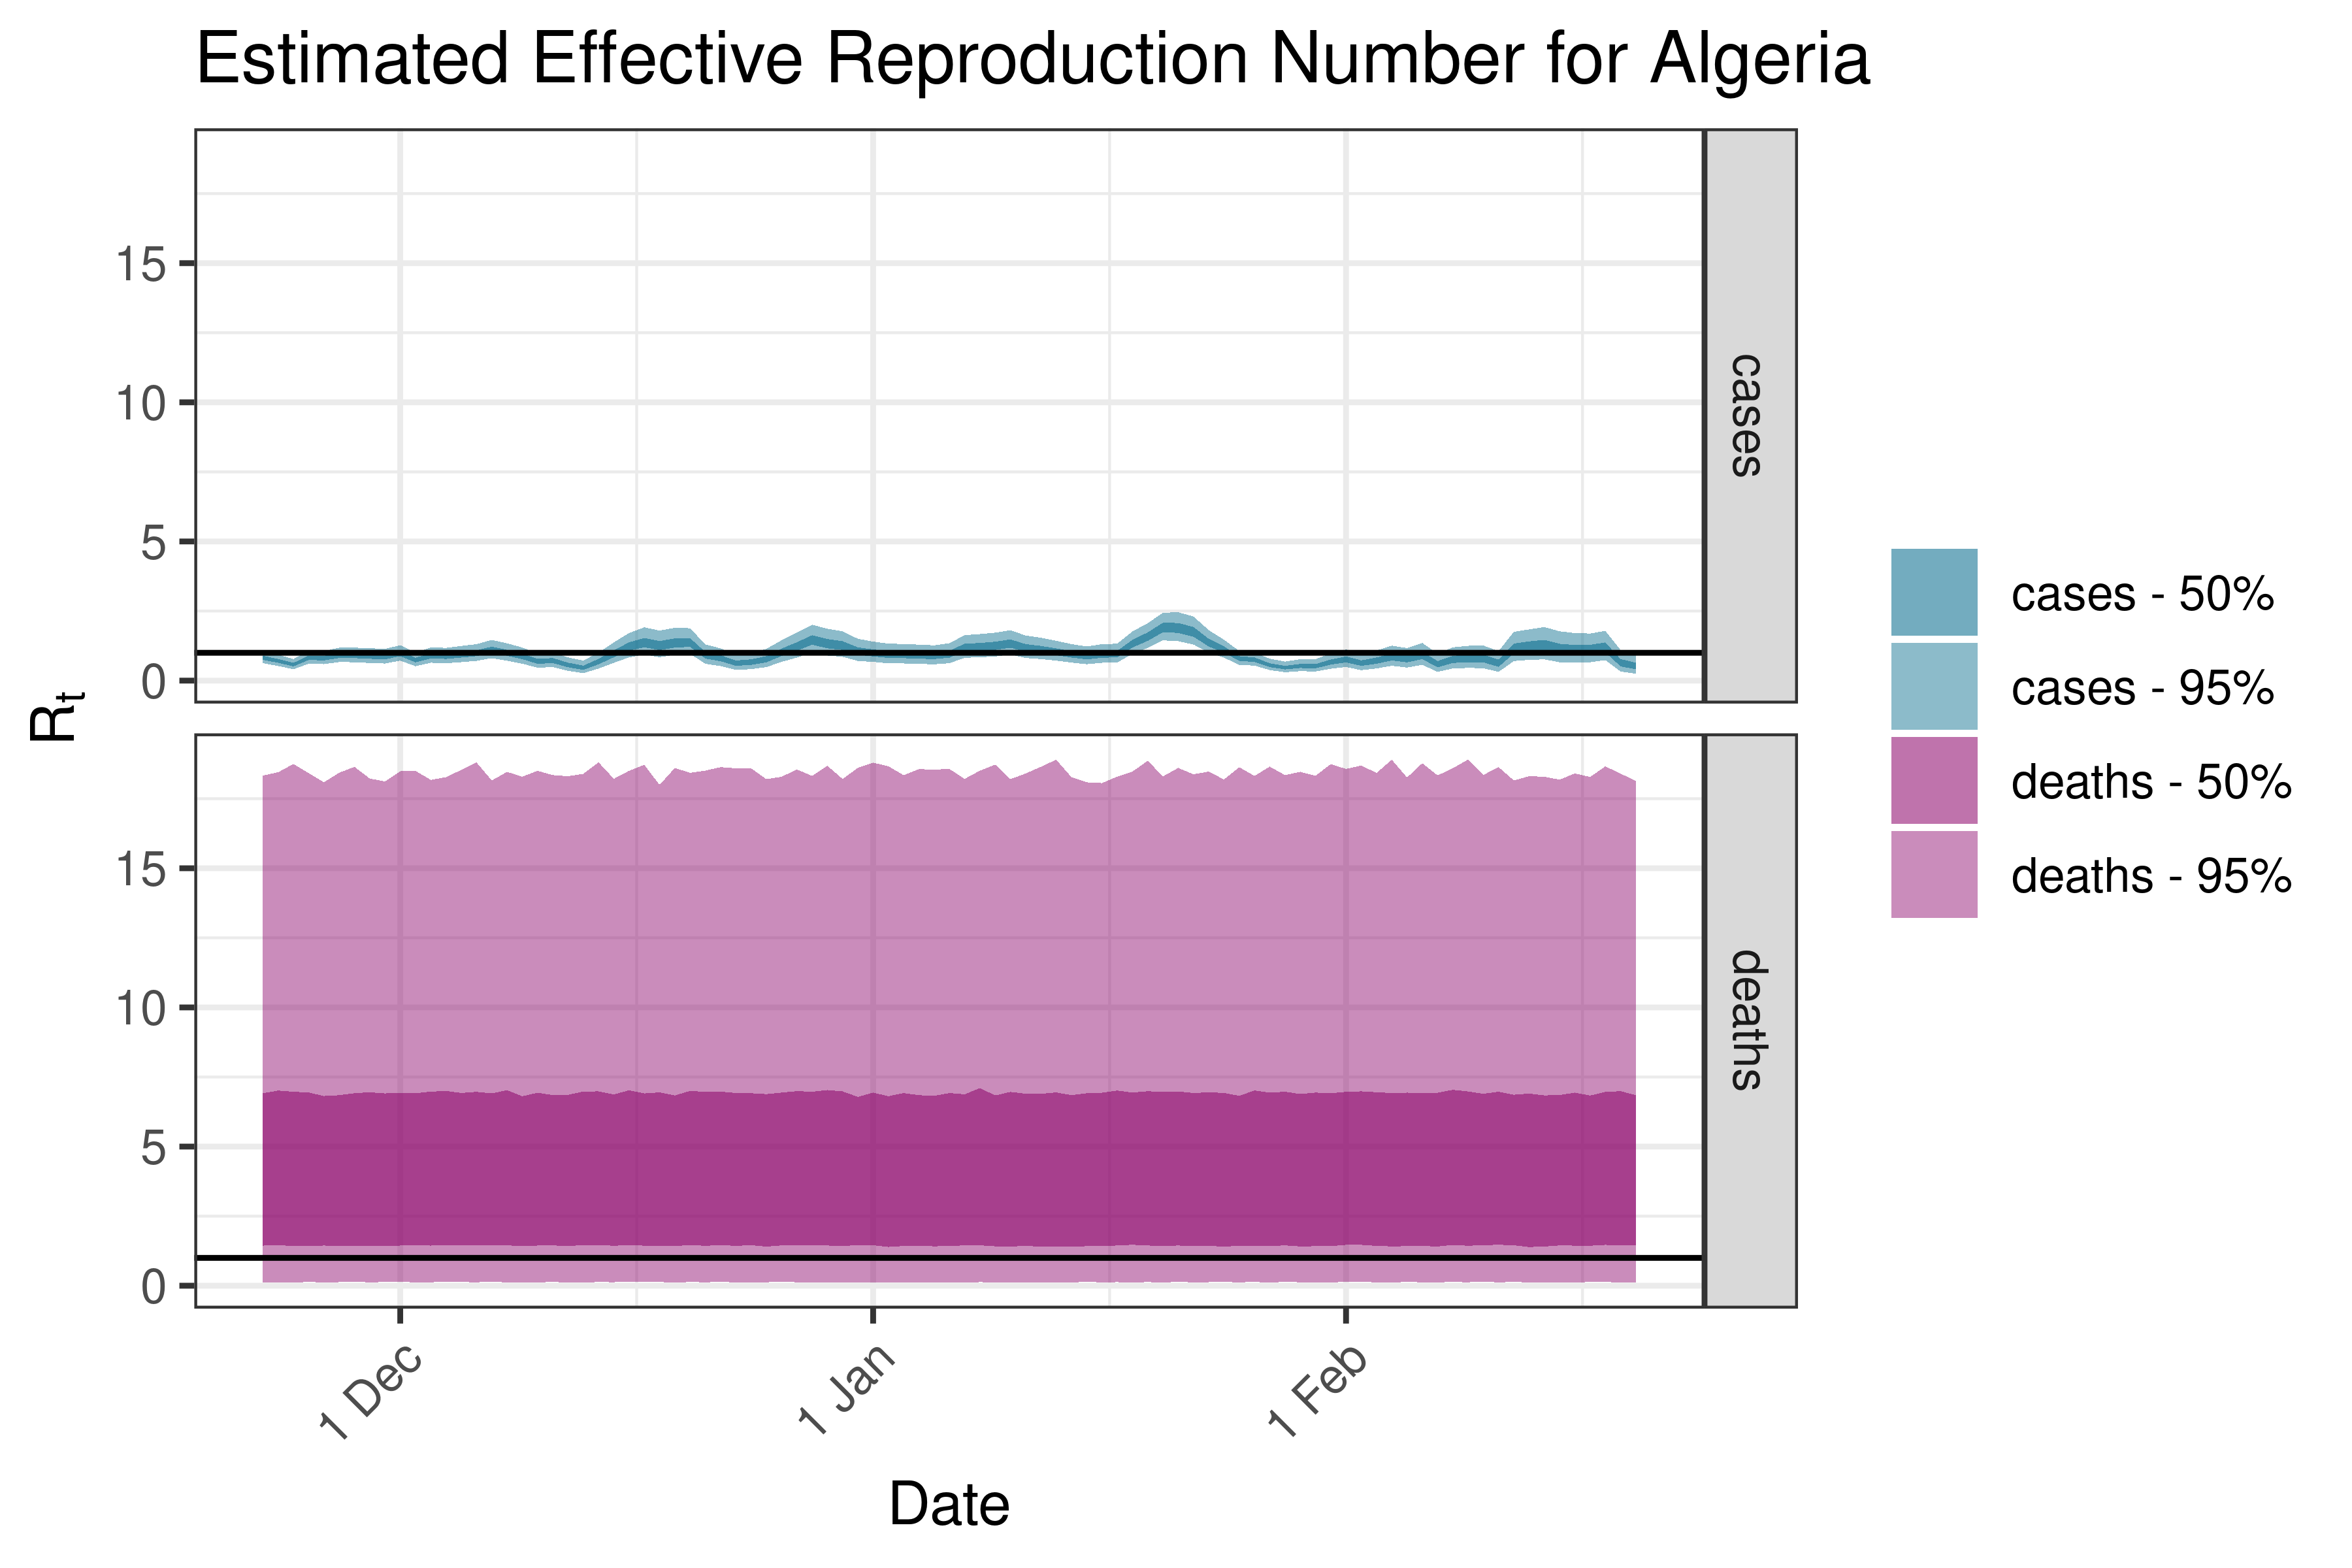
6.5.1.1 Algeria
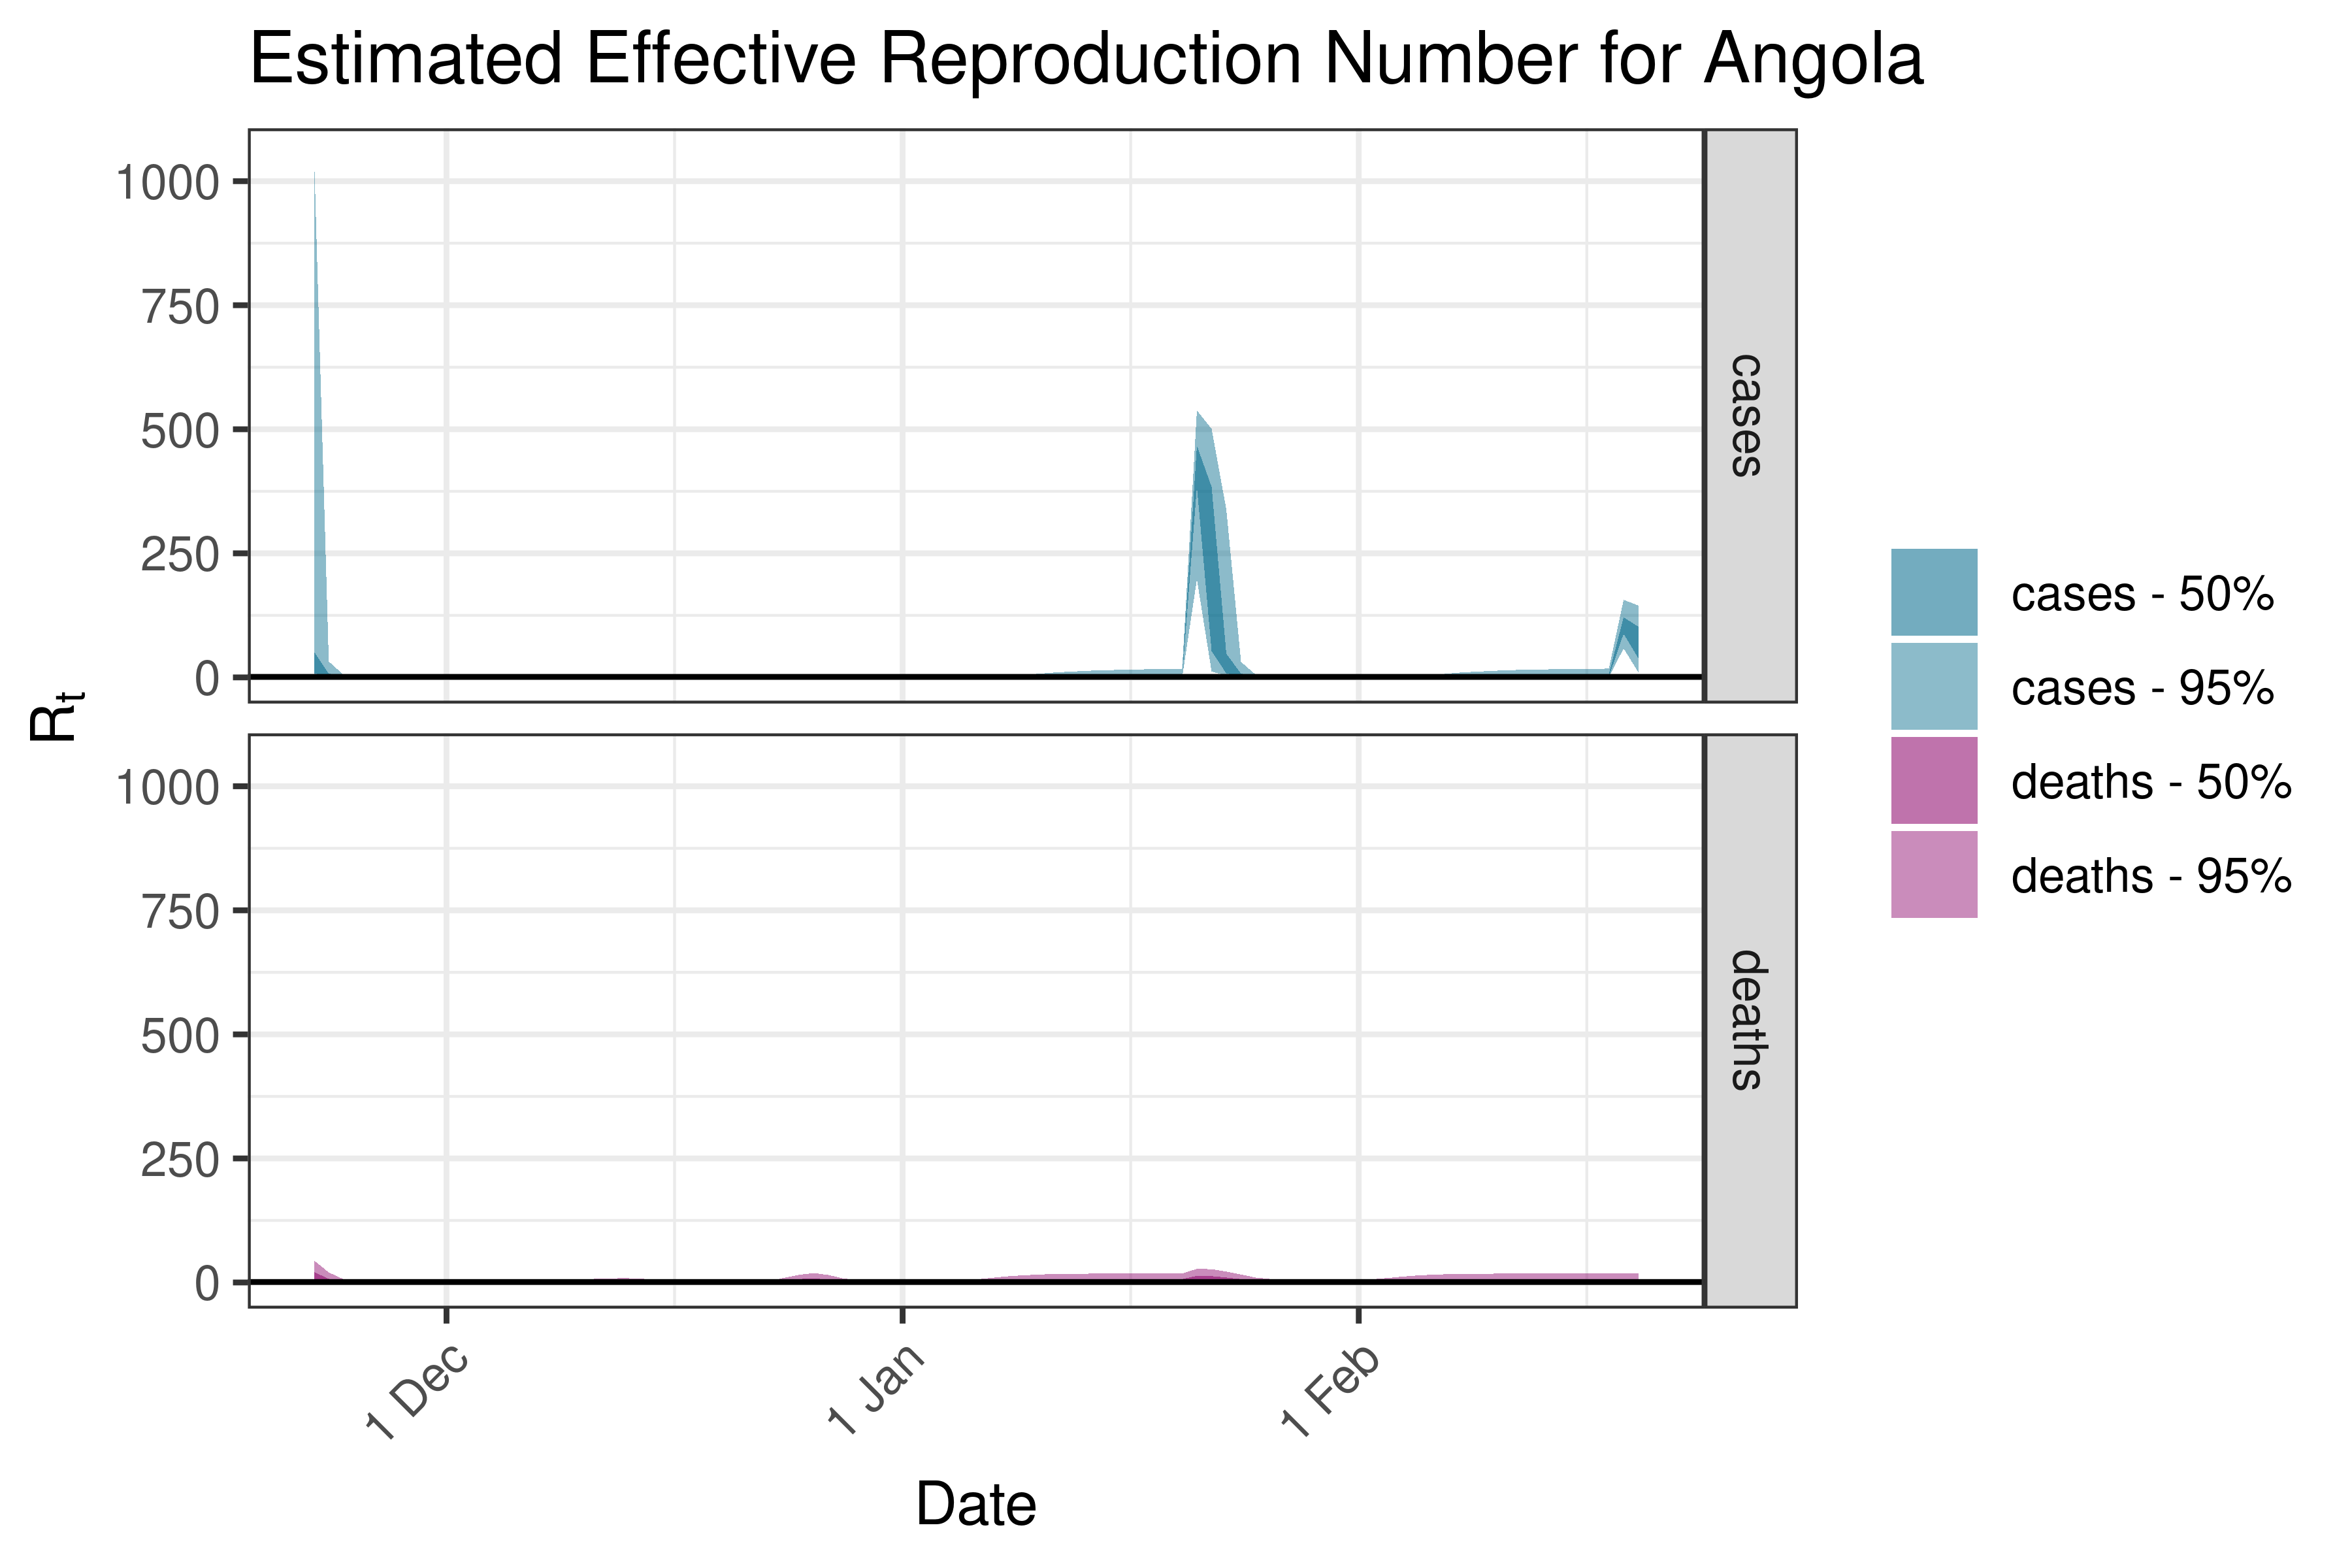
6.5.1.2 Angola
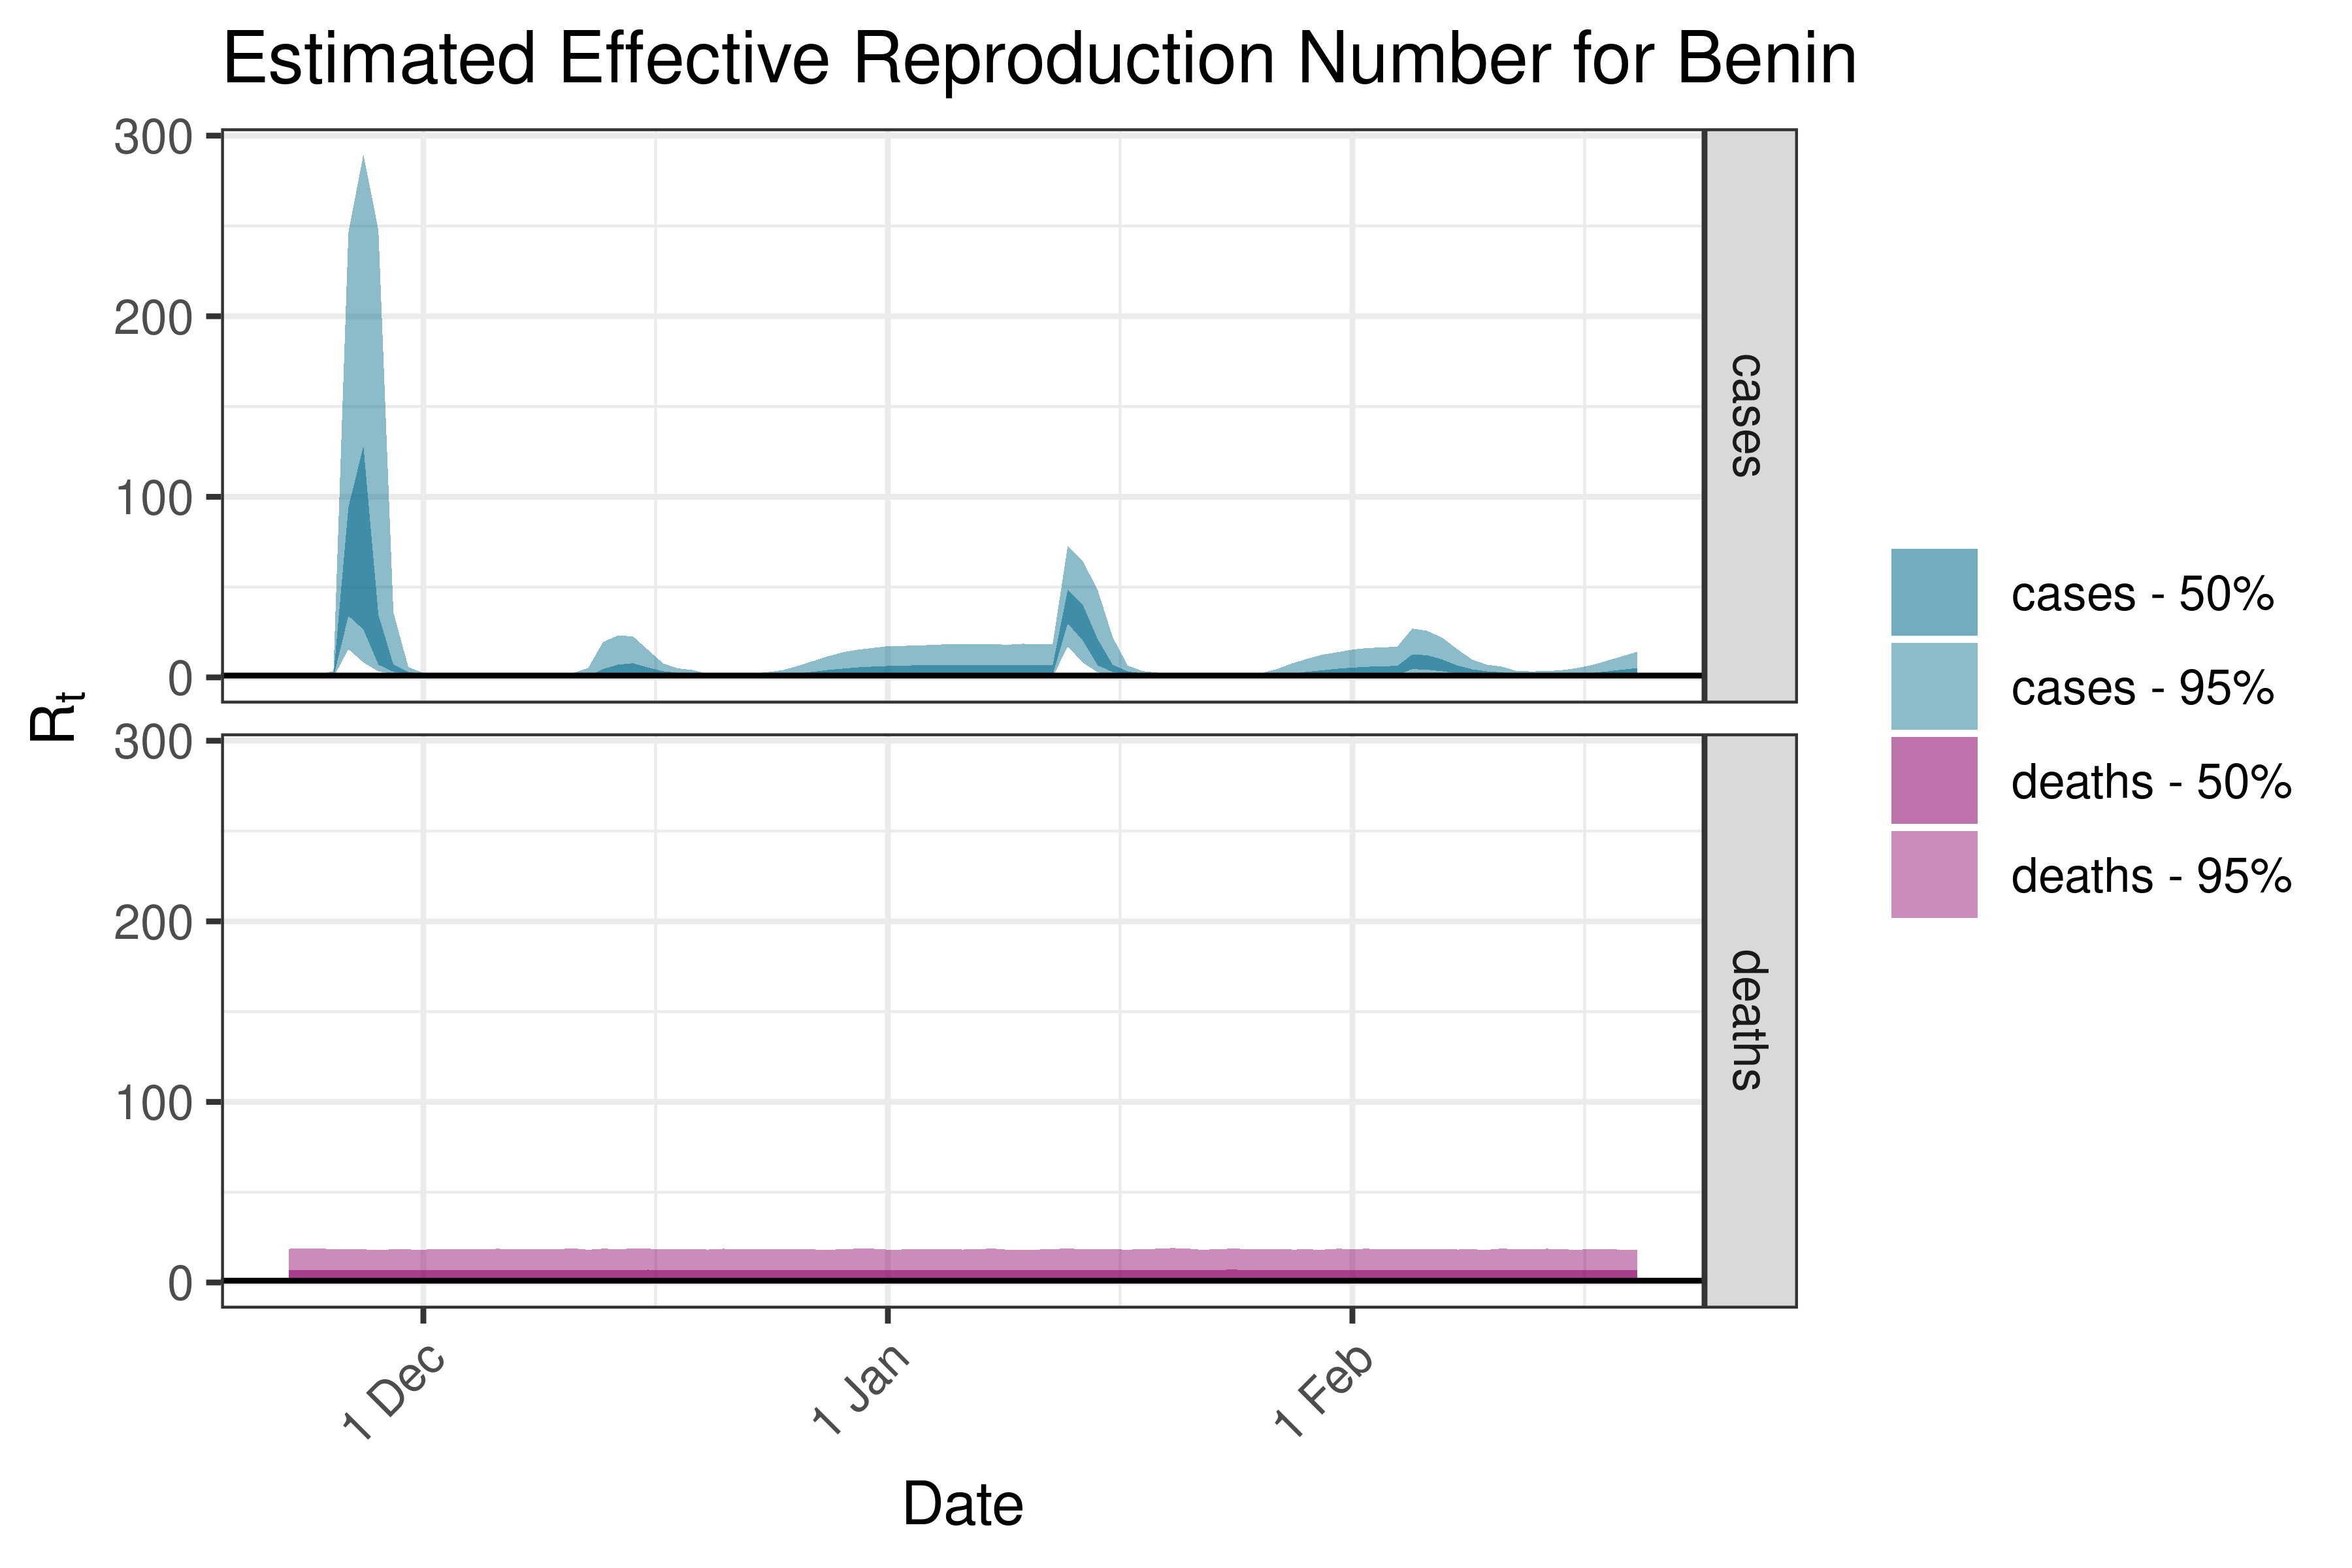
6.5.1.3 Benin
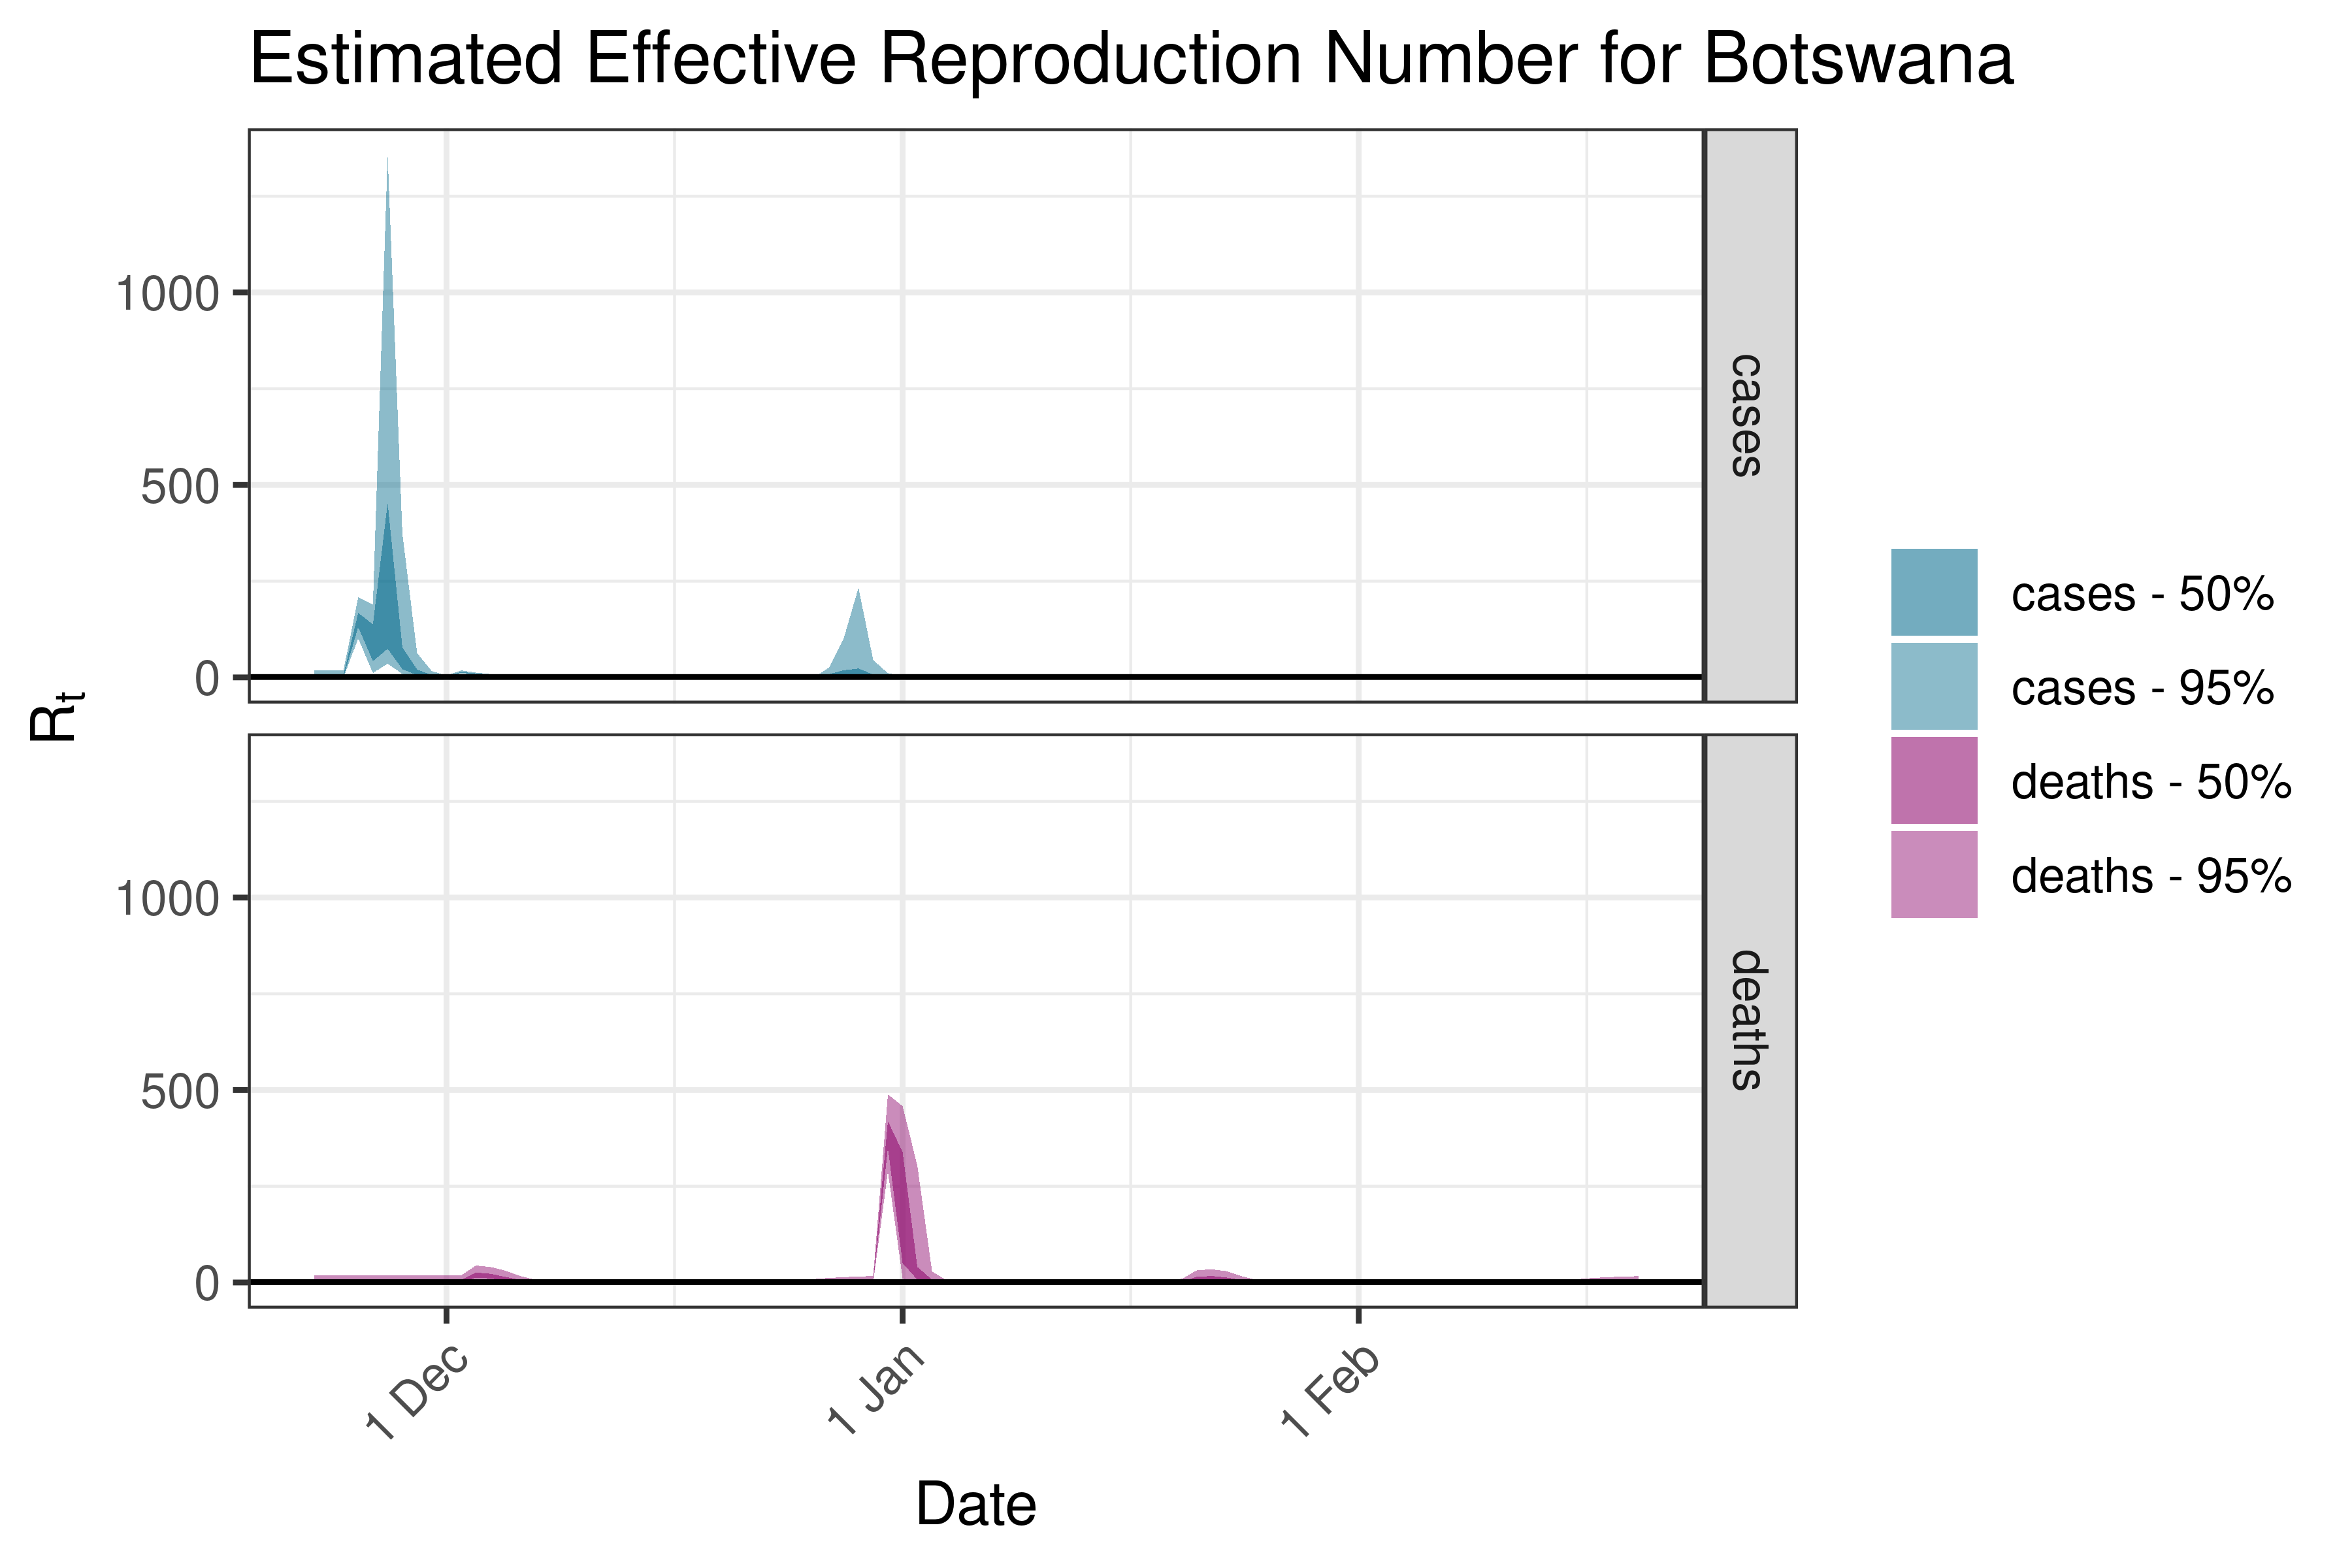
6.5.1.4 Botswana
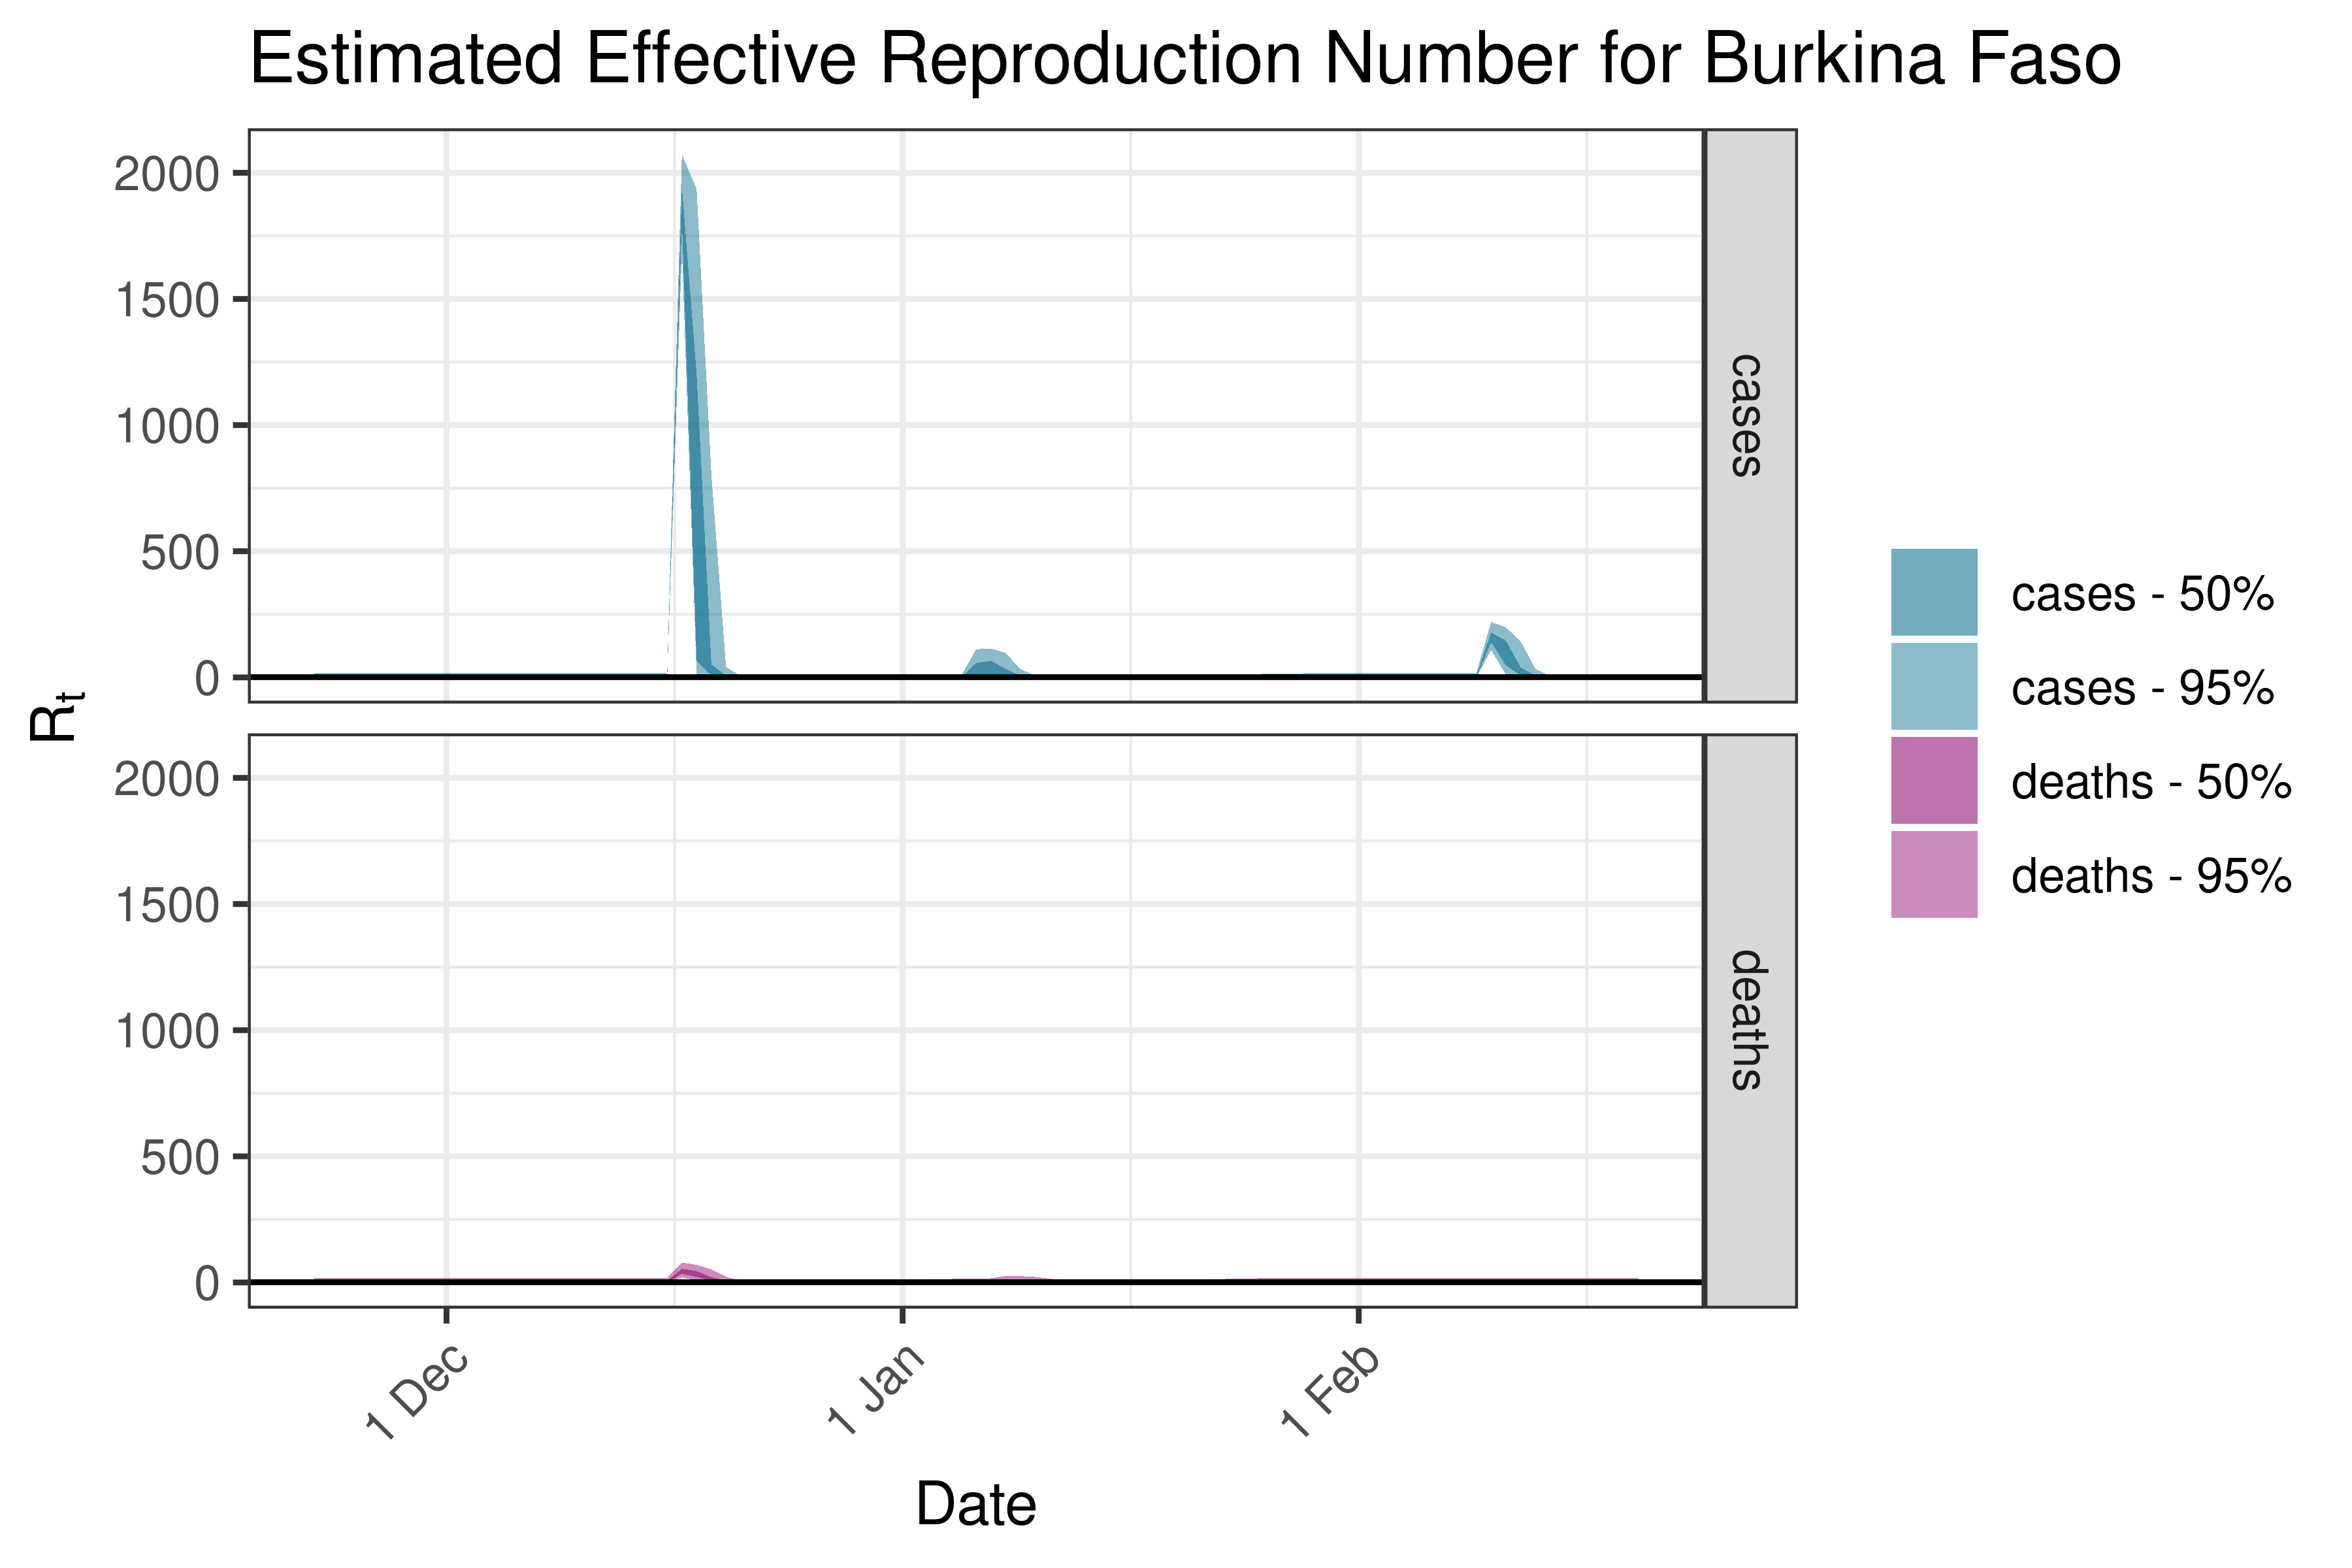
6.5.1.5 Burkina Faso
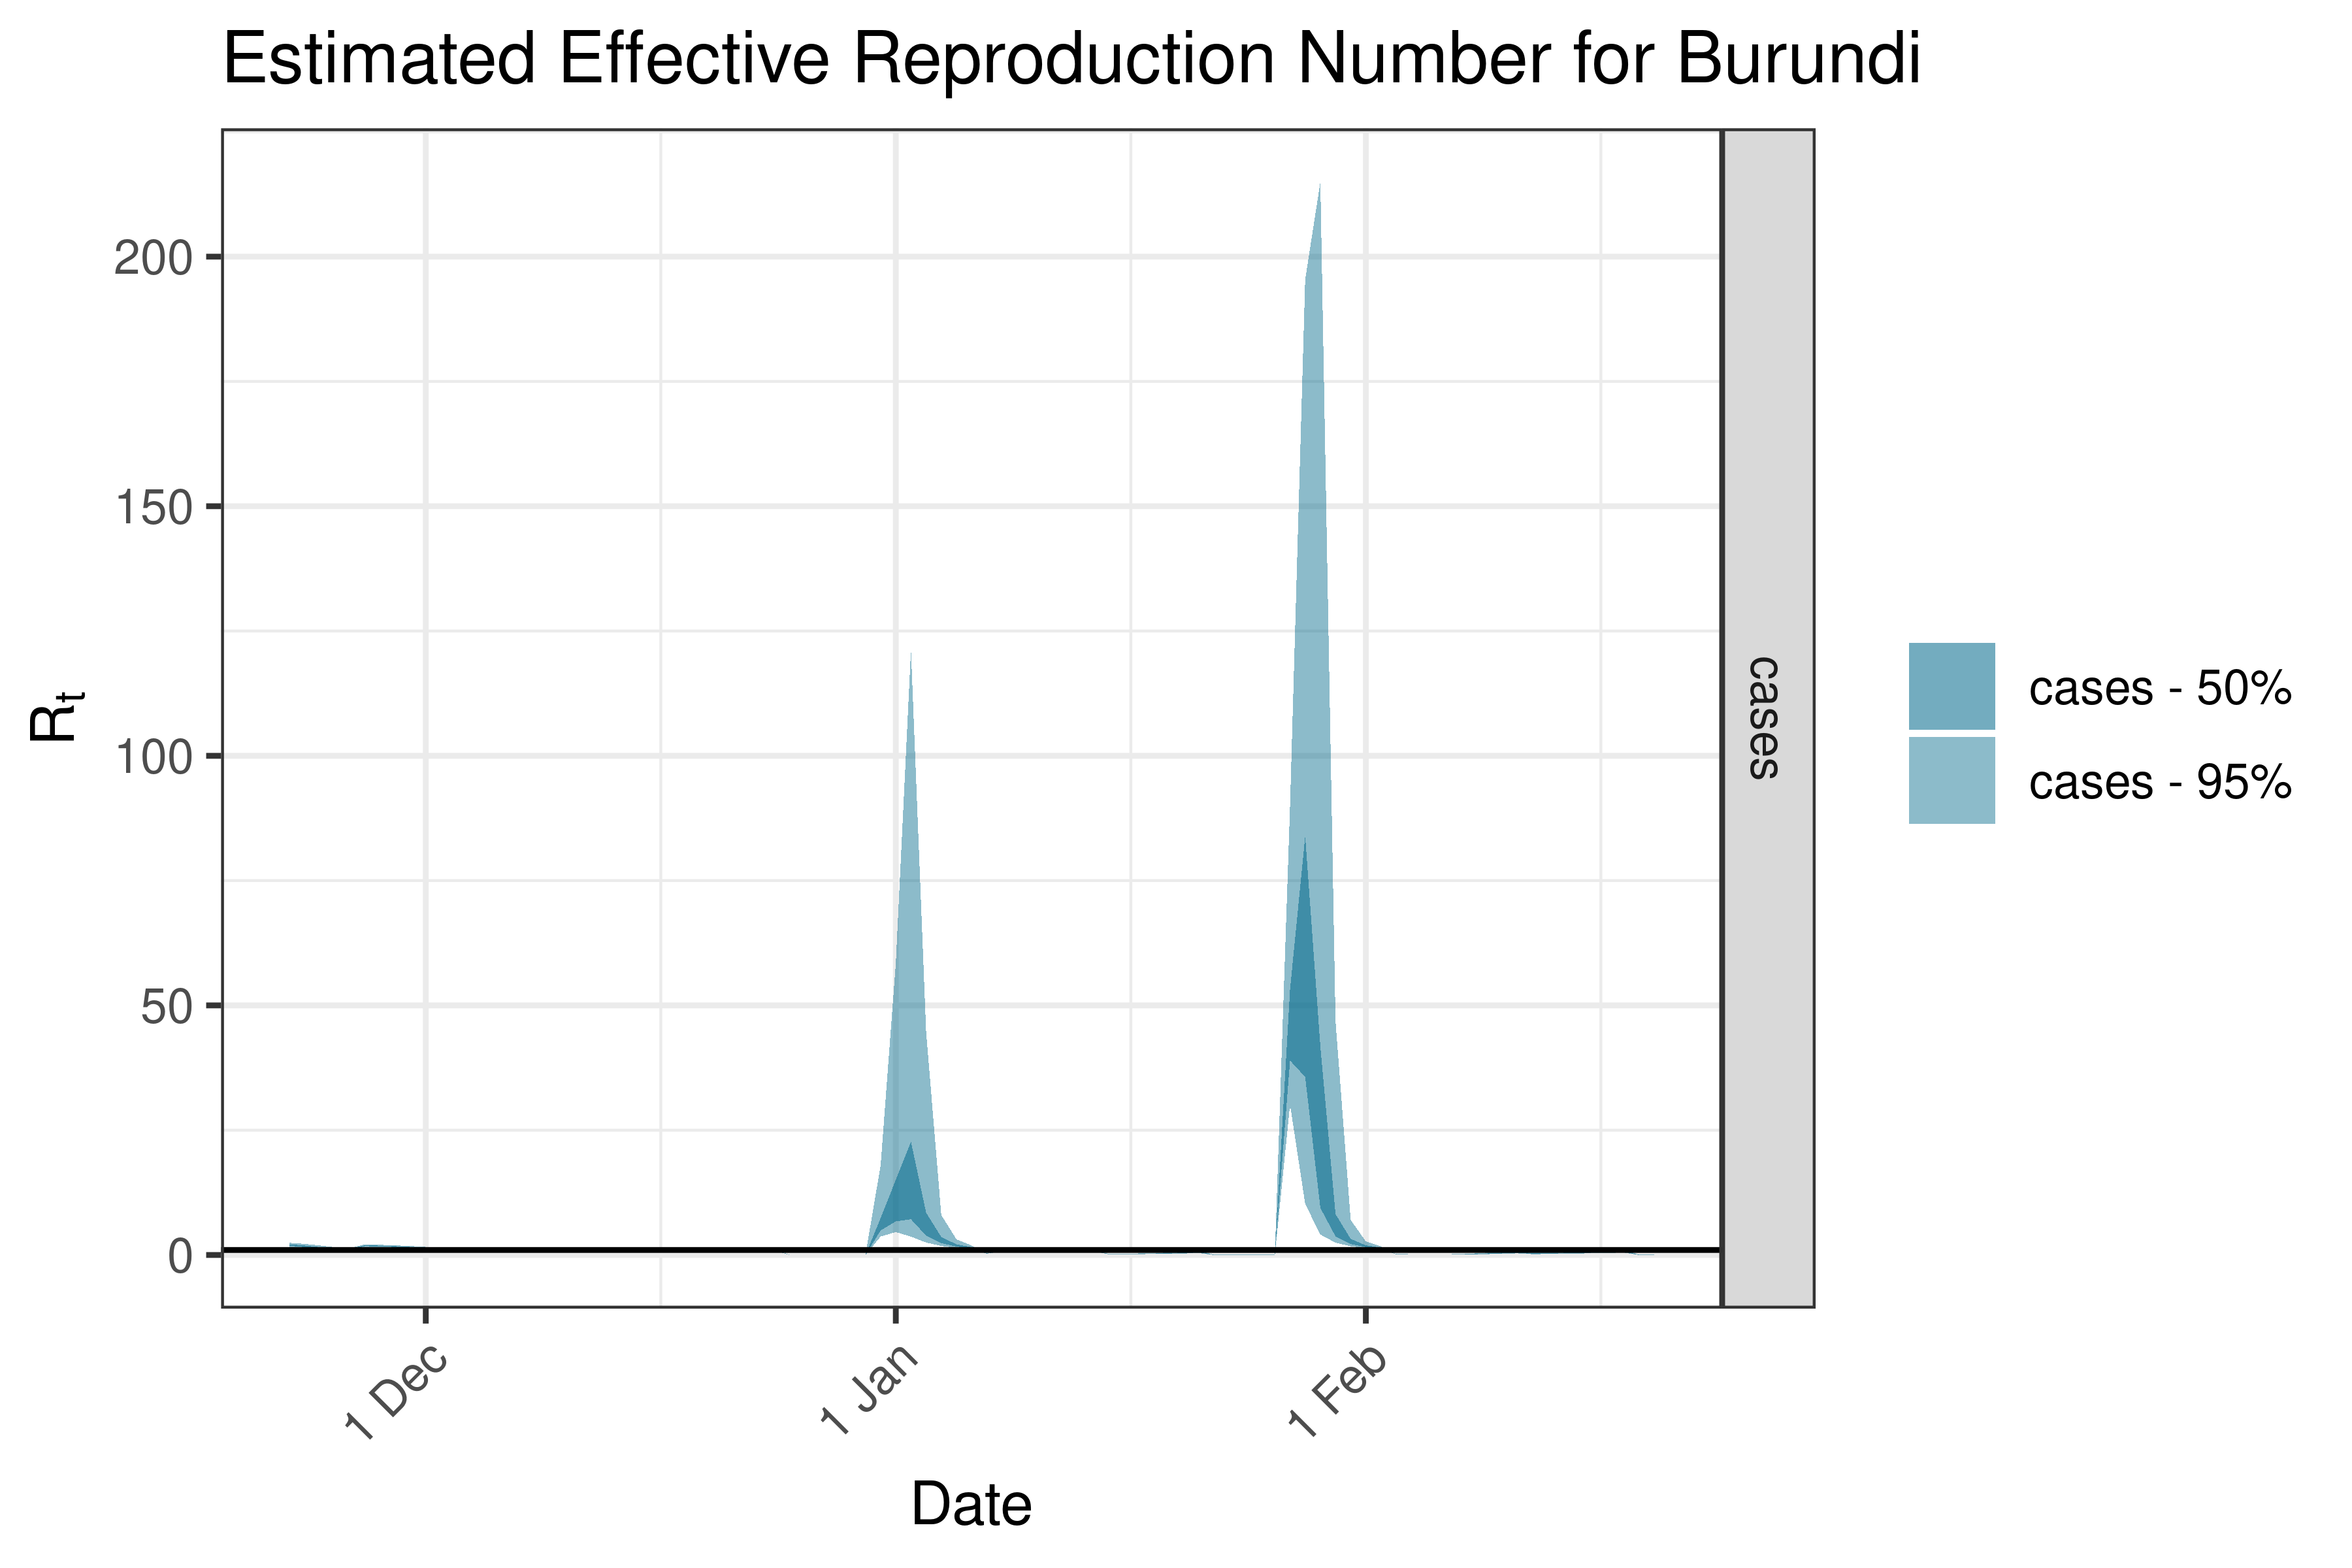
6.5.1.6 Burundi
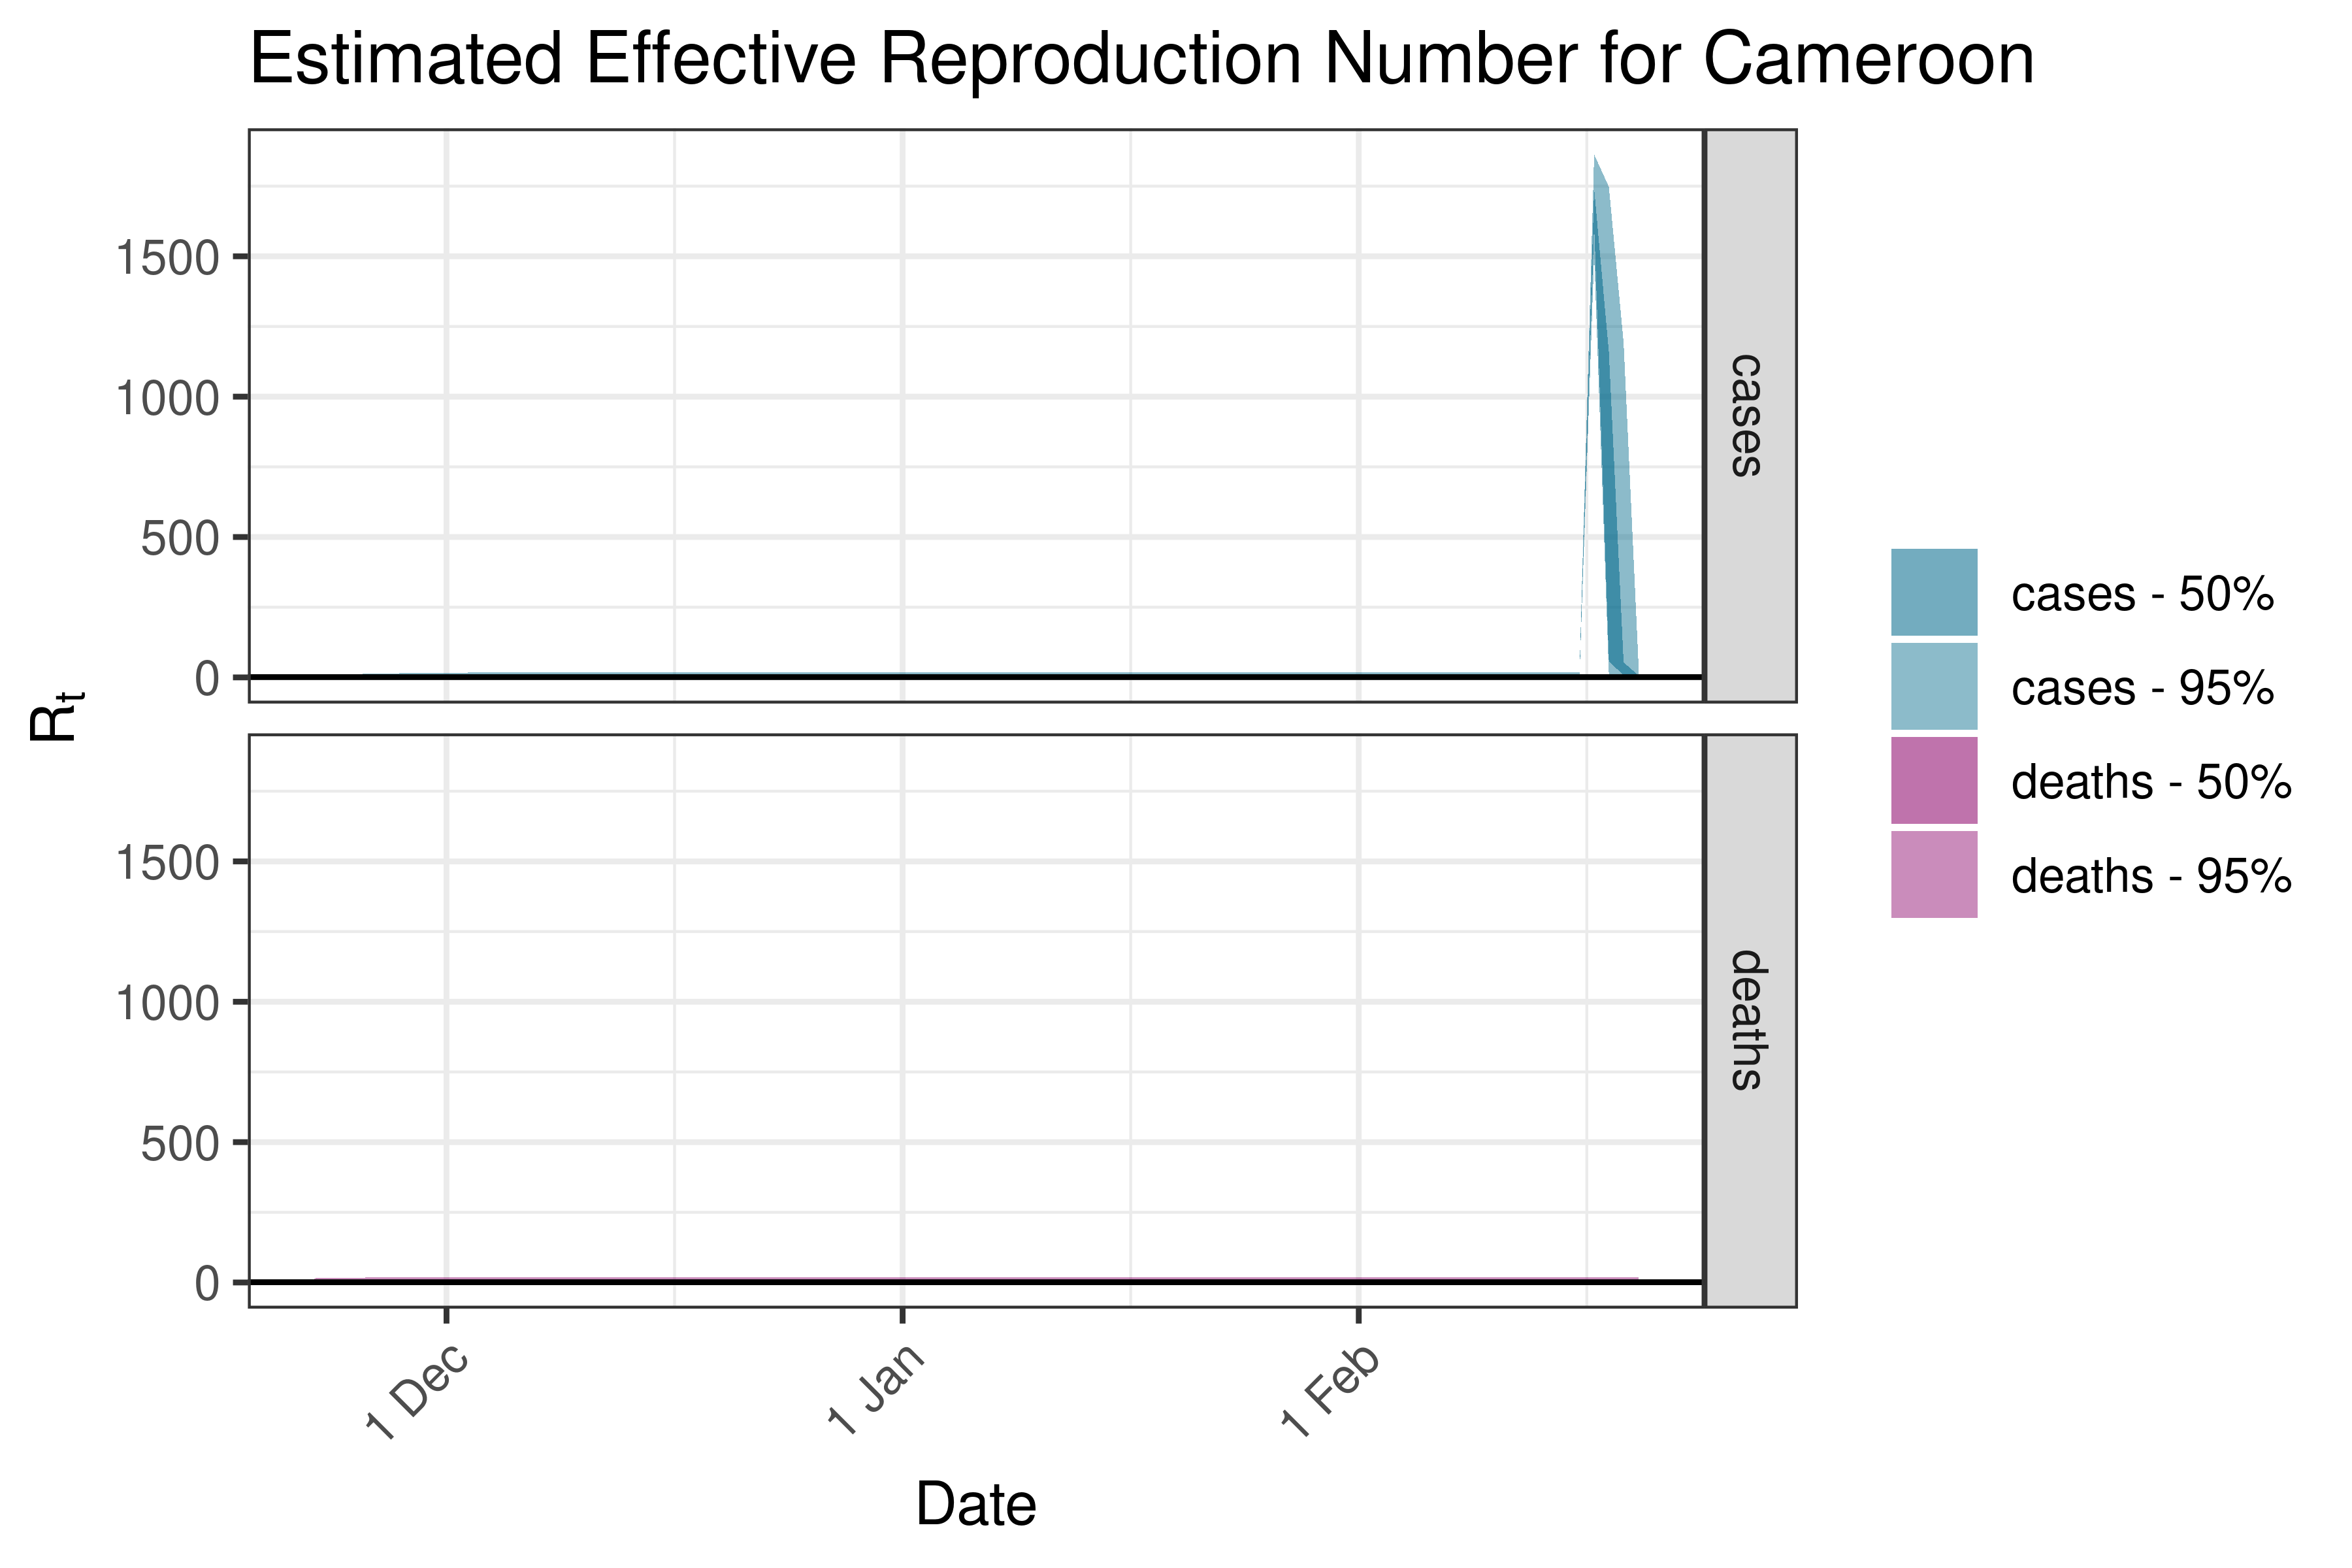
6.5.1.7 Cameroon
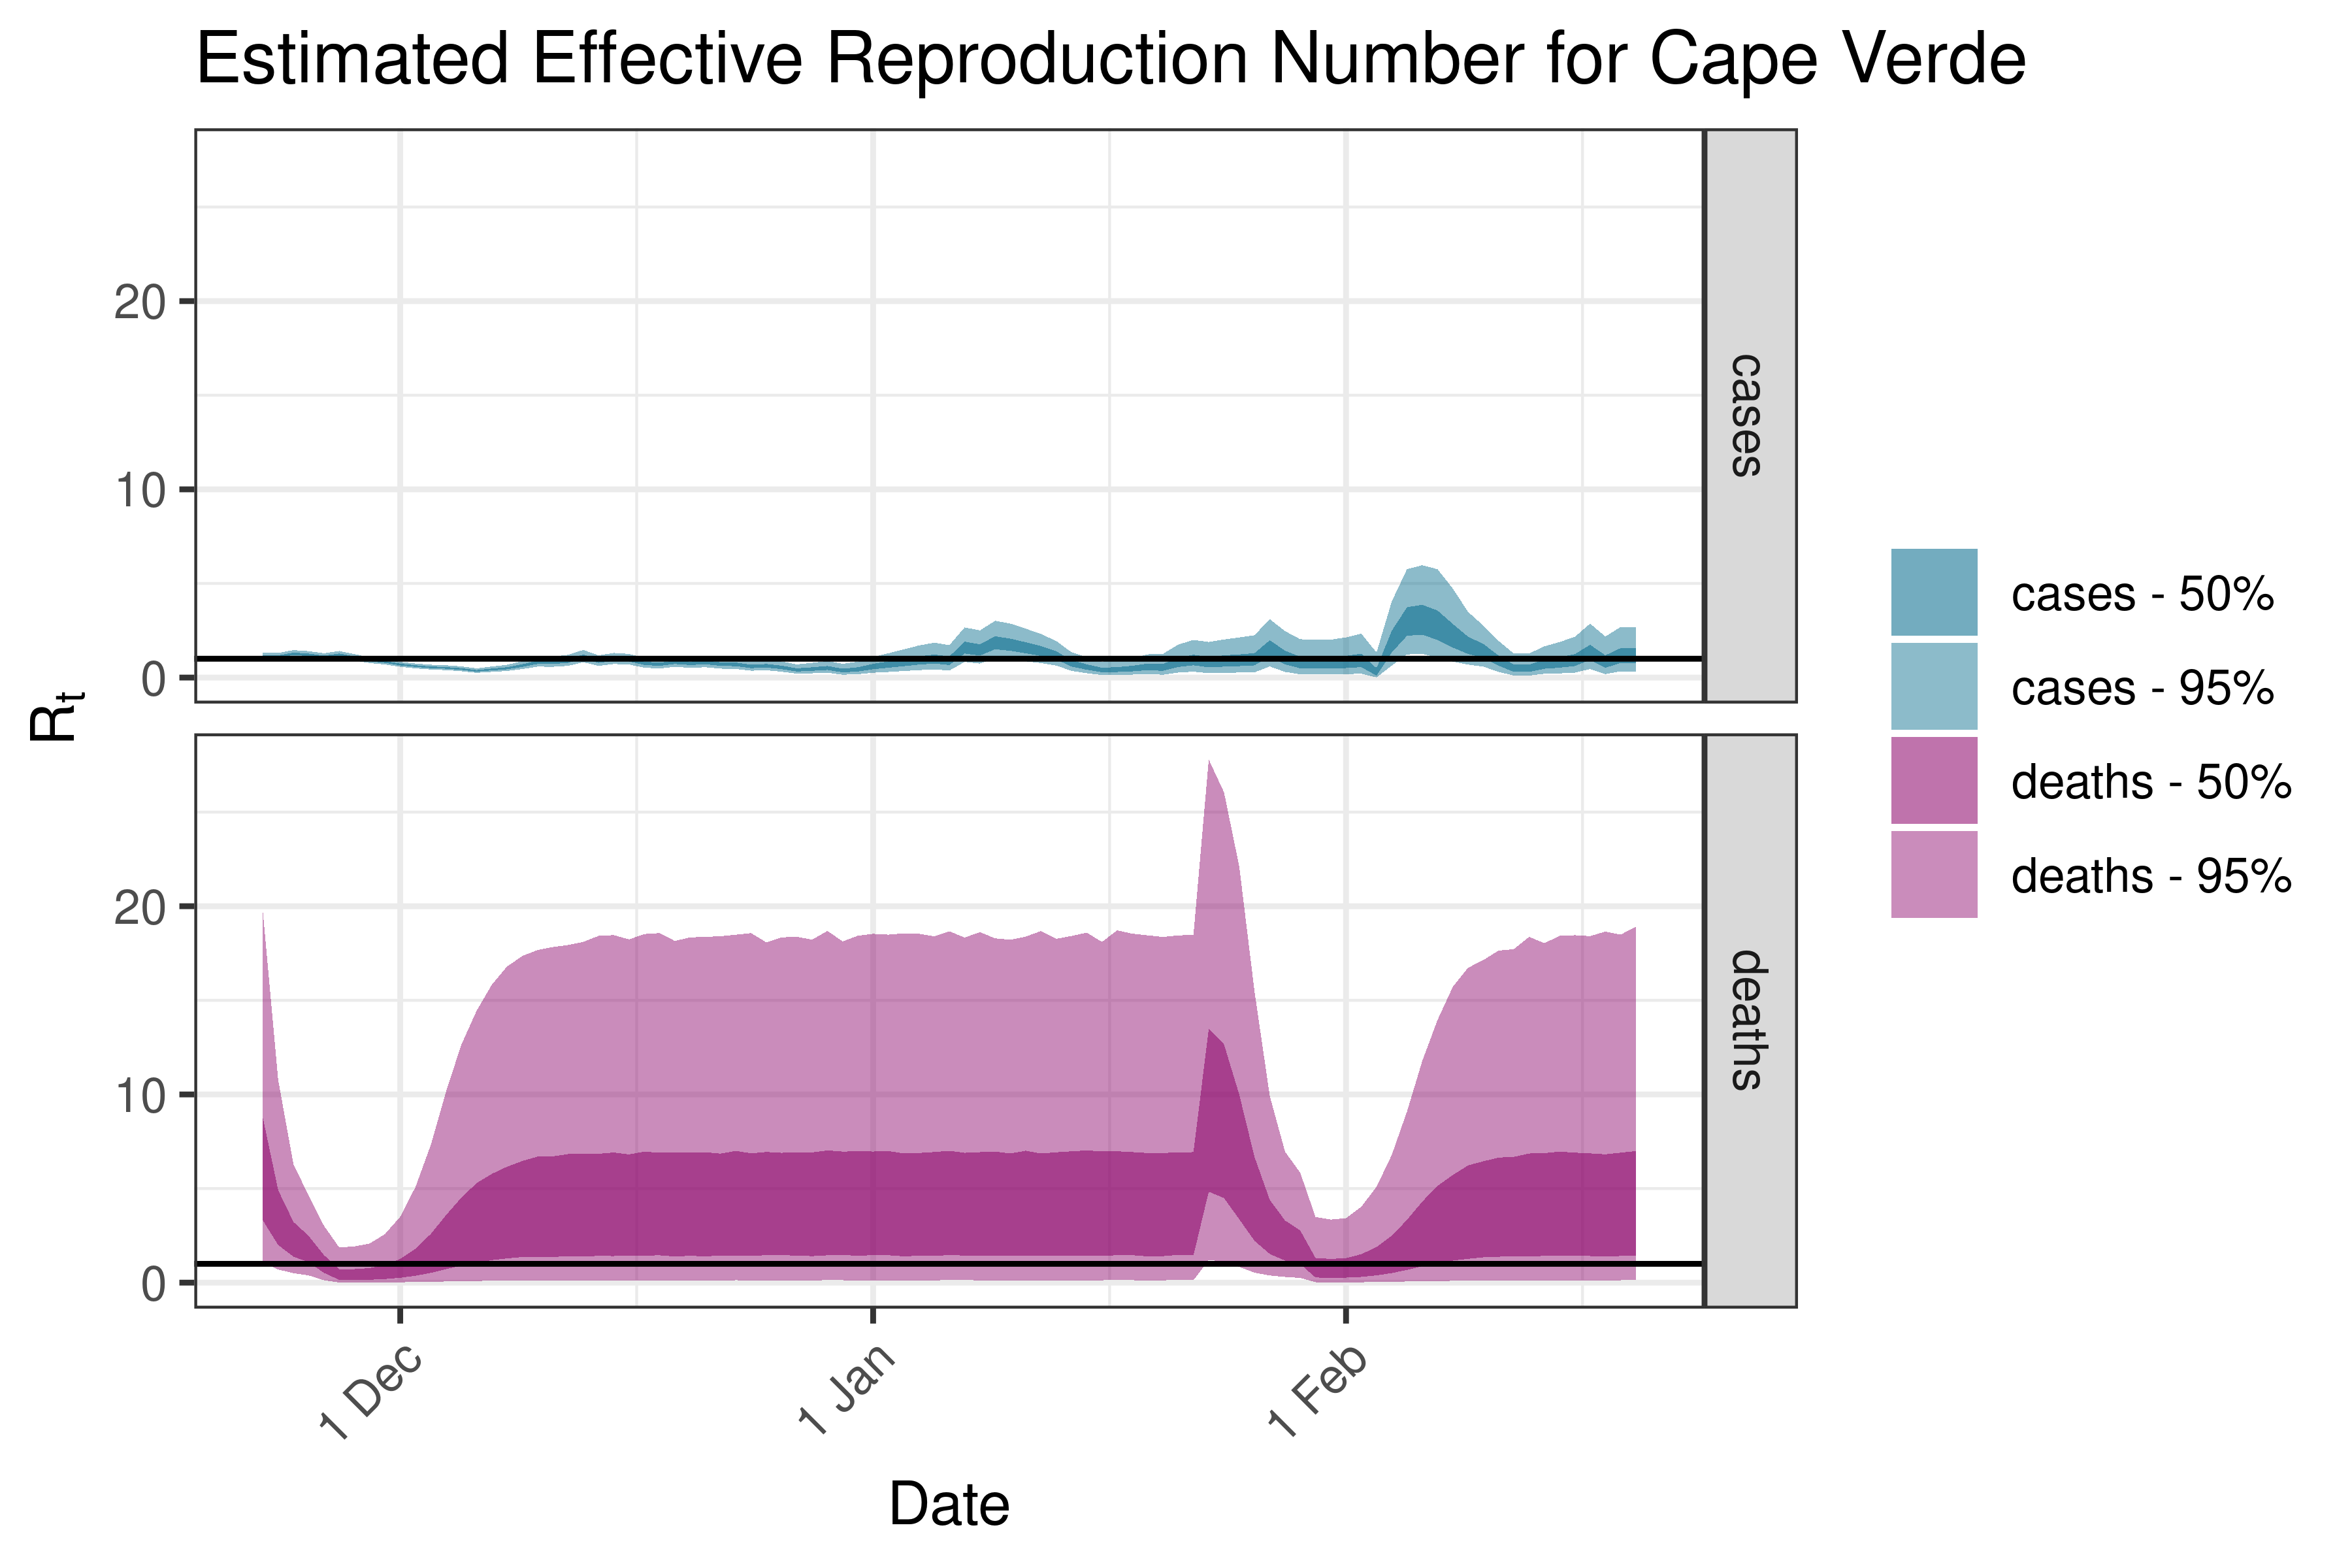
6.5.1.8 Cape Verde
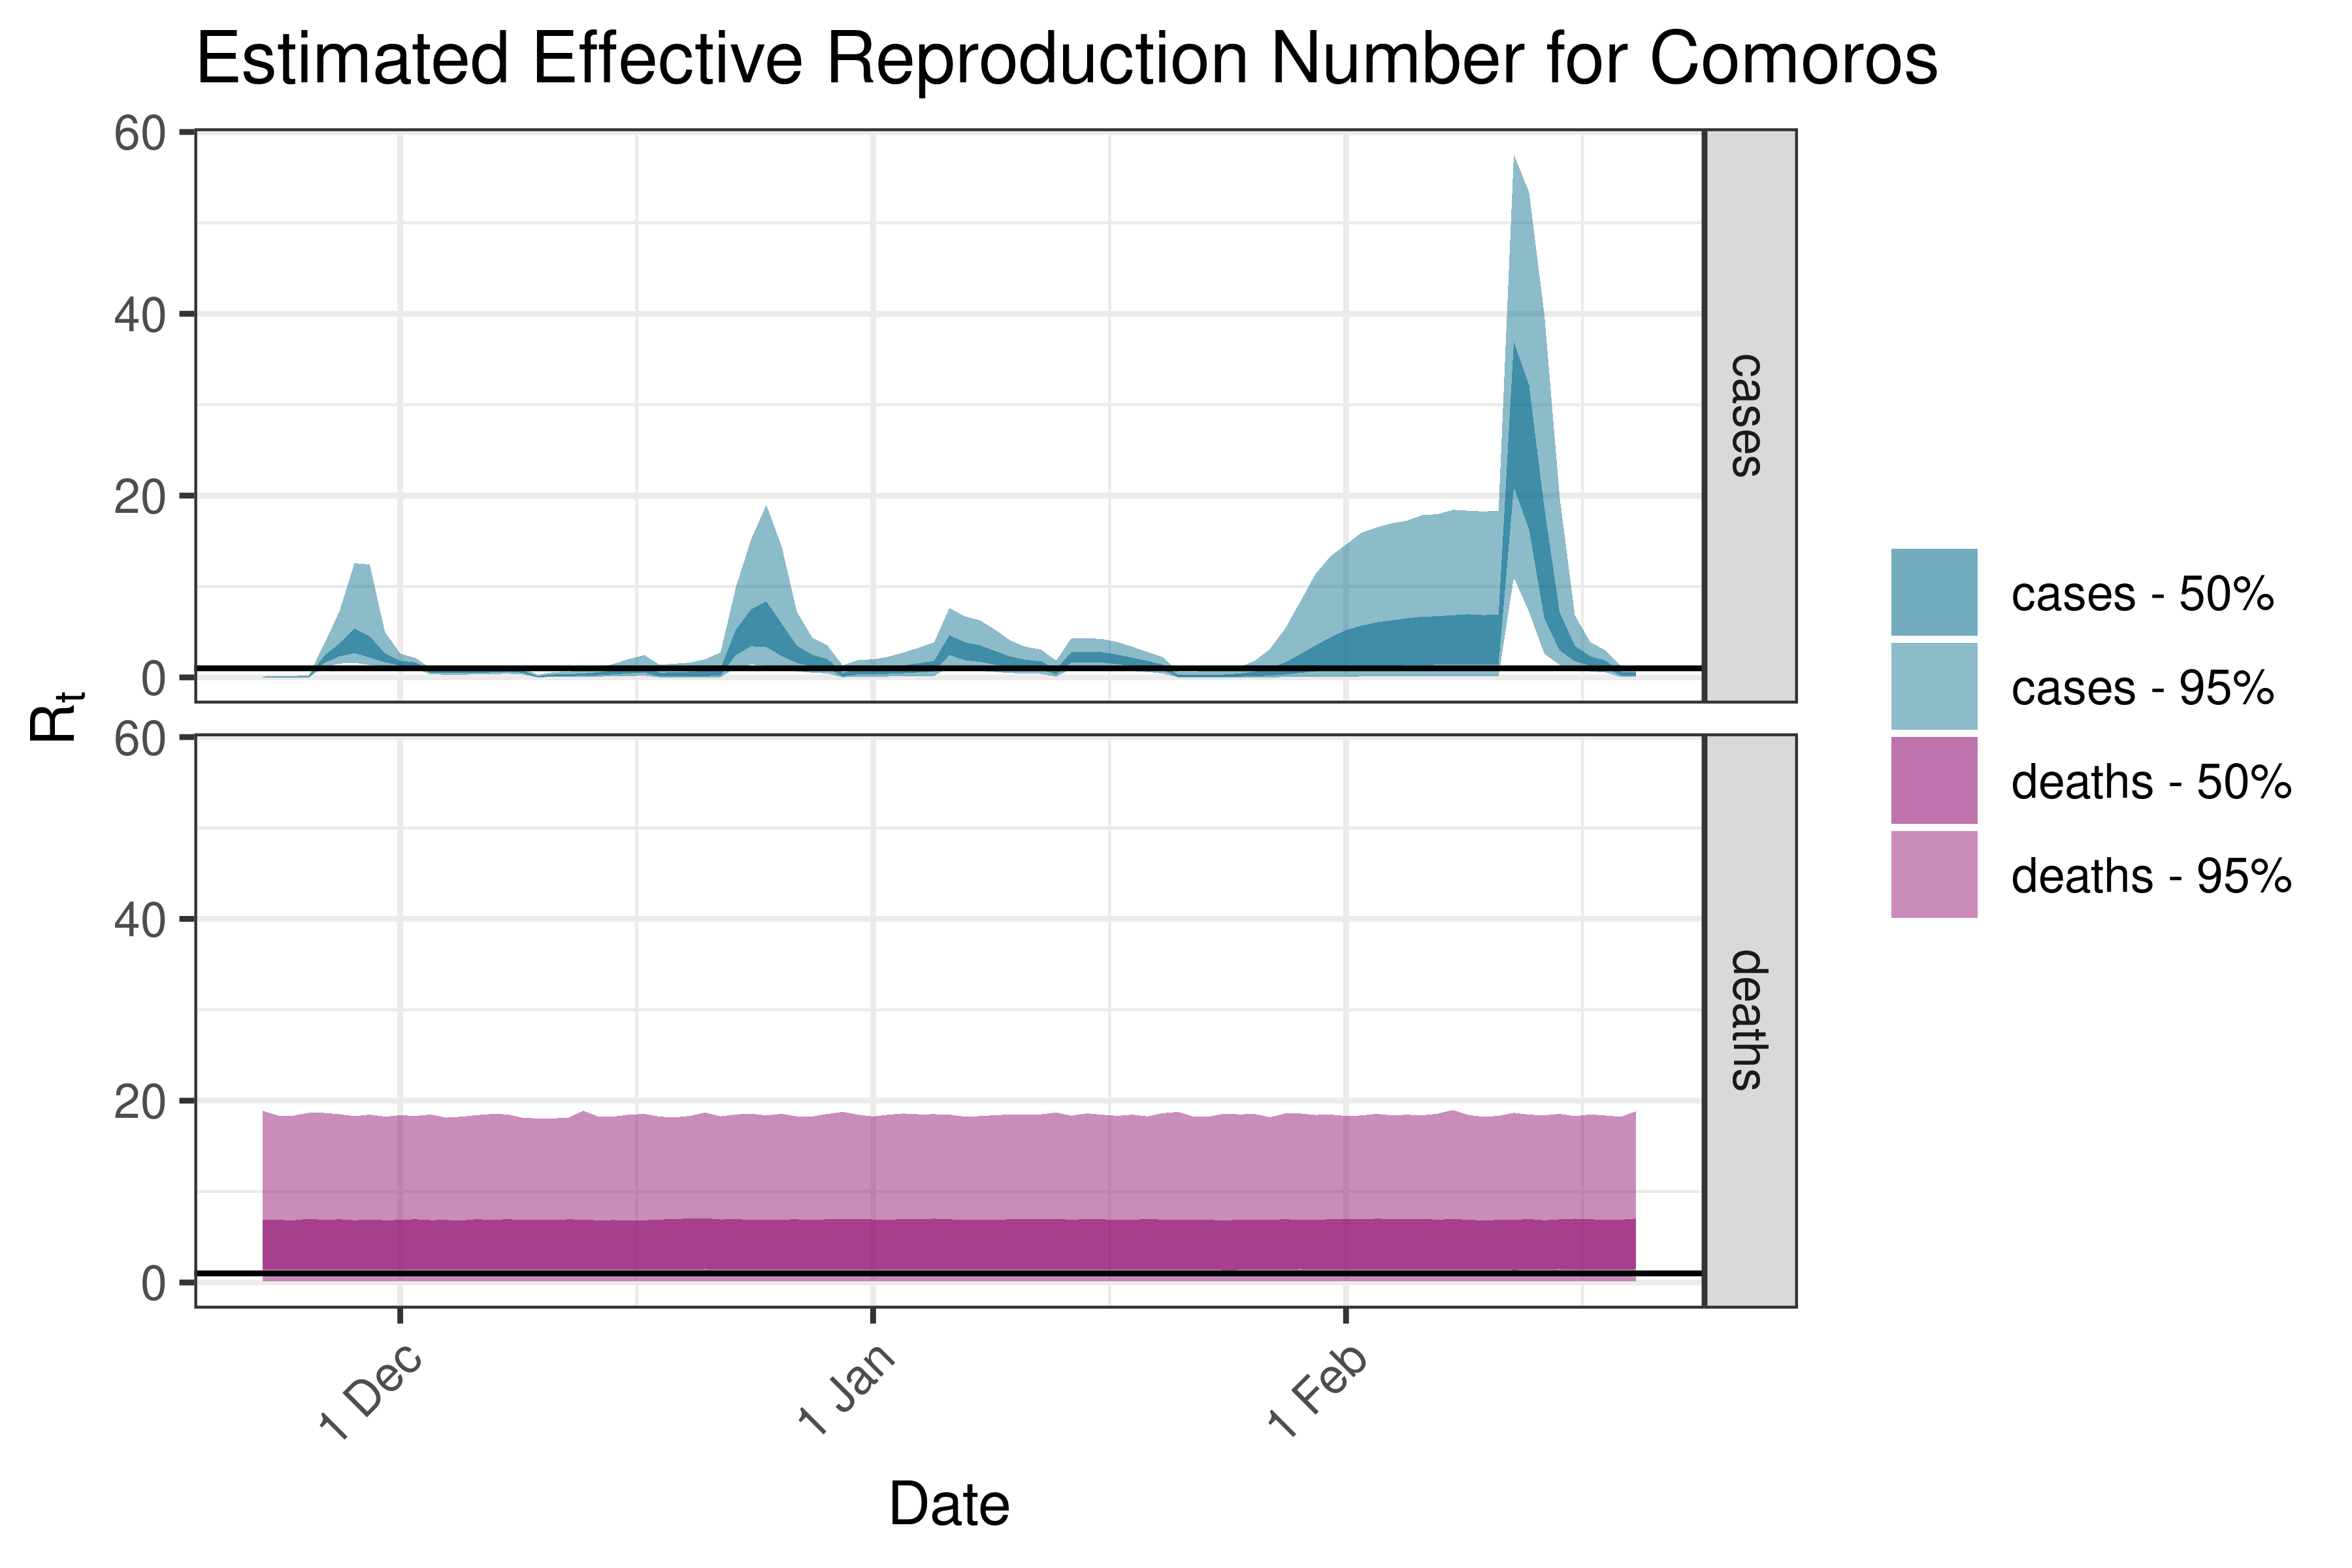
6.5.1.9 Comoros
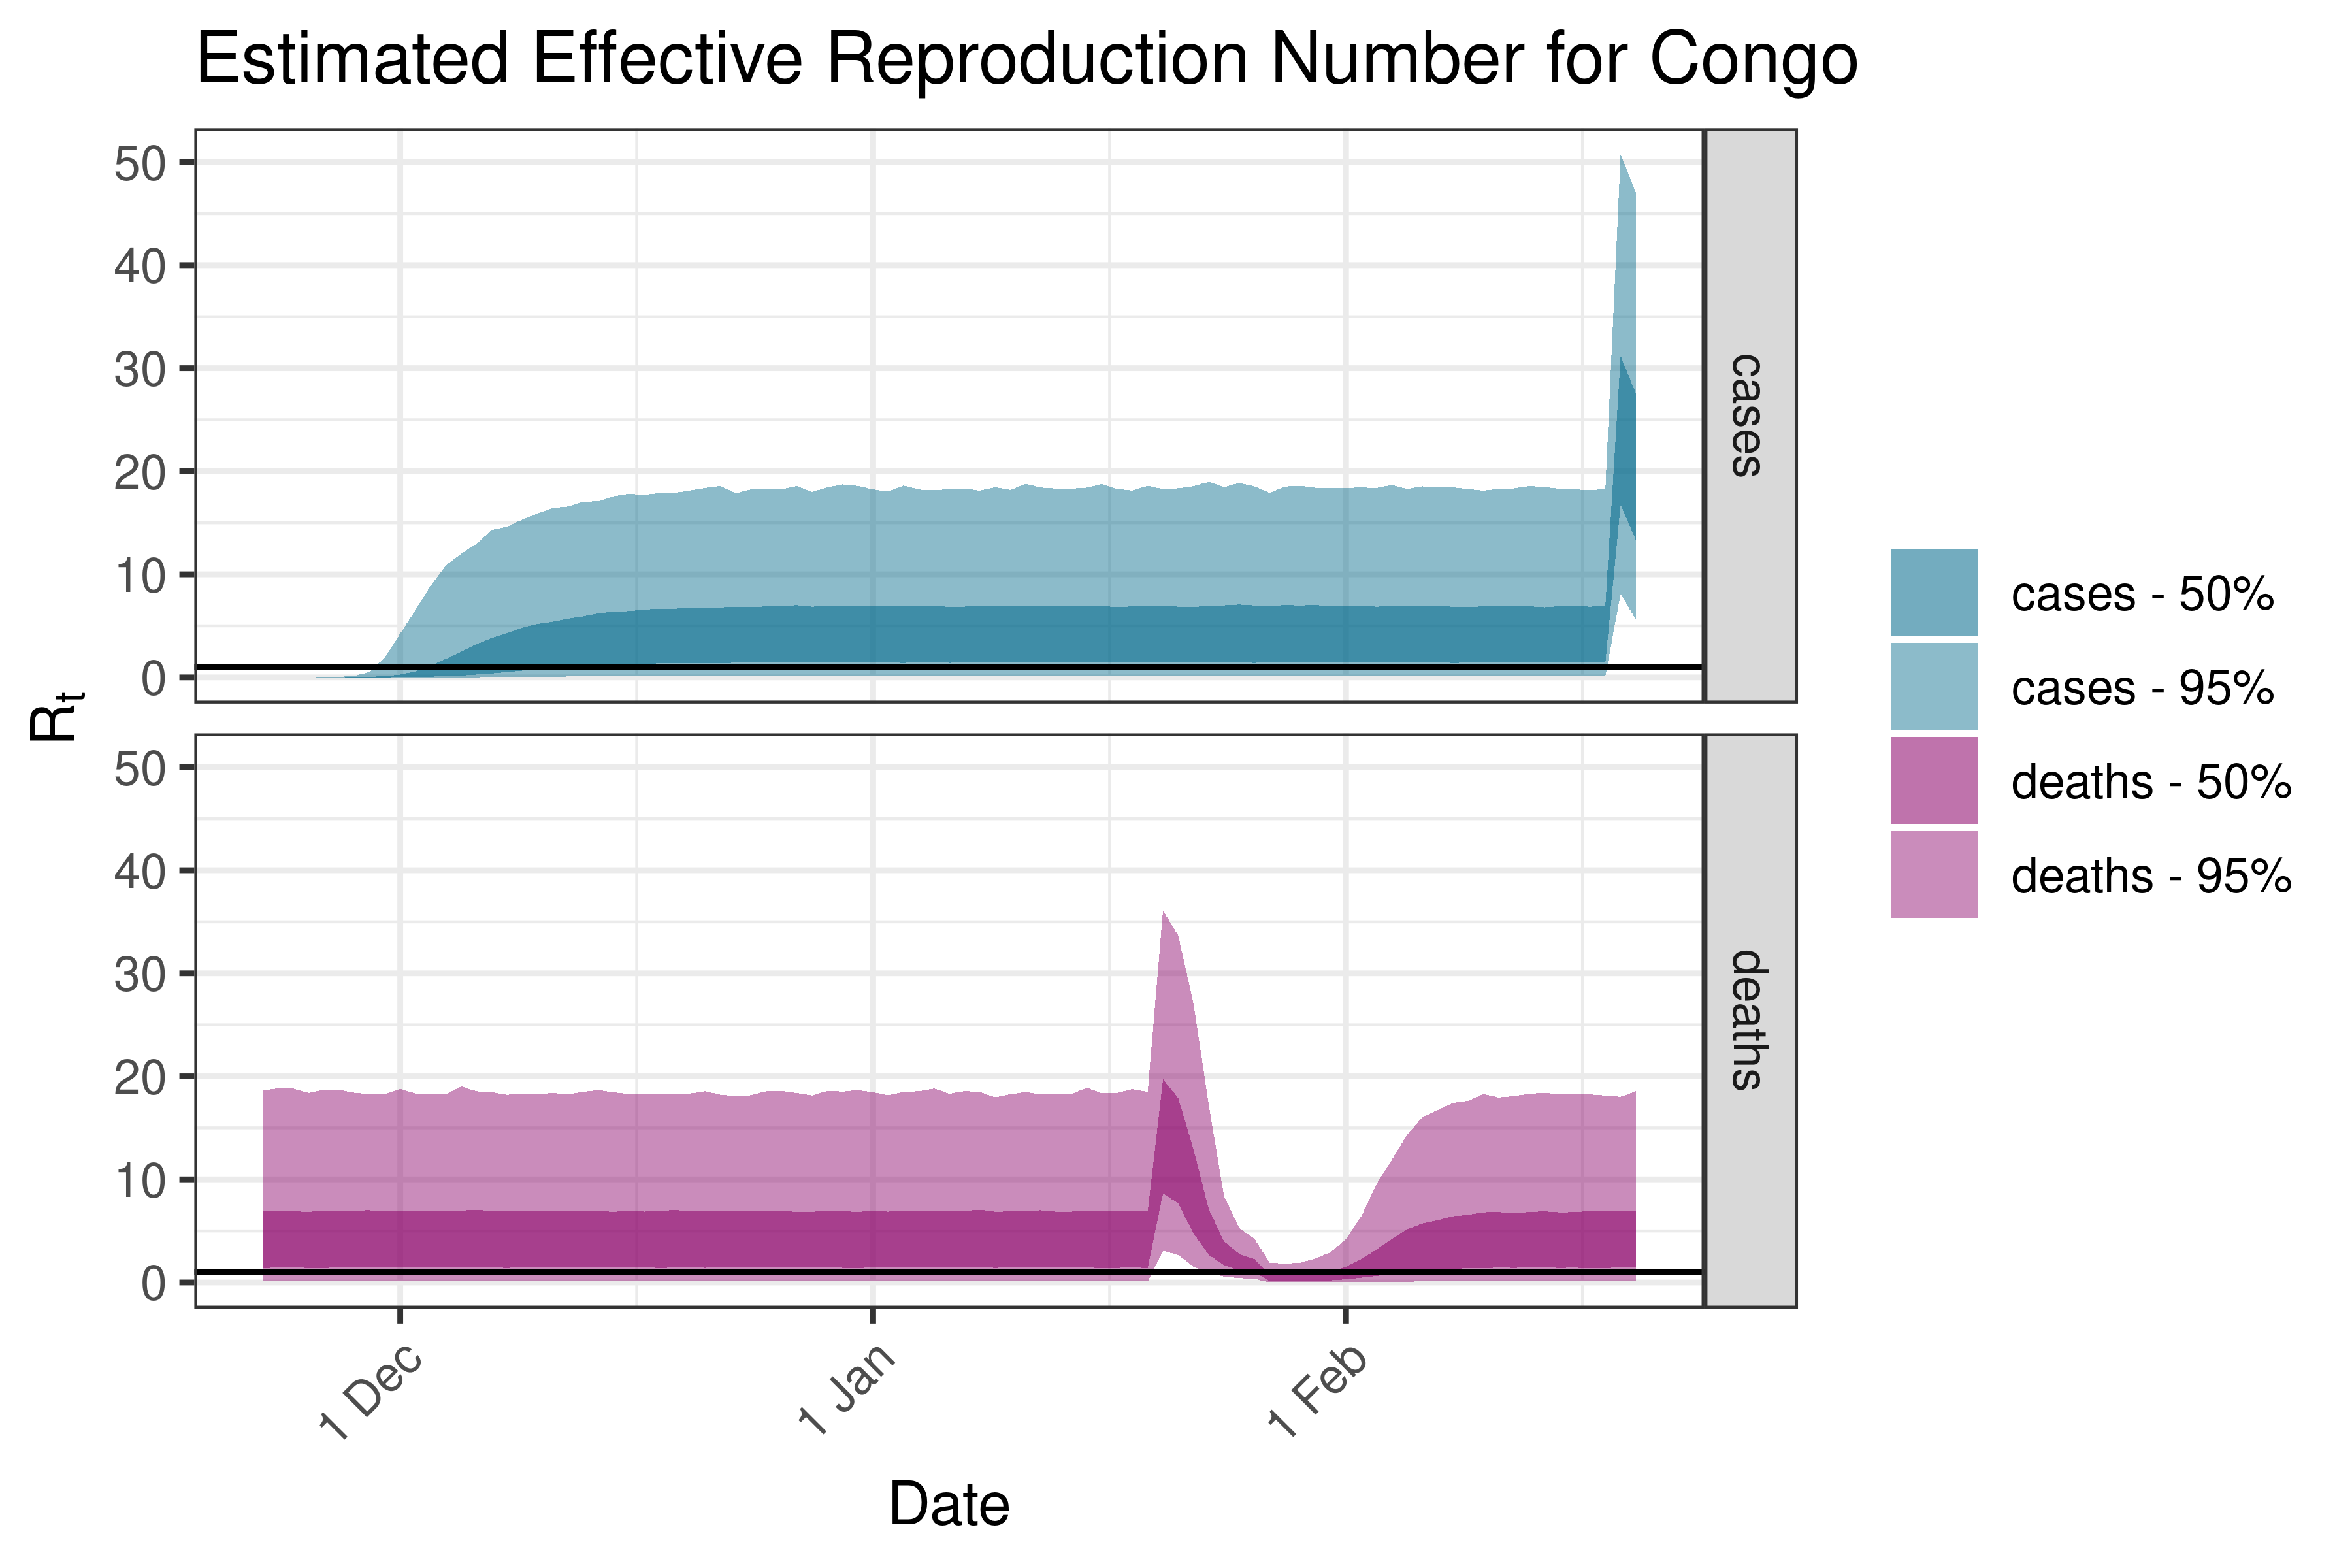
6.5.1.10 Congo
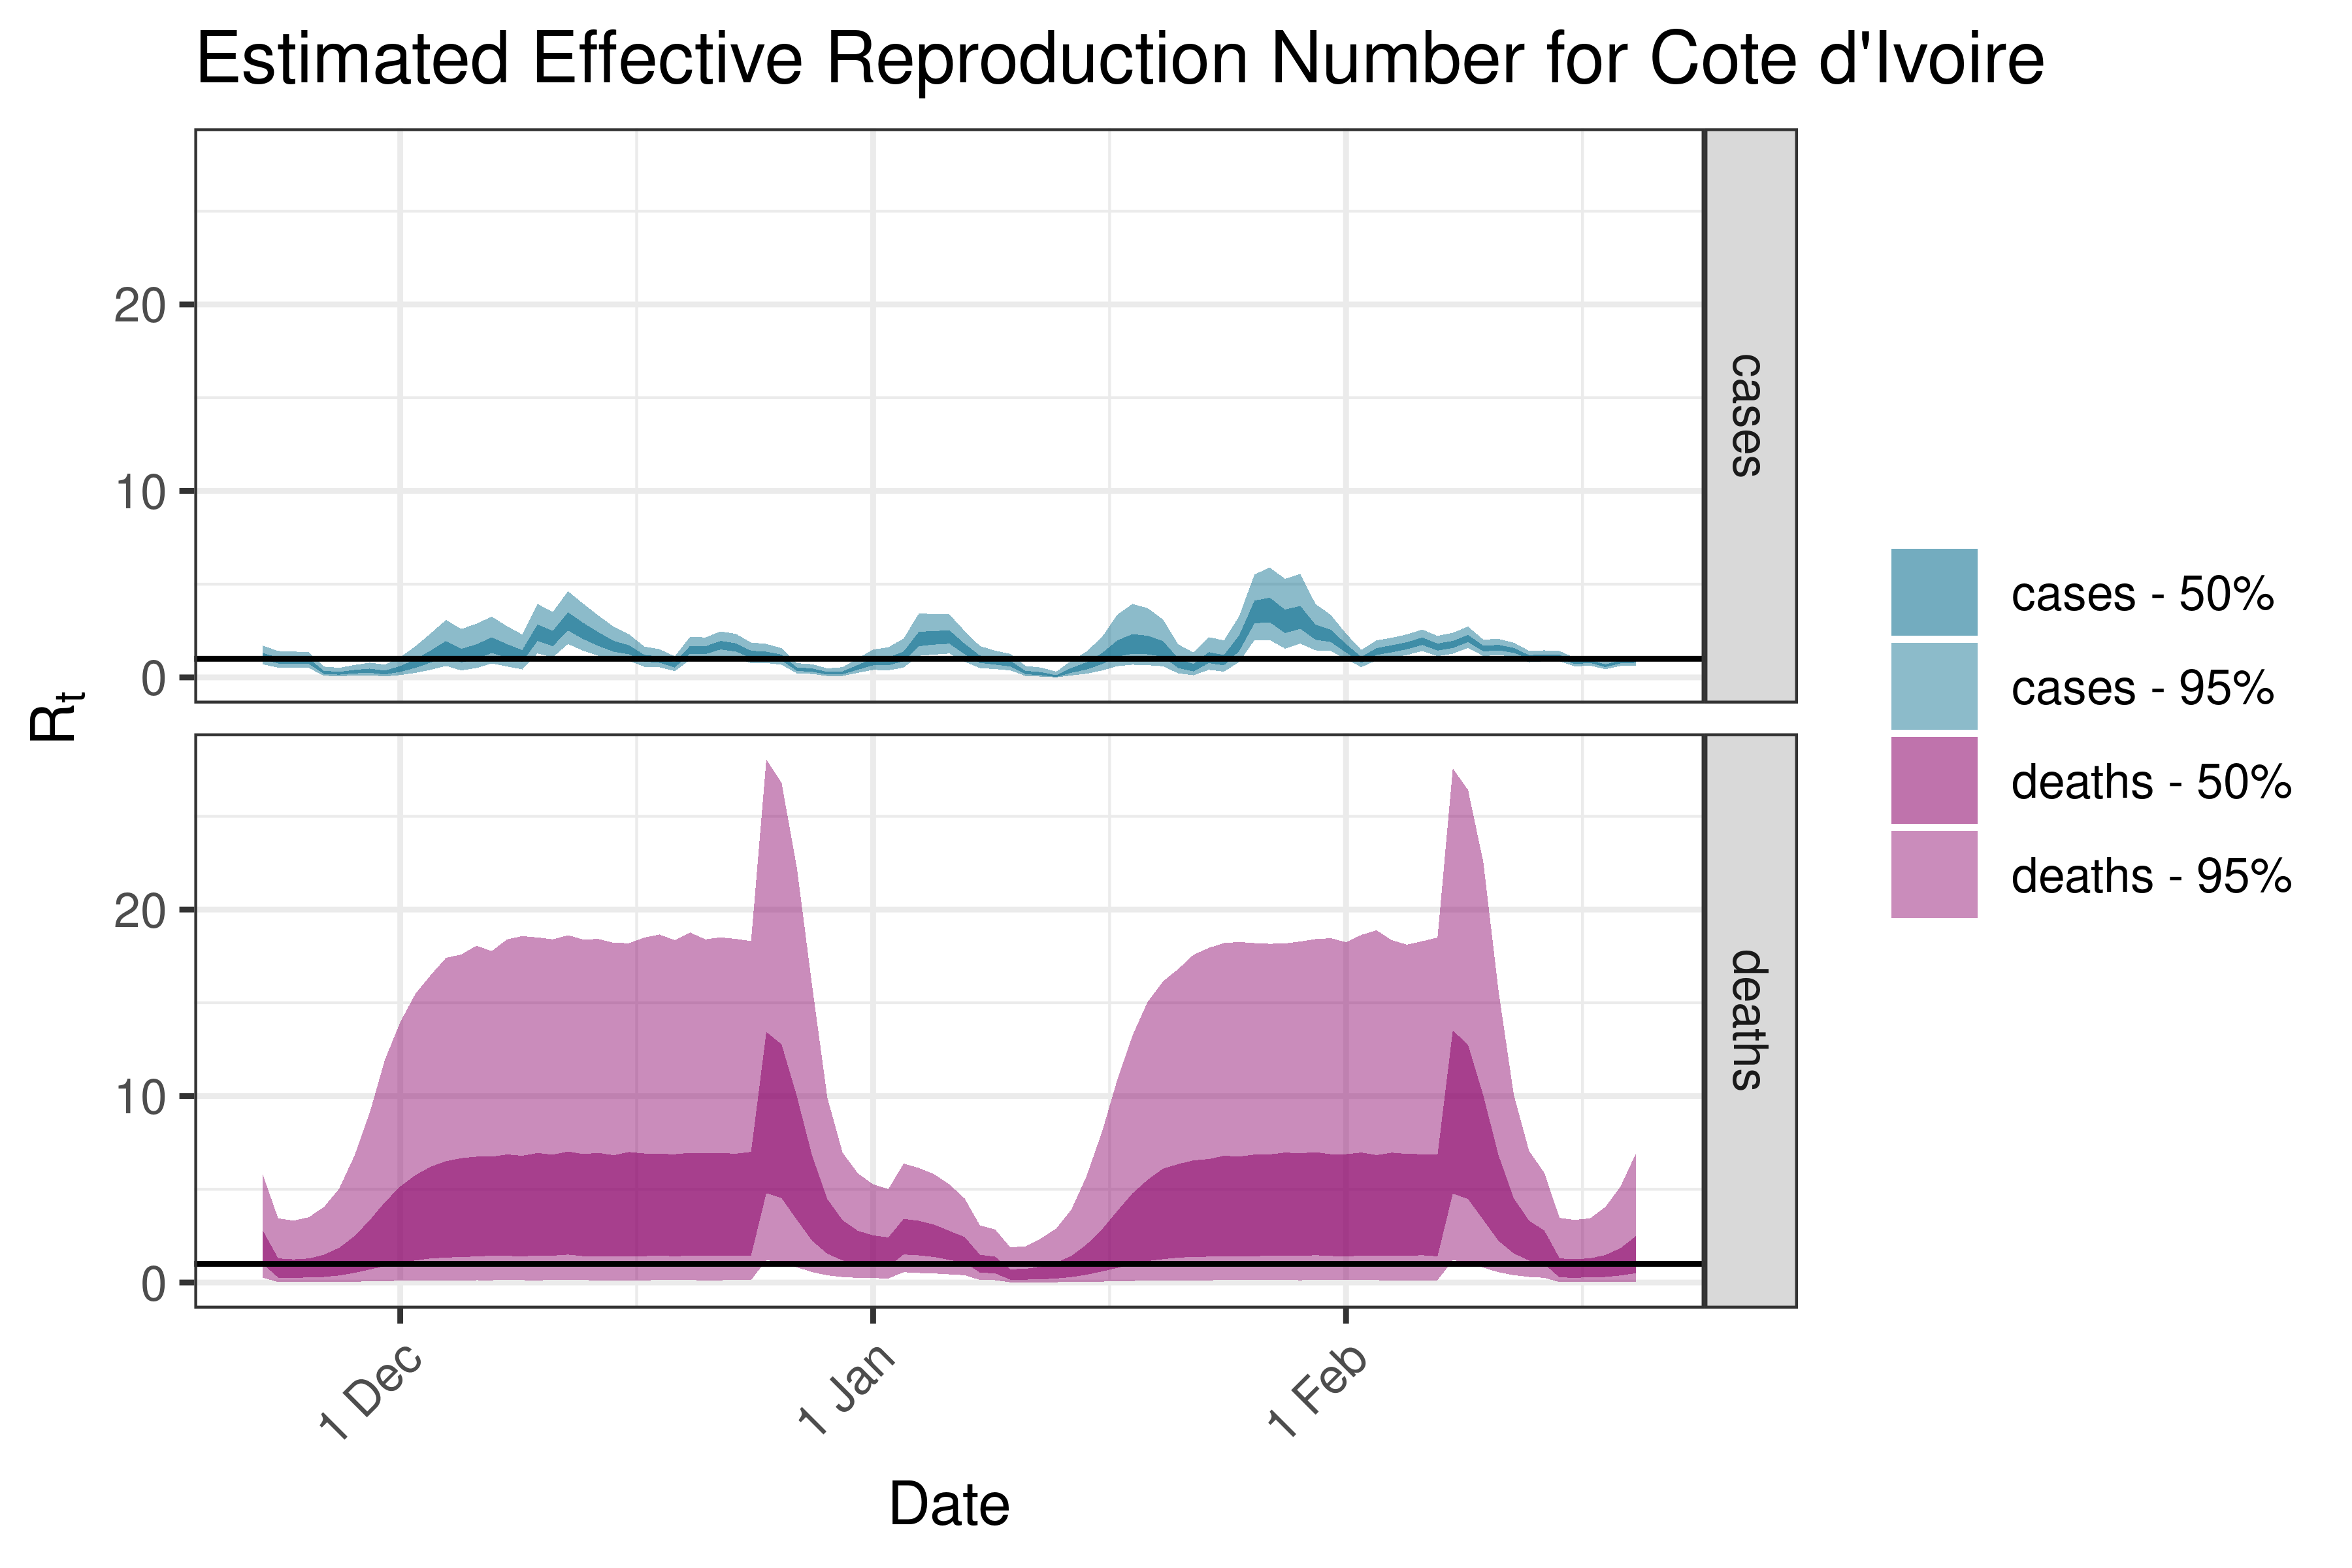
6.5.1.11 Cote d’Ivoire
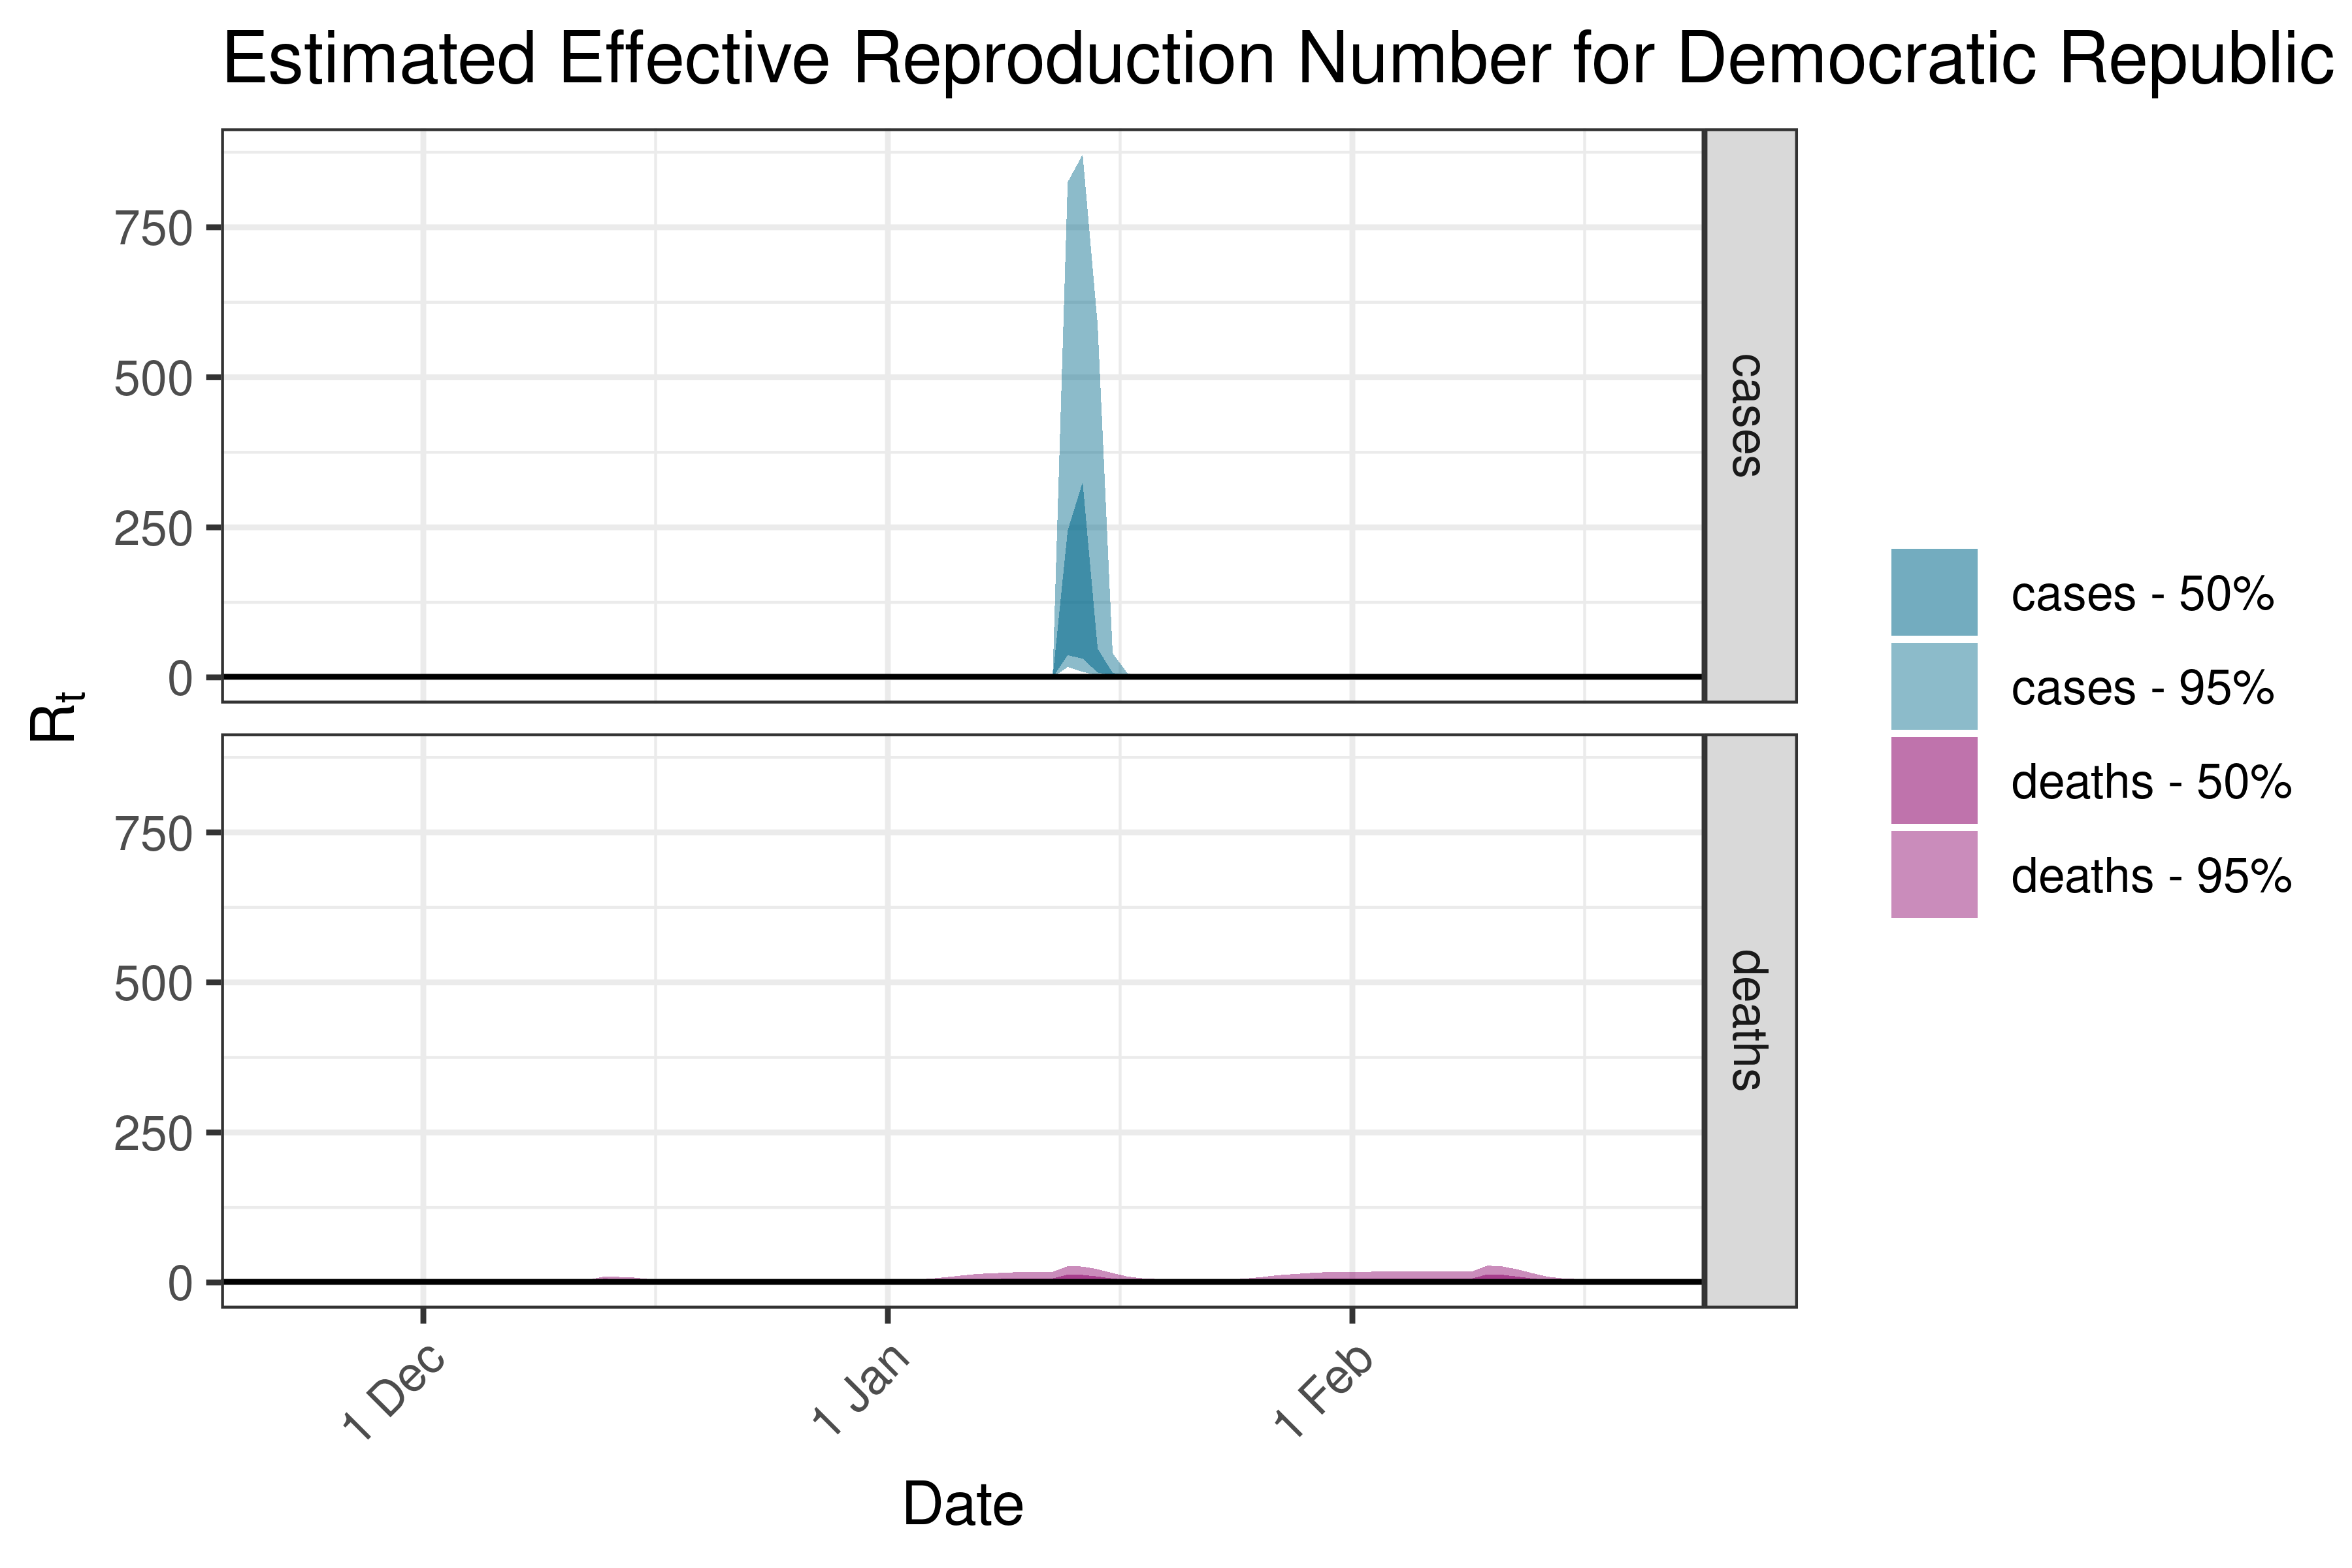
6.5.1.12 Democratic Republic of Congo
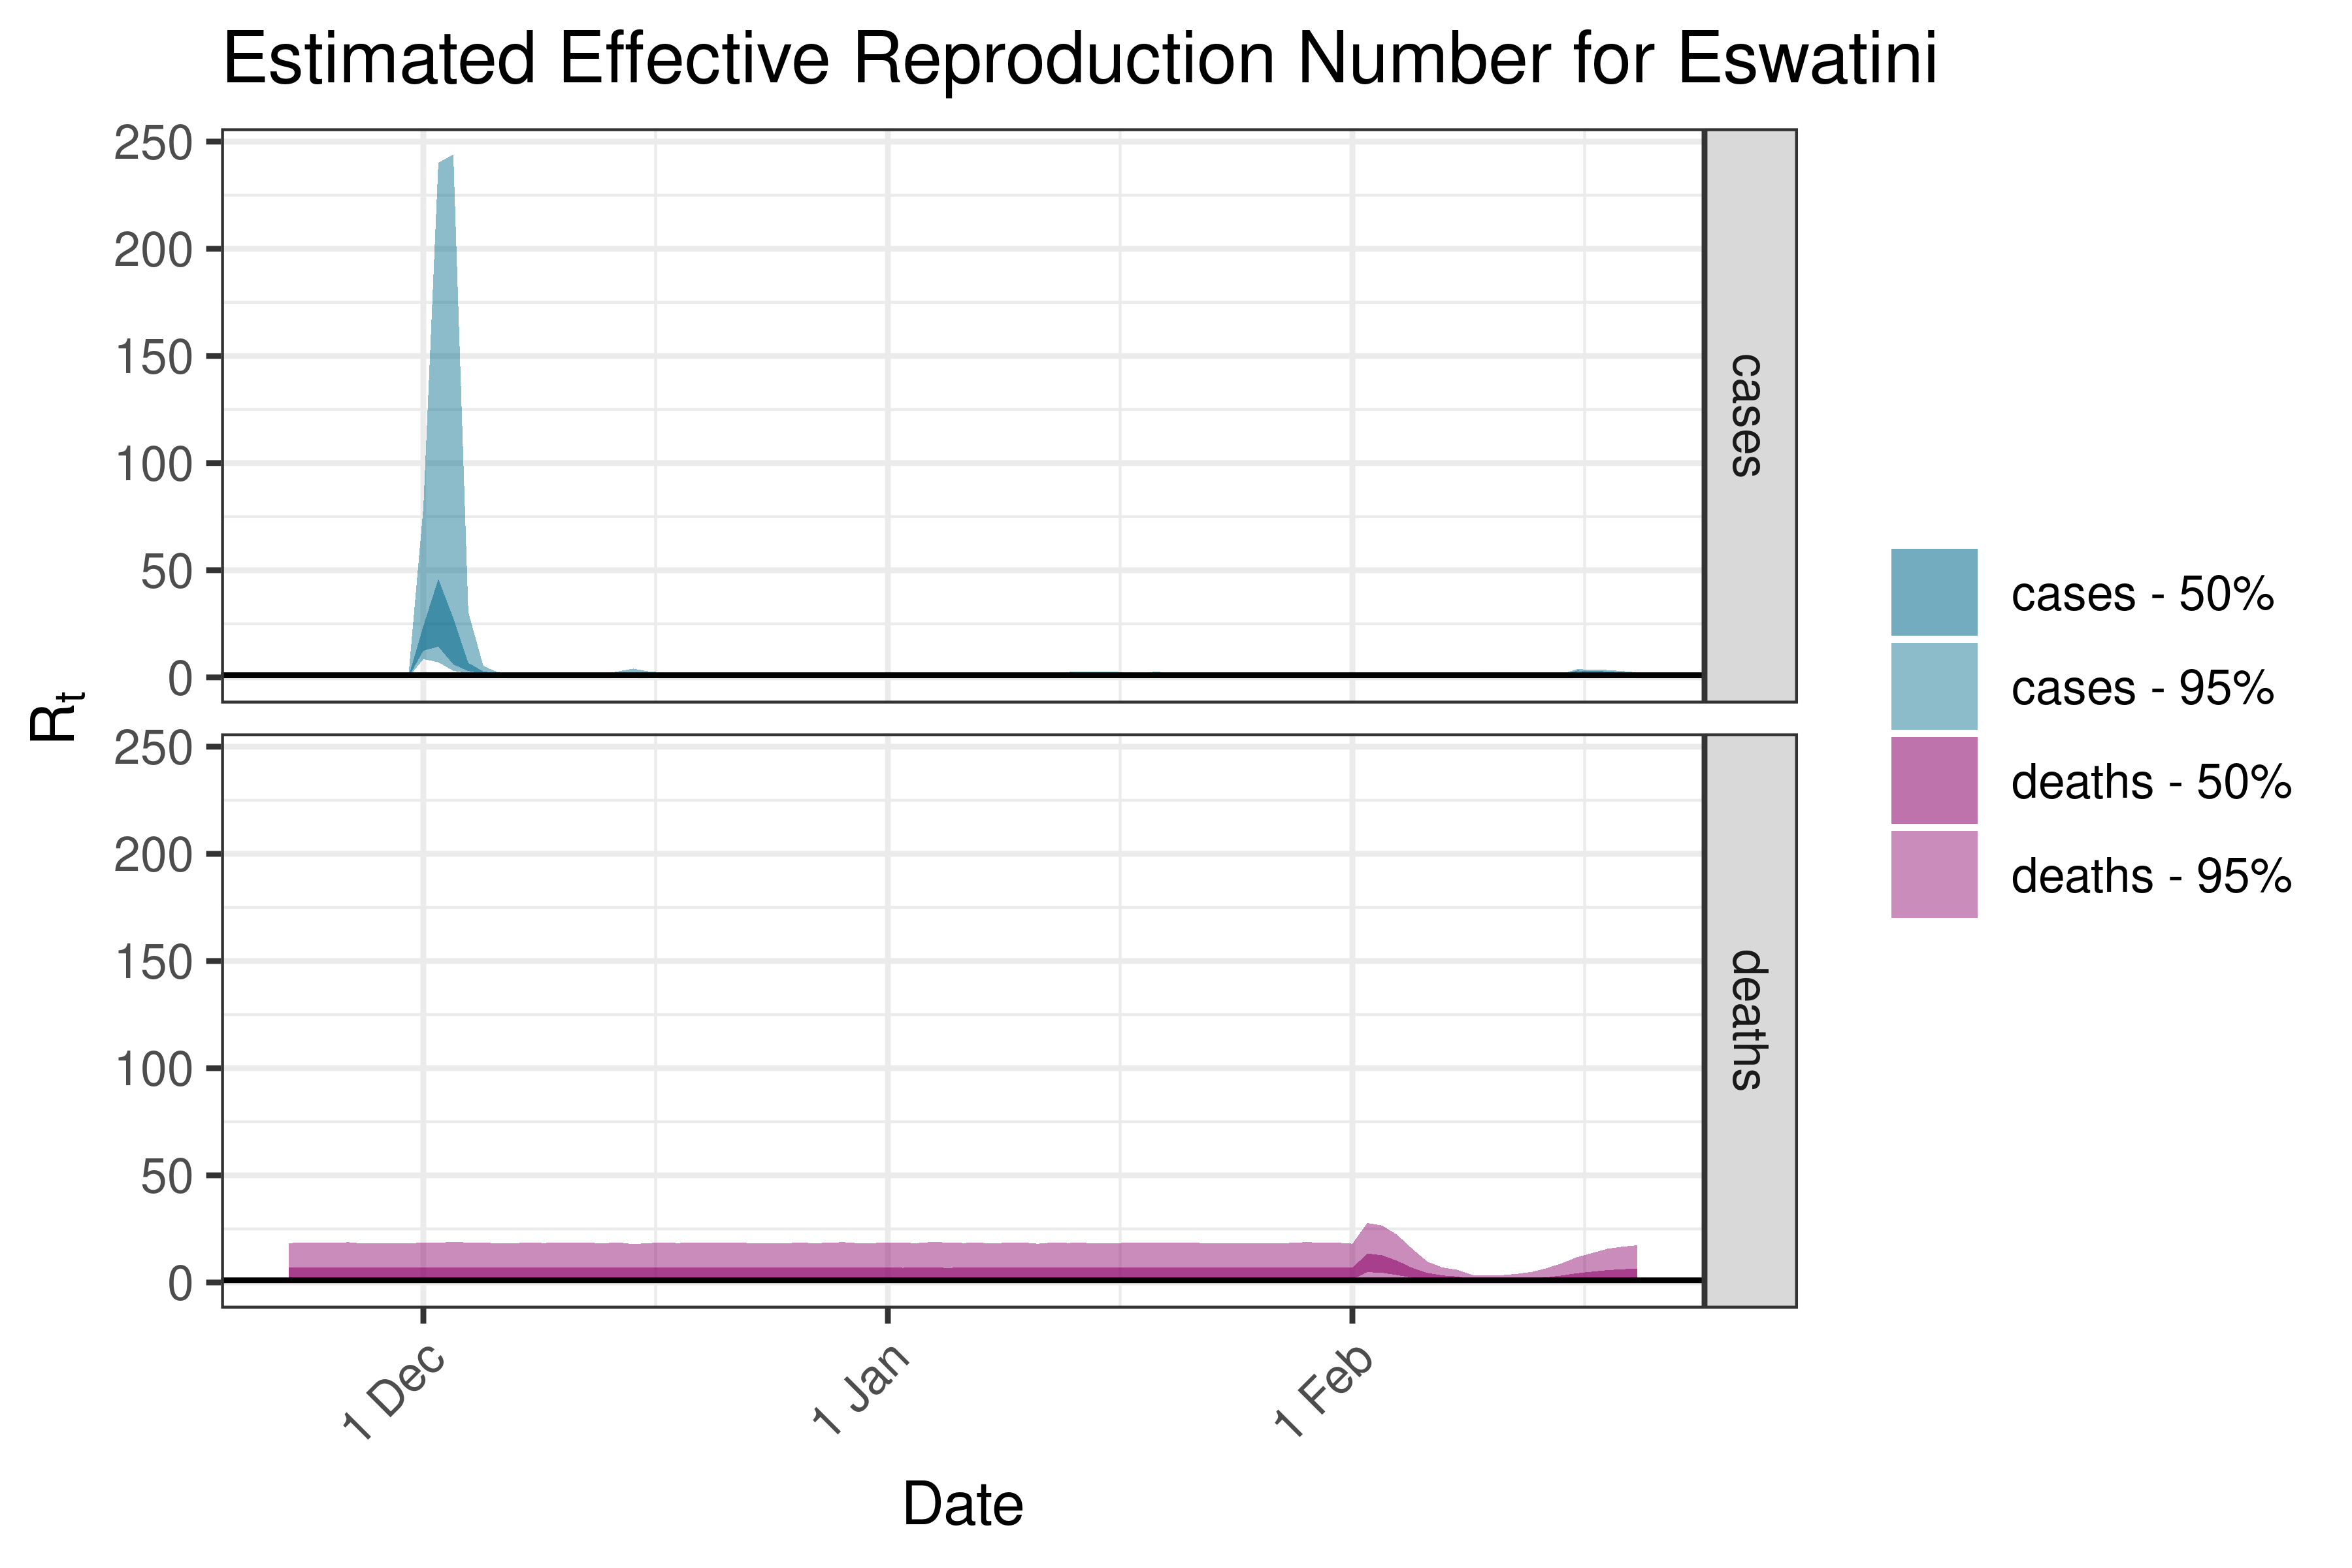
6.5.1.13 Eswatini
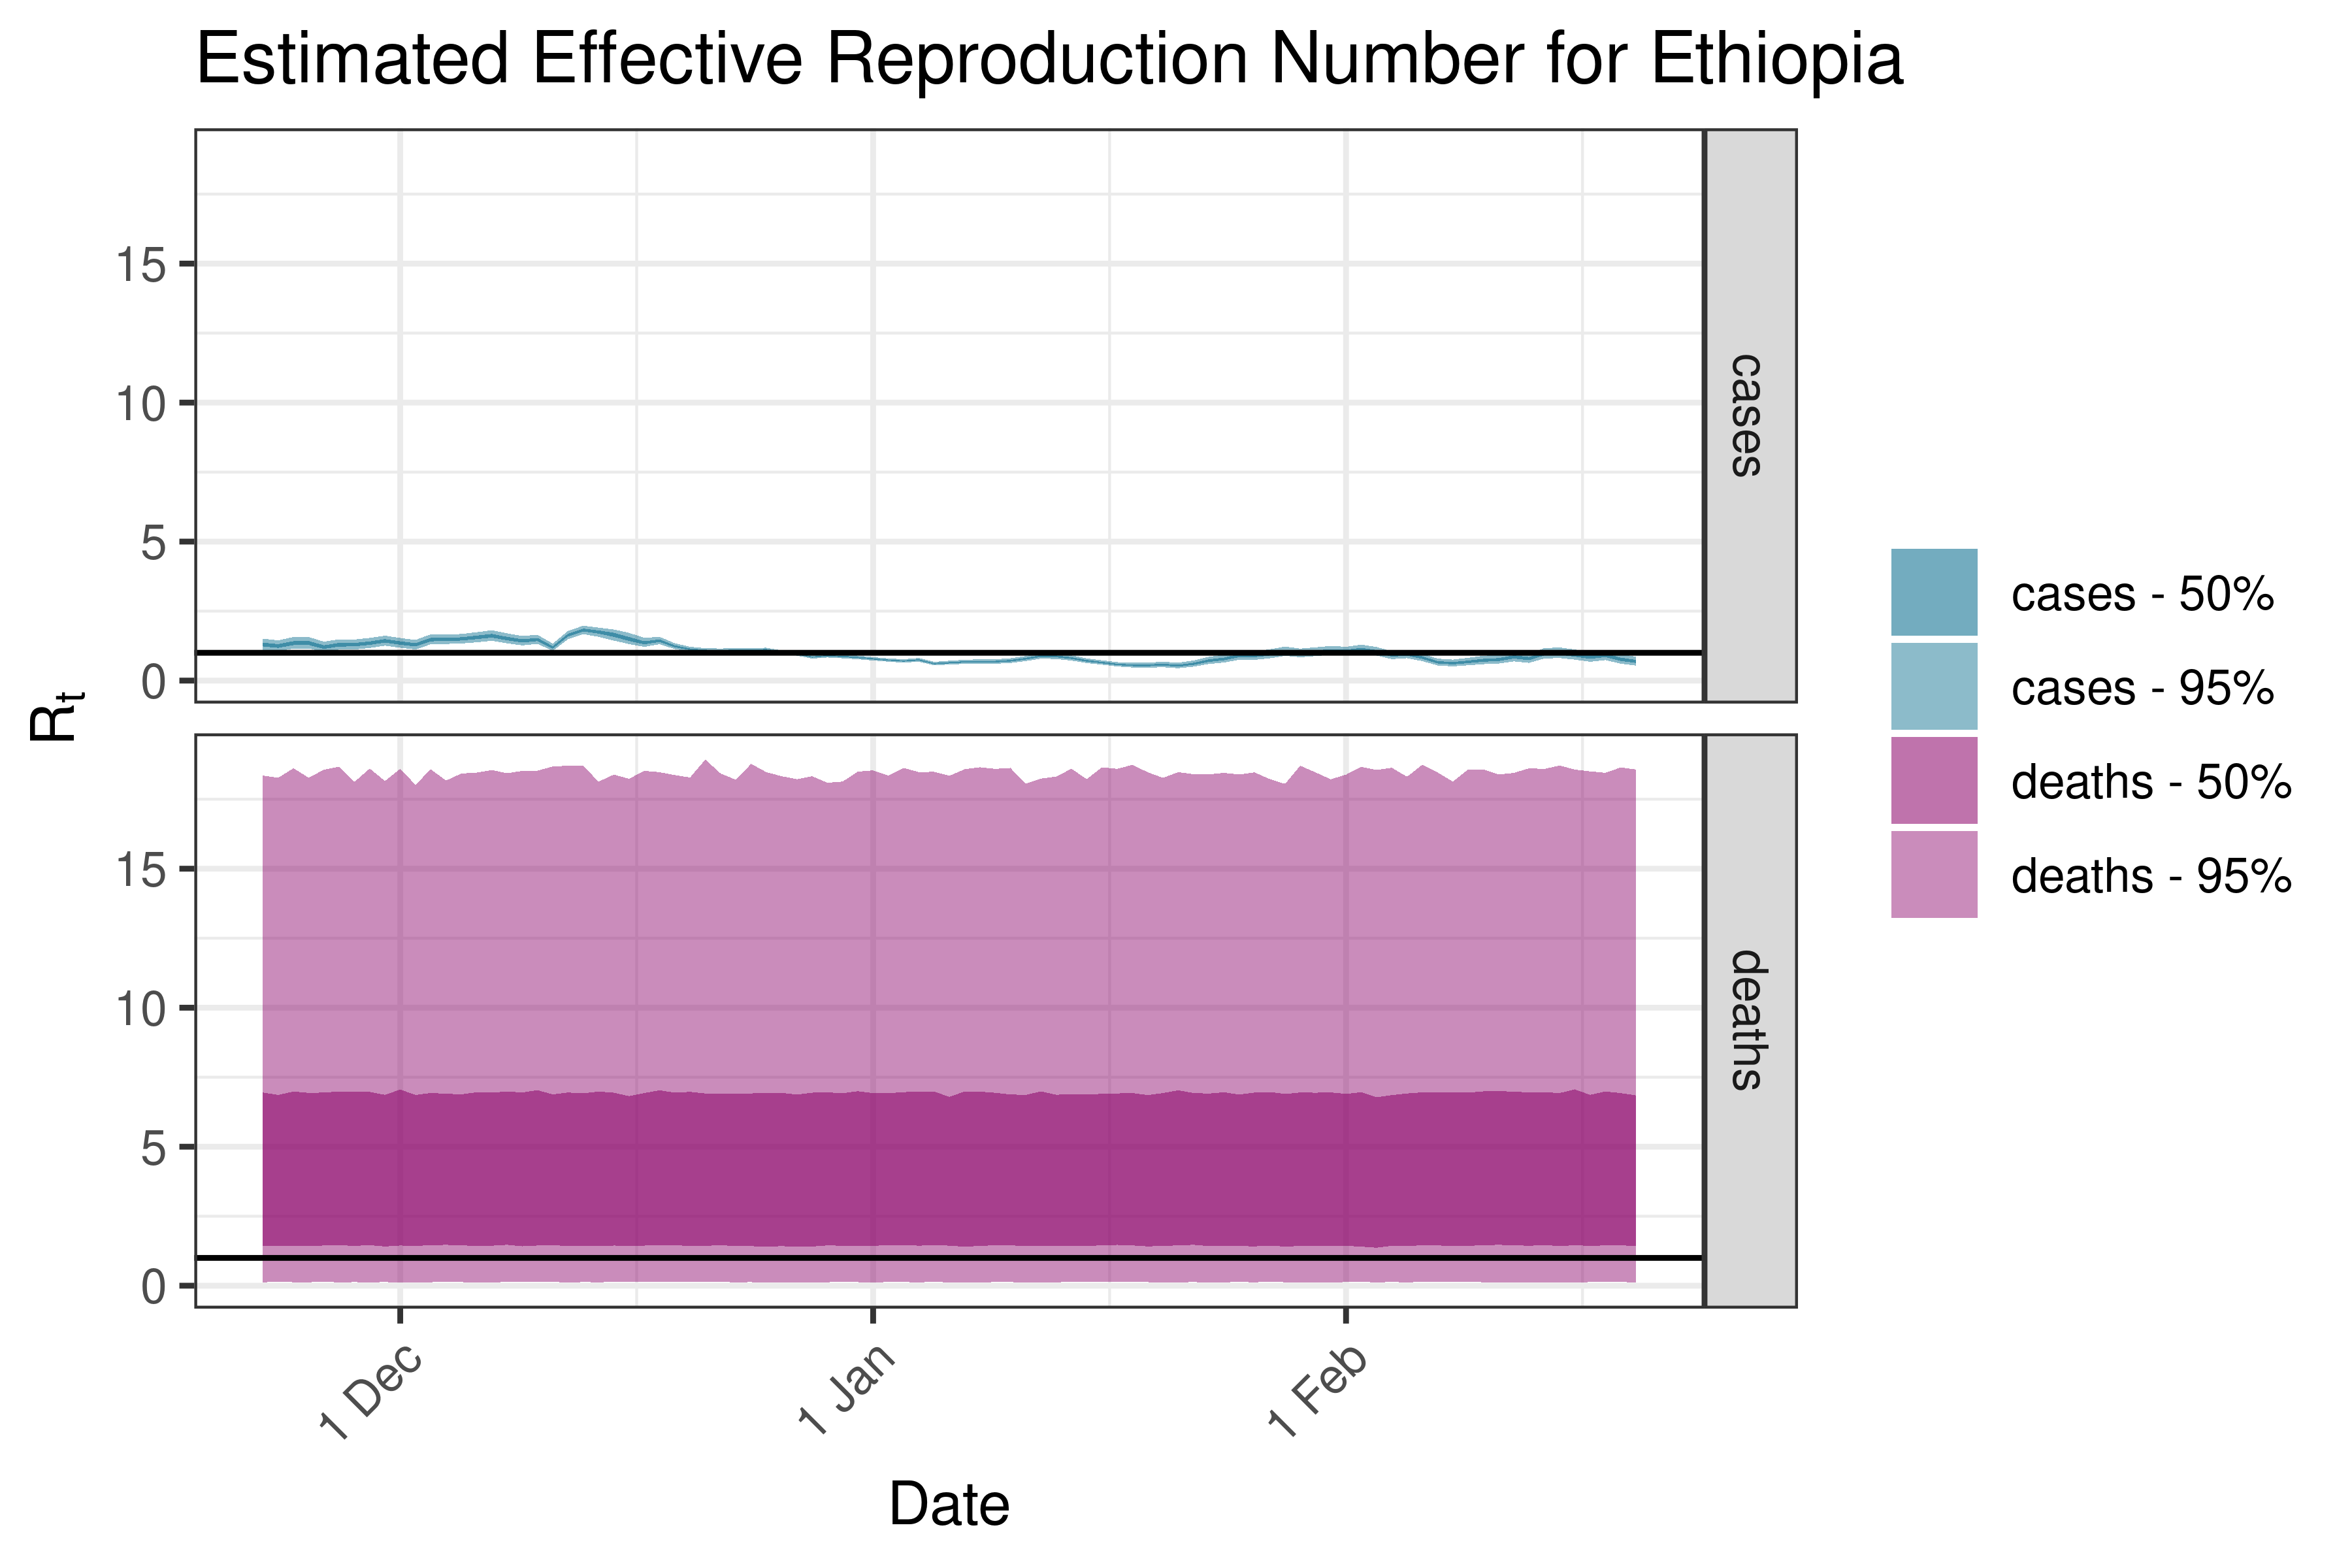
6.5.1.14 Ethiopia
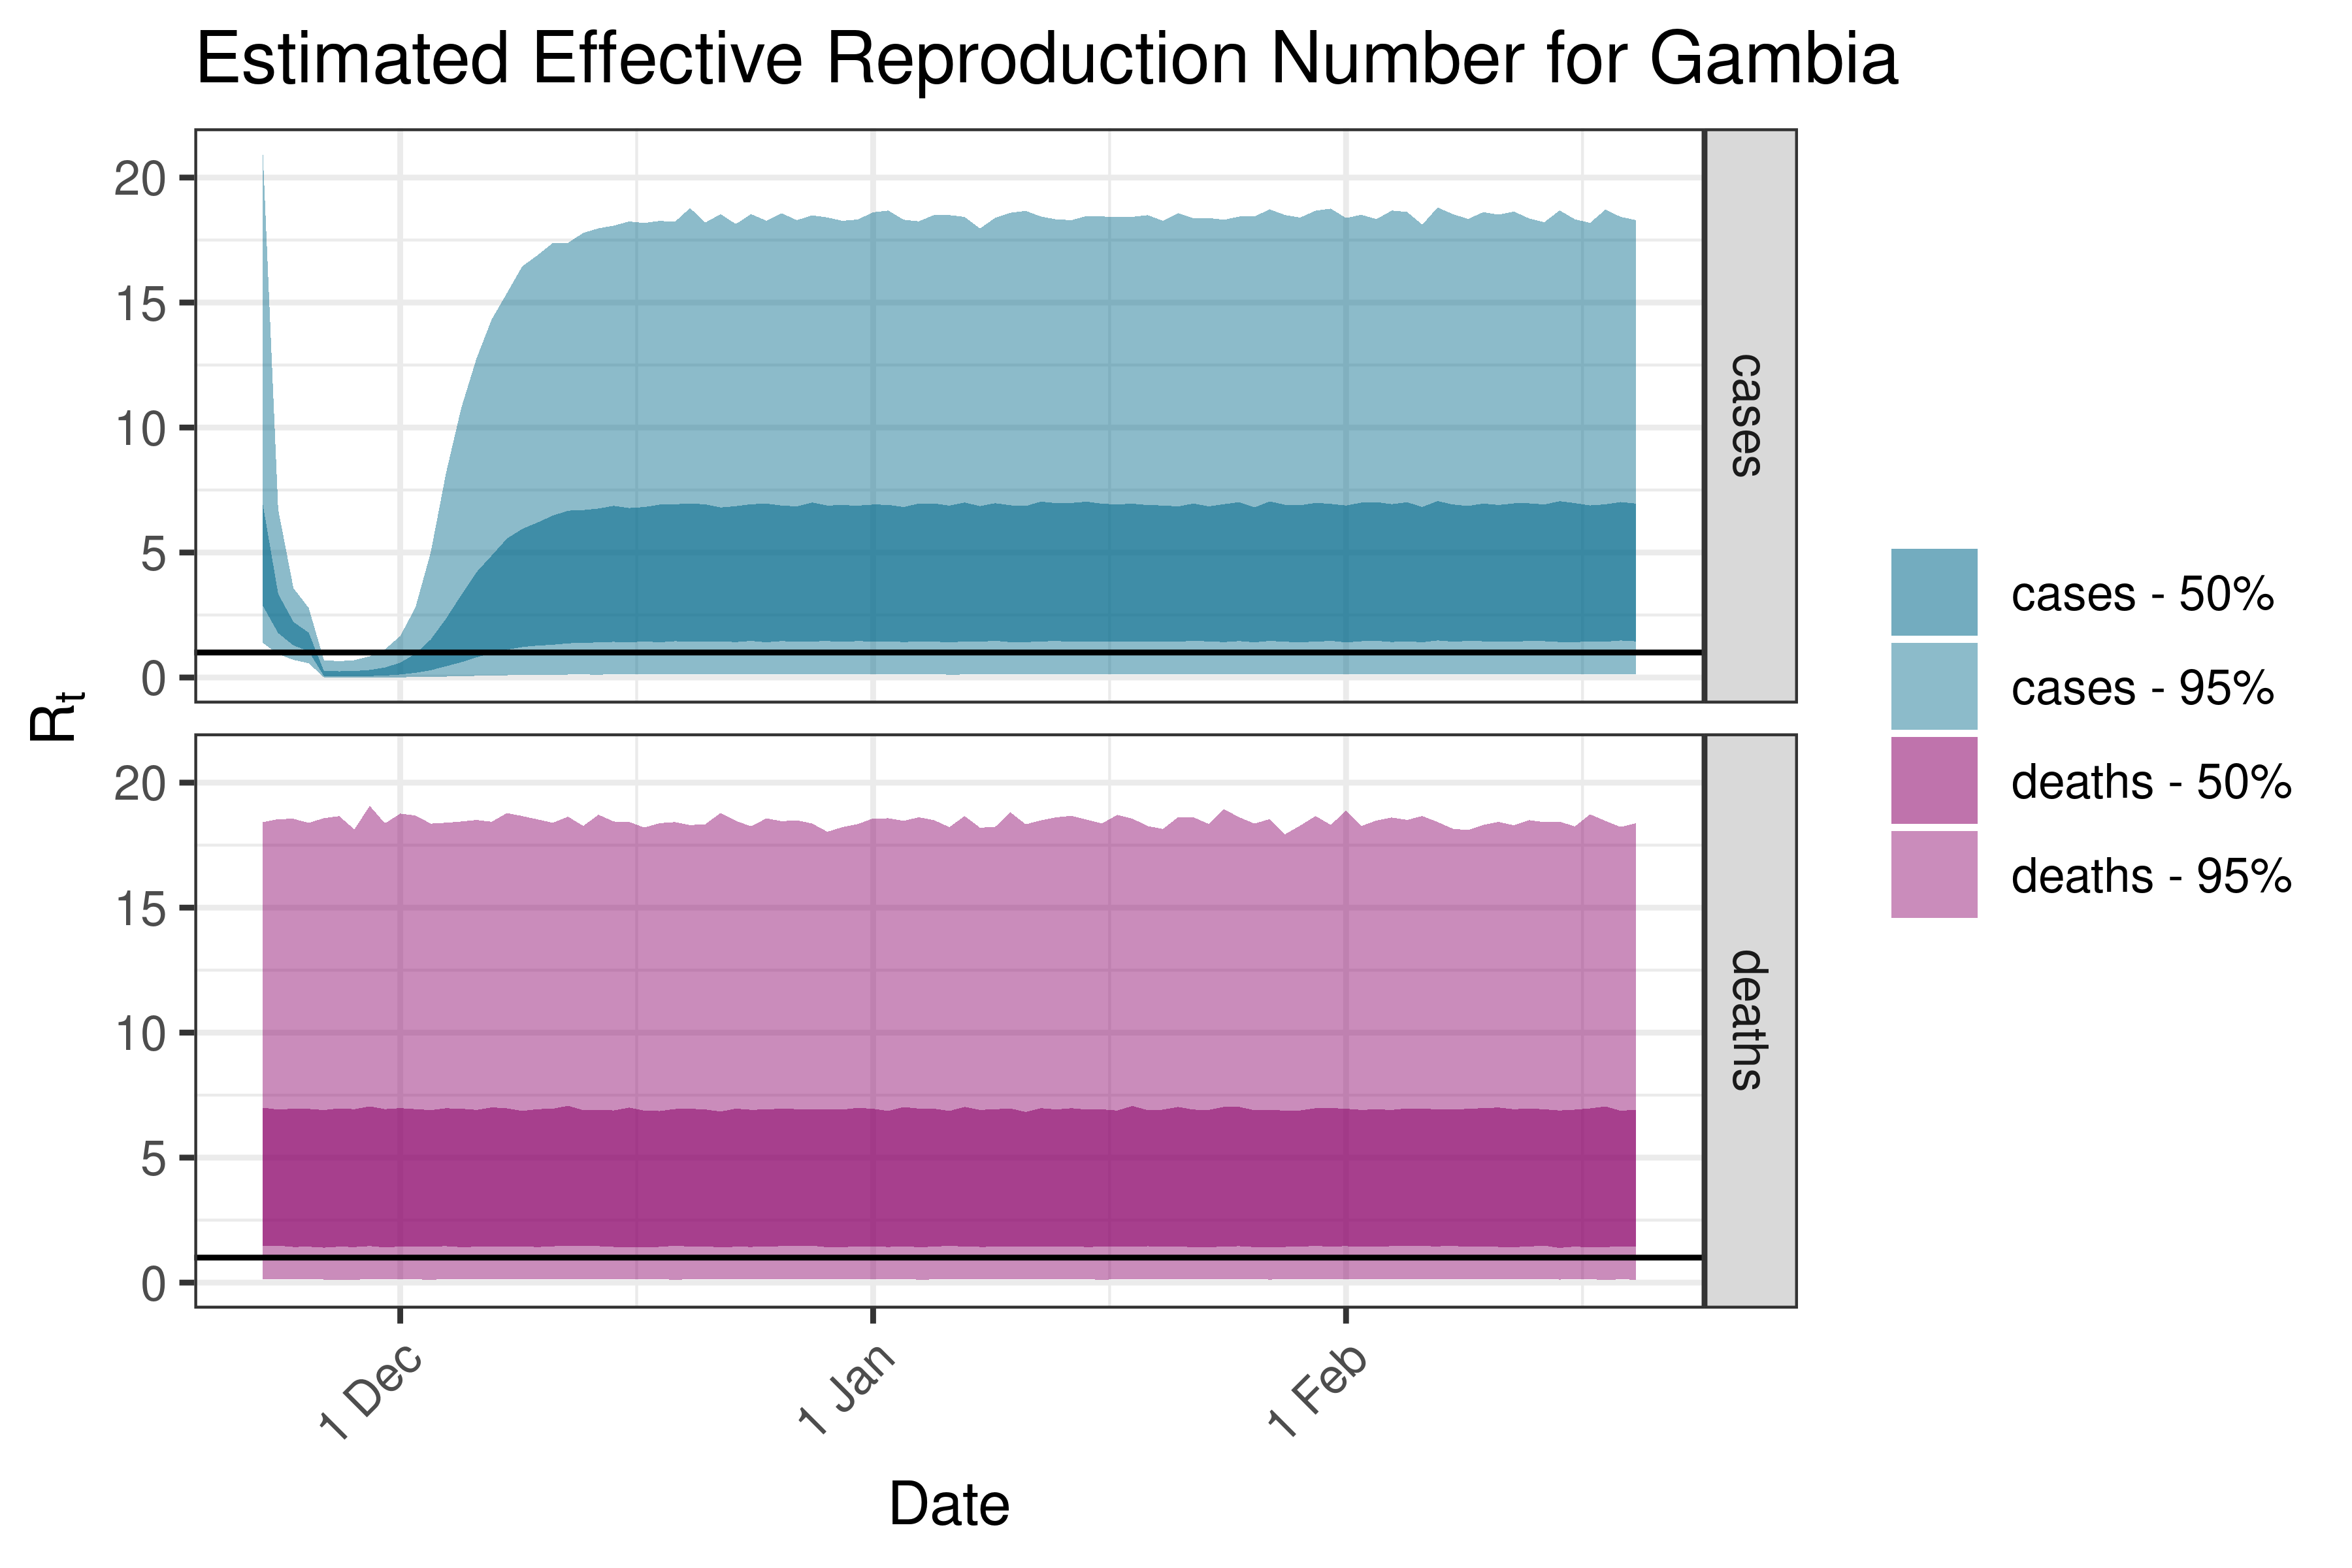
6.5.1.15 Gambia
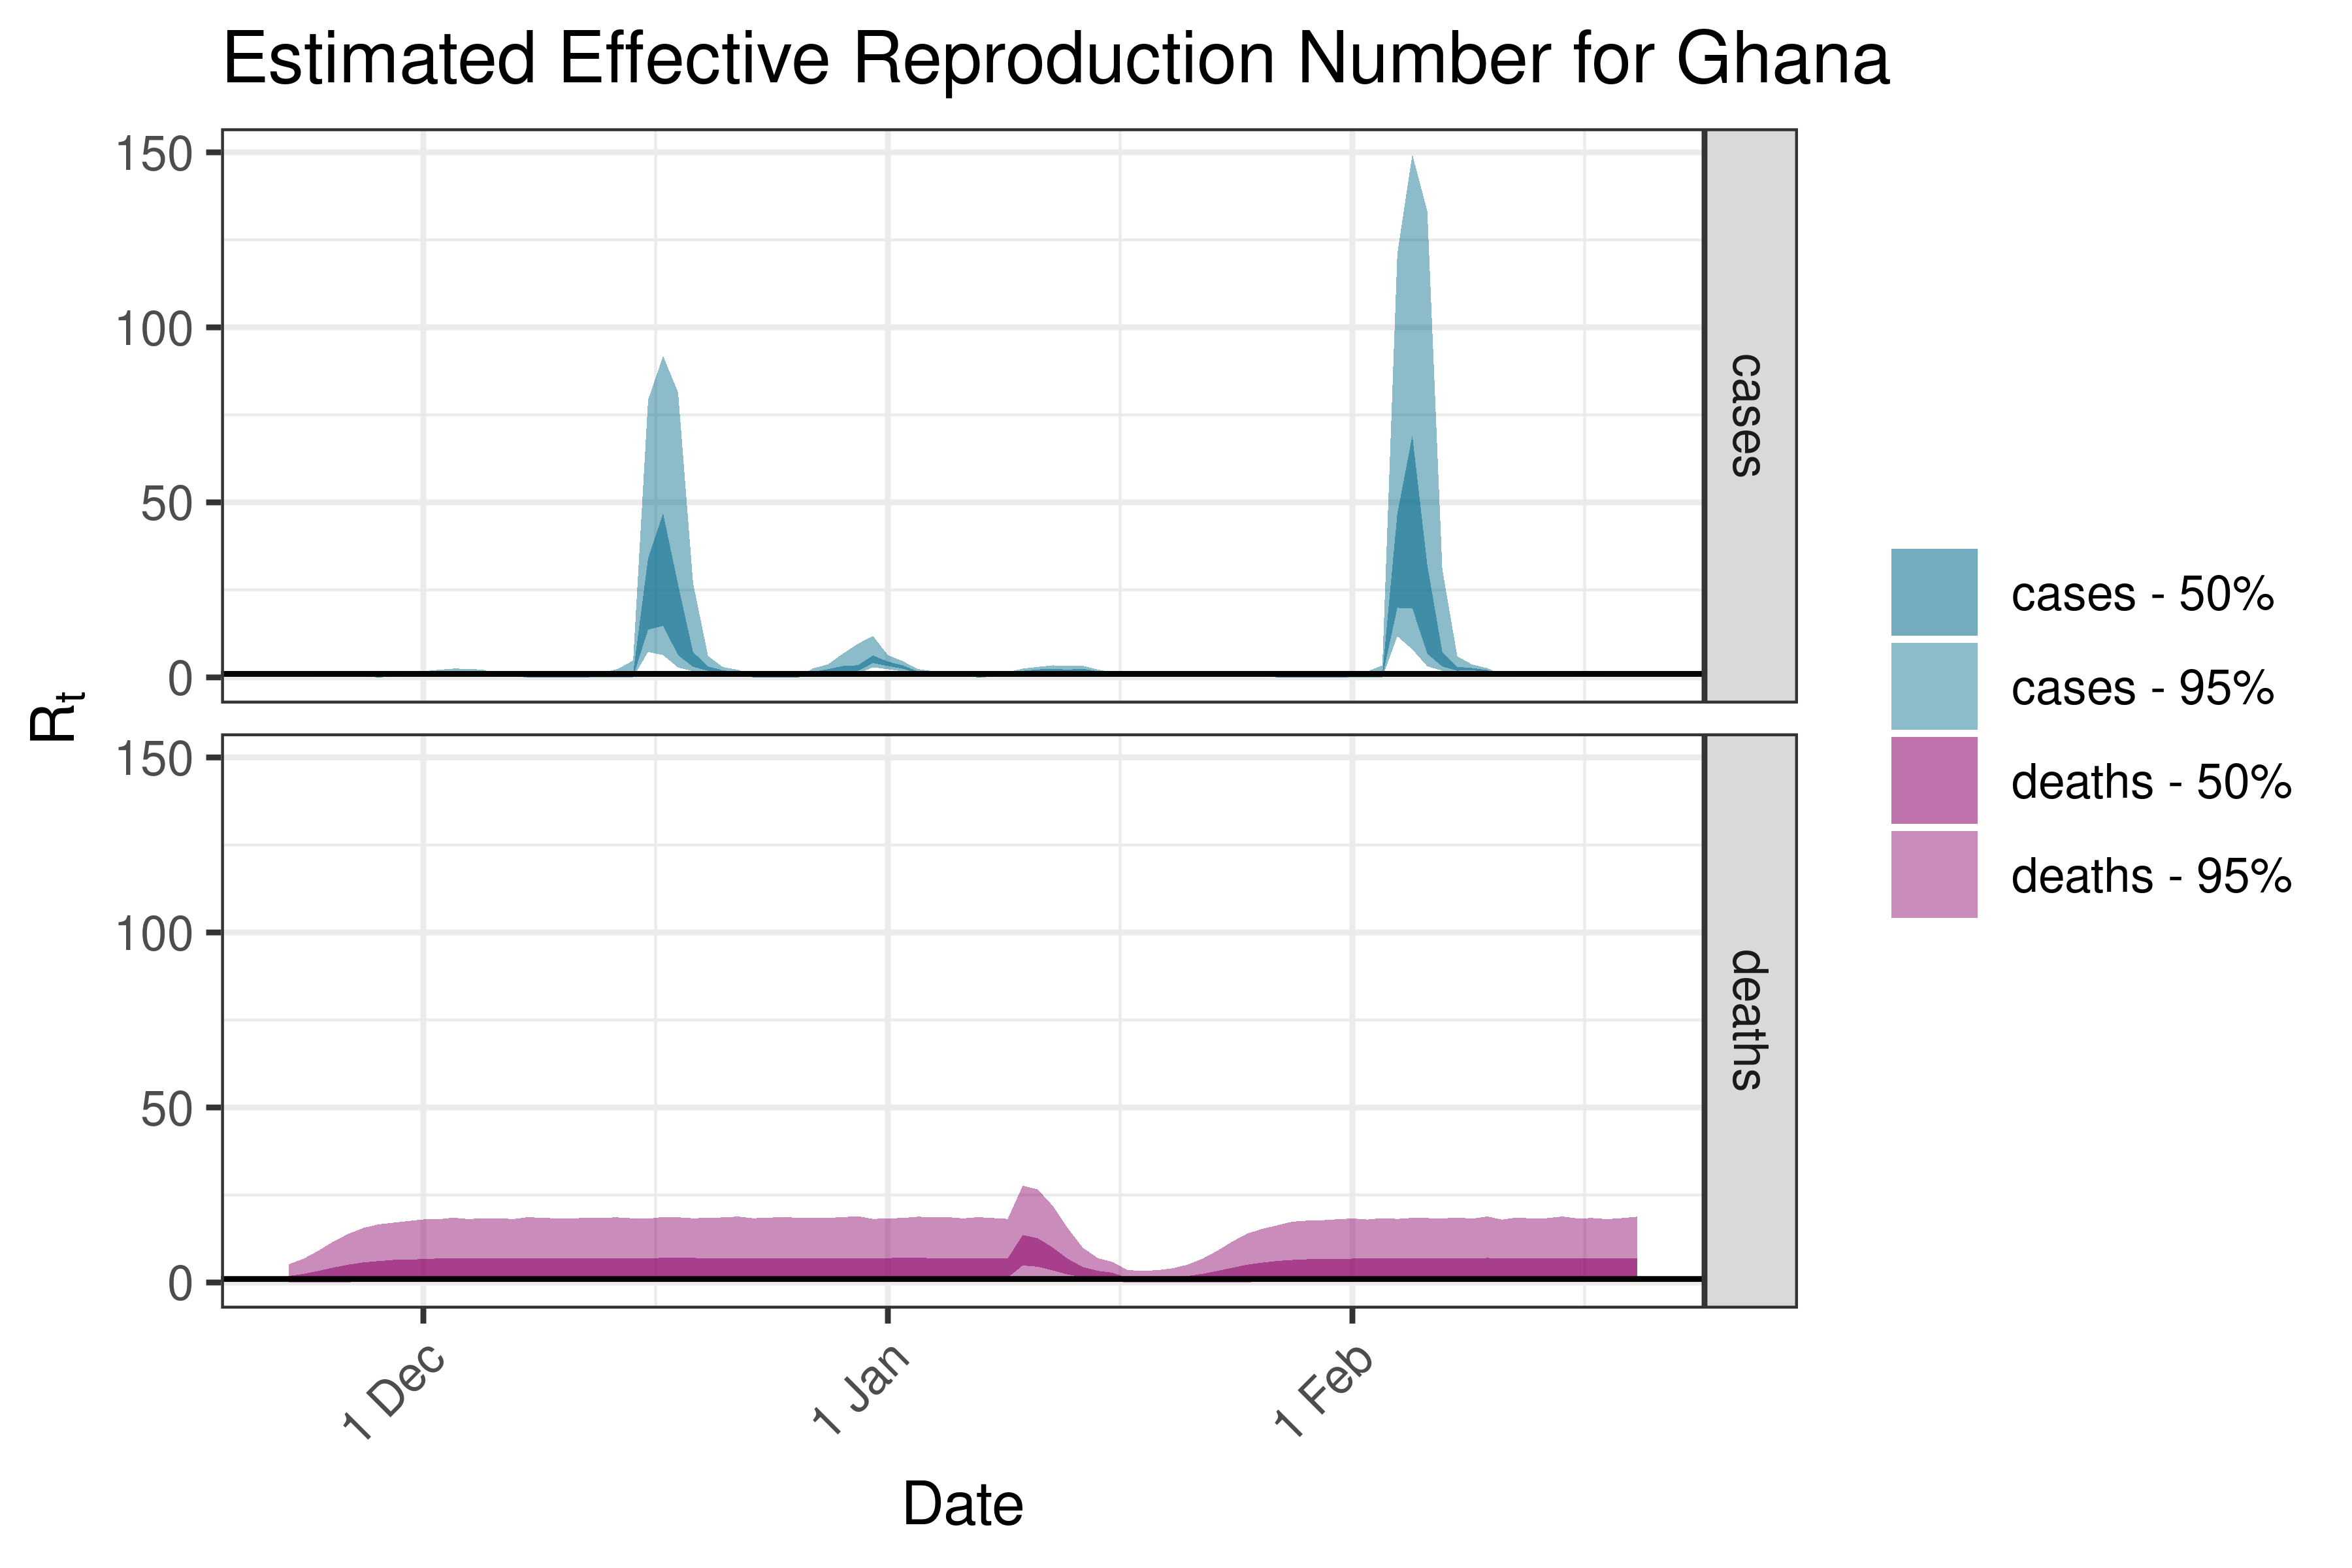
6.5.1.16 Ghana
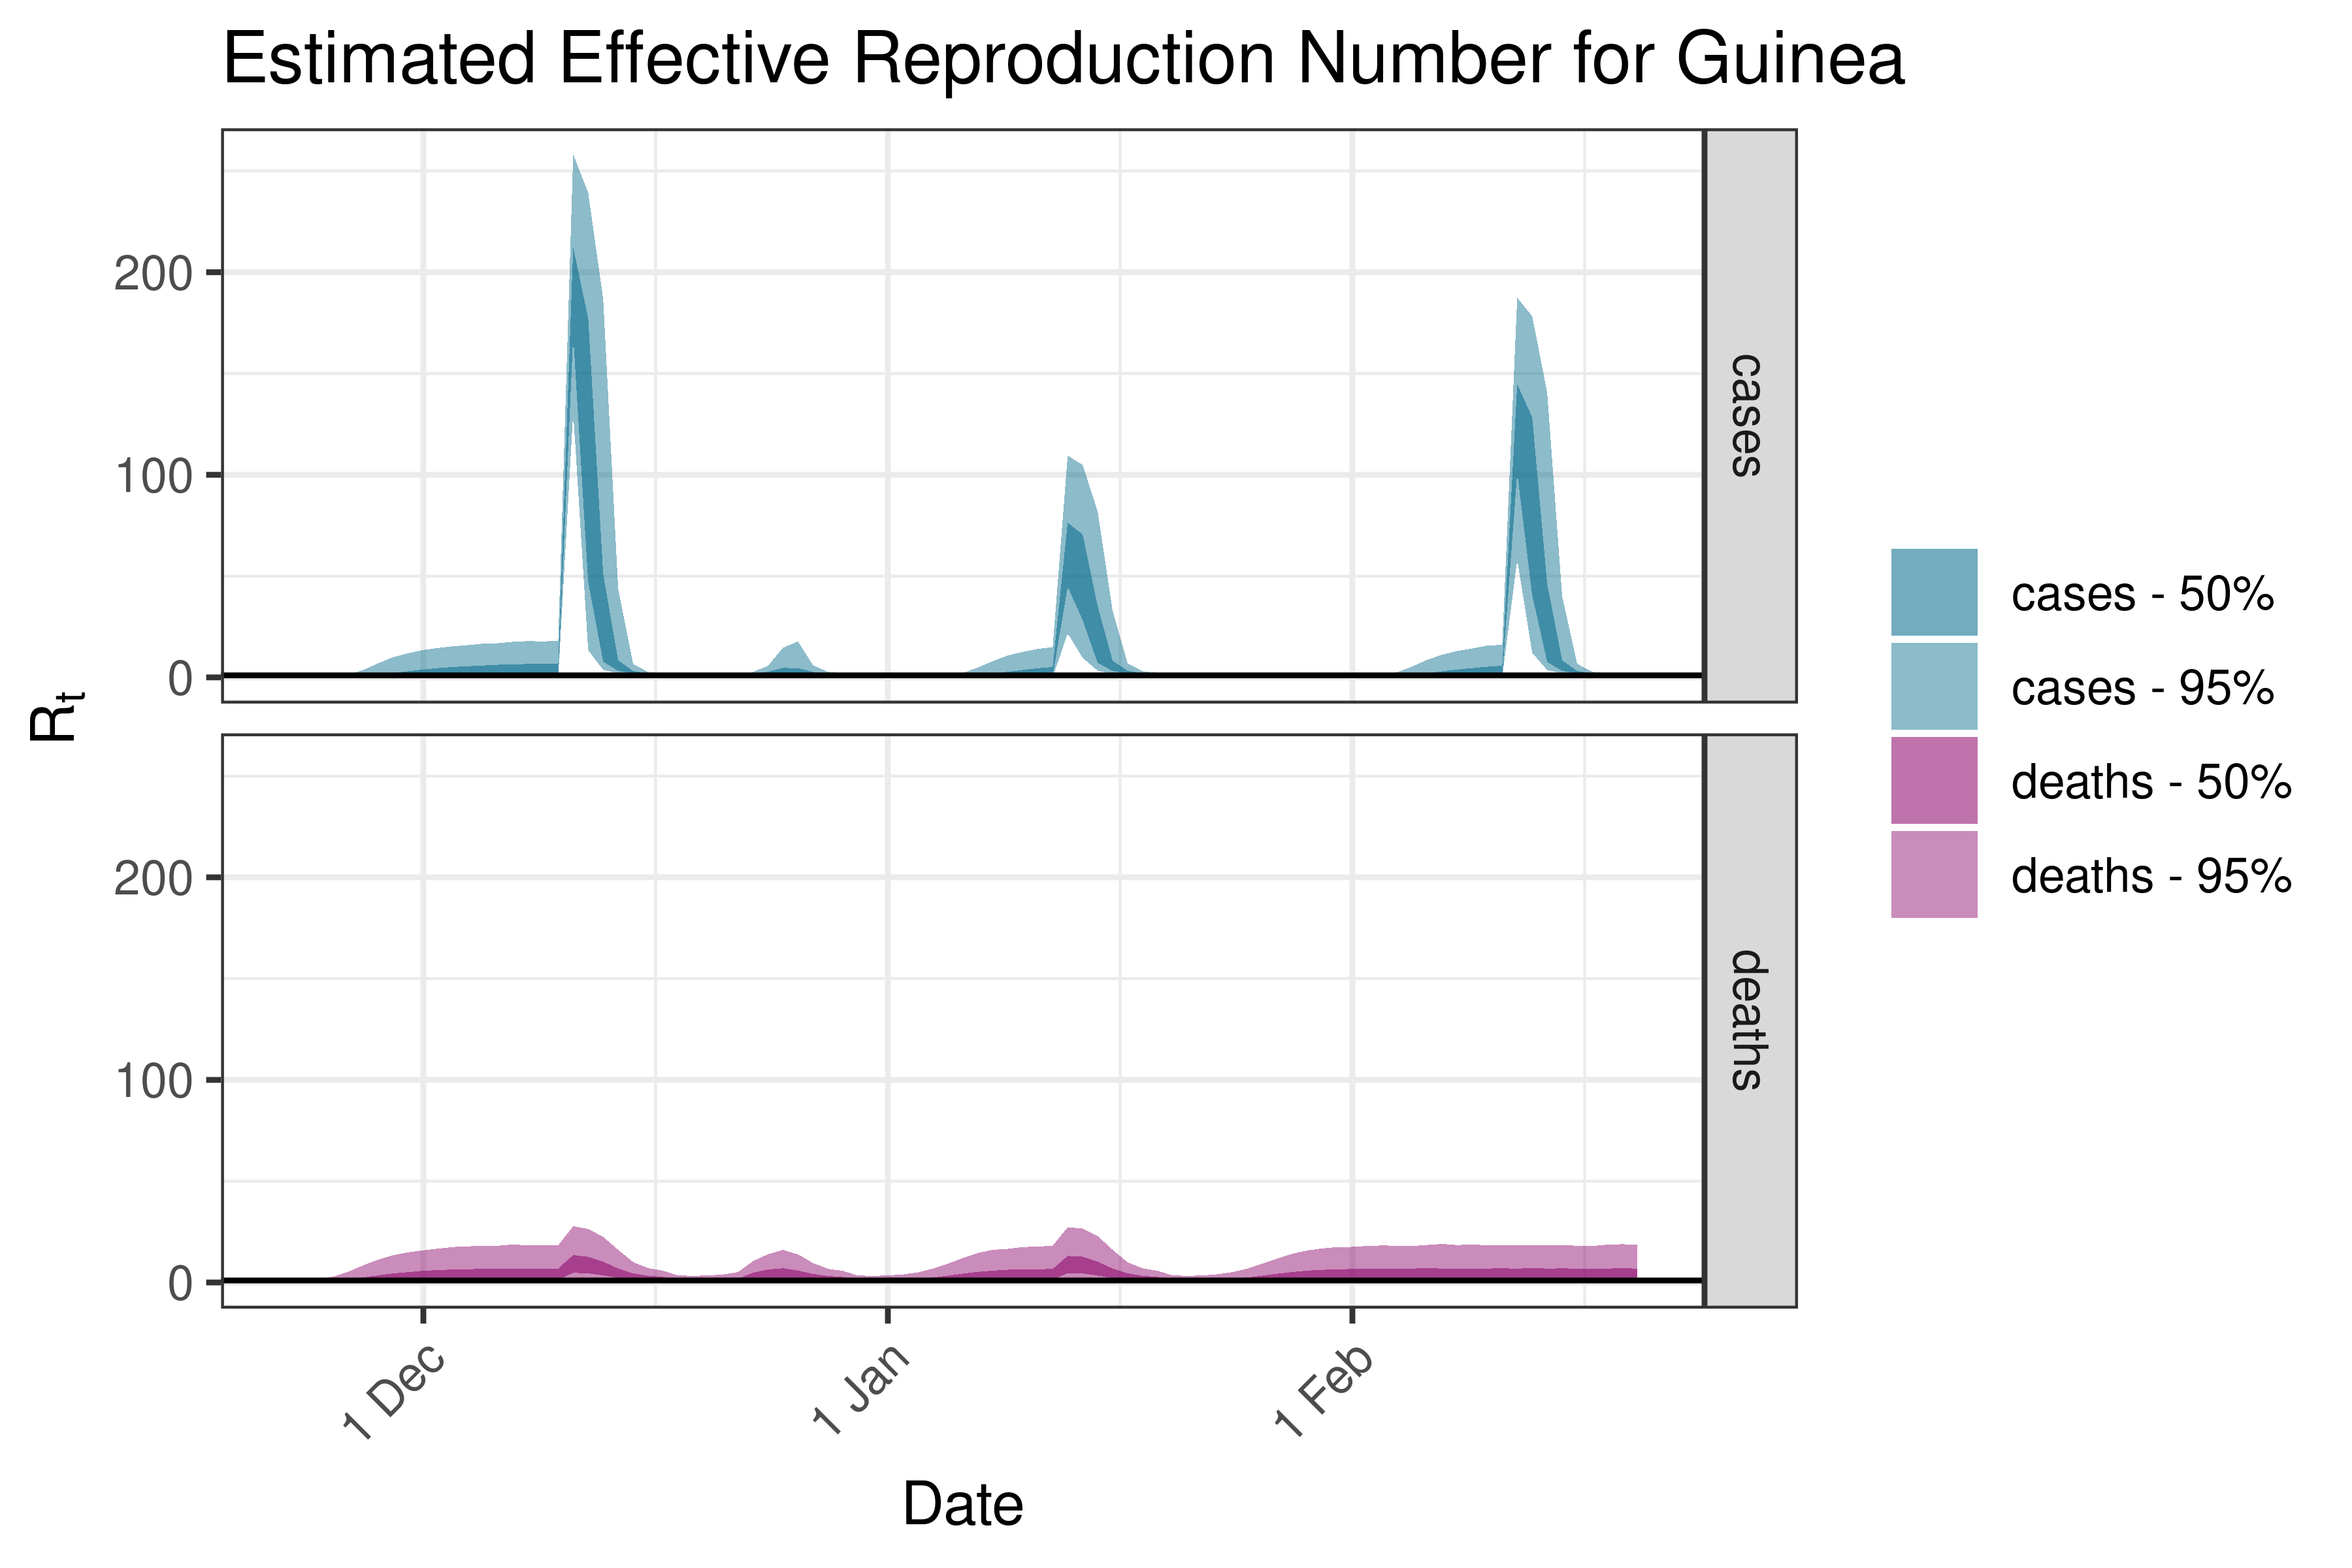
6.5.1.17 Guinea
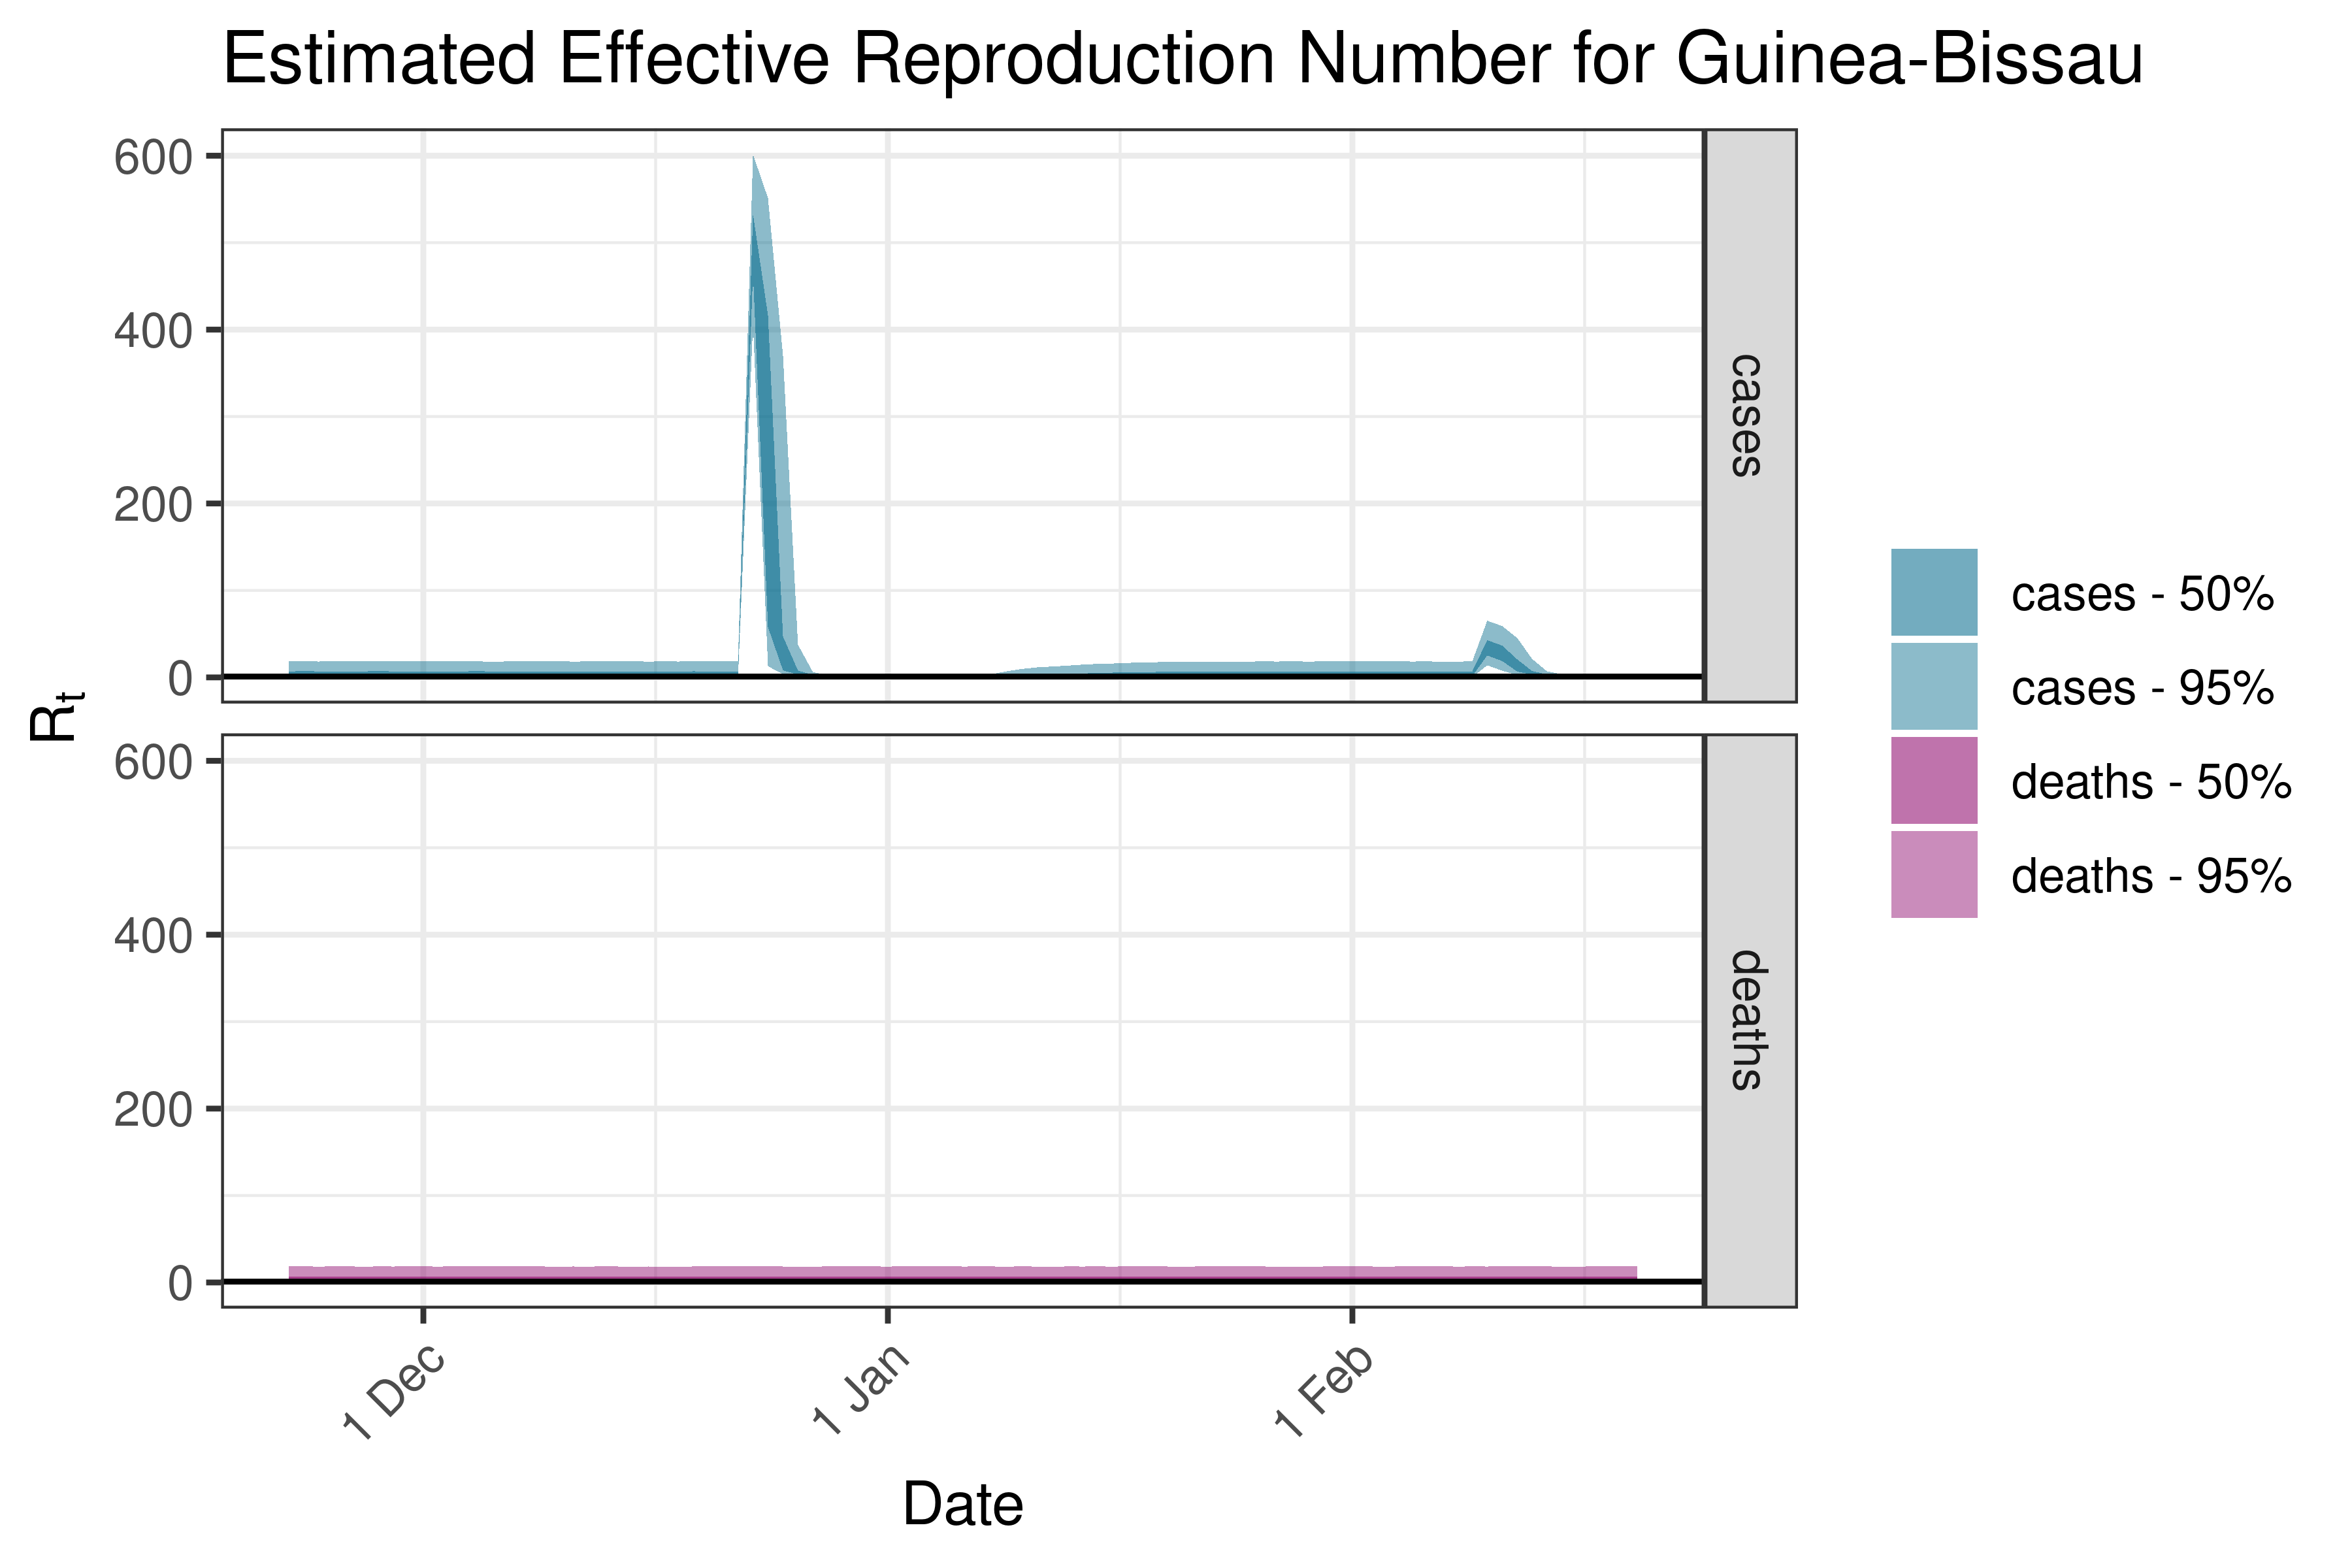
6.5.1.18 Guinea-Bissau
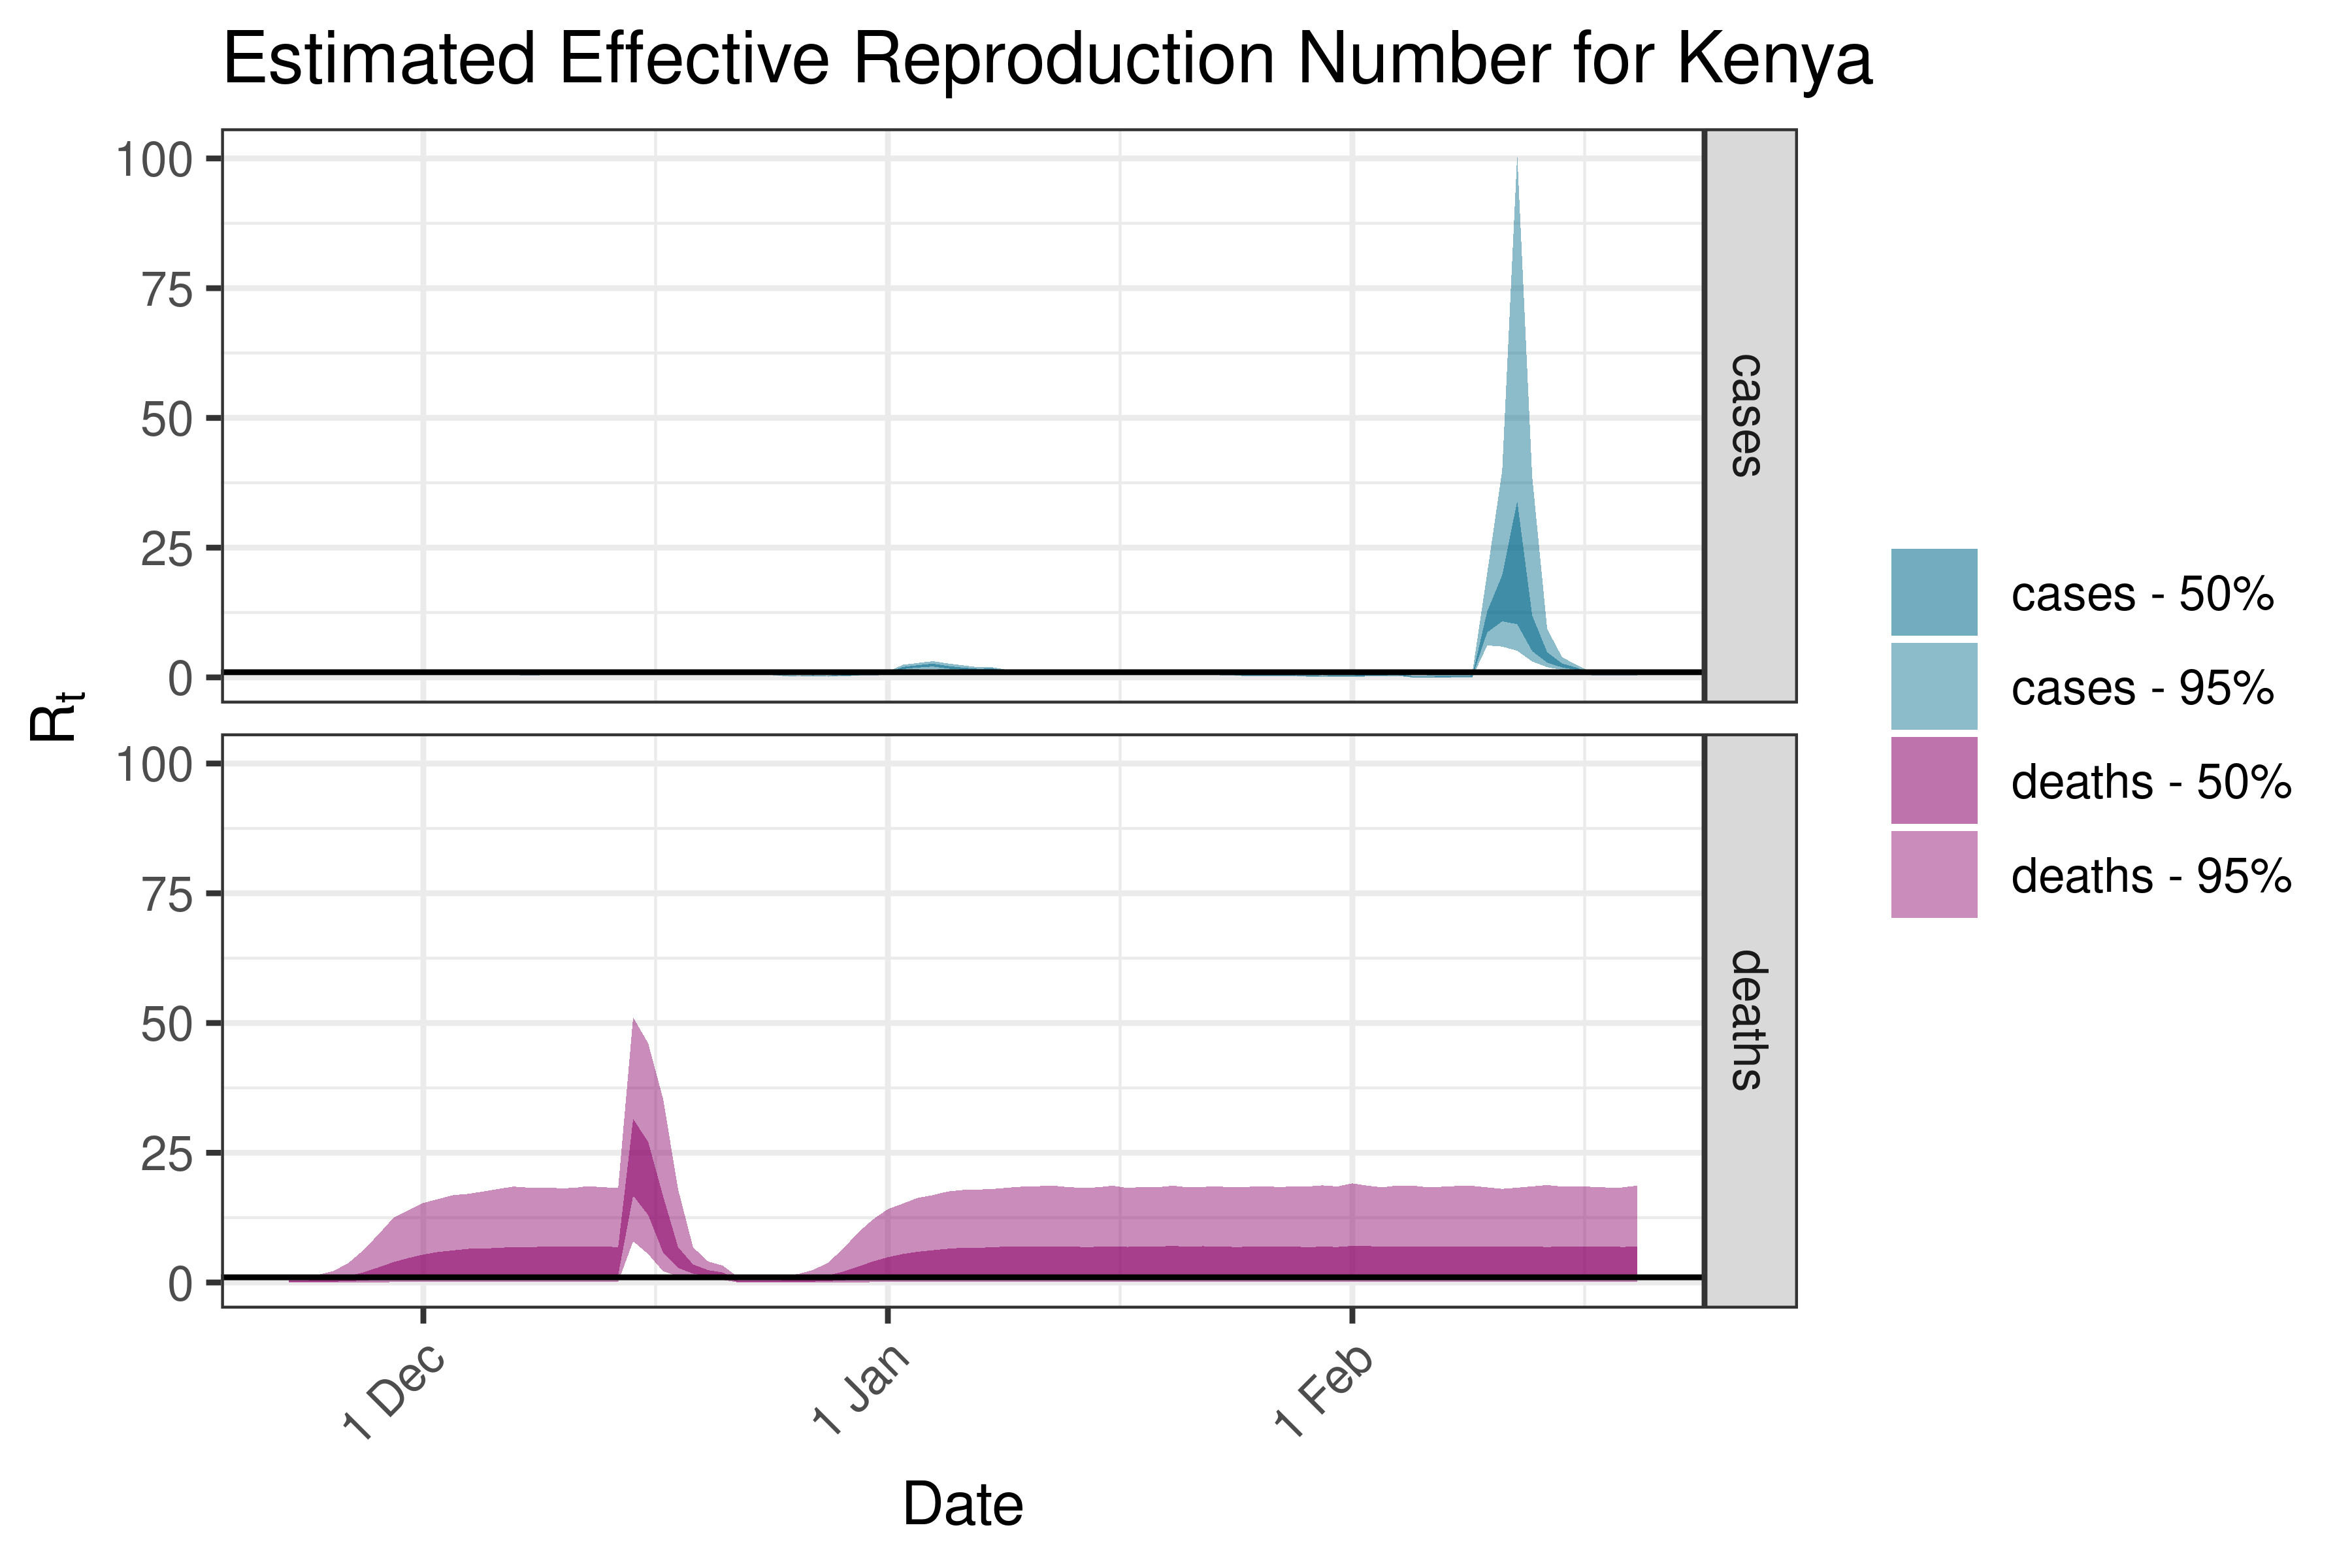
6.5.1.19 Kenya
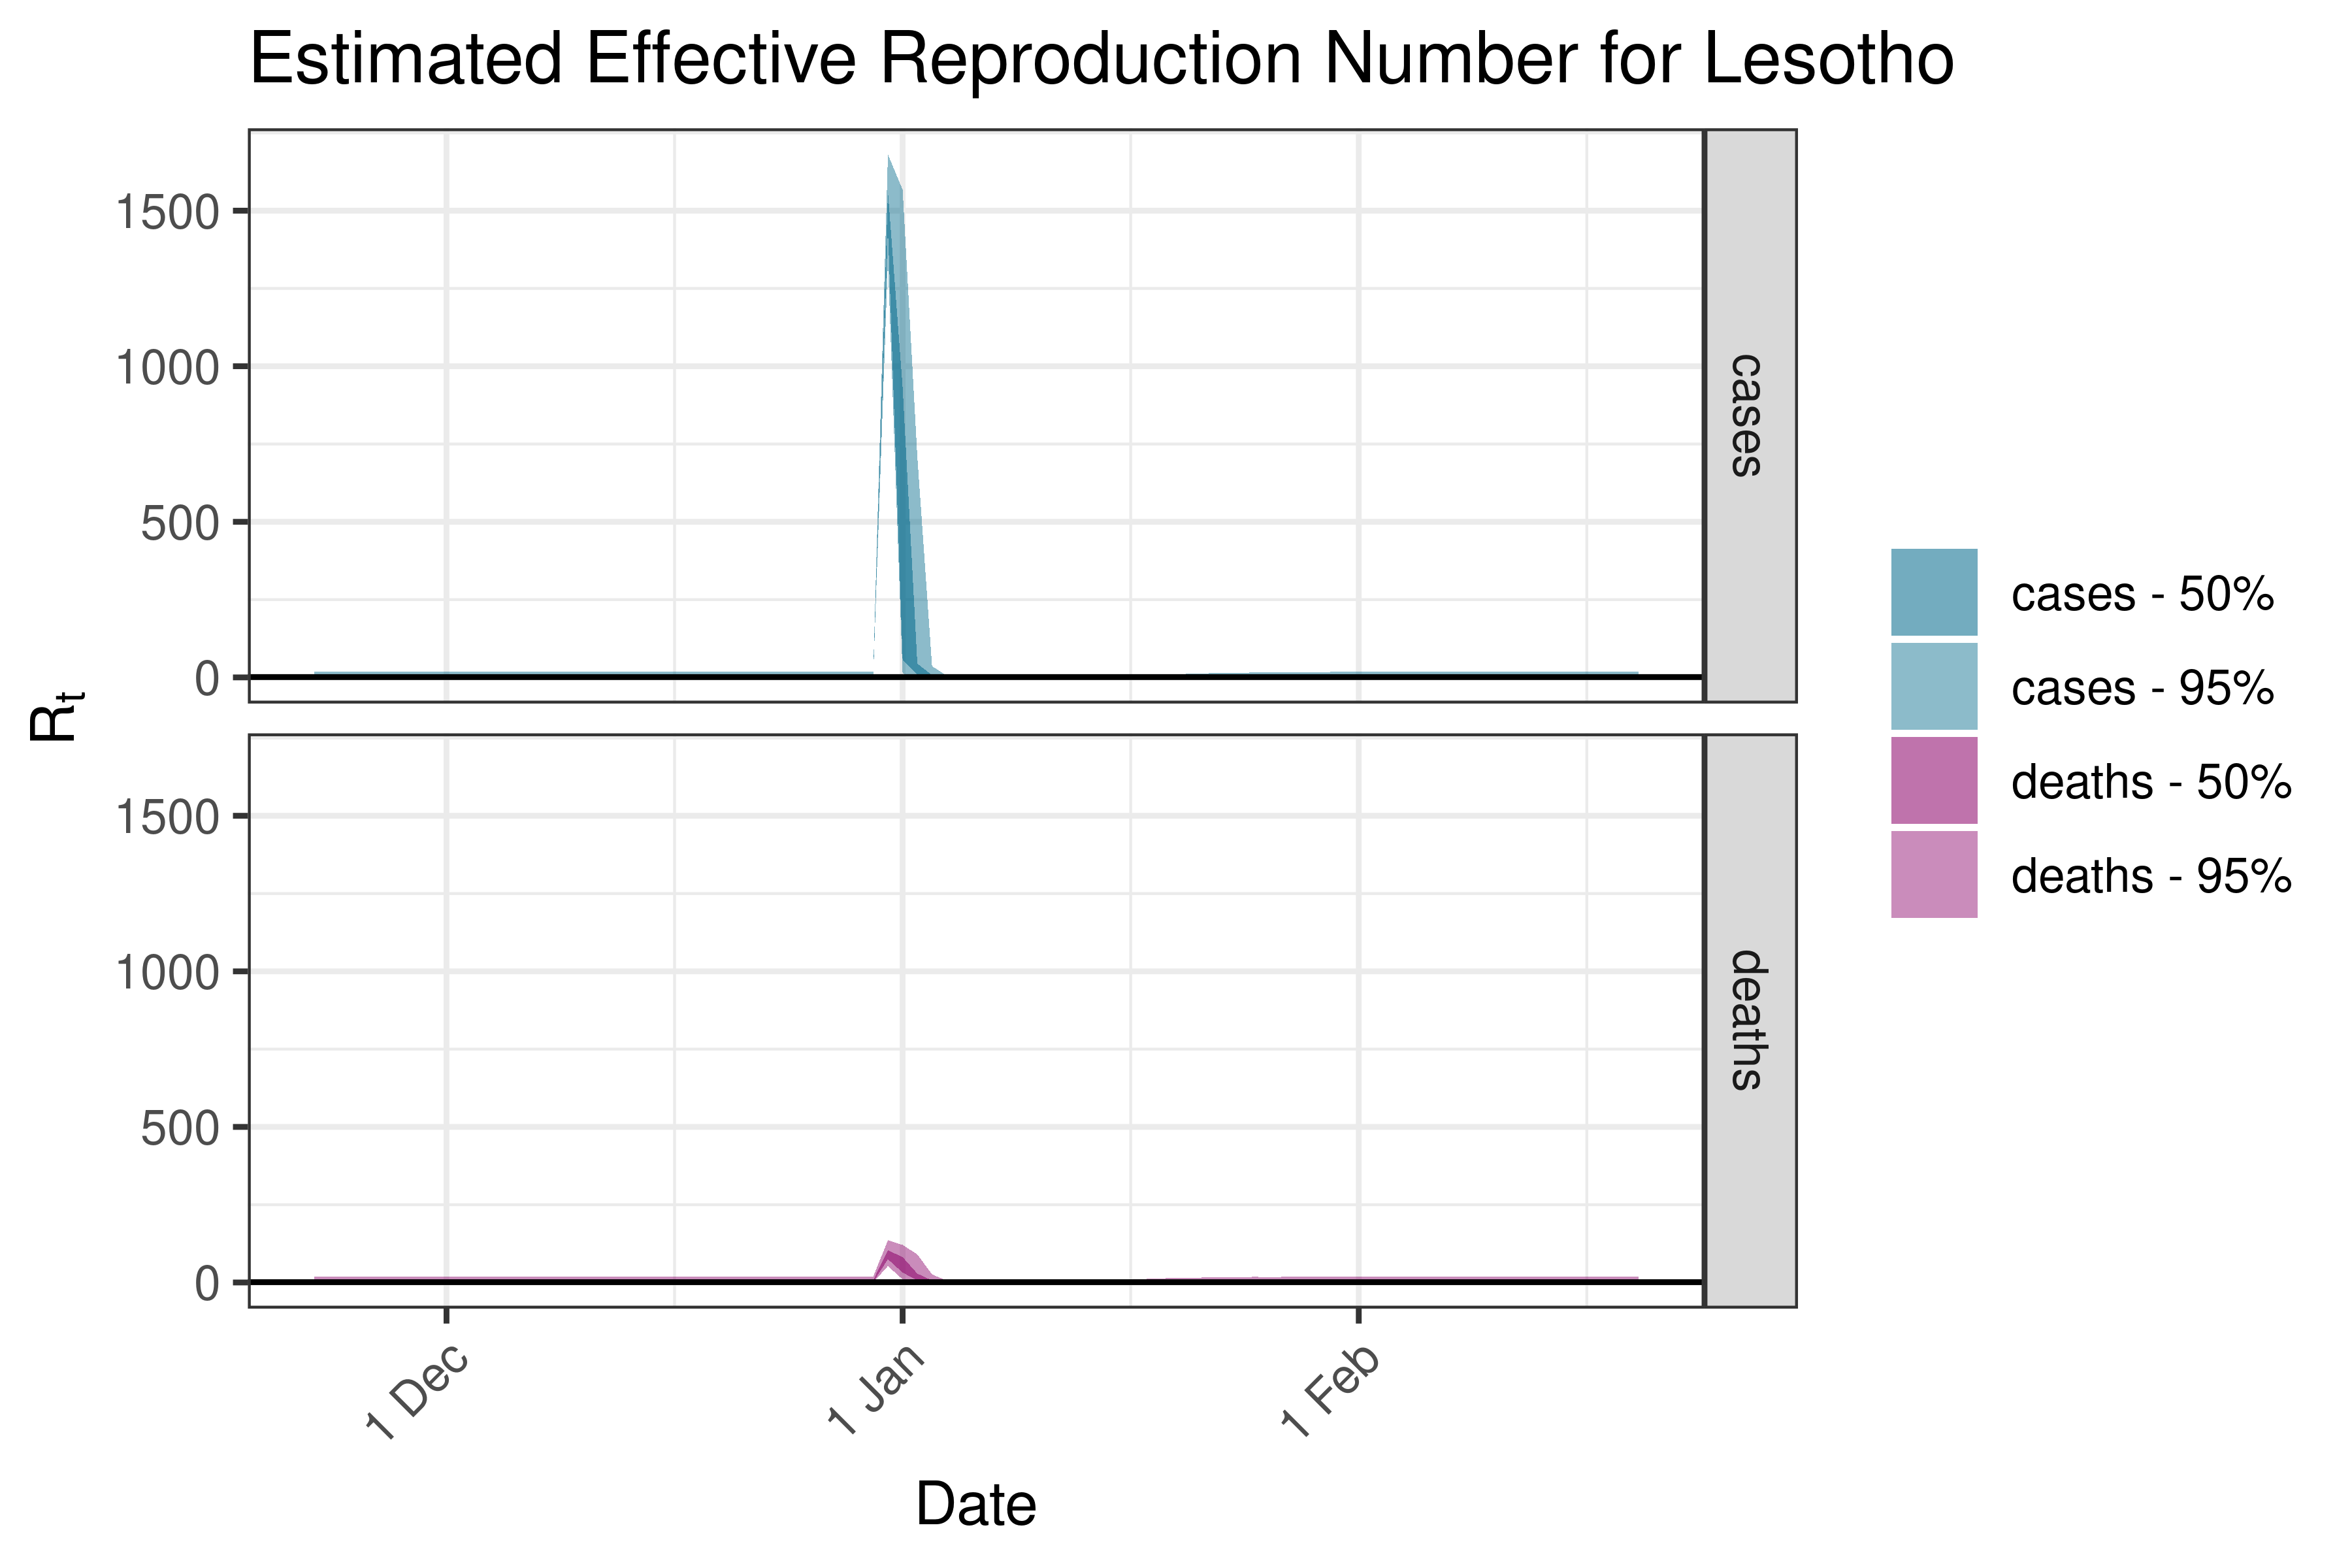
6.5.1.20 Lesotho
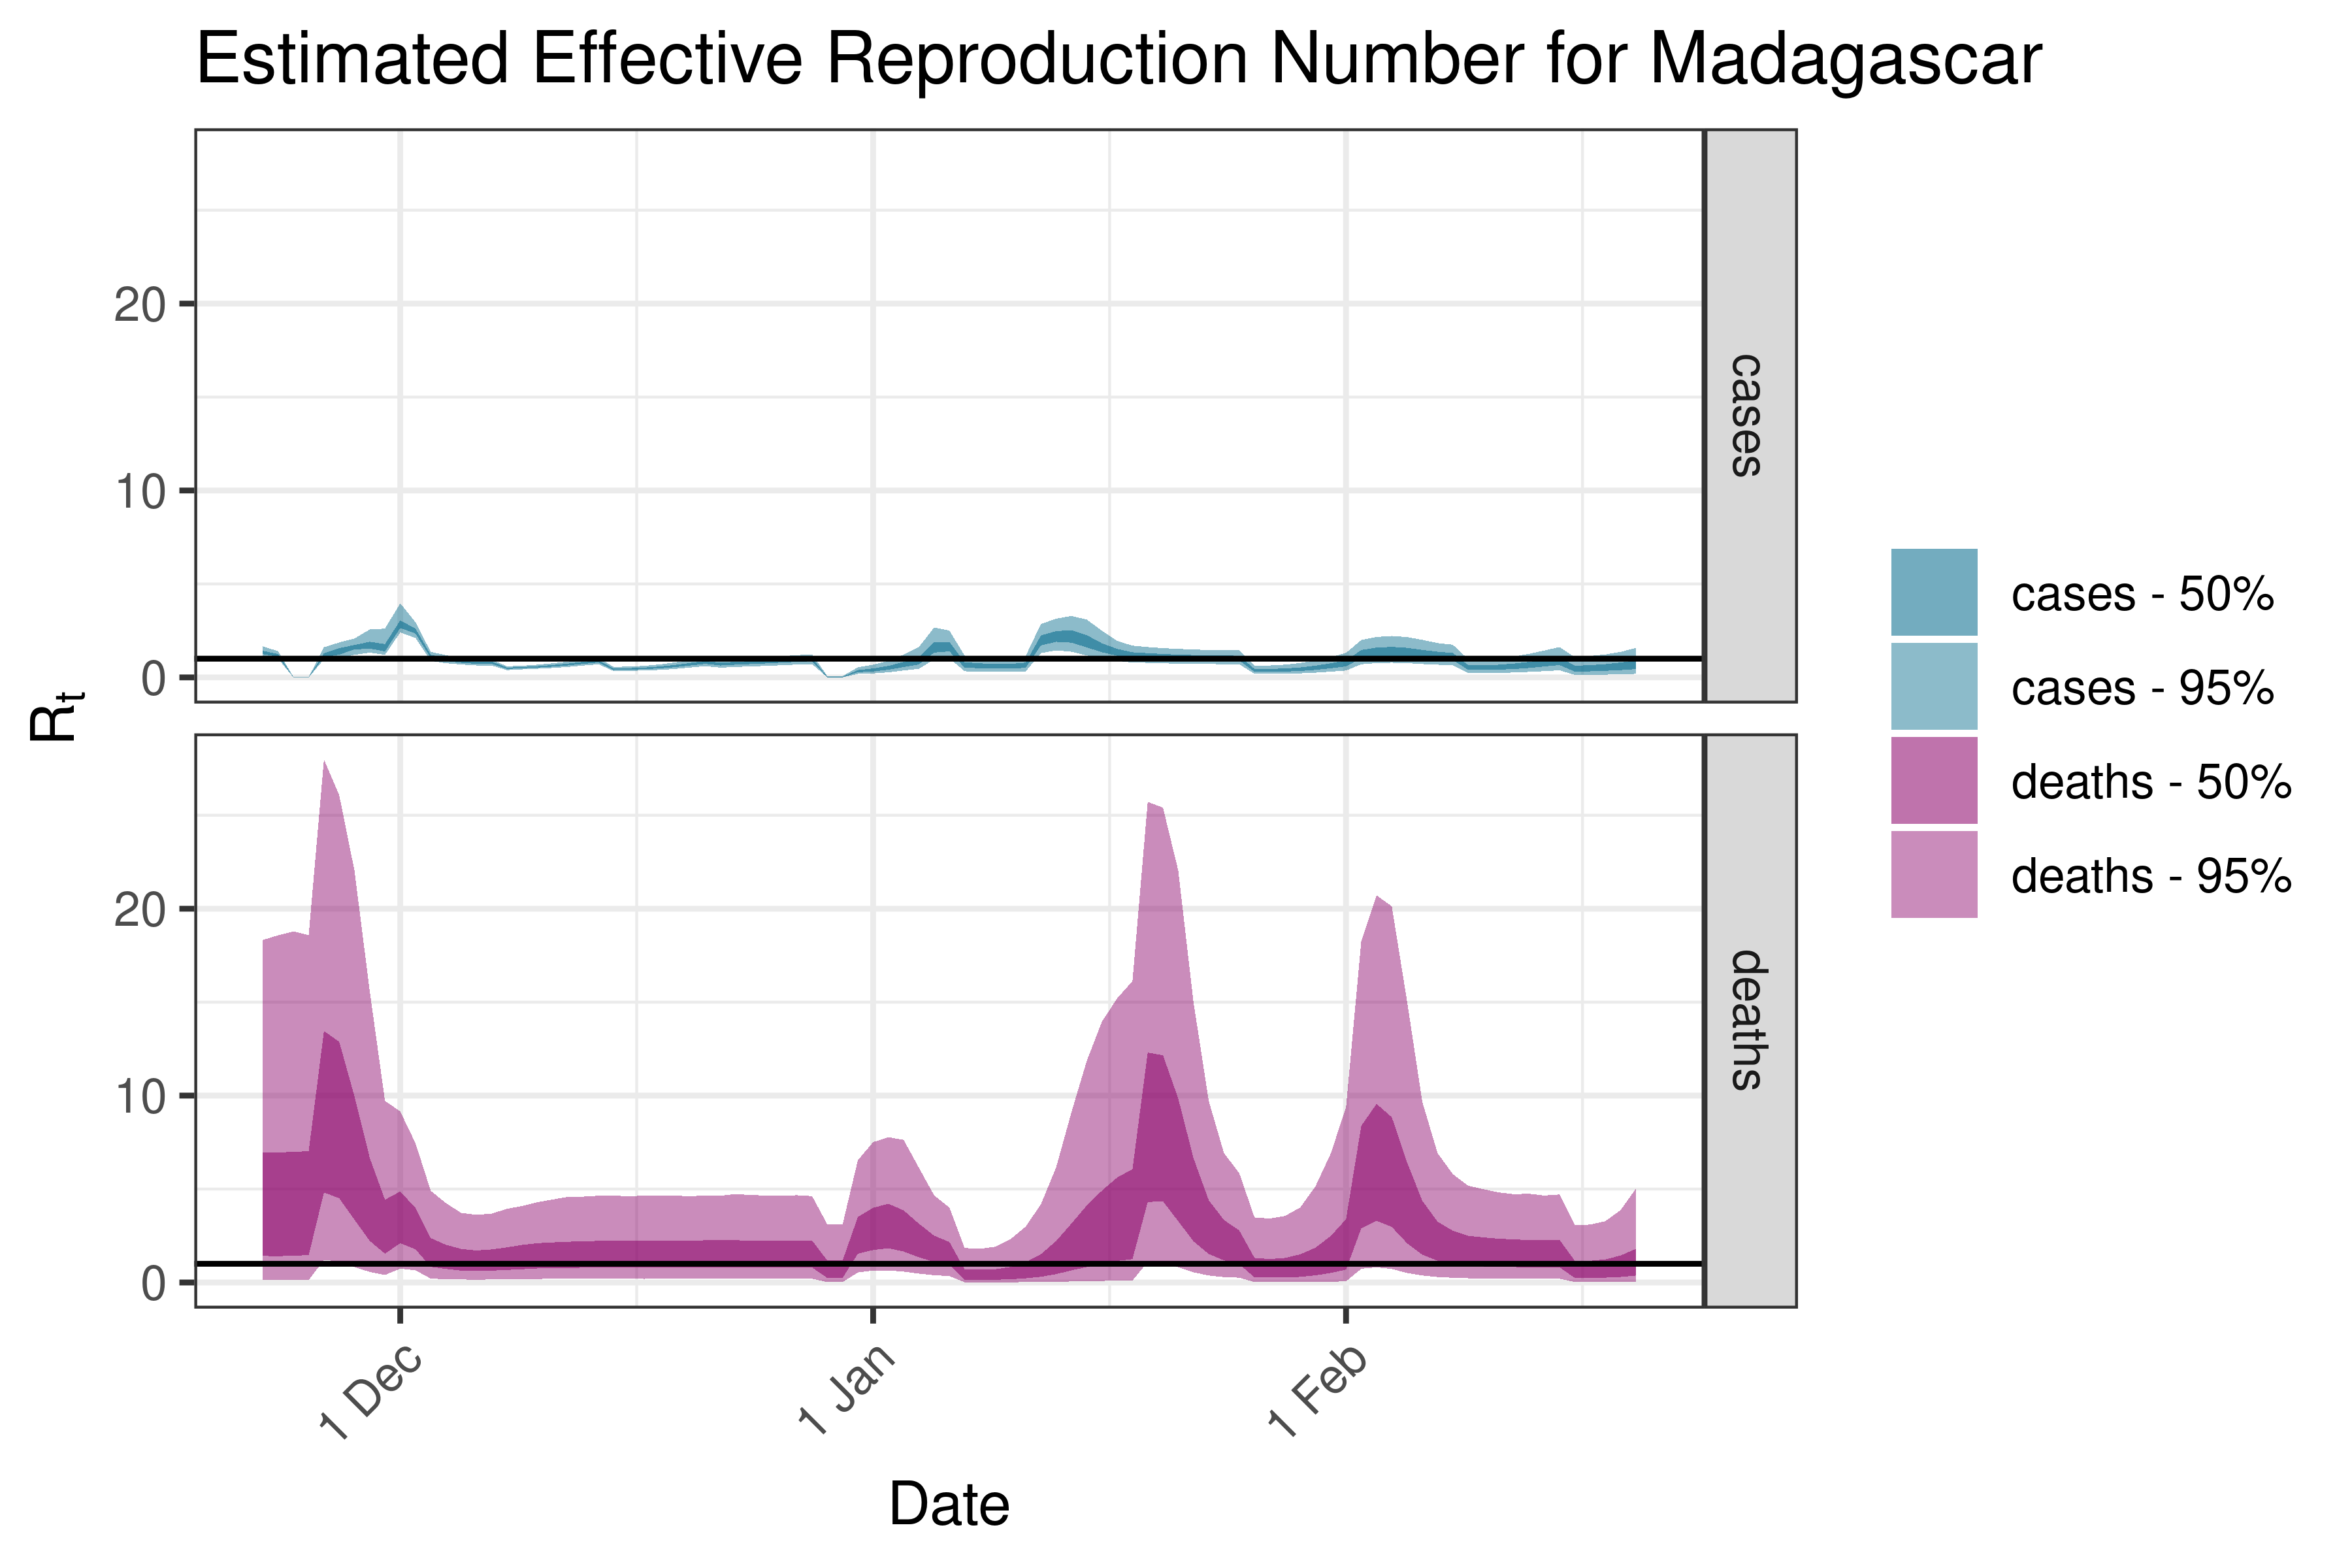
6.5.1.21 Madagascar
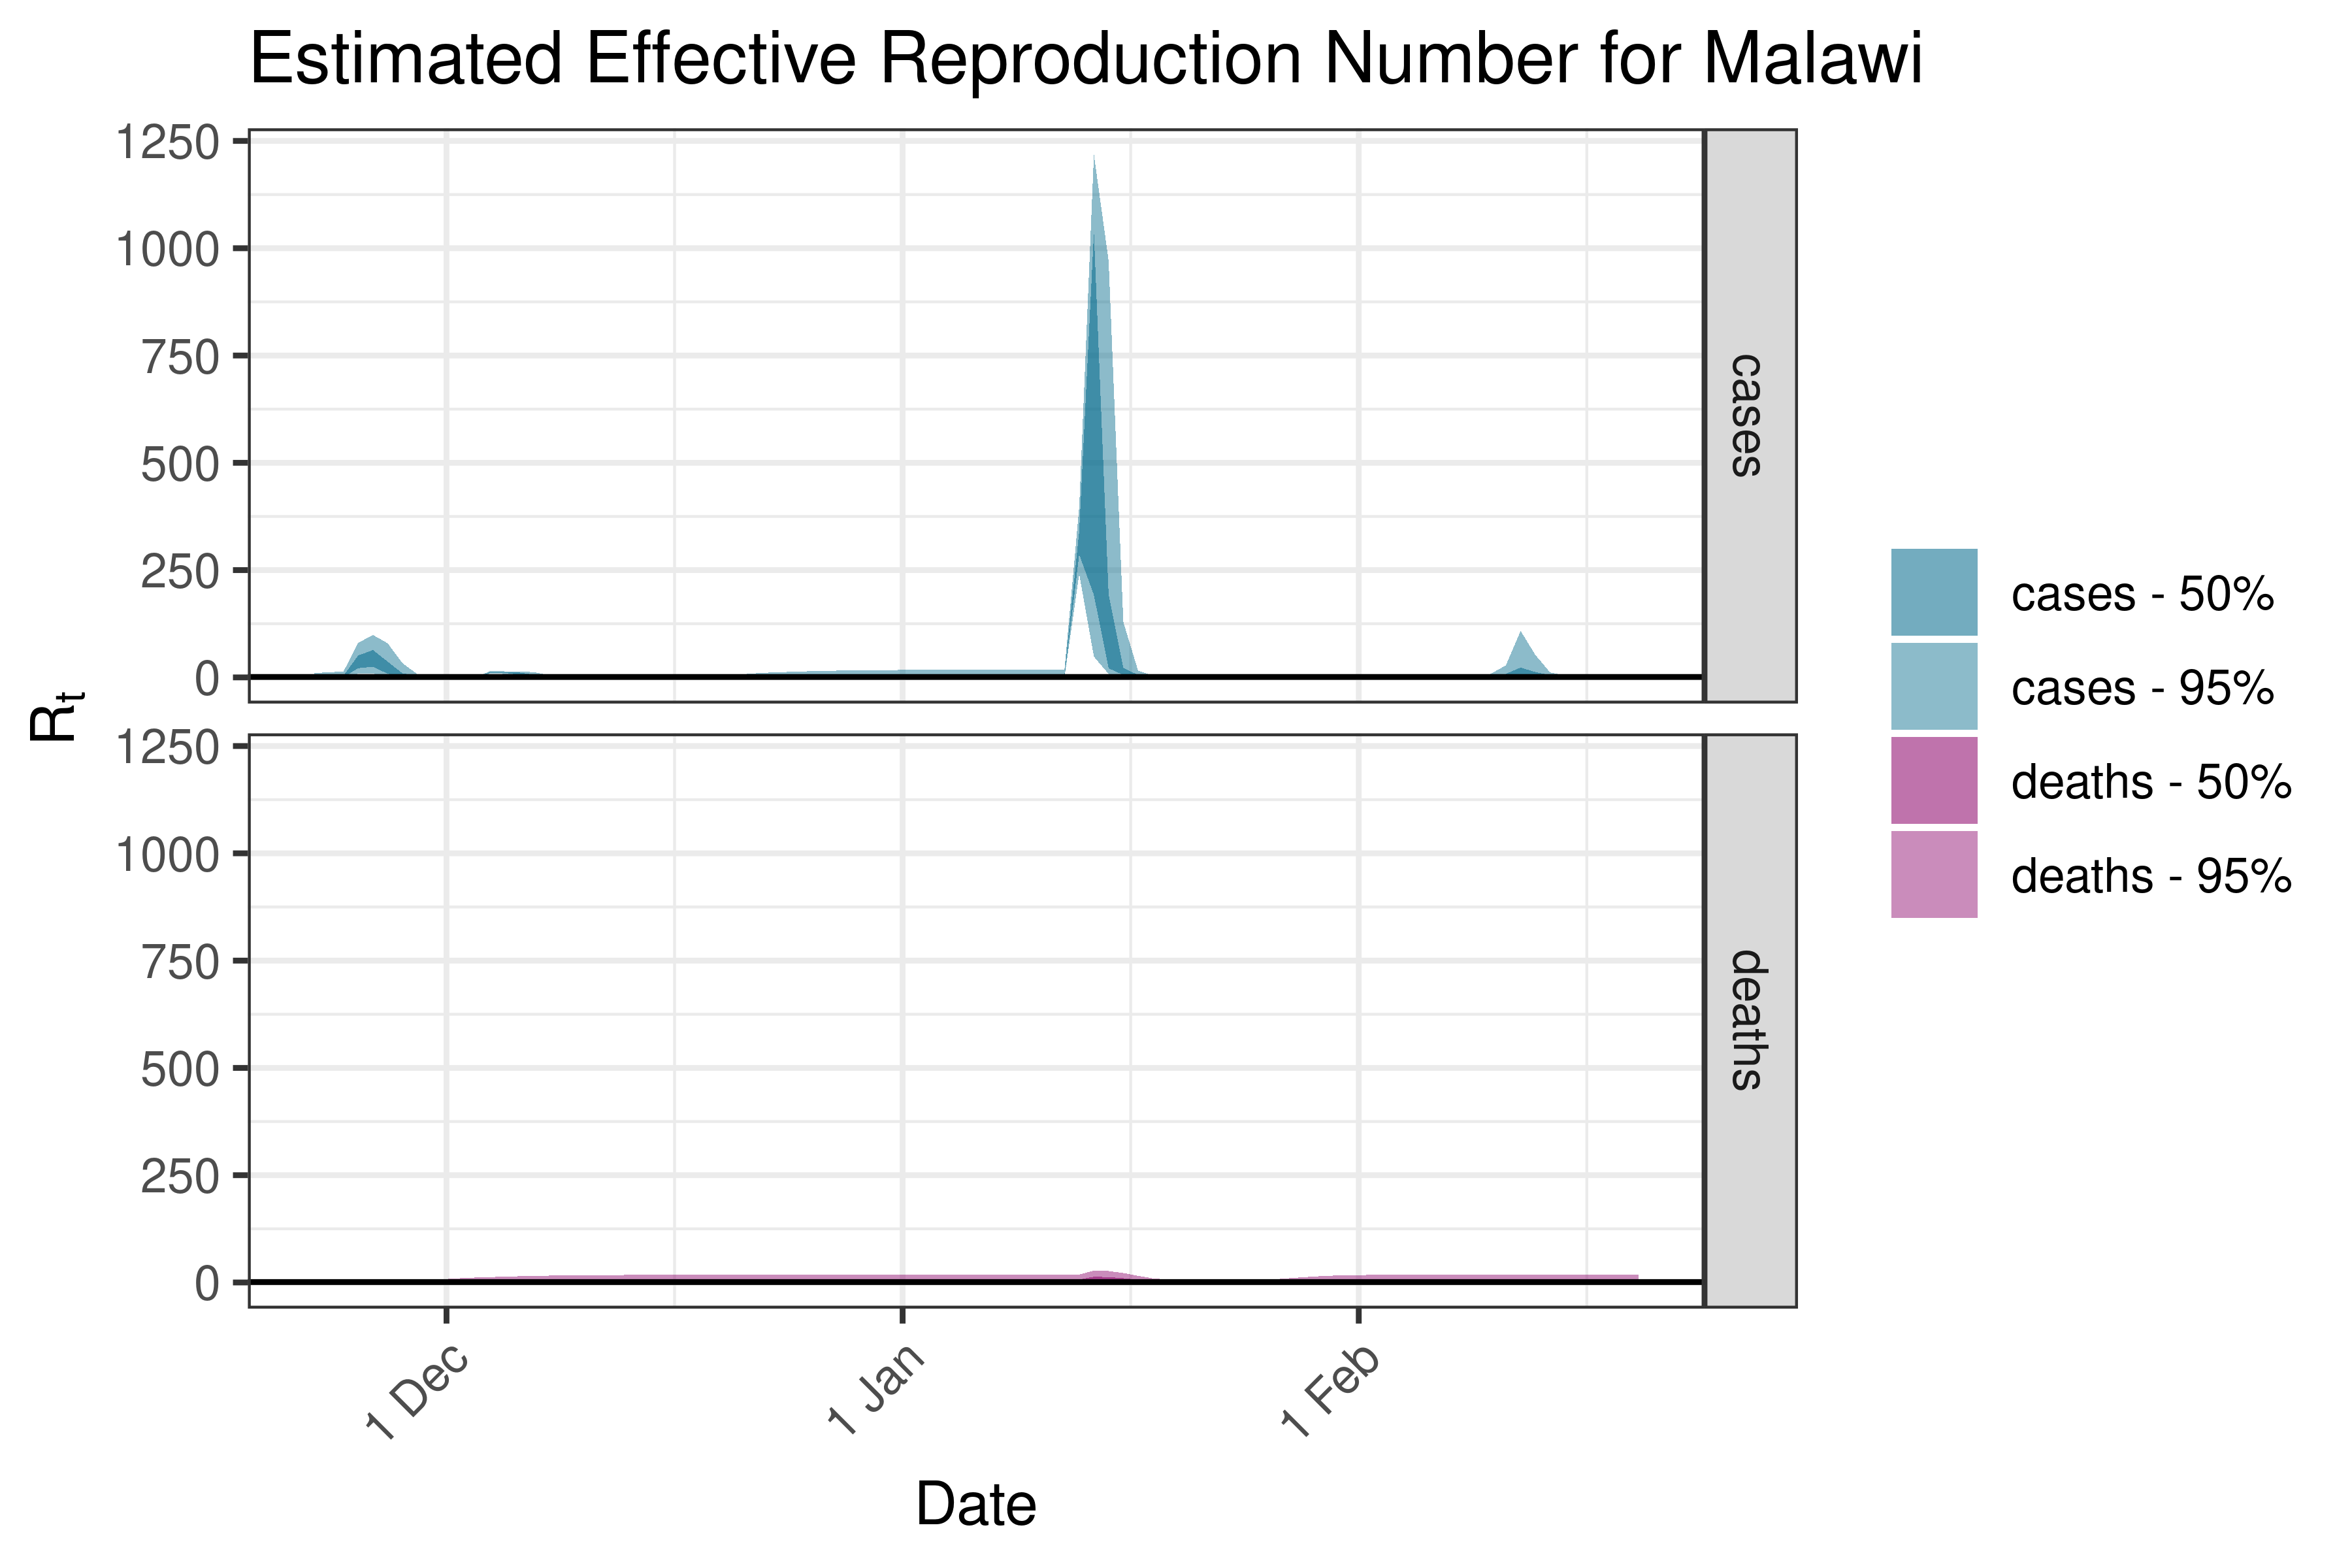
6.5.1.22 Malawi
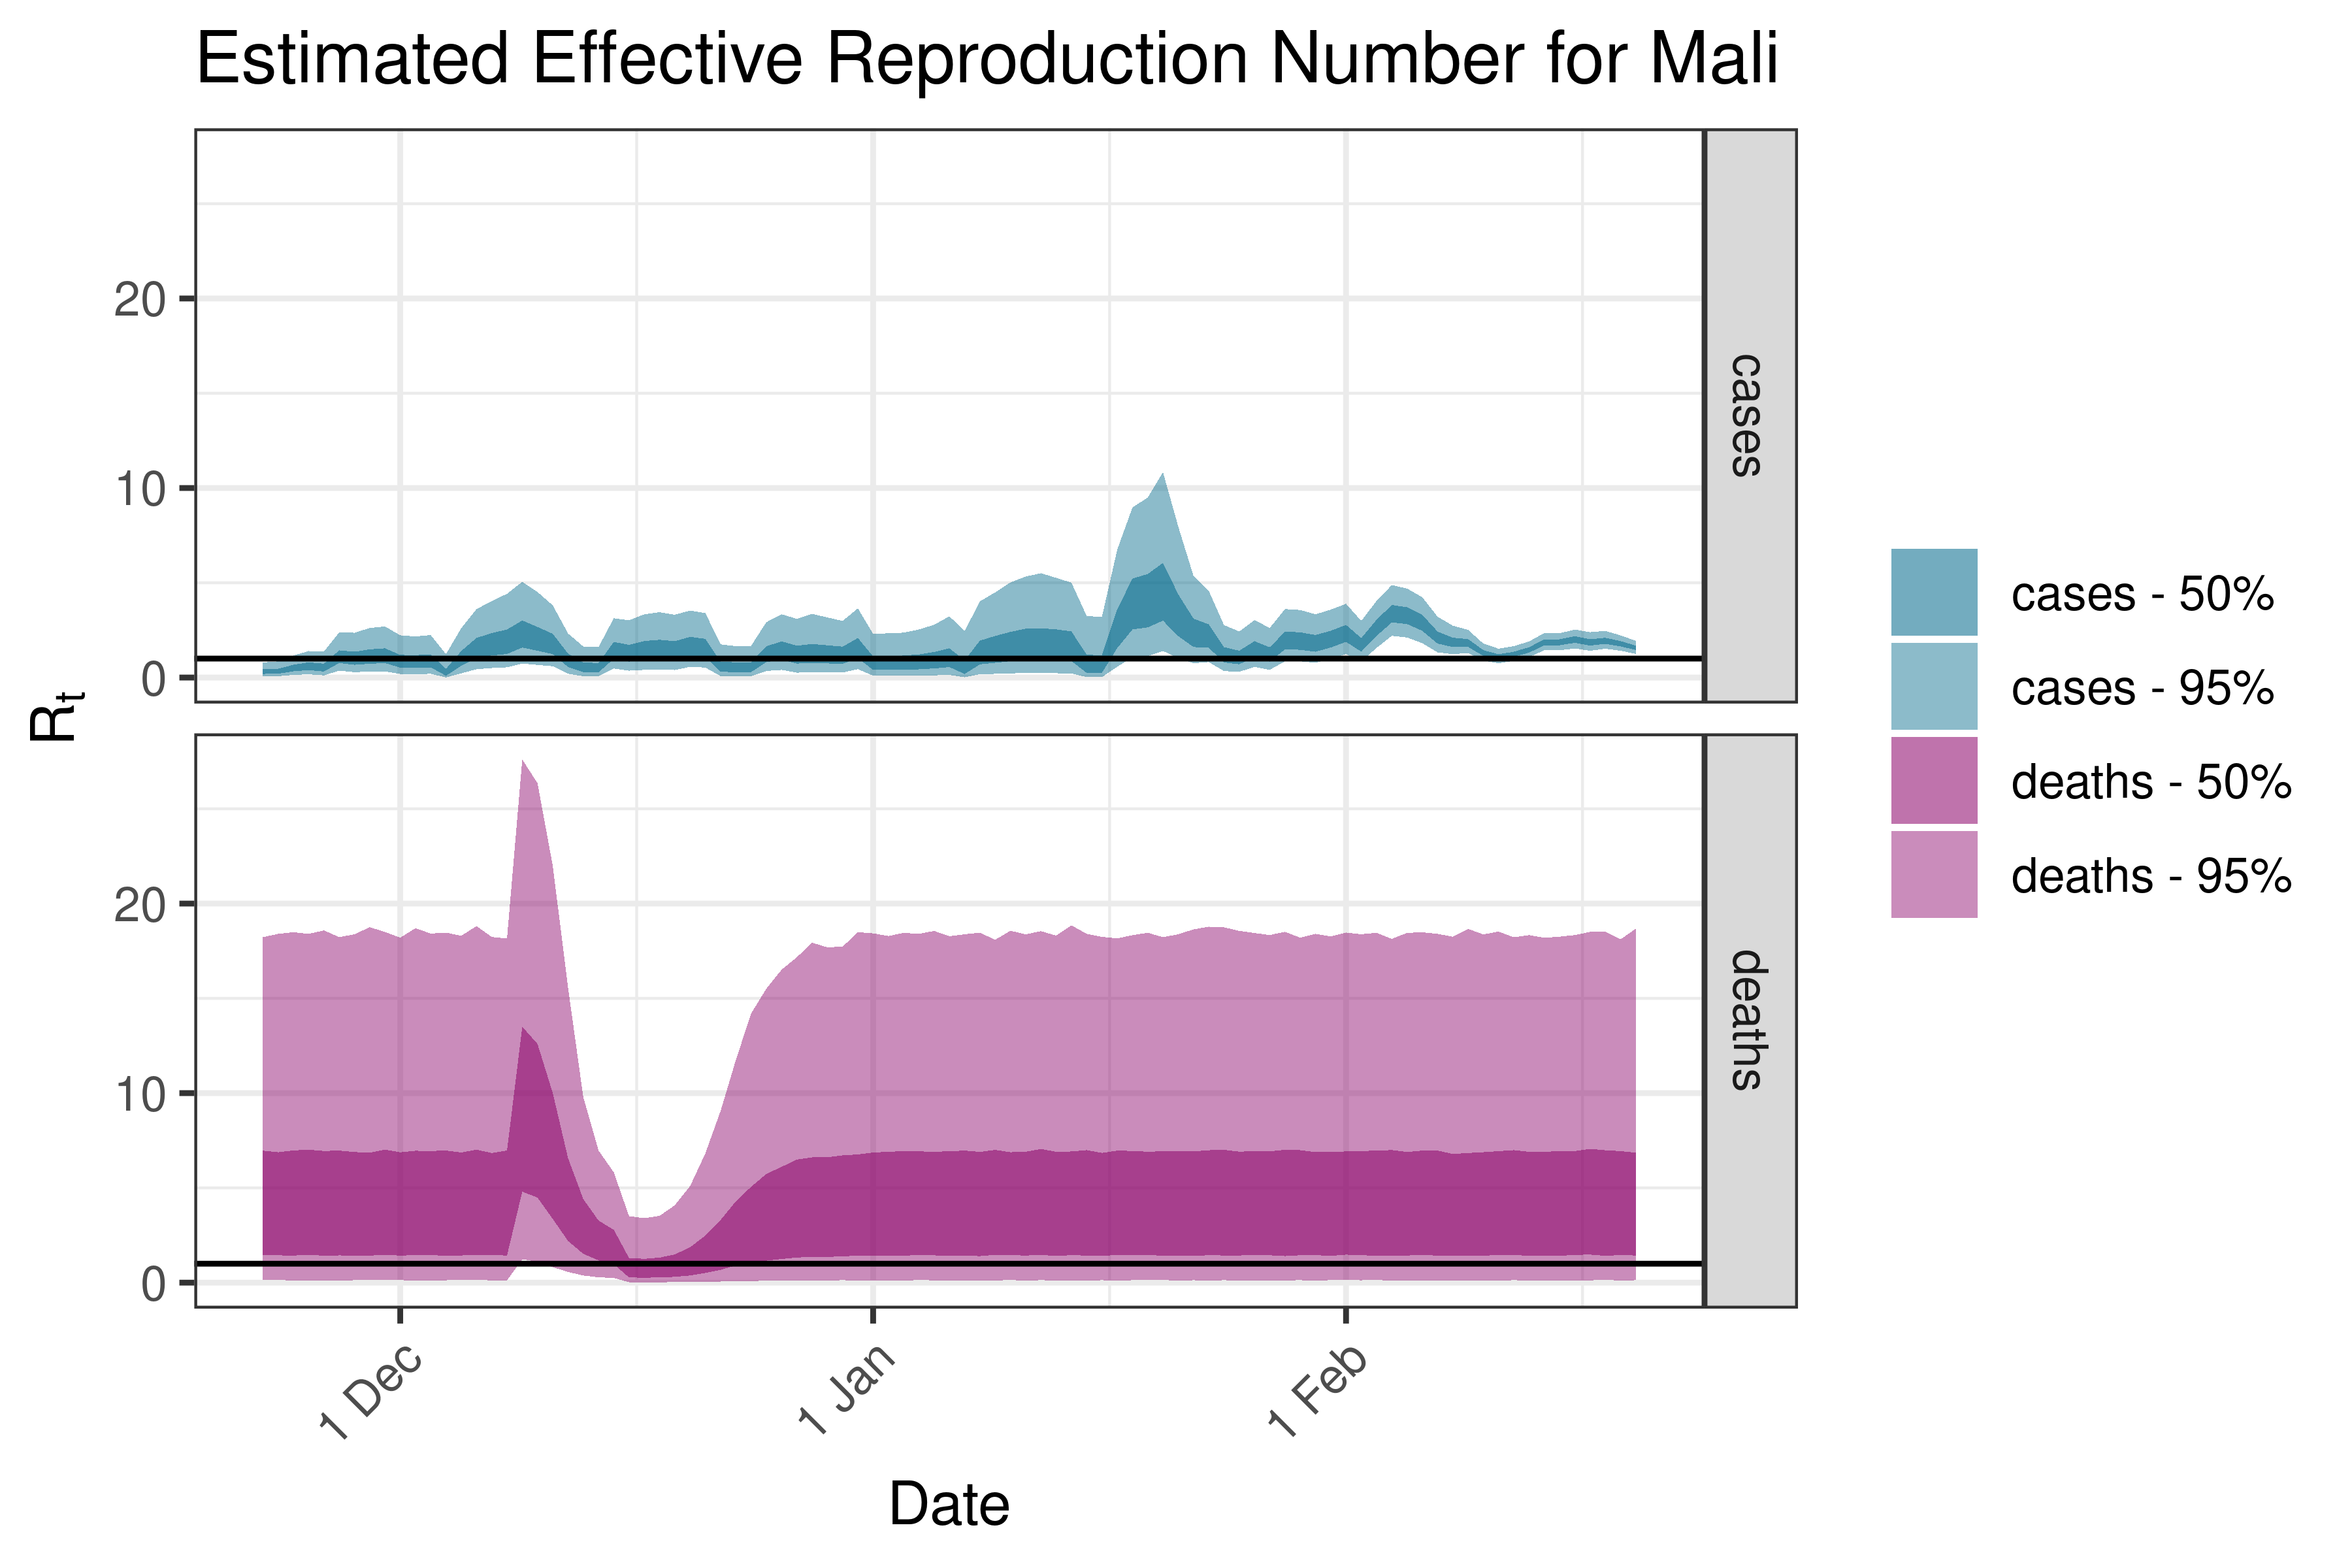
6.5.1.23 Mali
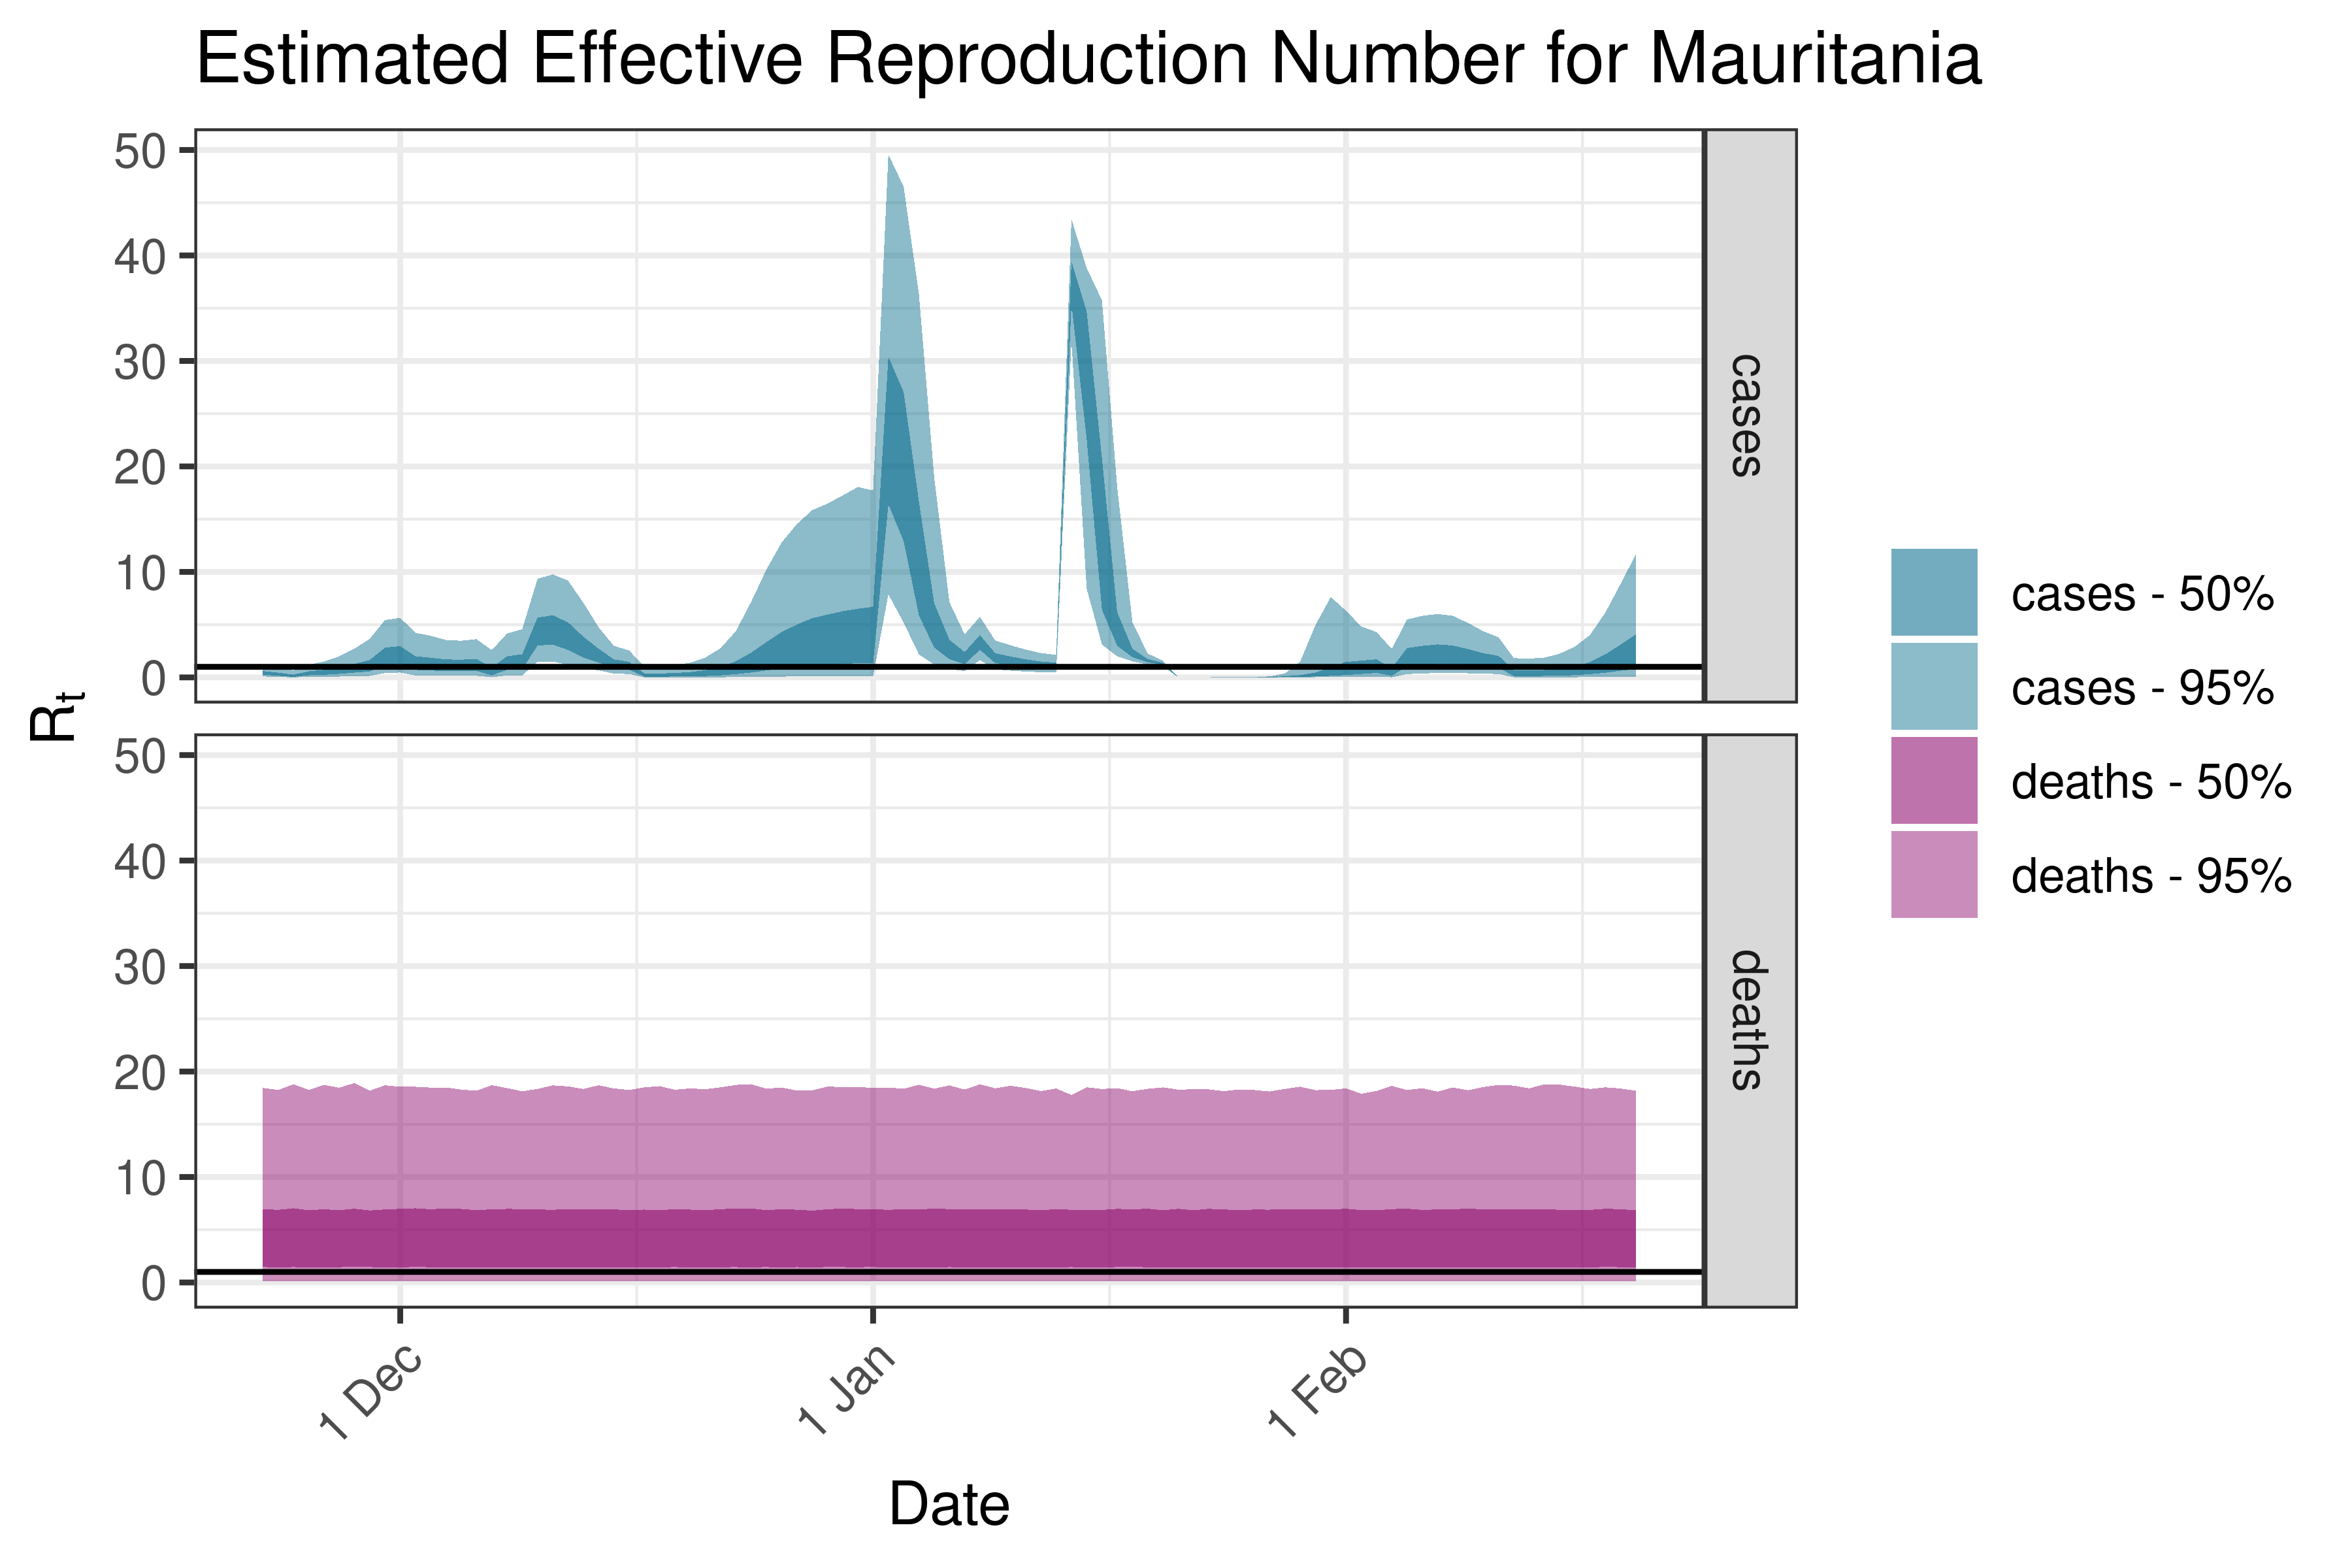
6.5.1.24 Mauritania
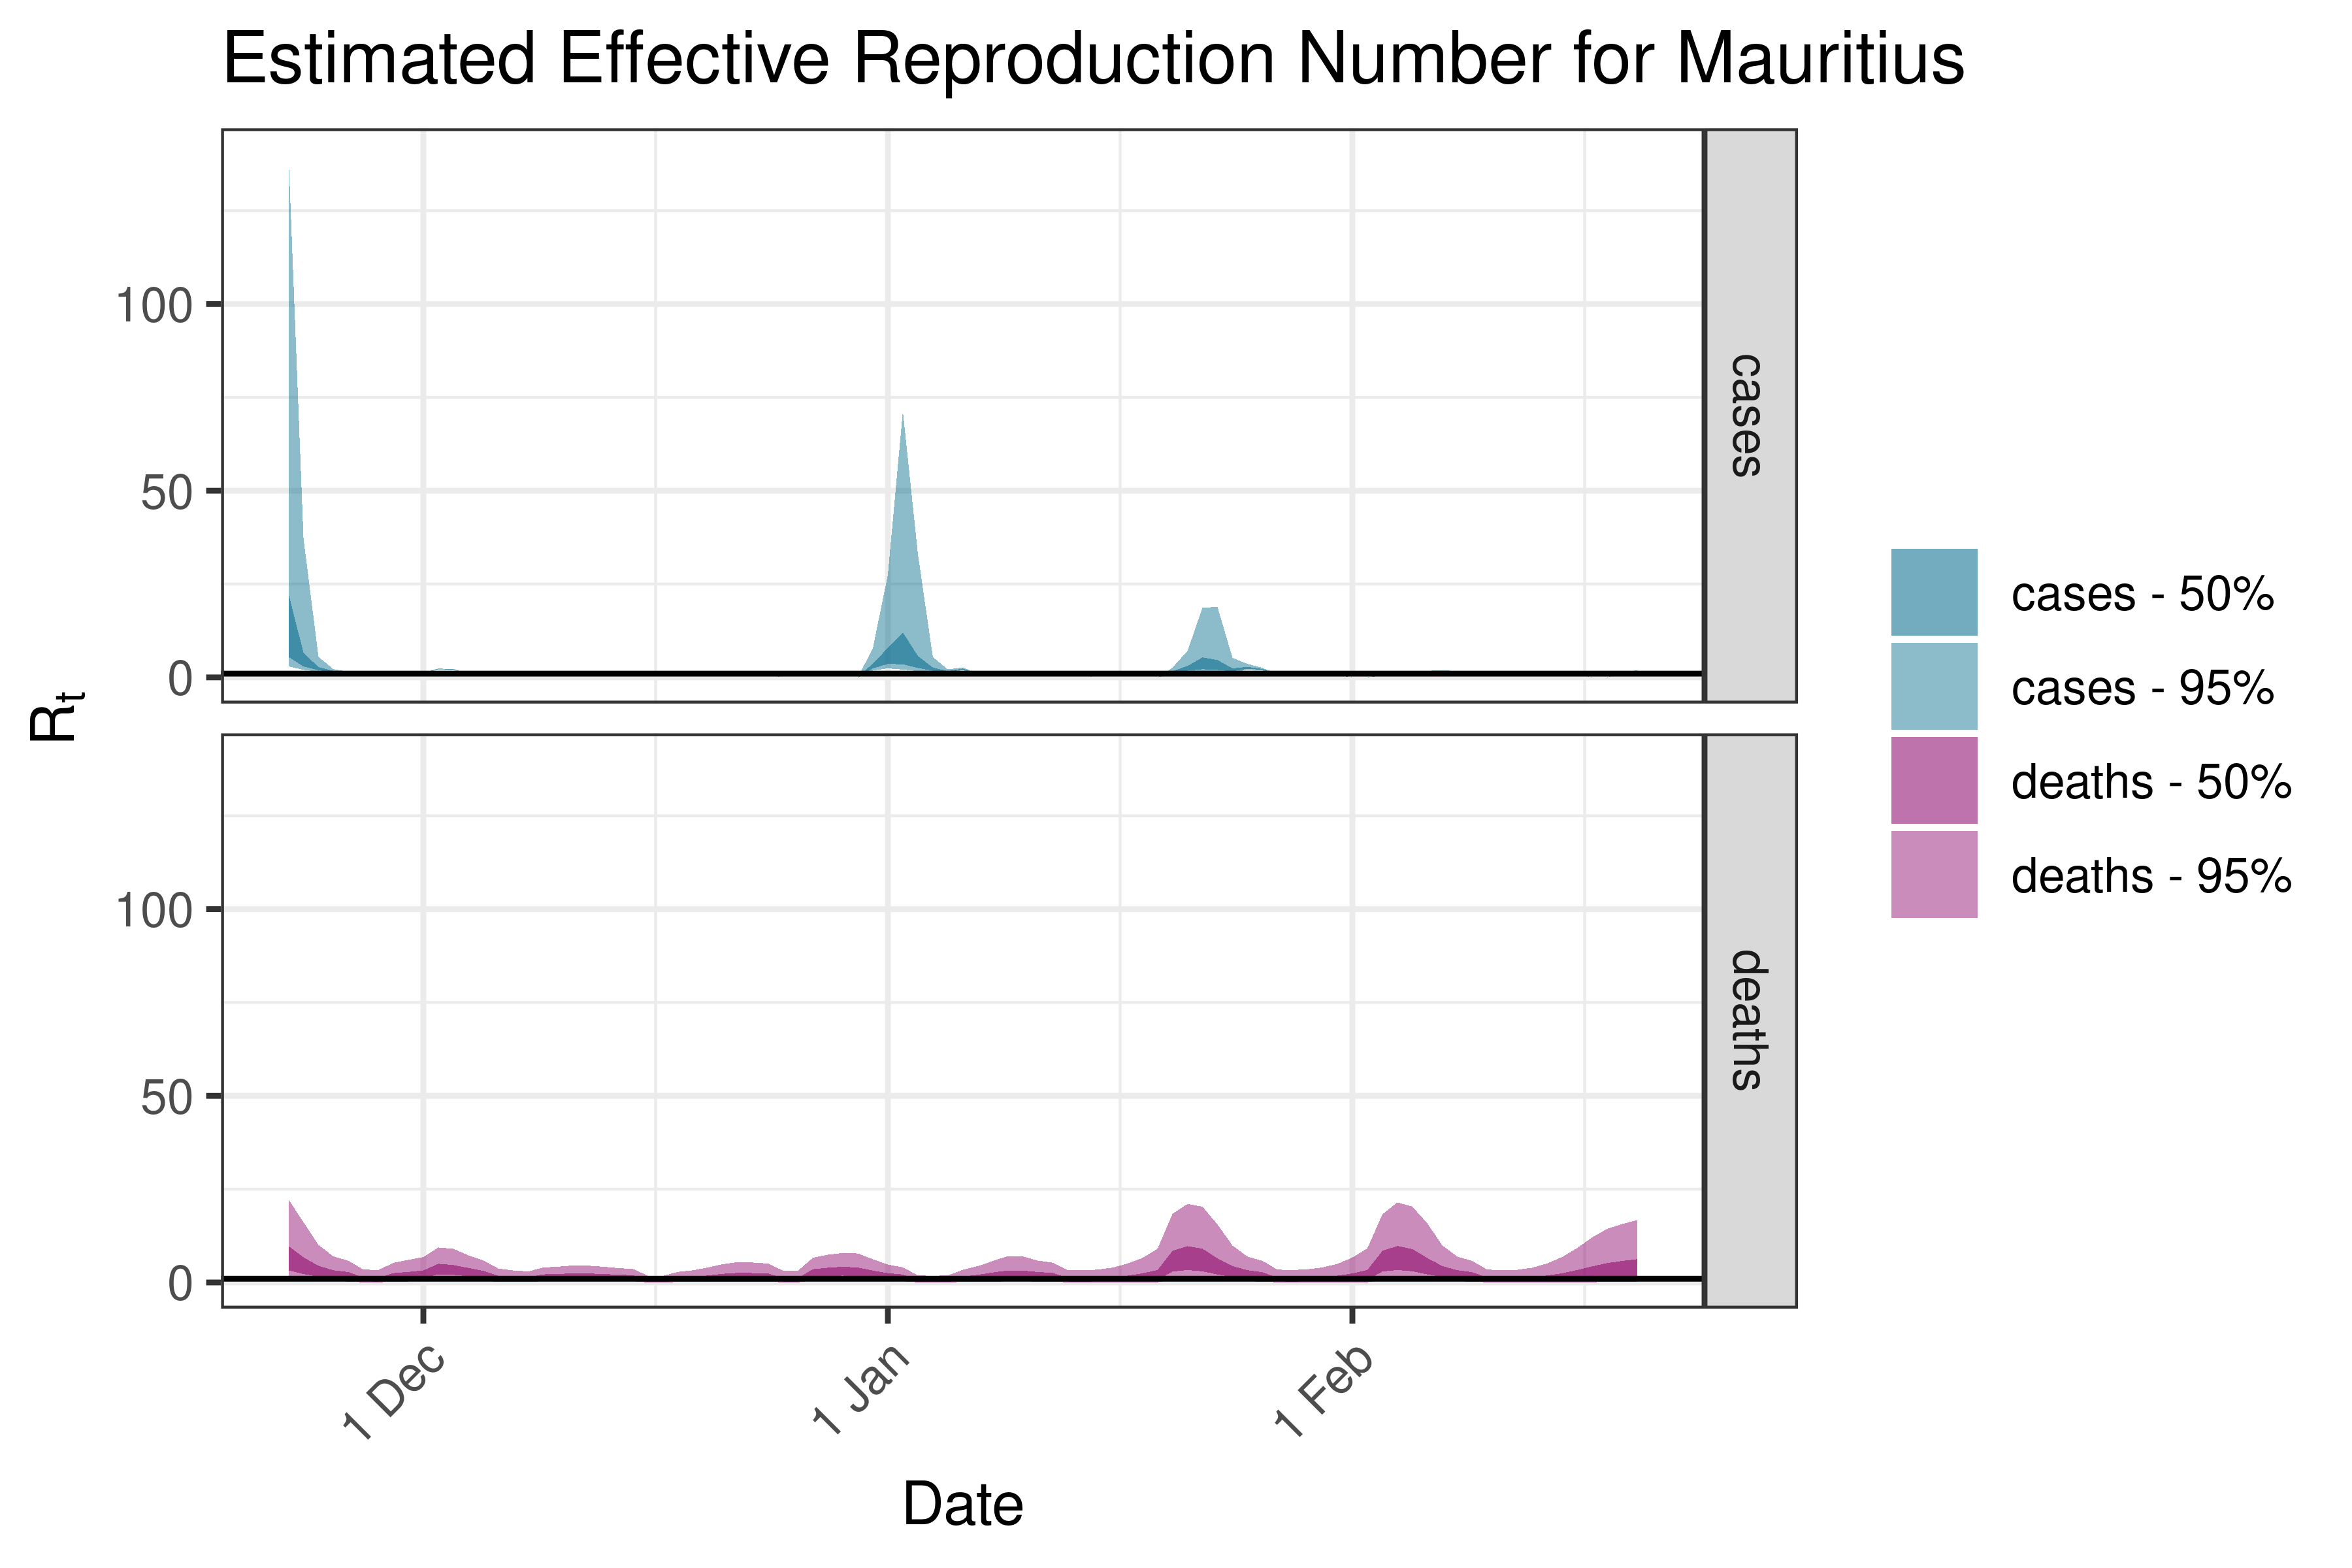
6.5.1.25 Mauritius
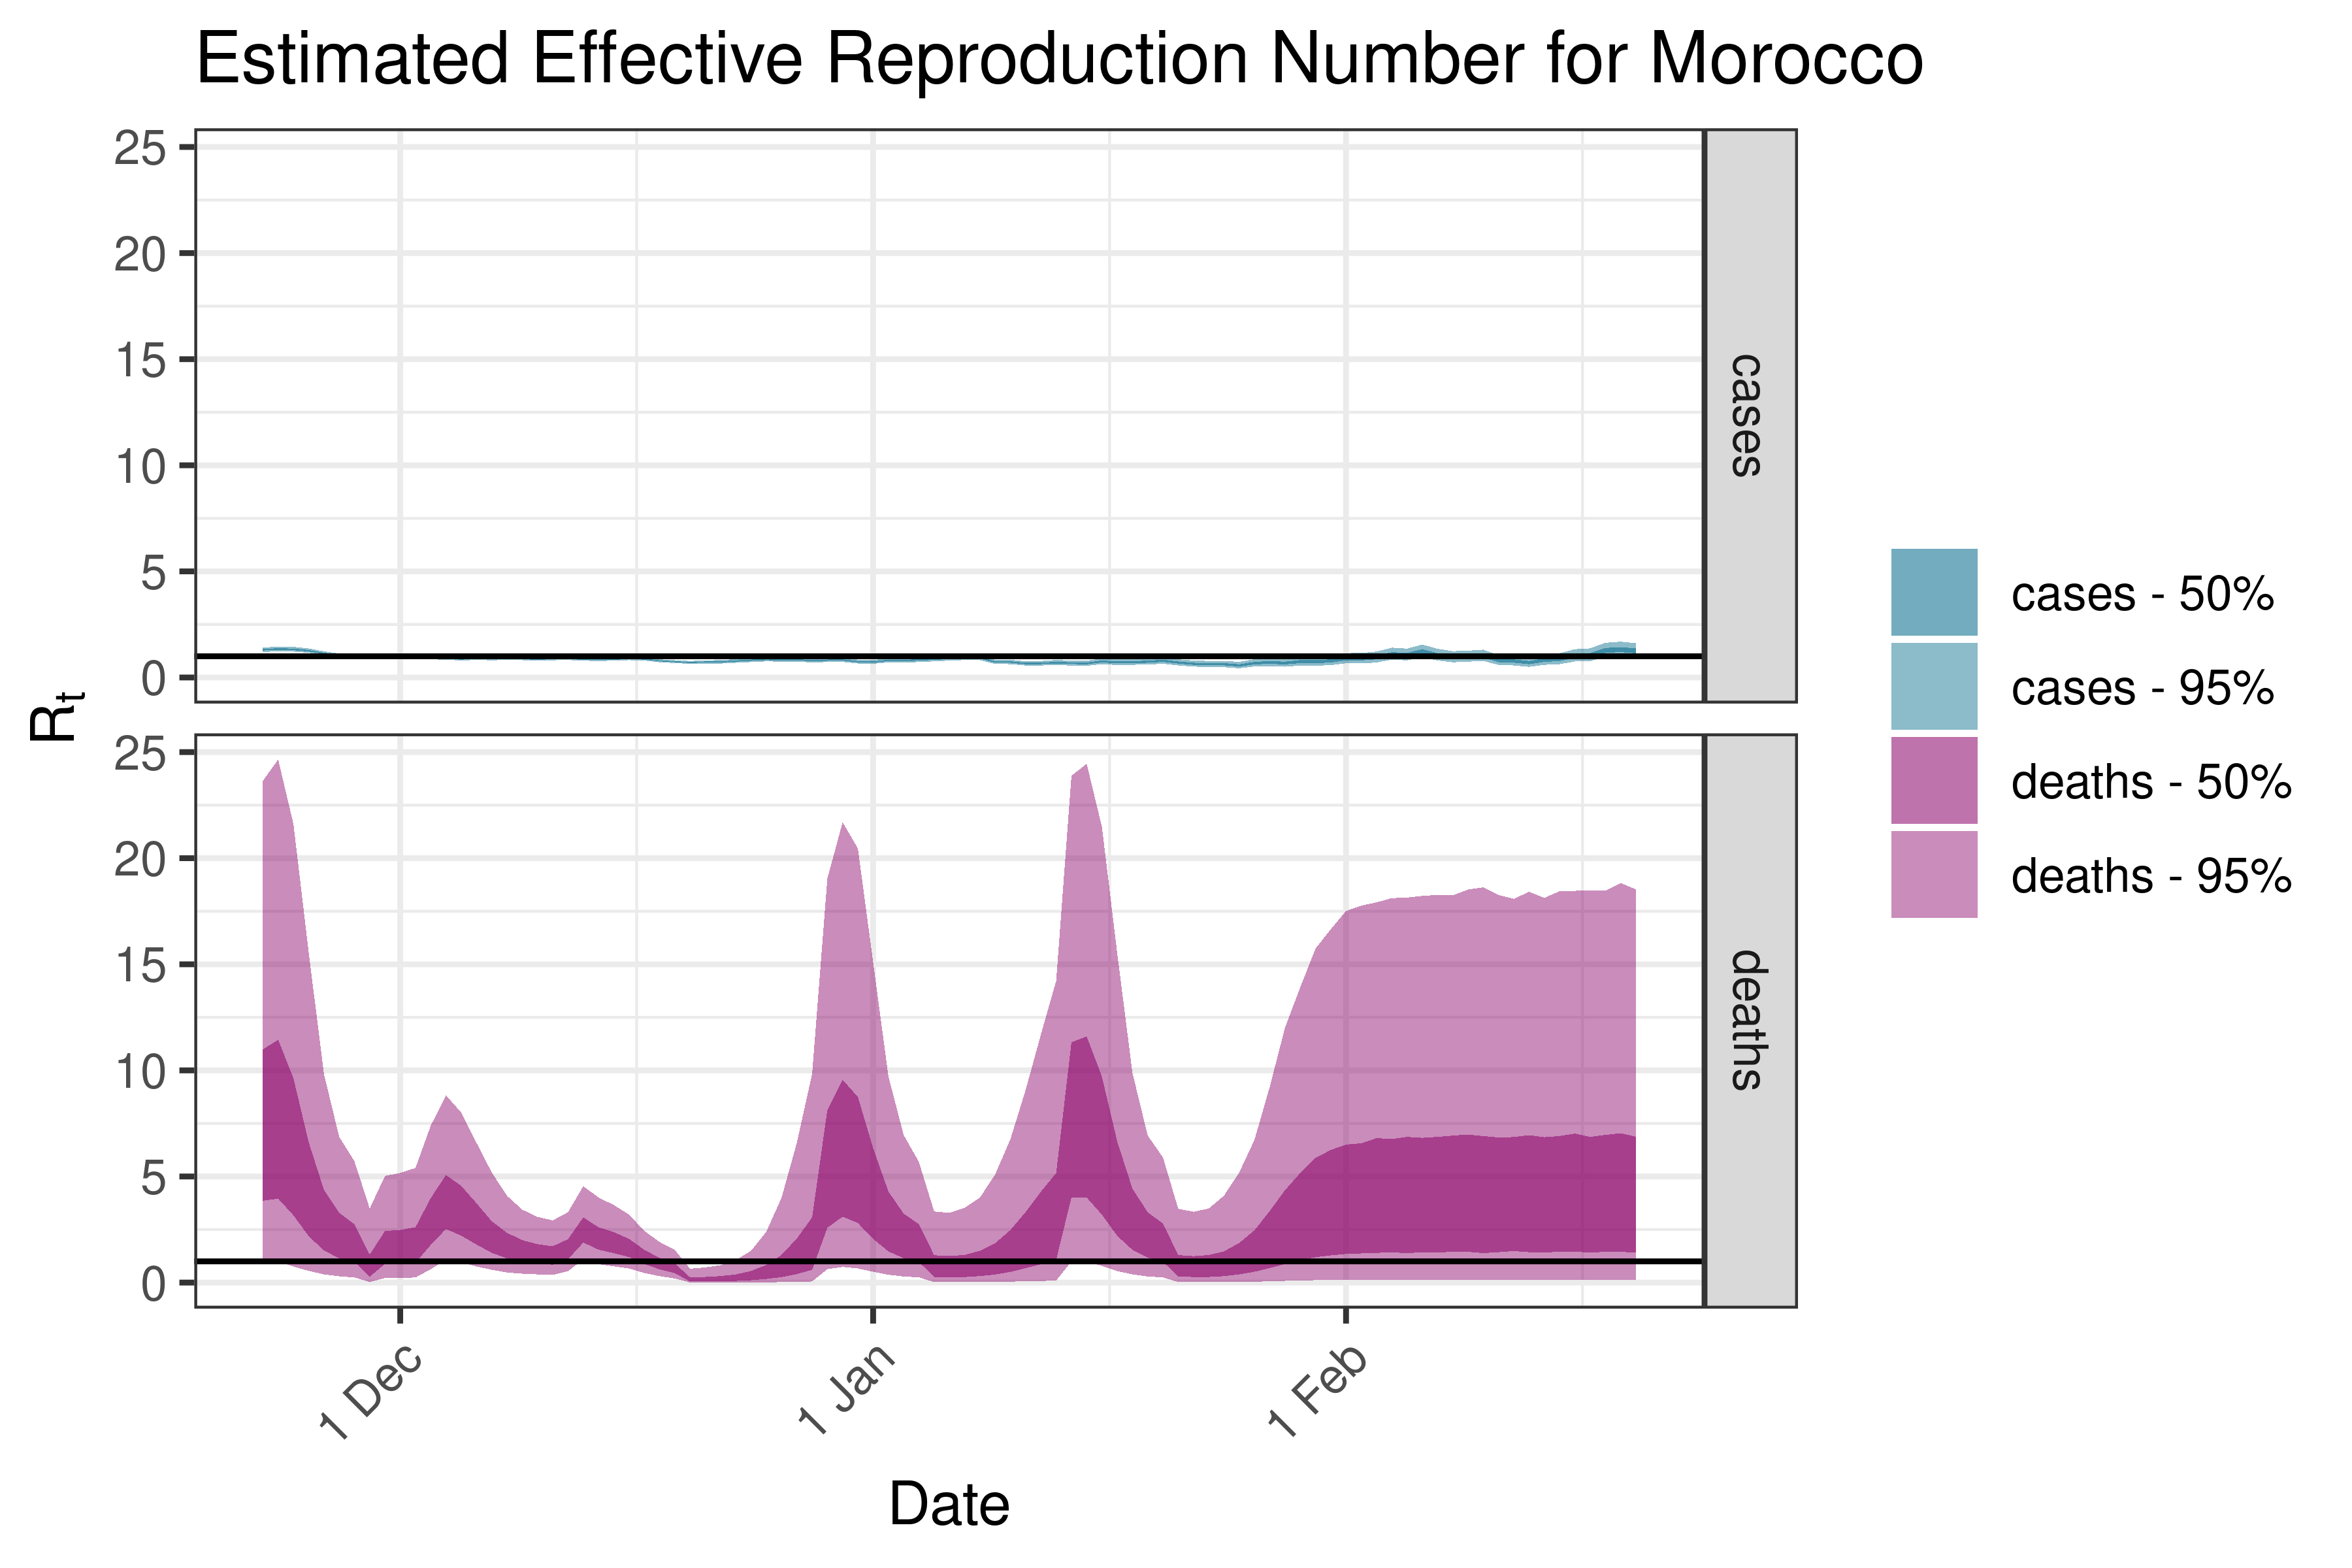
6.5.1.26 Morocco
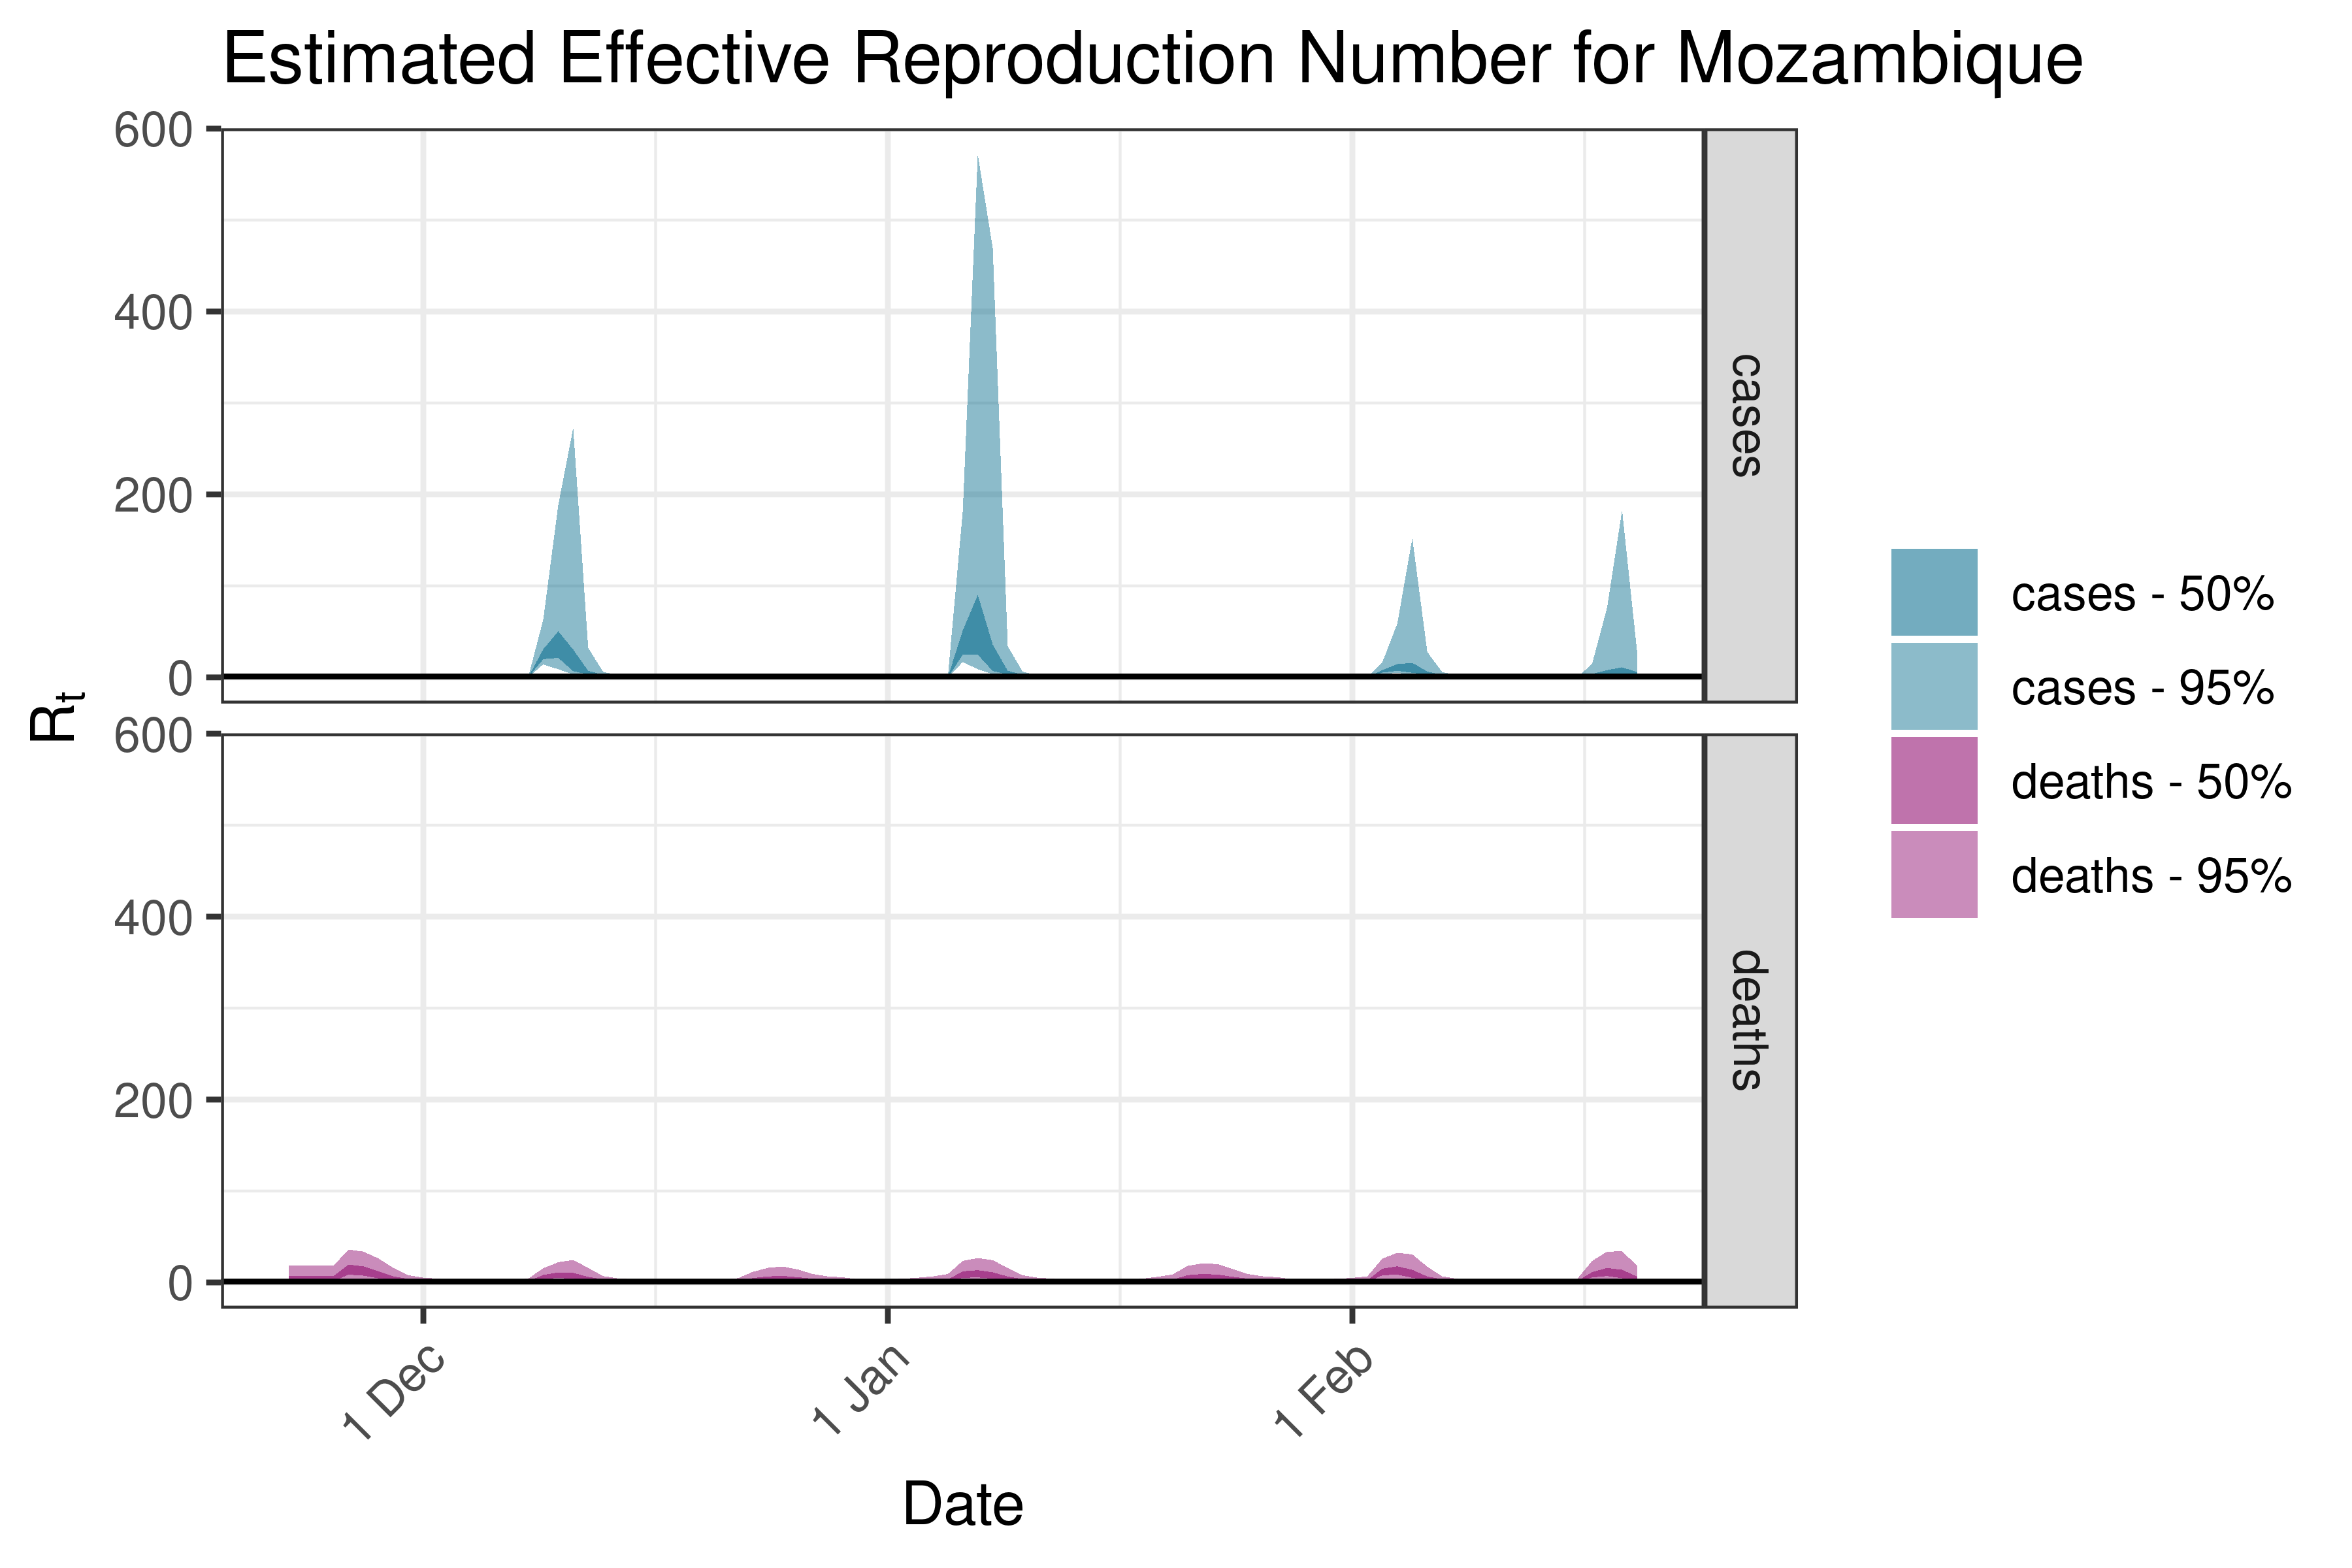
6.5.1.27 Mozambique
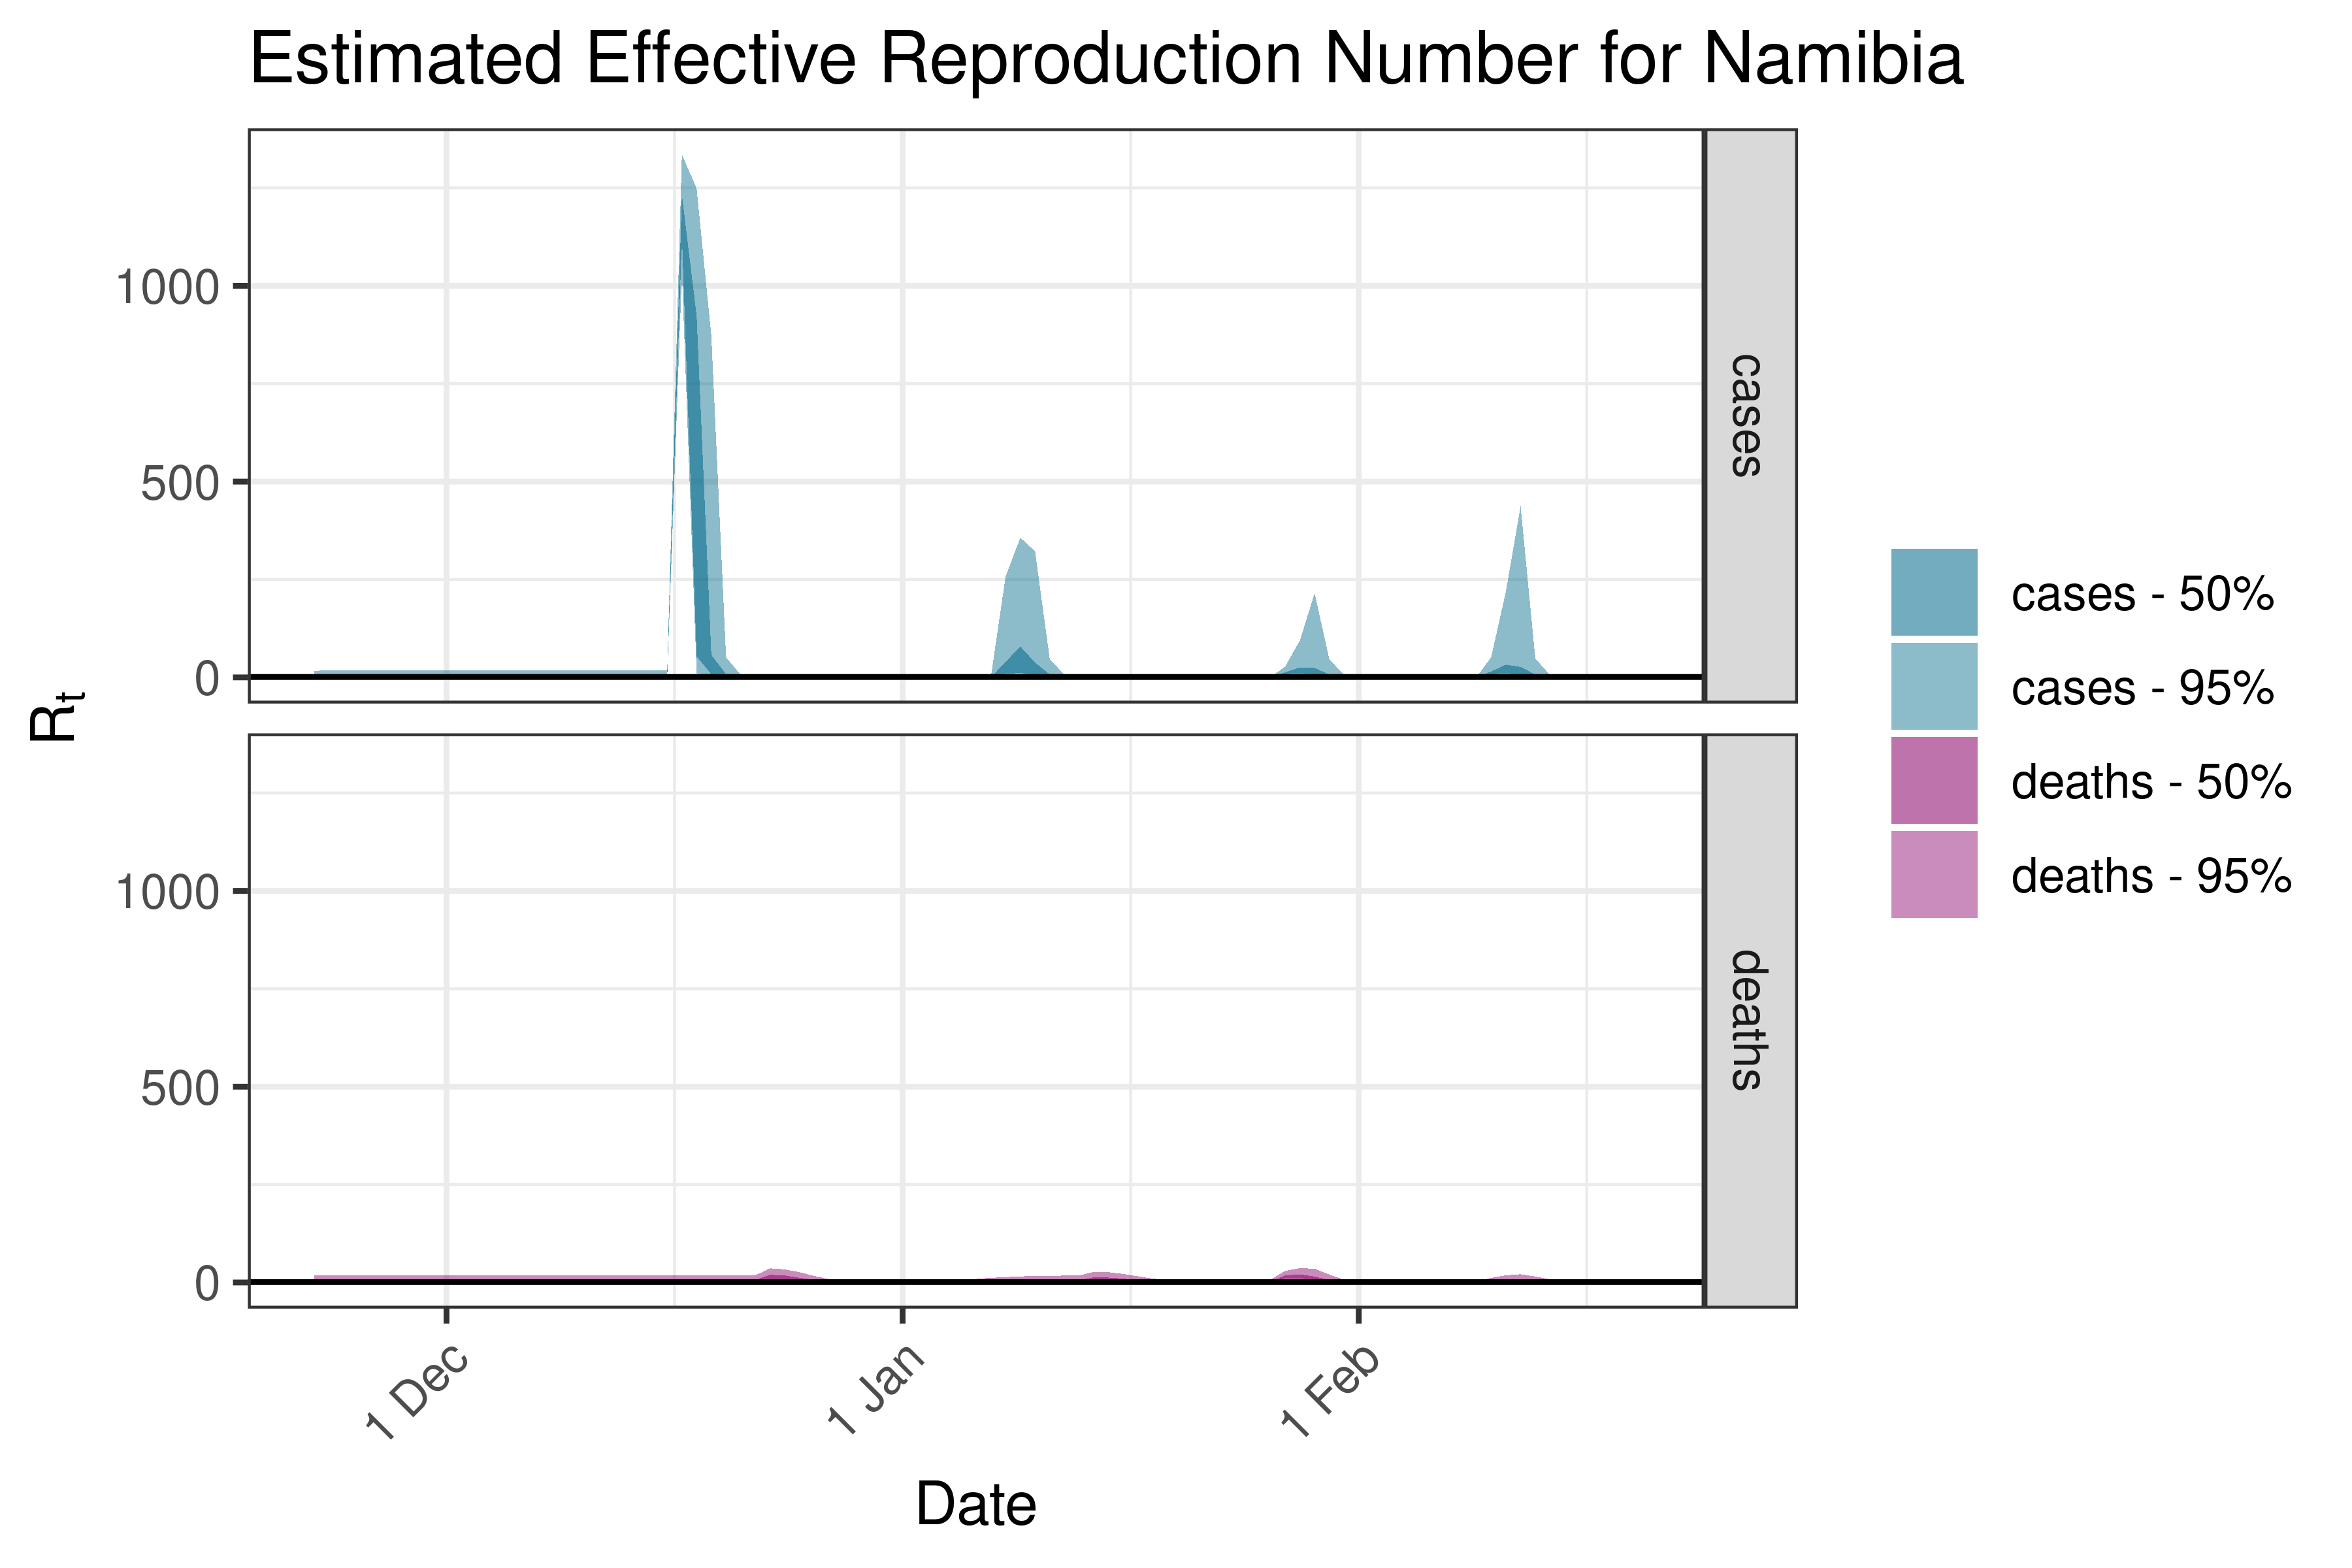
6.5.1.28 Namibia
6.5.1.29 Nigeria
6.5.1.30 Rwanda
6.5.1.31 Senegal
6.5.1.32 South Africa
6.5.1.33 South Sudan
6.5.1.34 Sudan
6.5.1.35 Tanzania
6.5.1.36 Tunisia
6.5.1.37 Uganda
6.5.1.38 Zambia
6.5.1.39 Zimbabwe
6.5.2 Asia
6.5.2.1 Afghanistan
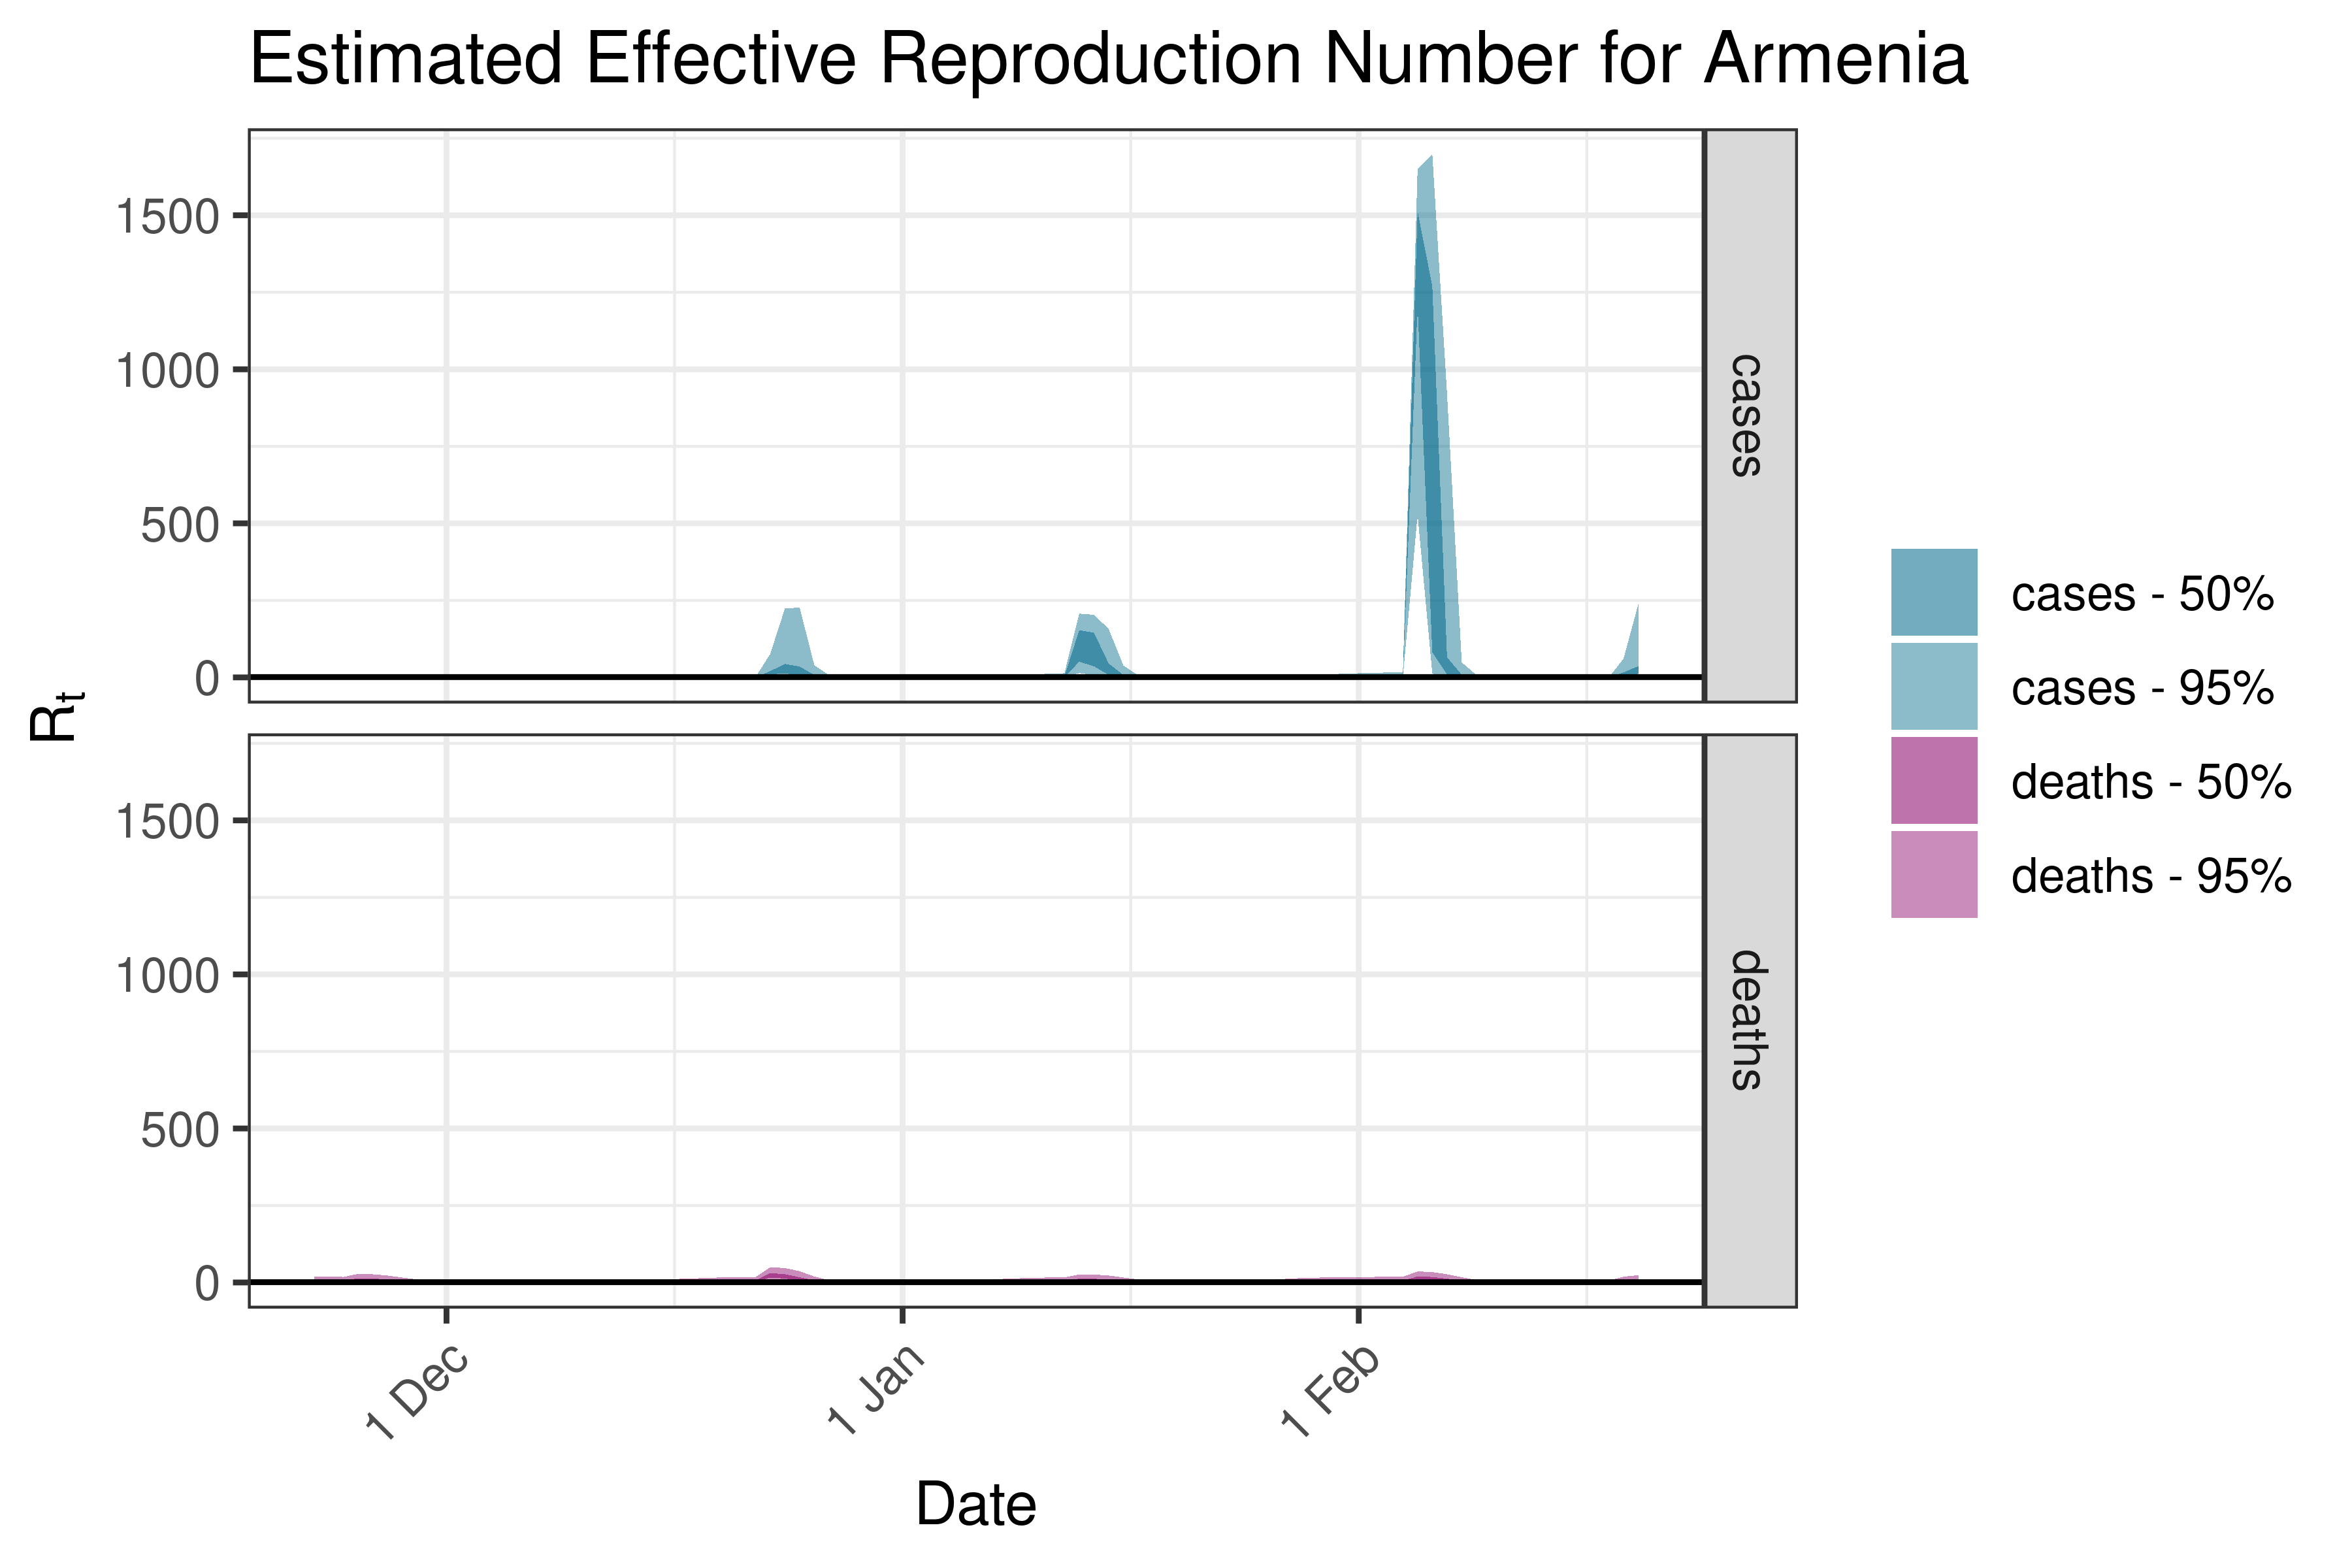
6.5.2.2 Armenia
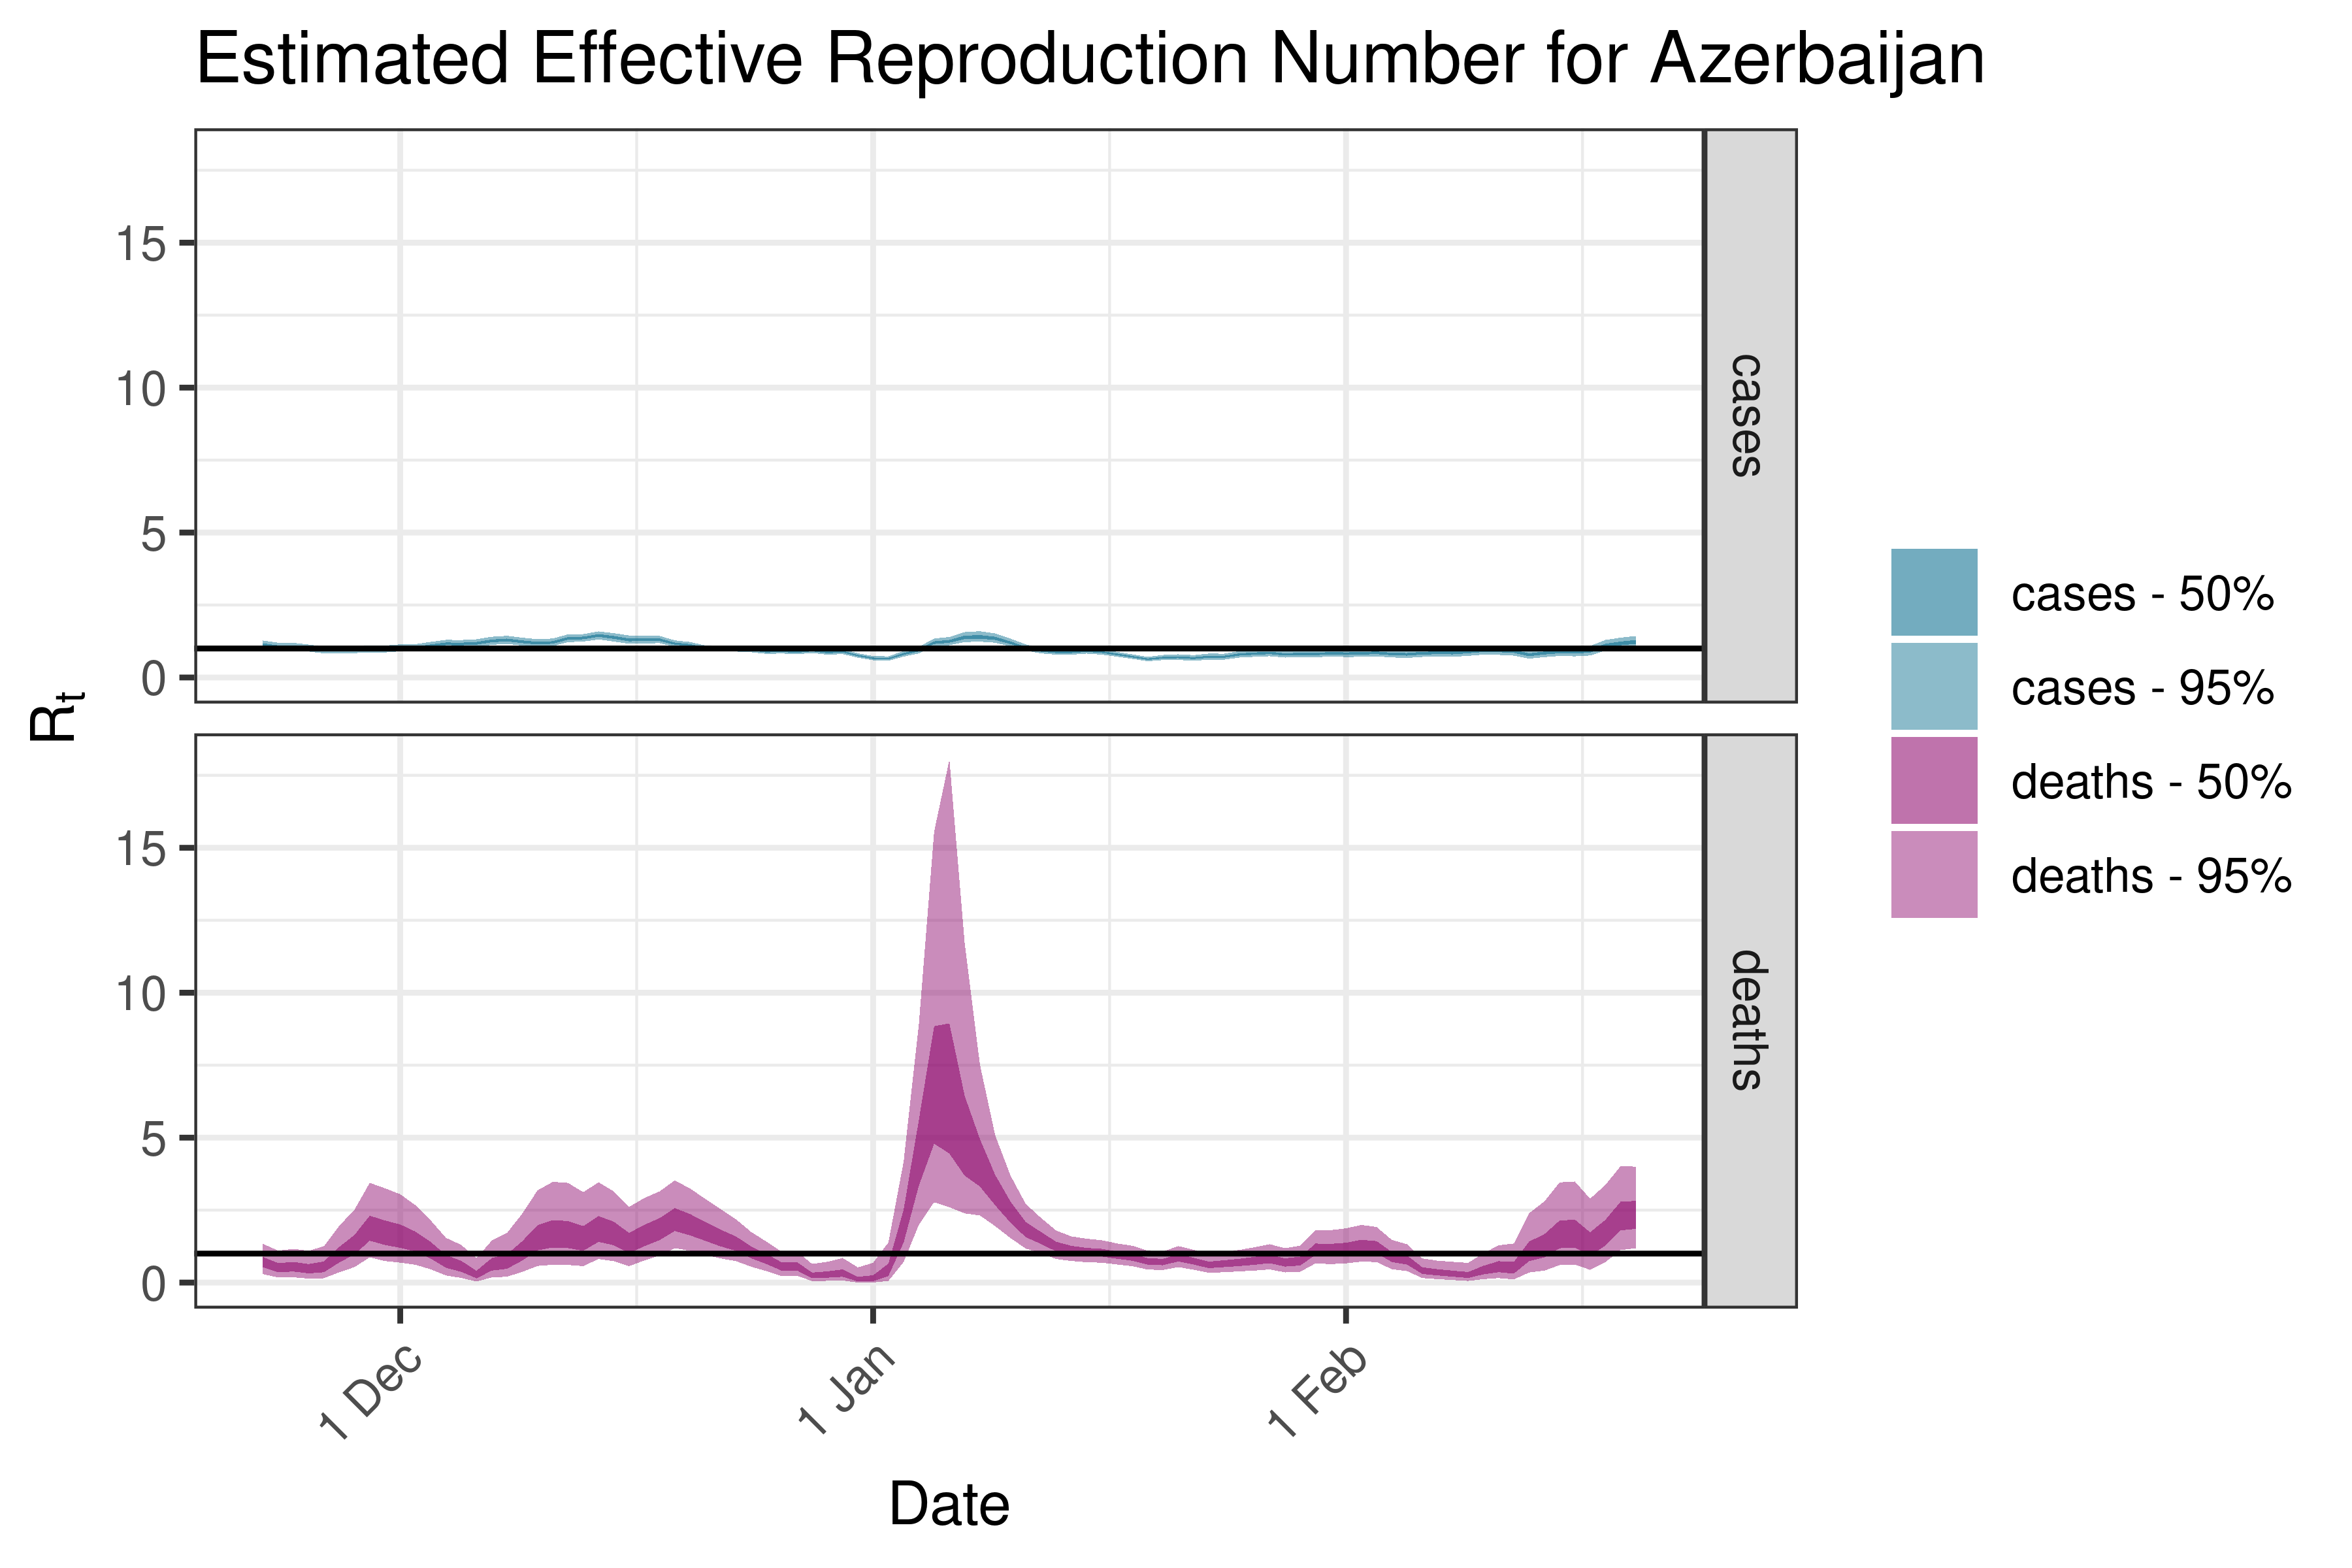
6.5.2.3 Azerbaijan
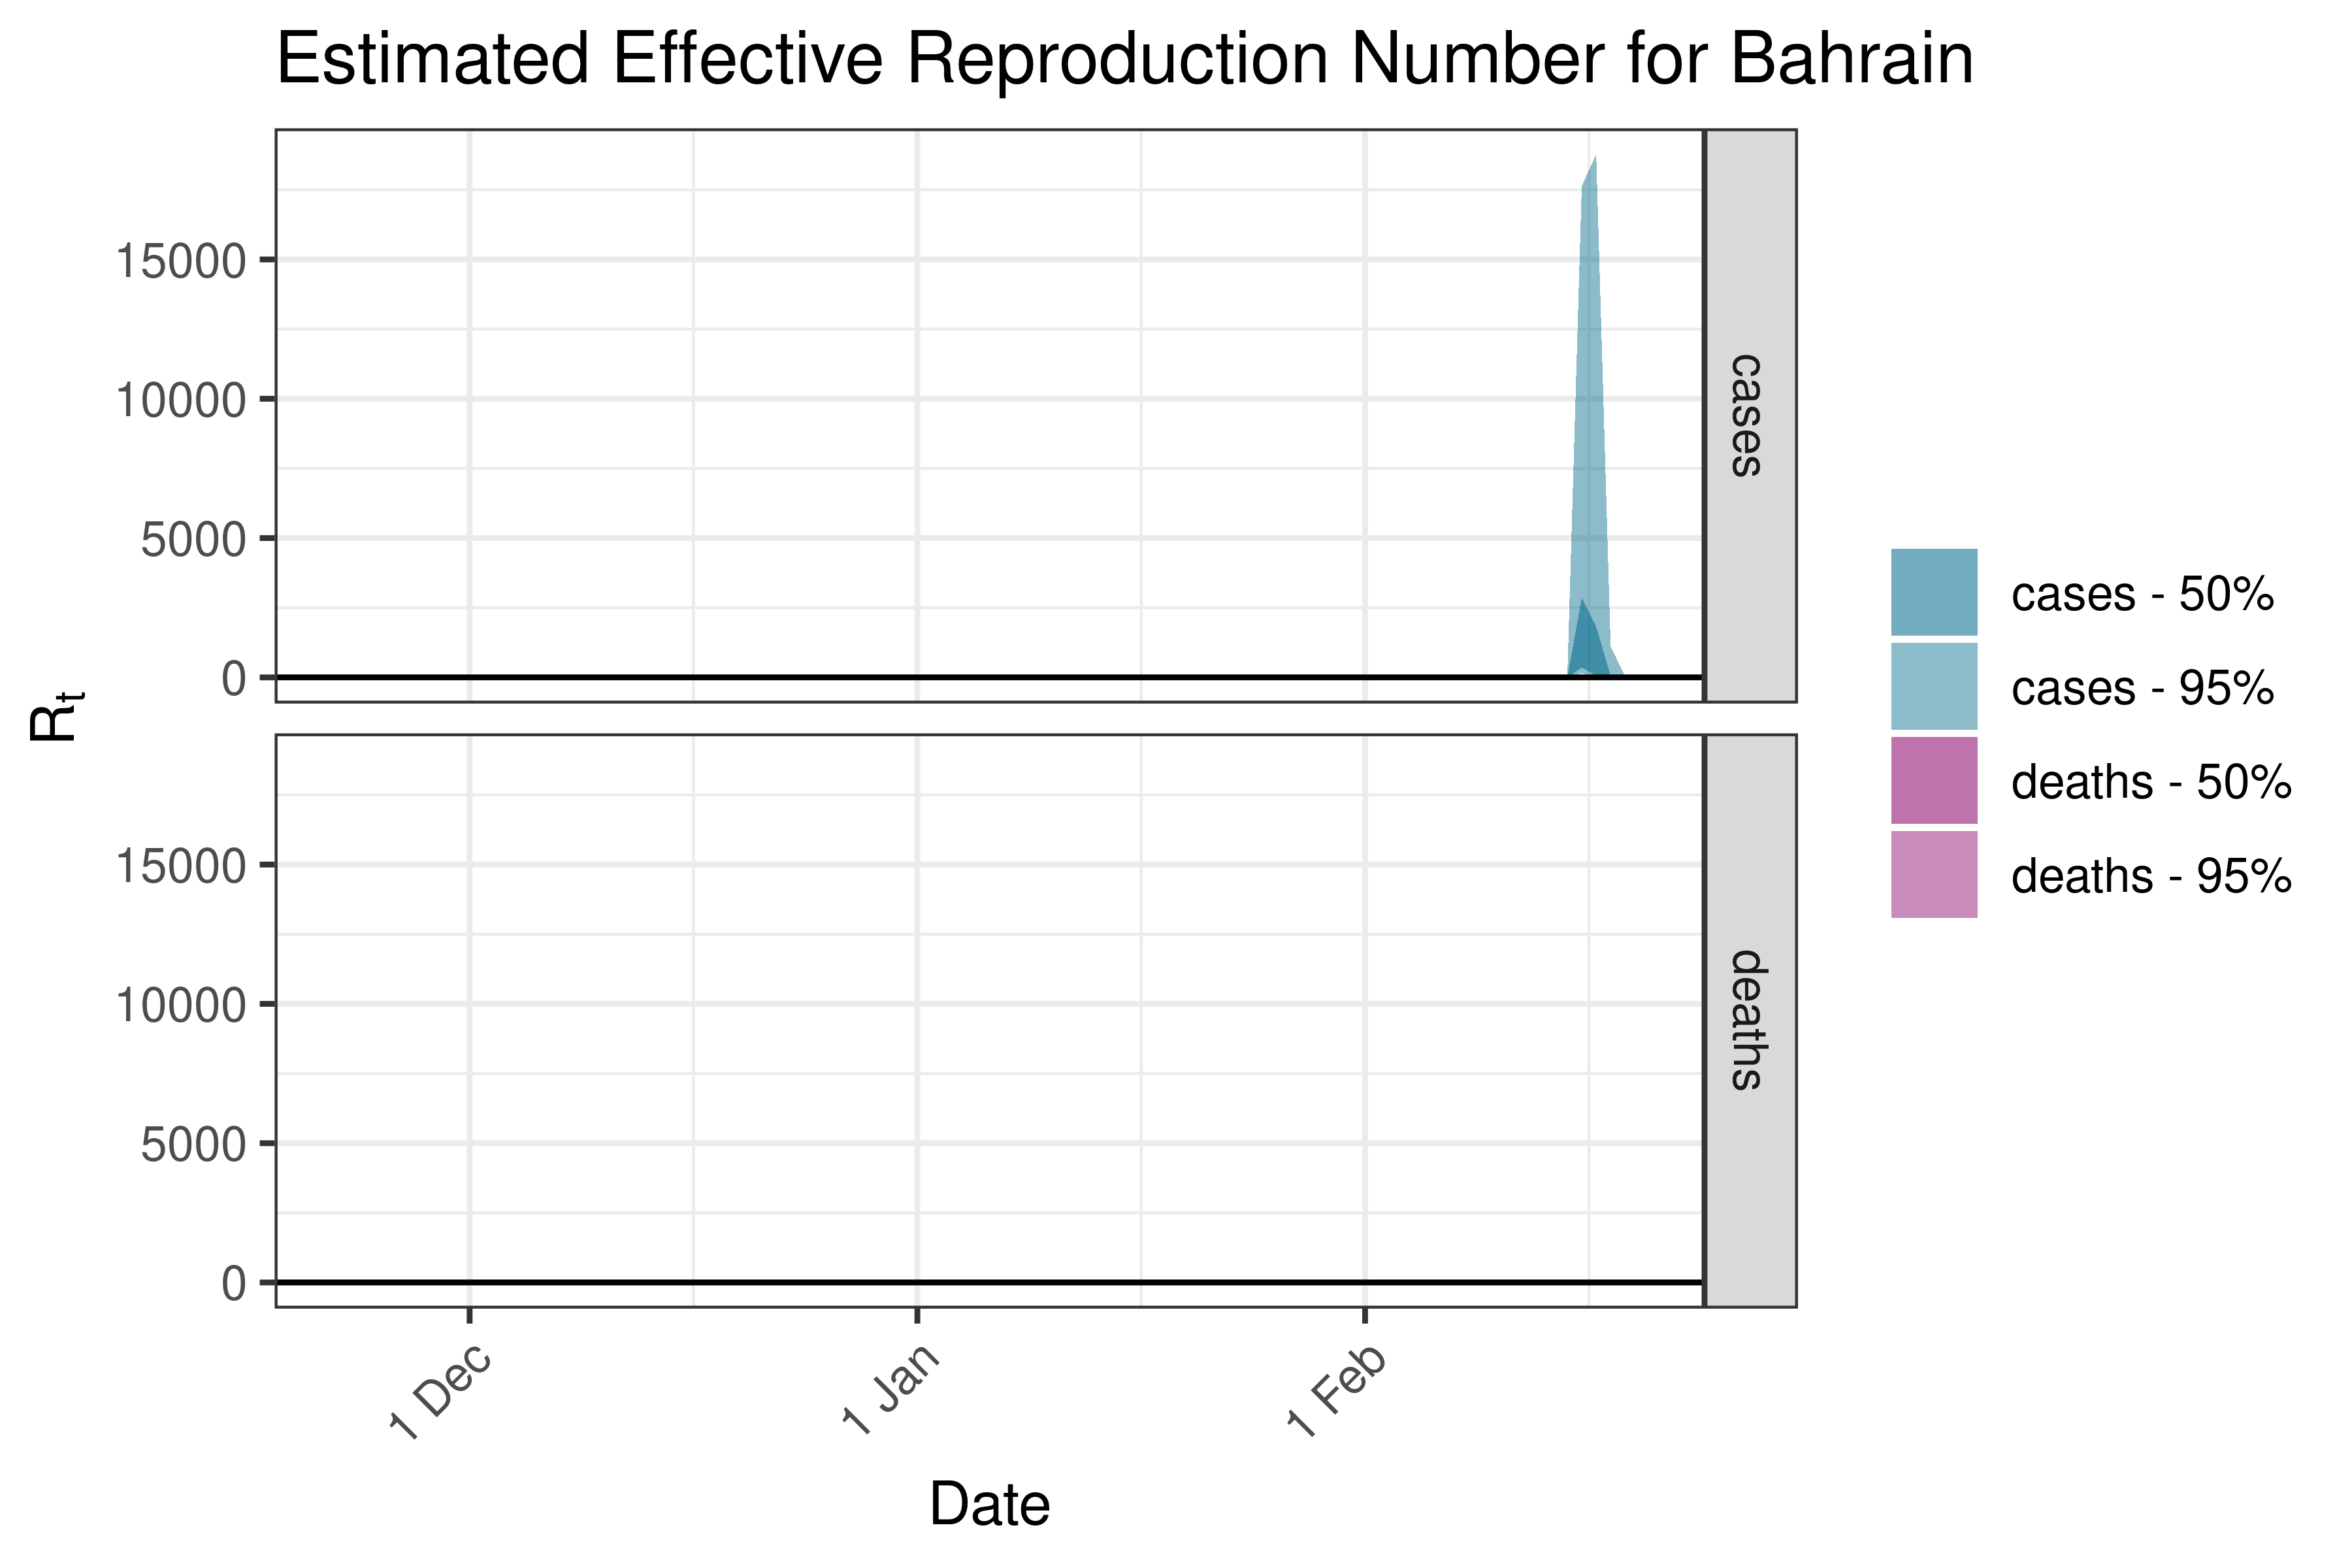
6.5.2.4 Bahrain
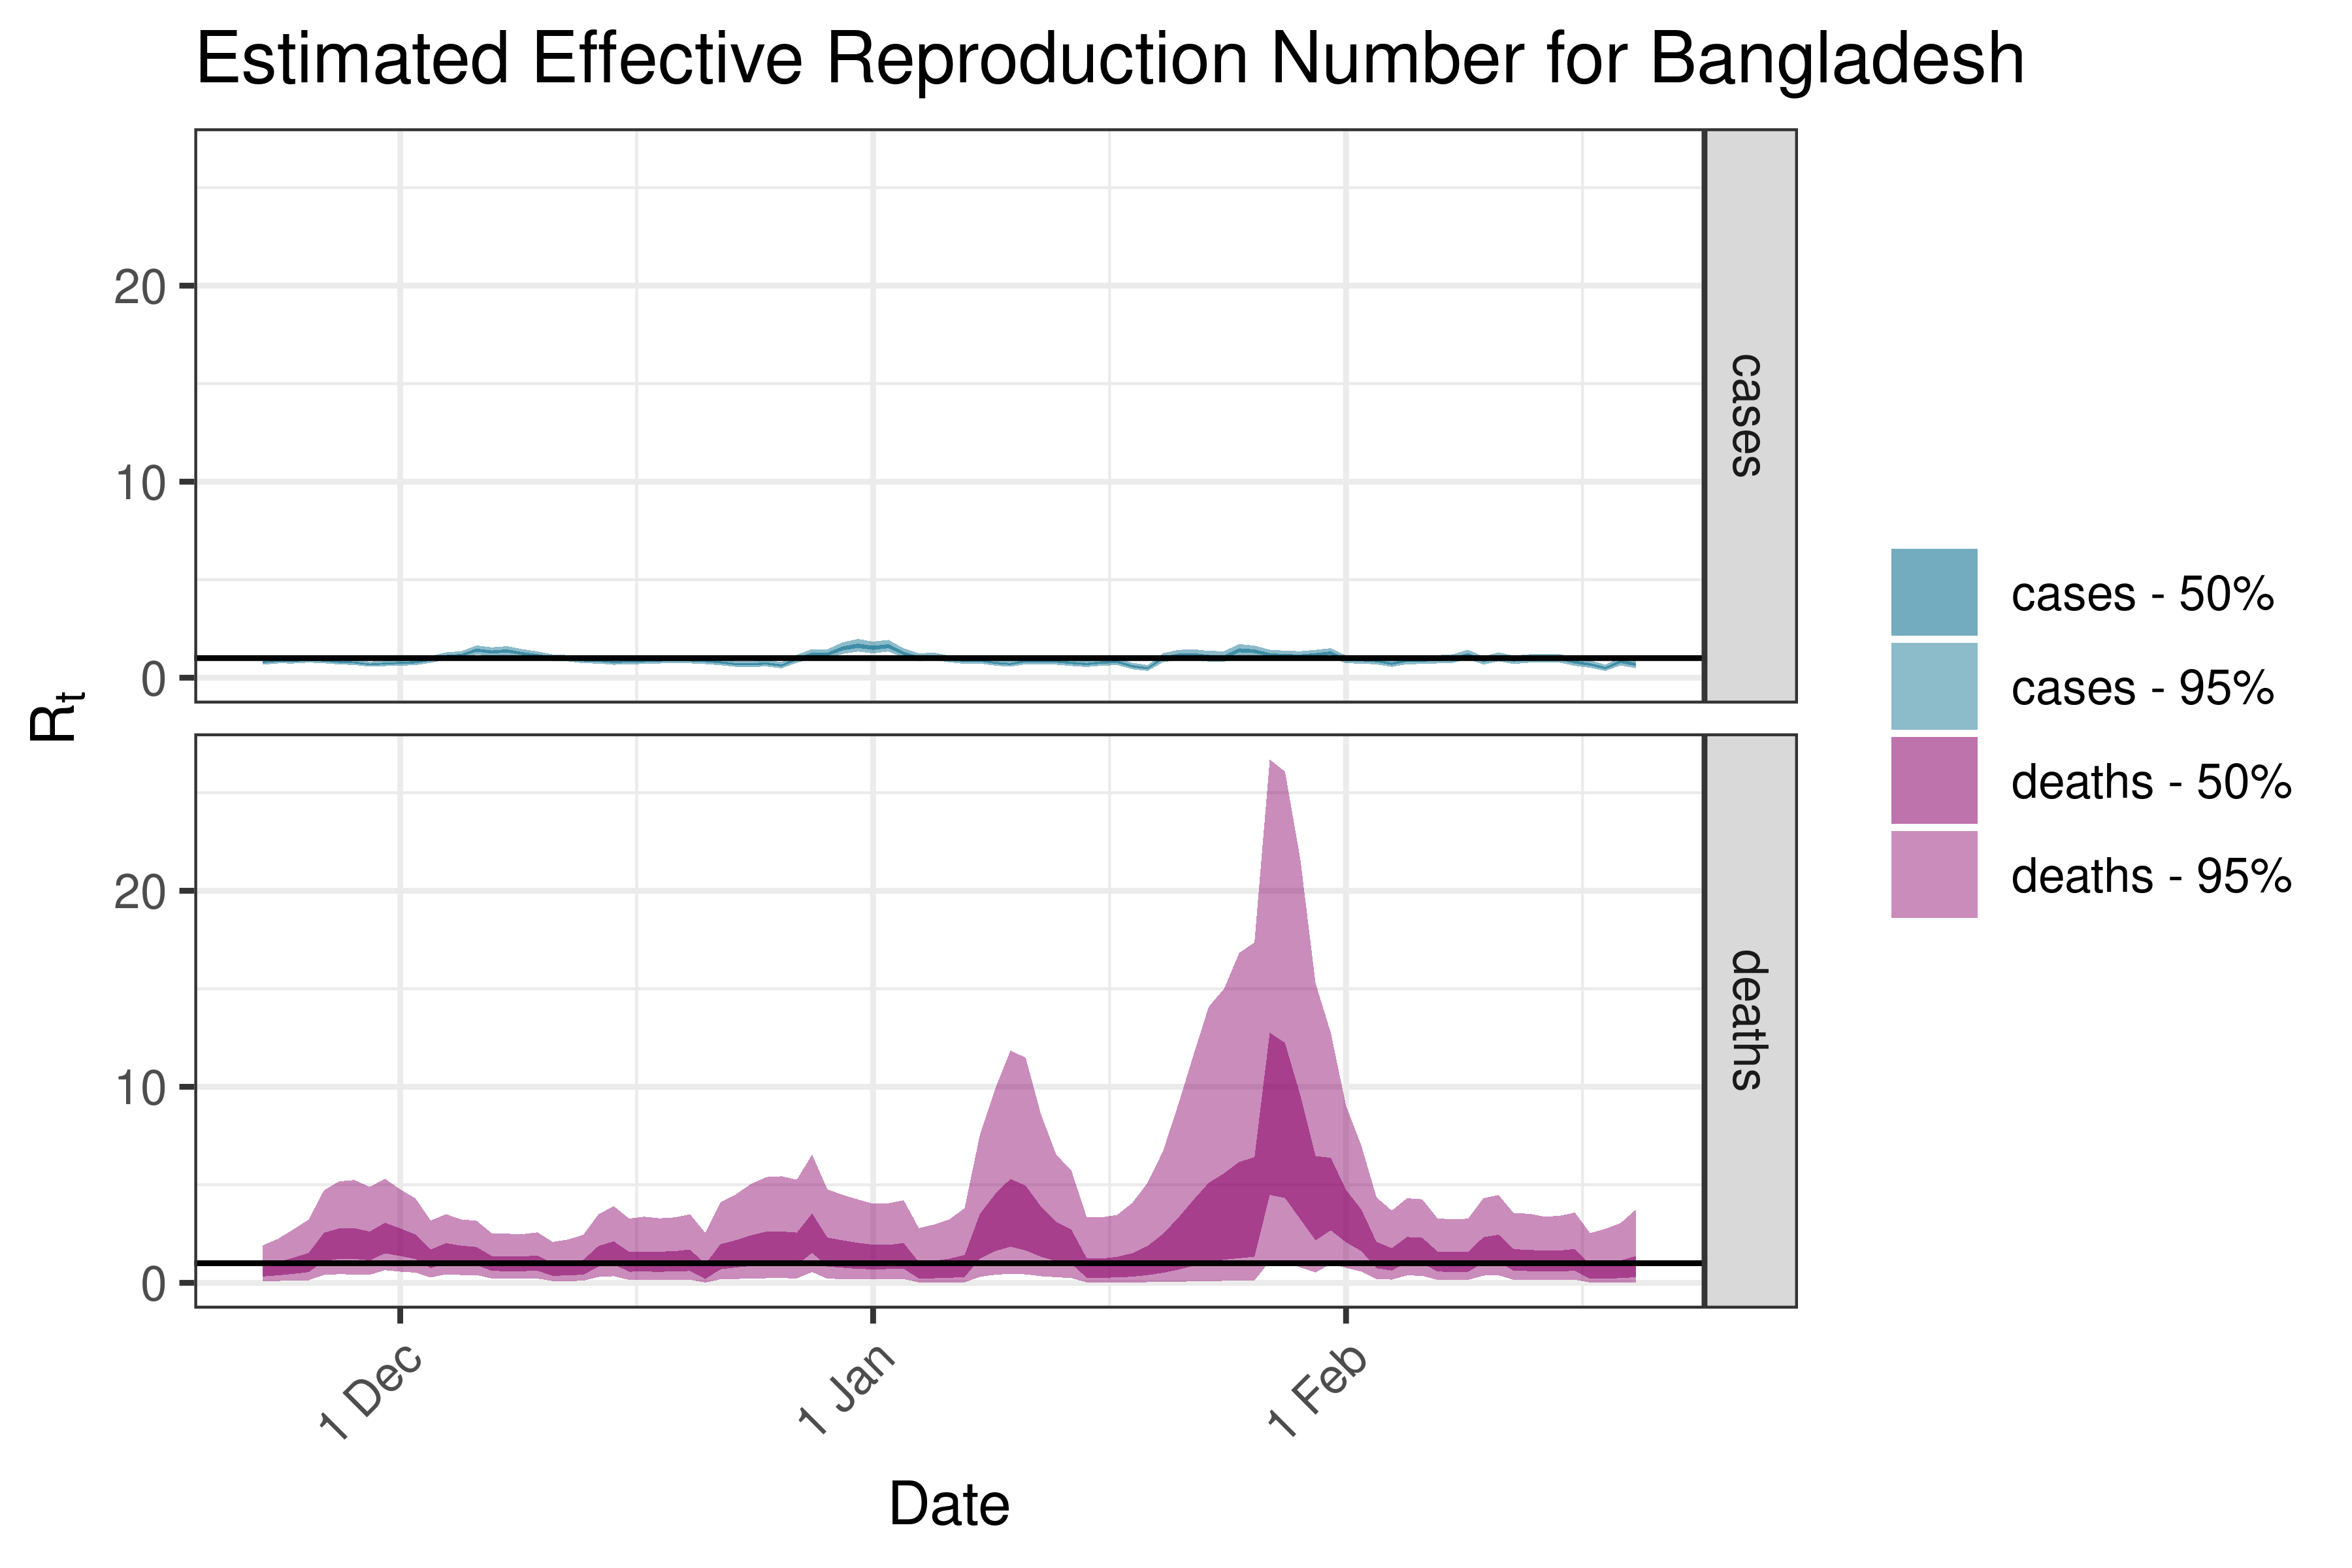
6.5.2.5 Bangladesh
6.5.2.6 Cambodia

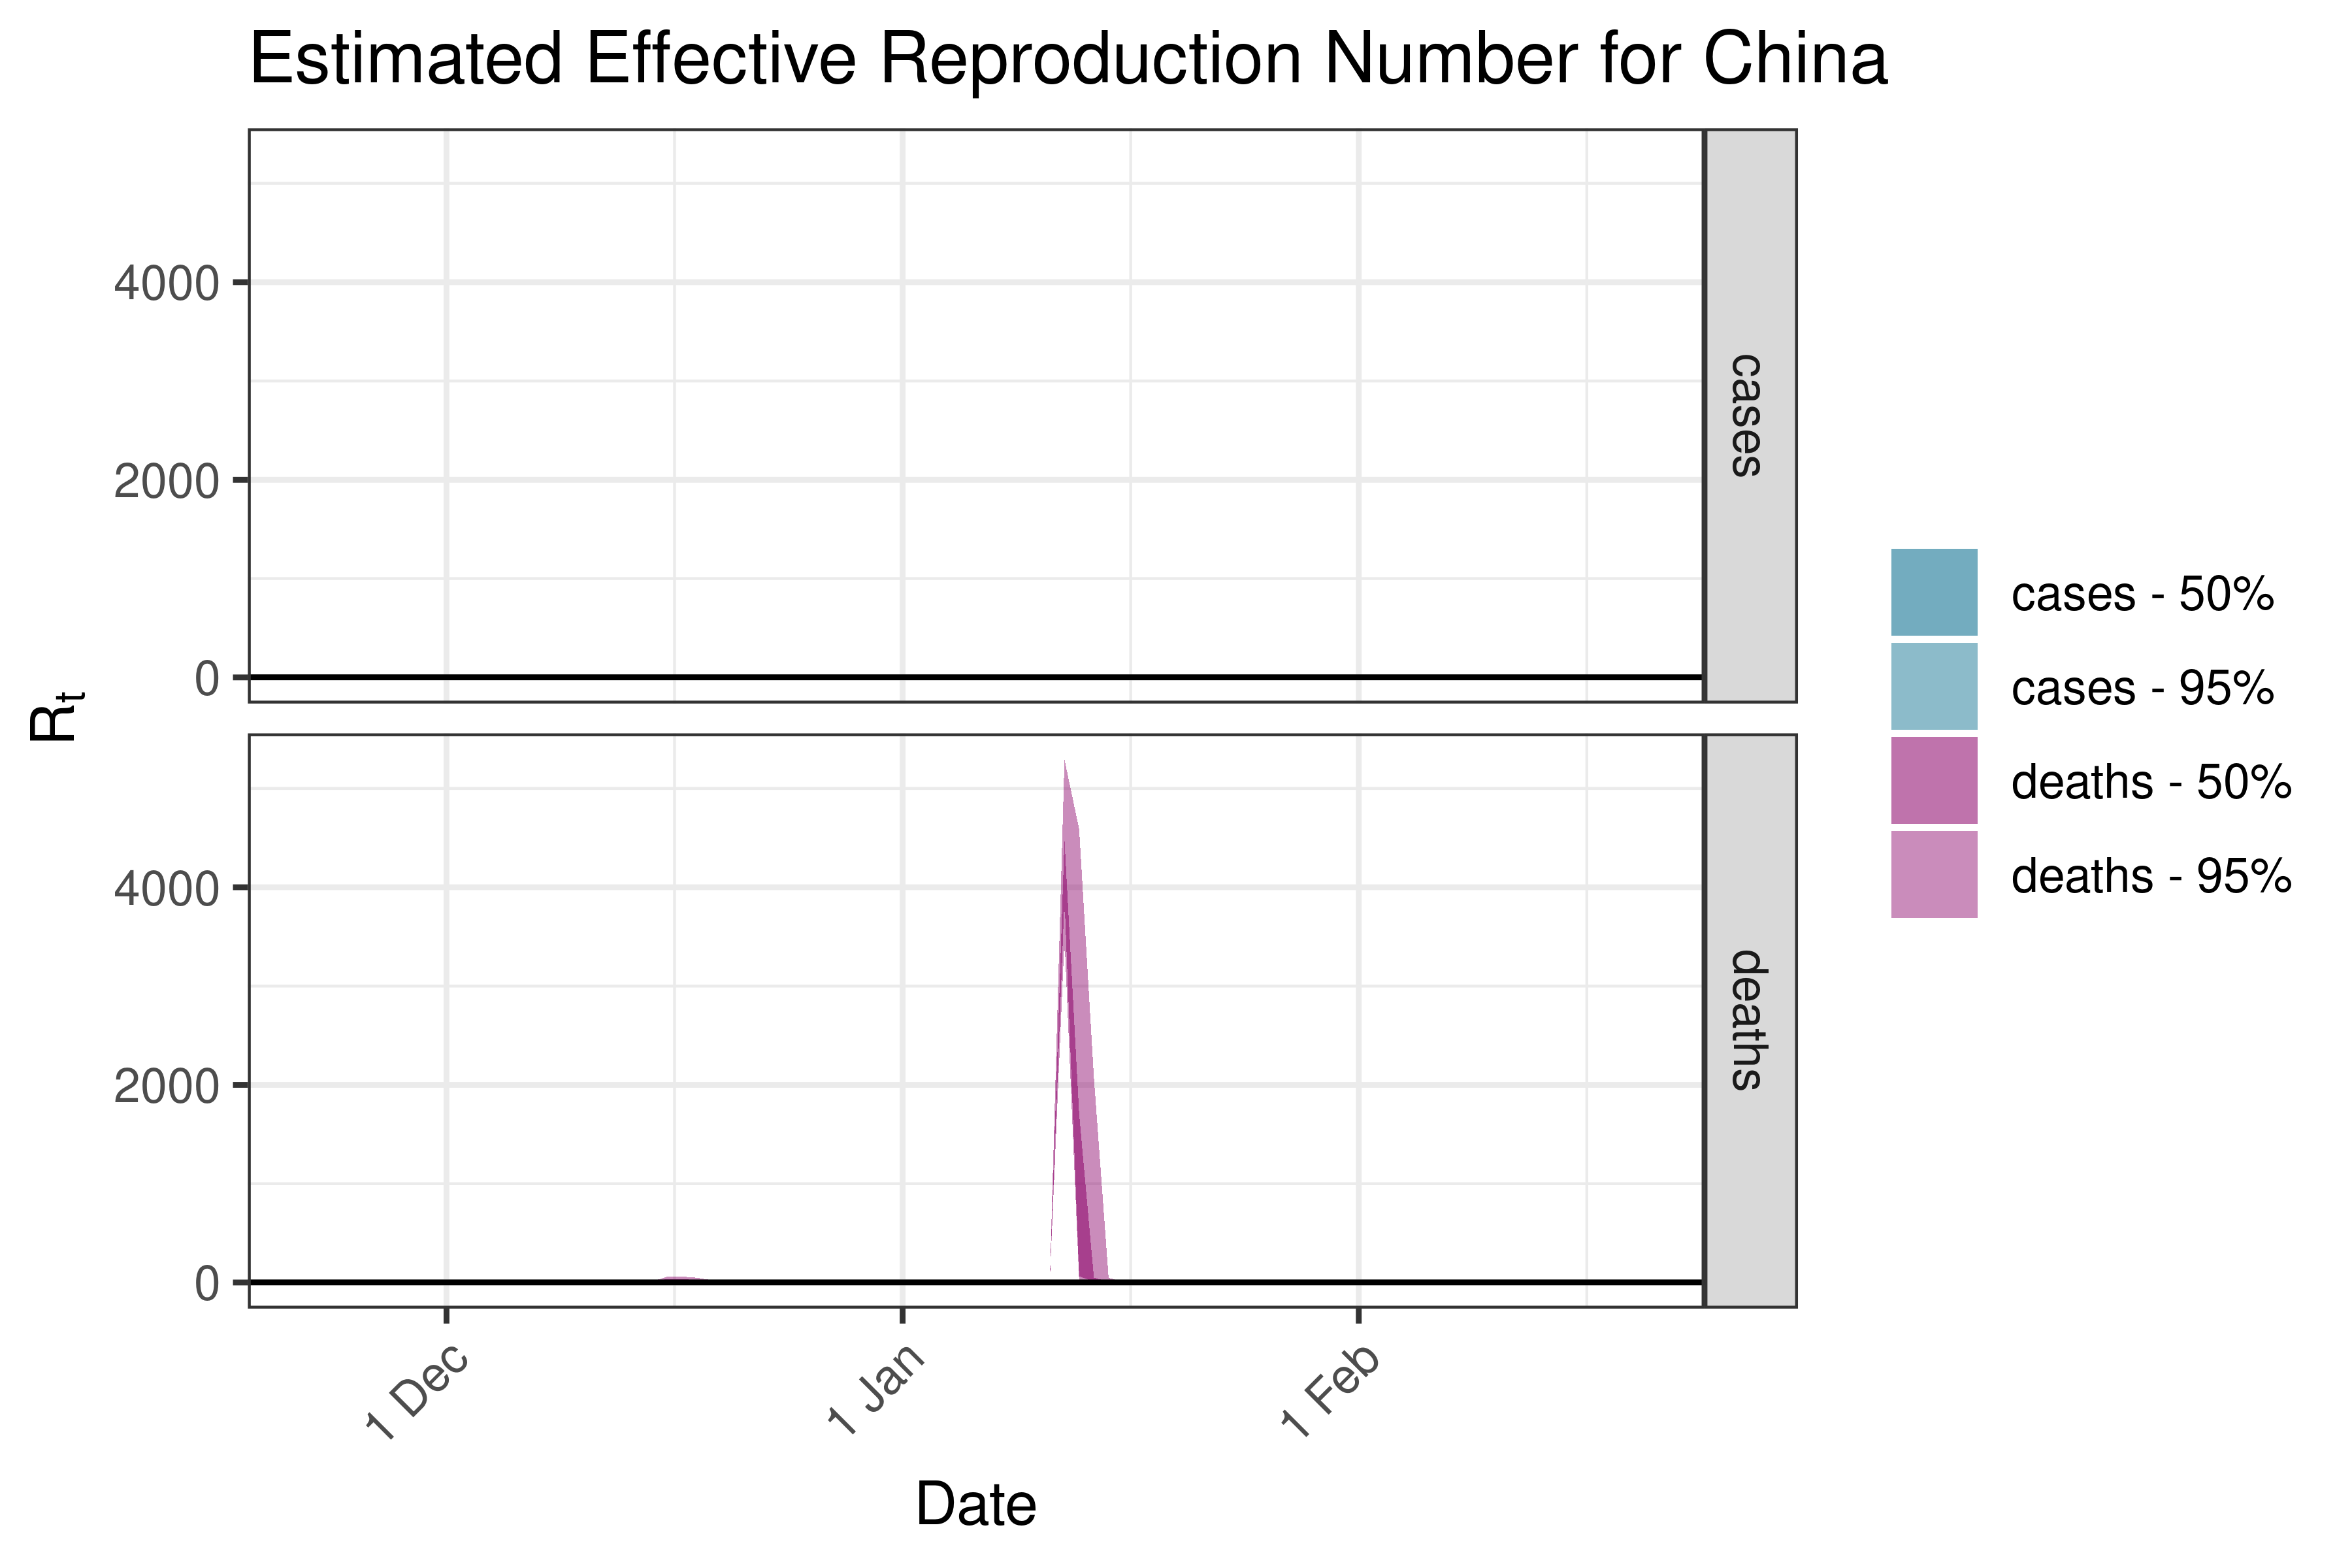
6.5.2.7 China
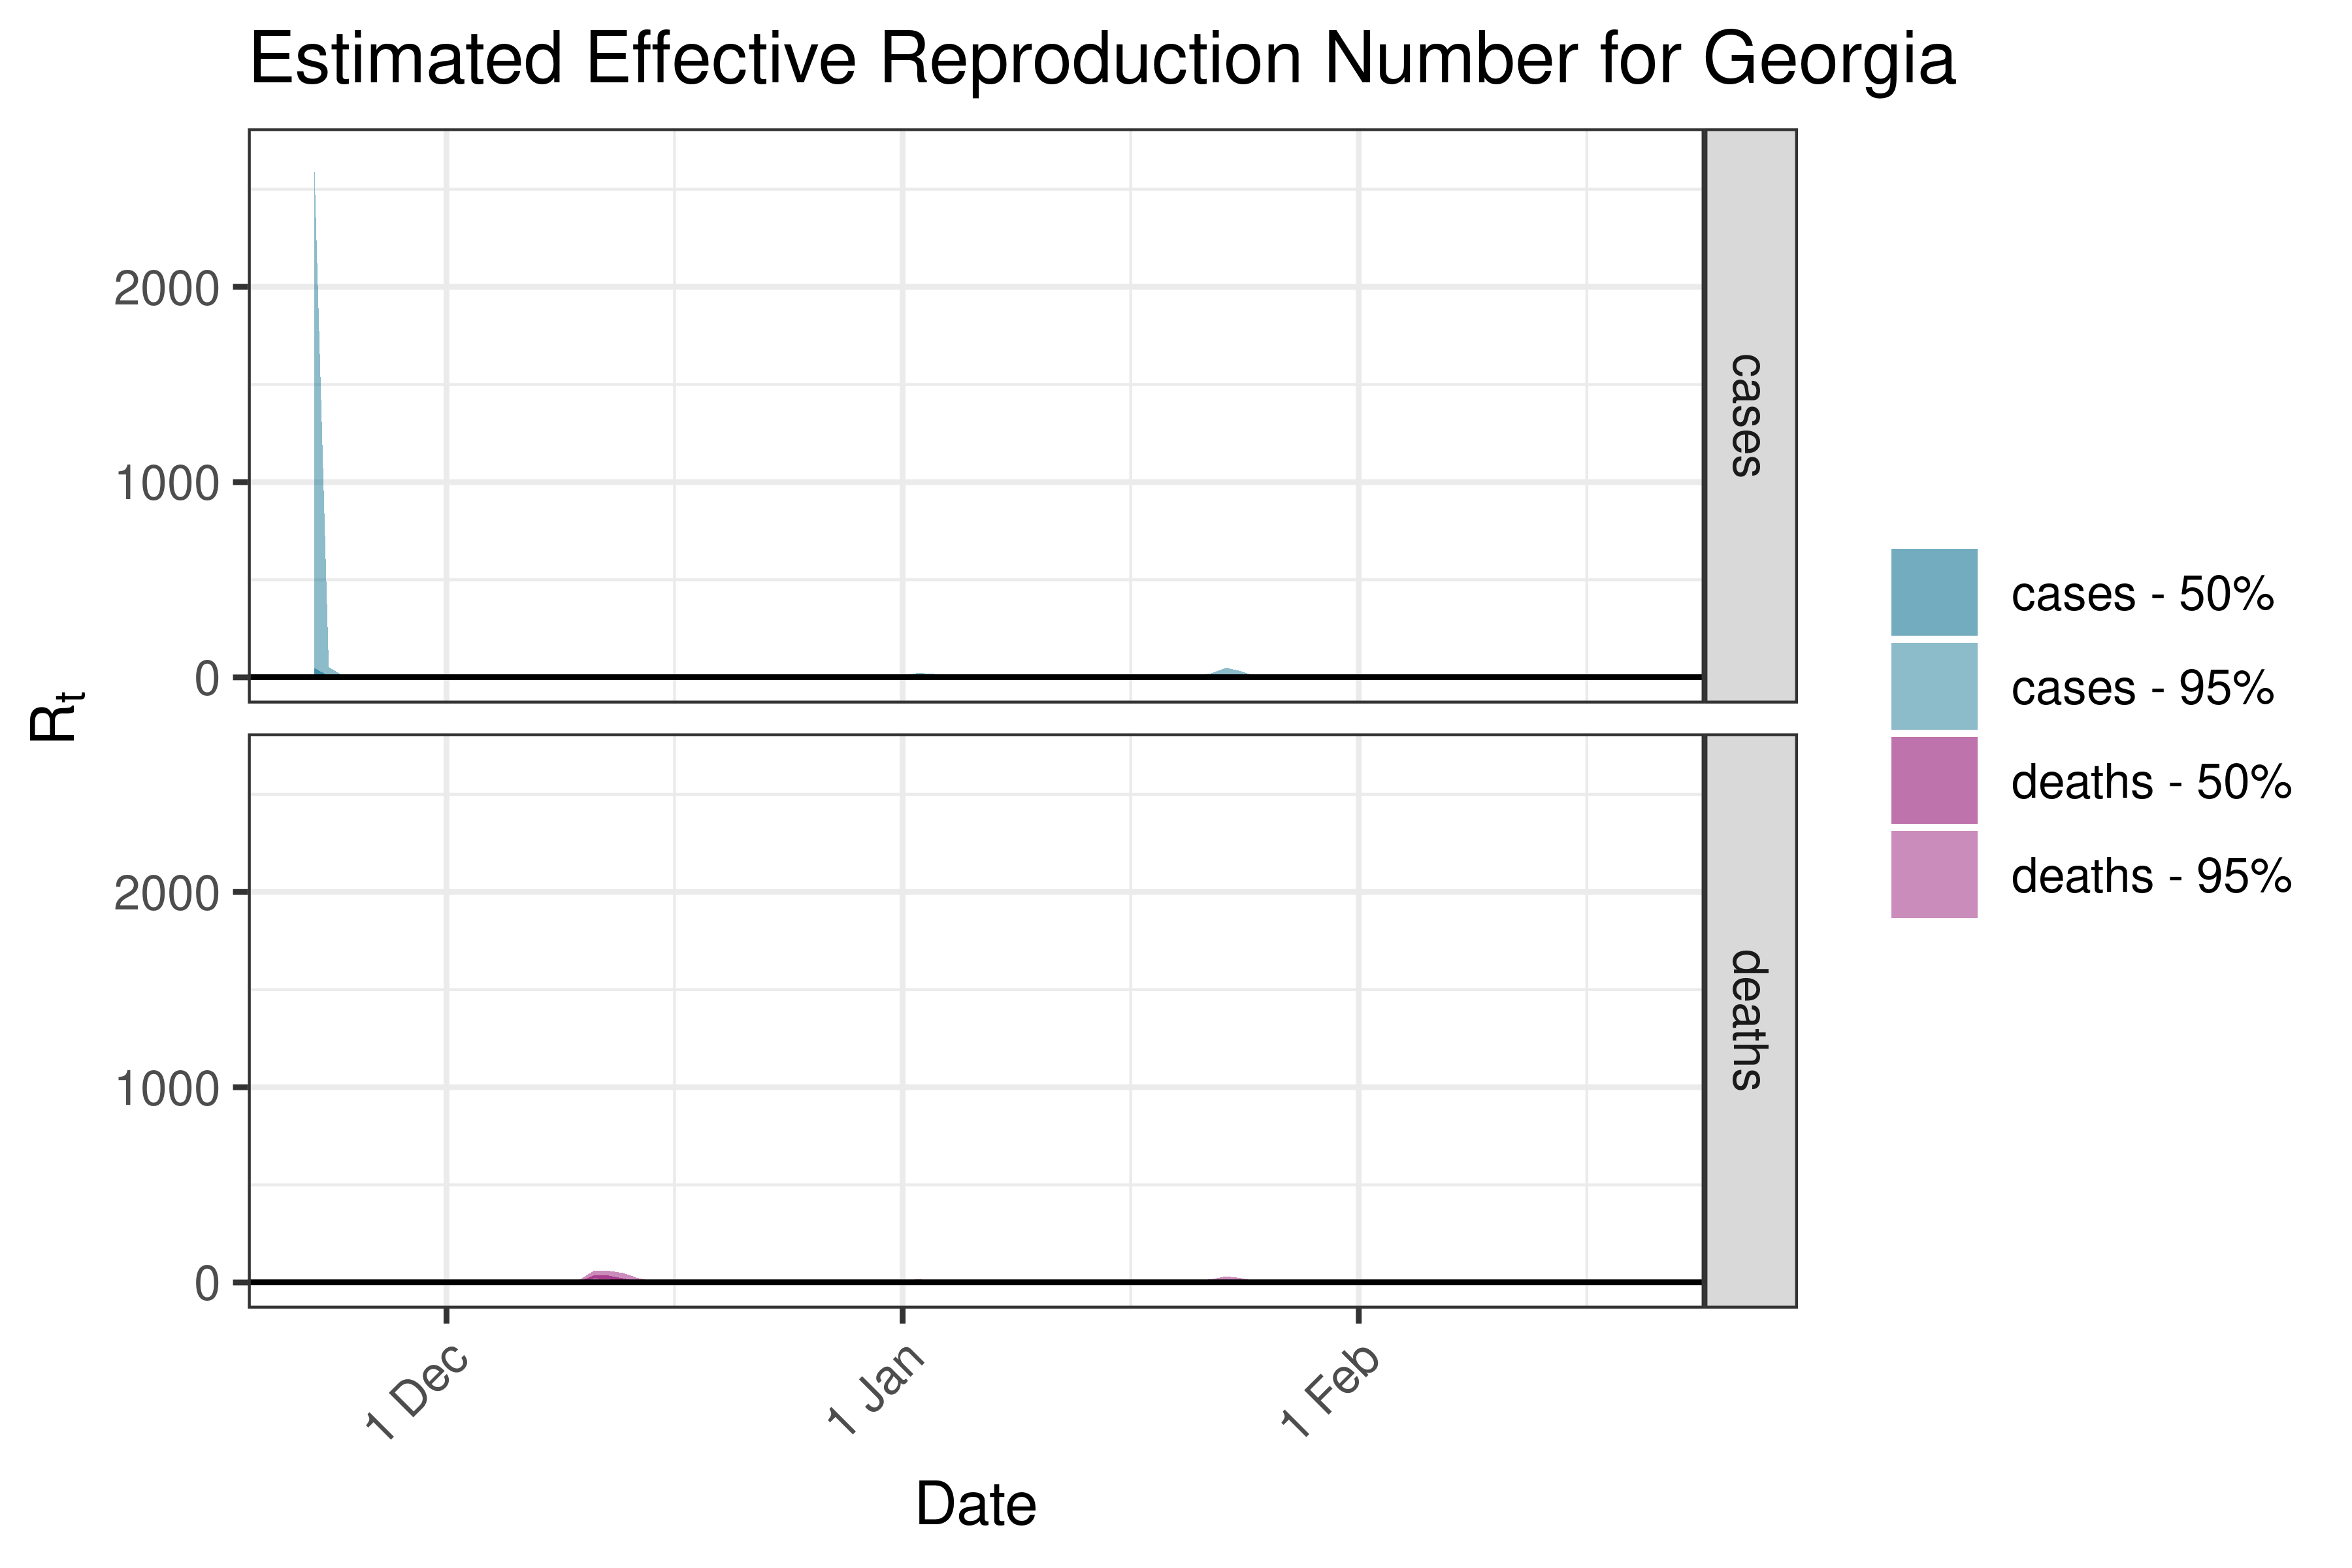
6.5.2.8 Georgia
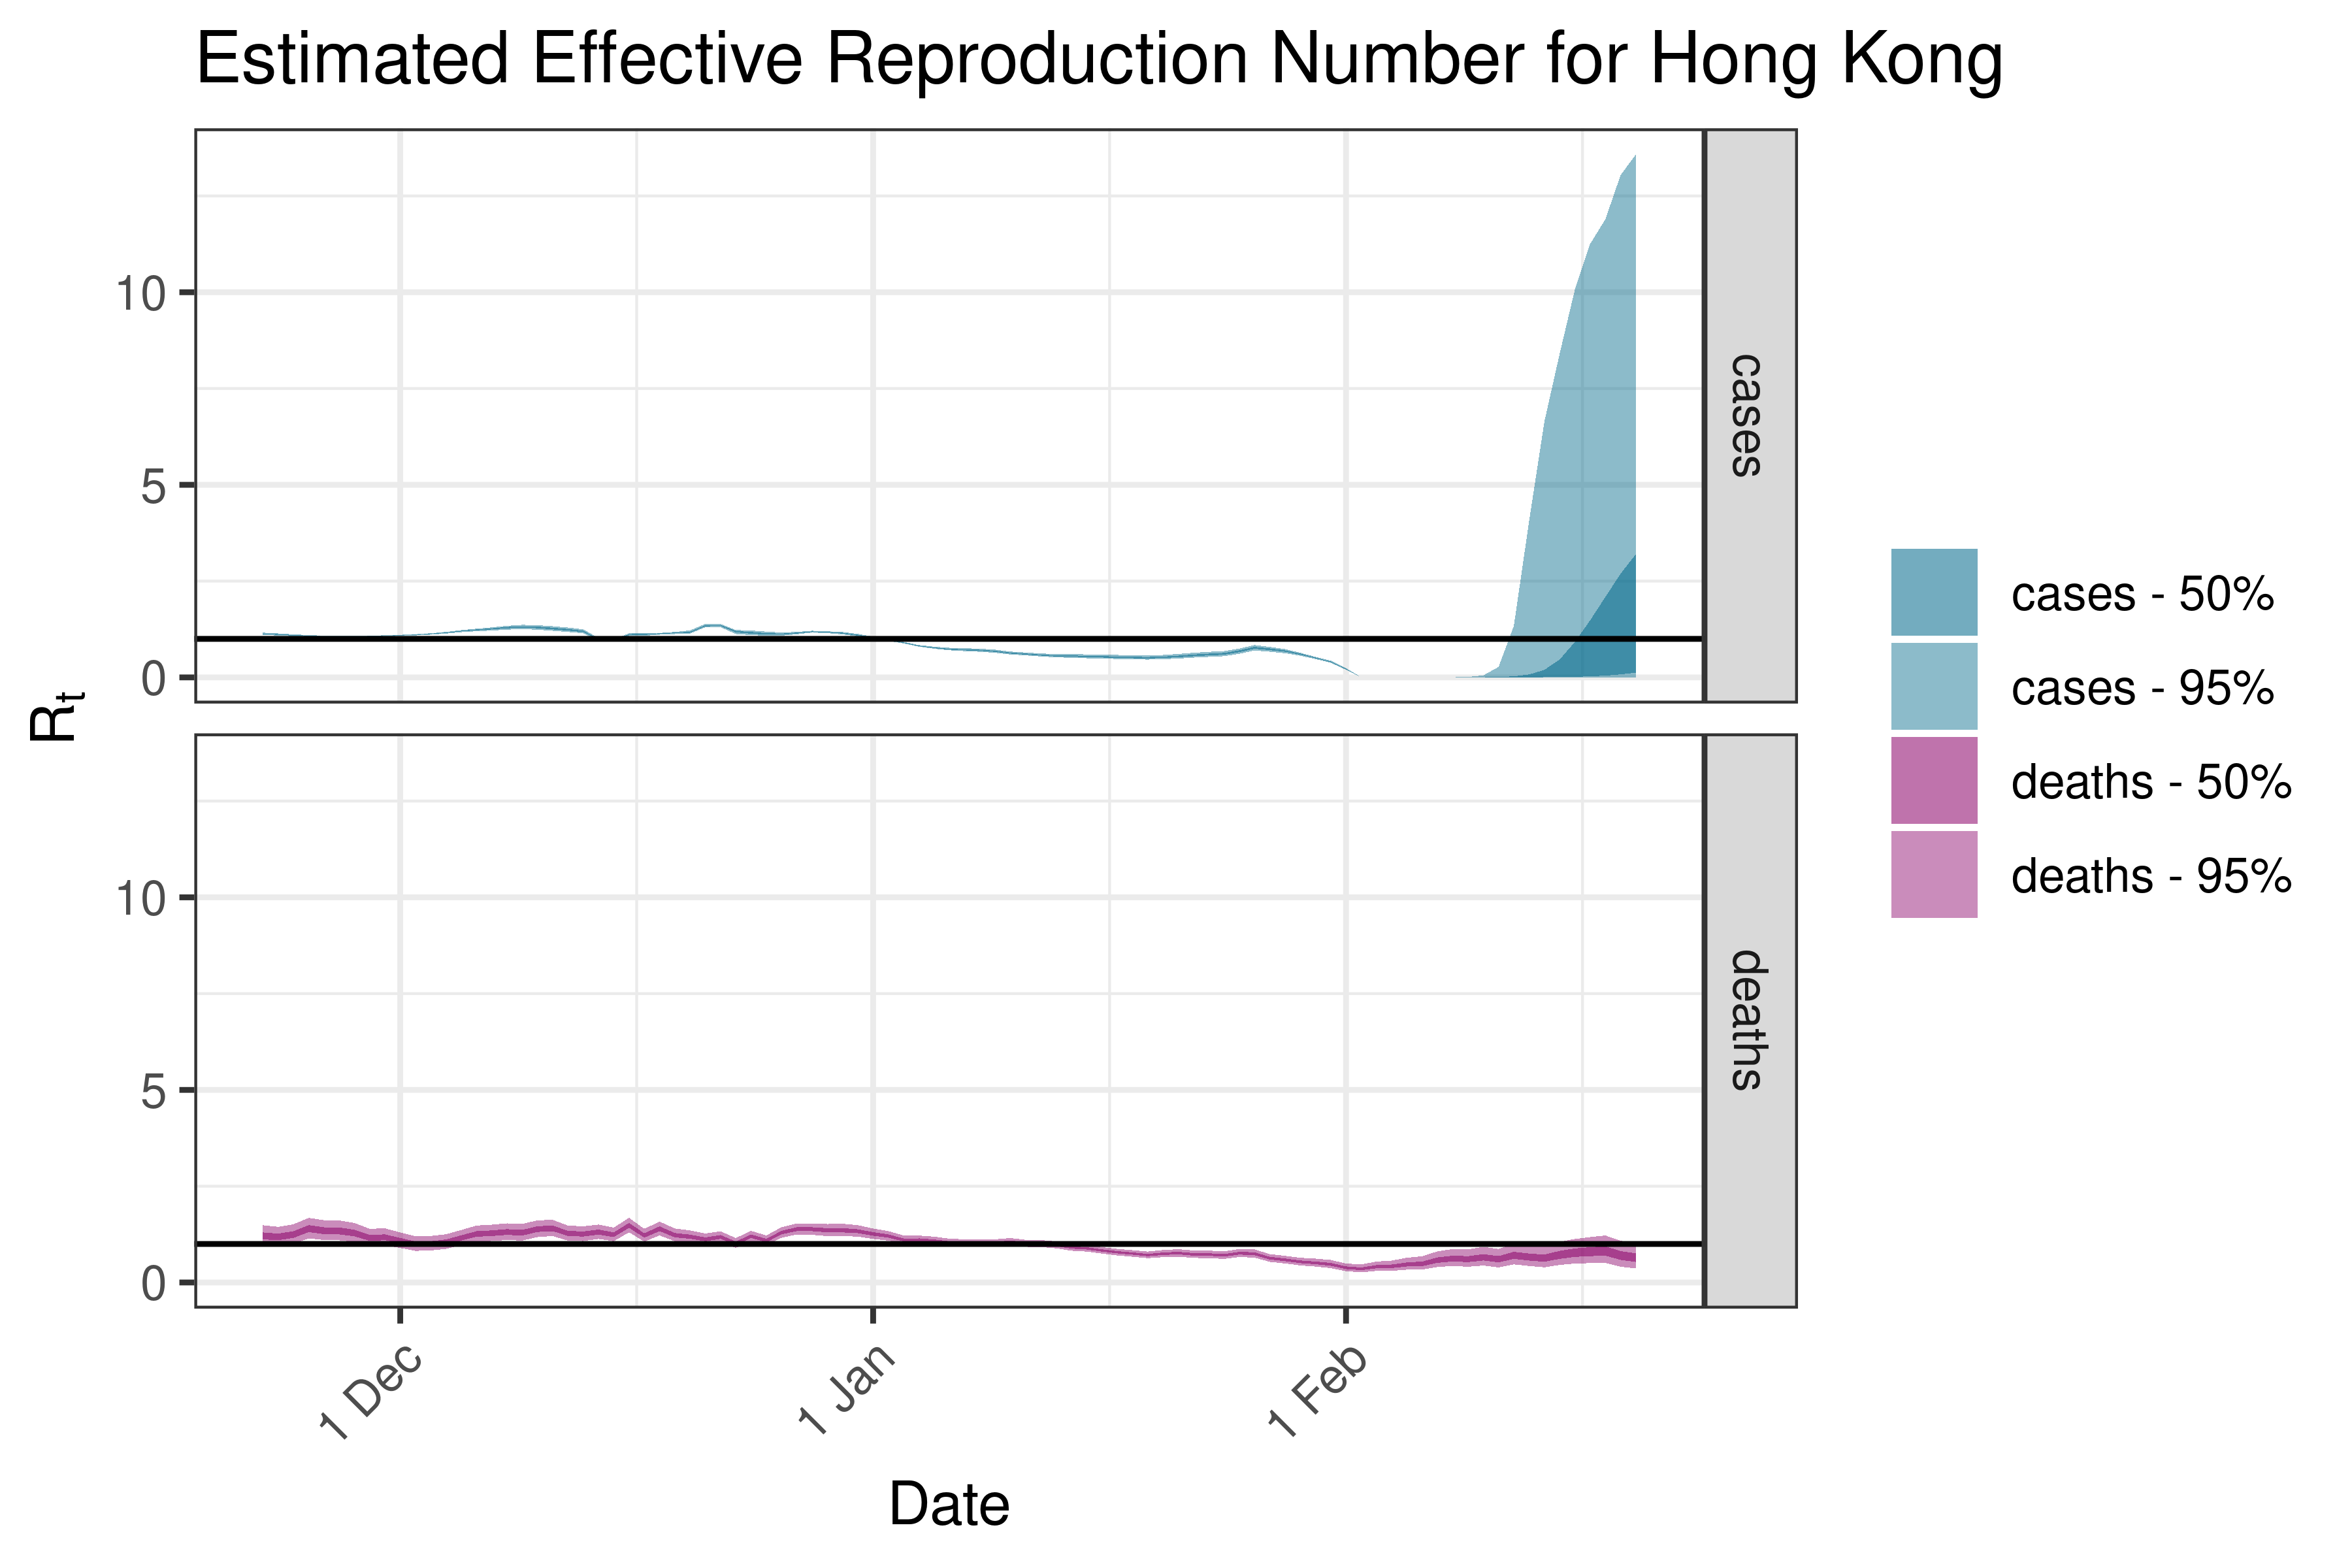
6.5.2.9 Hong Kong
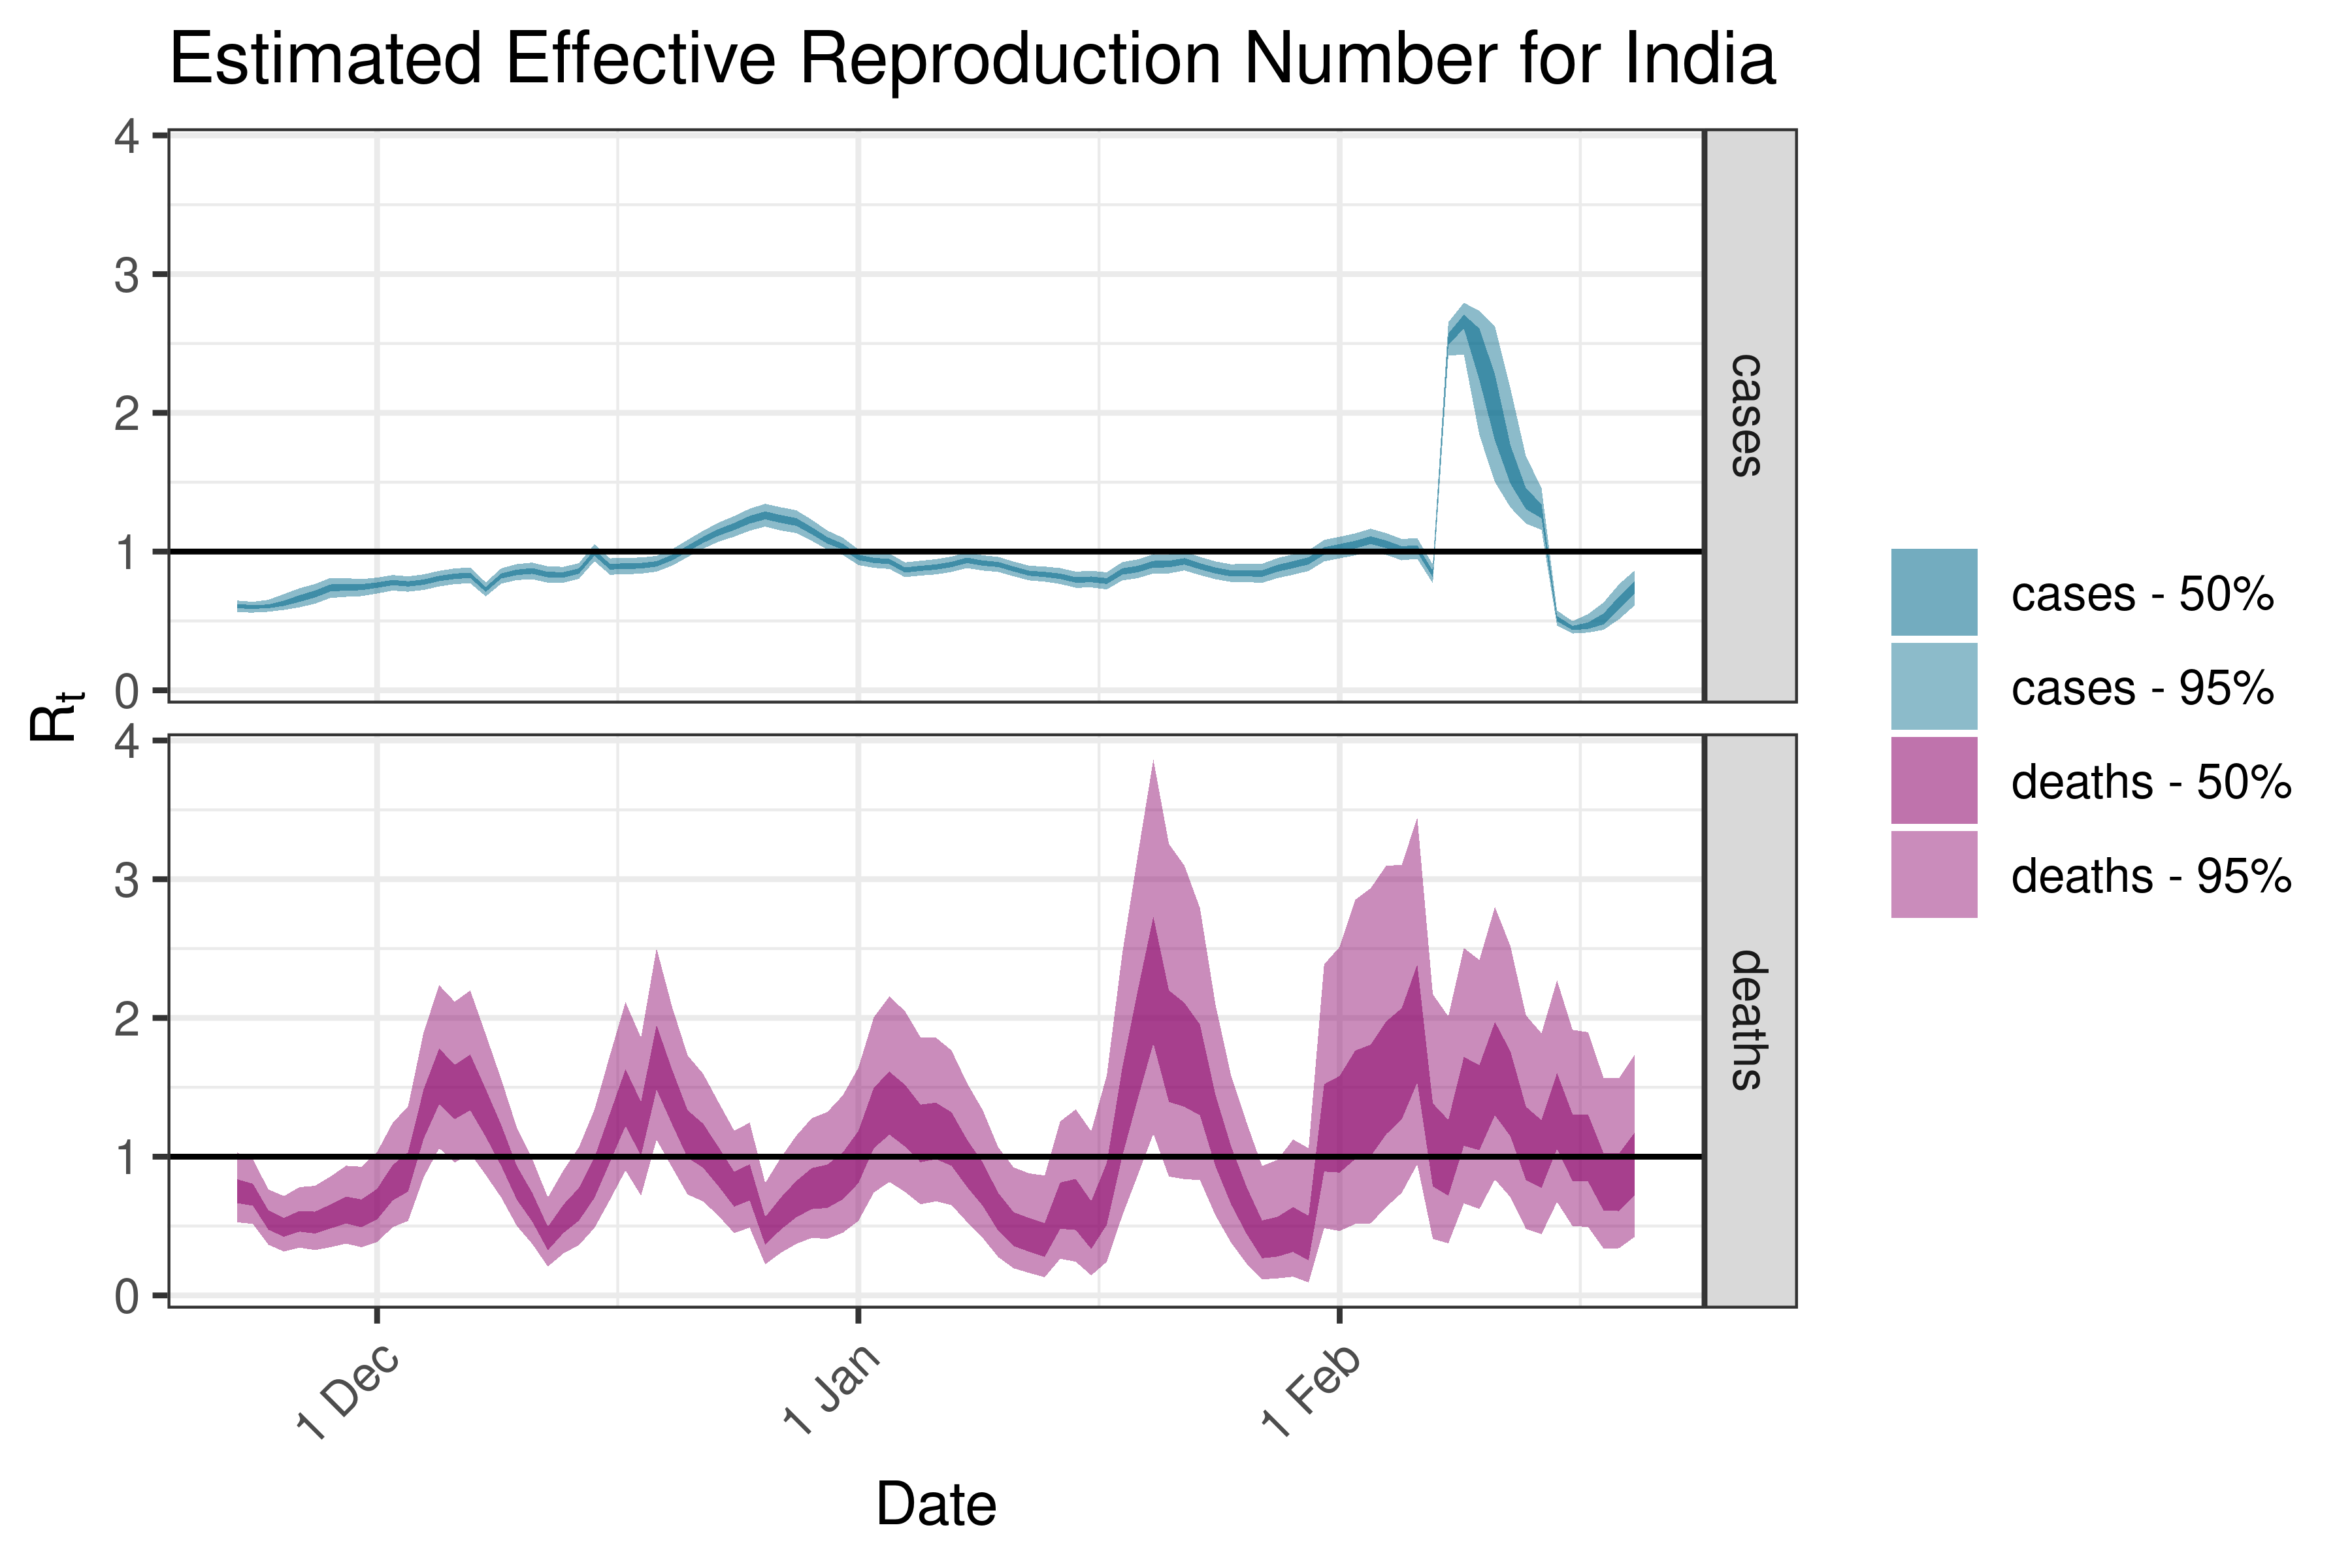
6.5.2.10 India
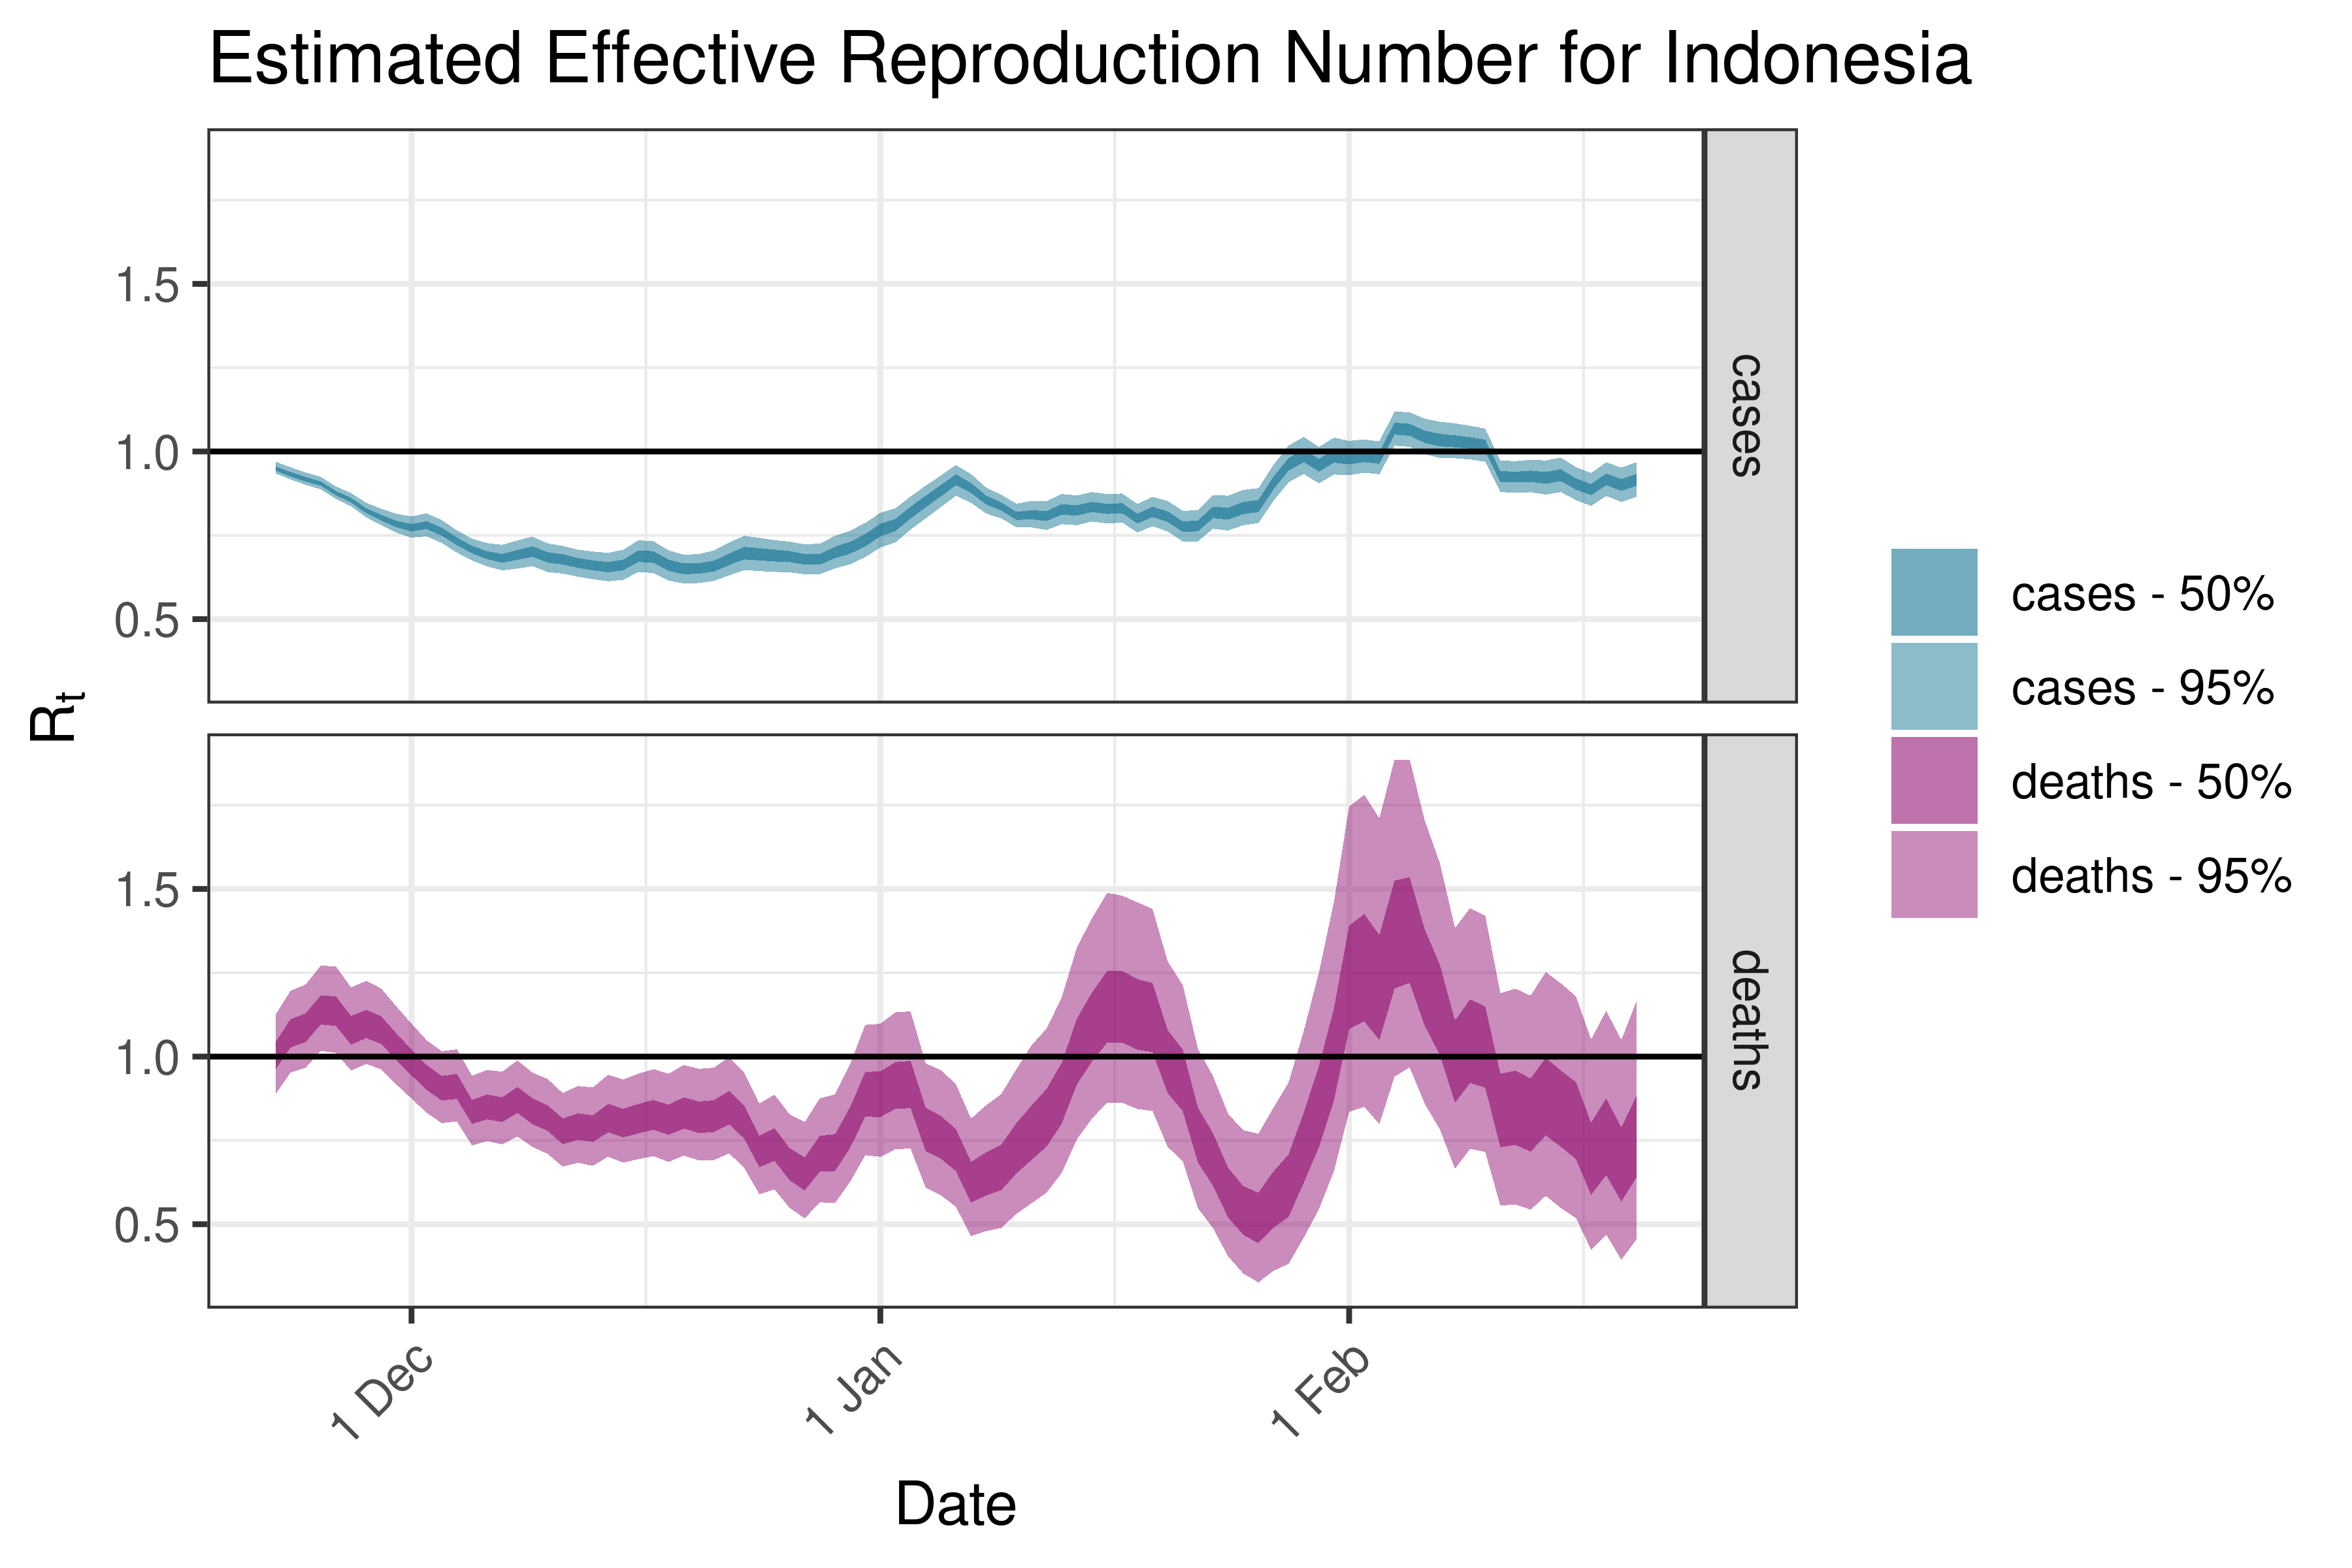
6.5.2.11 Indonesia
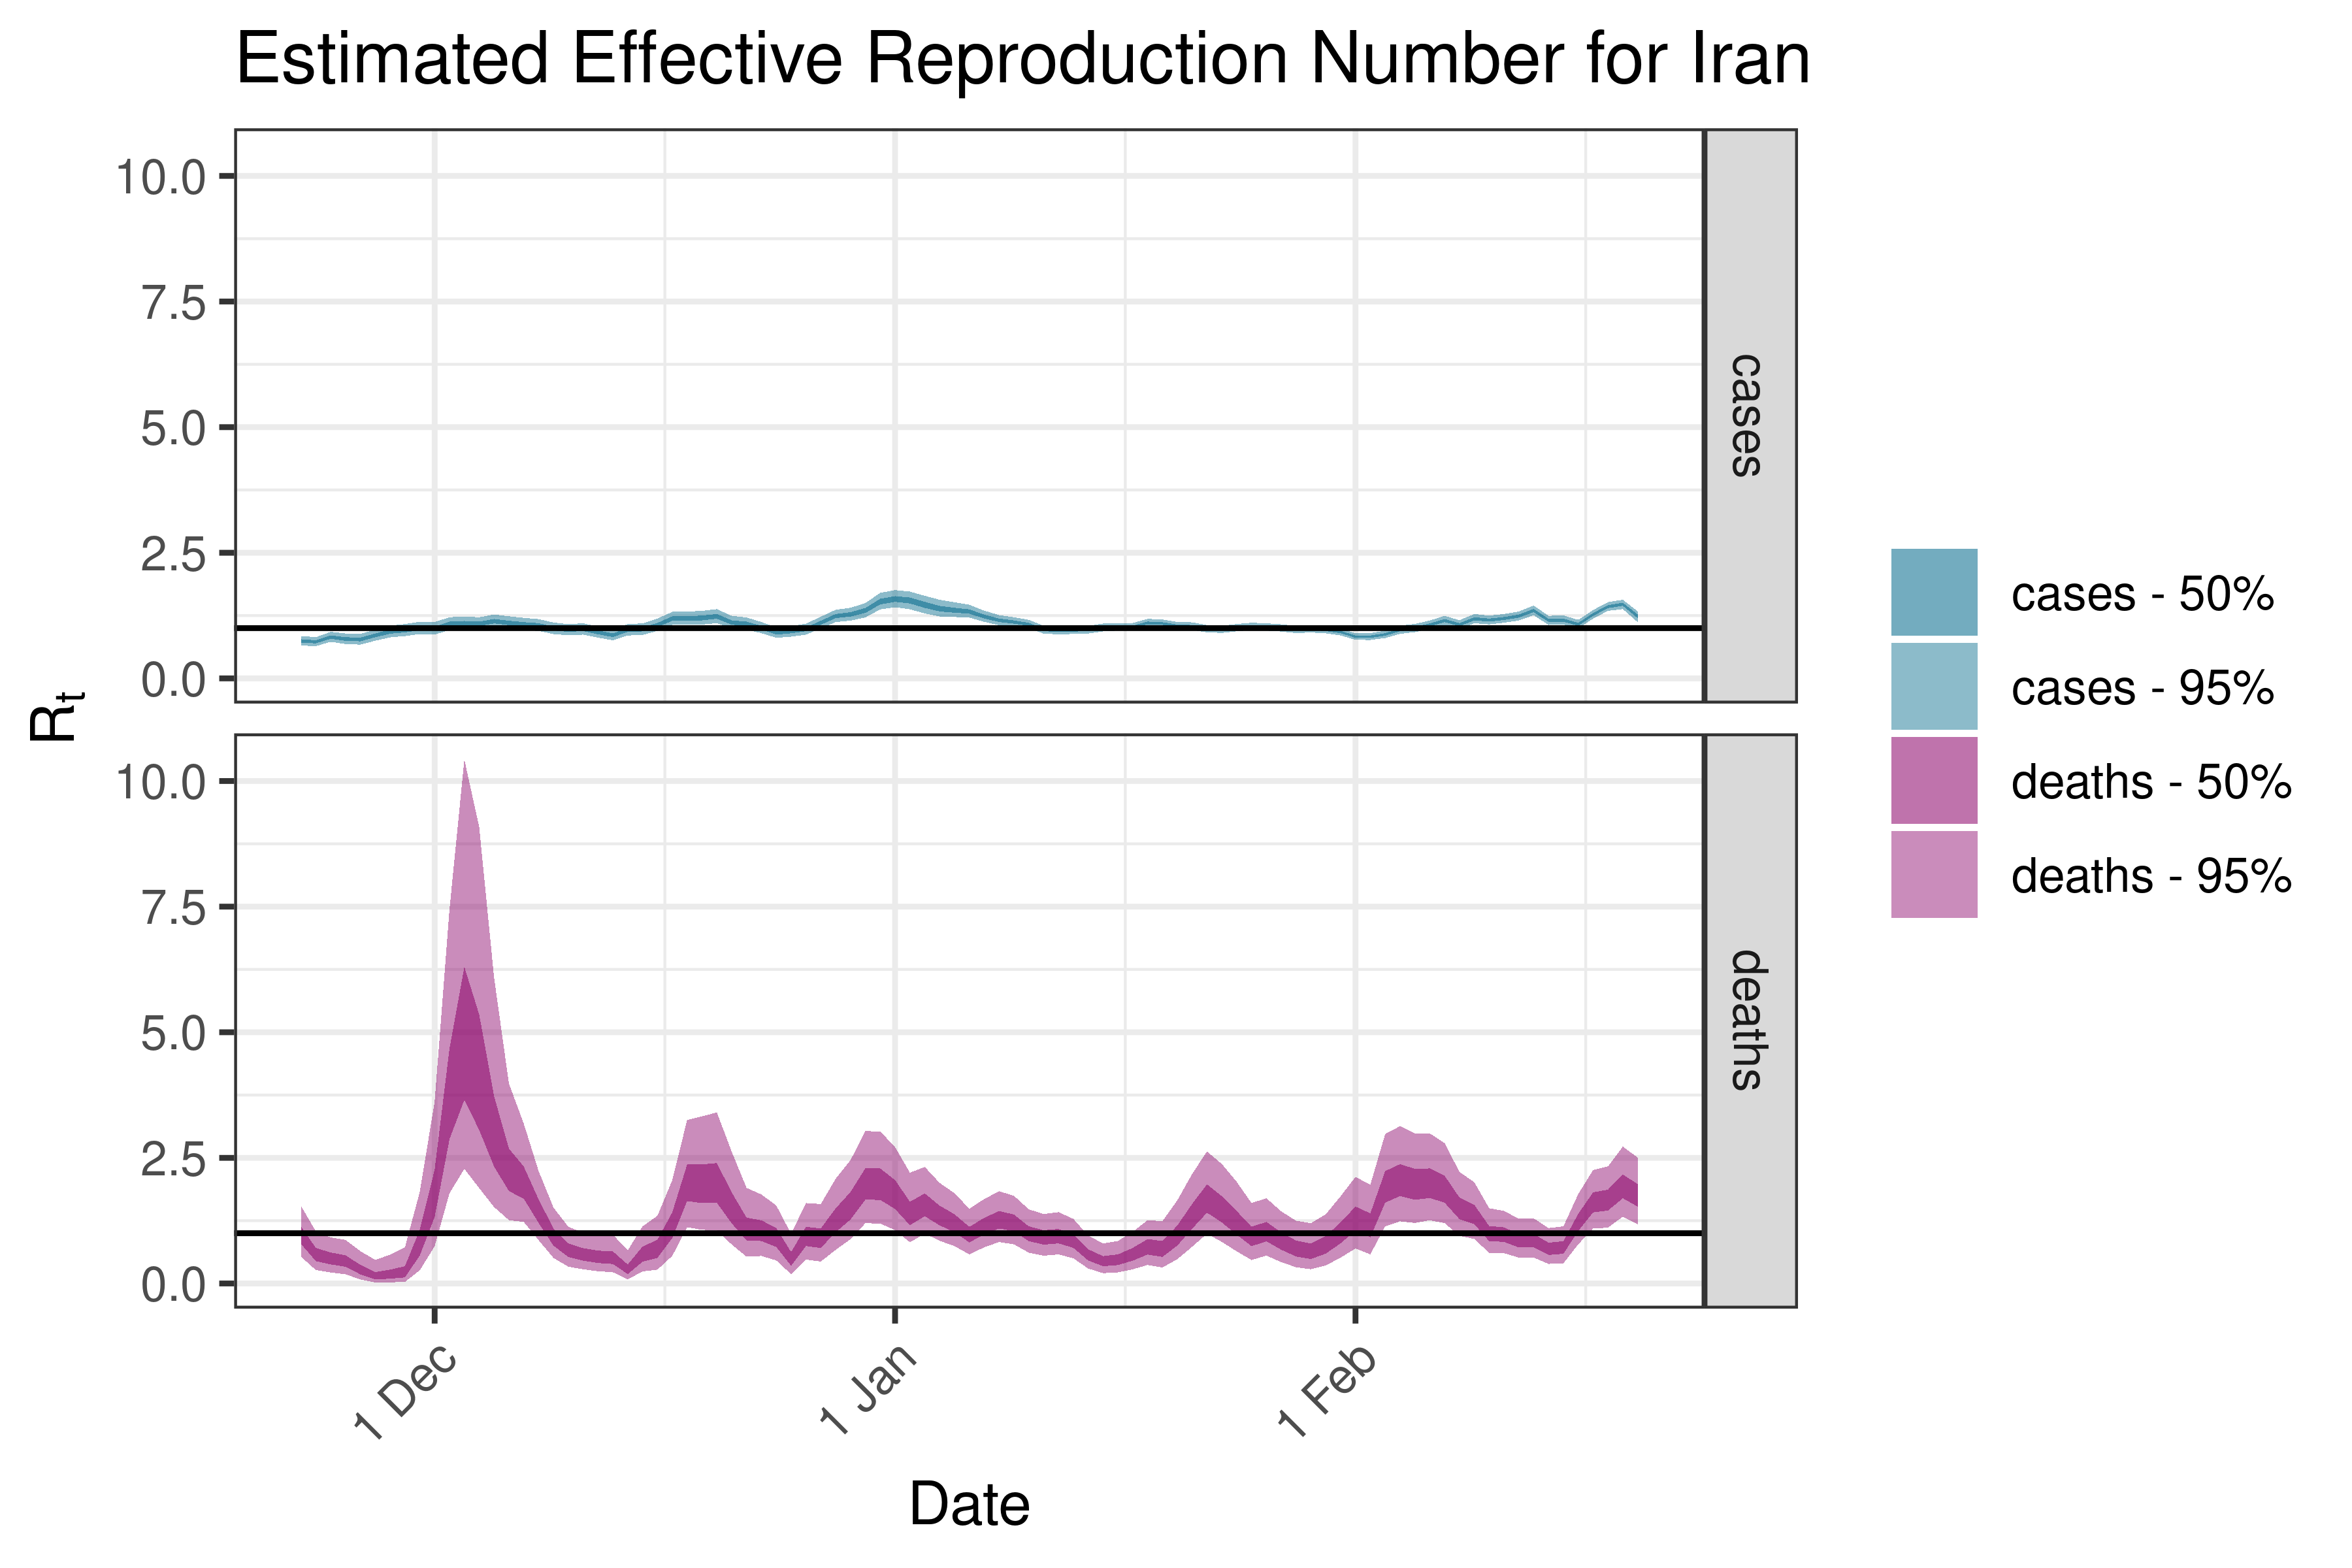
6.5.2.12 Iran
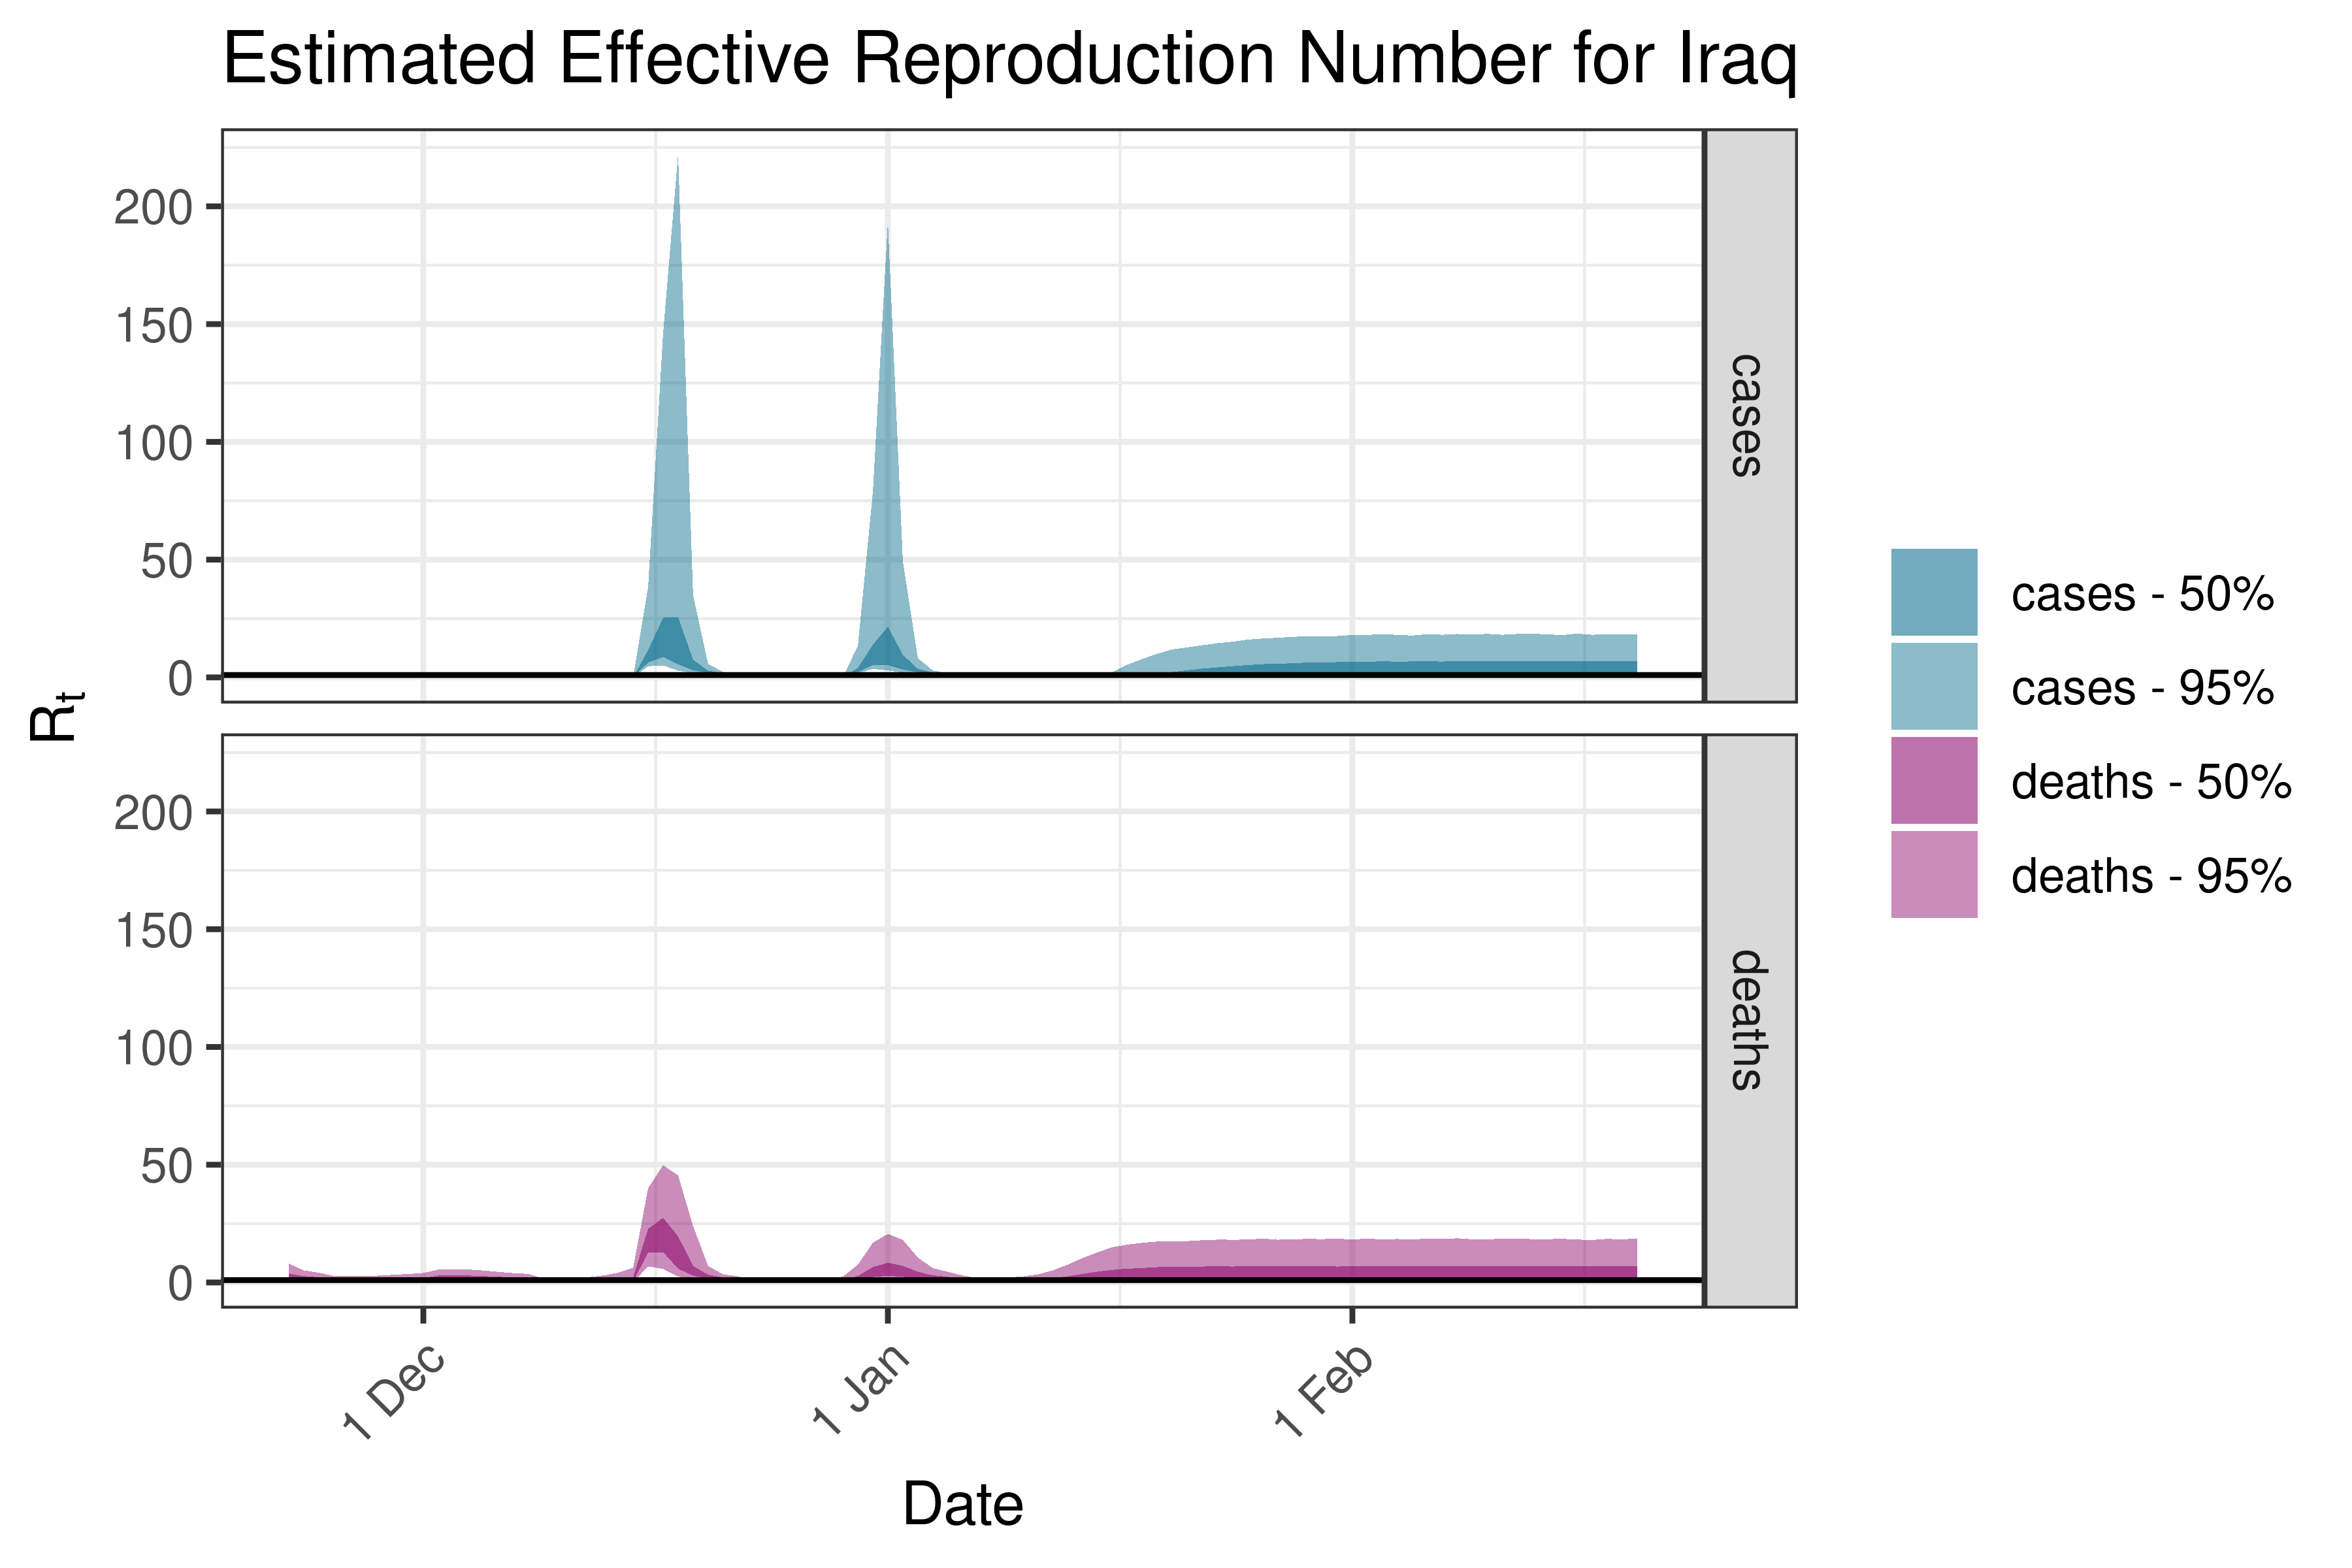
6.5.2.13 Iraq
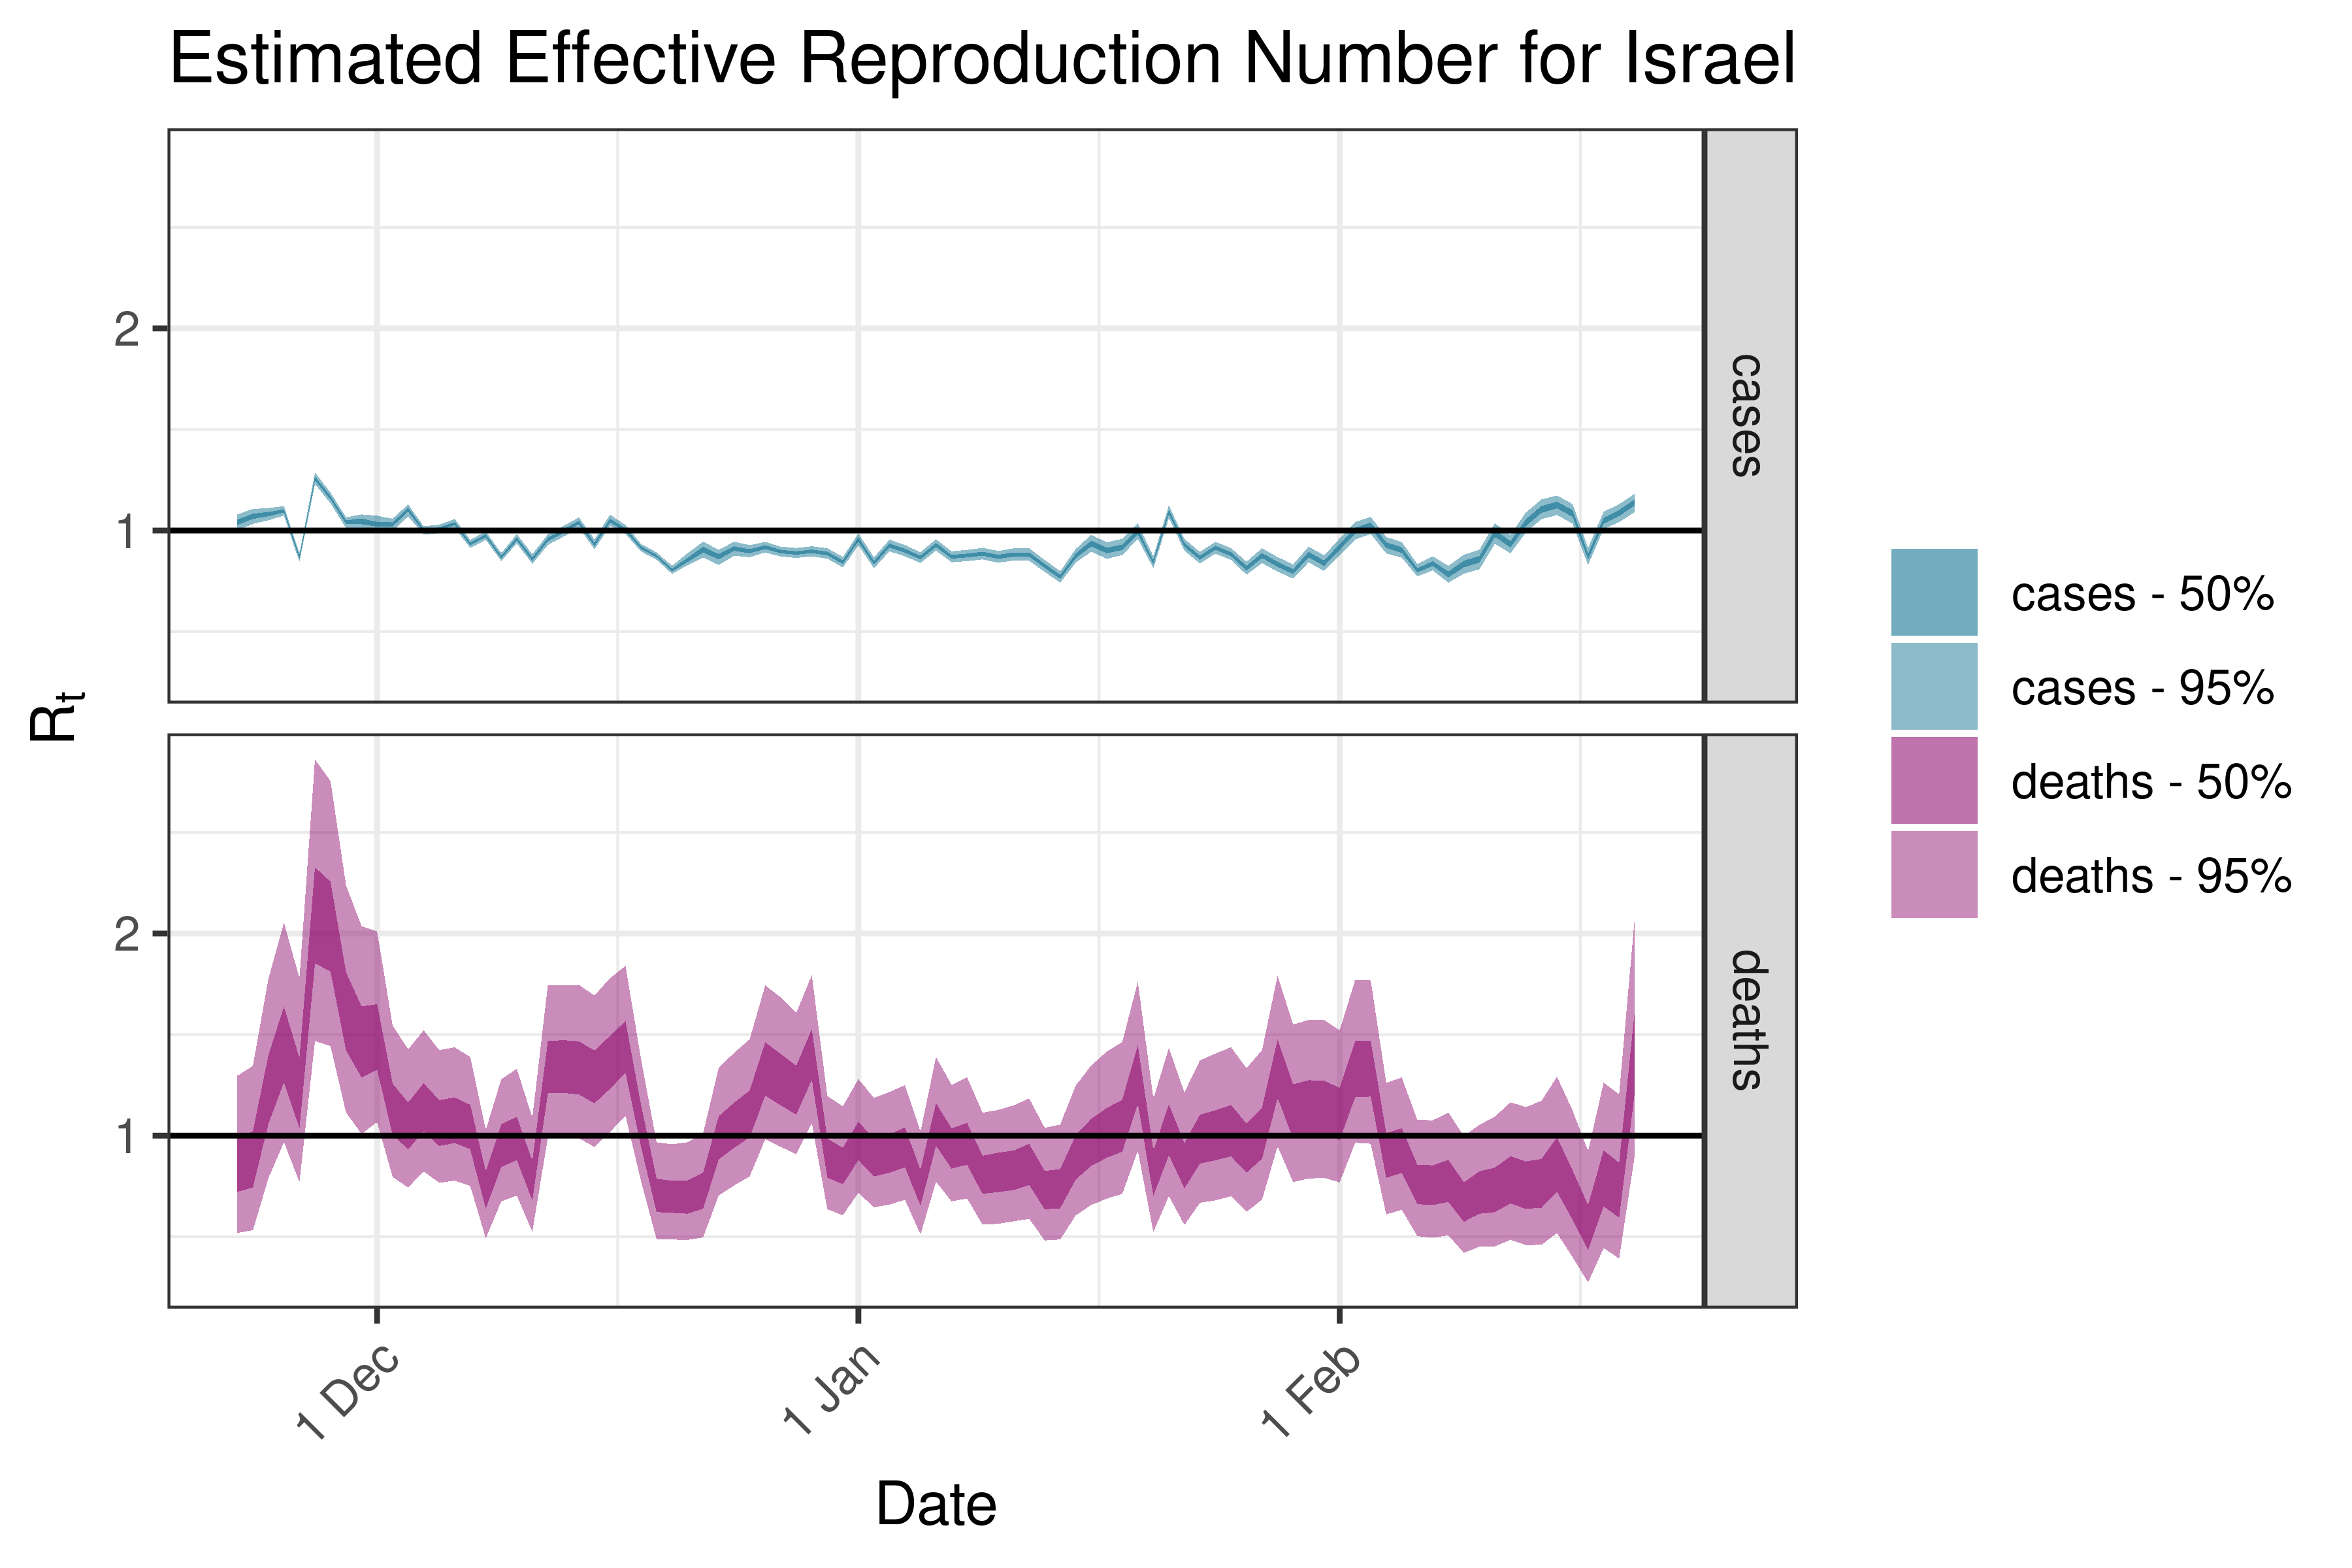
6.5.2.14 Israel
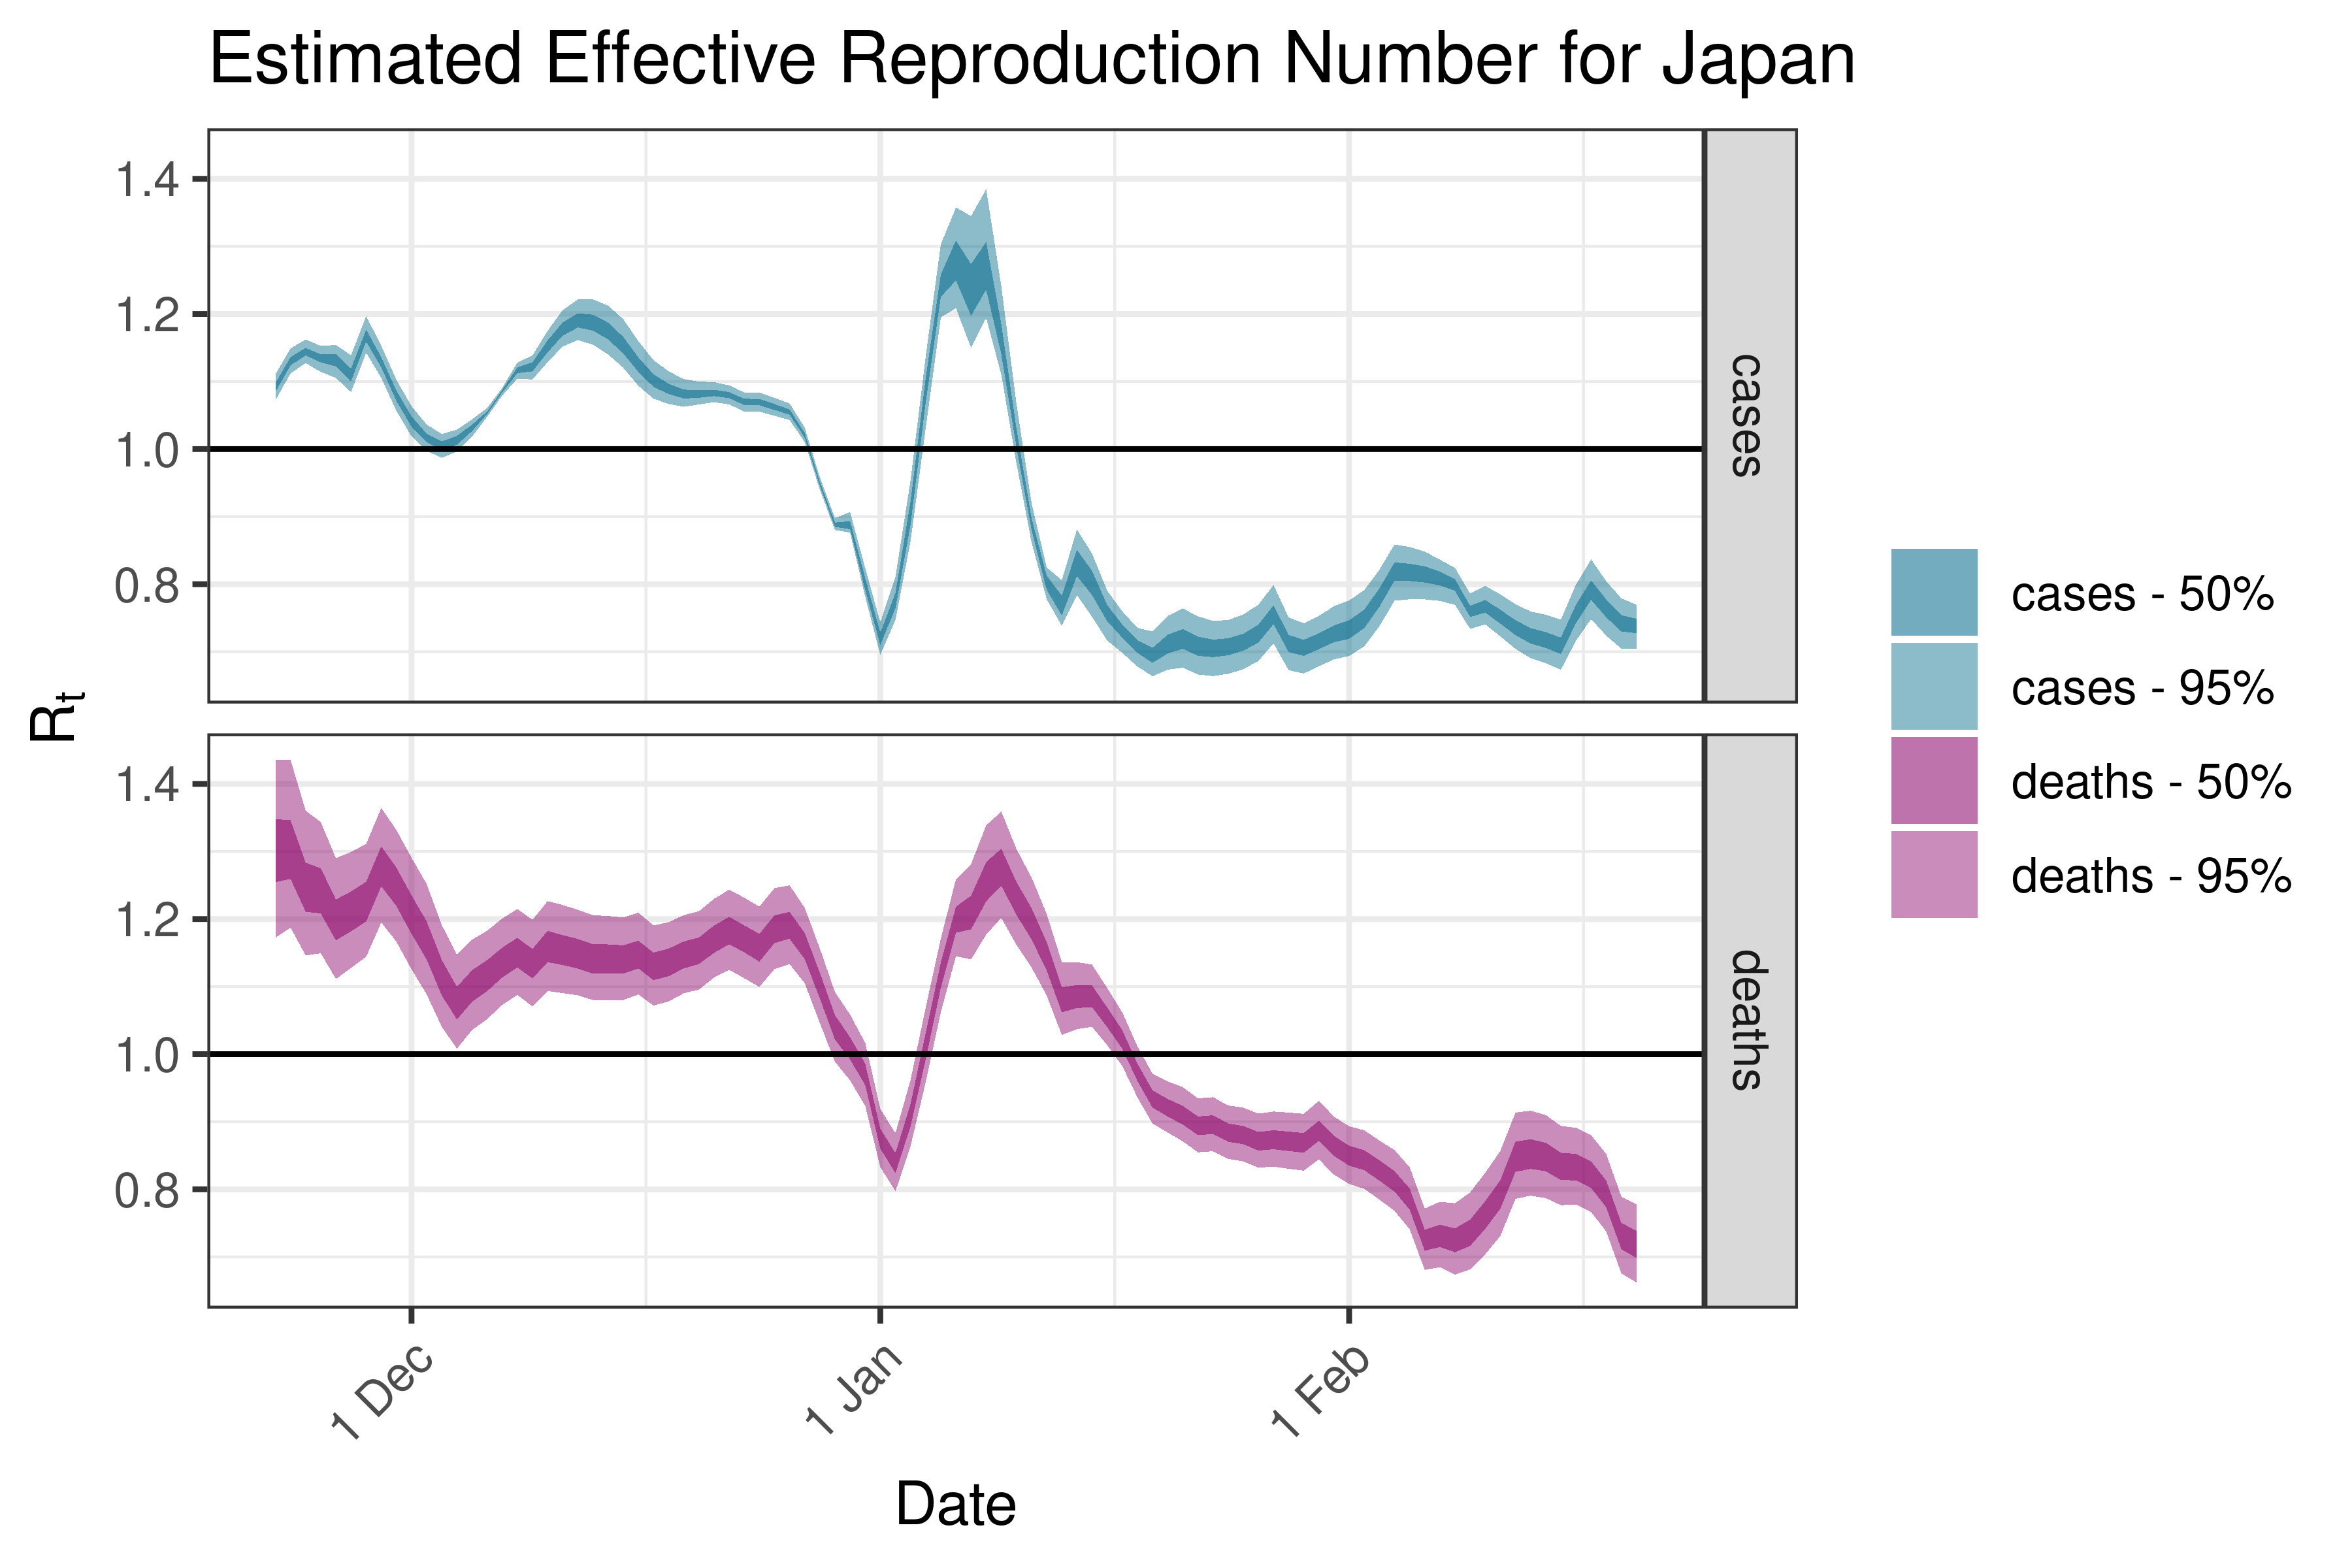
6.5.2.15 Japan
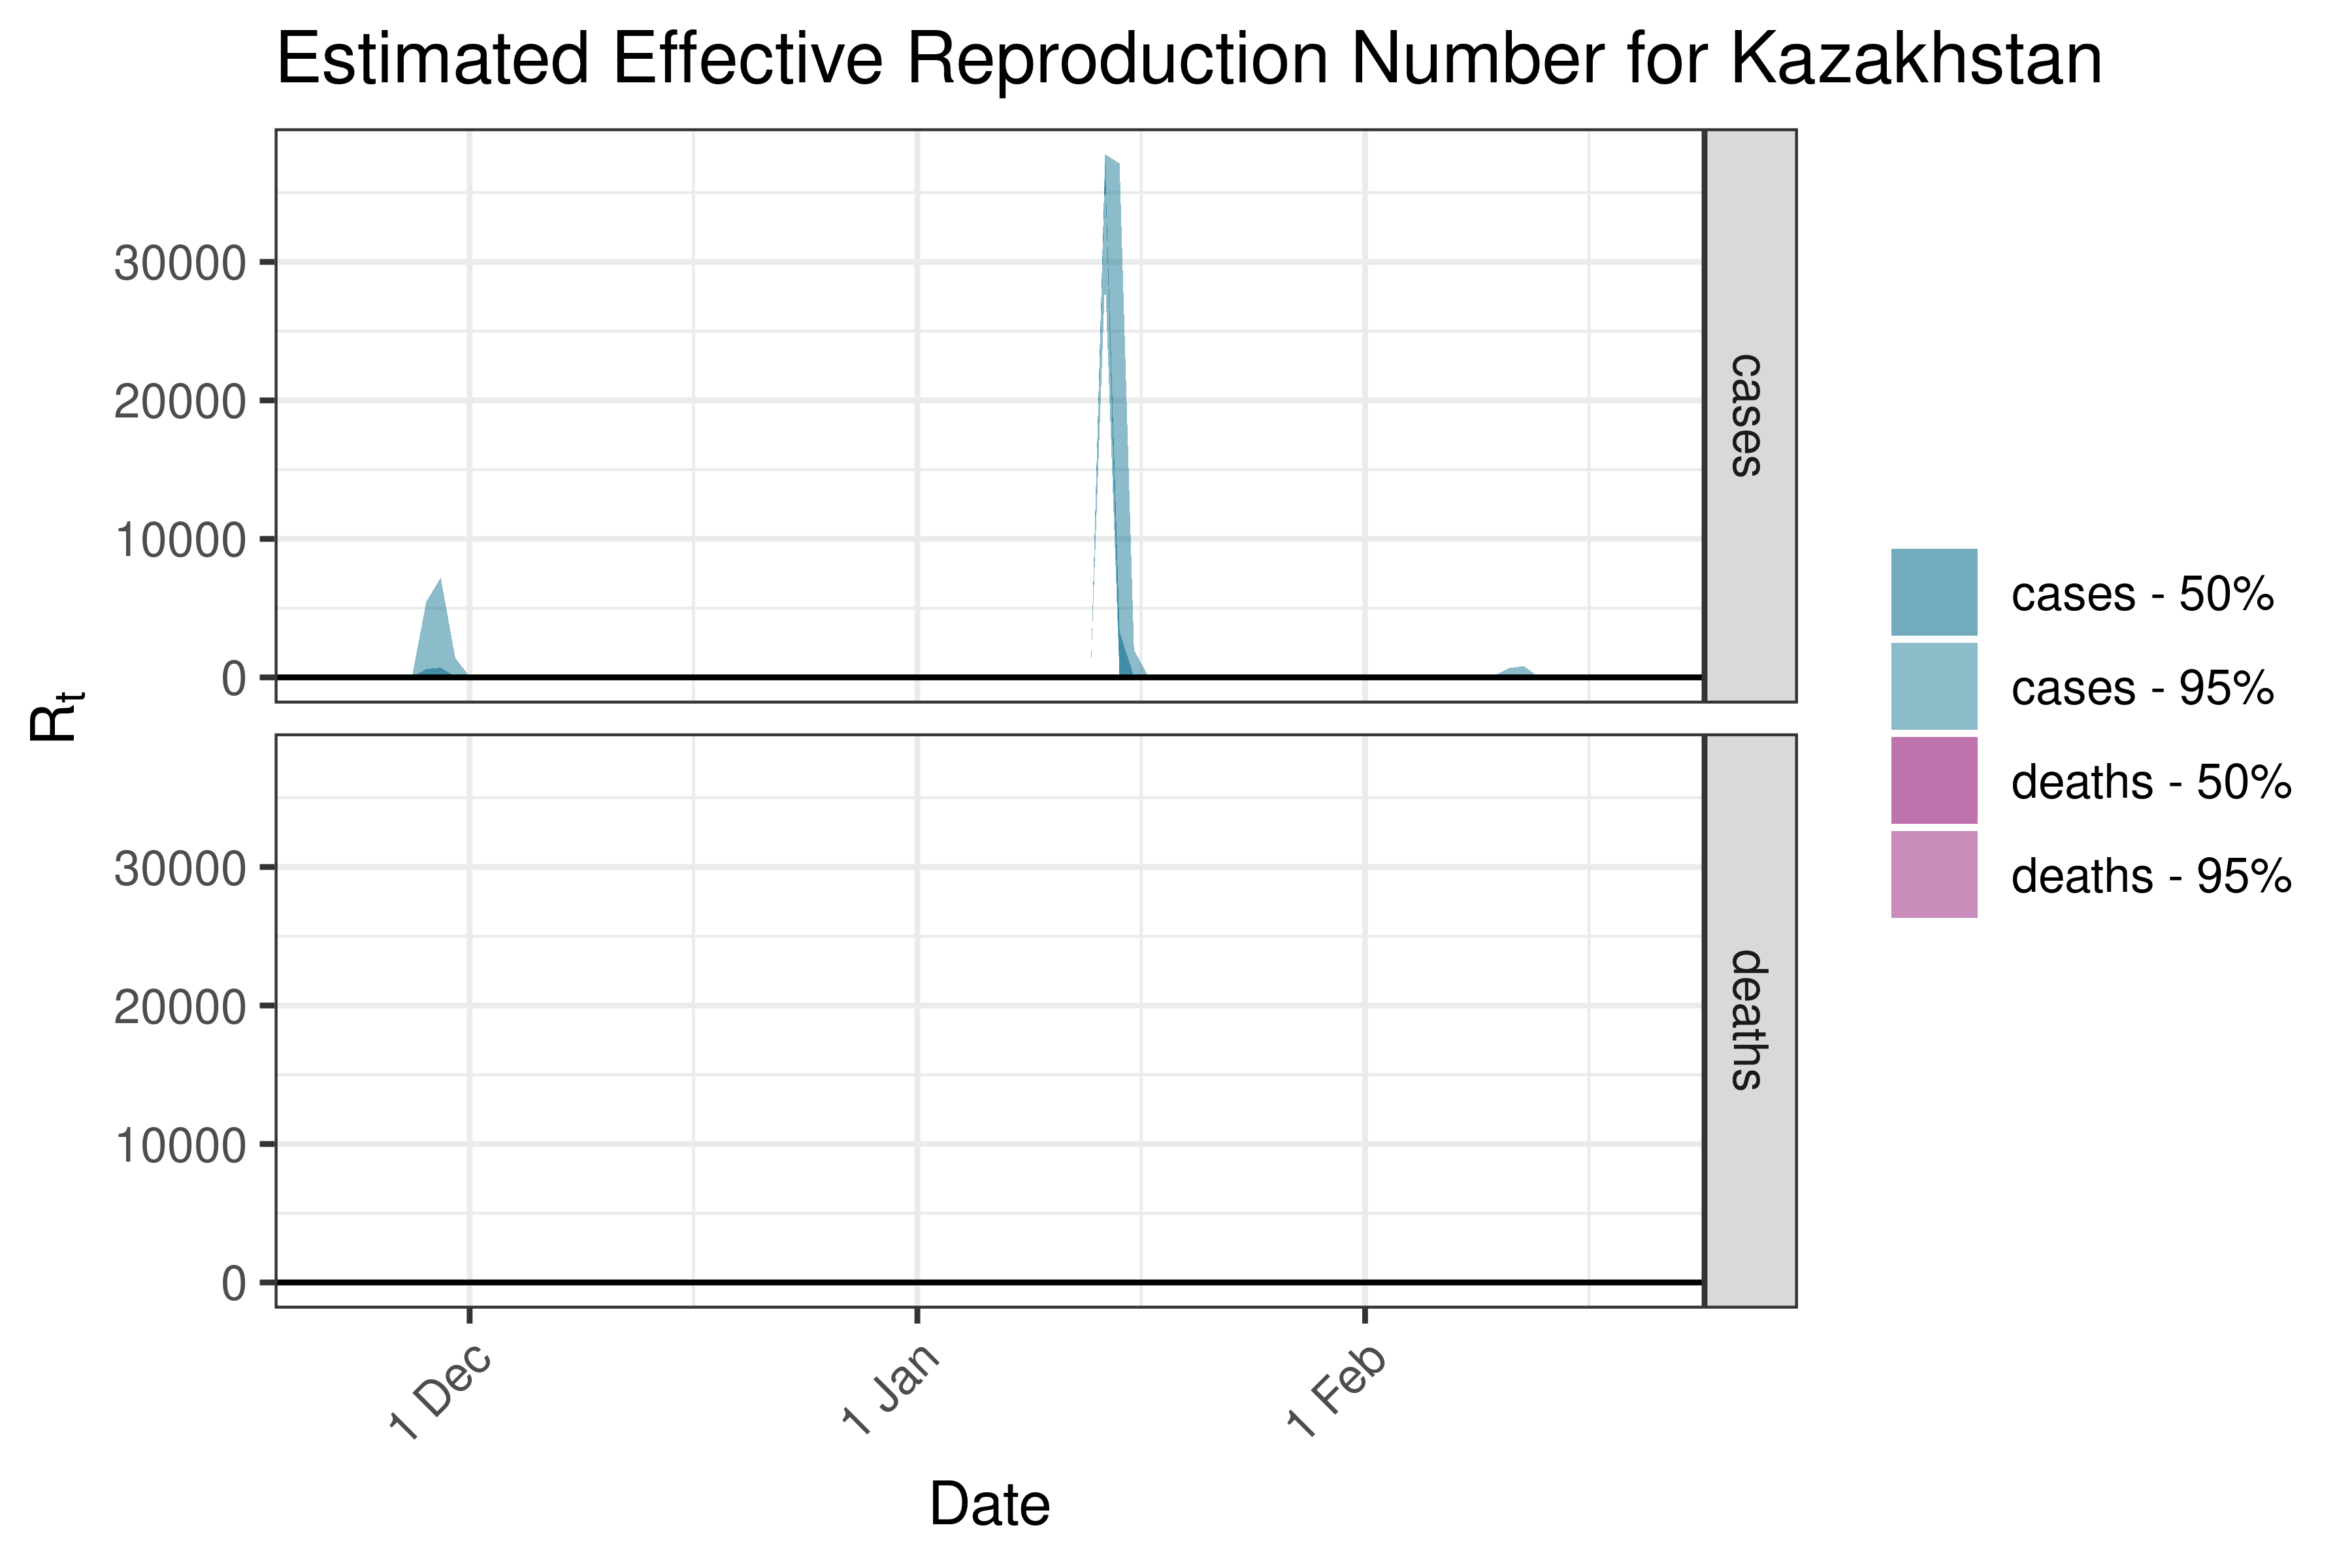
6.5.2.16 Kazakhstan
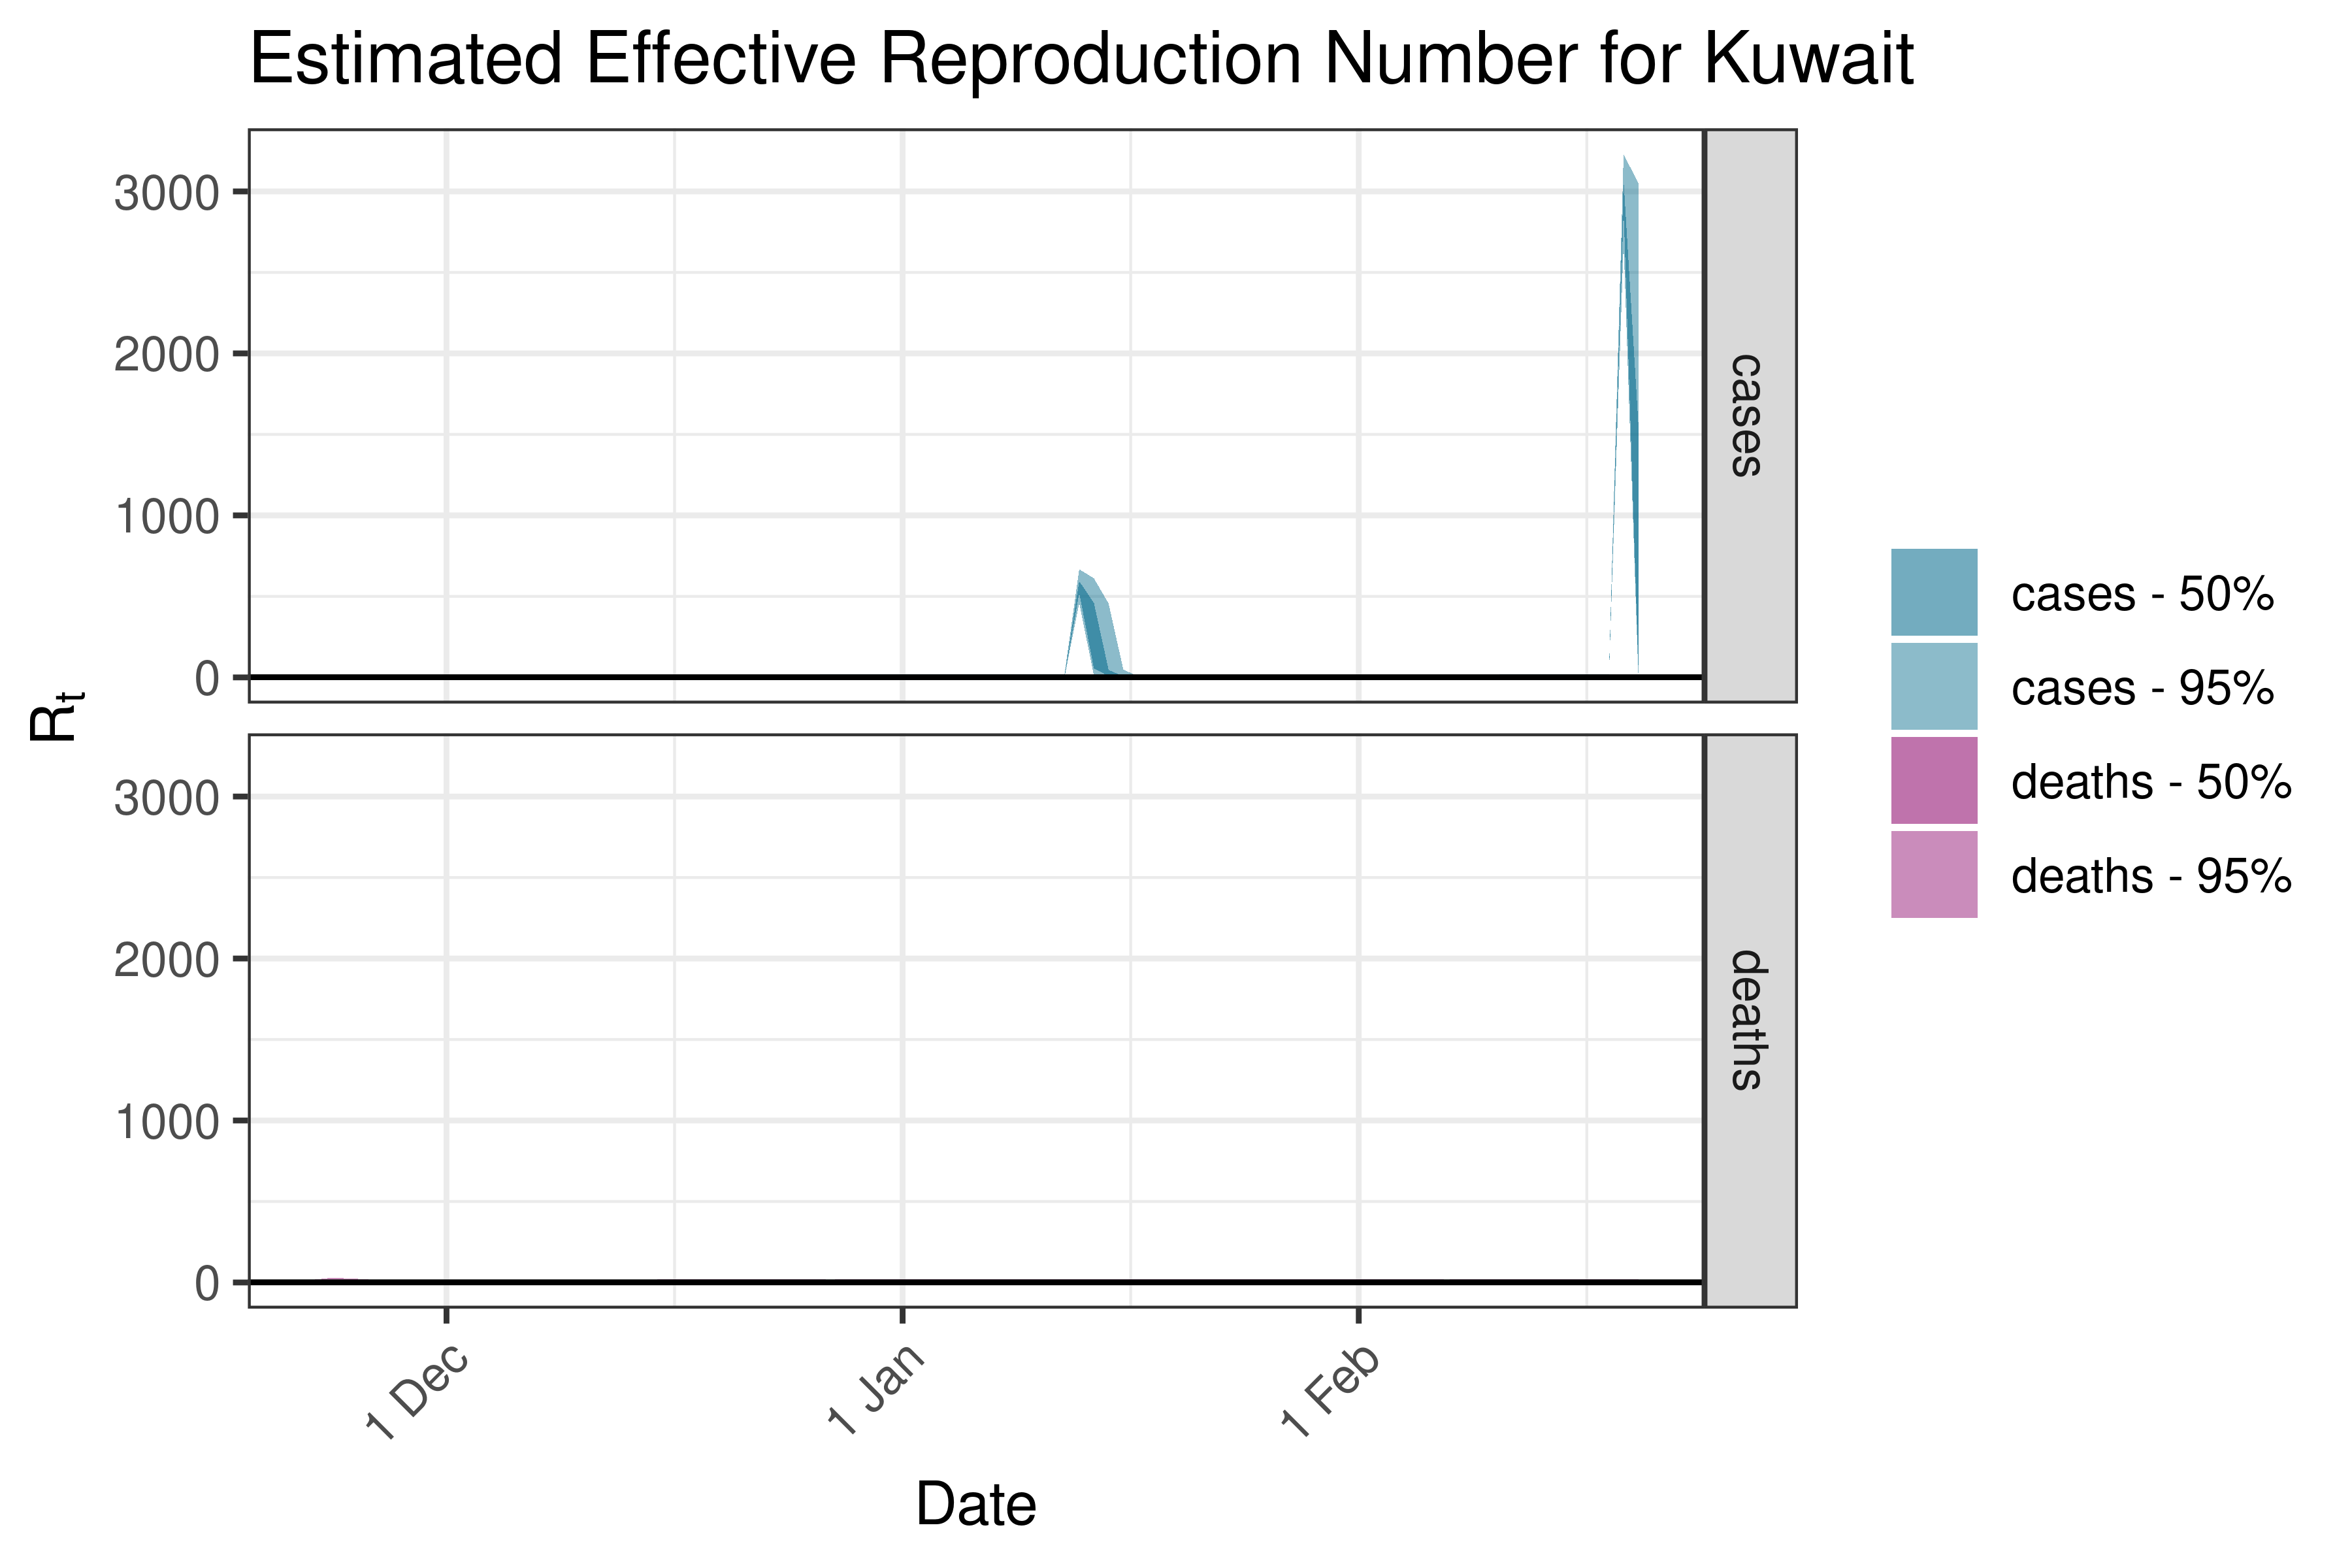
6.5.2.17 Kuwait
6.5.2.18 Laos

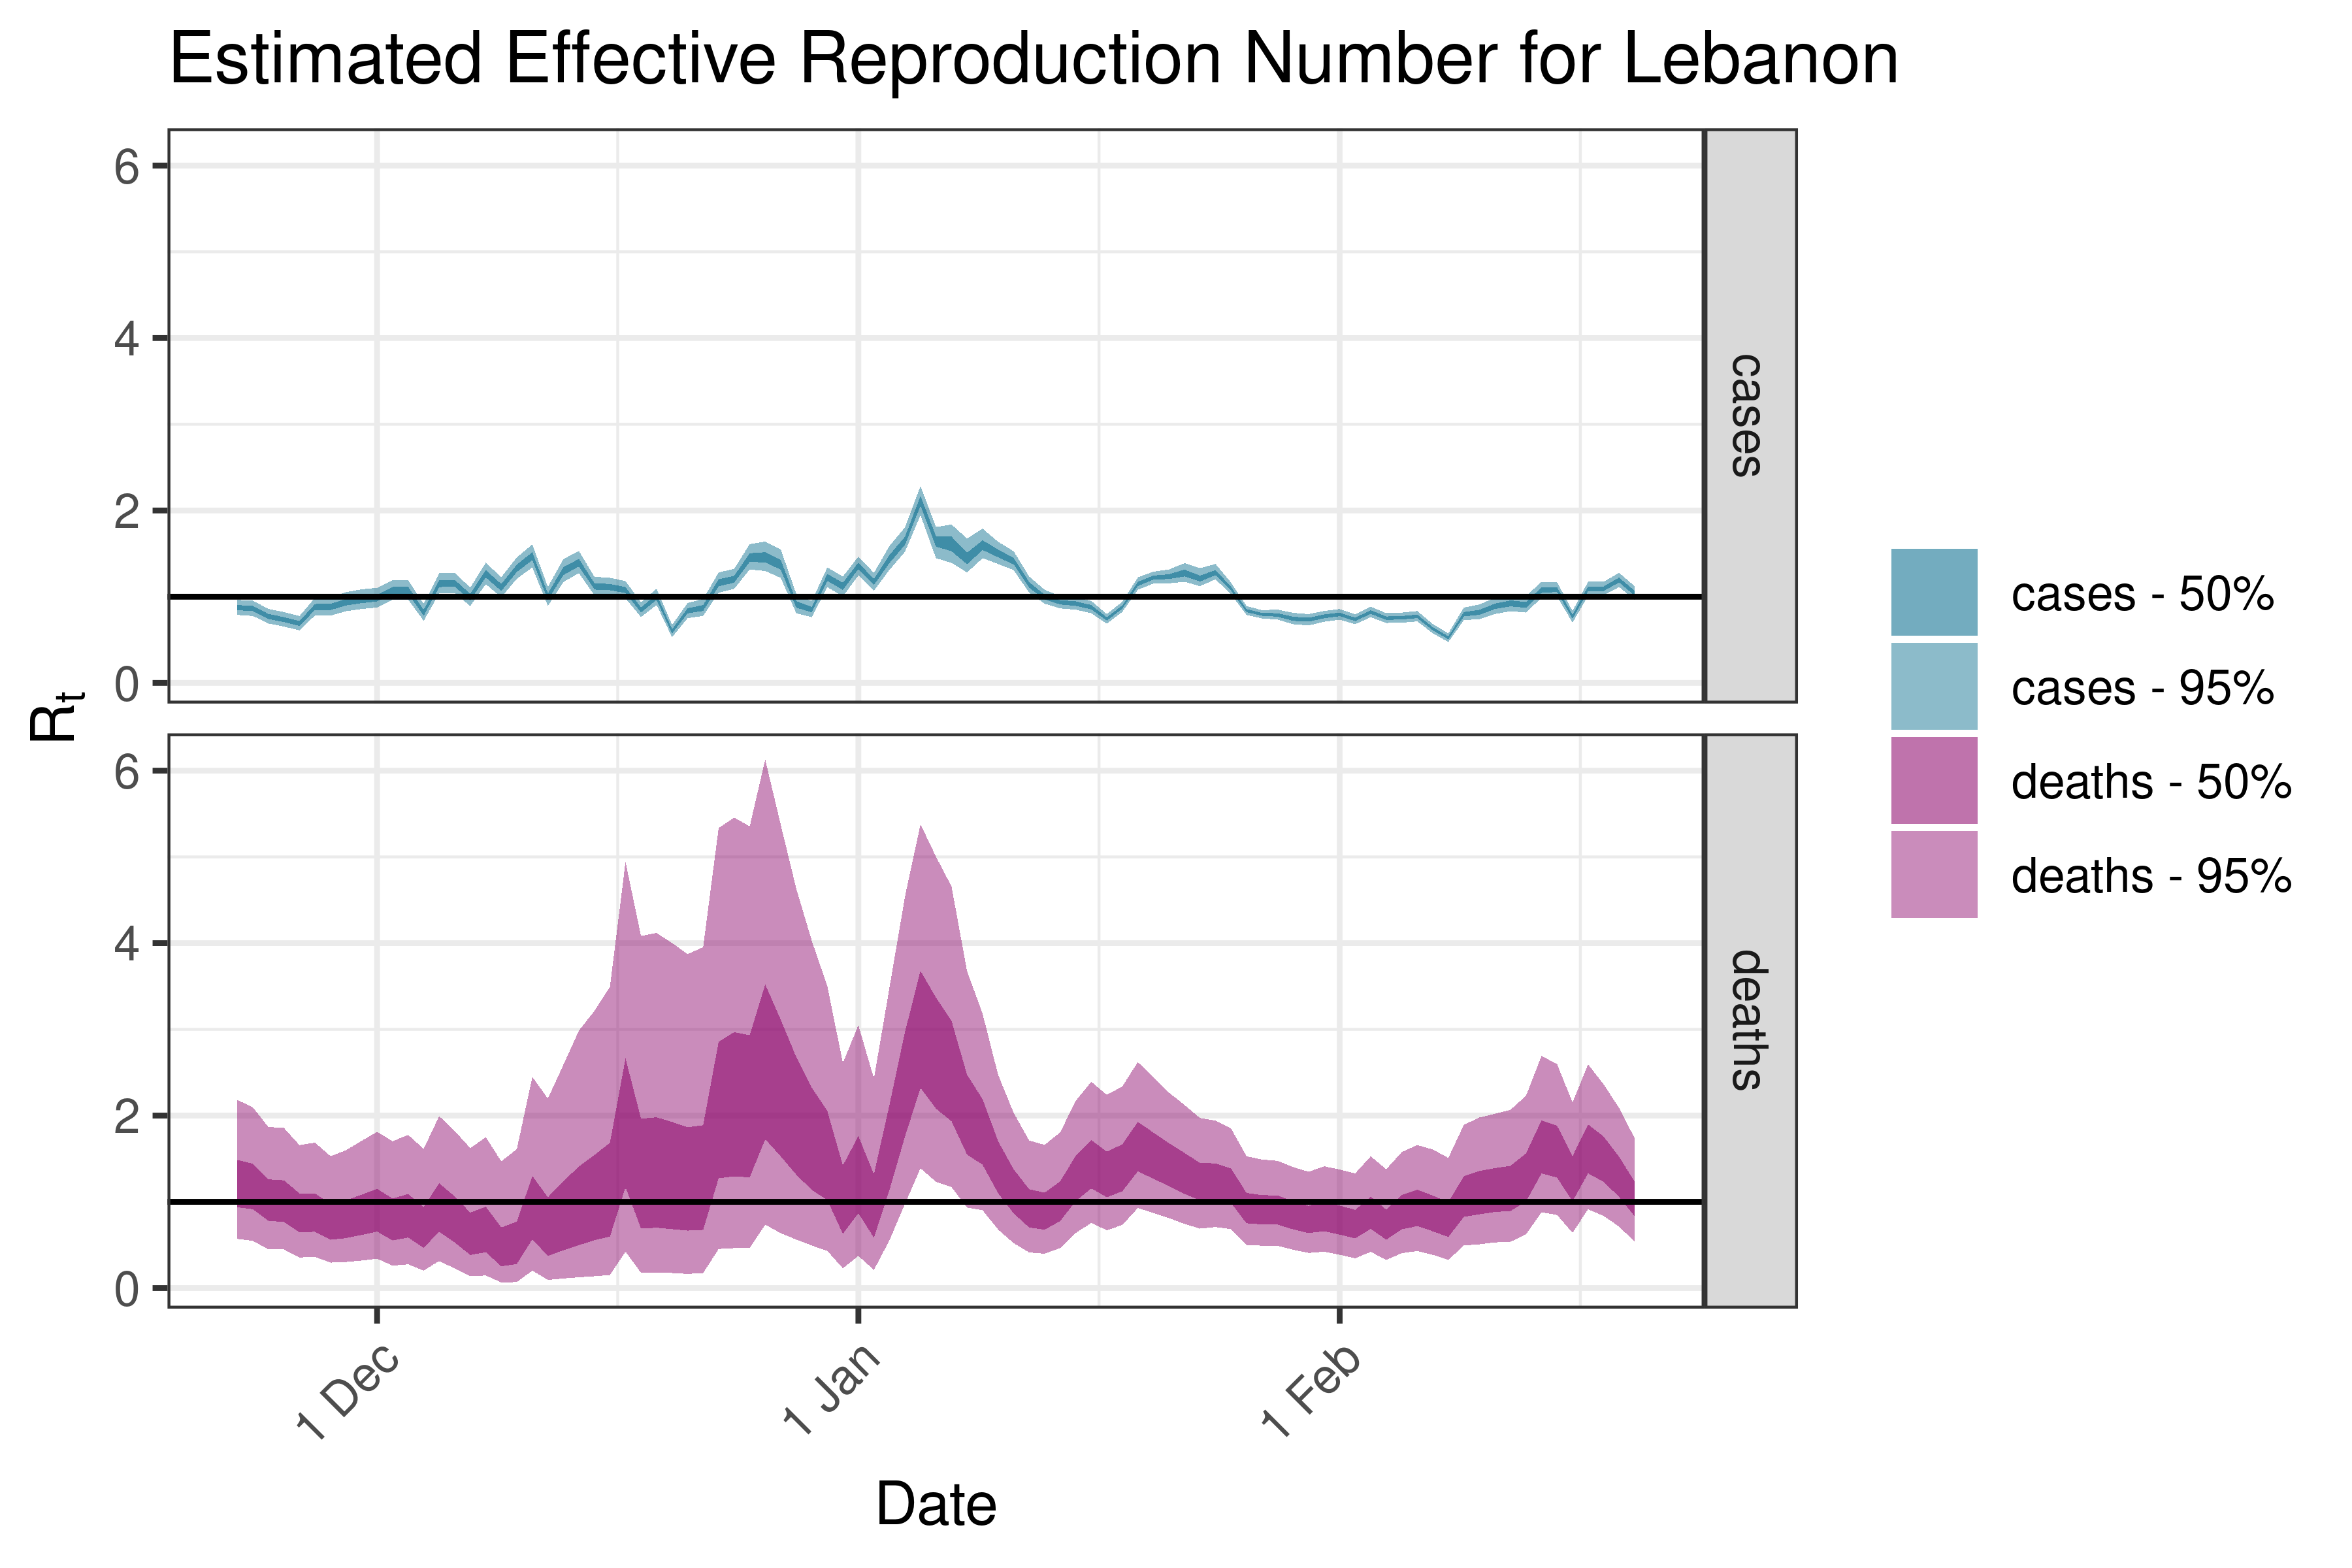
6.5.2.19 Lebanon
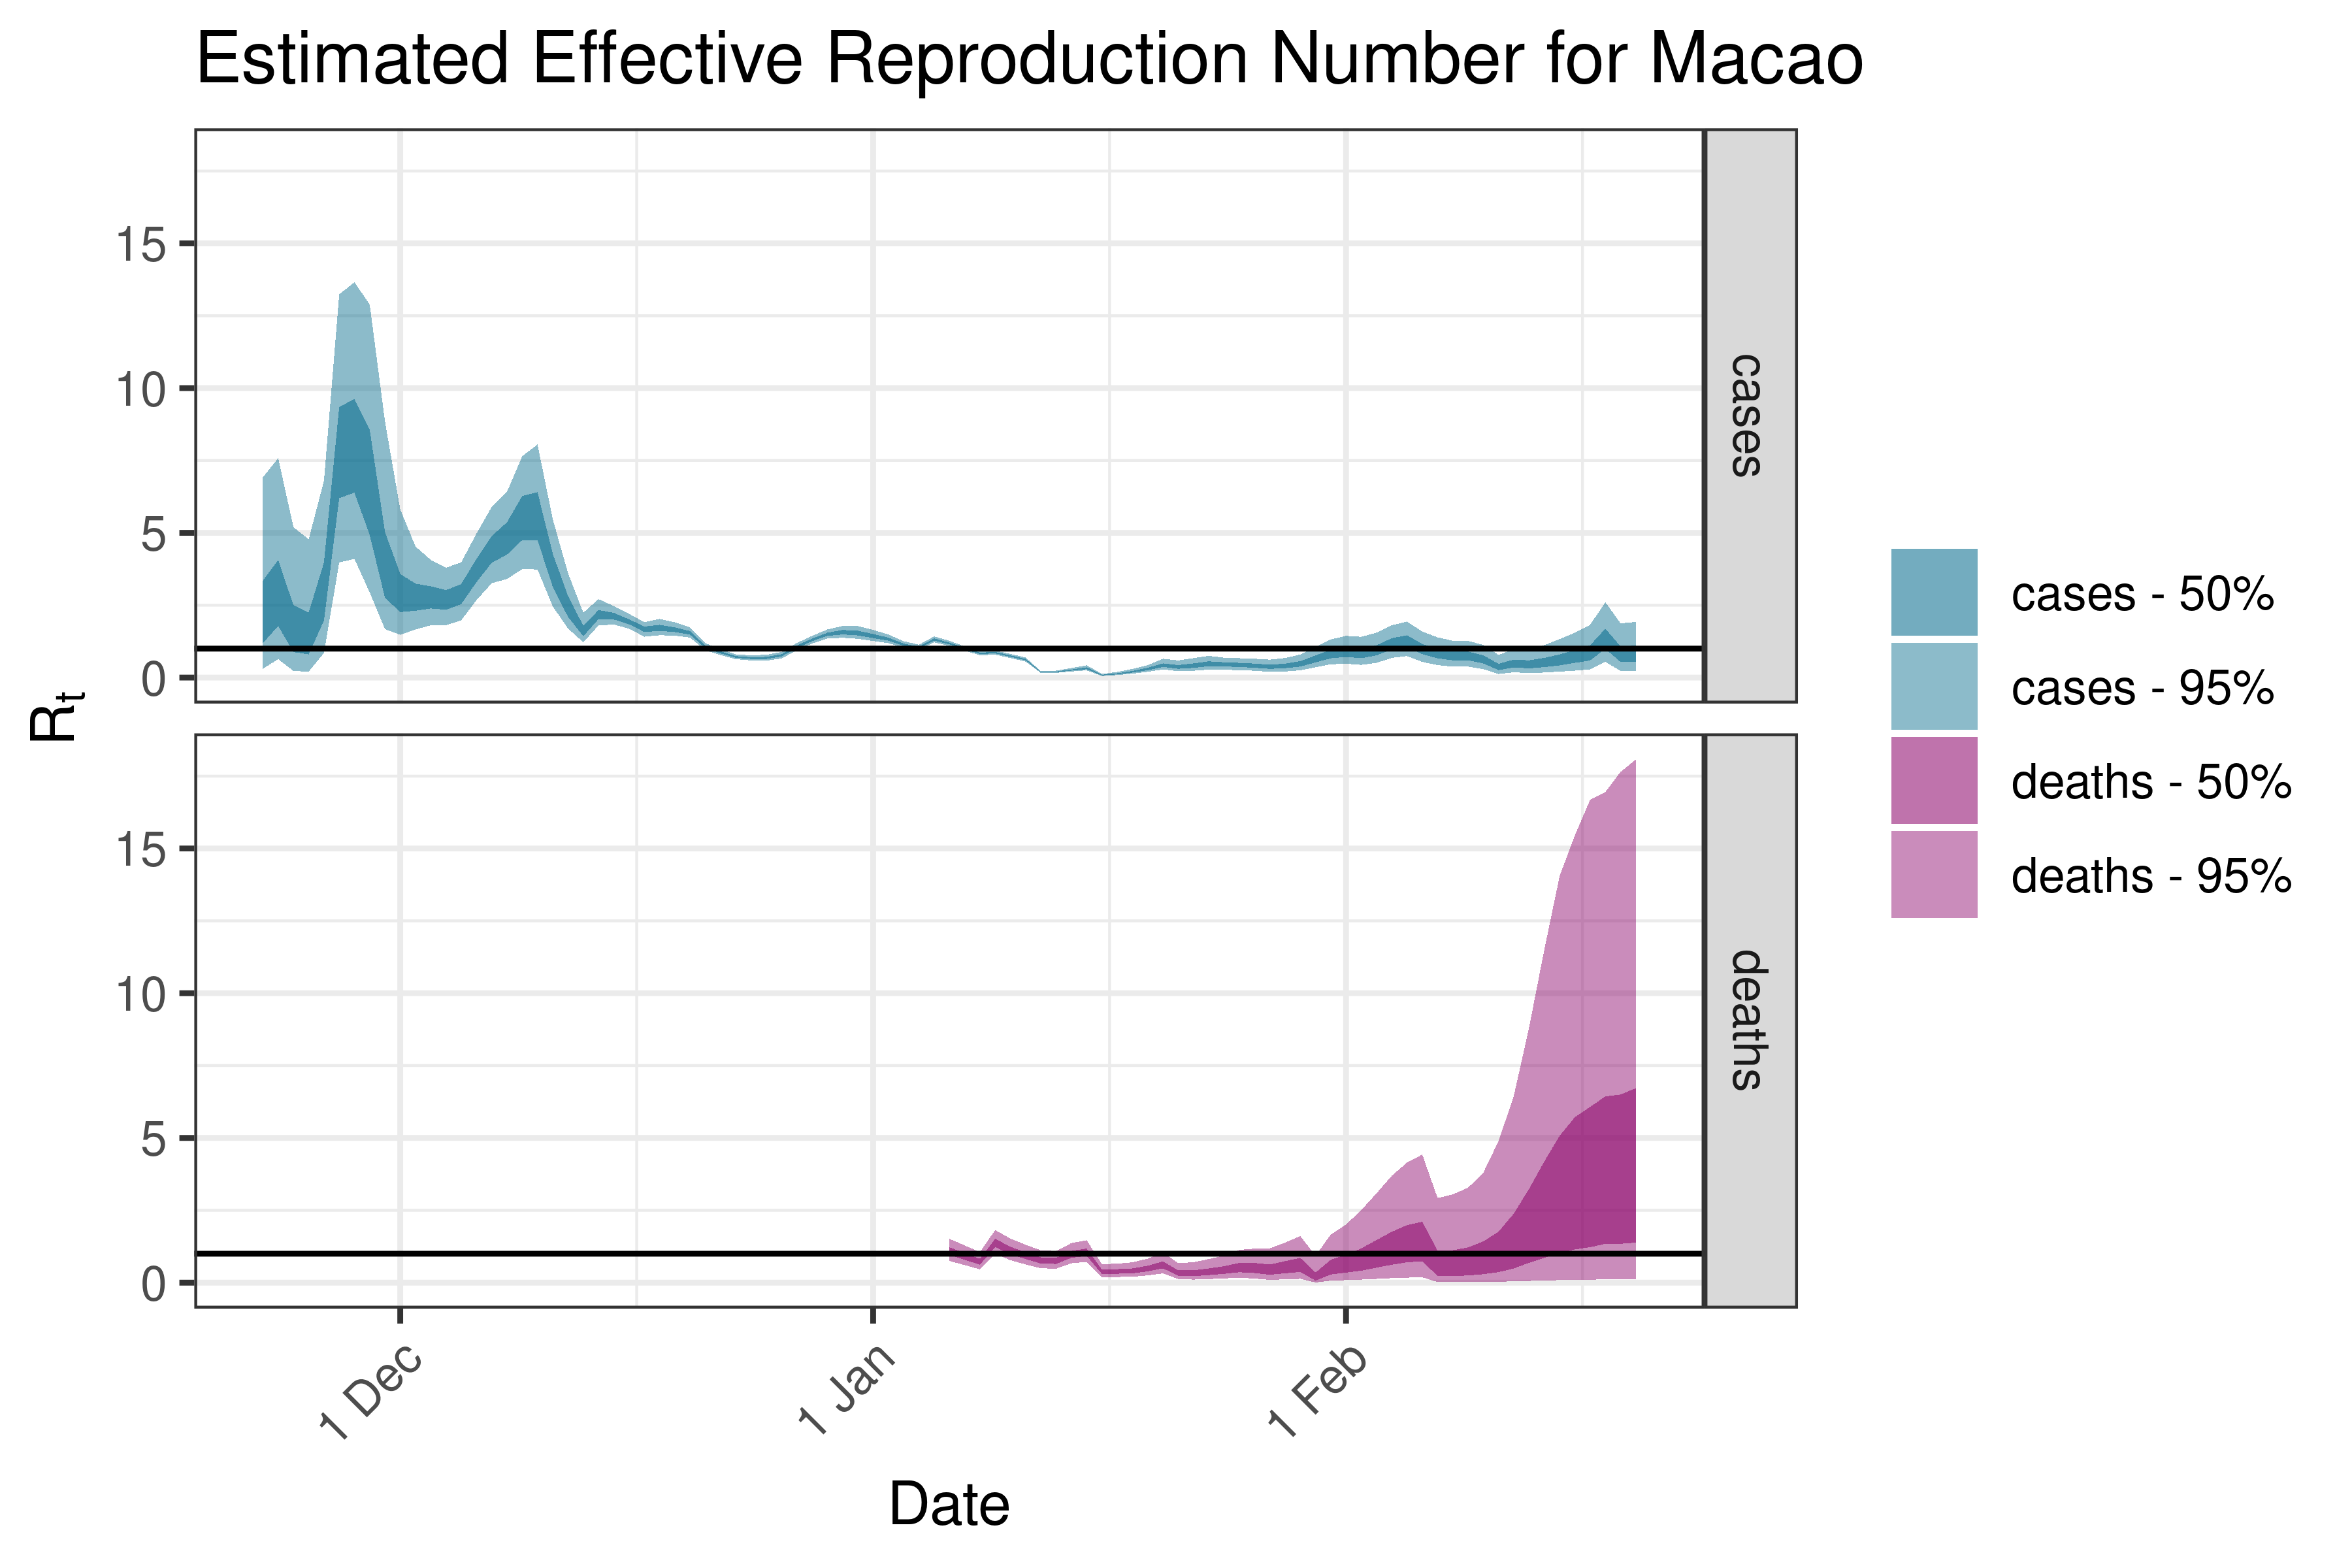
6.5.2.20 Macao
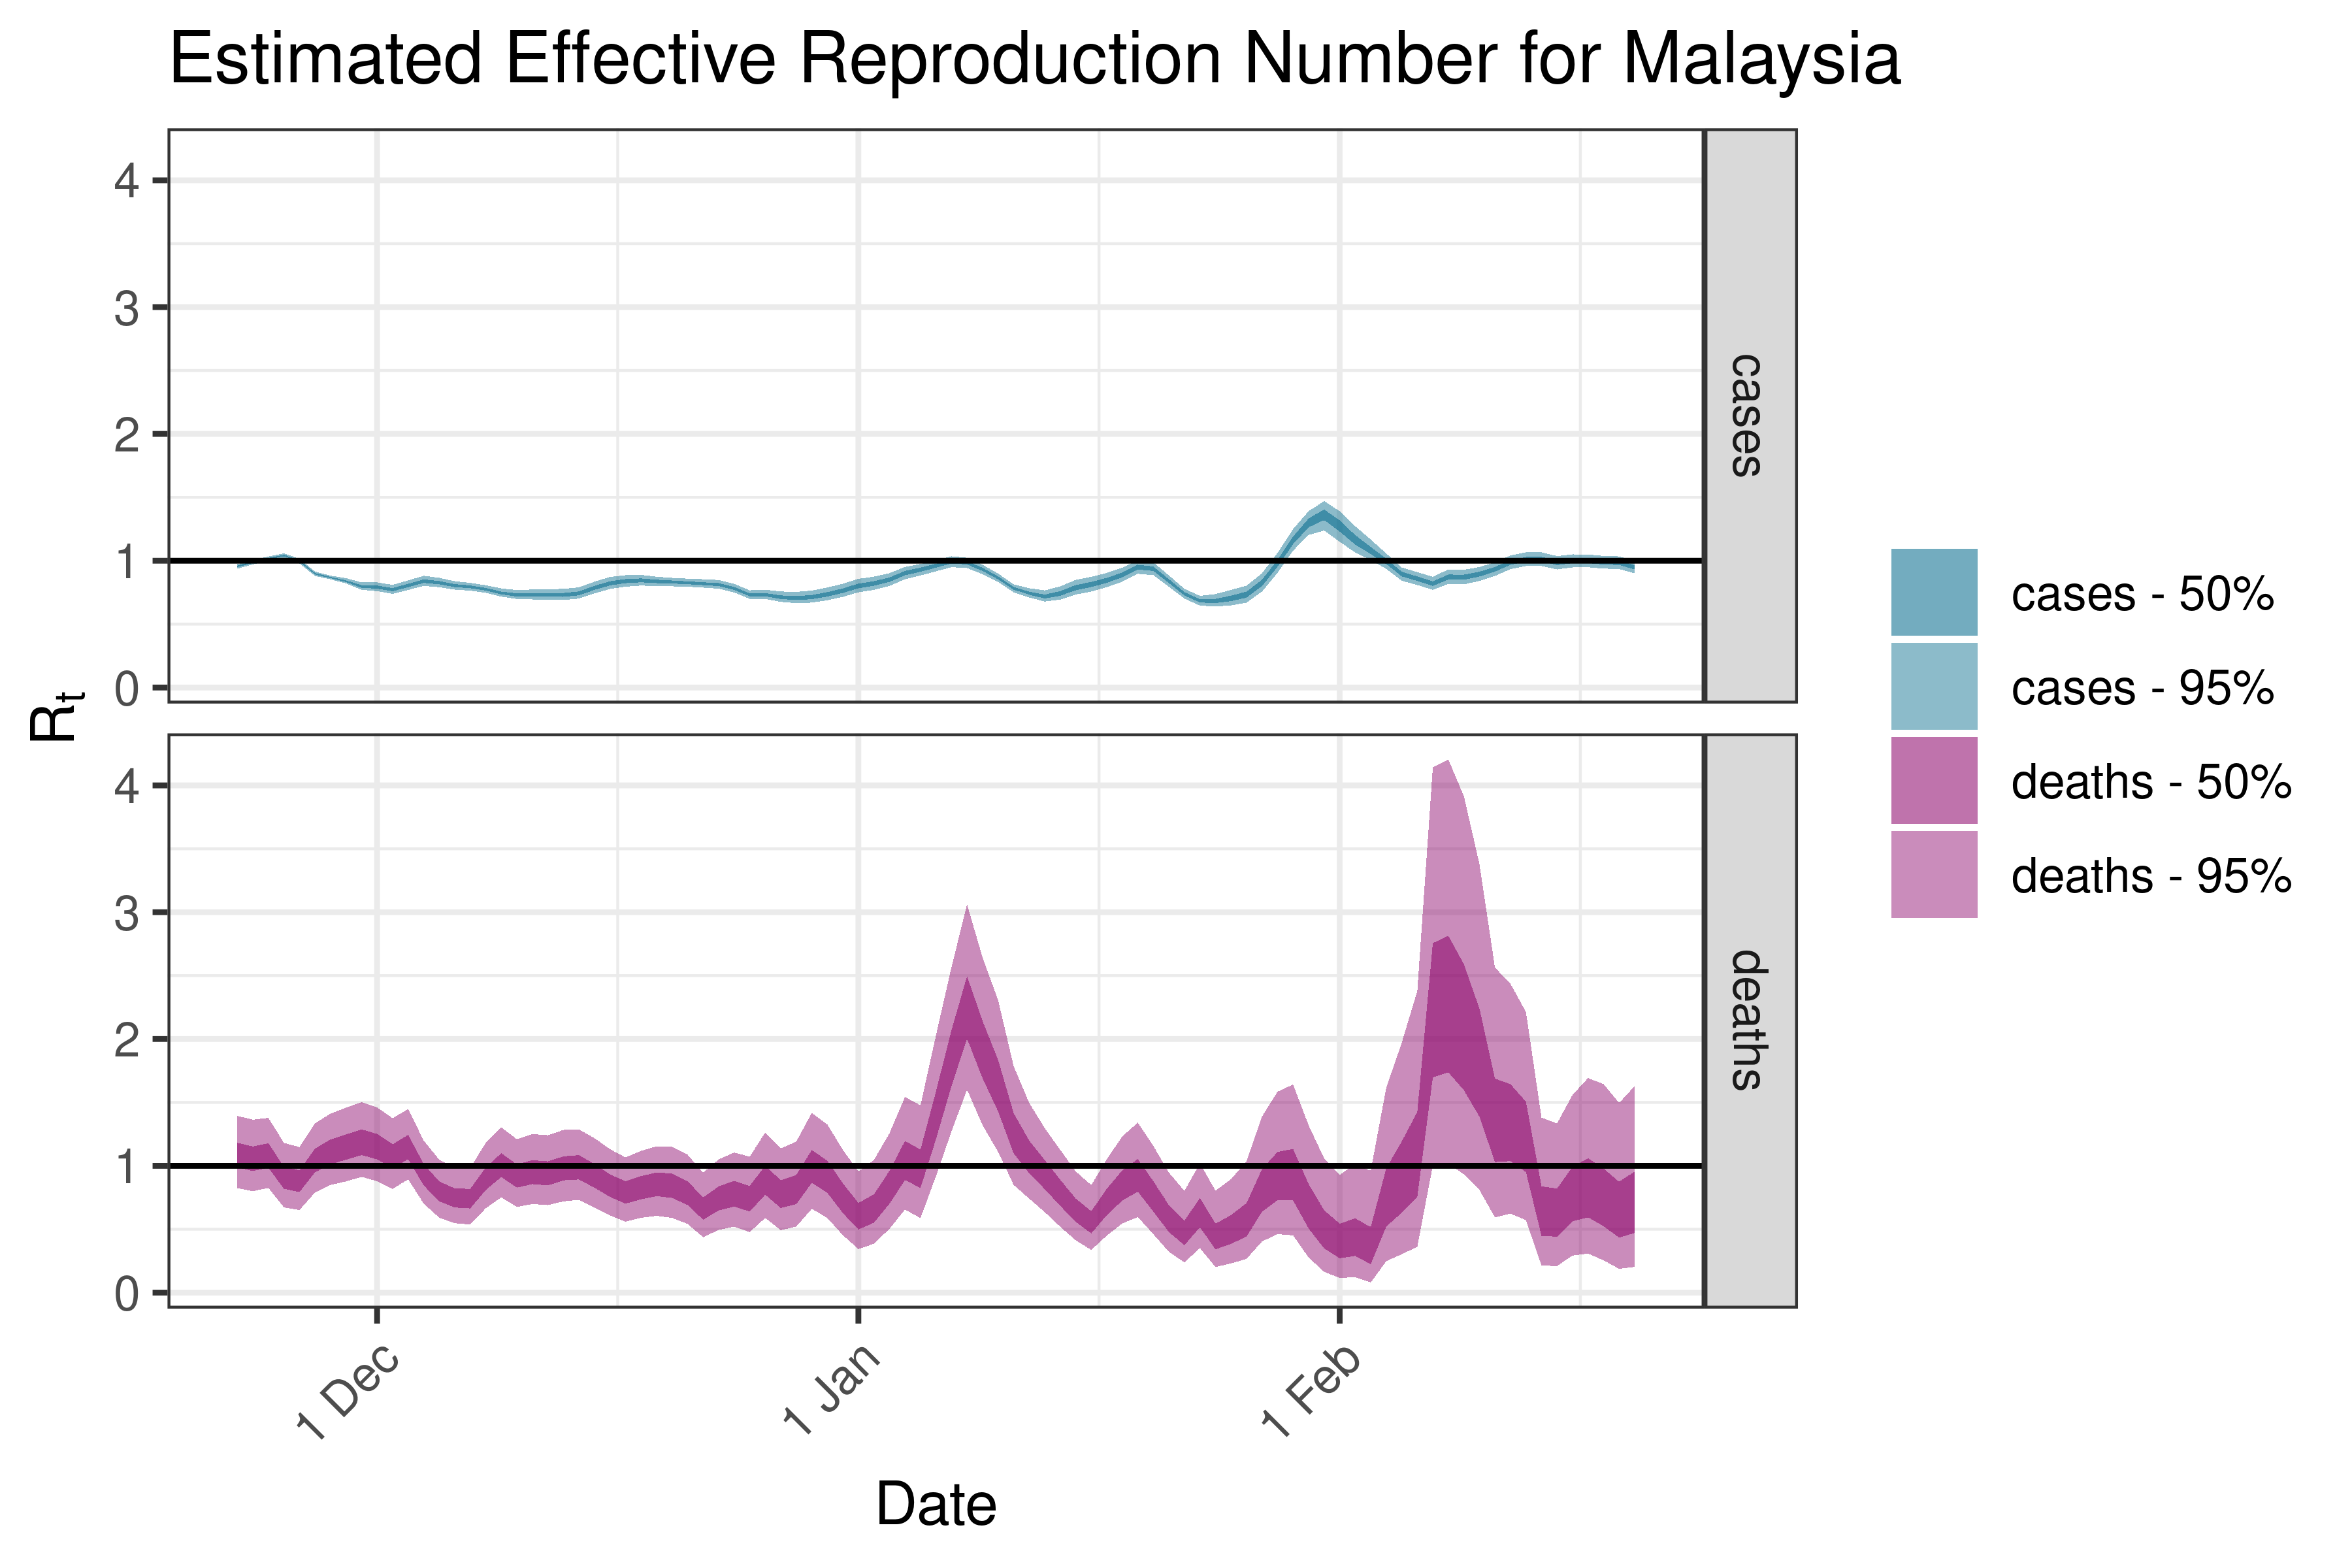
6.5.2.21 Malaysia
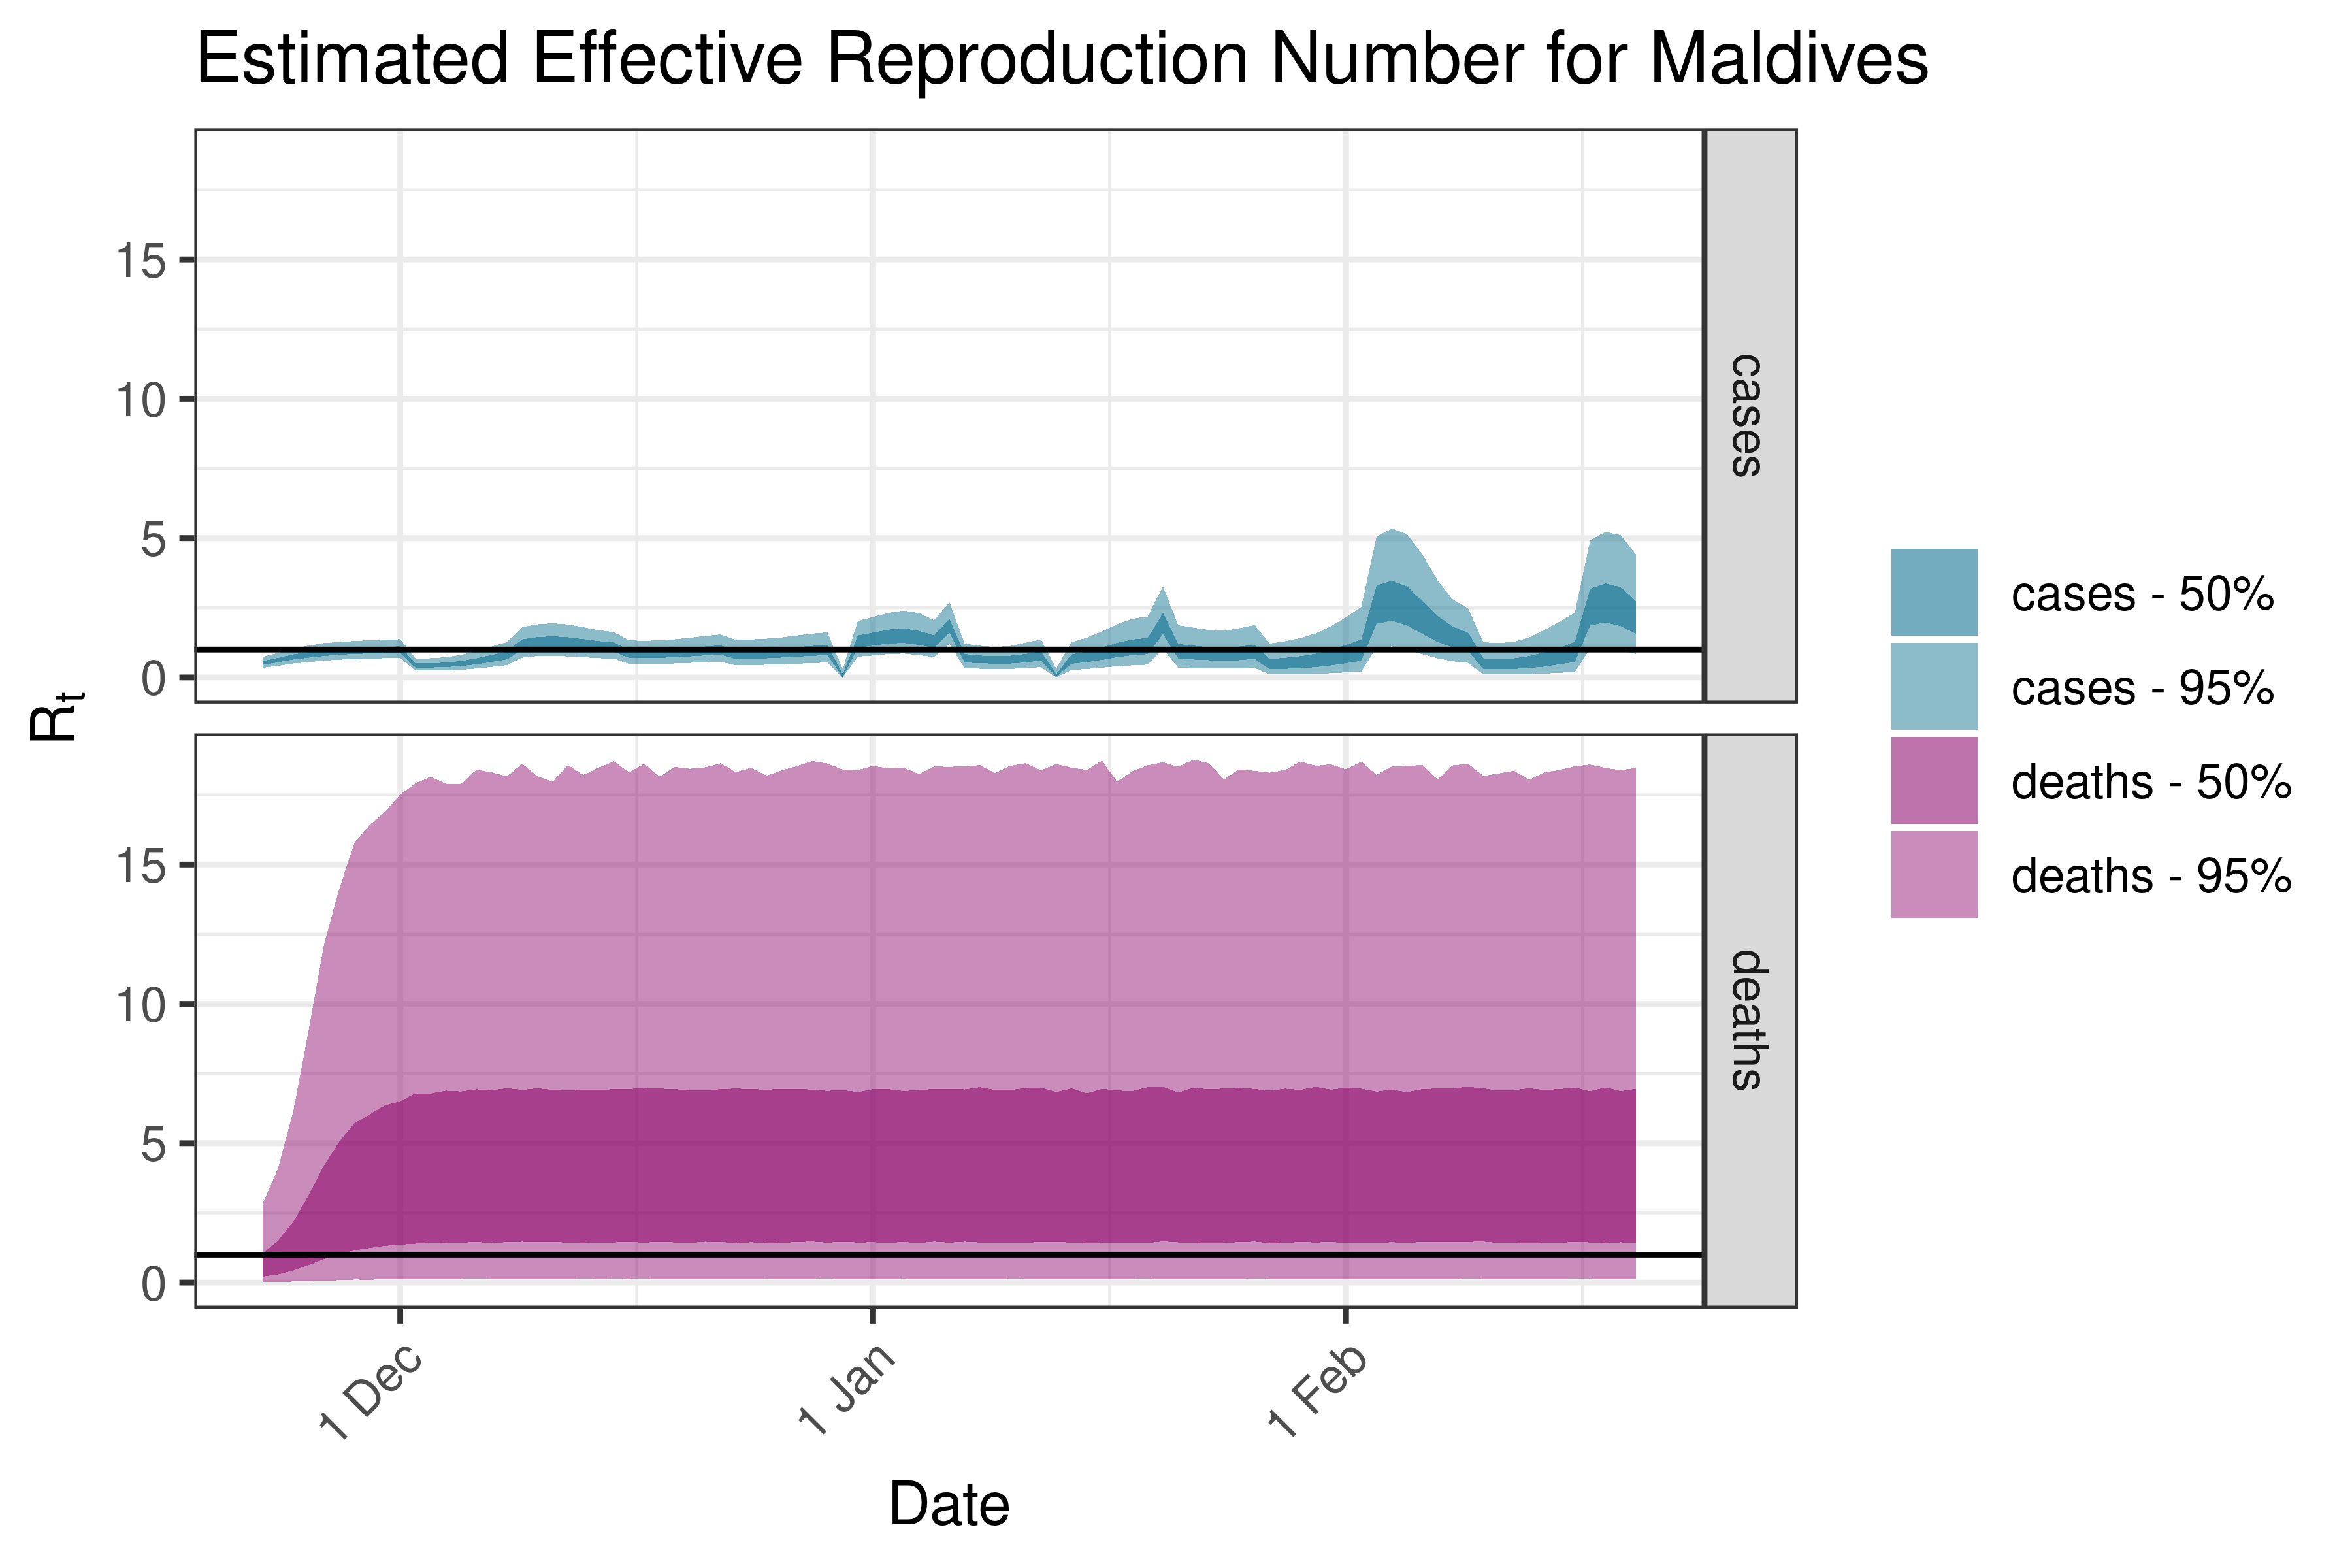
6.5.2.22 Maldives
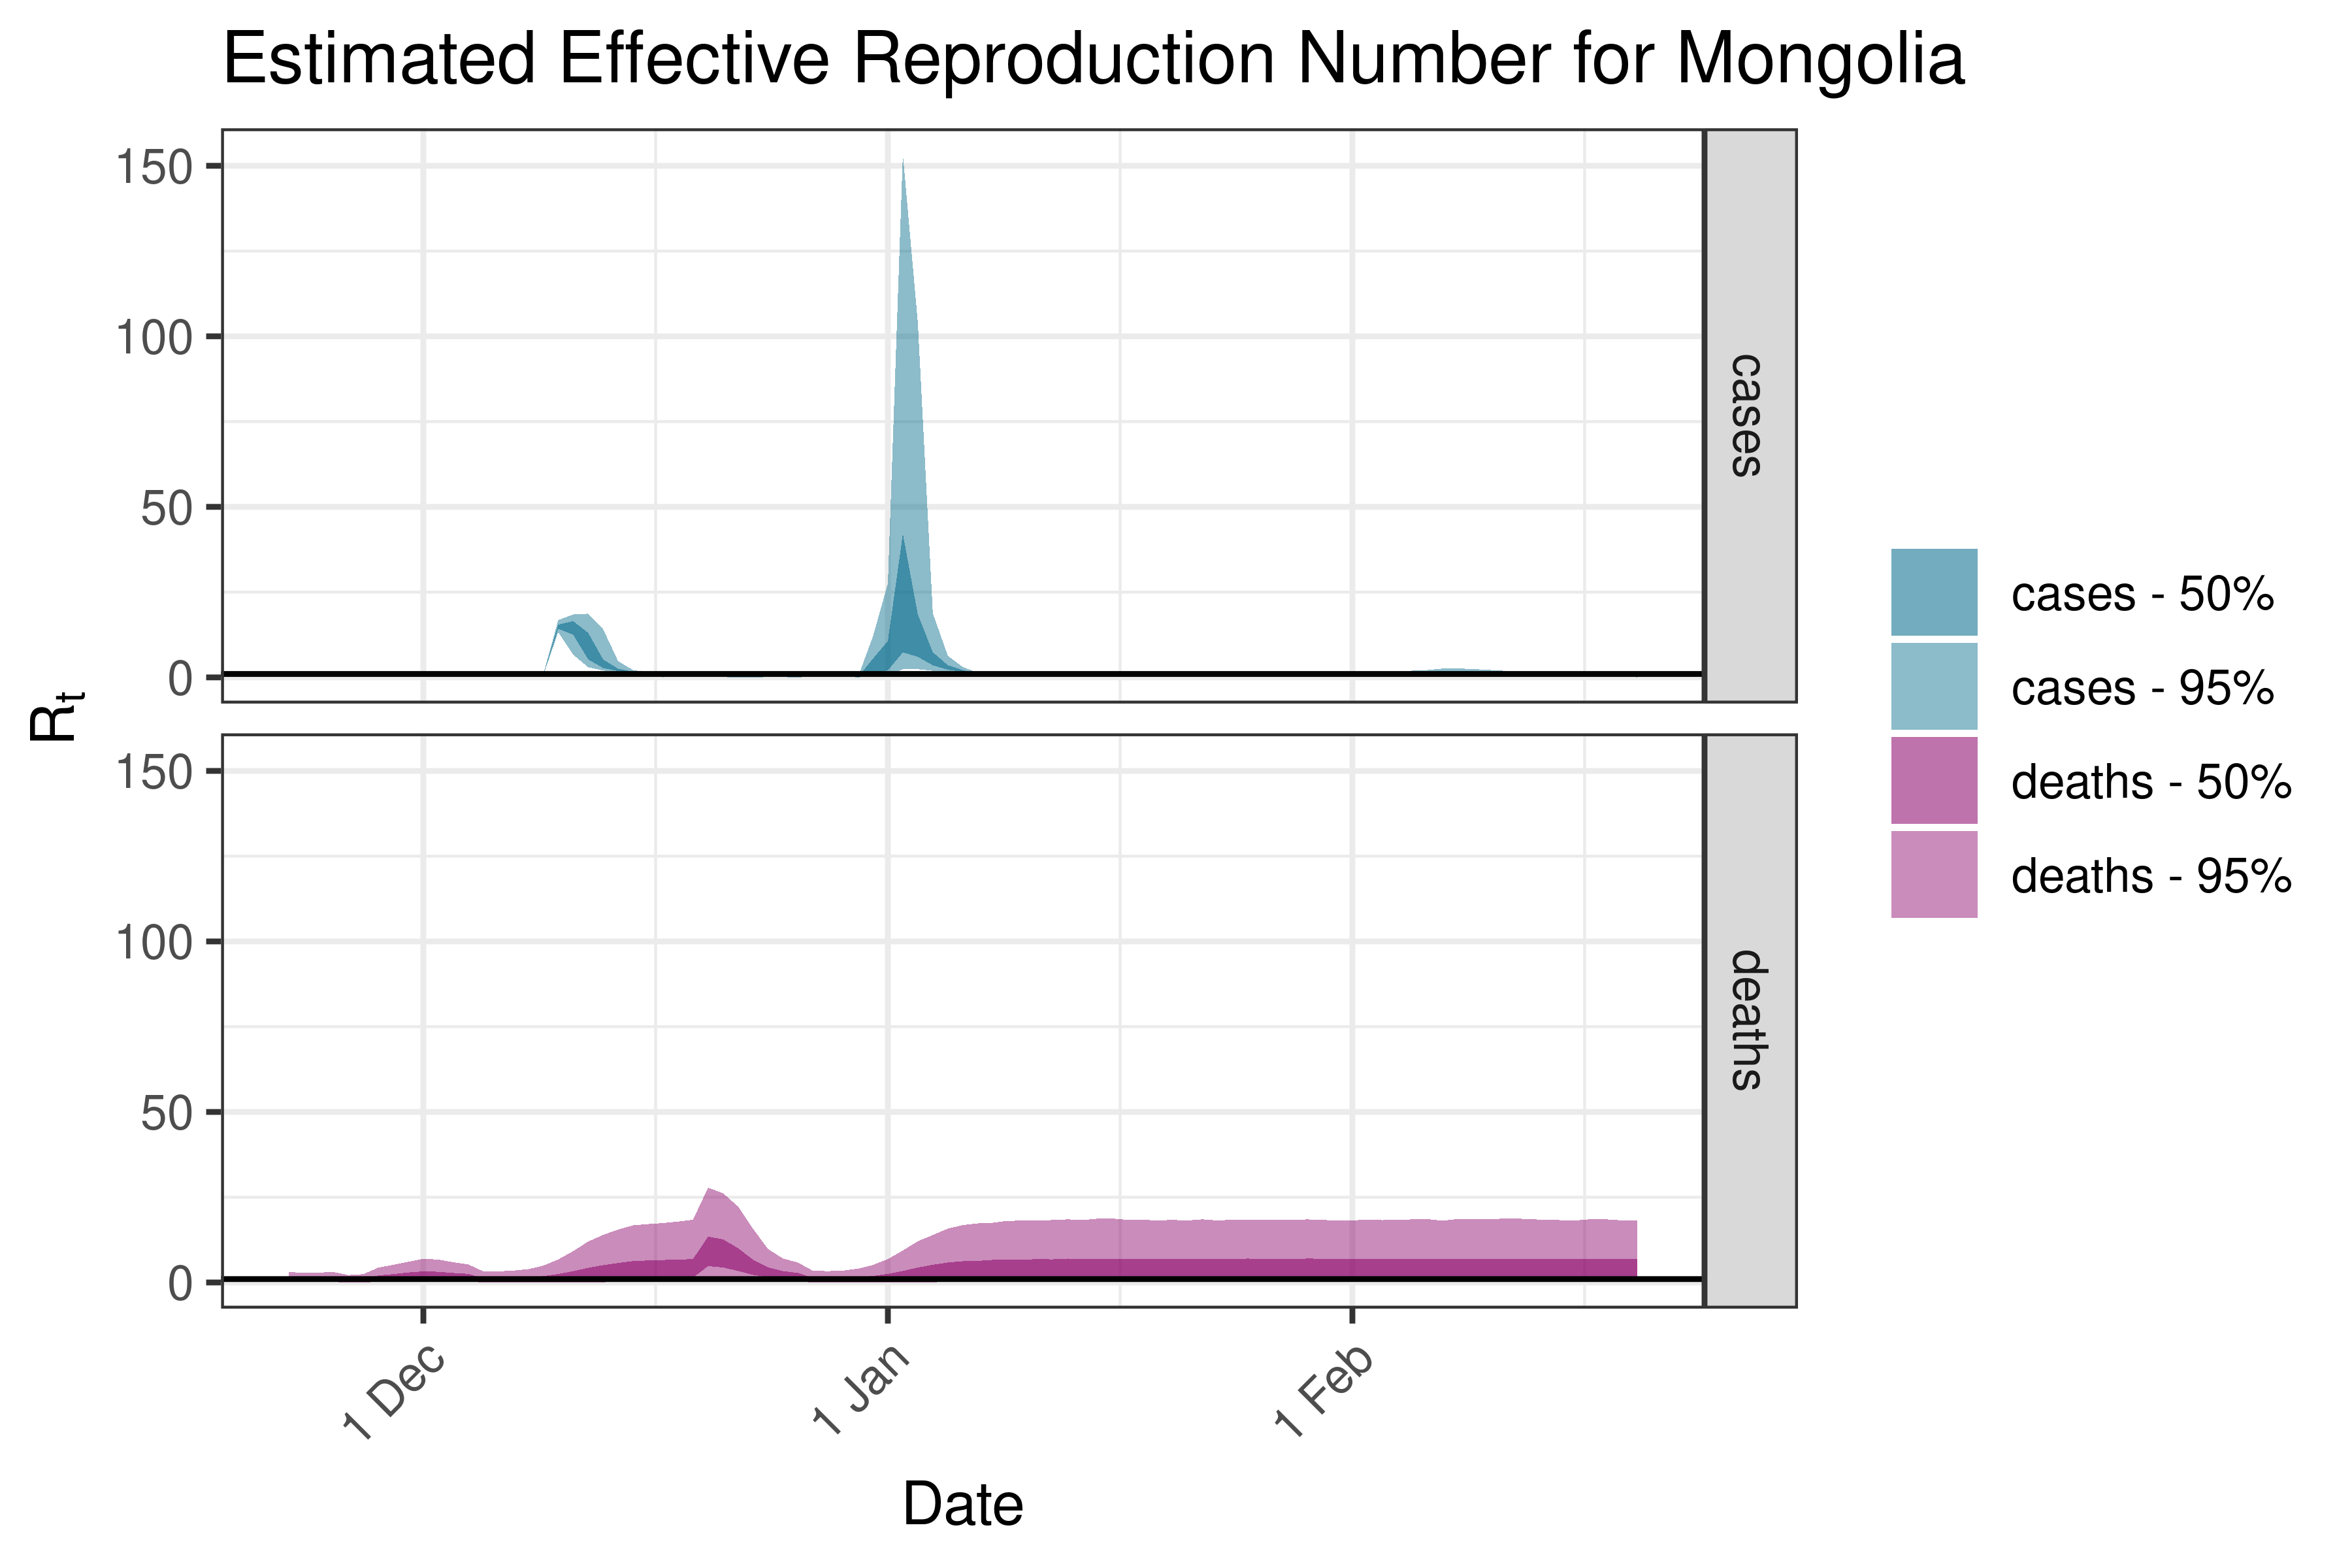
6.5.2.23 Mongolia
6.5.2.24 Myanmar
6.5.2.25 Nepal
6.5.2.26 Oman
6.5.2.27 Pakistan
6.5.2.28 Palestine
6.5.2.29 Philippines
6.5.2.30 Qatar
6.5.2.31 Saudi Arabia
6.5.2.32 Singapore
6.5.2.33 South Korea
6.5.2.34 Sri Lanka
6.5.2.35 Taiwan
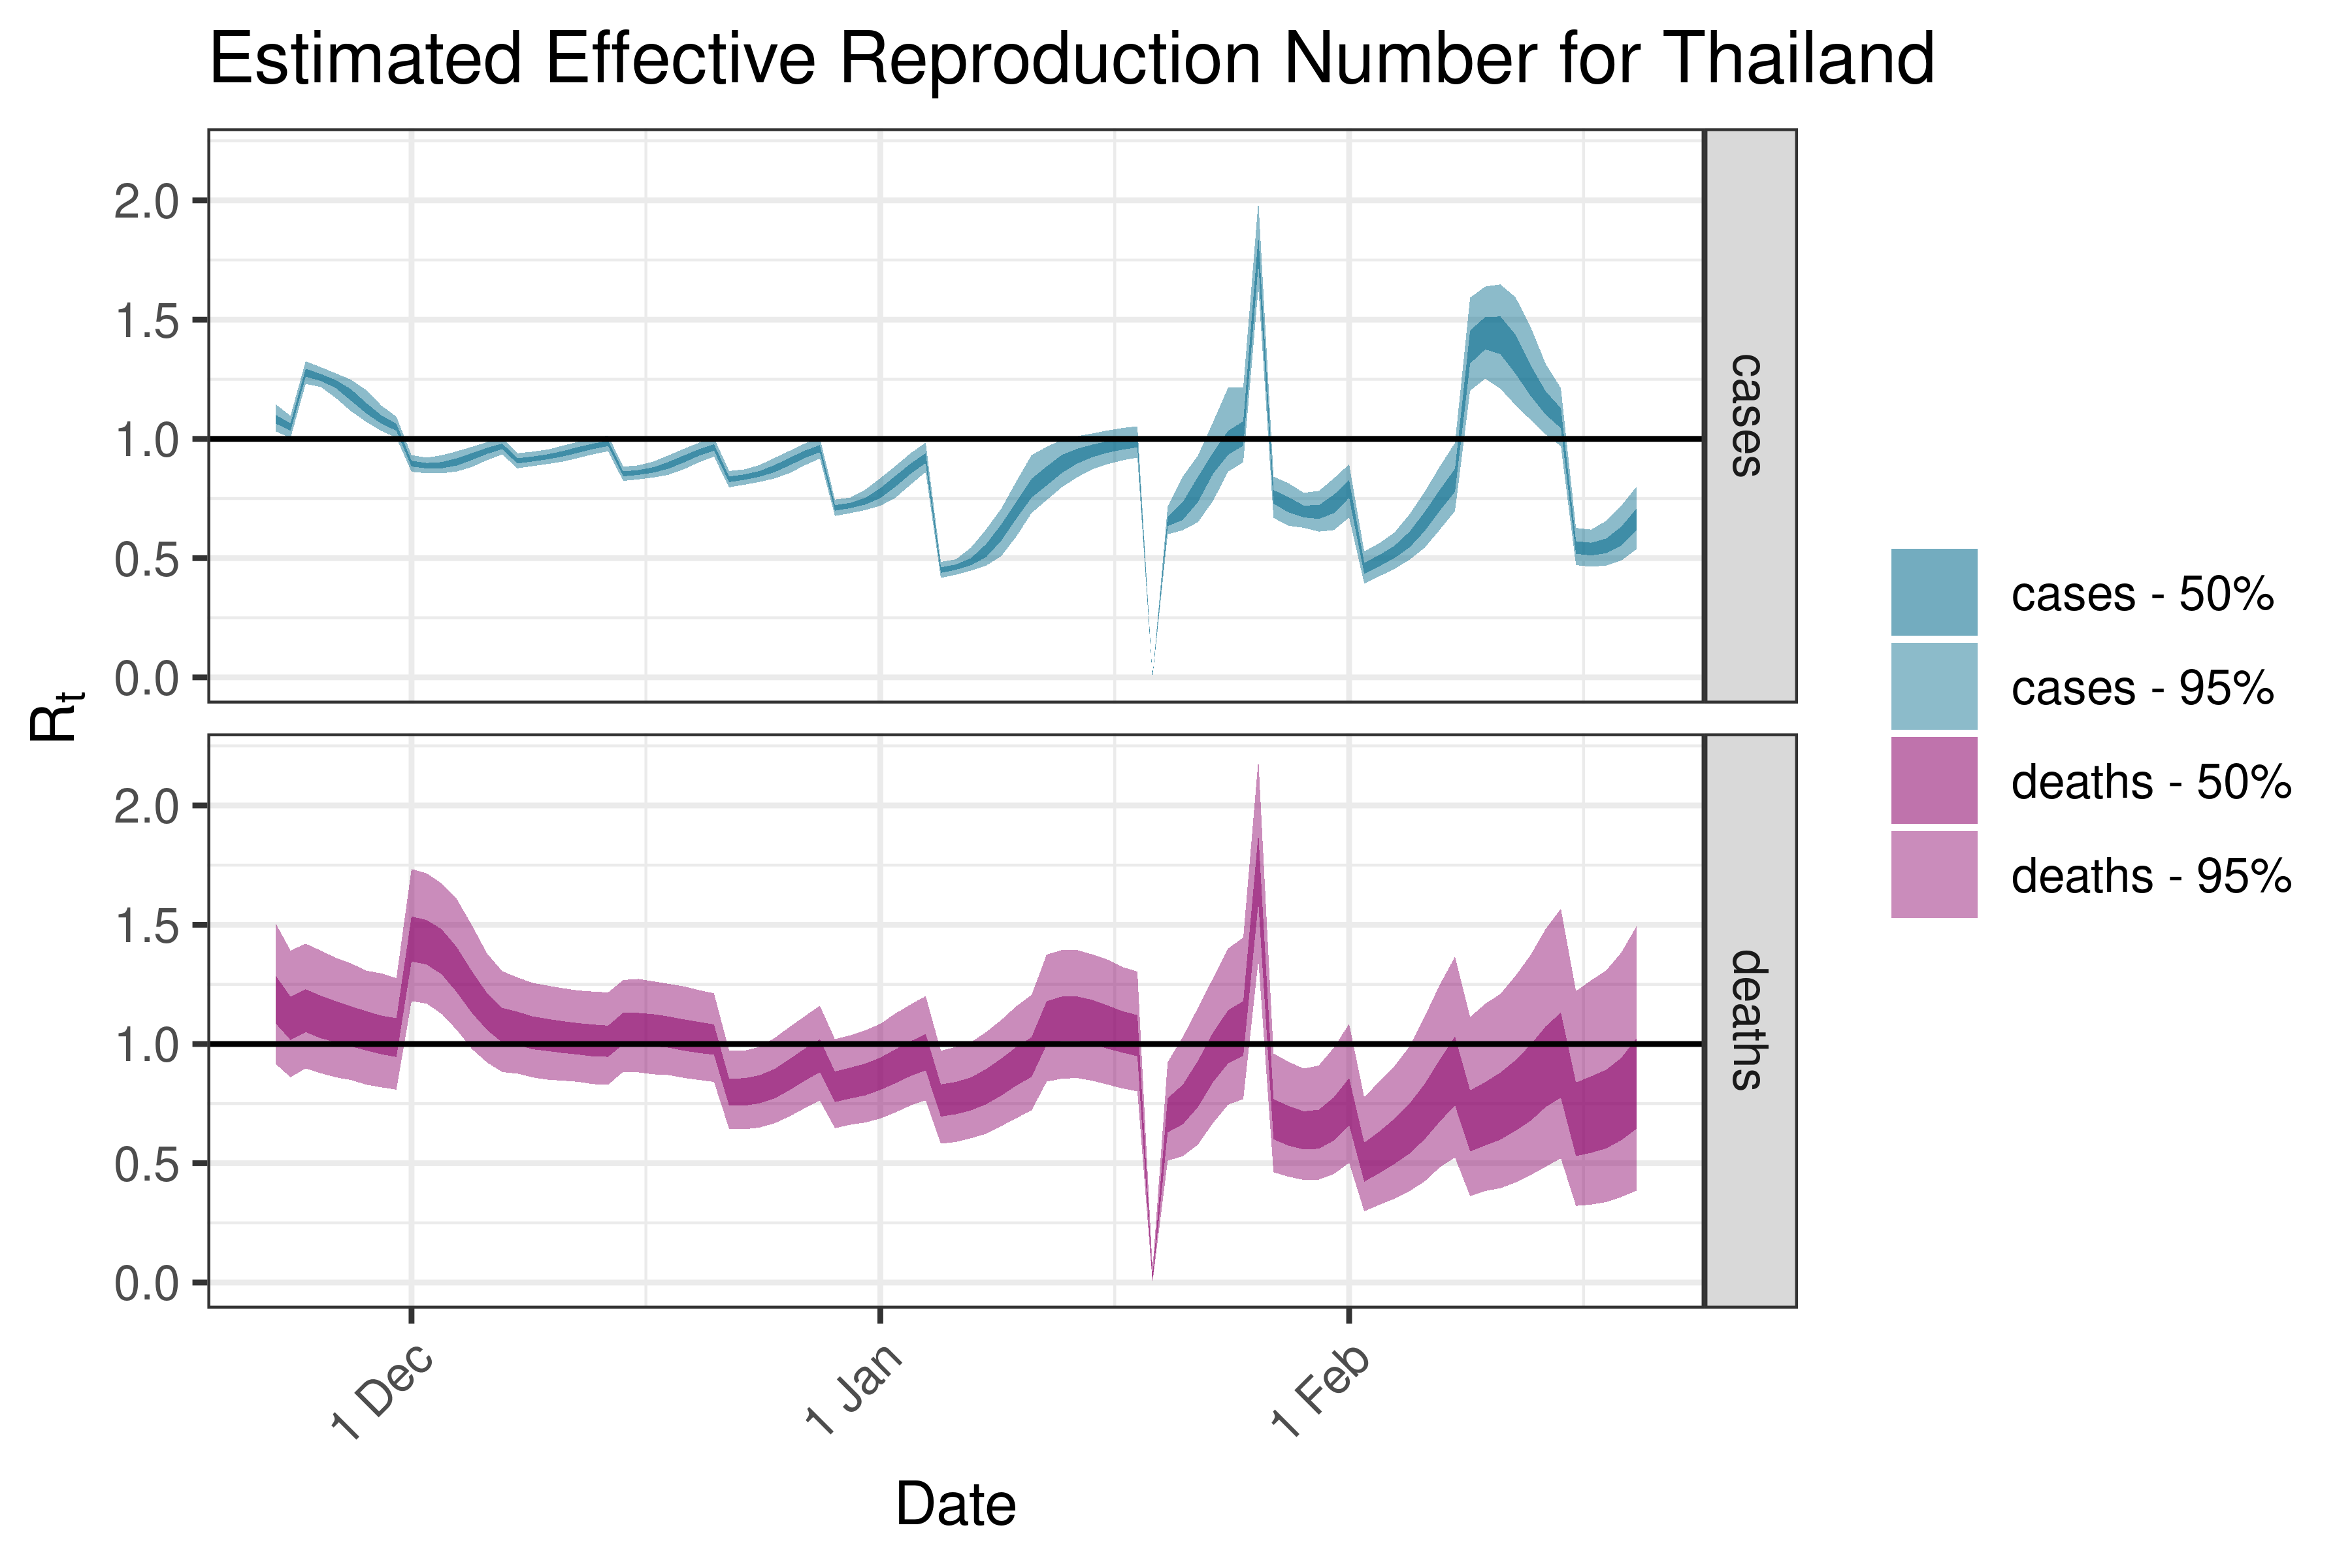
6.5.2.36 Thailand
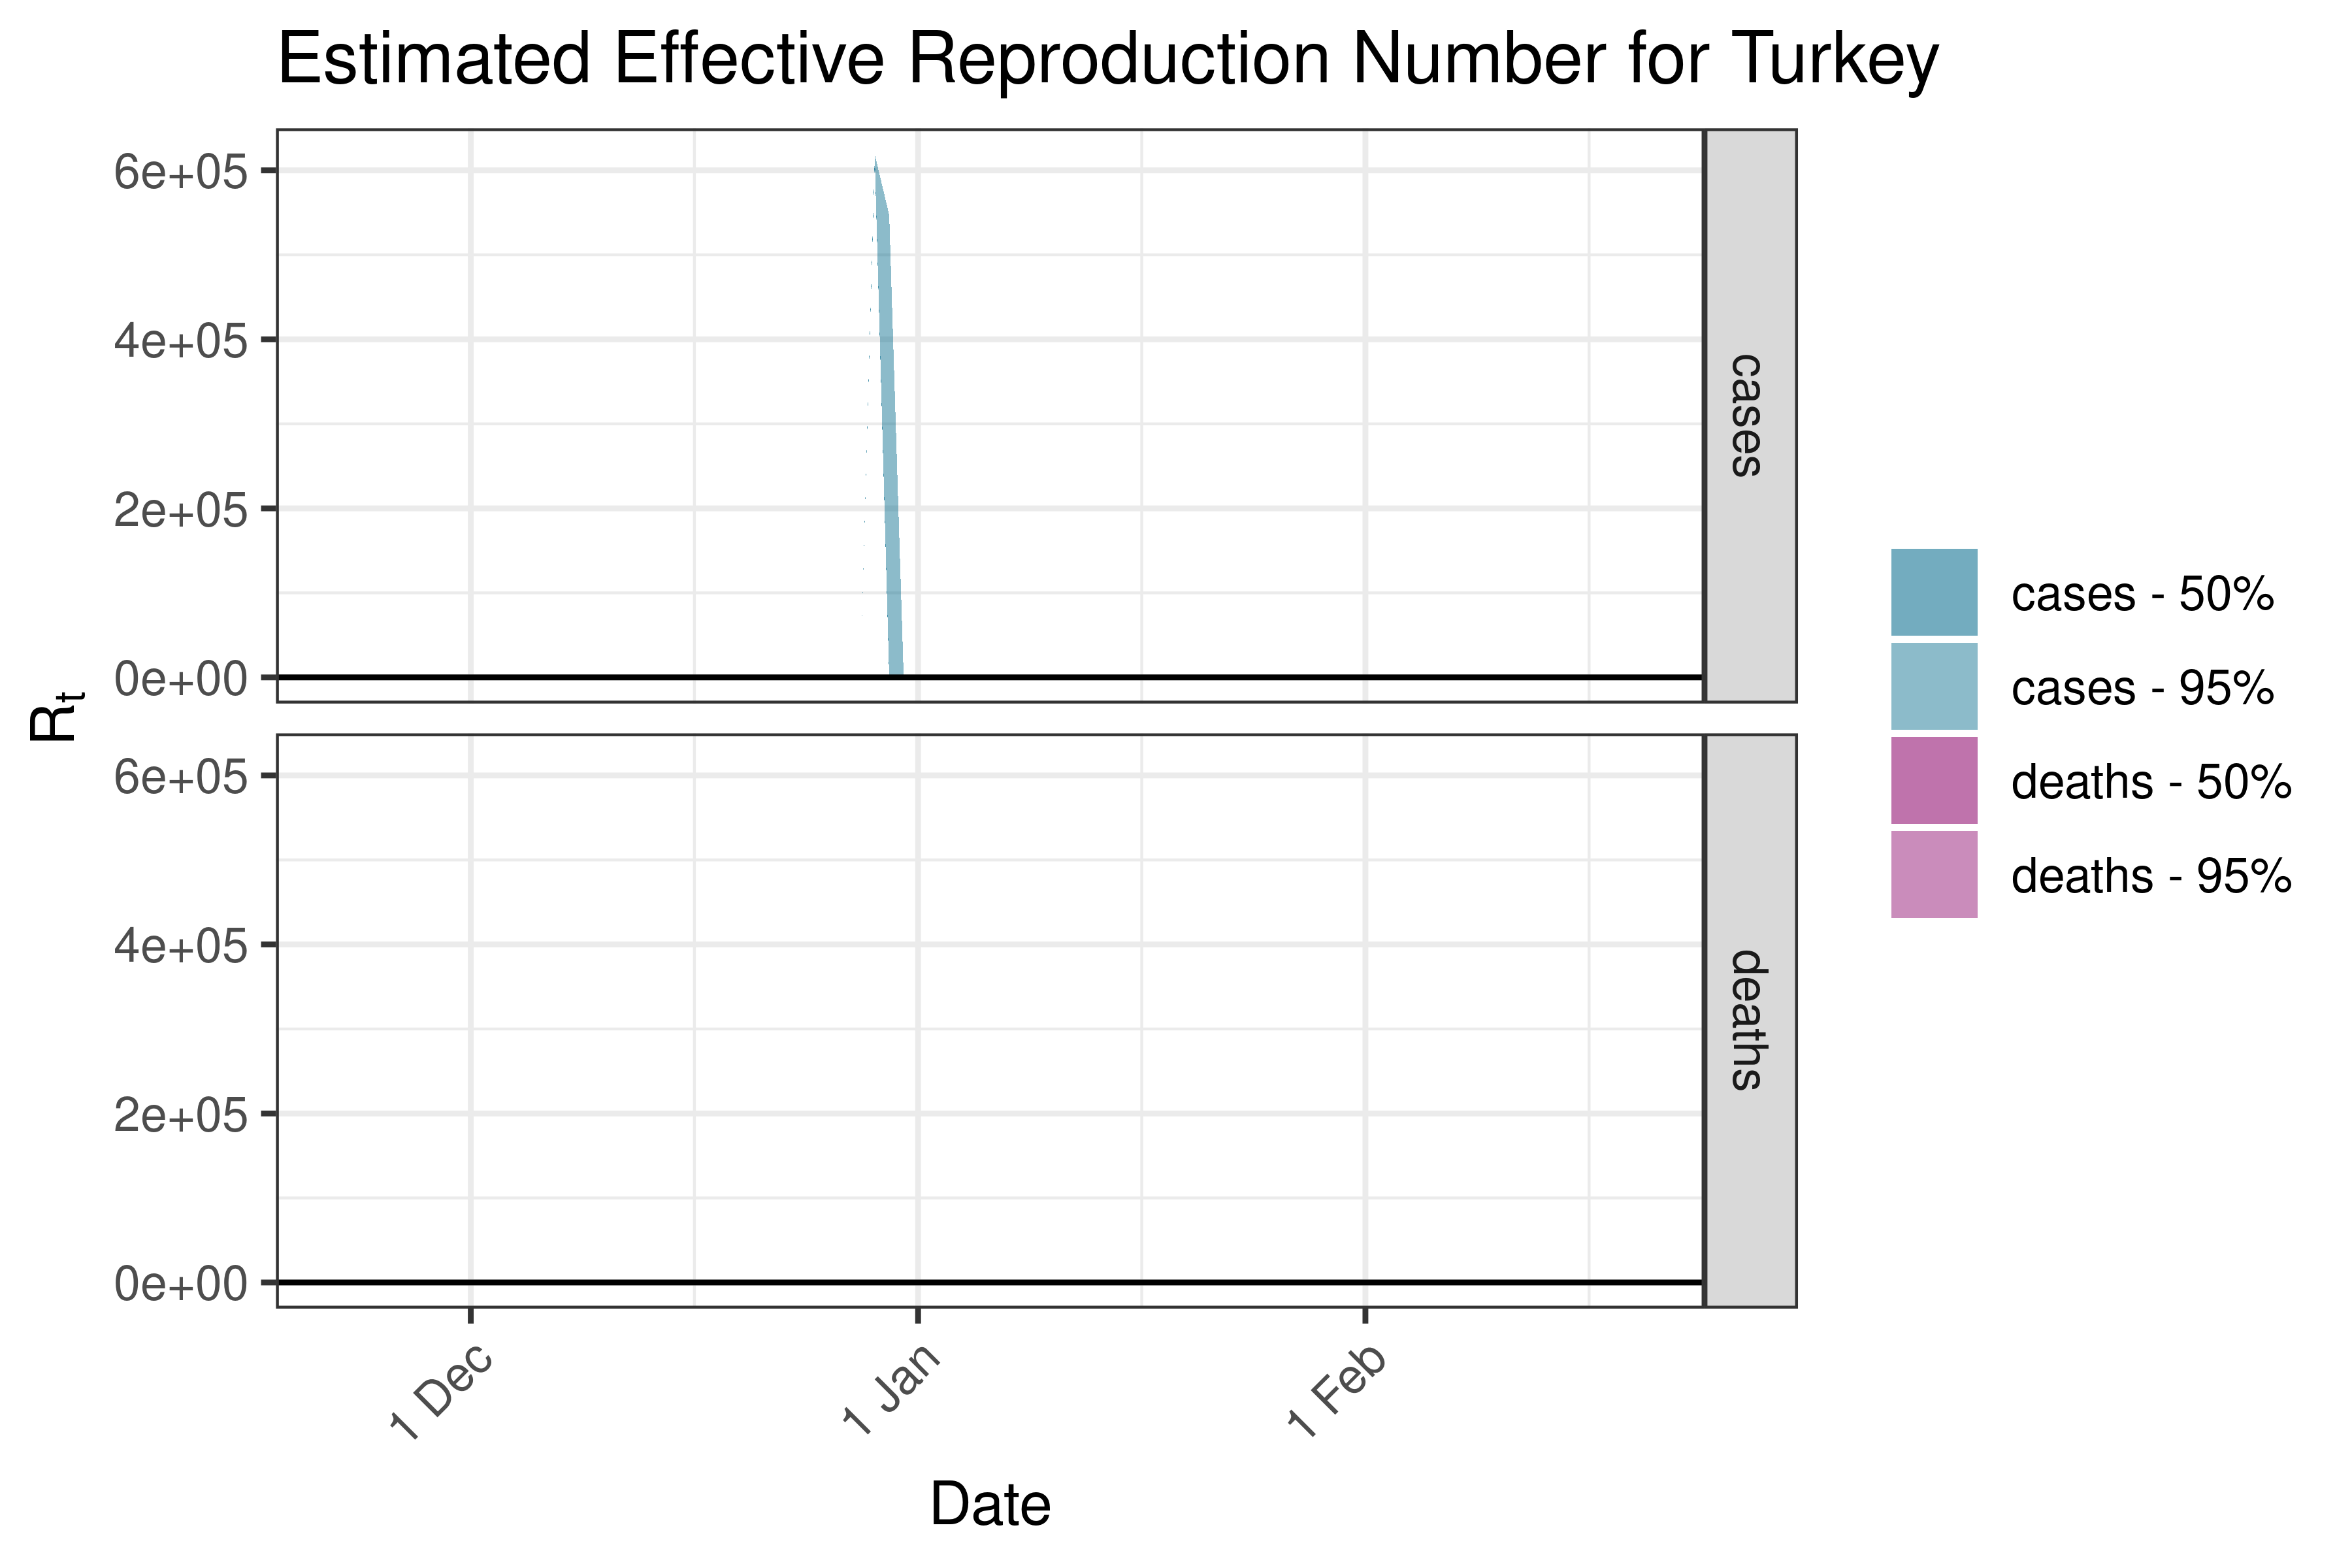
6.5.2.37 Turkey
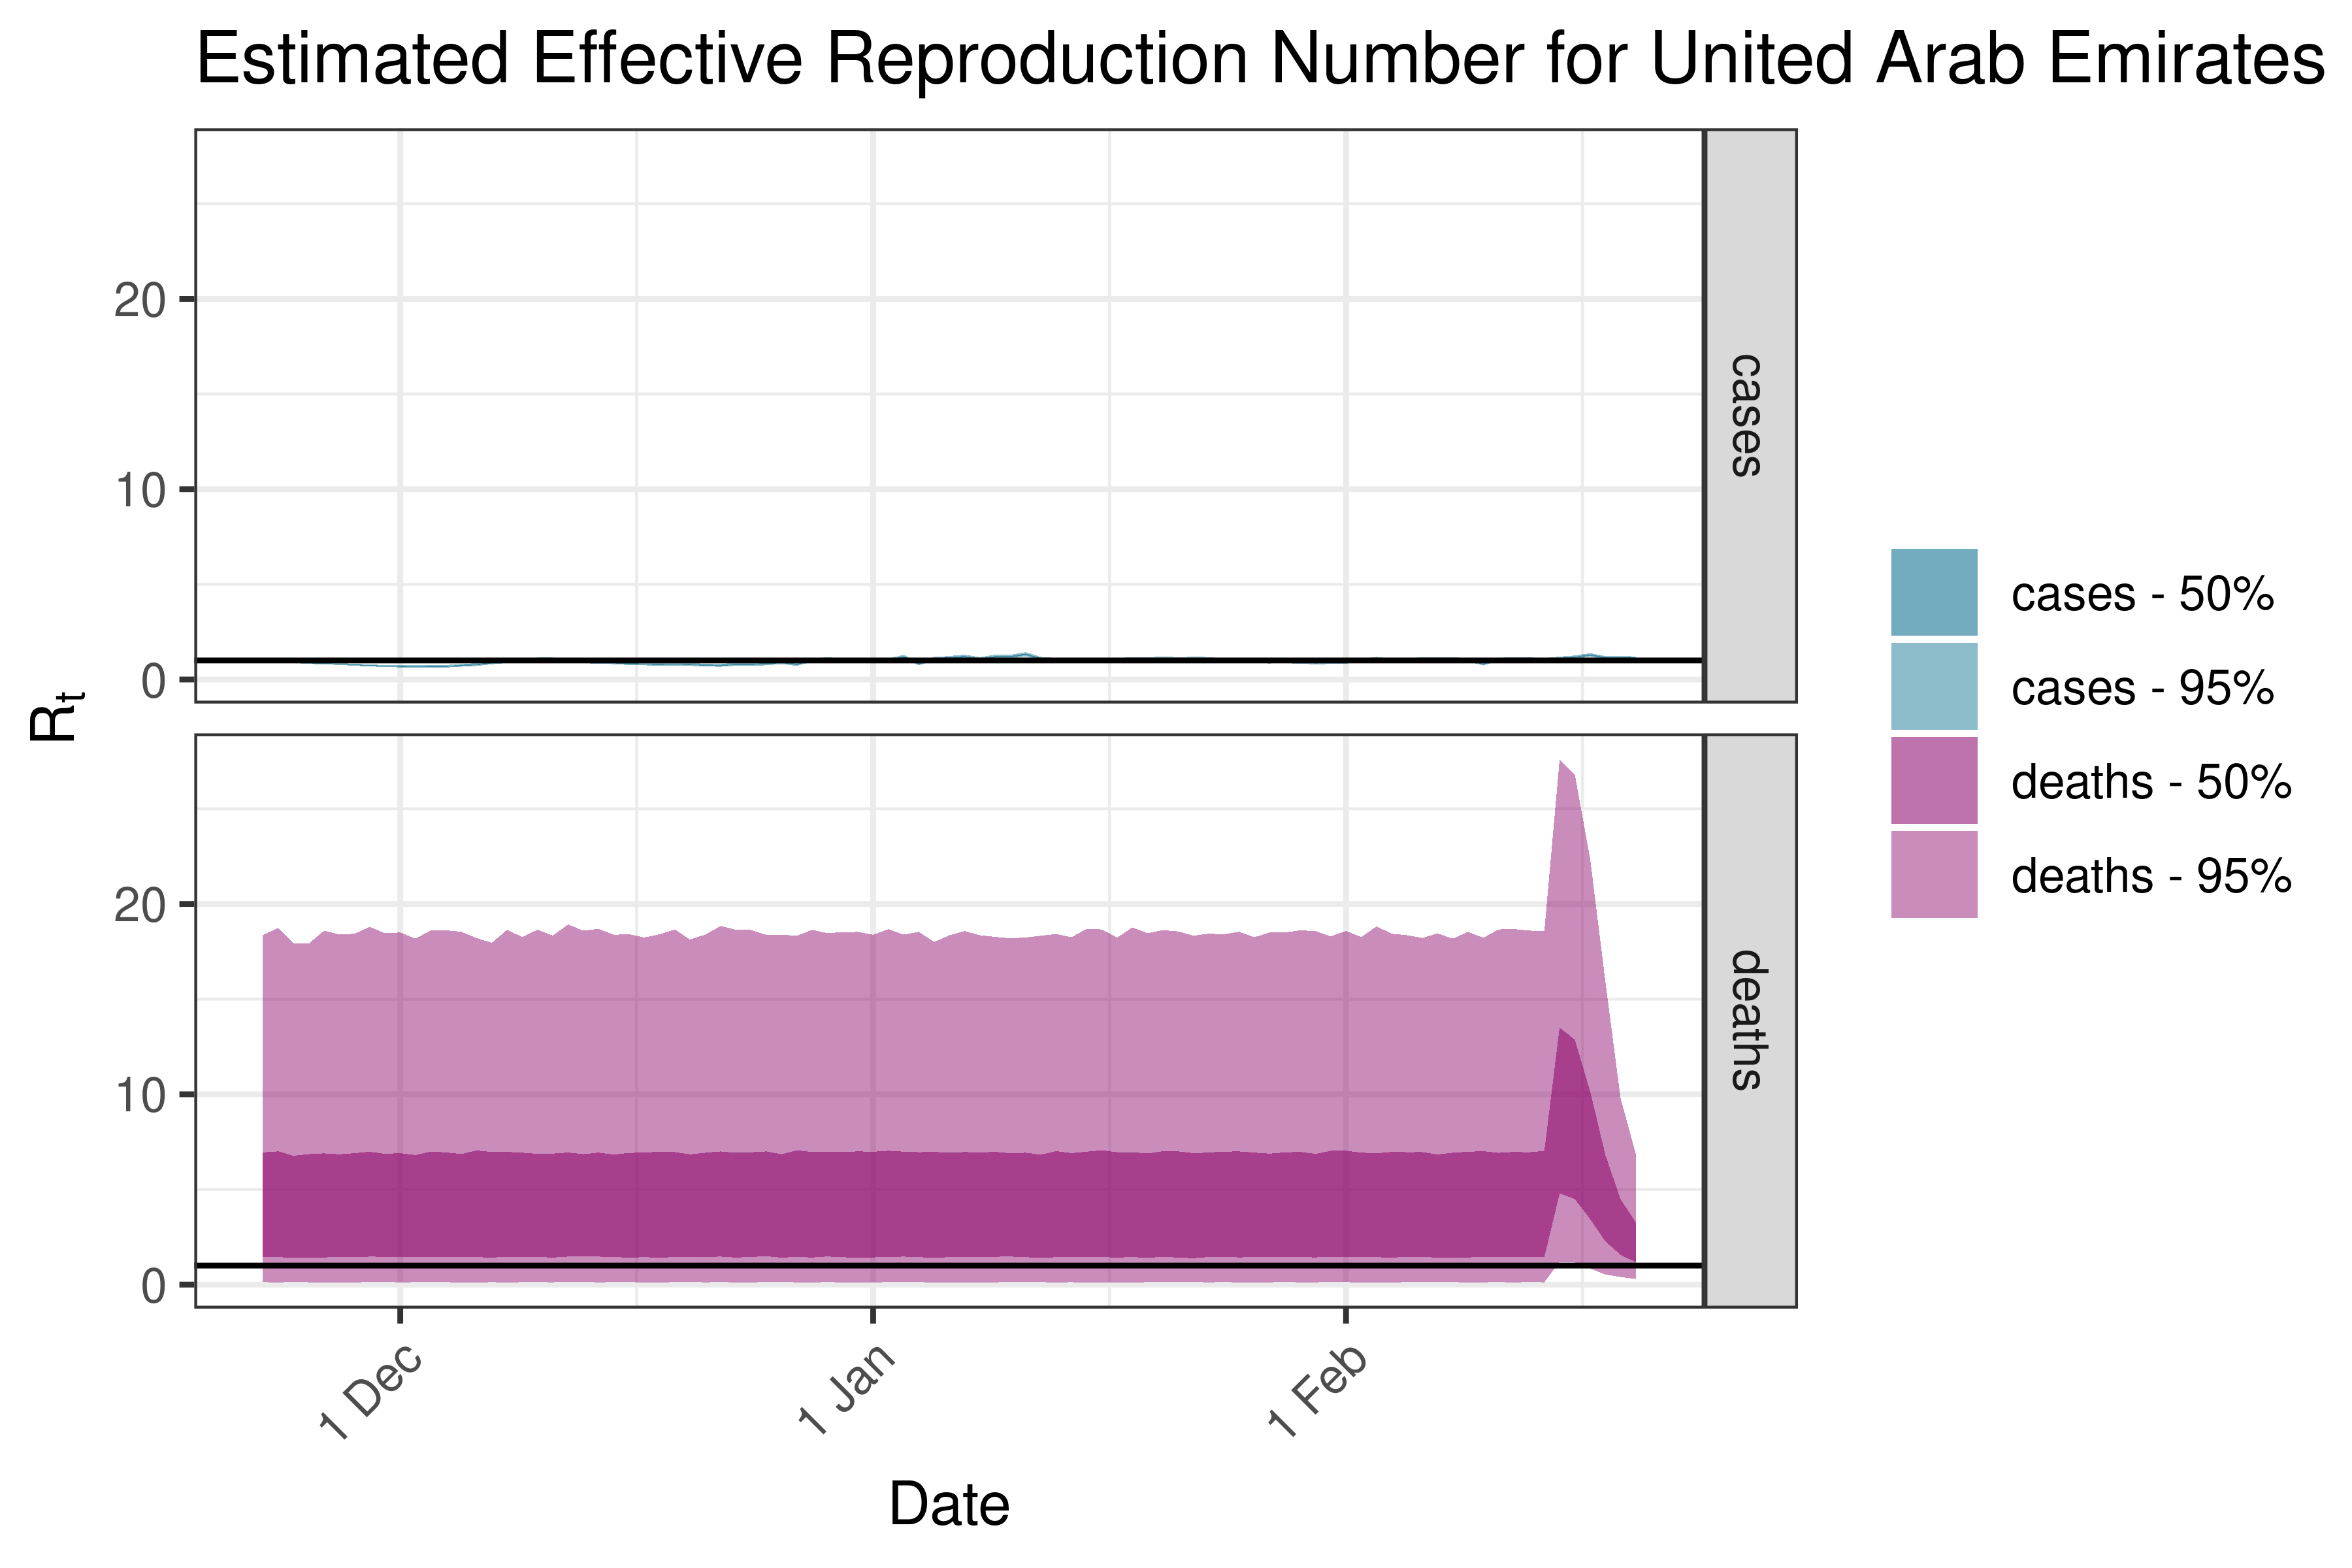
6.5.2.38 United Arab Emirates
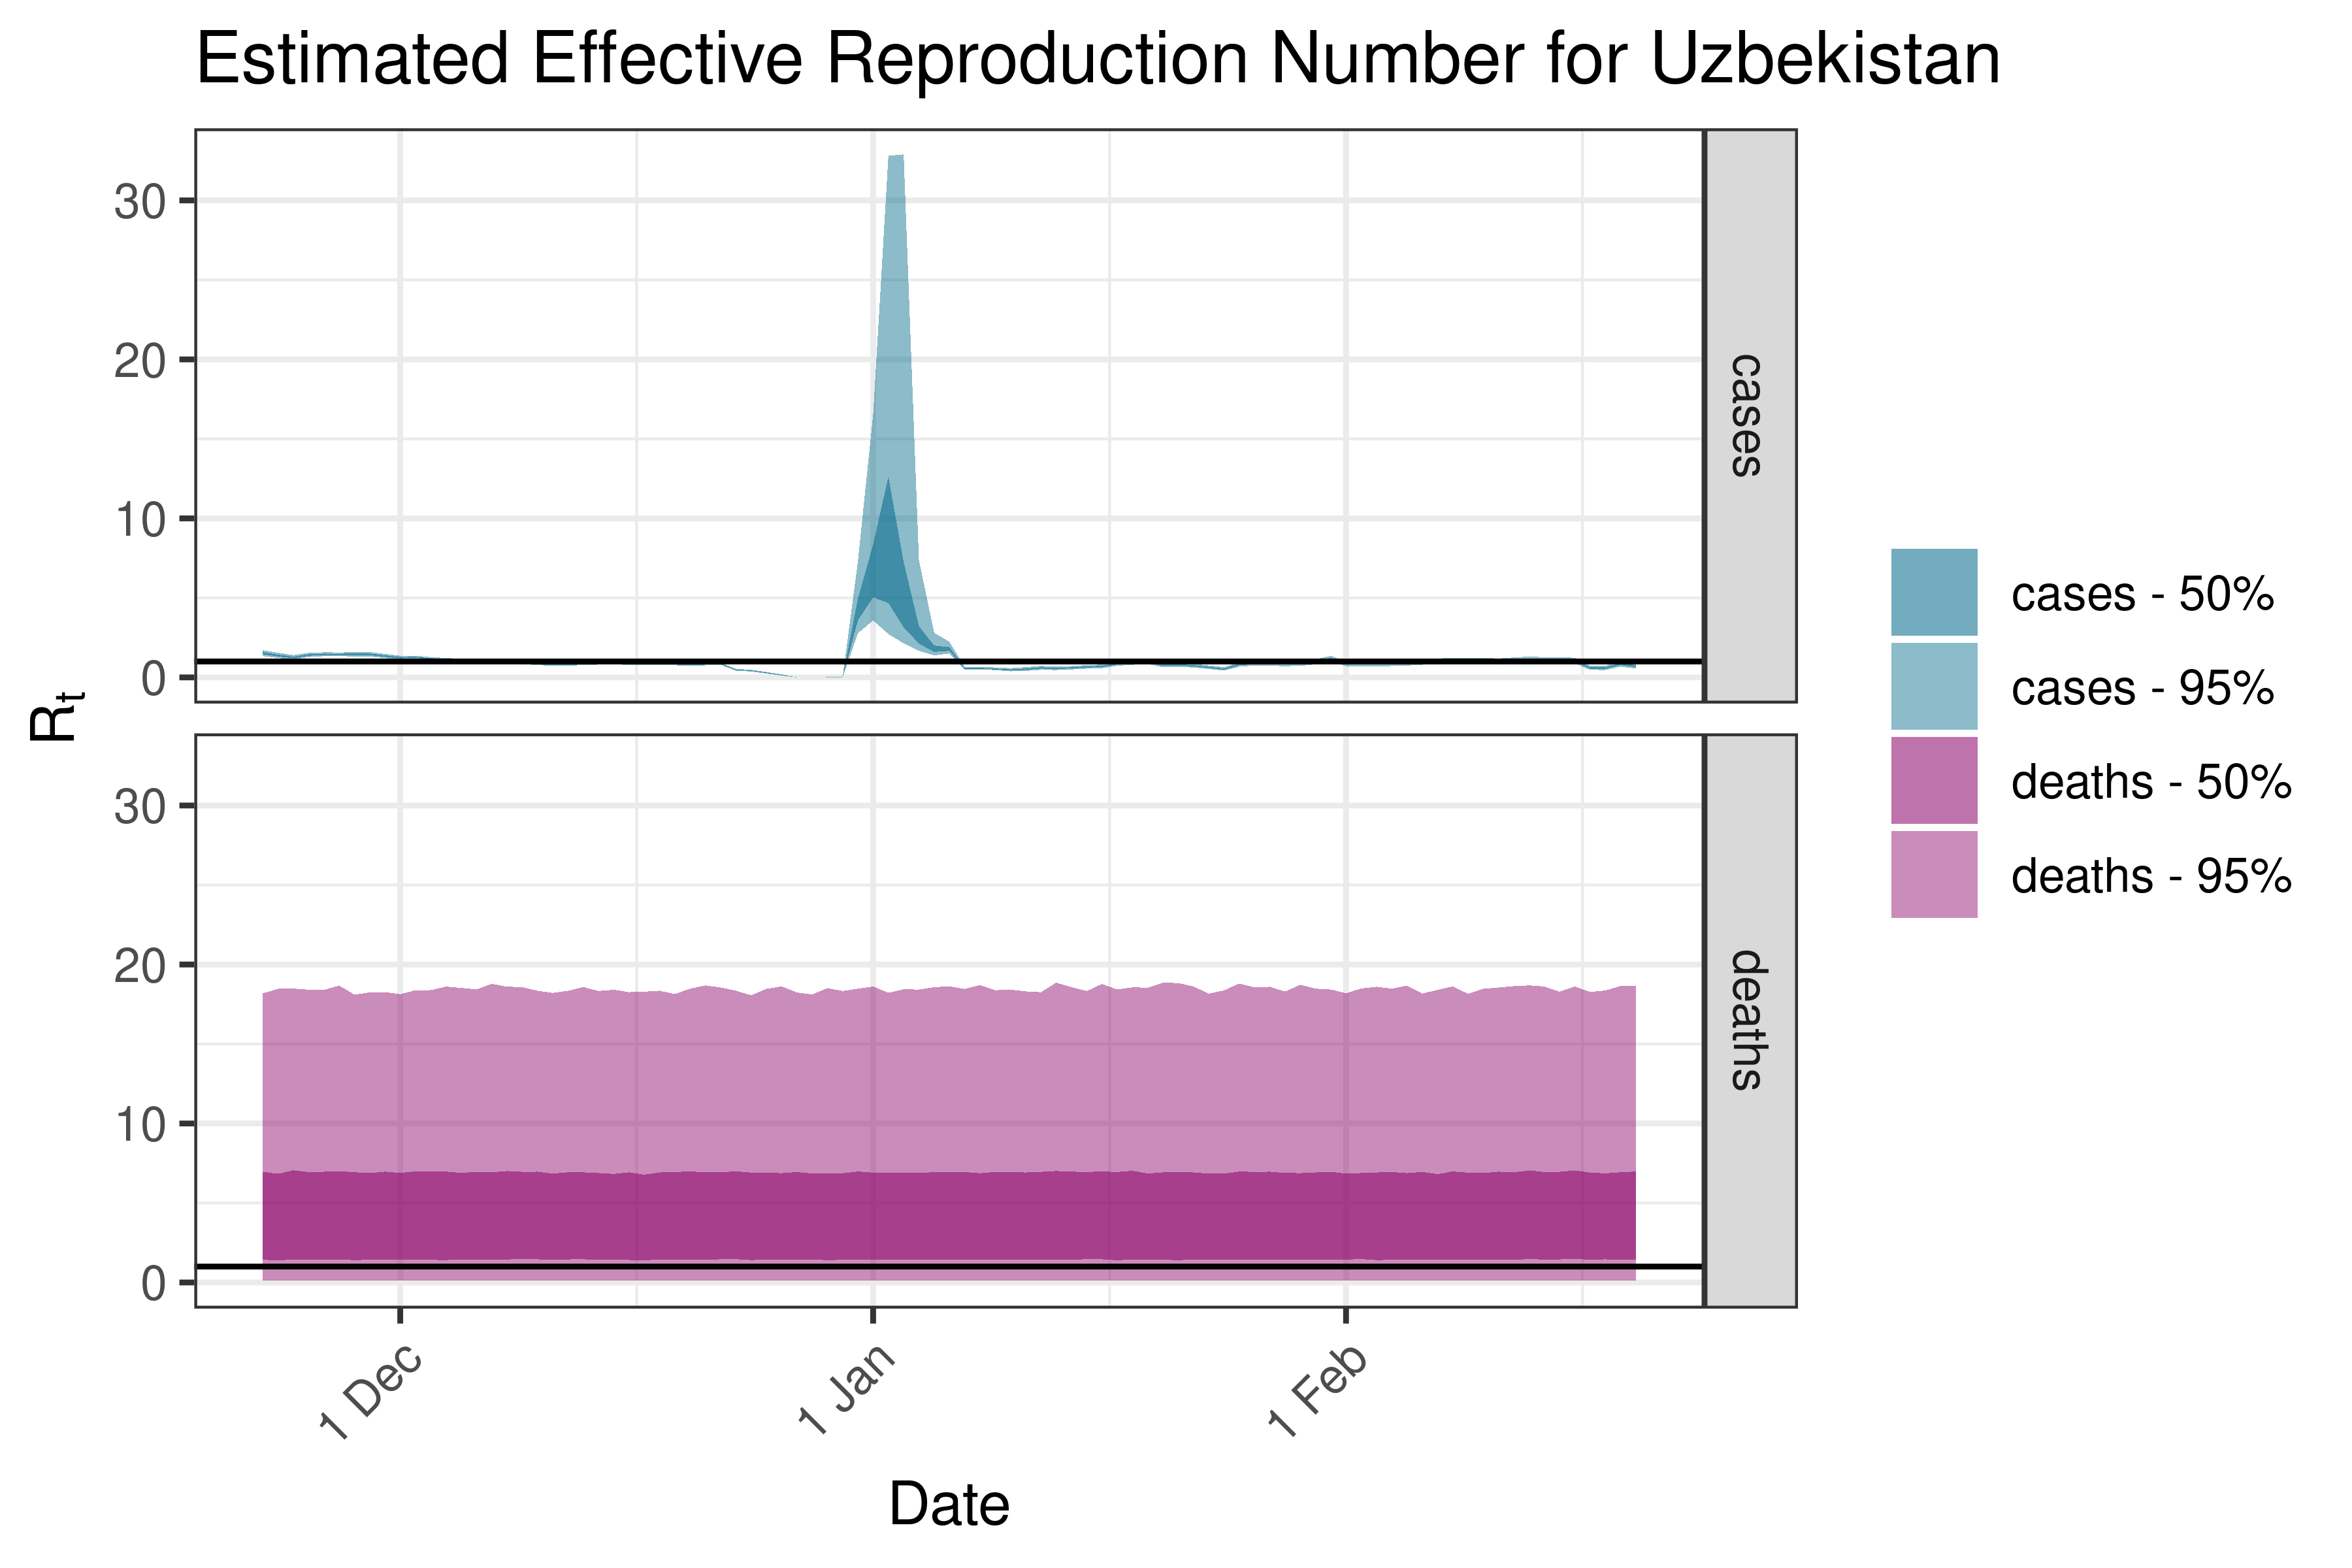
6.5.2.39 Uzbekistan
6.5.2.40 Vietnam
6.5.3 Europe
6.5.3.1 Albania
6.5.3.2 Austria
6.5.3.3 Belgium
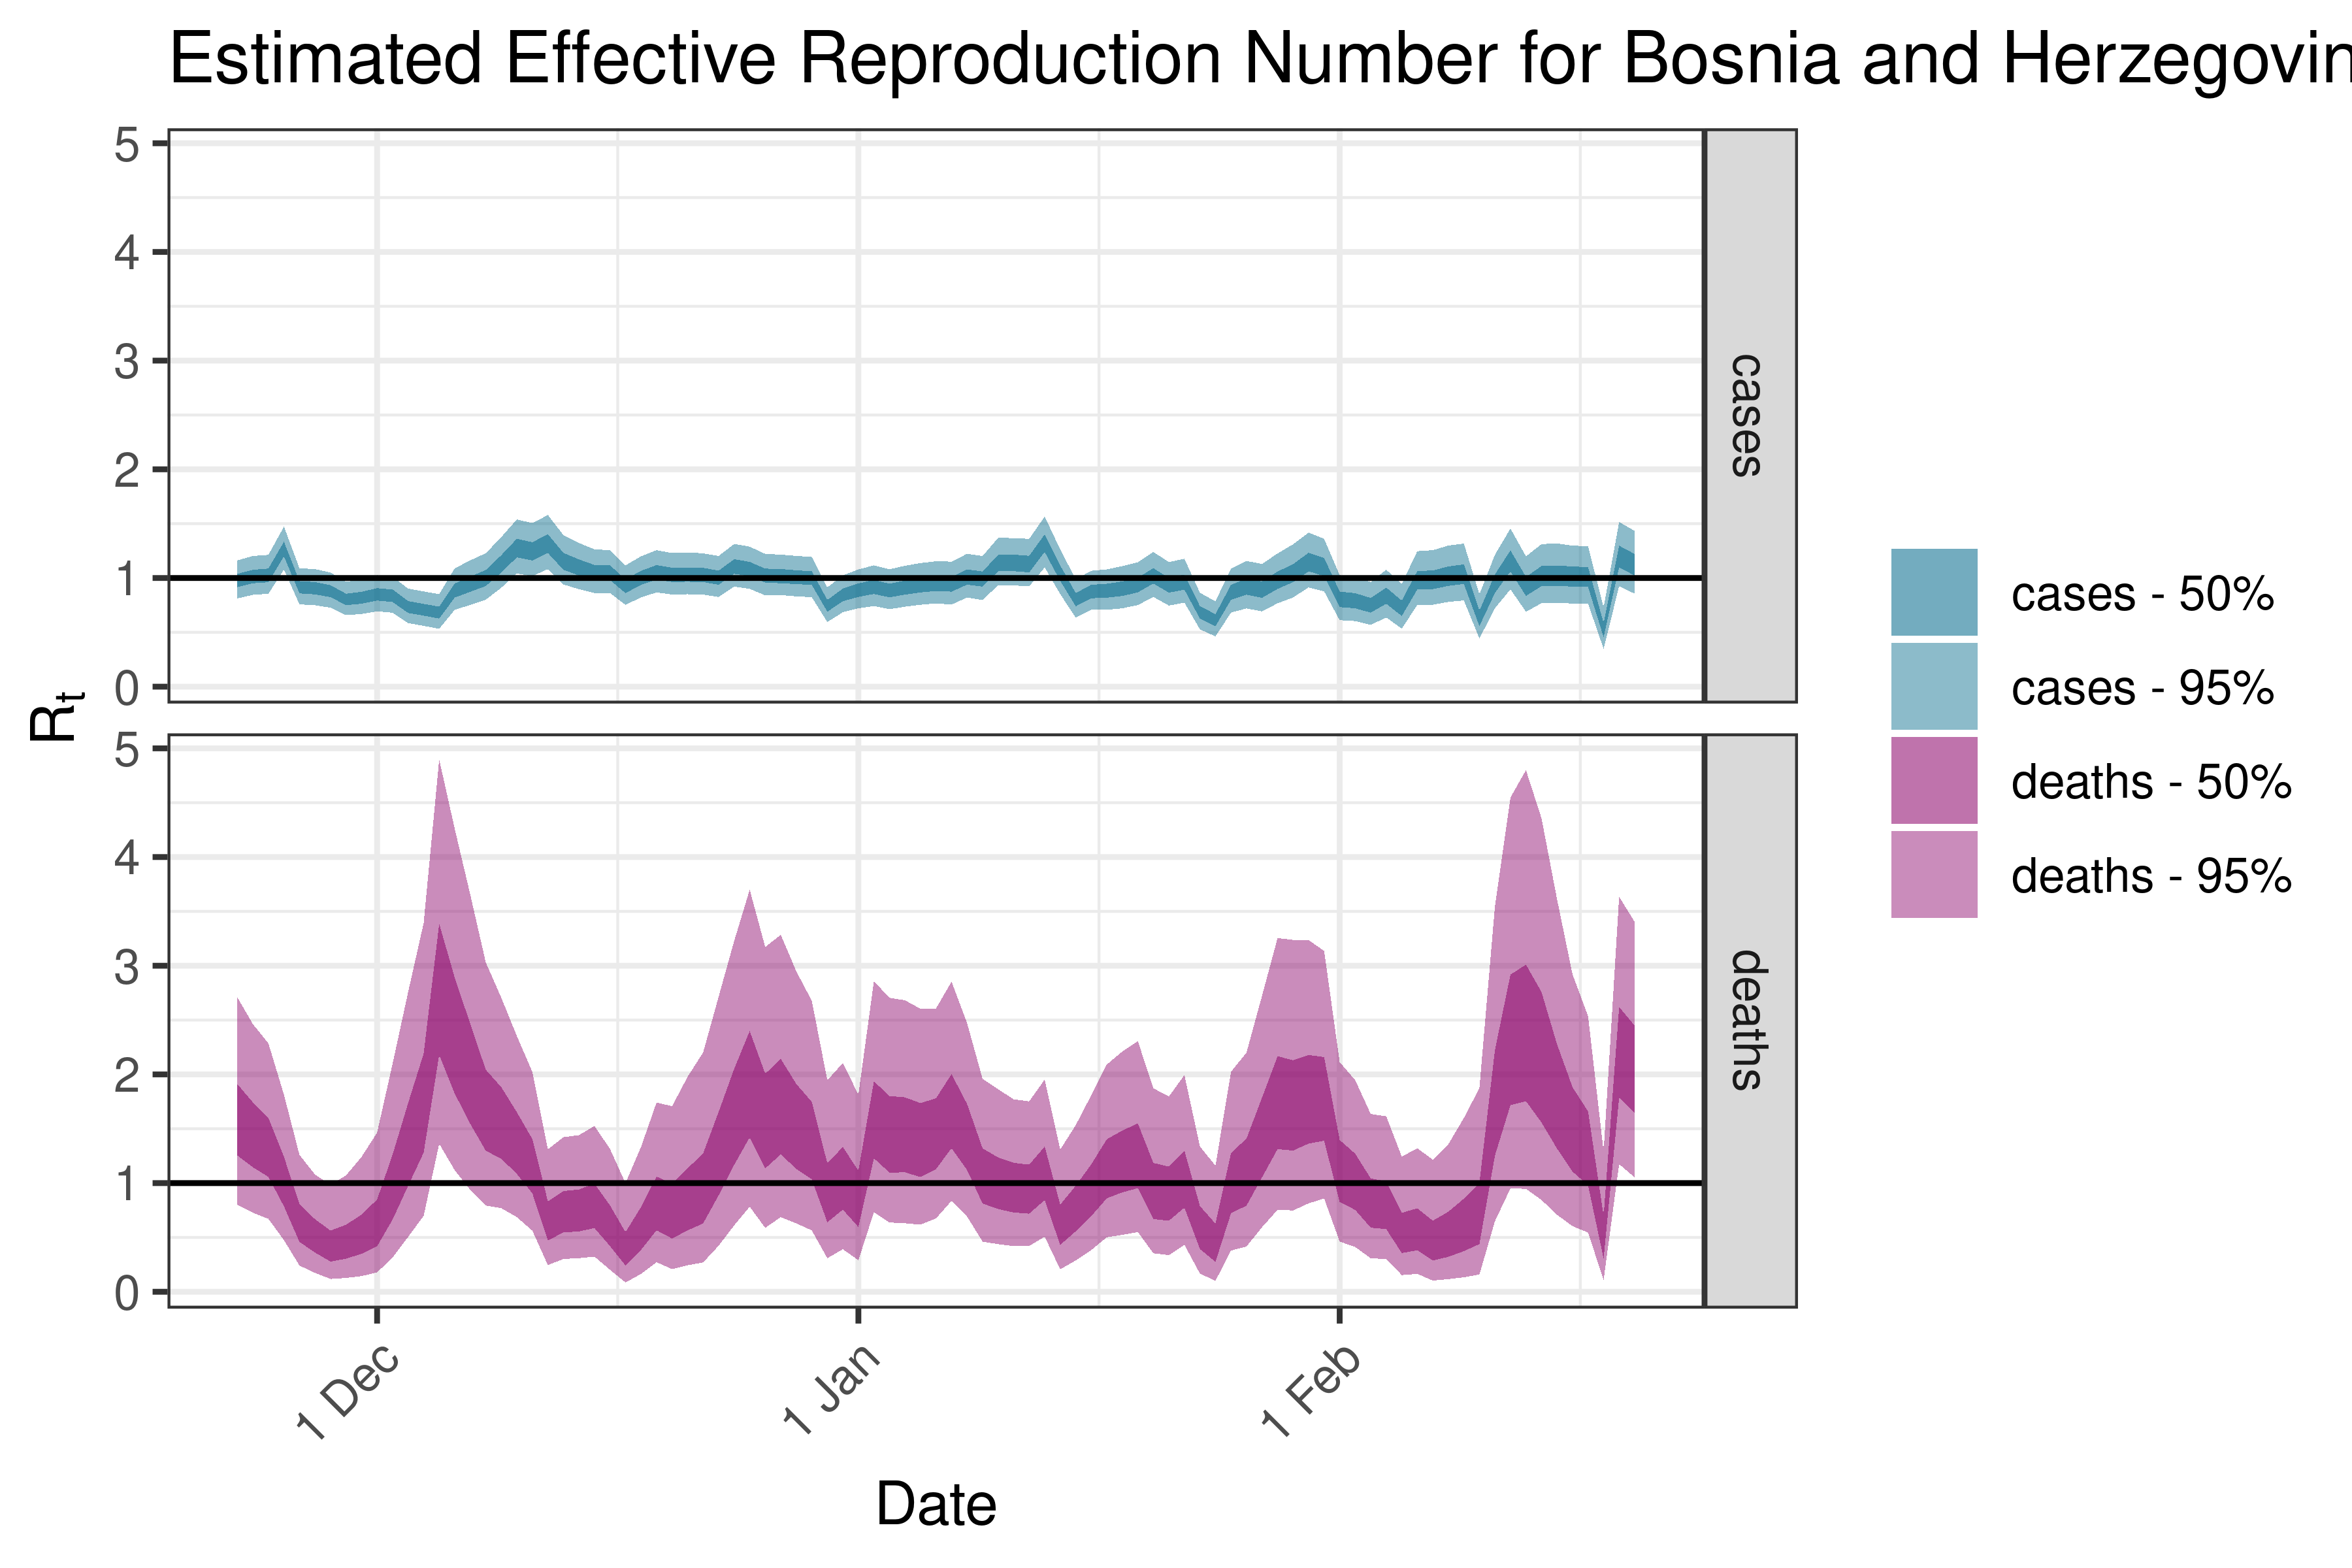
6.5.3.4 Bosnia and Herzegovina
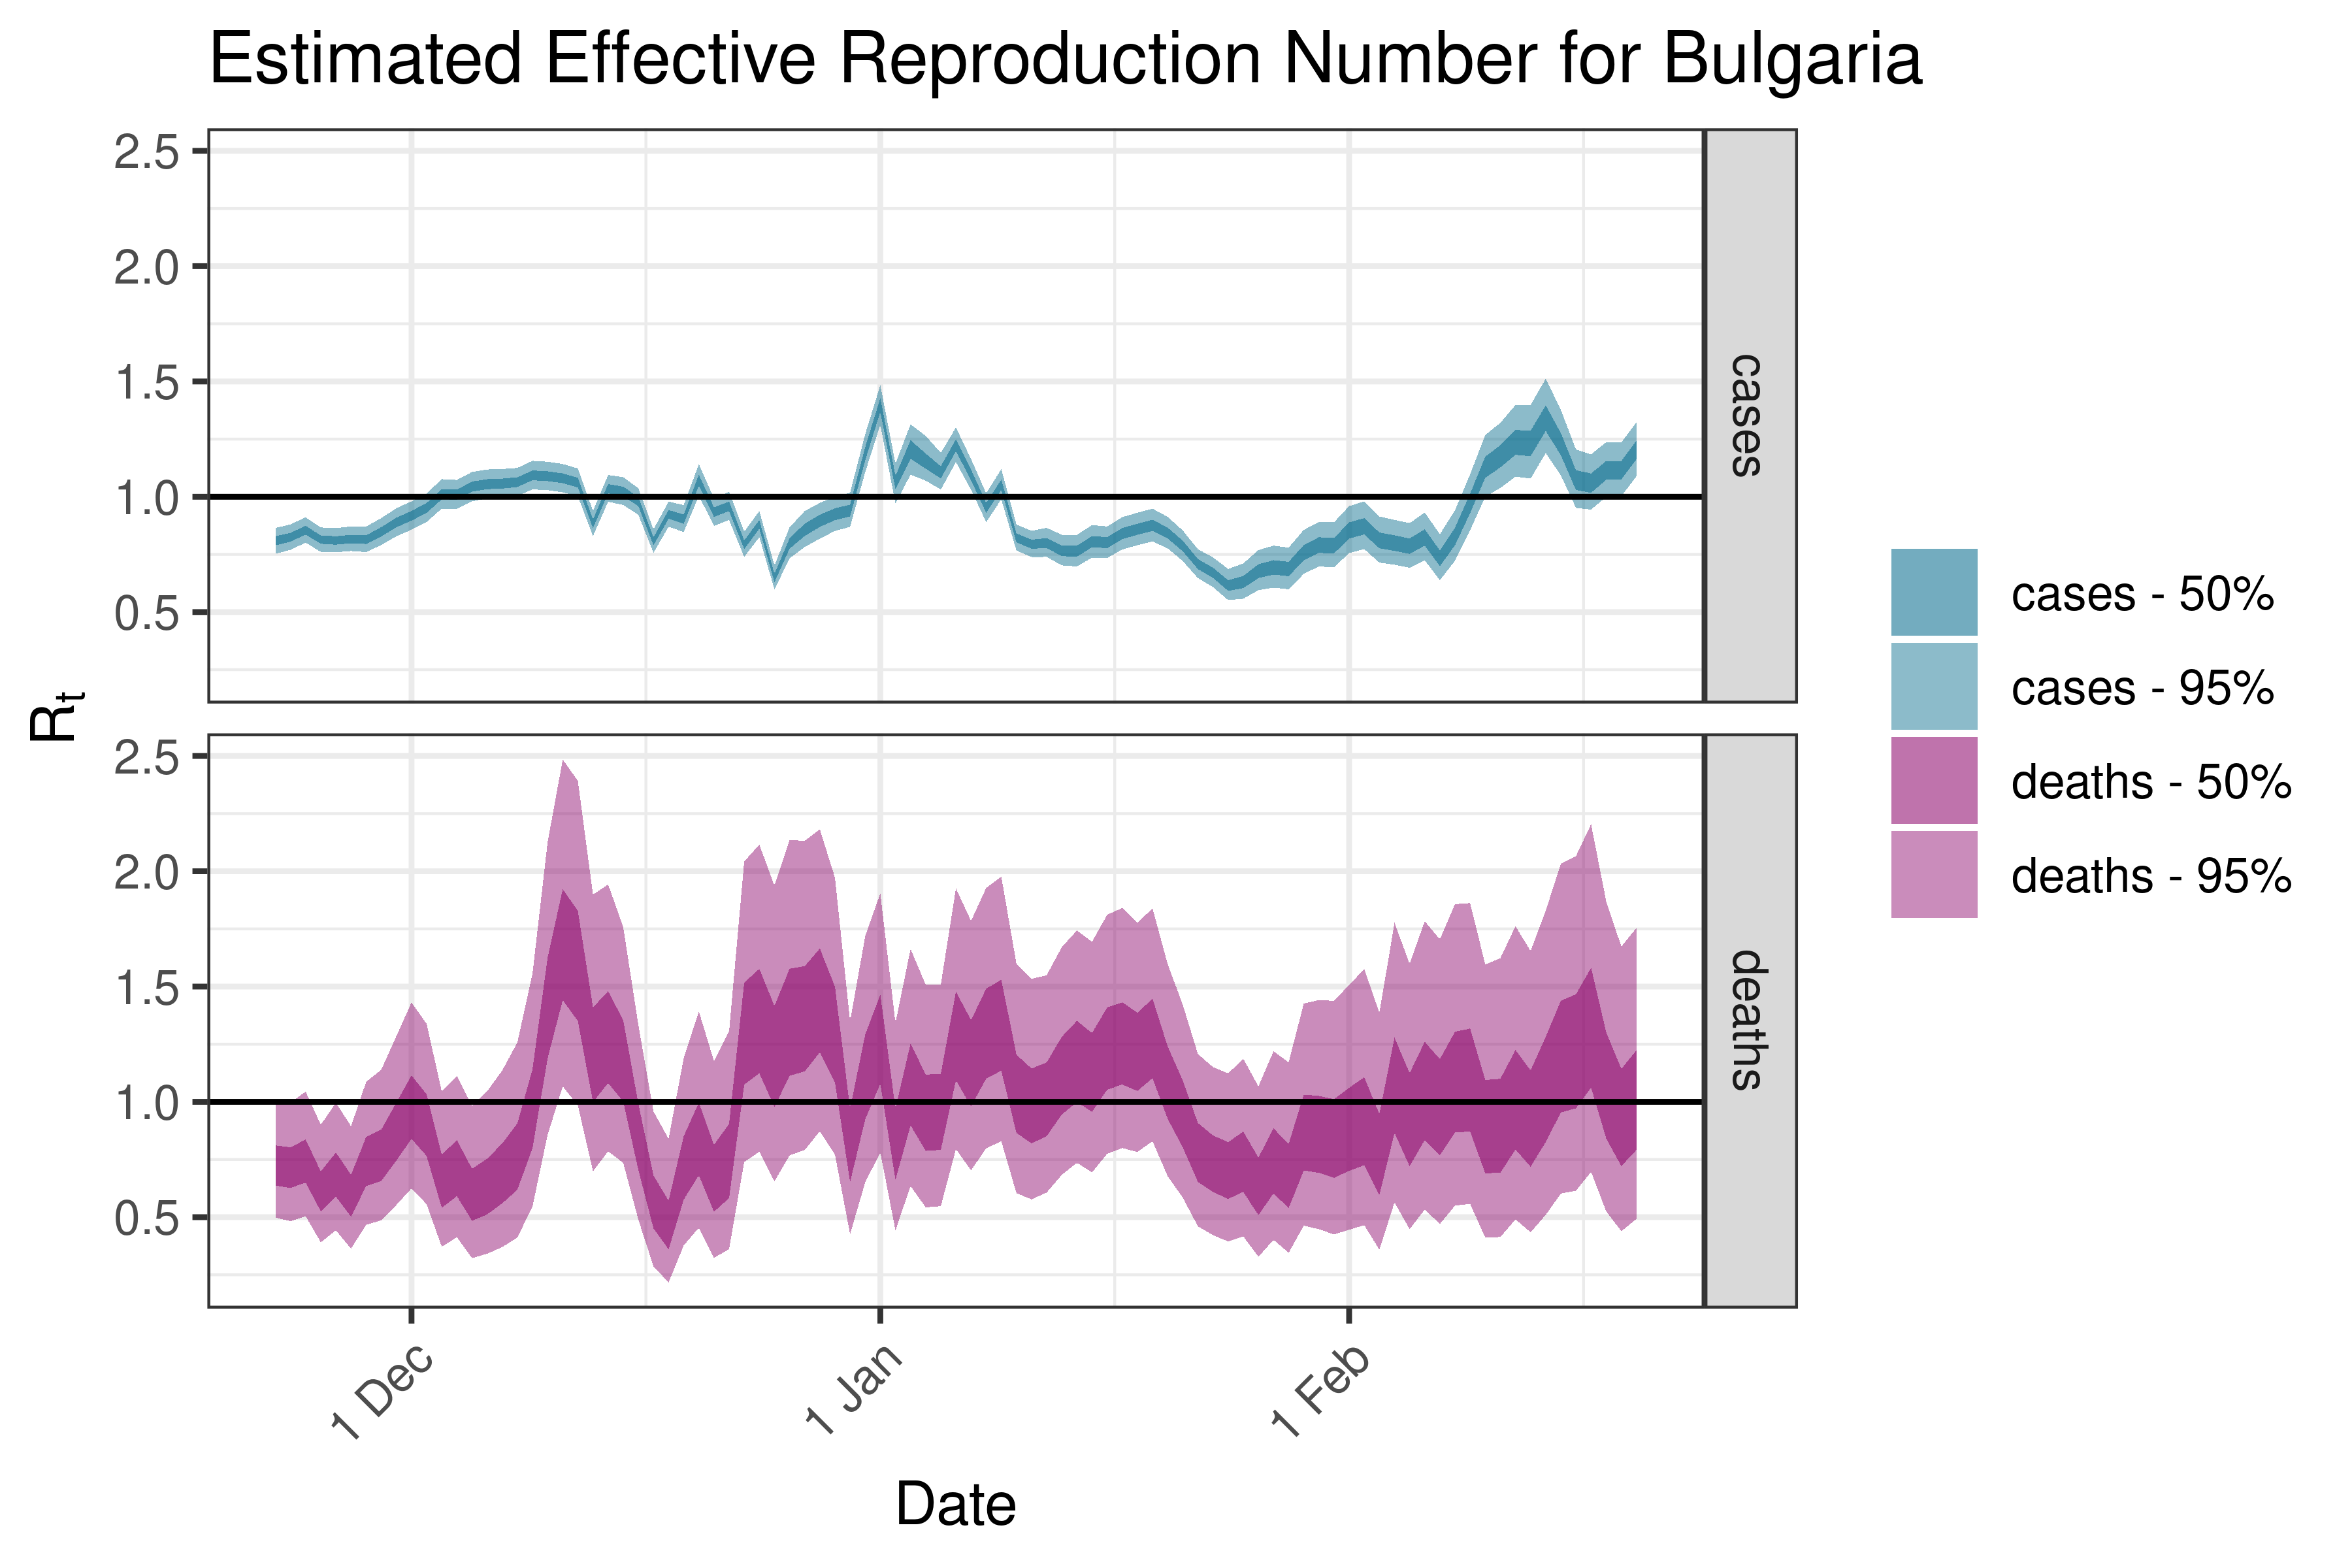
6.5.3.5 Bulgaria
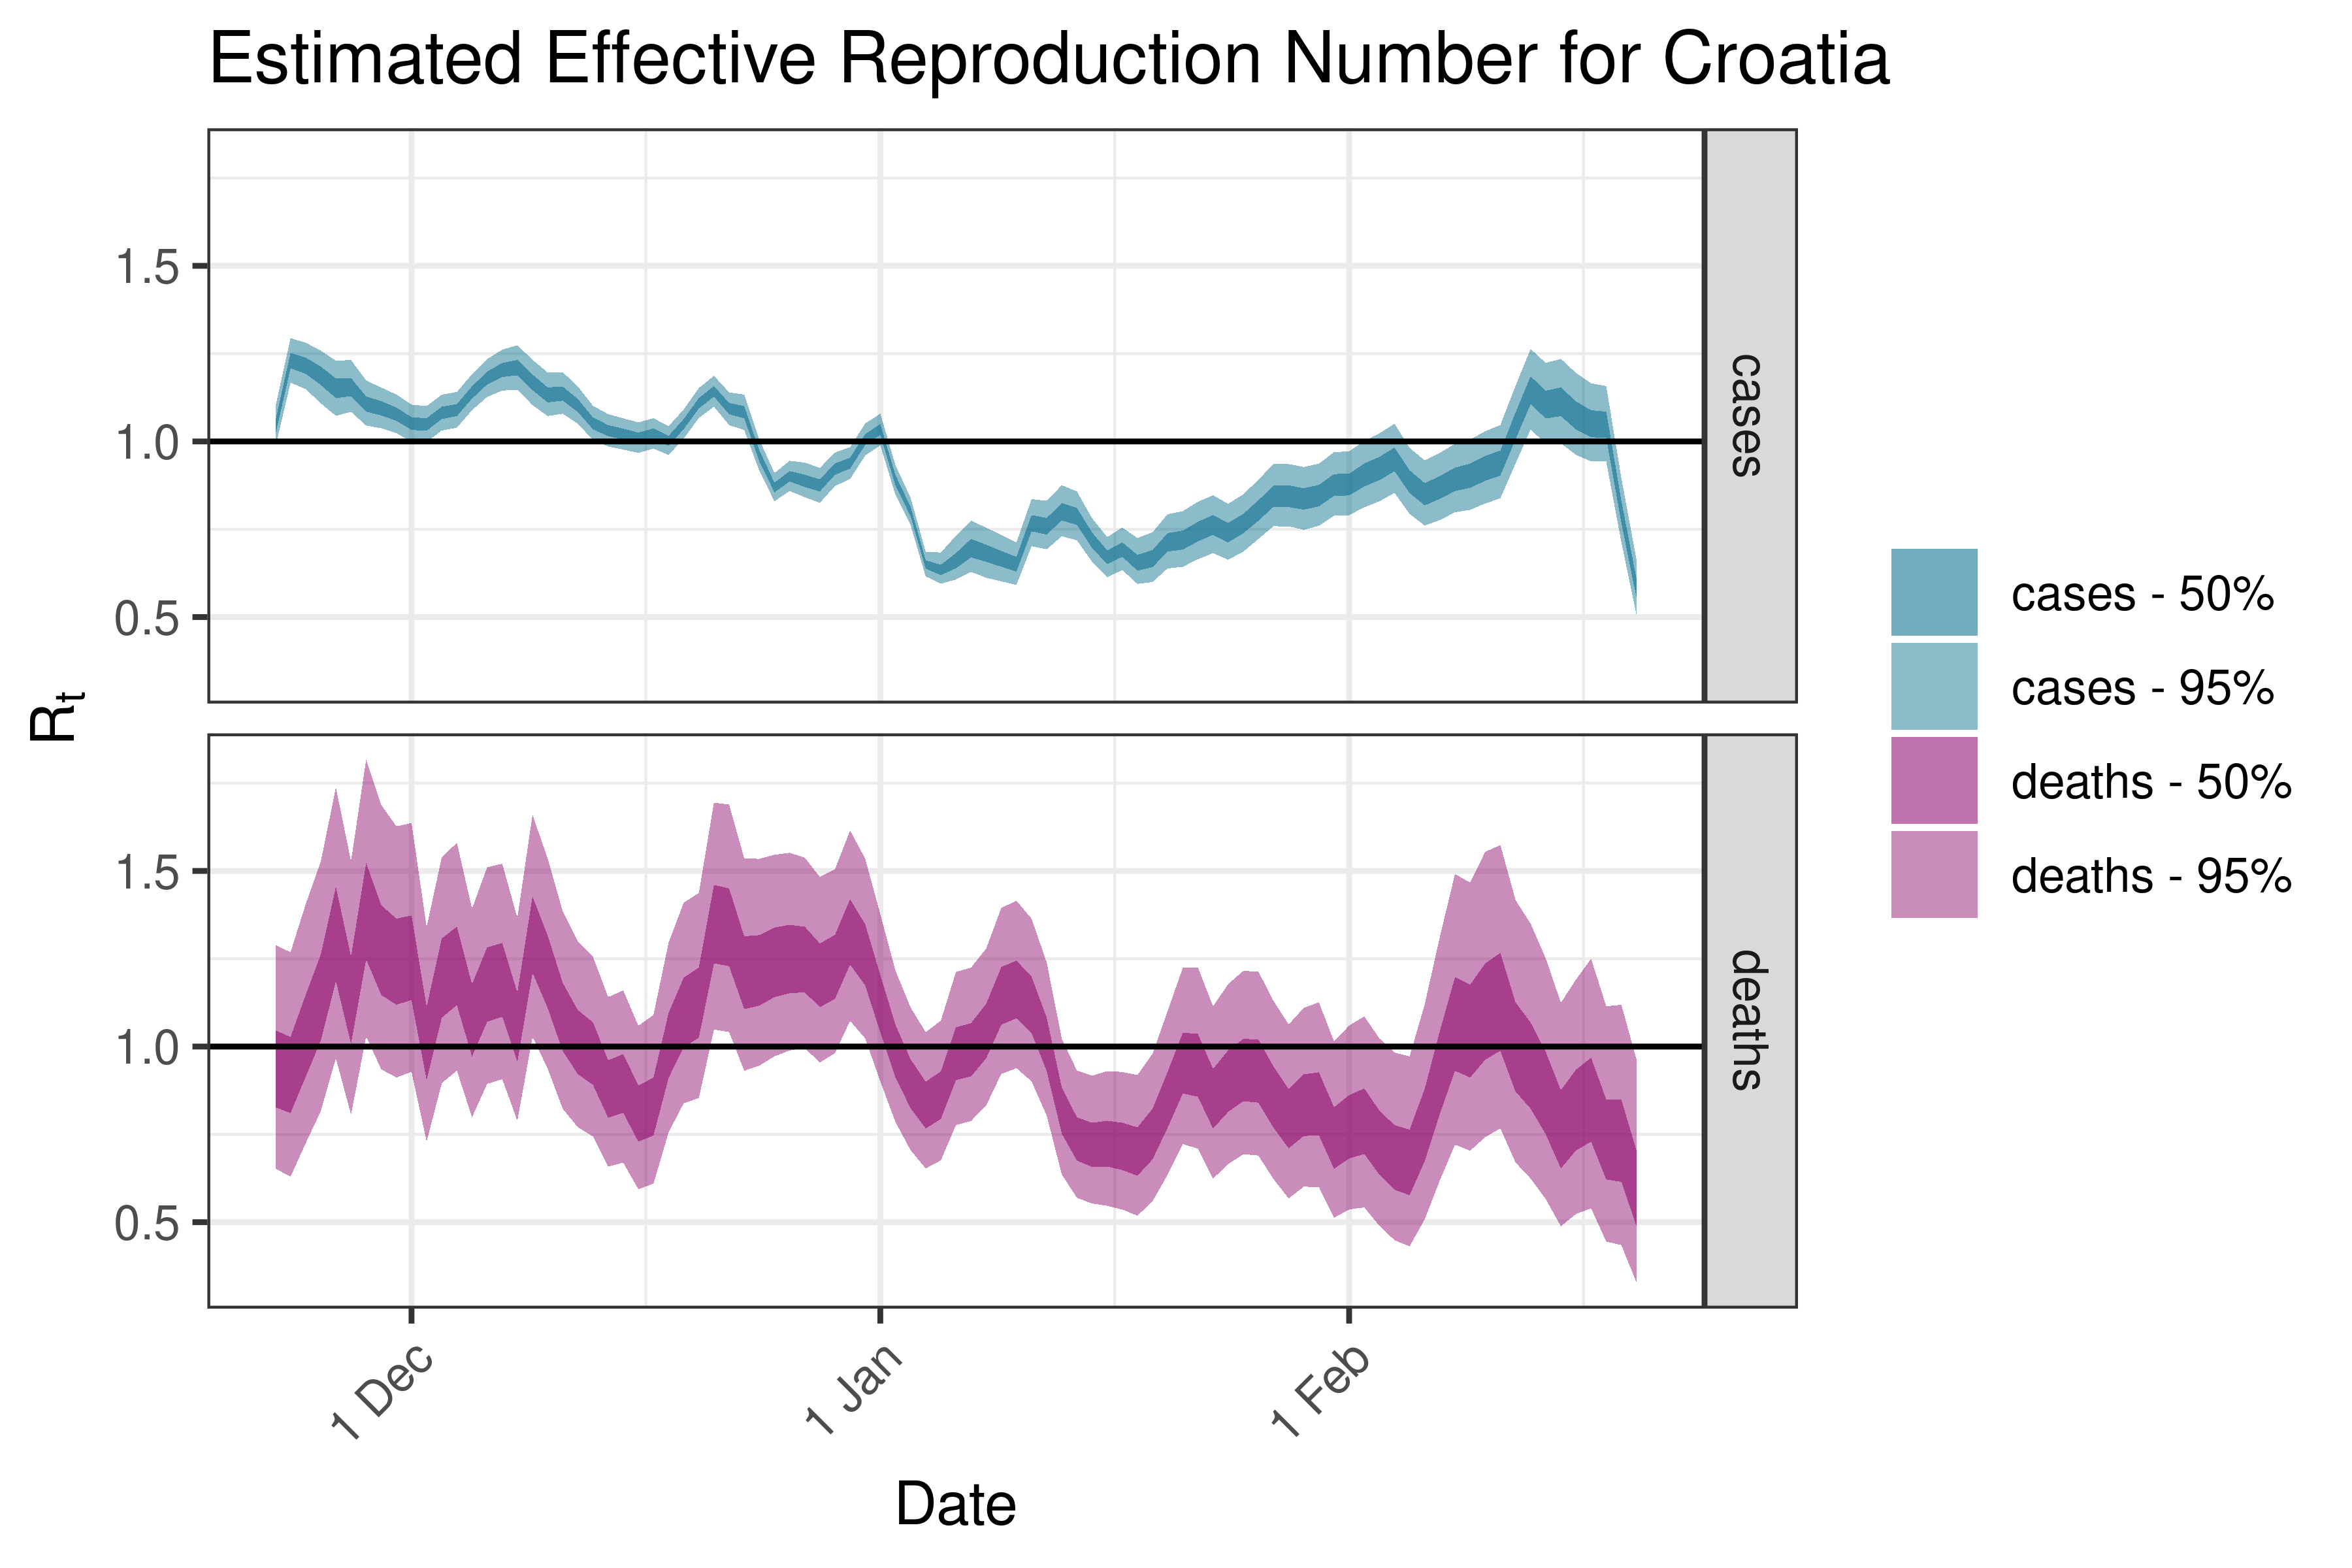
6.5.3.6 Croatia
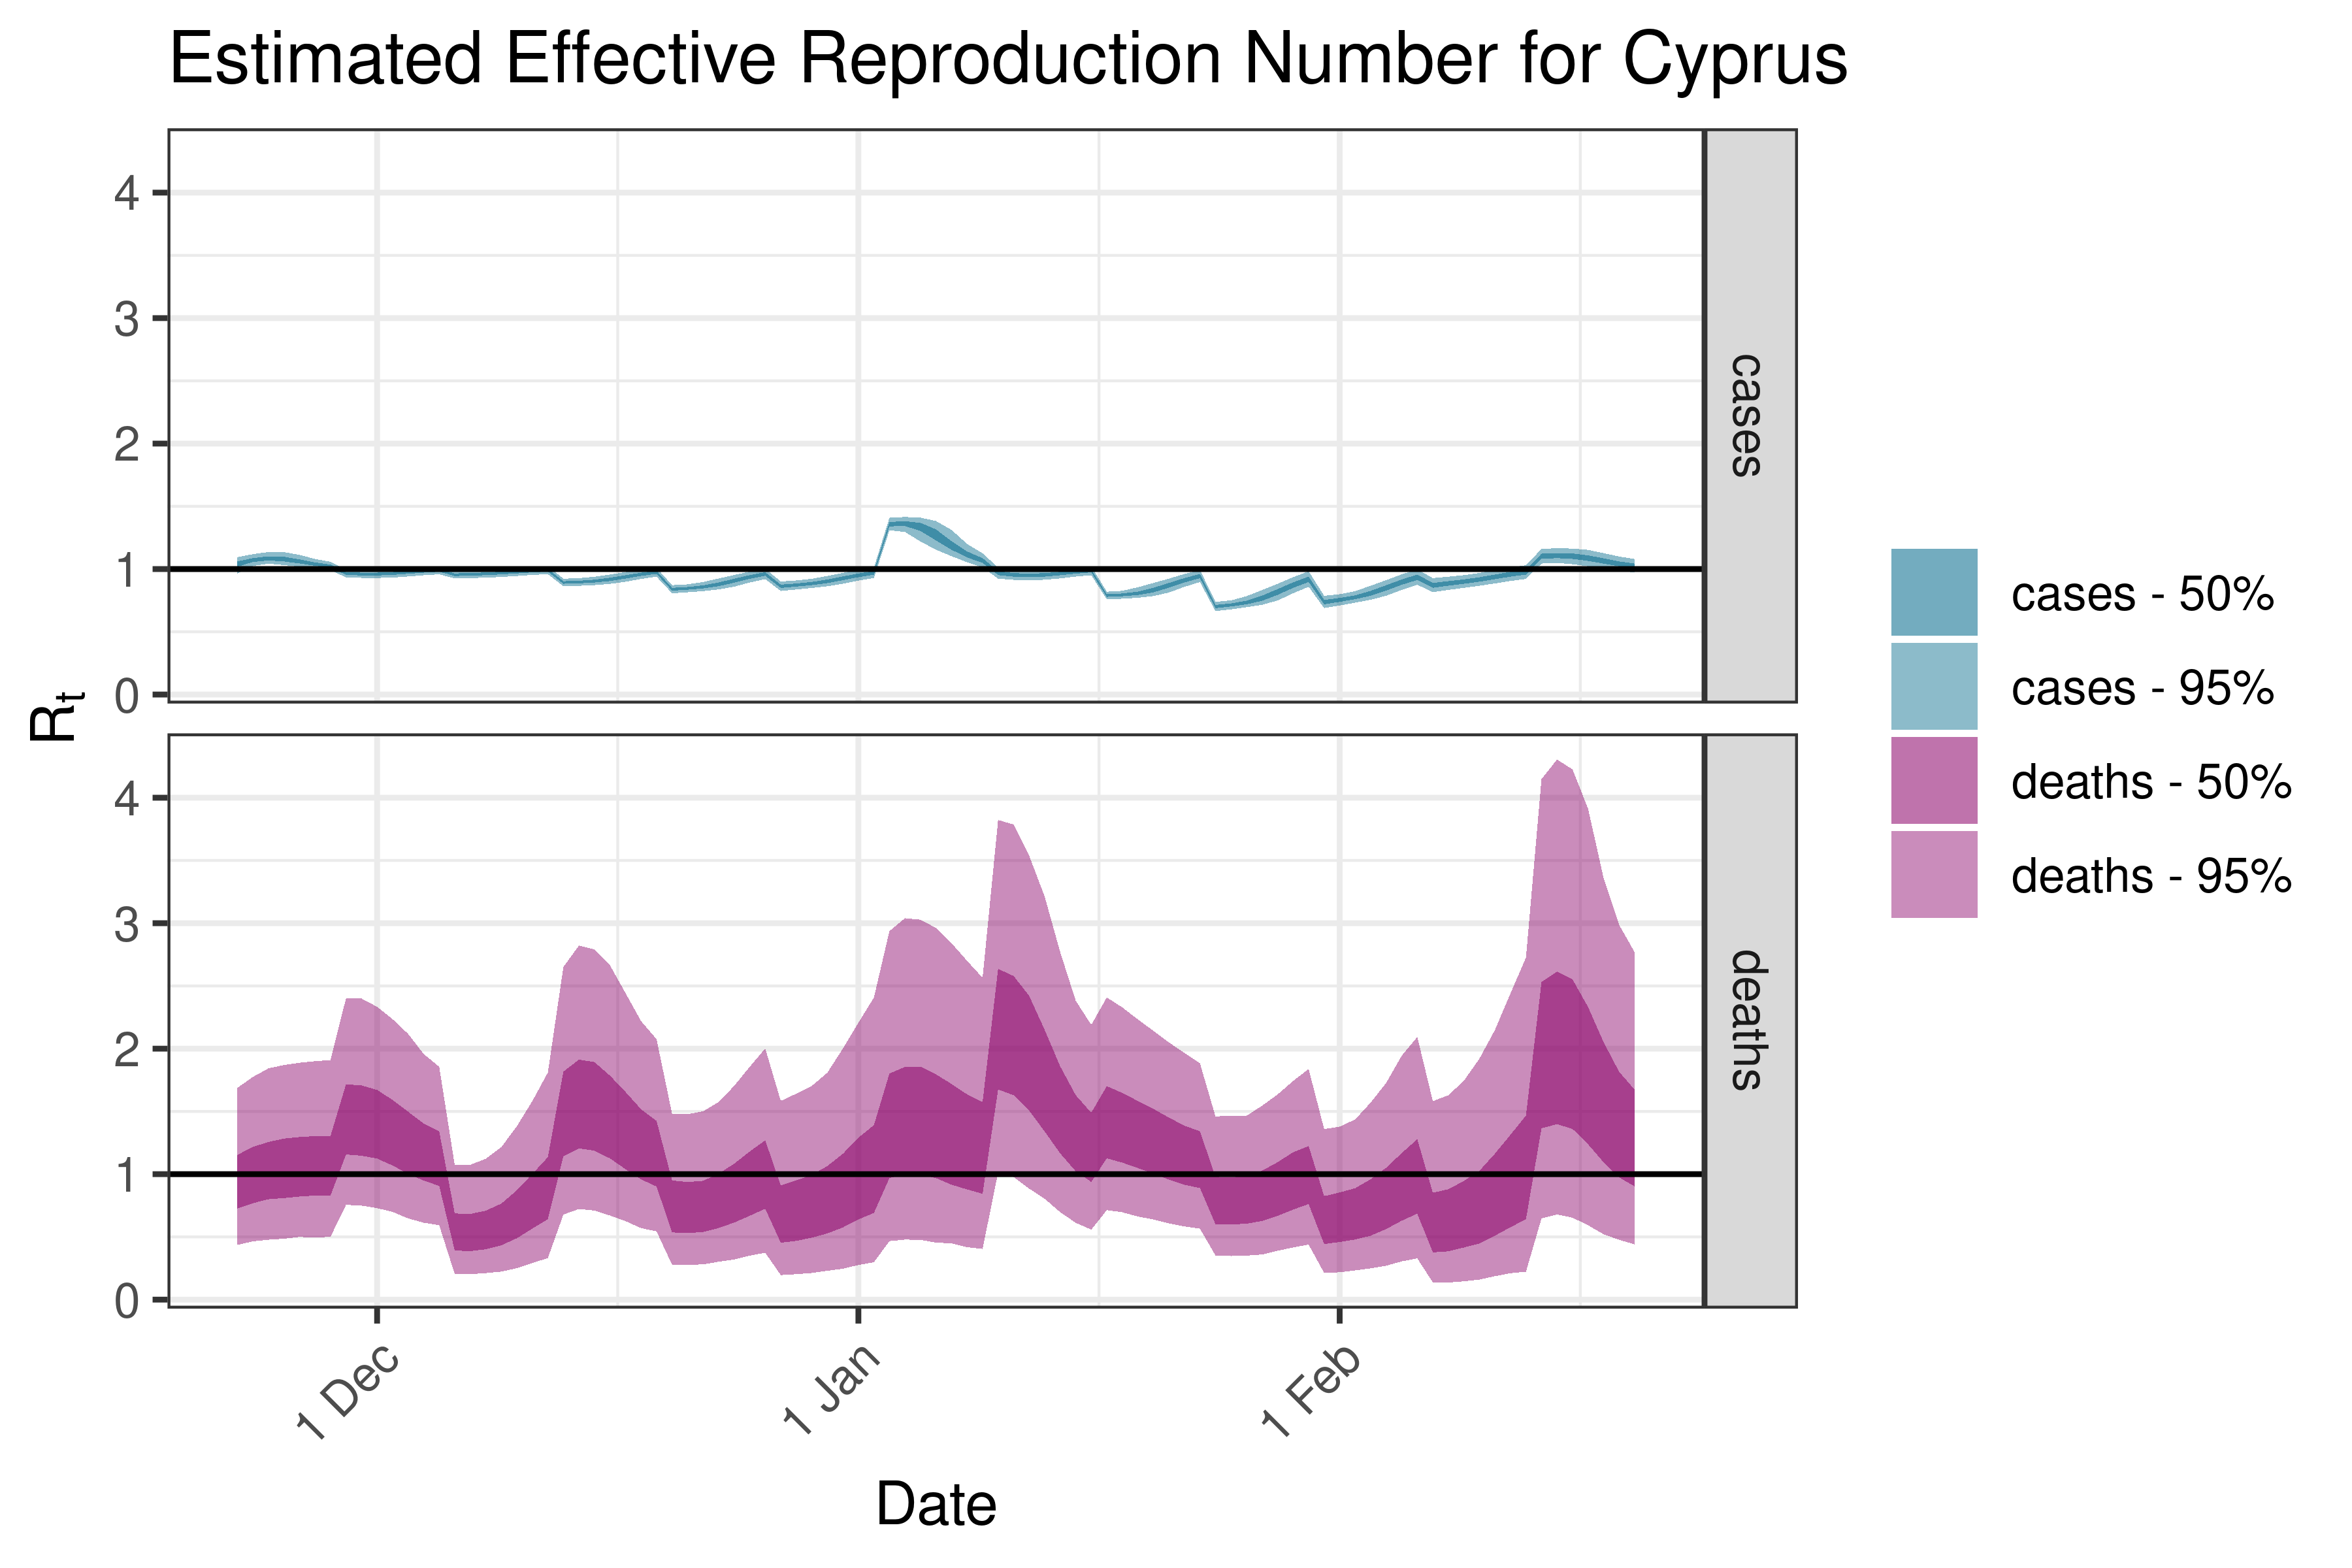
6.5.3.7 Cyprus
6.5.3.8 Czechia
6.5.3.9 Denmark
6.5.3.10 Estonia
6.5.3.11 Finland
6.5.3.12 France
6.5.3.13 Germany
6.5.3.14 Greece
6.5.3.15 Hungary
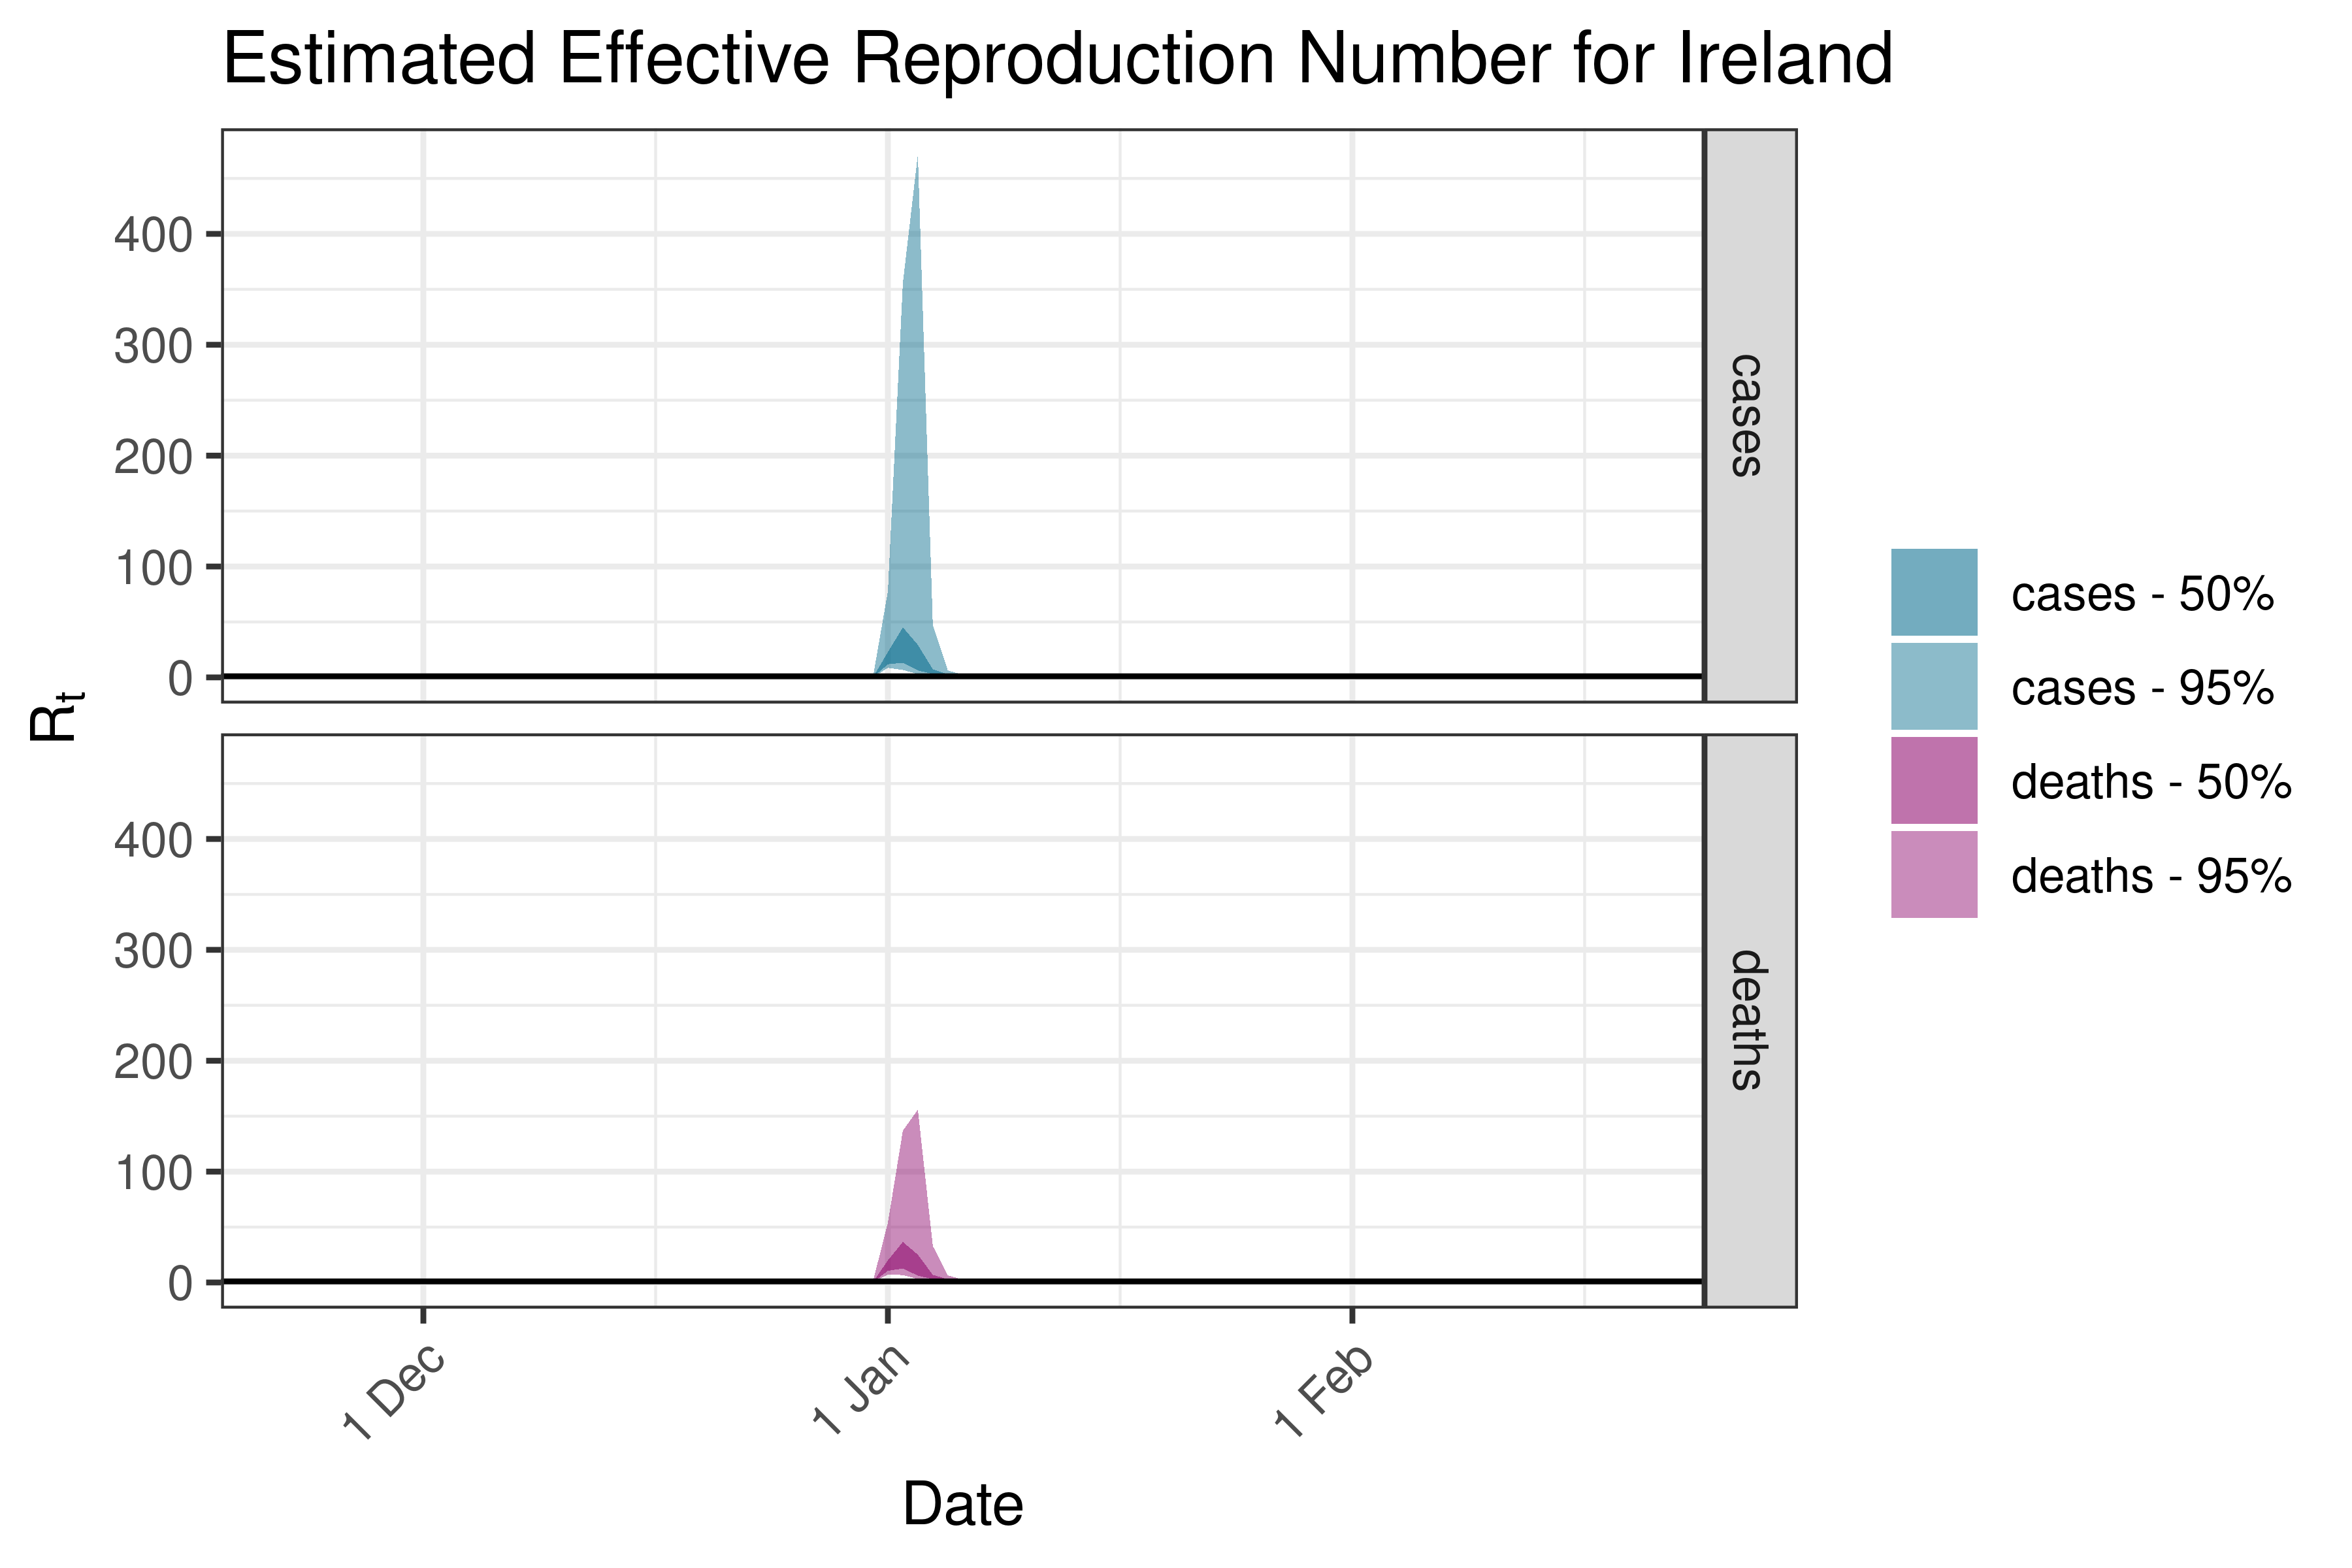
6.5.3.16 Ireland
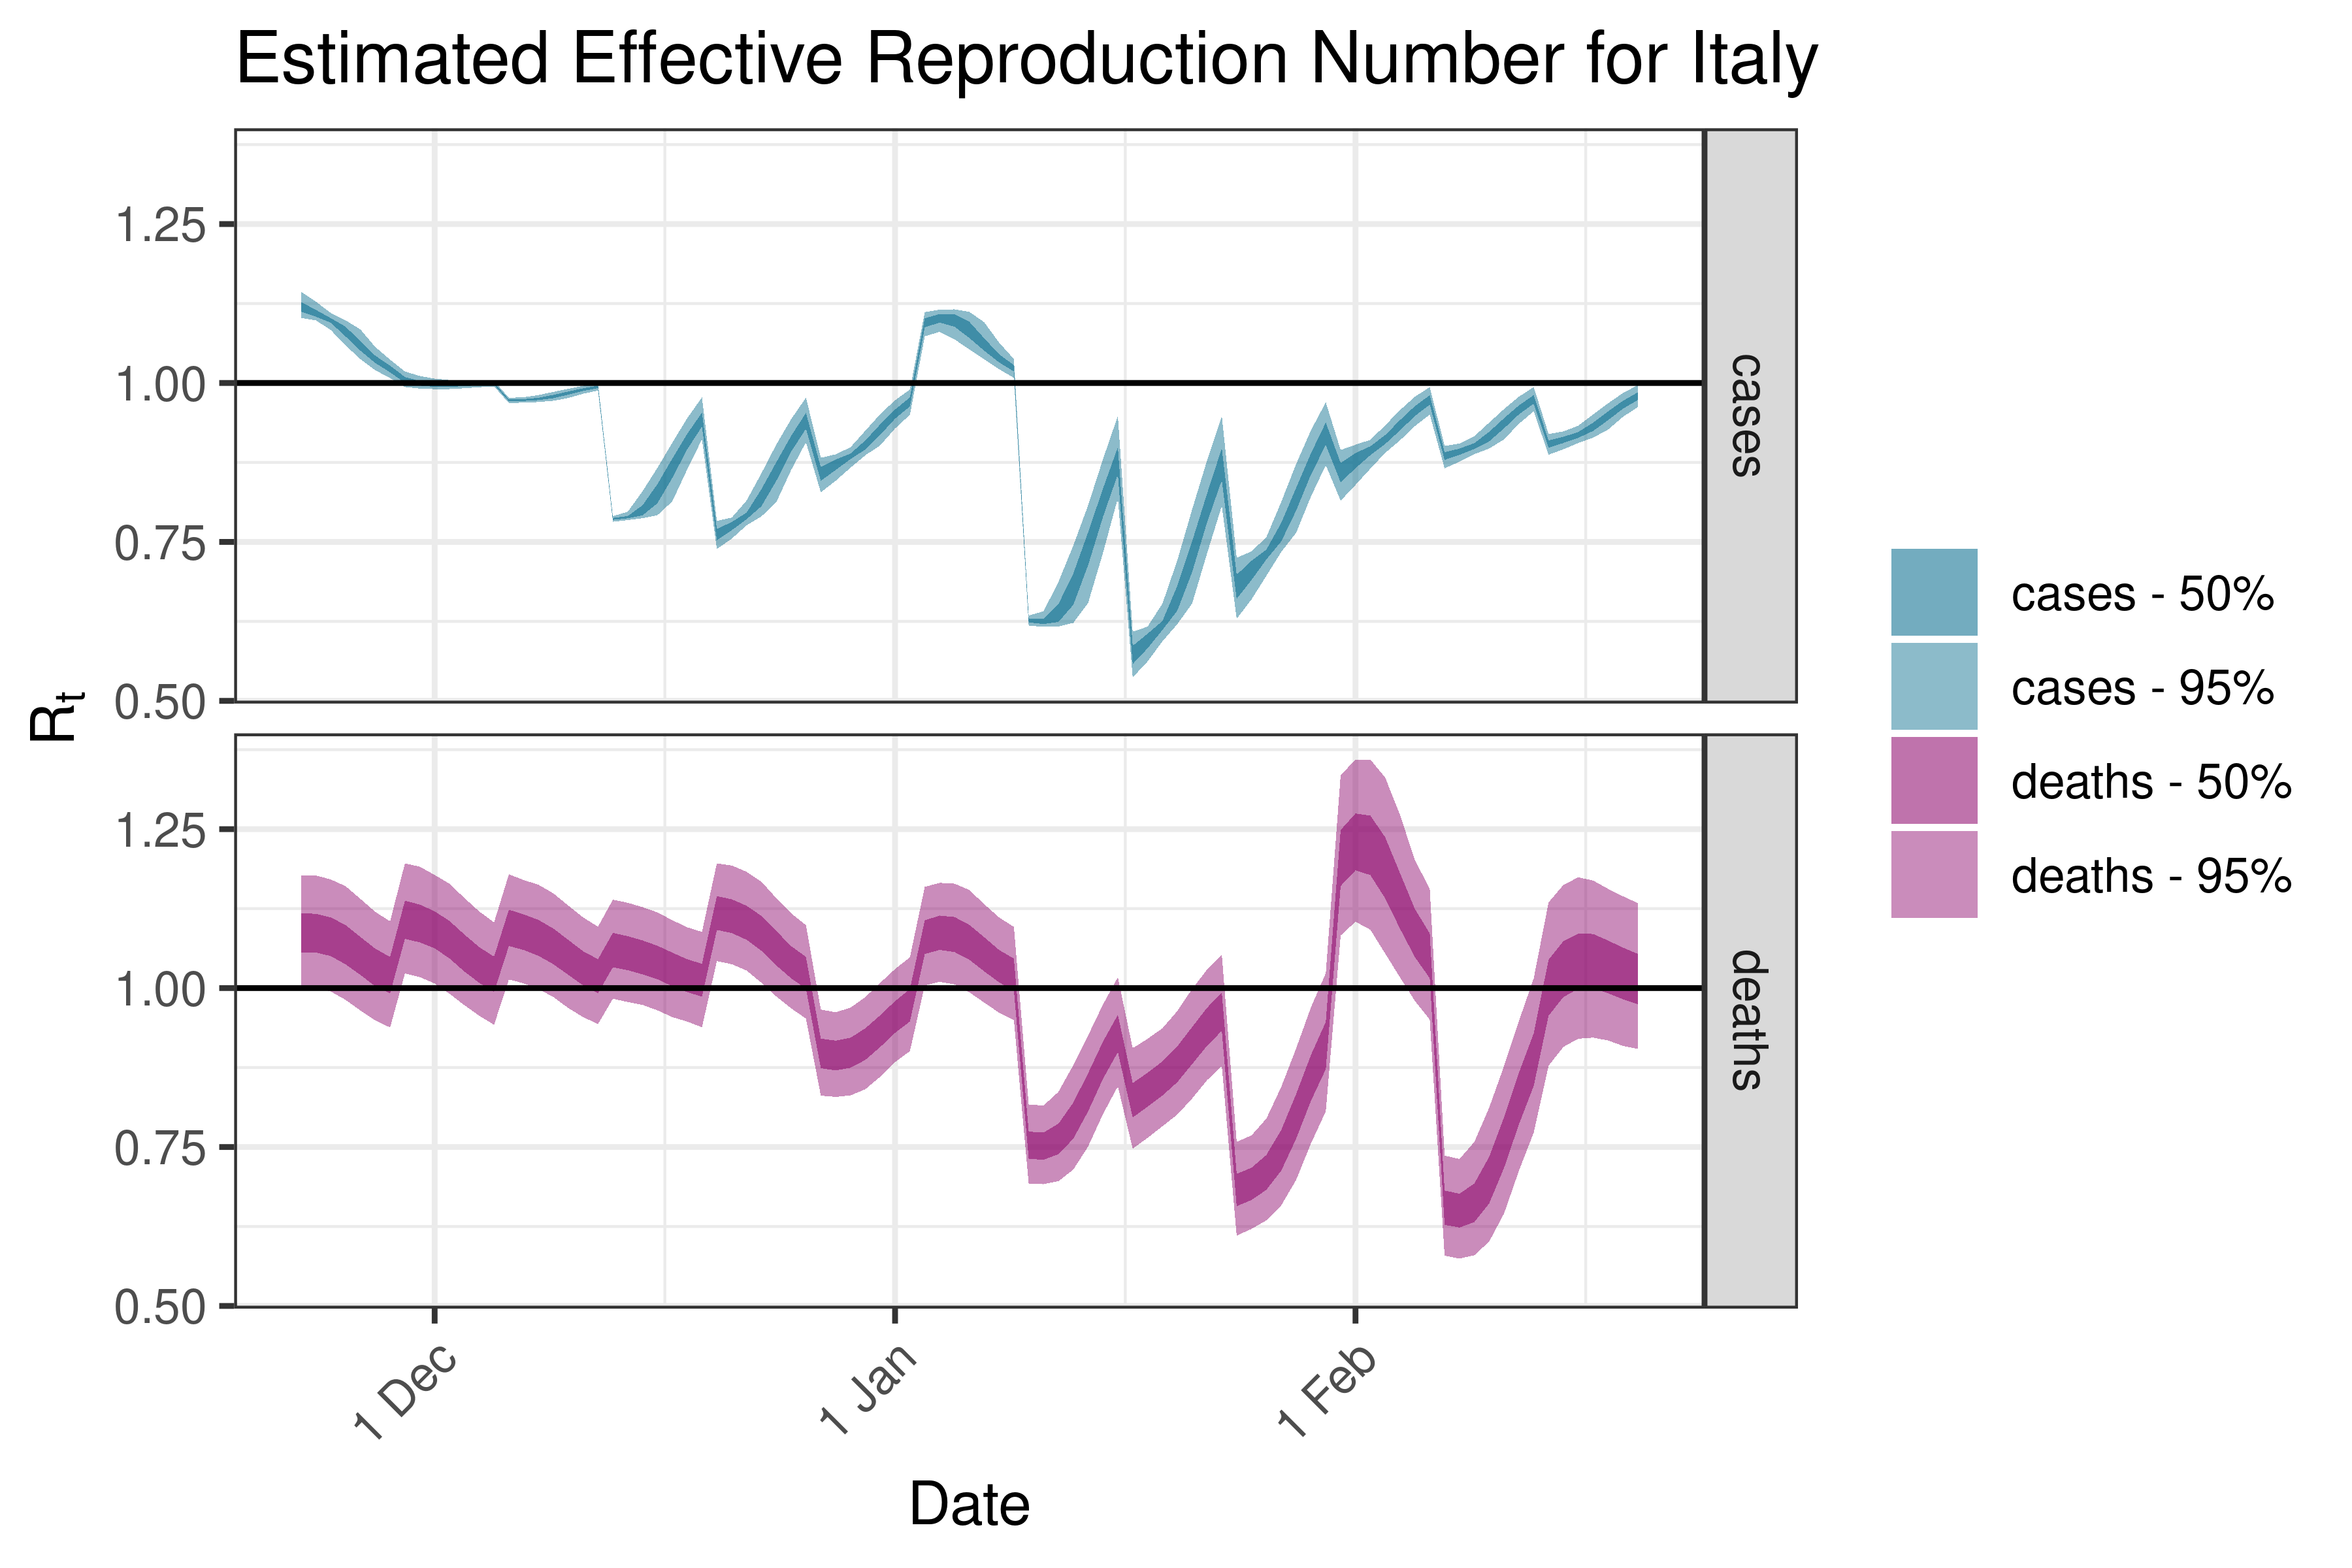
6.5.3.17 Italy
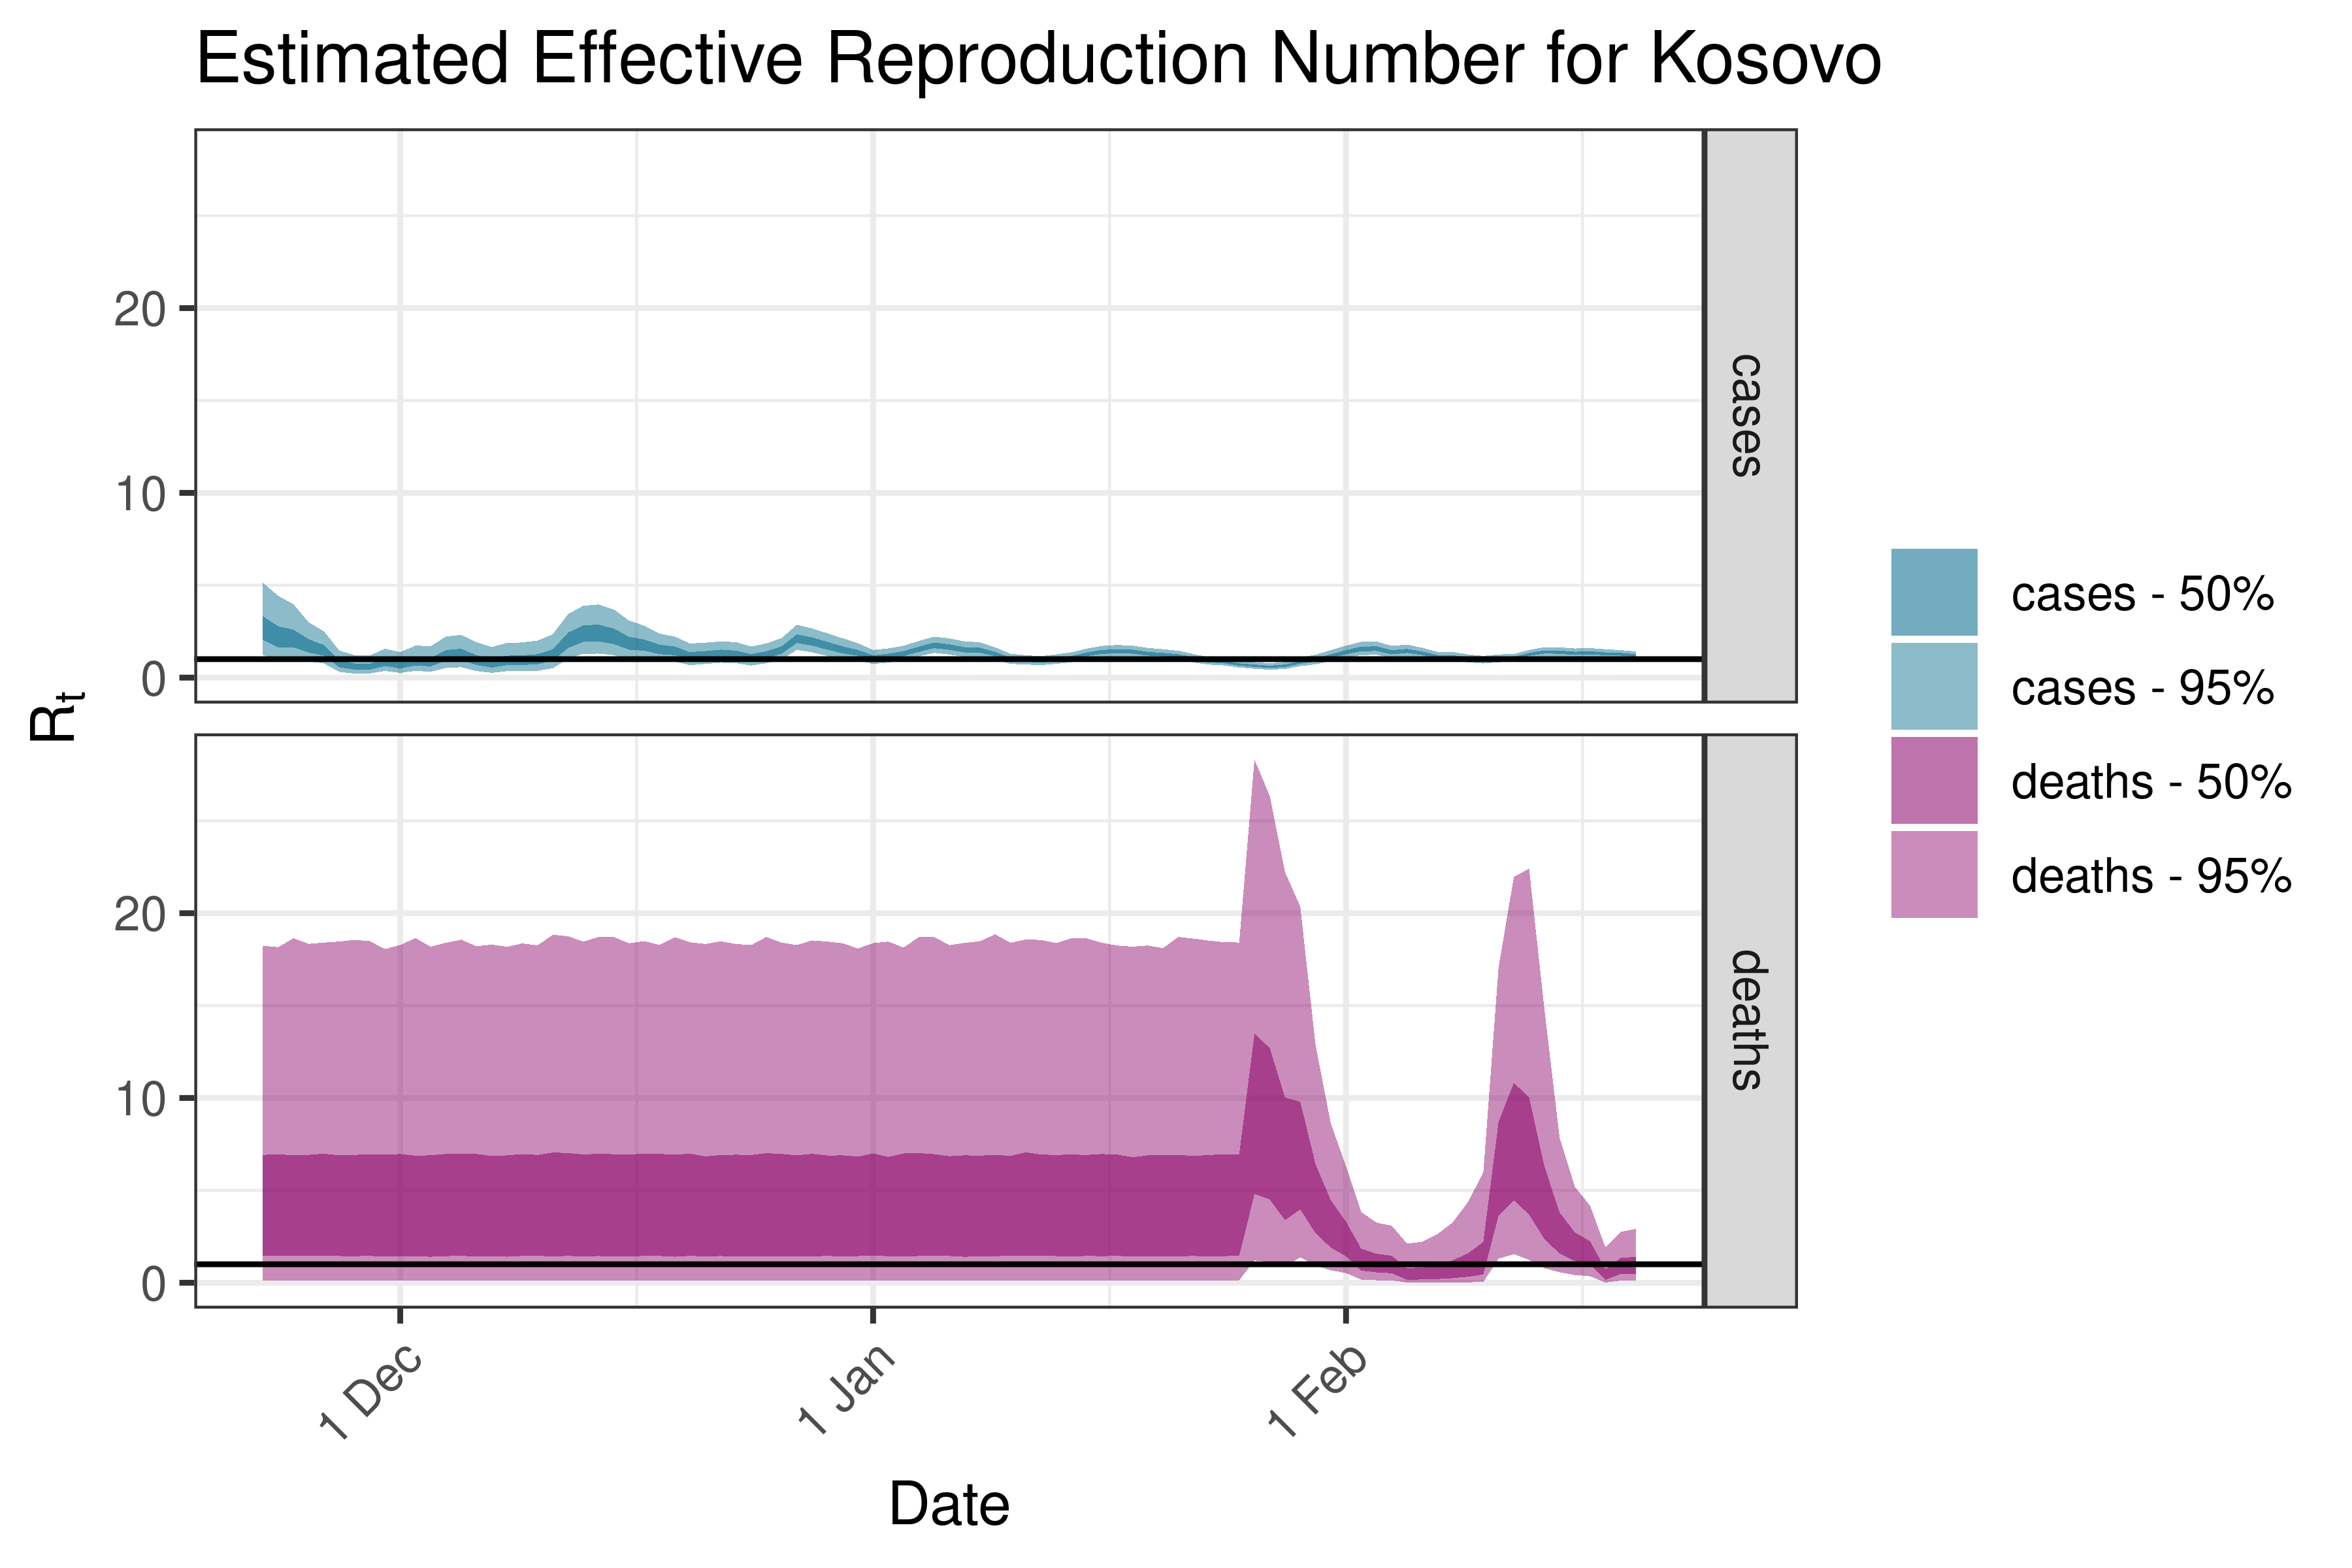
6.5.3.18 Kosovo
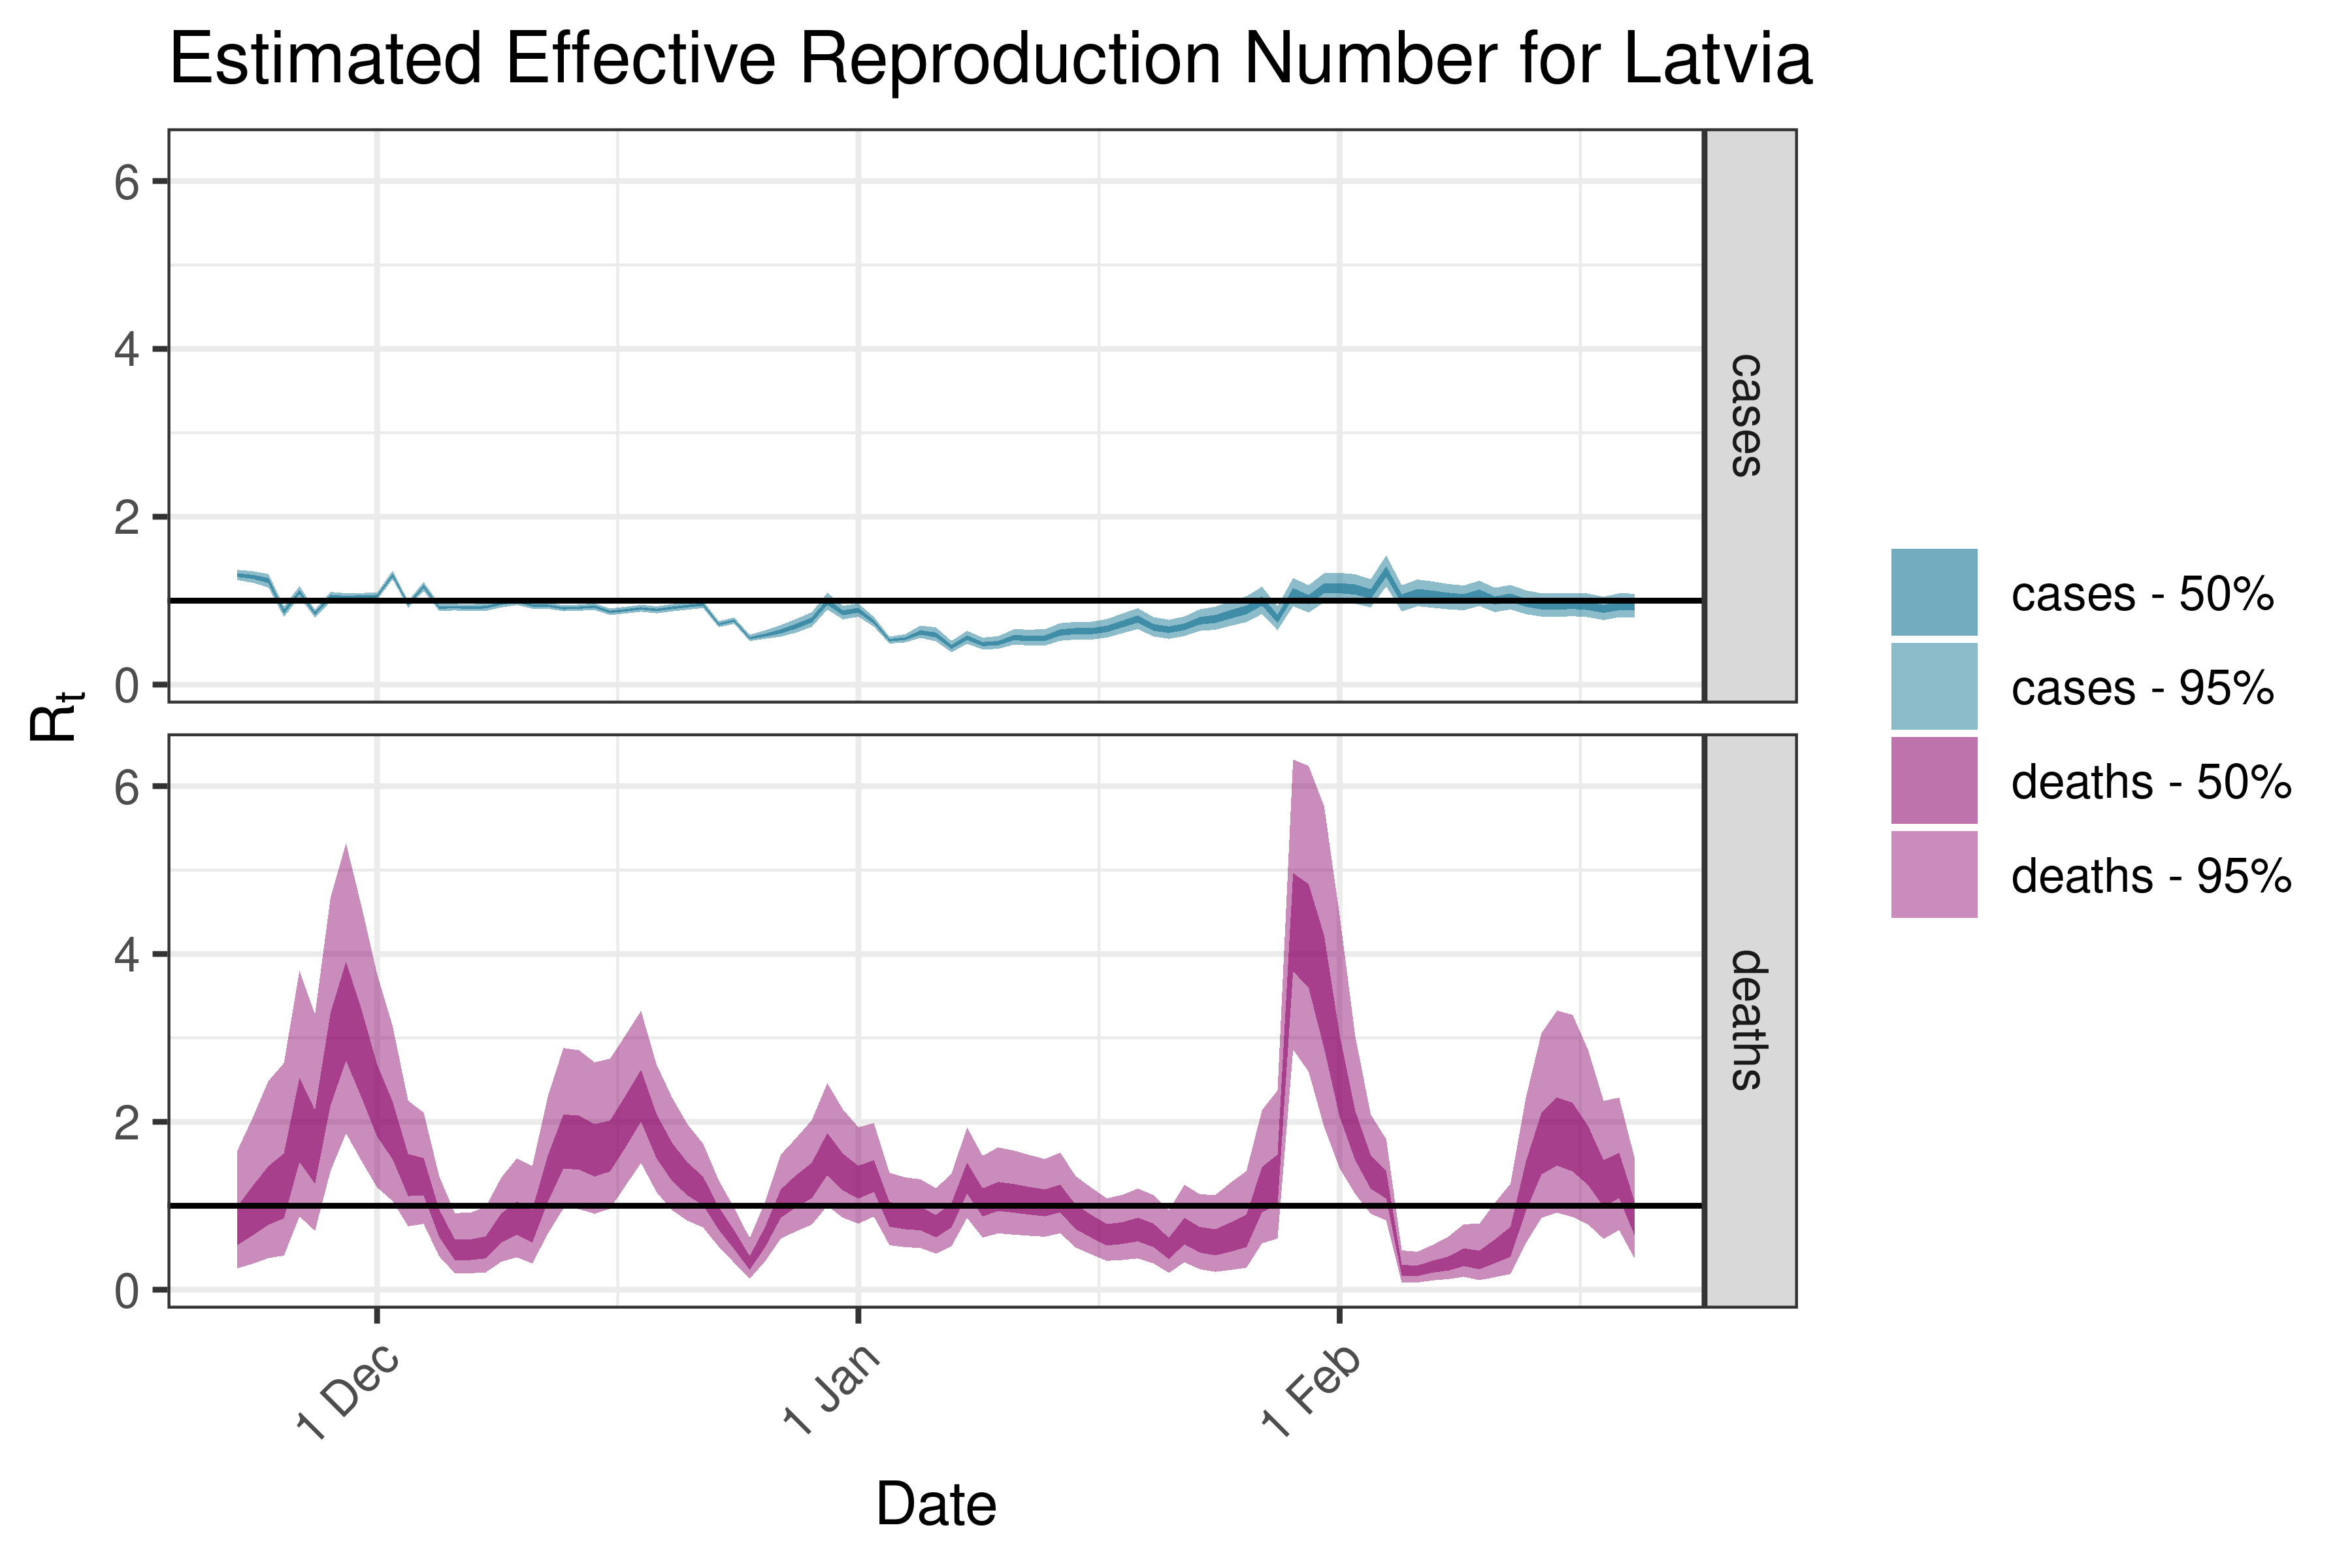
6.5.3.19 Latvia
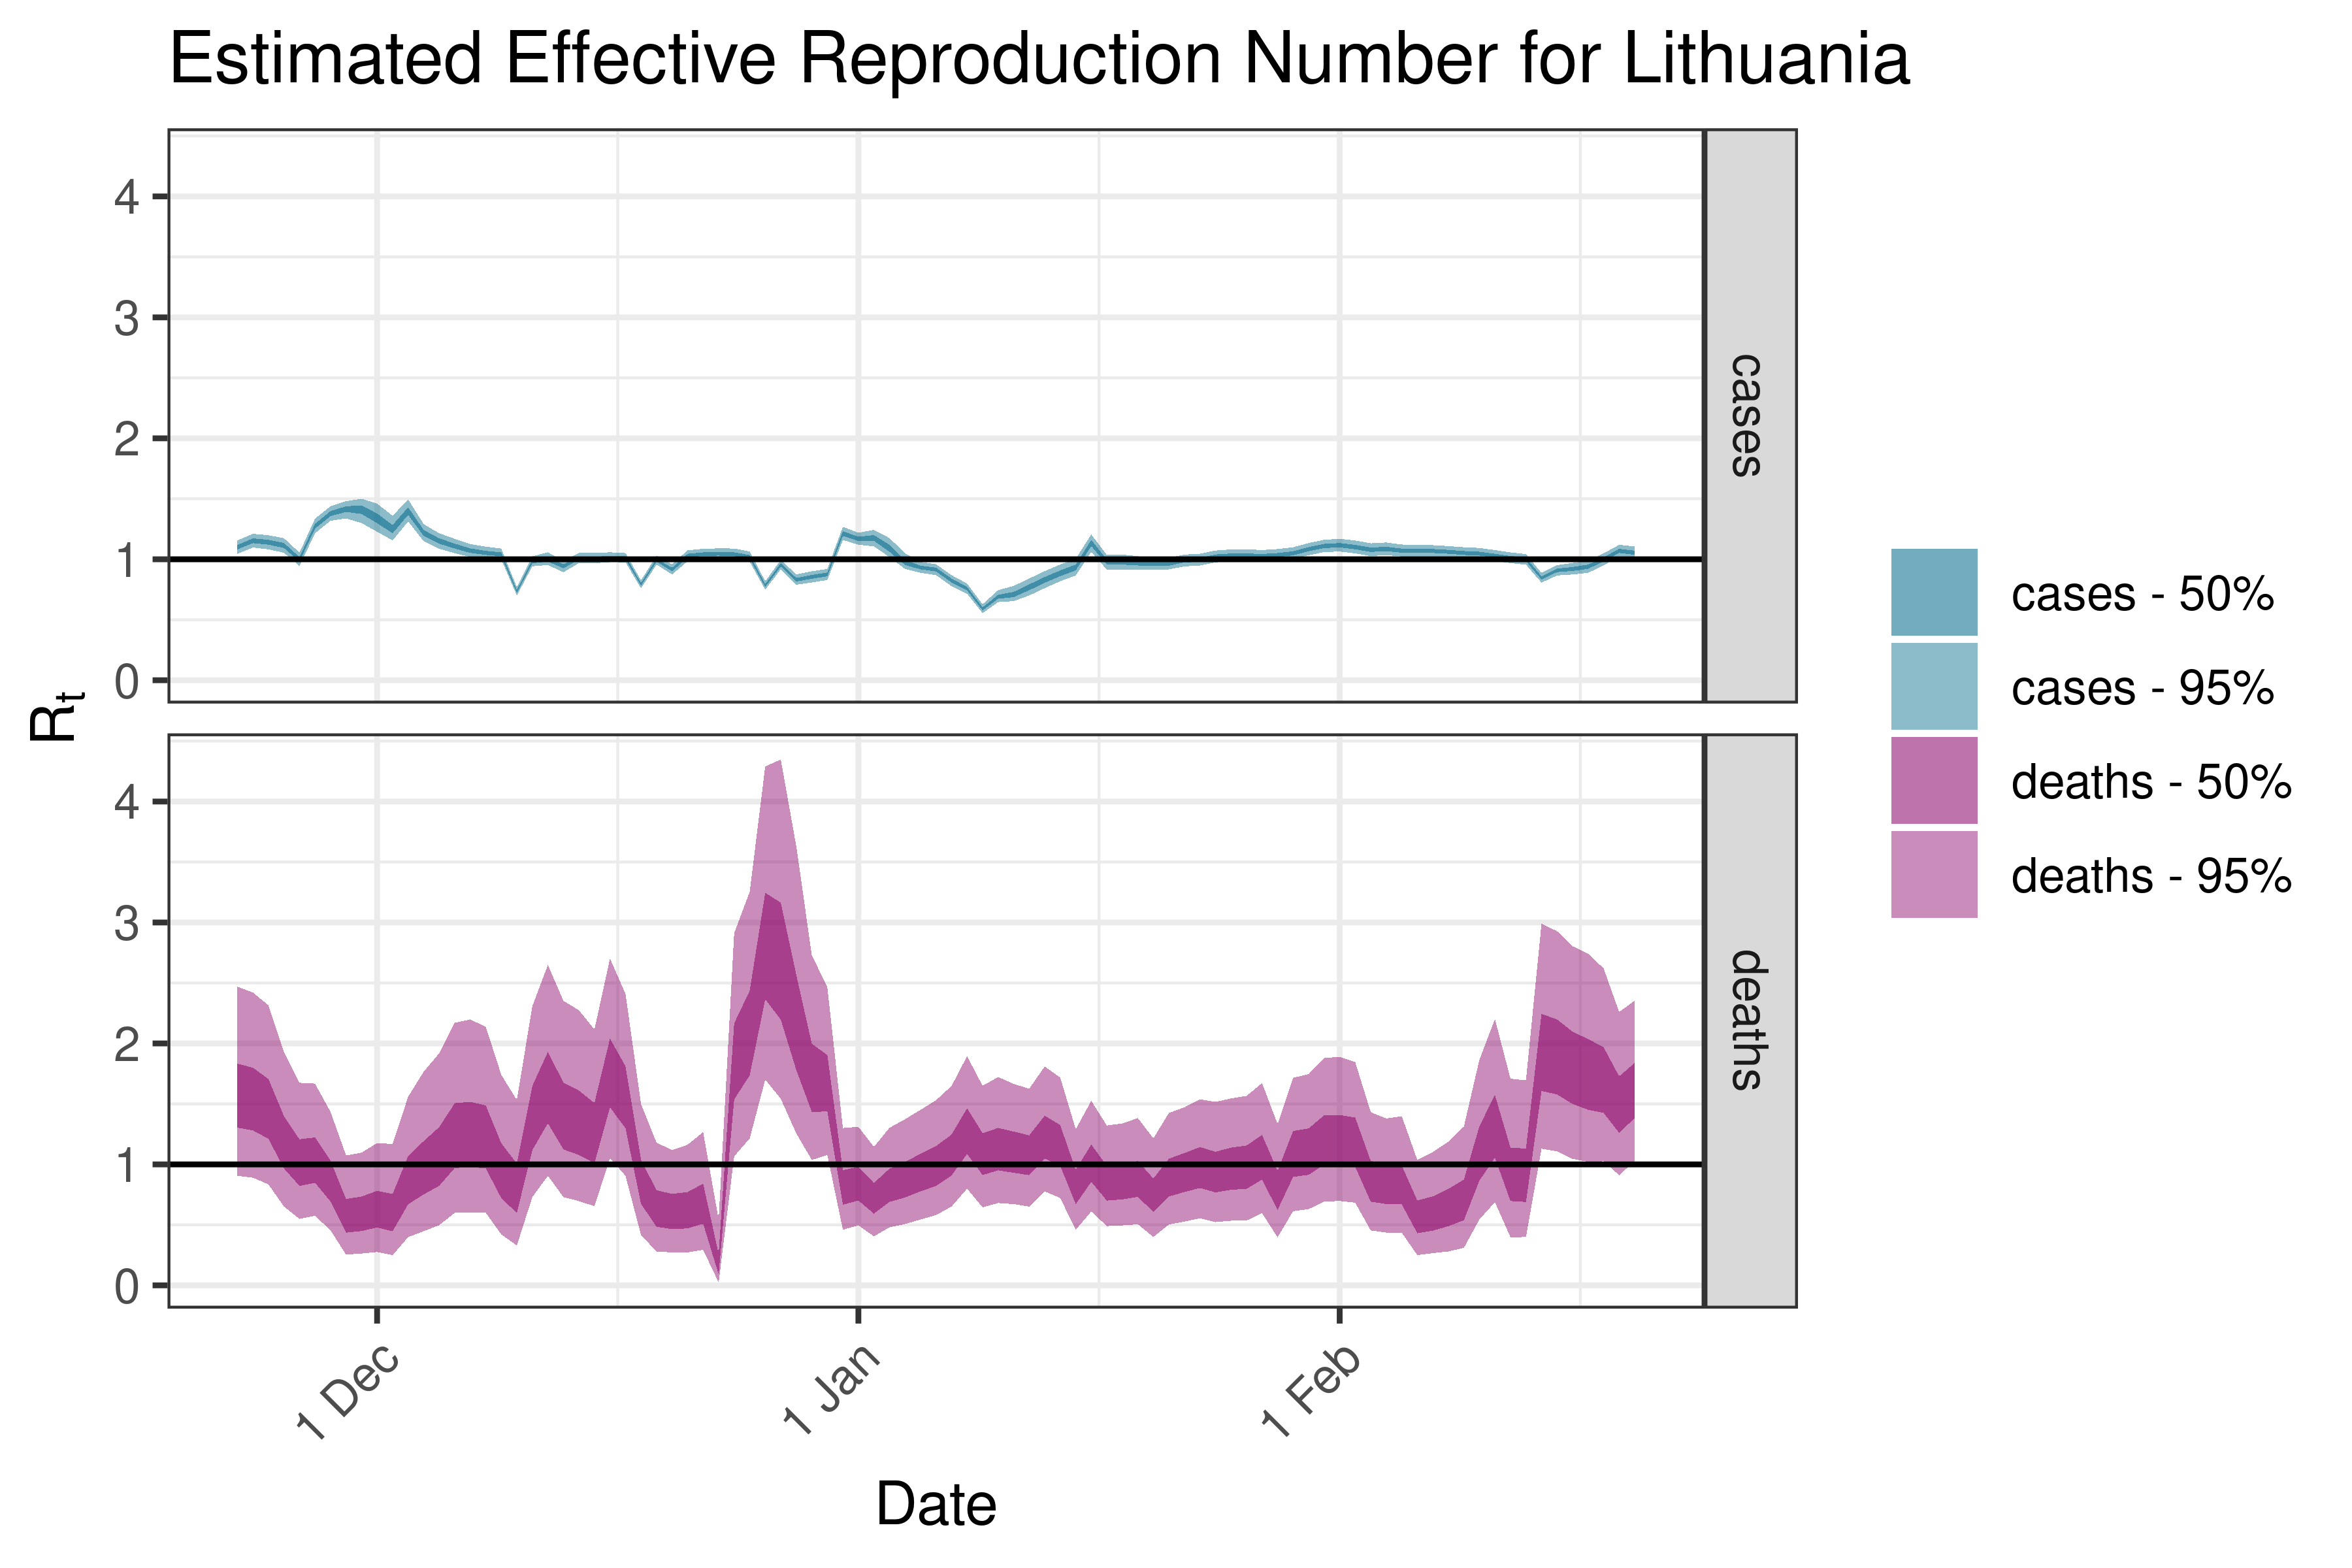
6.5.3.20 Lithuania
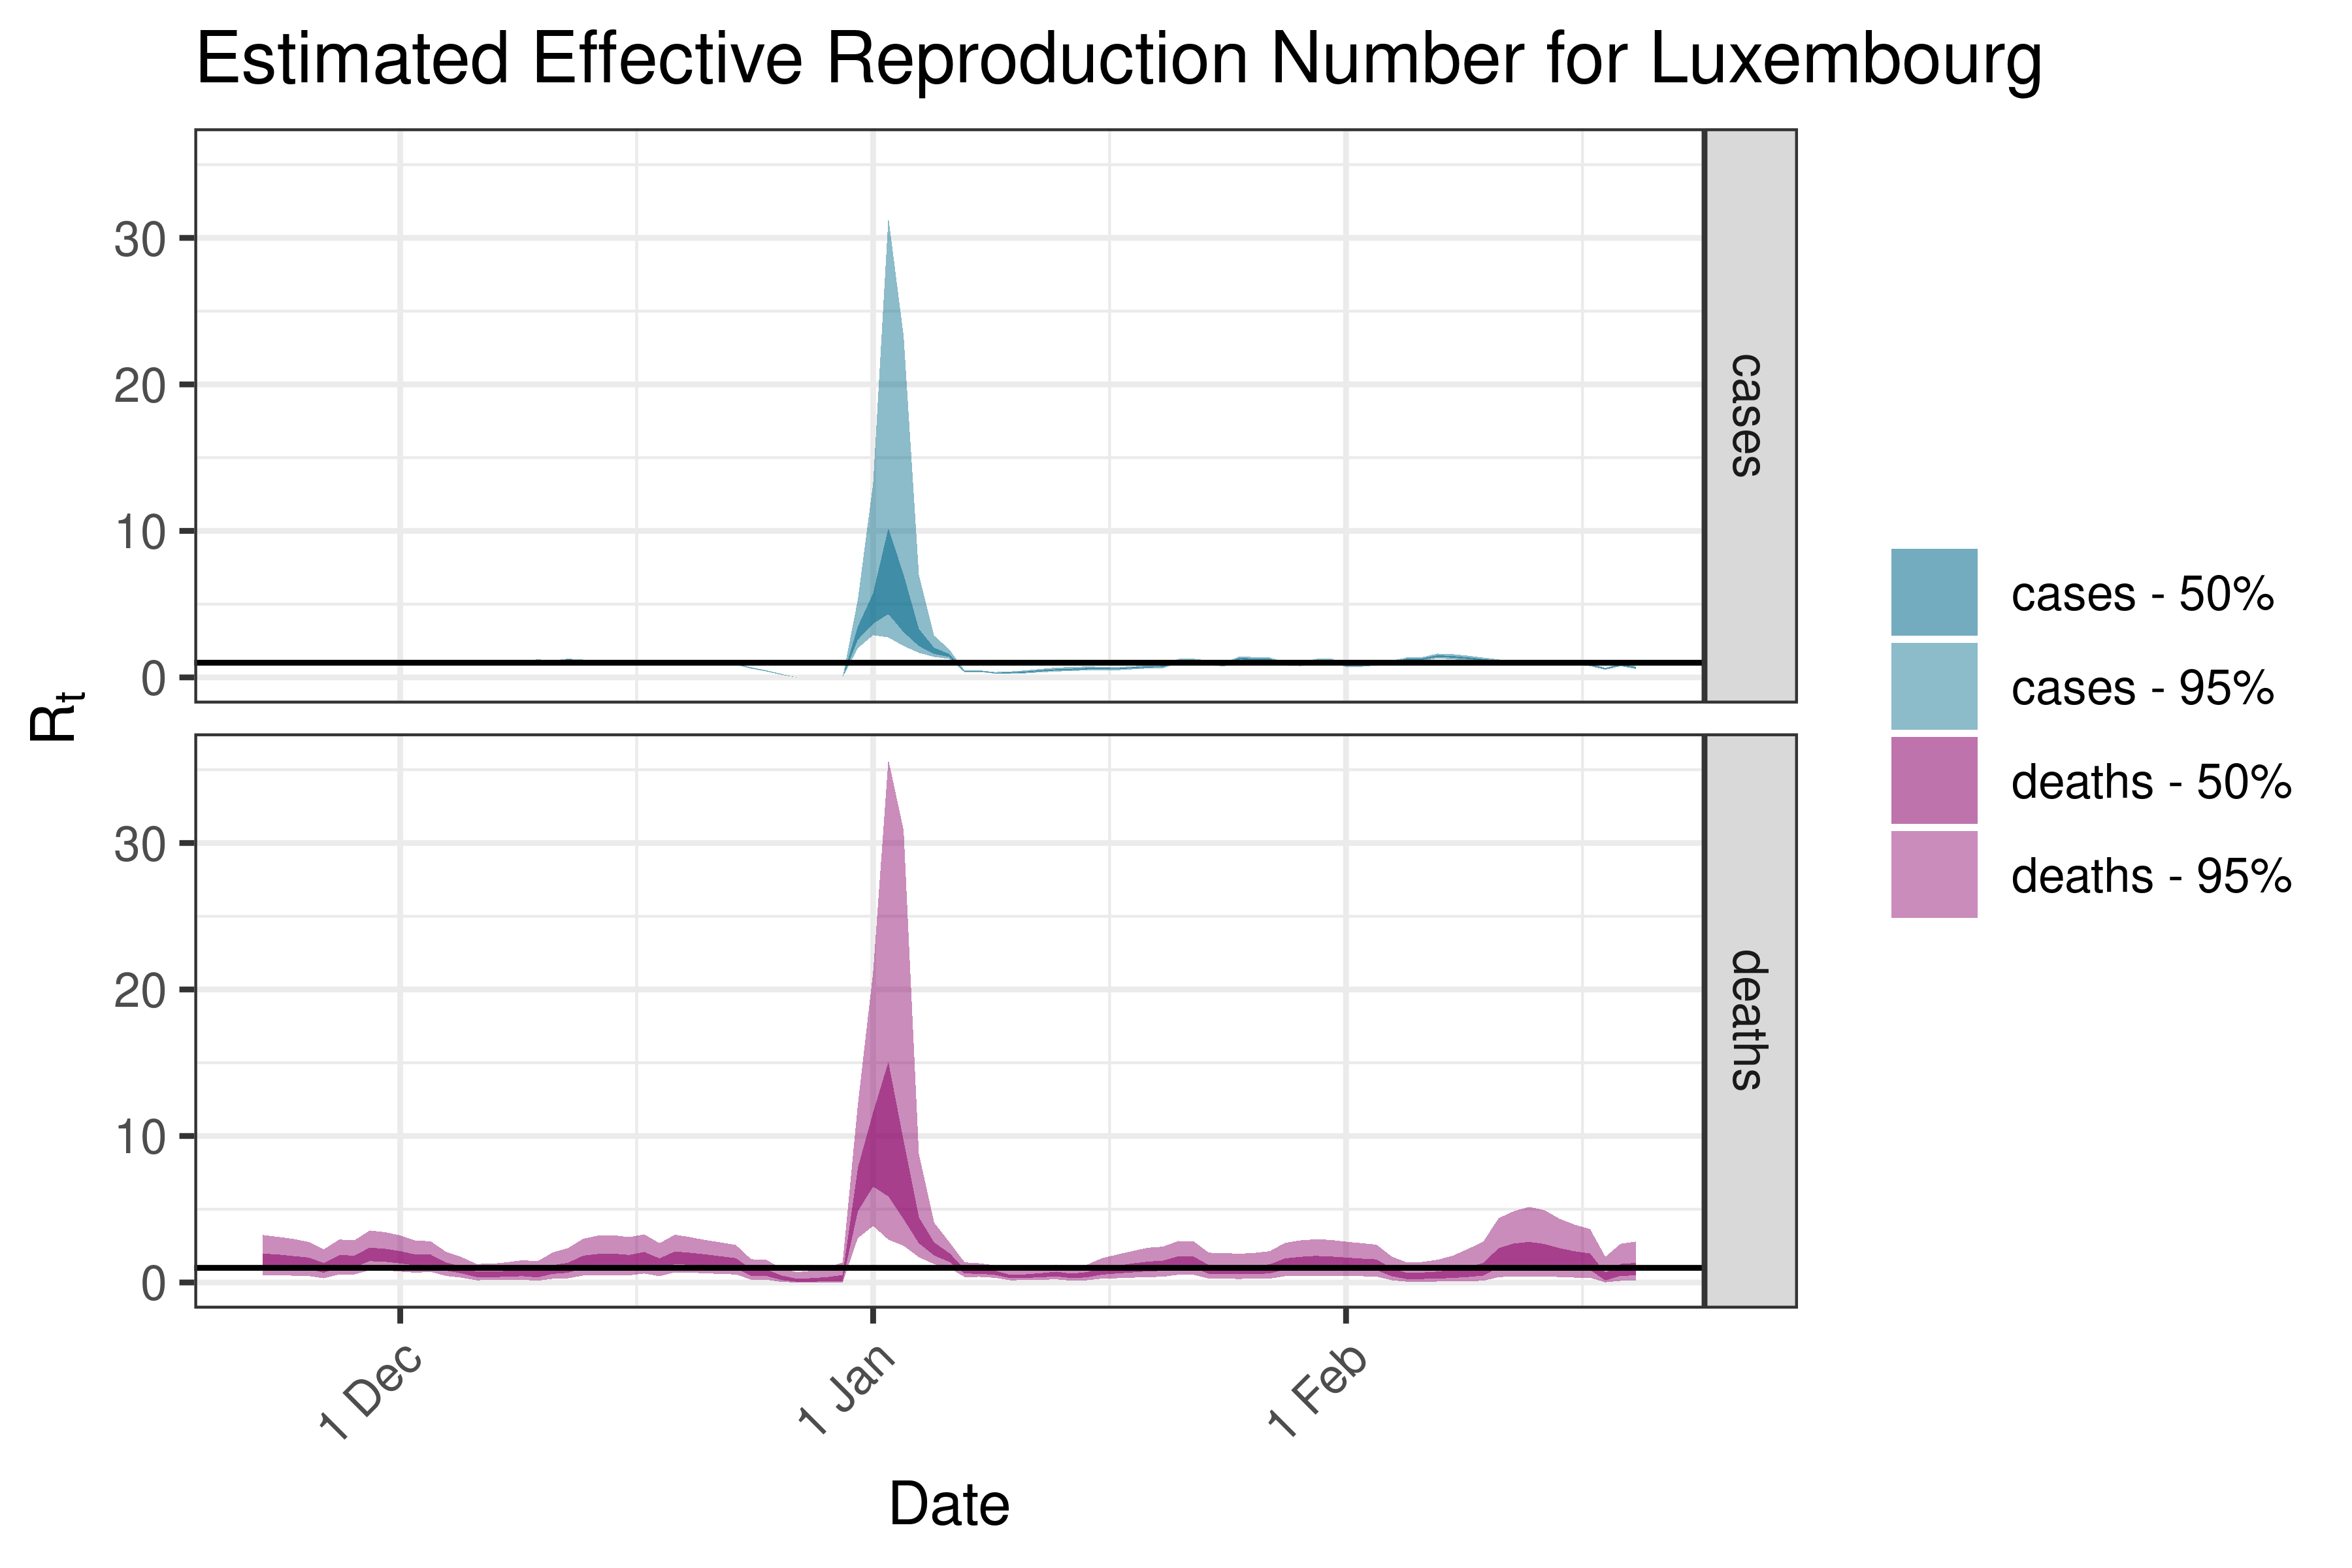
6.5.3.21 Luxembourg
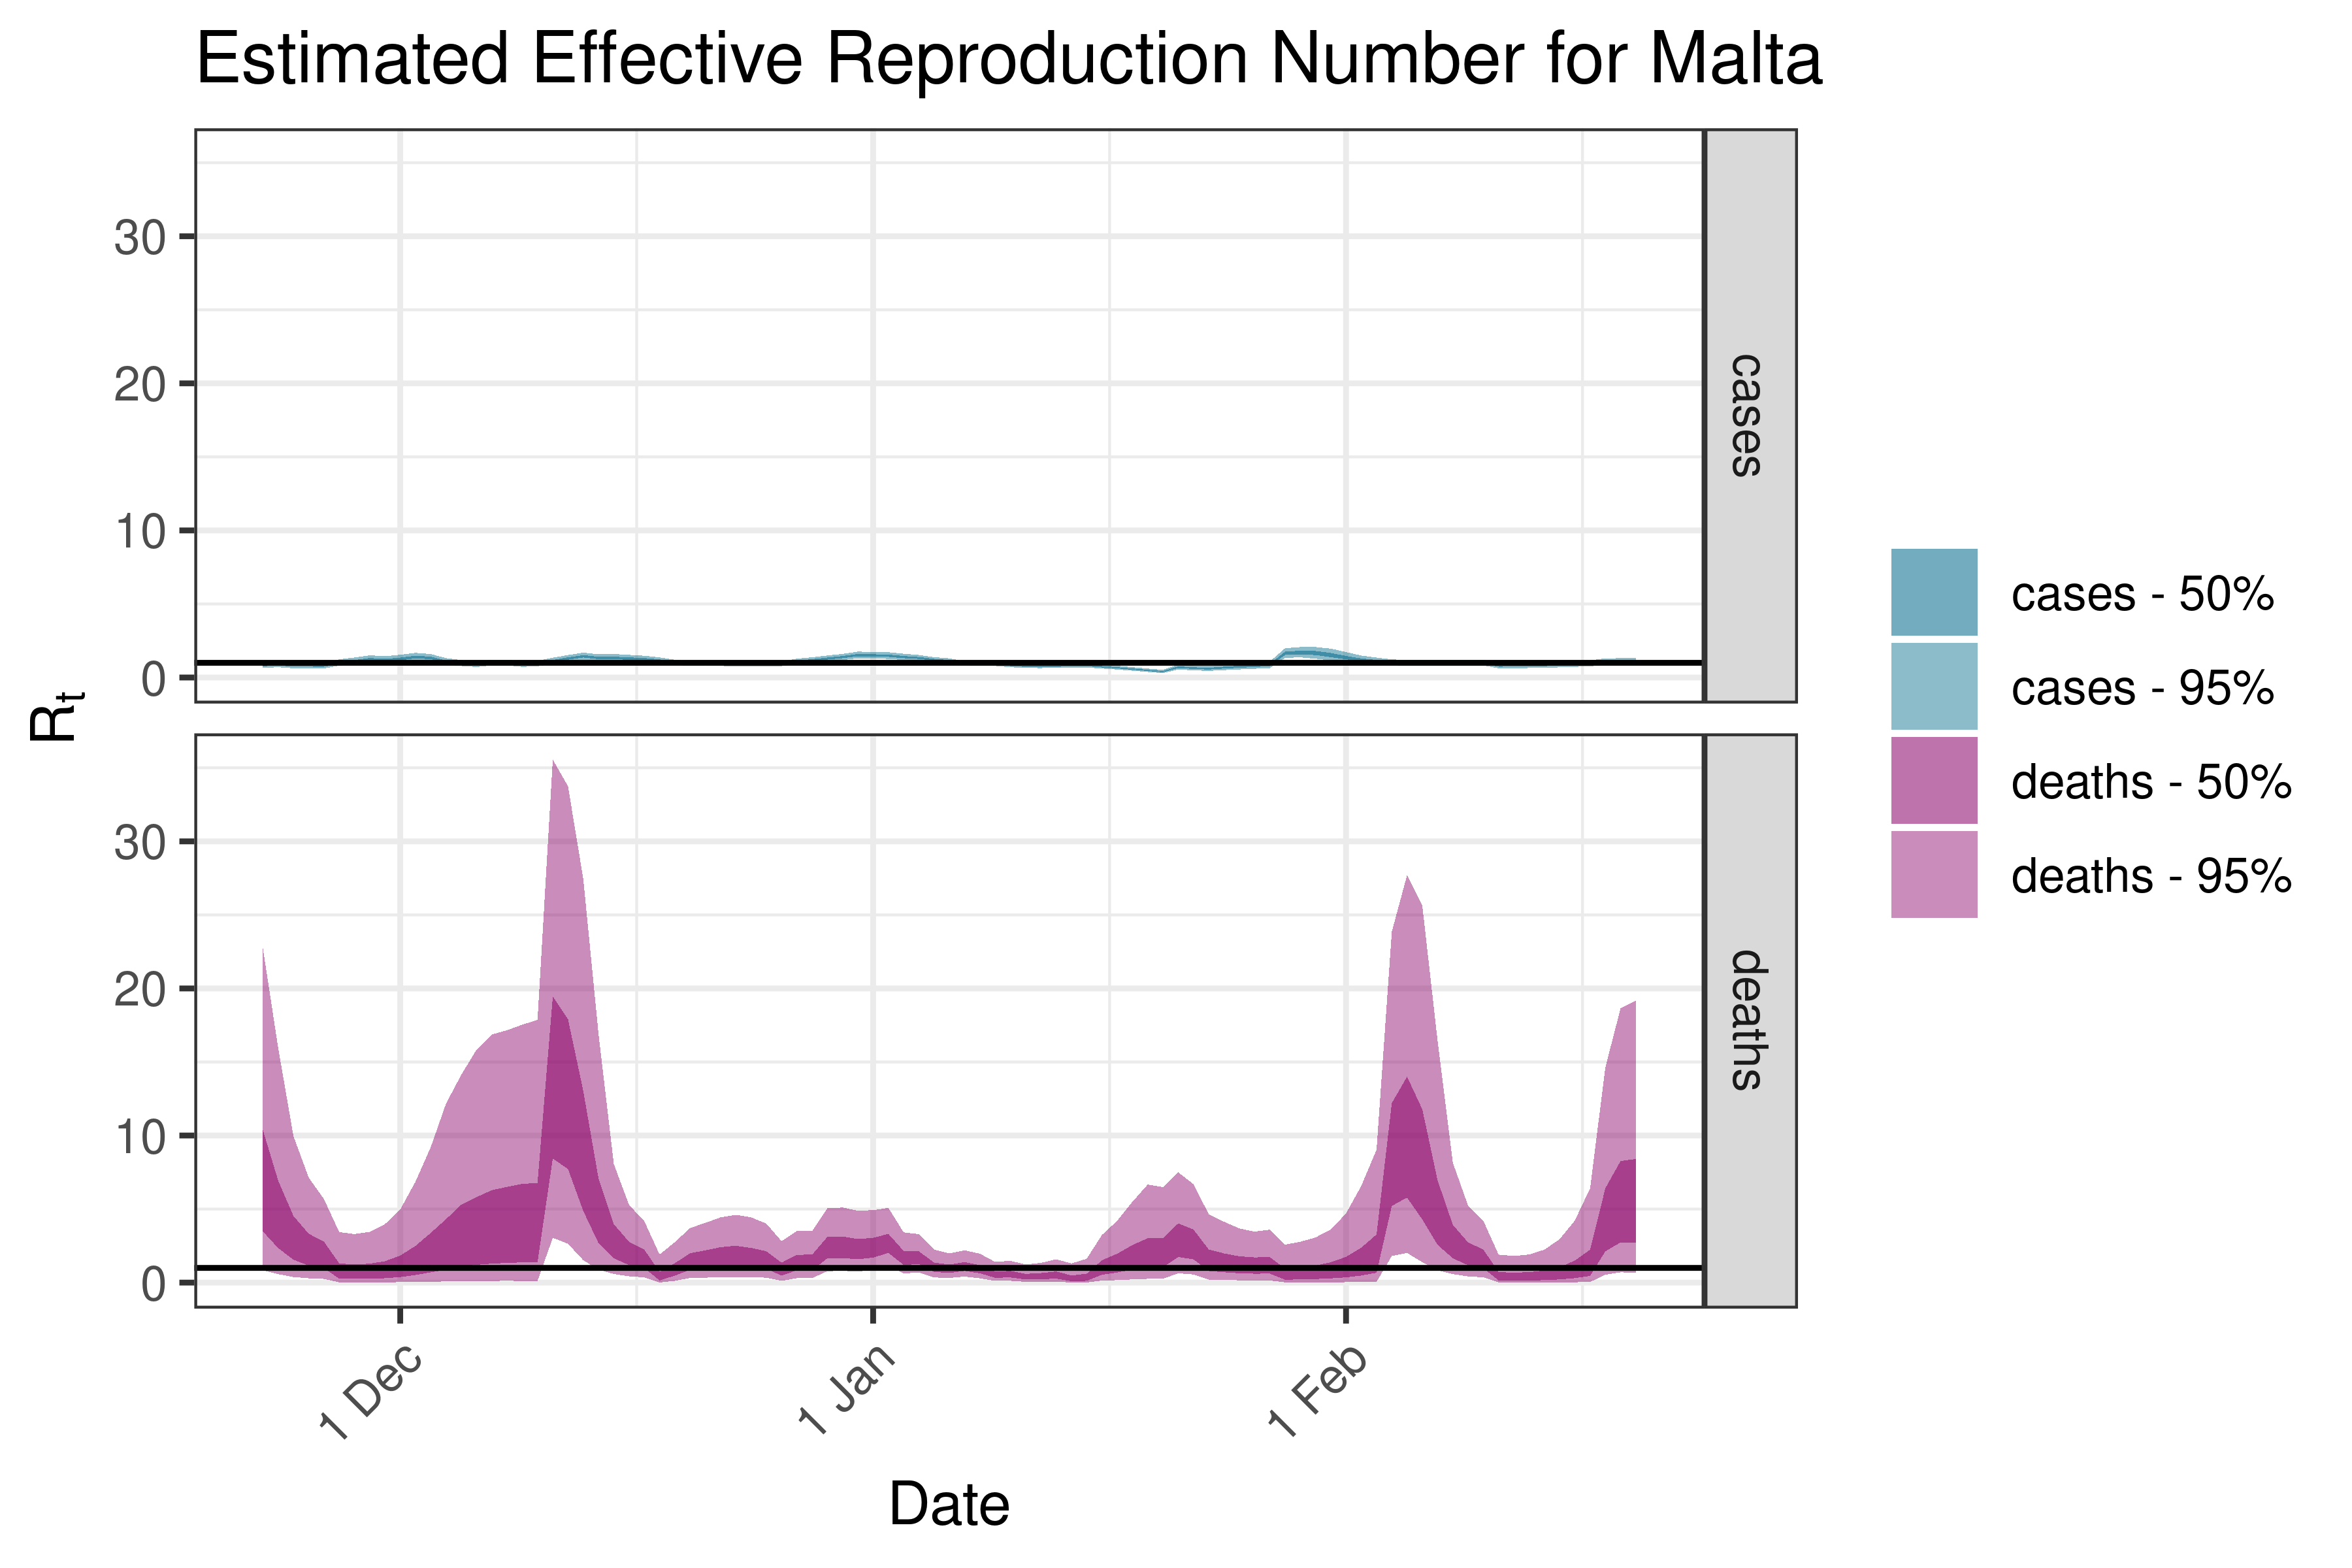
6.5.3.22 Malta
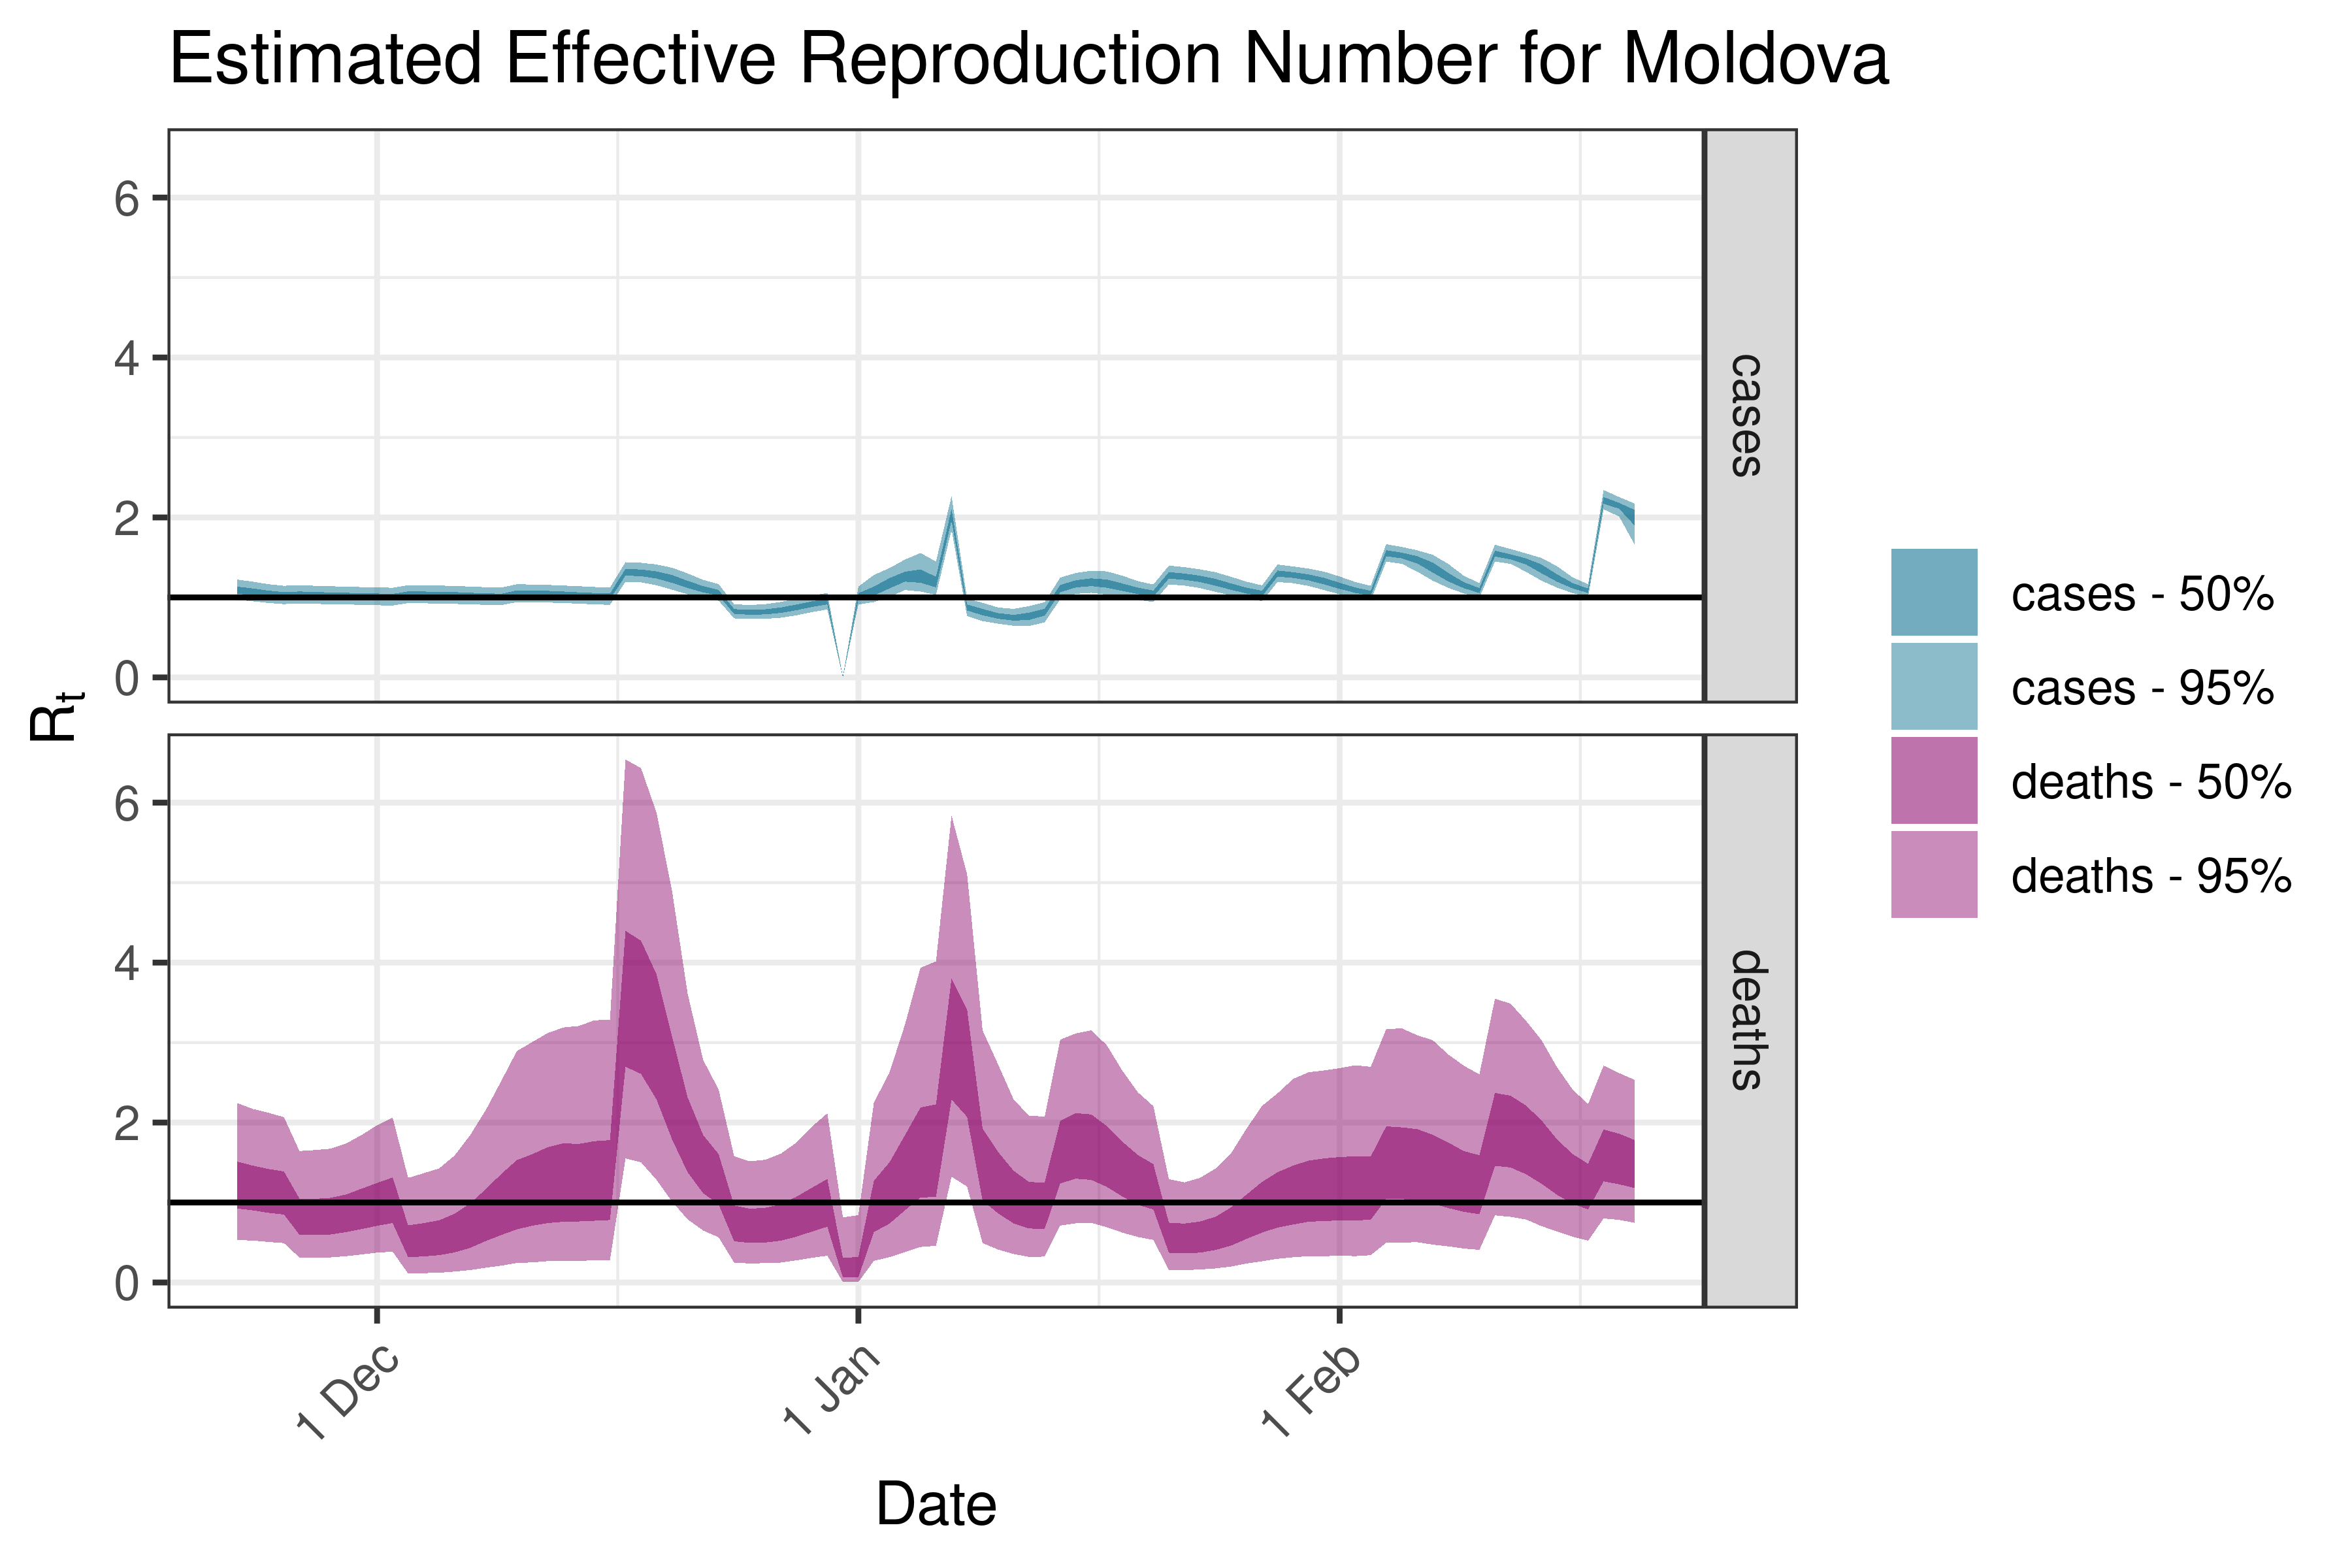
6.5.3.23 Moldova
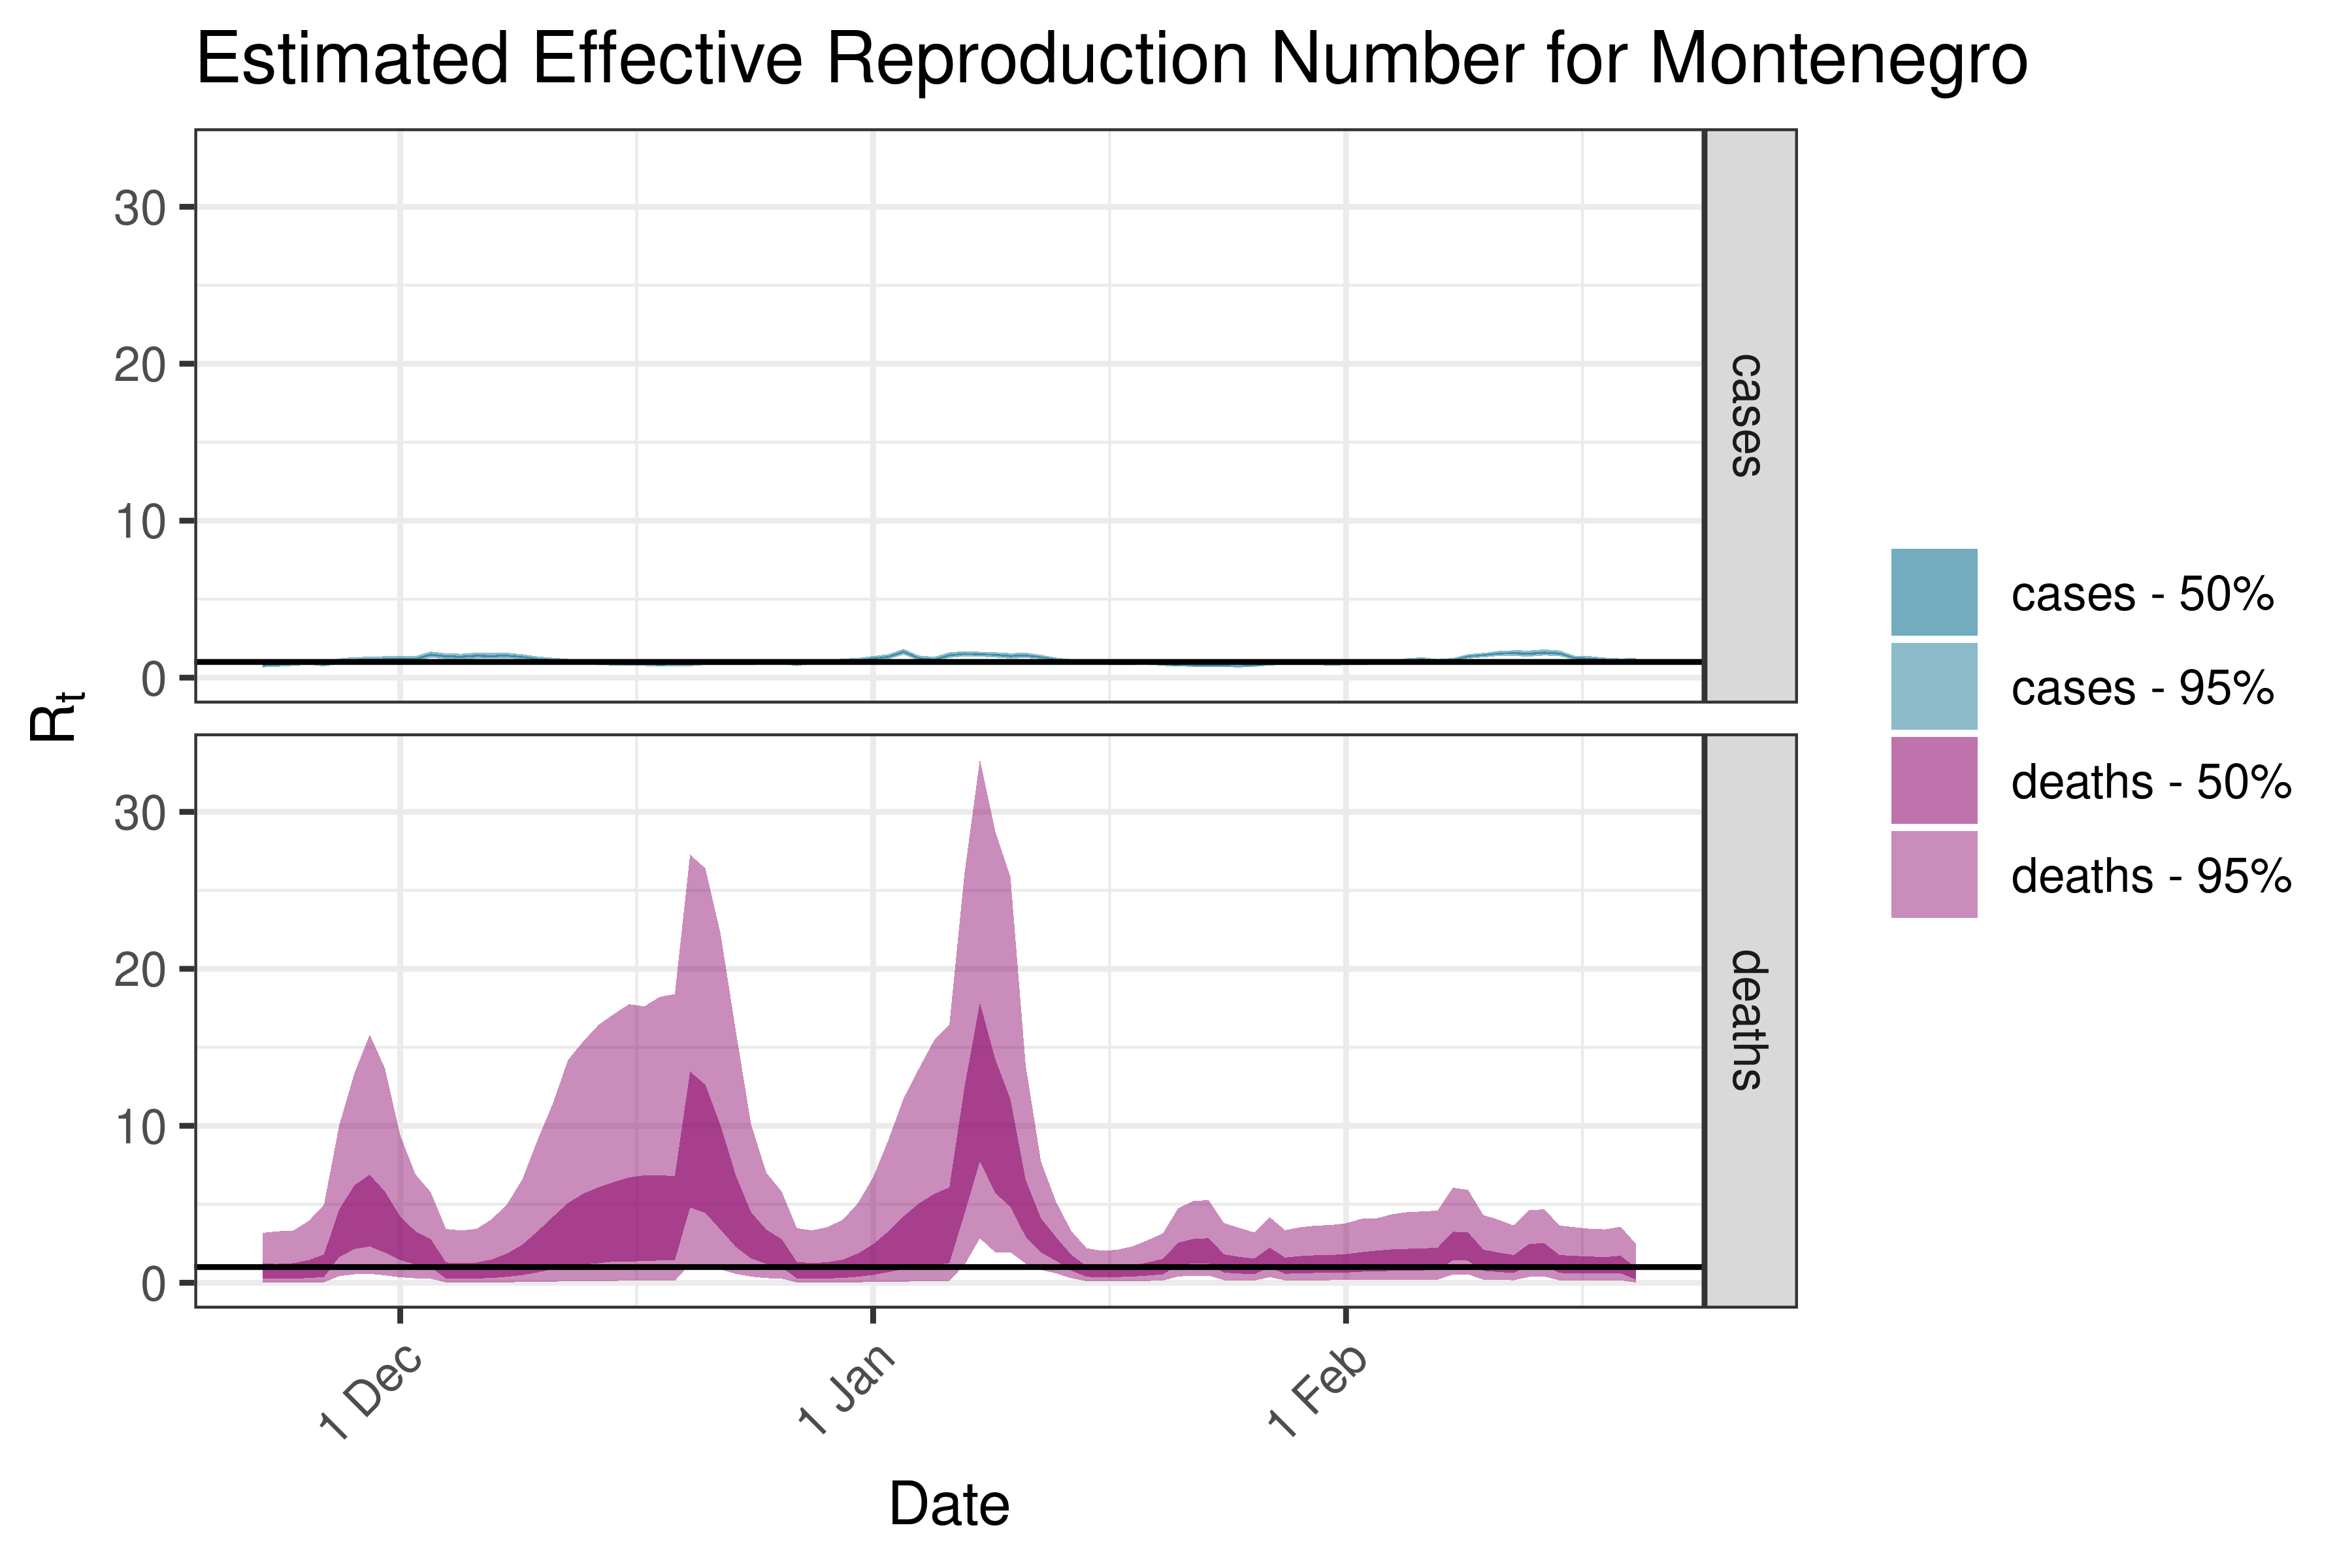
6.5.3.24 Montenegro
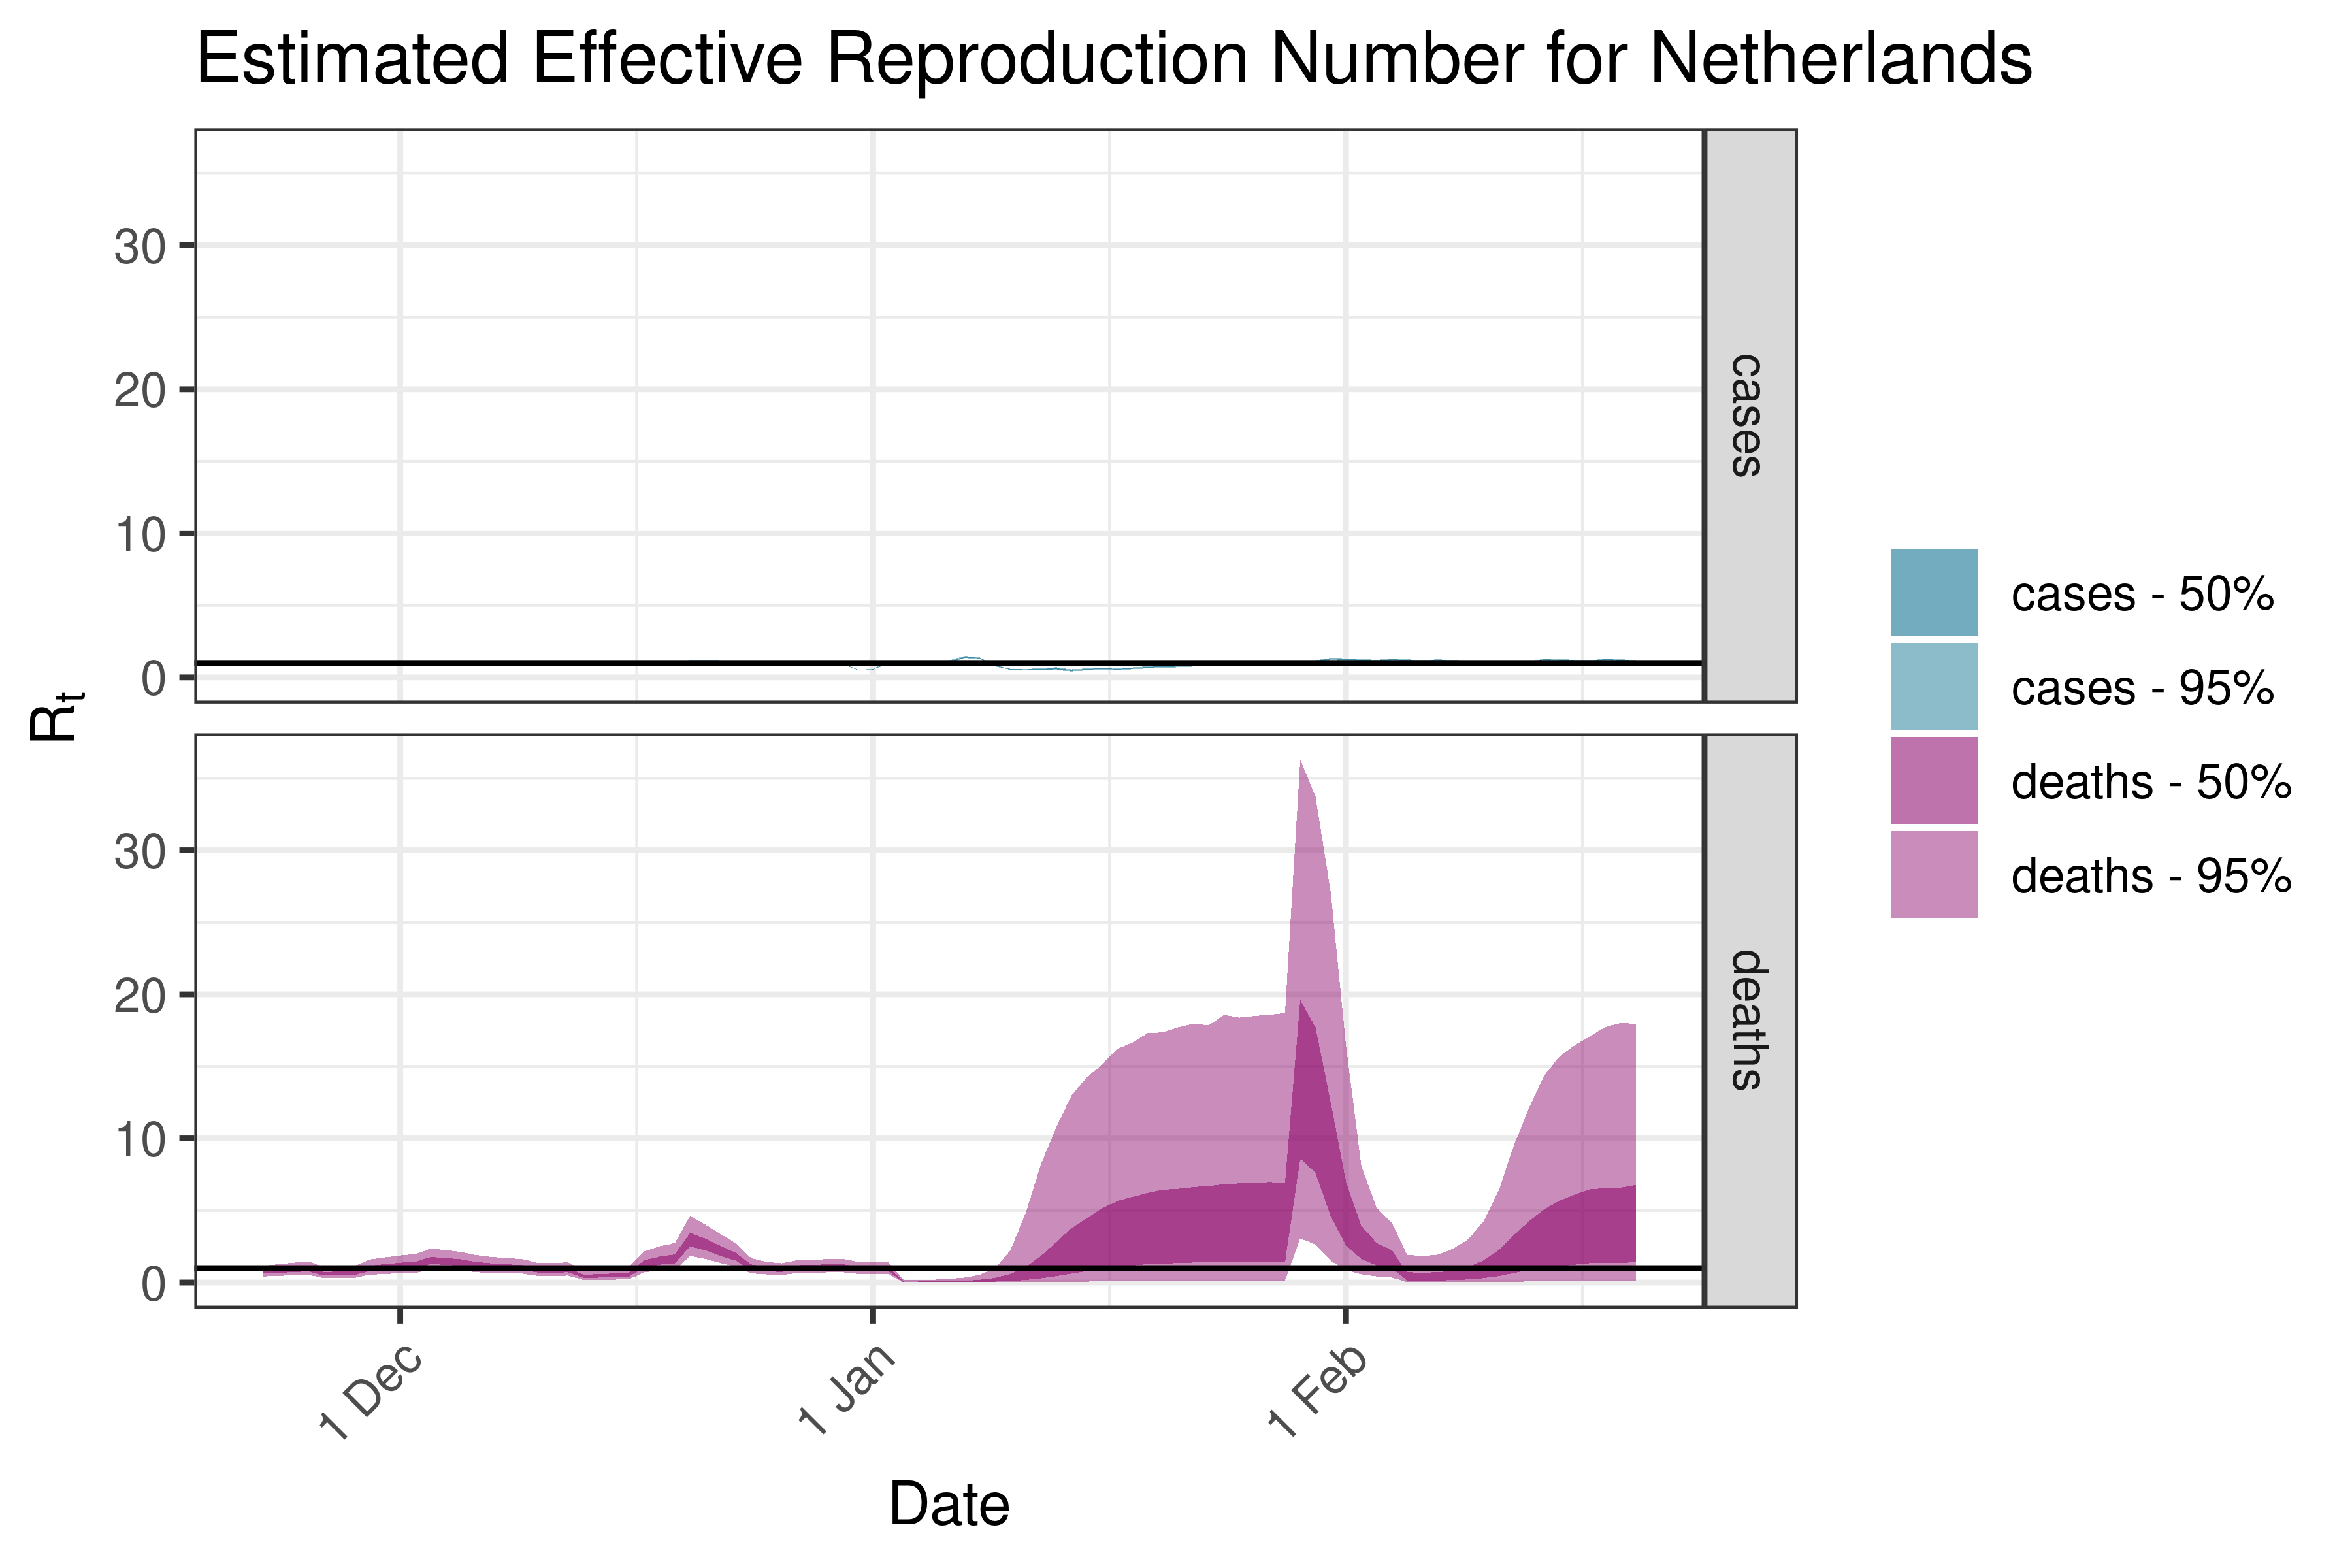
6.5.3.25 Netherlands
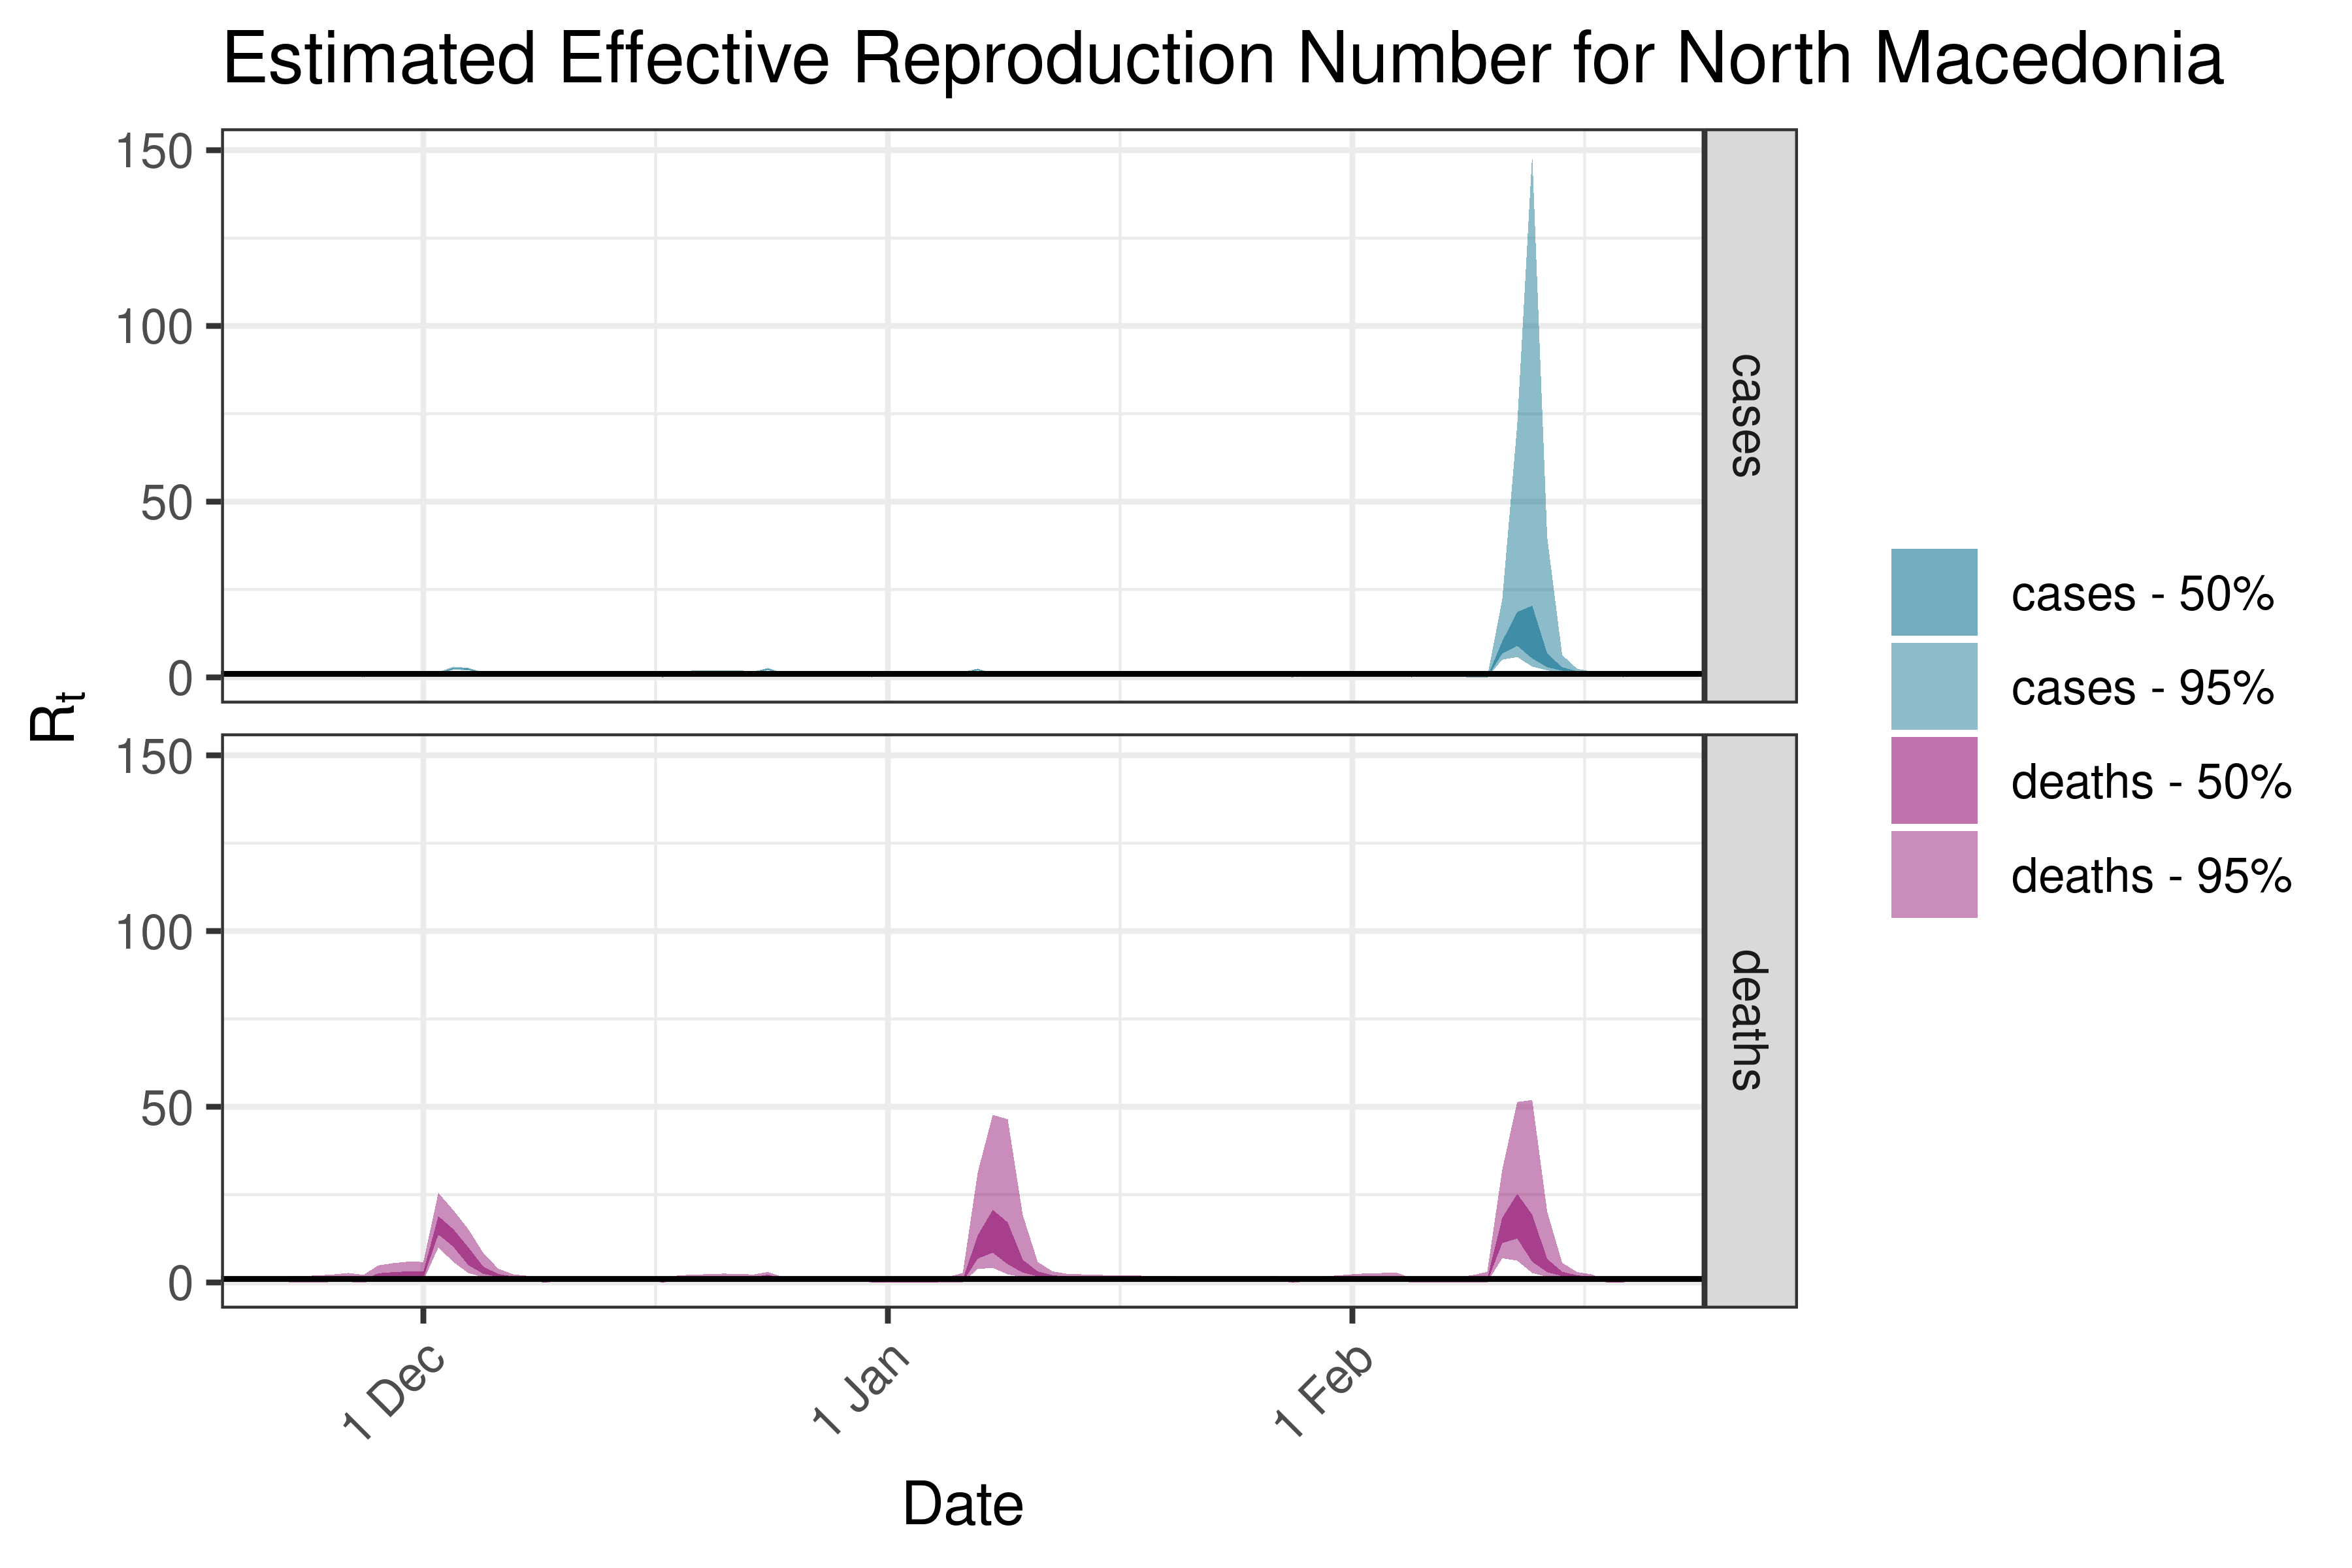
6.5.3.26 North Macedonia
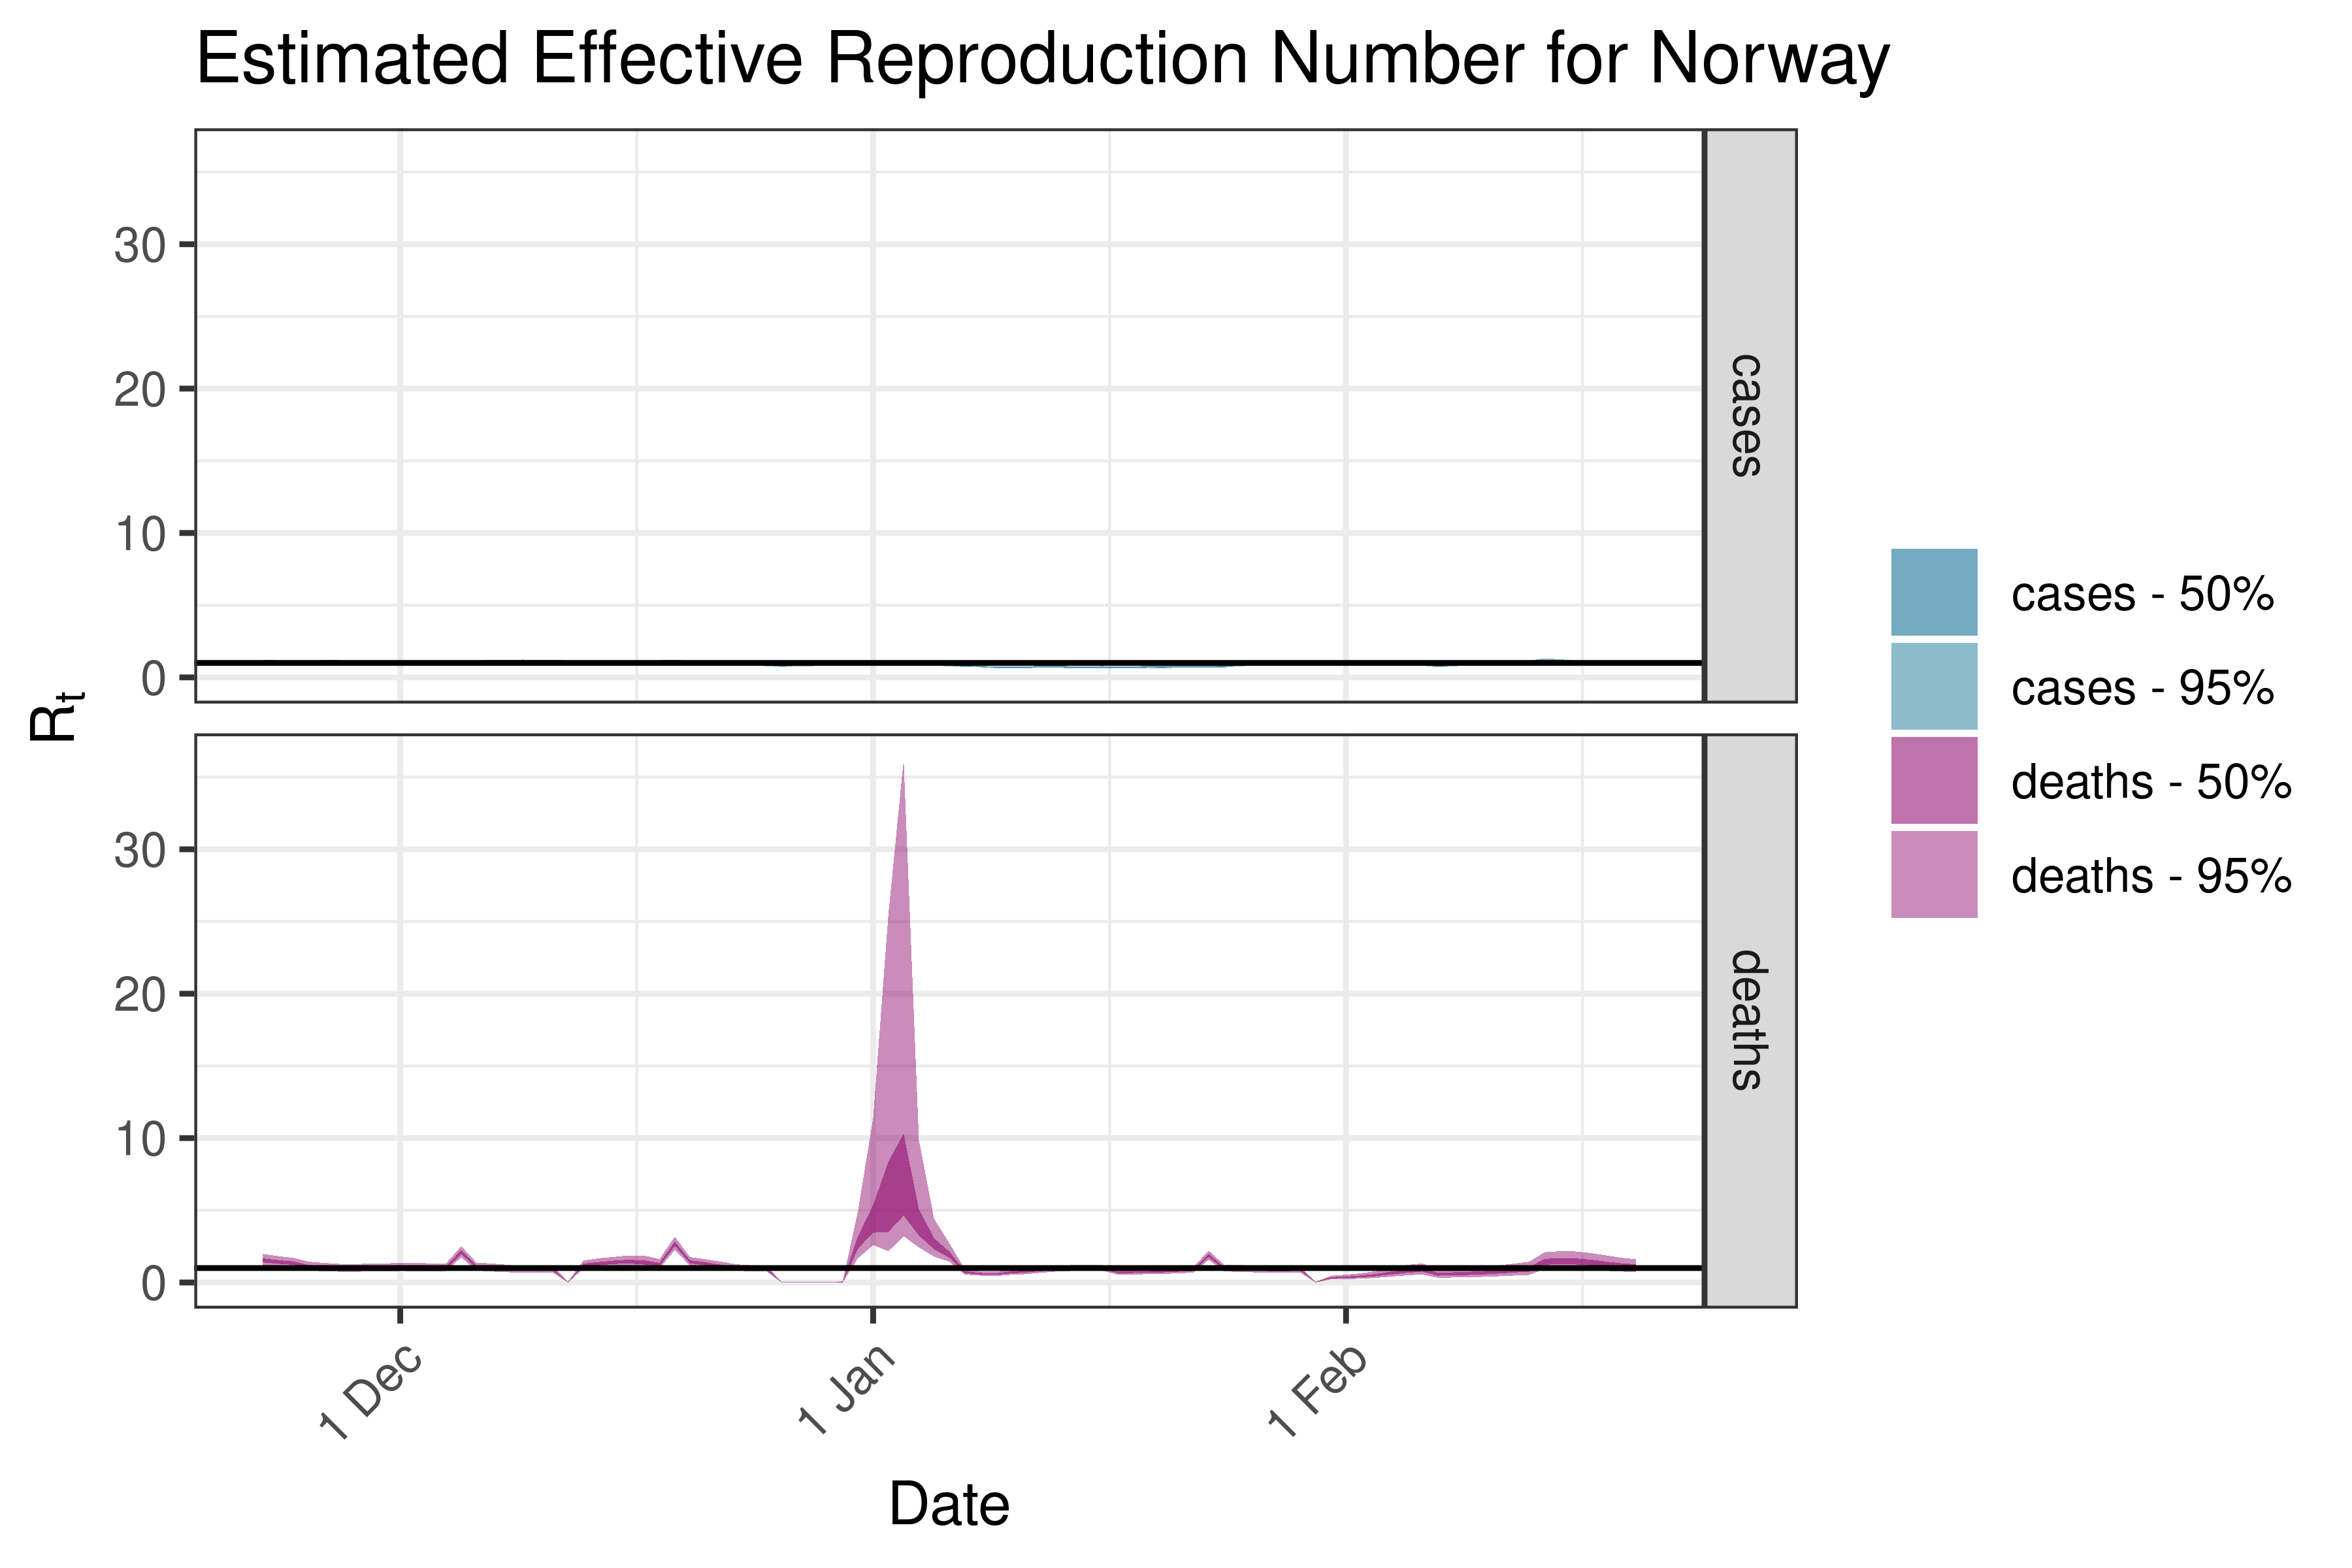
6.5.3.27 Norway
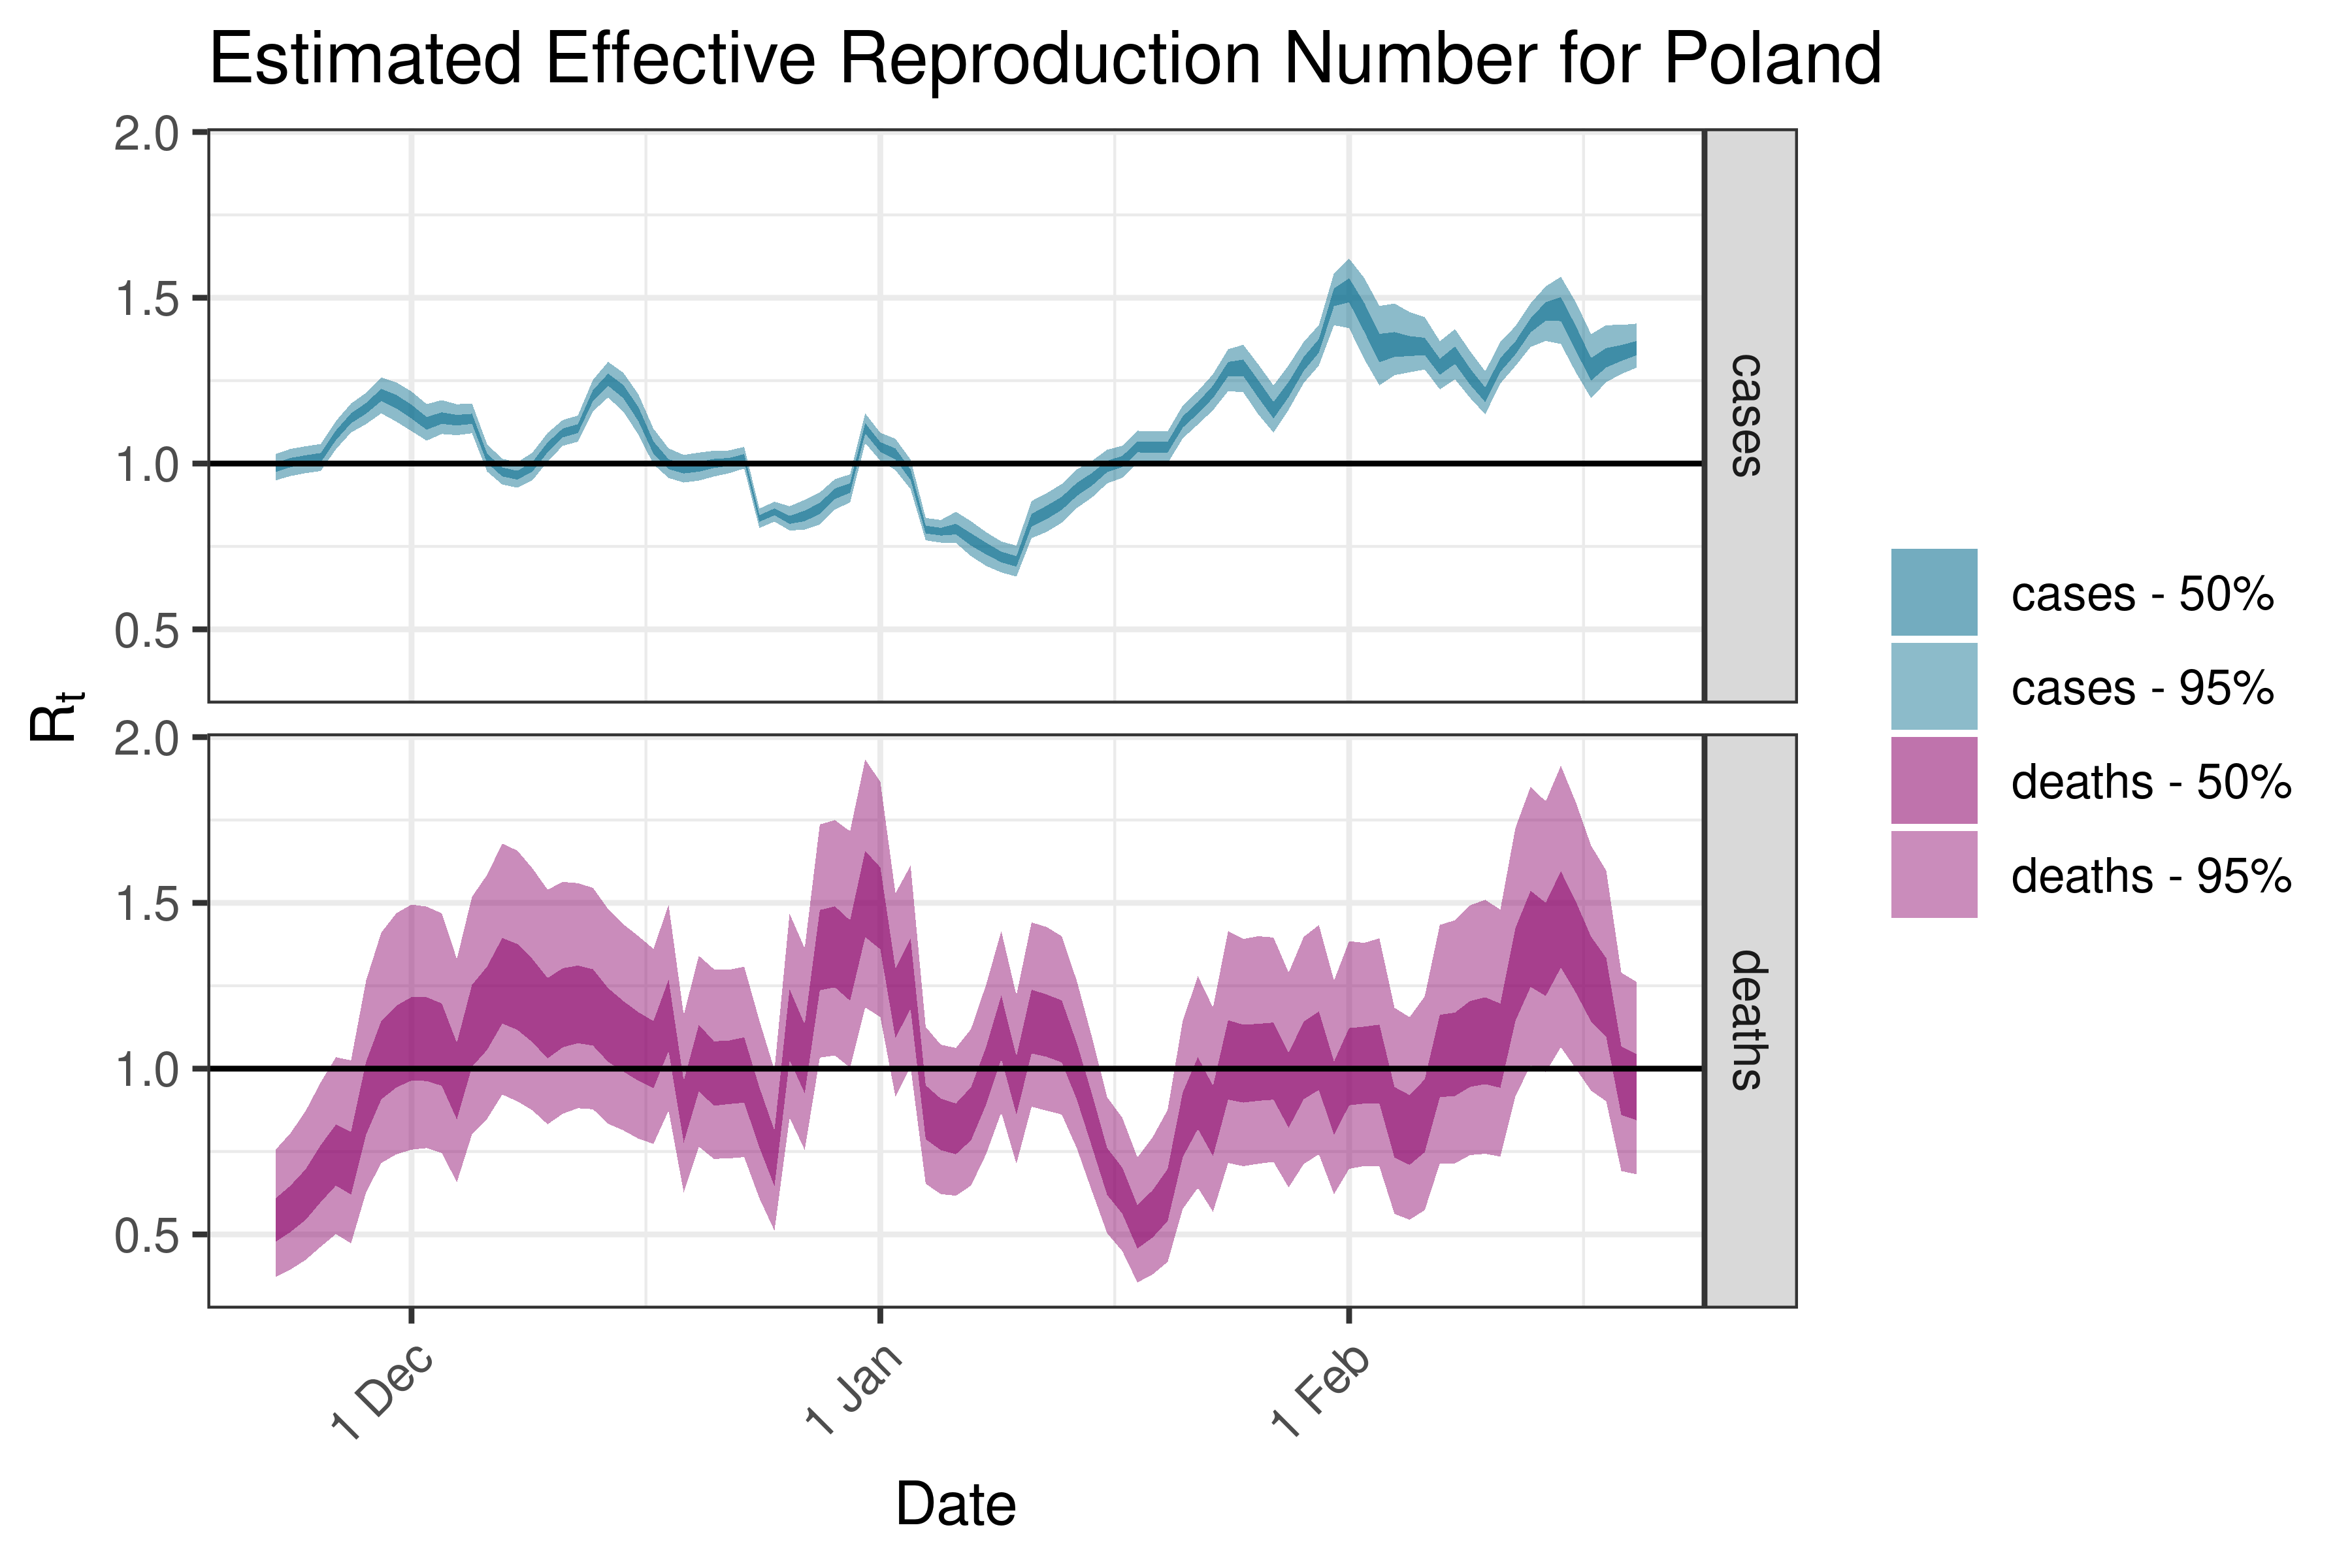
6.5.3.28 Poland
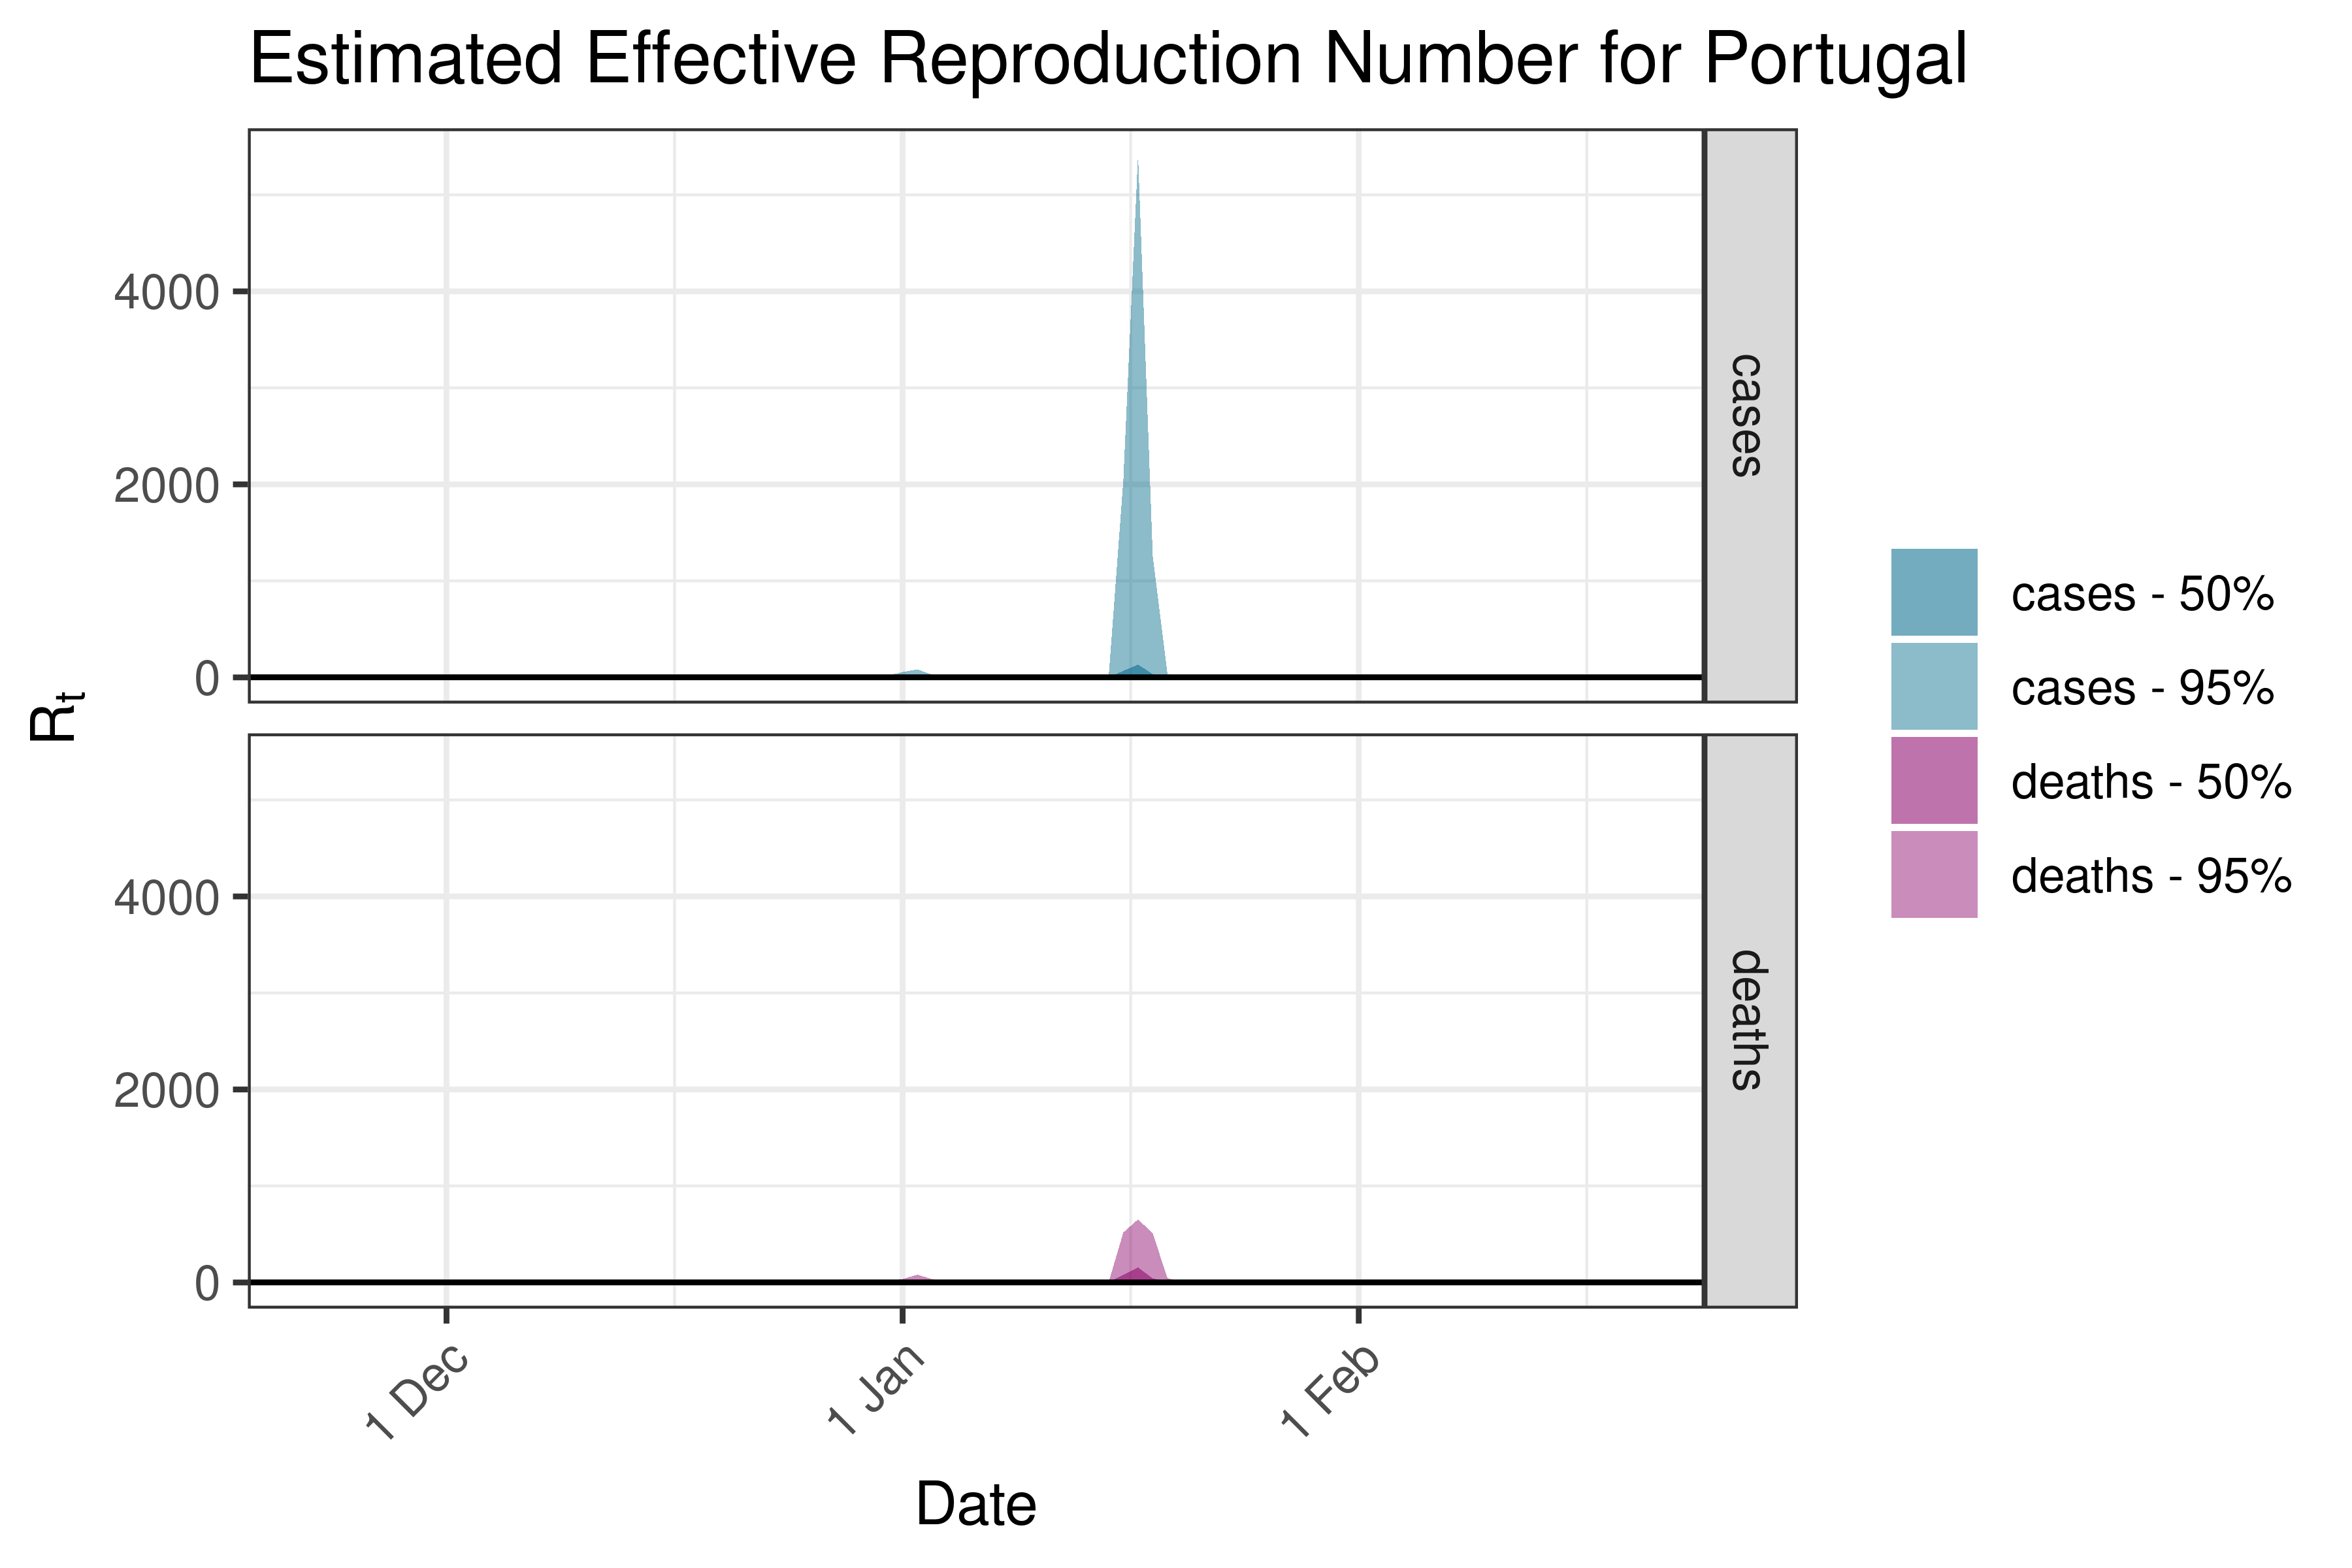
6.5.3.29 Portugal
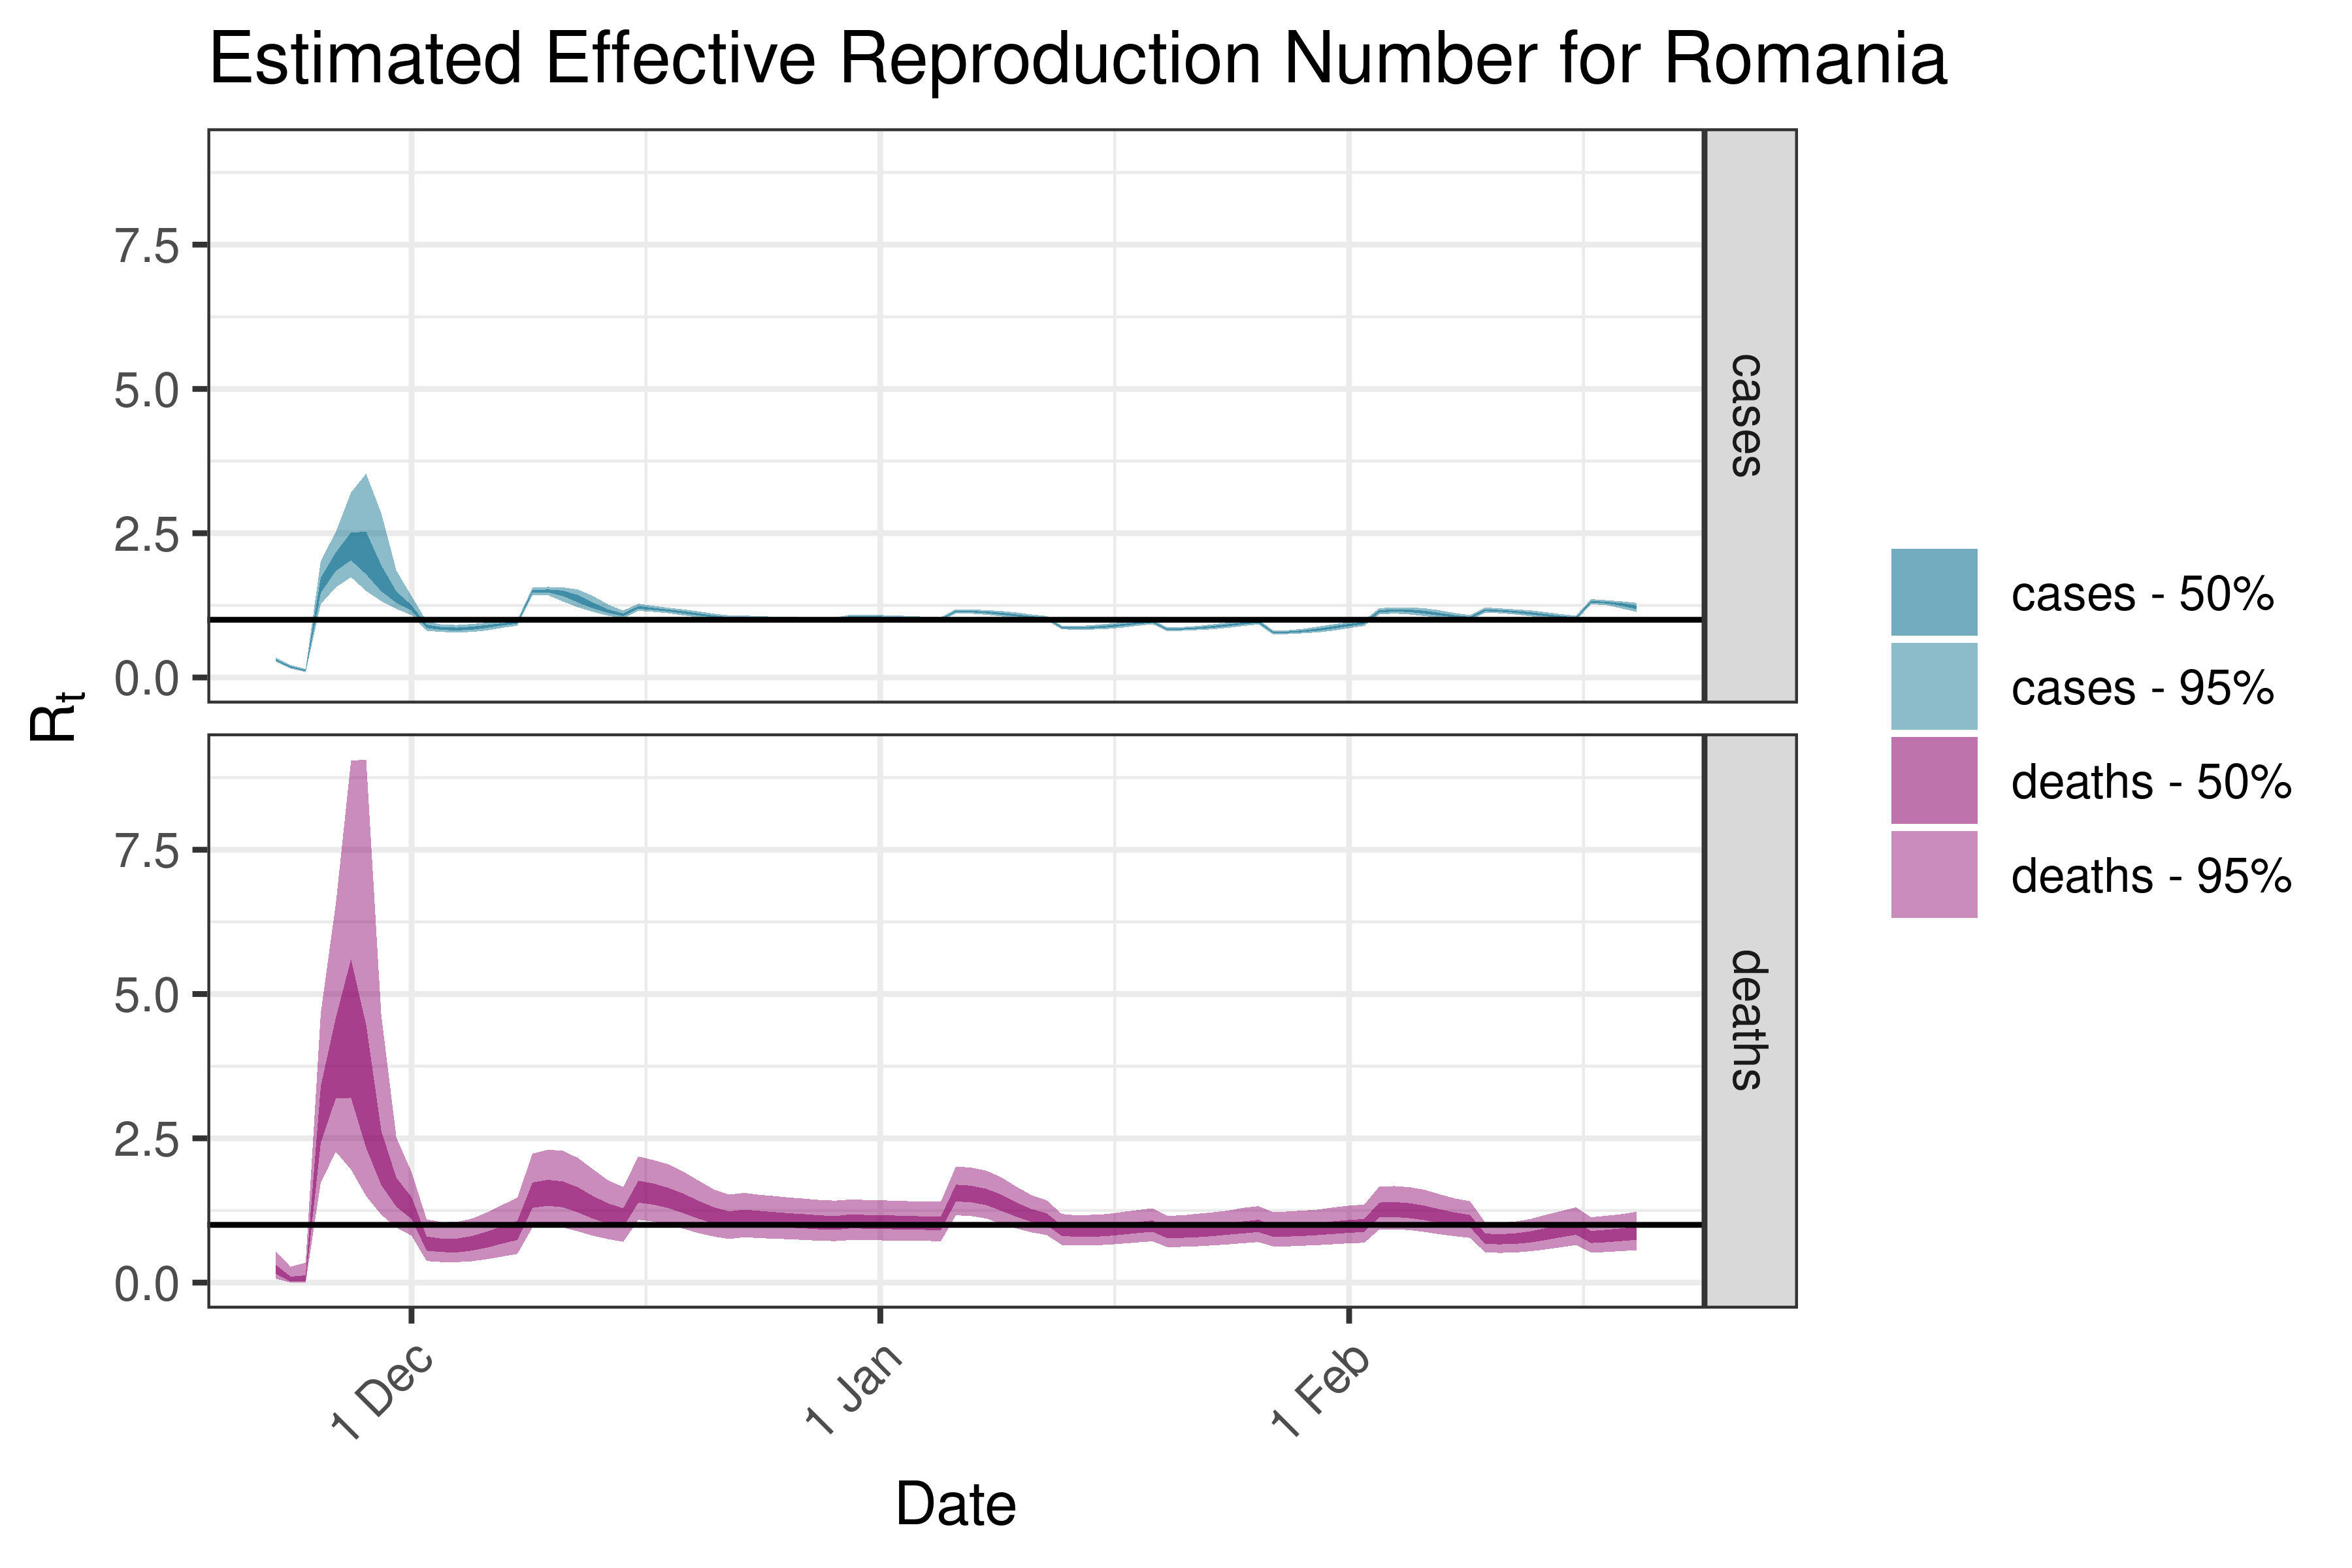
6.5.3.30 Romania
6.5.3.31 Russia
6.5.3.32 Serbia
6.5.3.33 Slovakia
6.5.3.34 Slovenia
6.5.3.35 Spain
6.5.3.36 Sweden
6.5.3.37 Switzerland
6.5.3.38 Ukraine
6.5.3.39 United Kingdom
6.5.4 North America
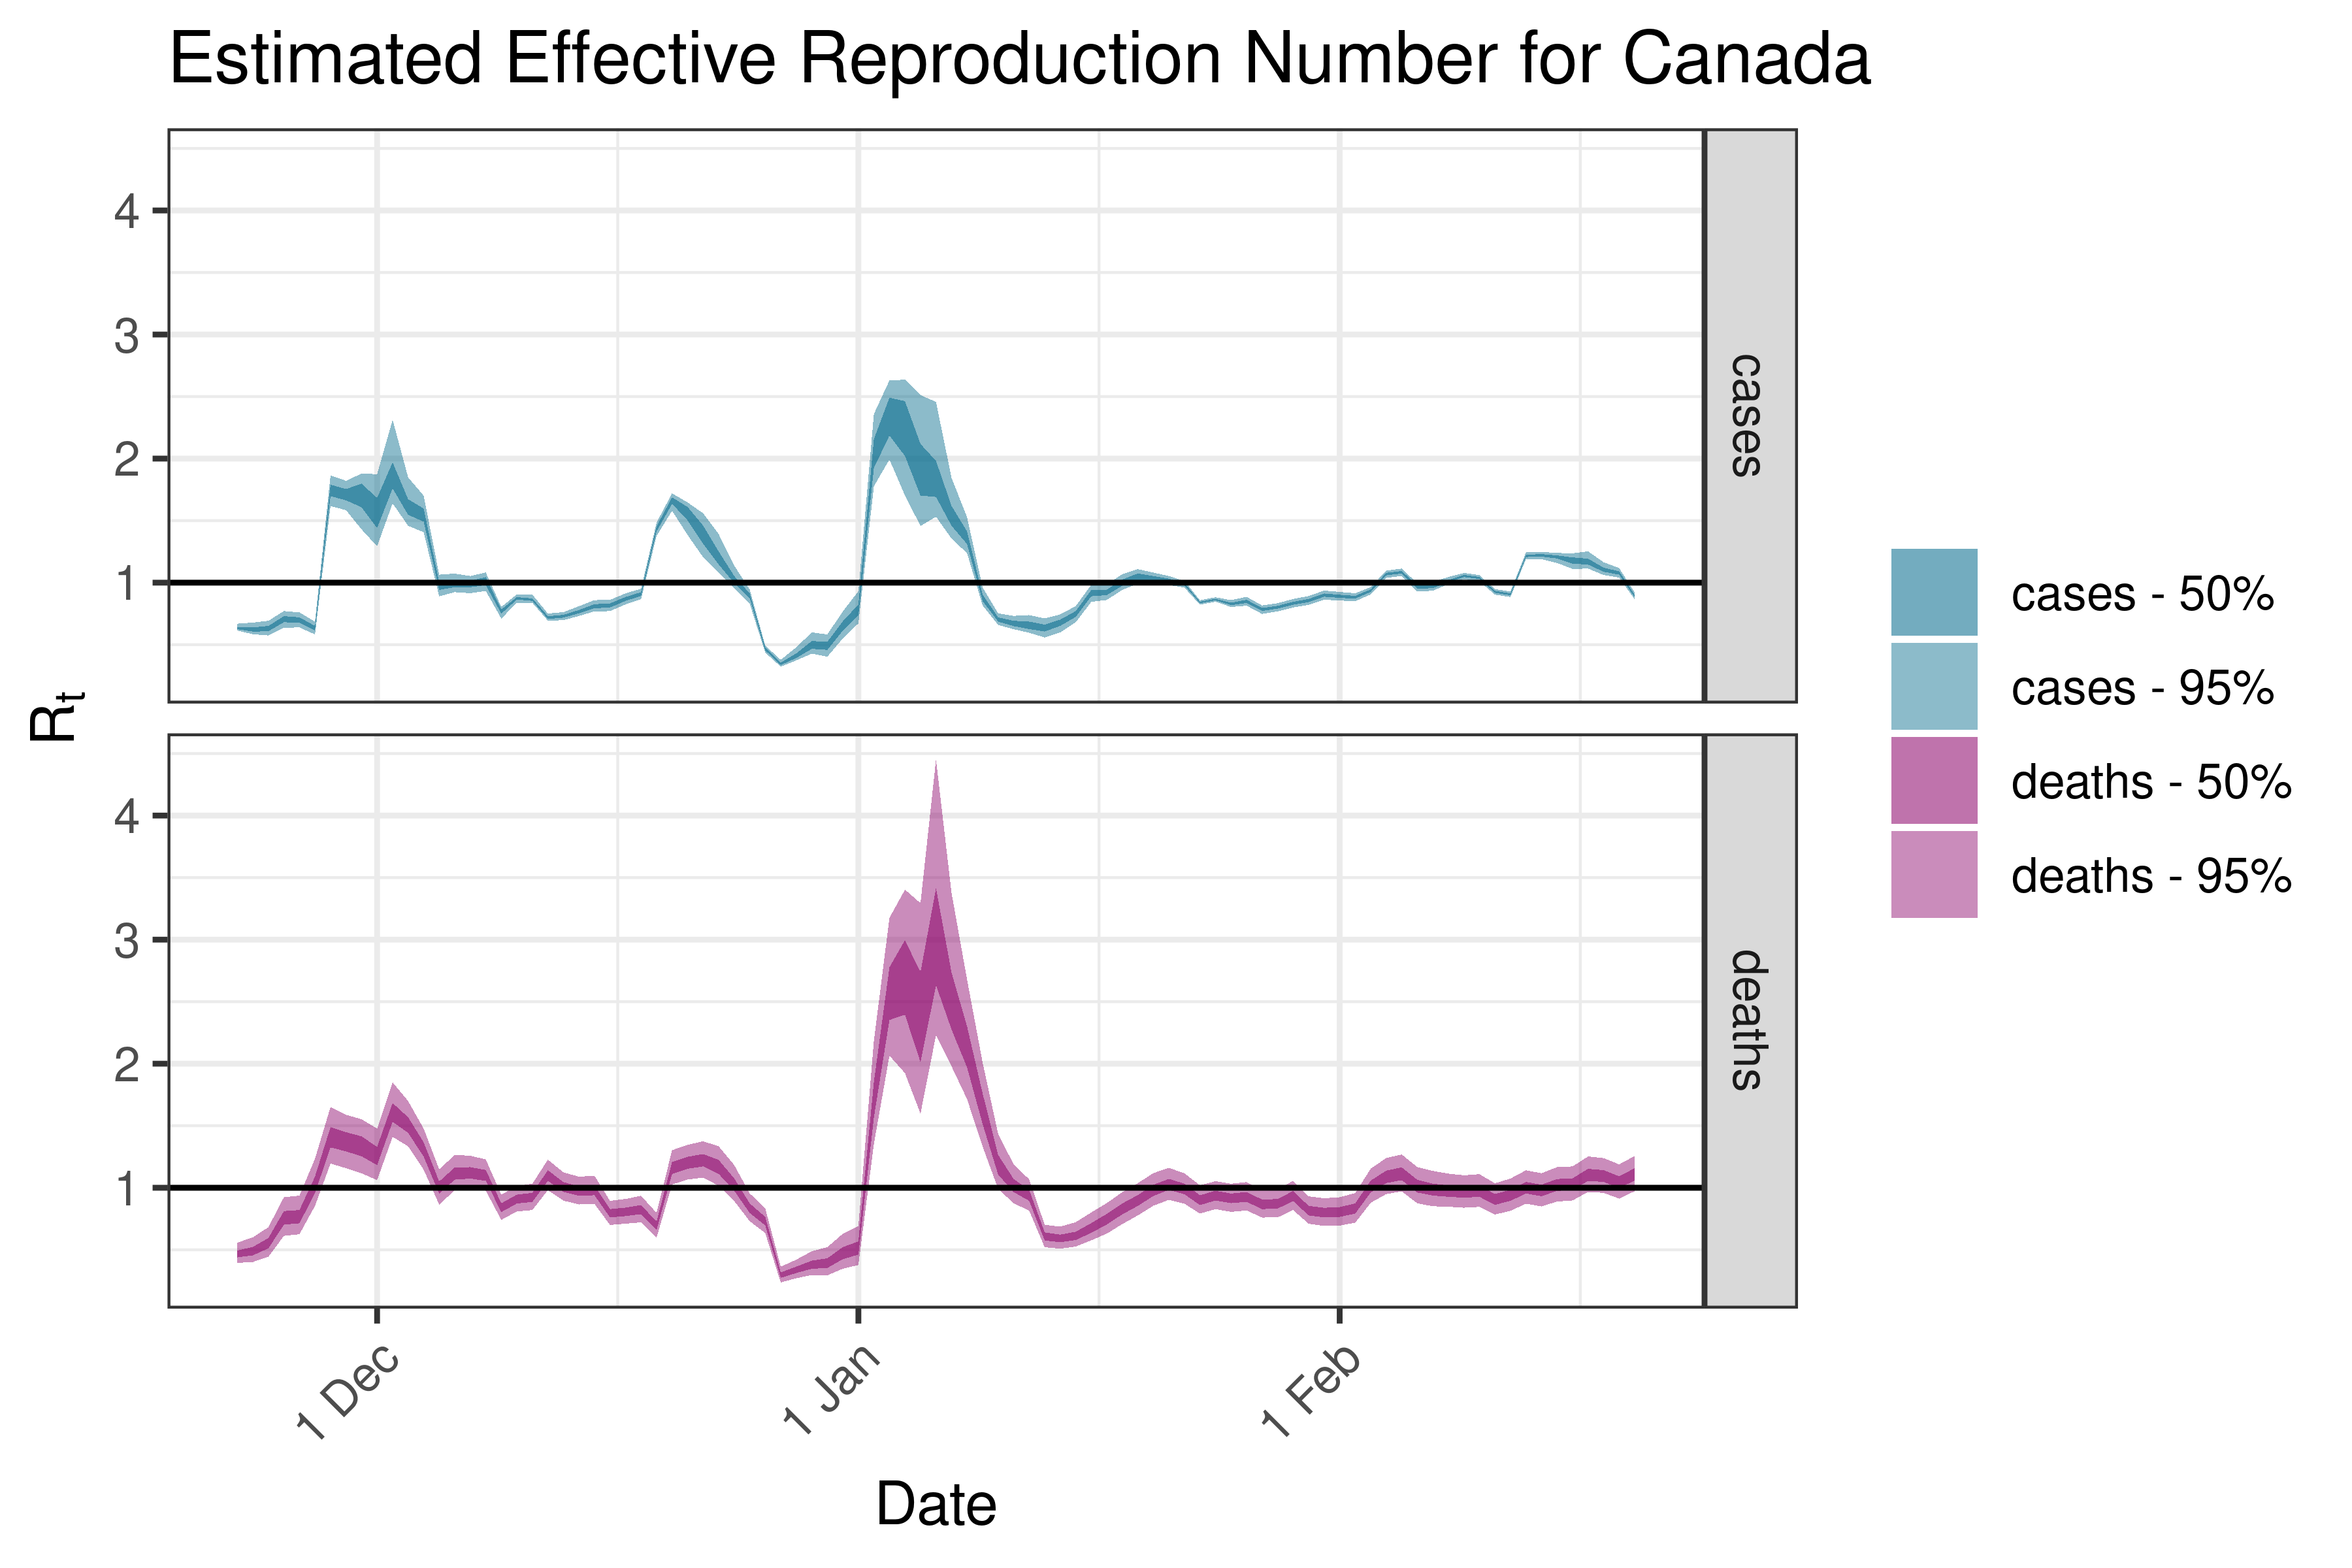
6.5.4.1 Canada
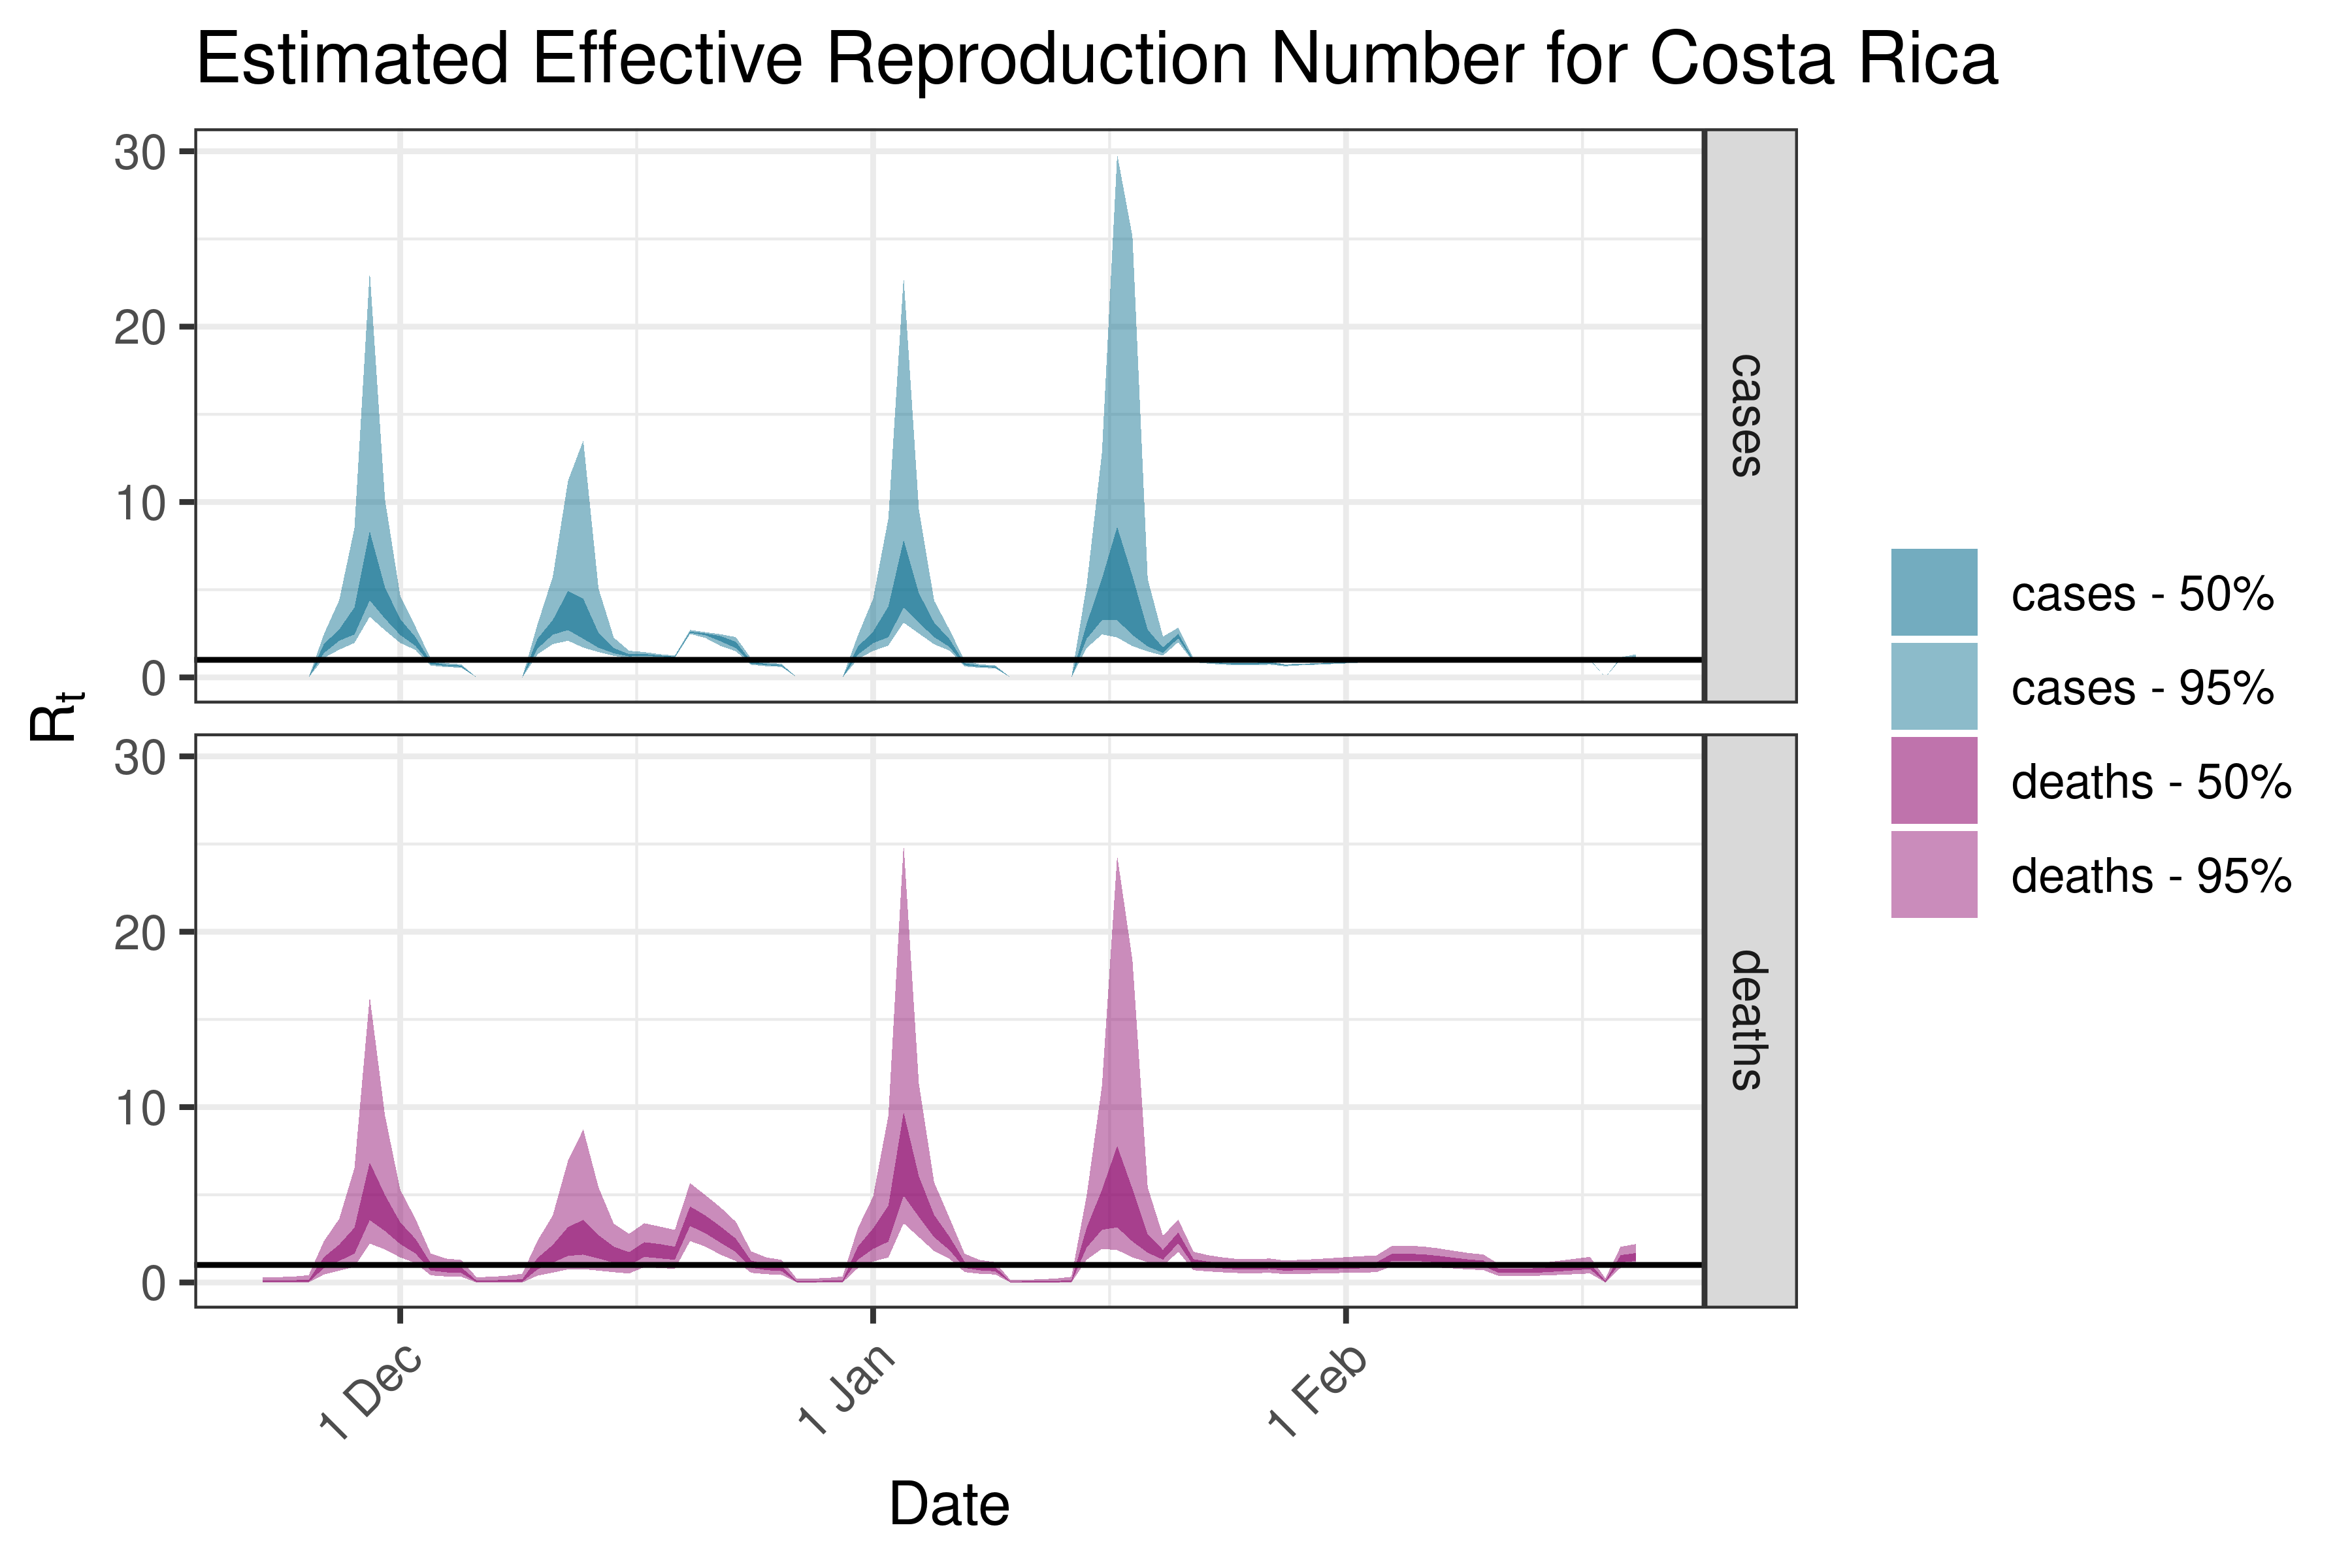
6.5.4.2 Costa Rica
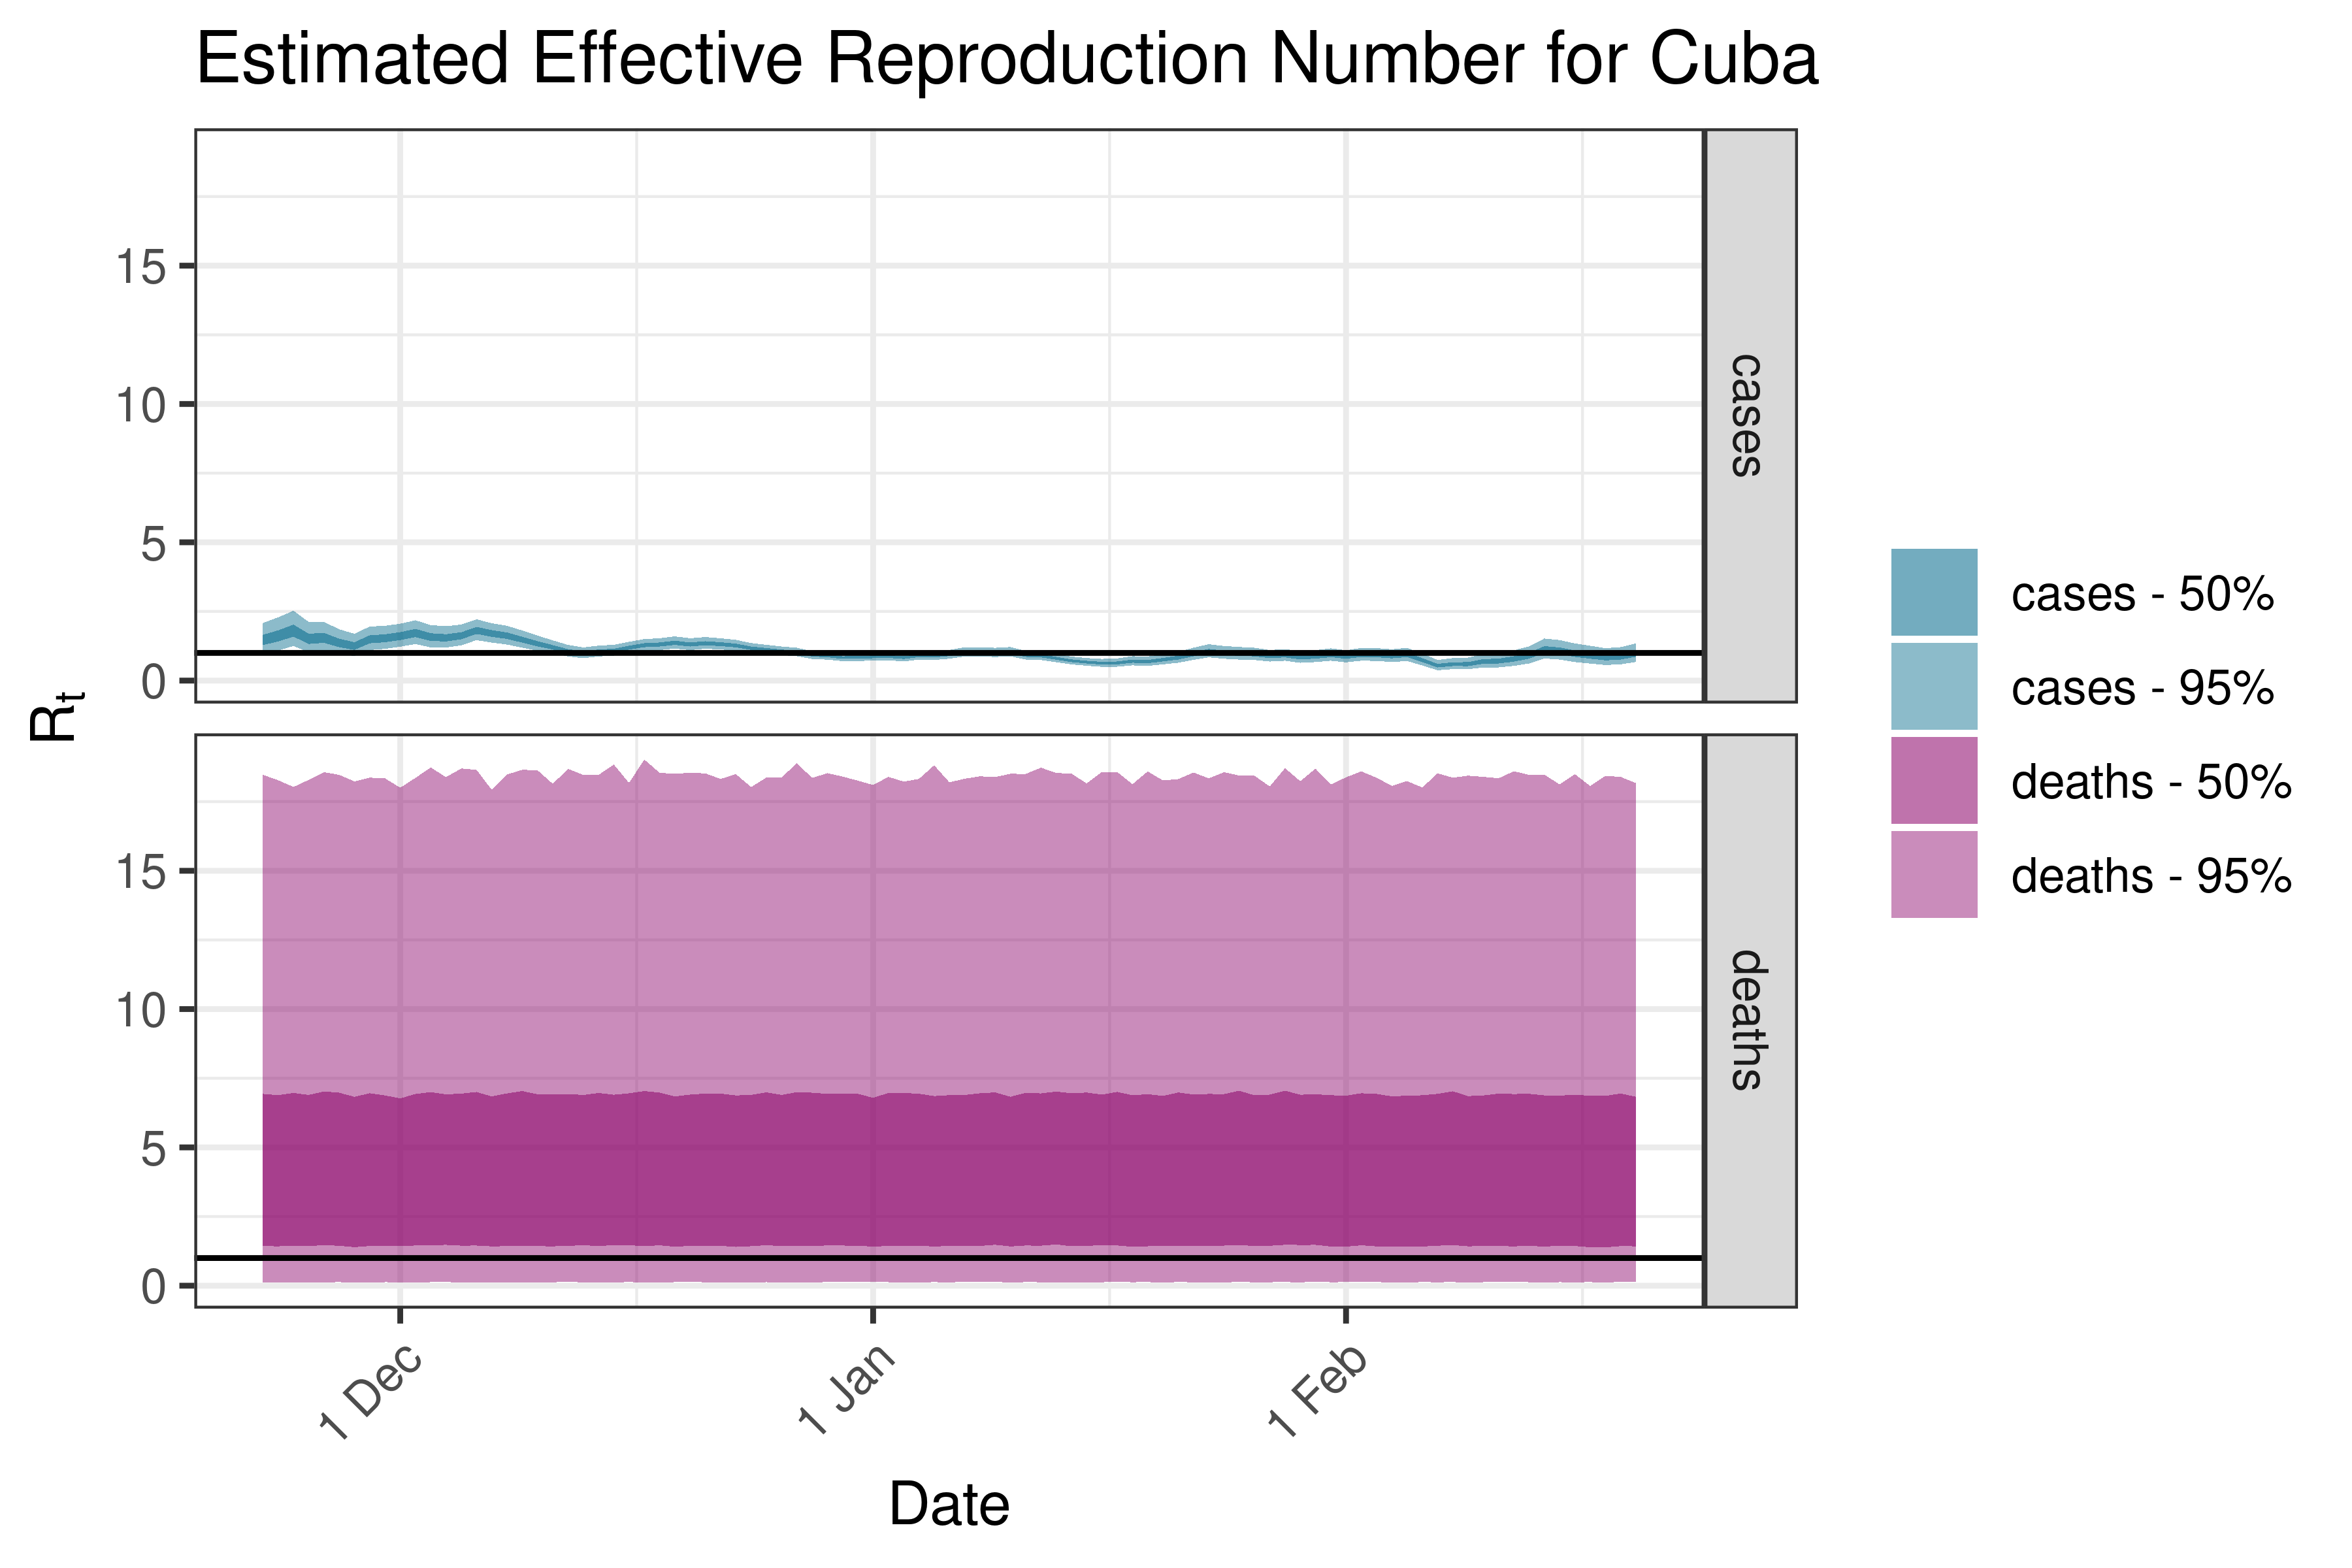
6.5.4.3 Cuba
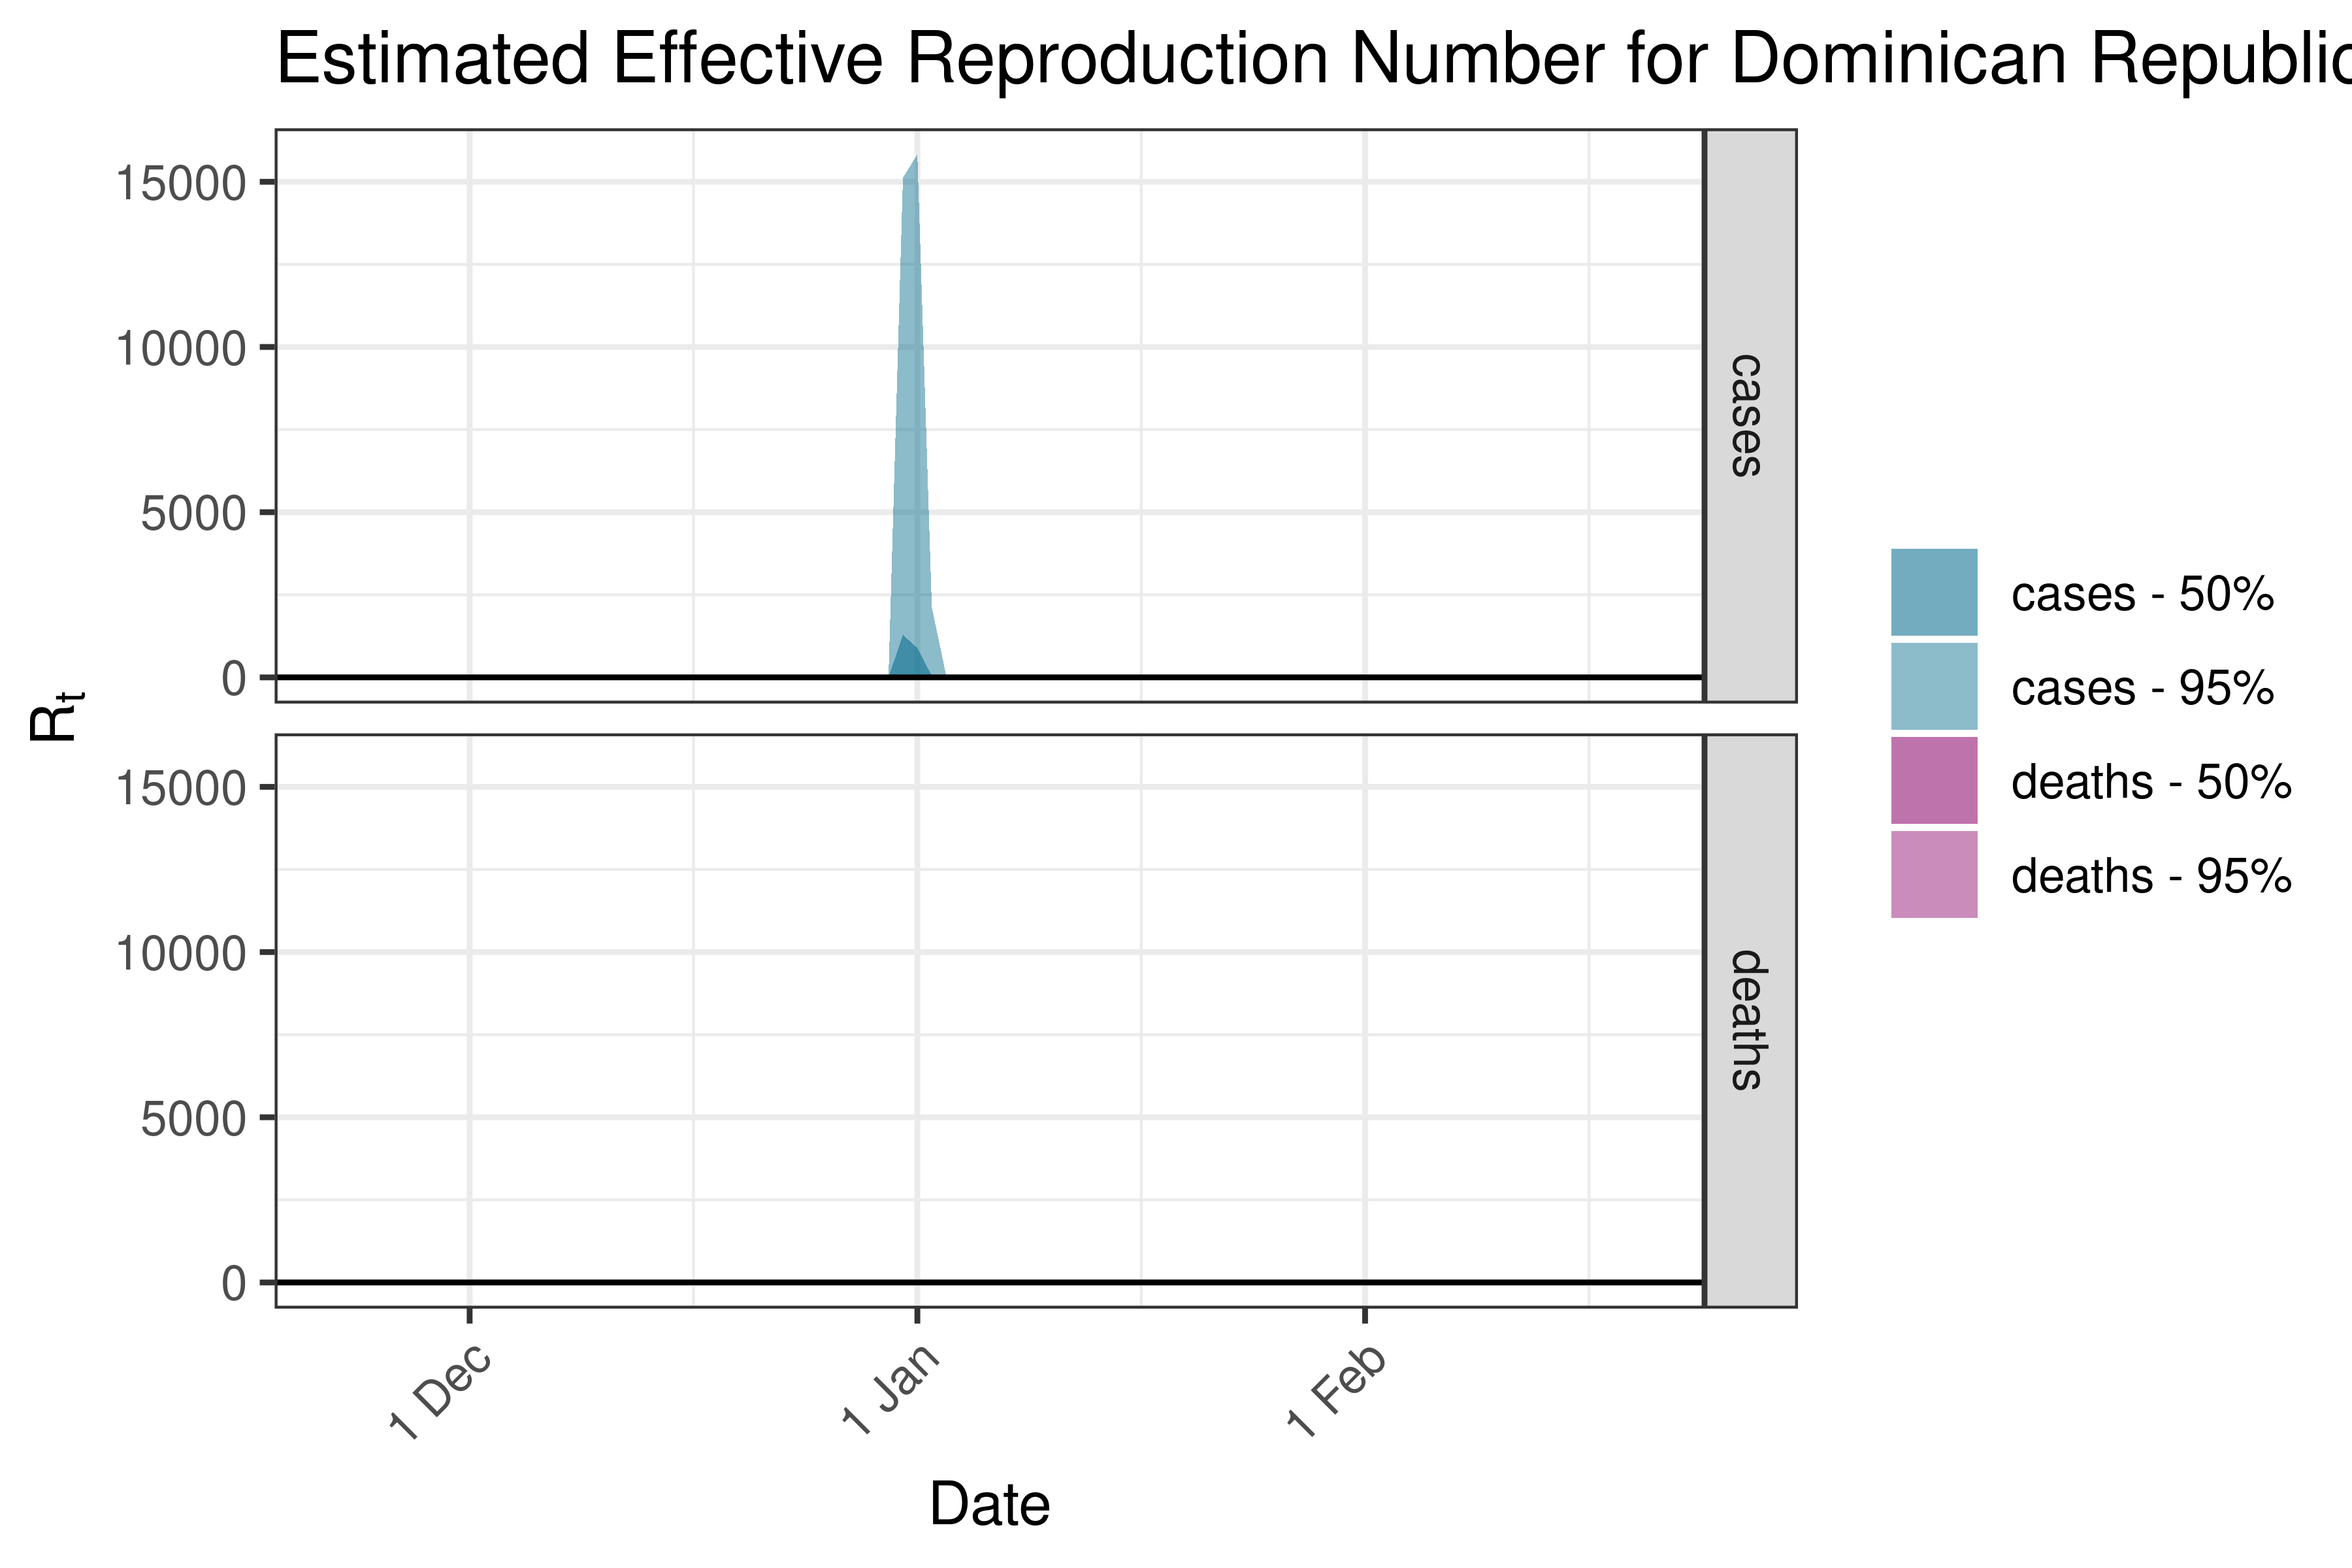
6.5.4.4 Dominican Republic
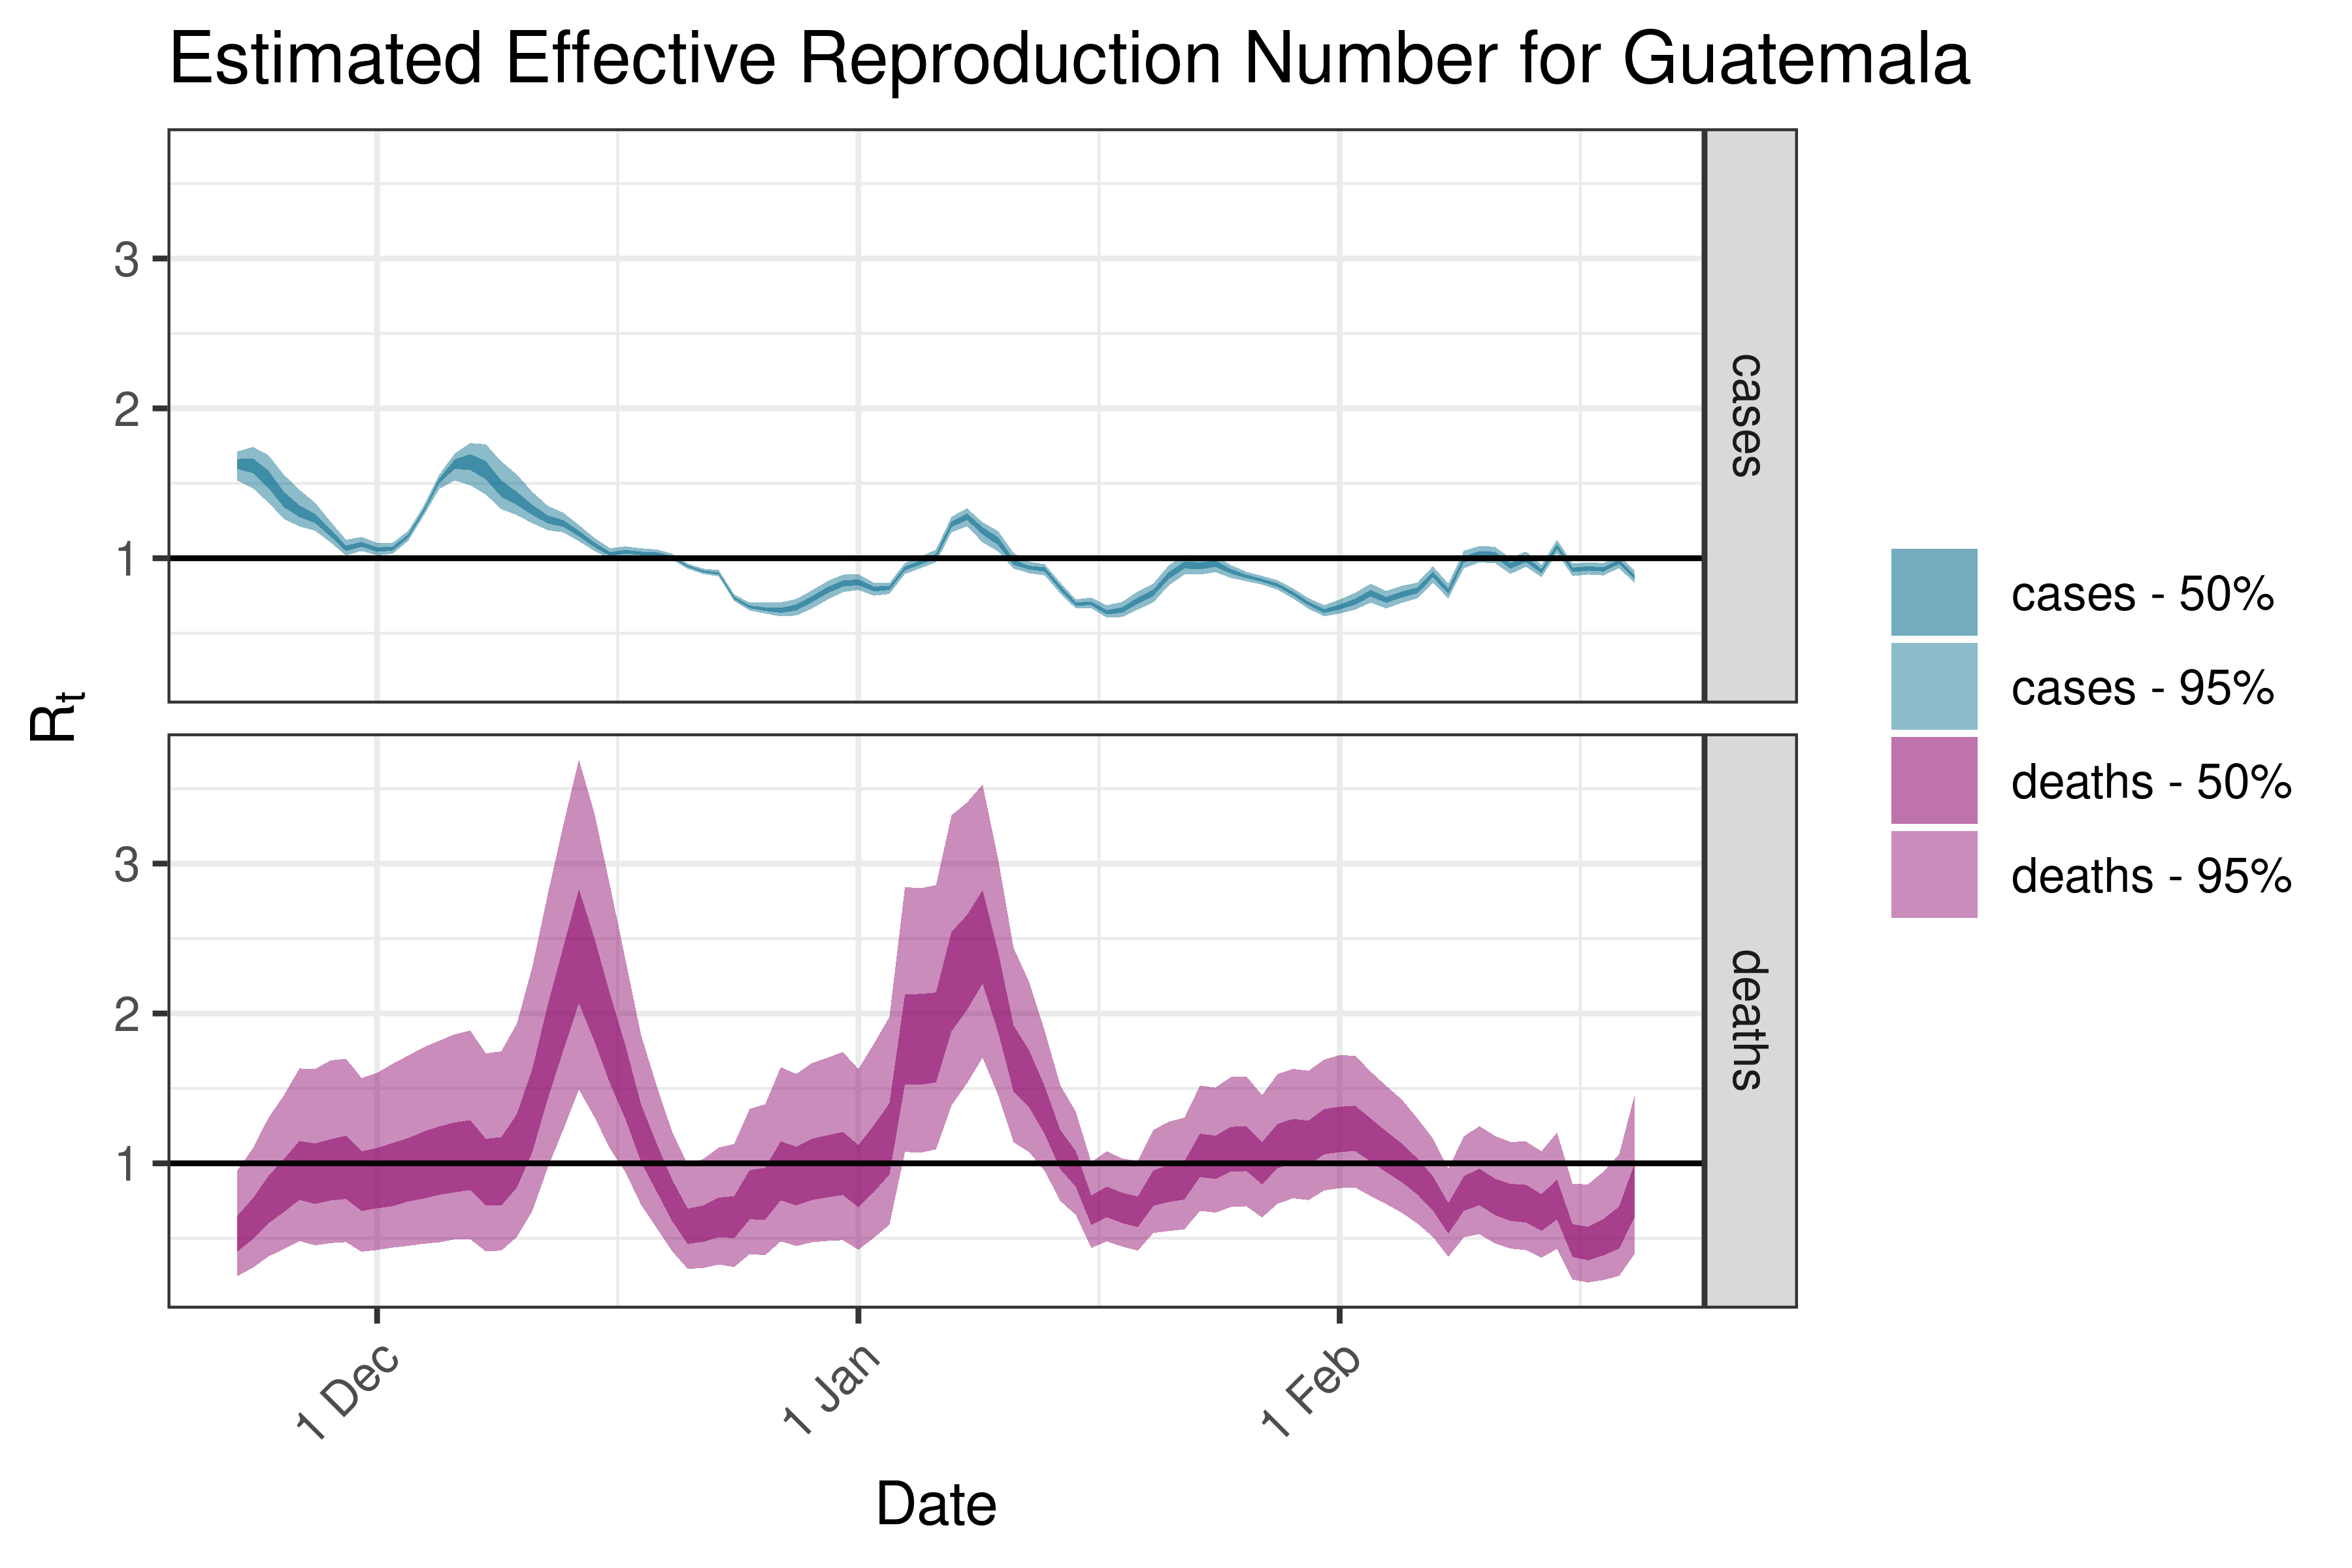
6.5.4.5 Guatemala
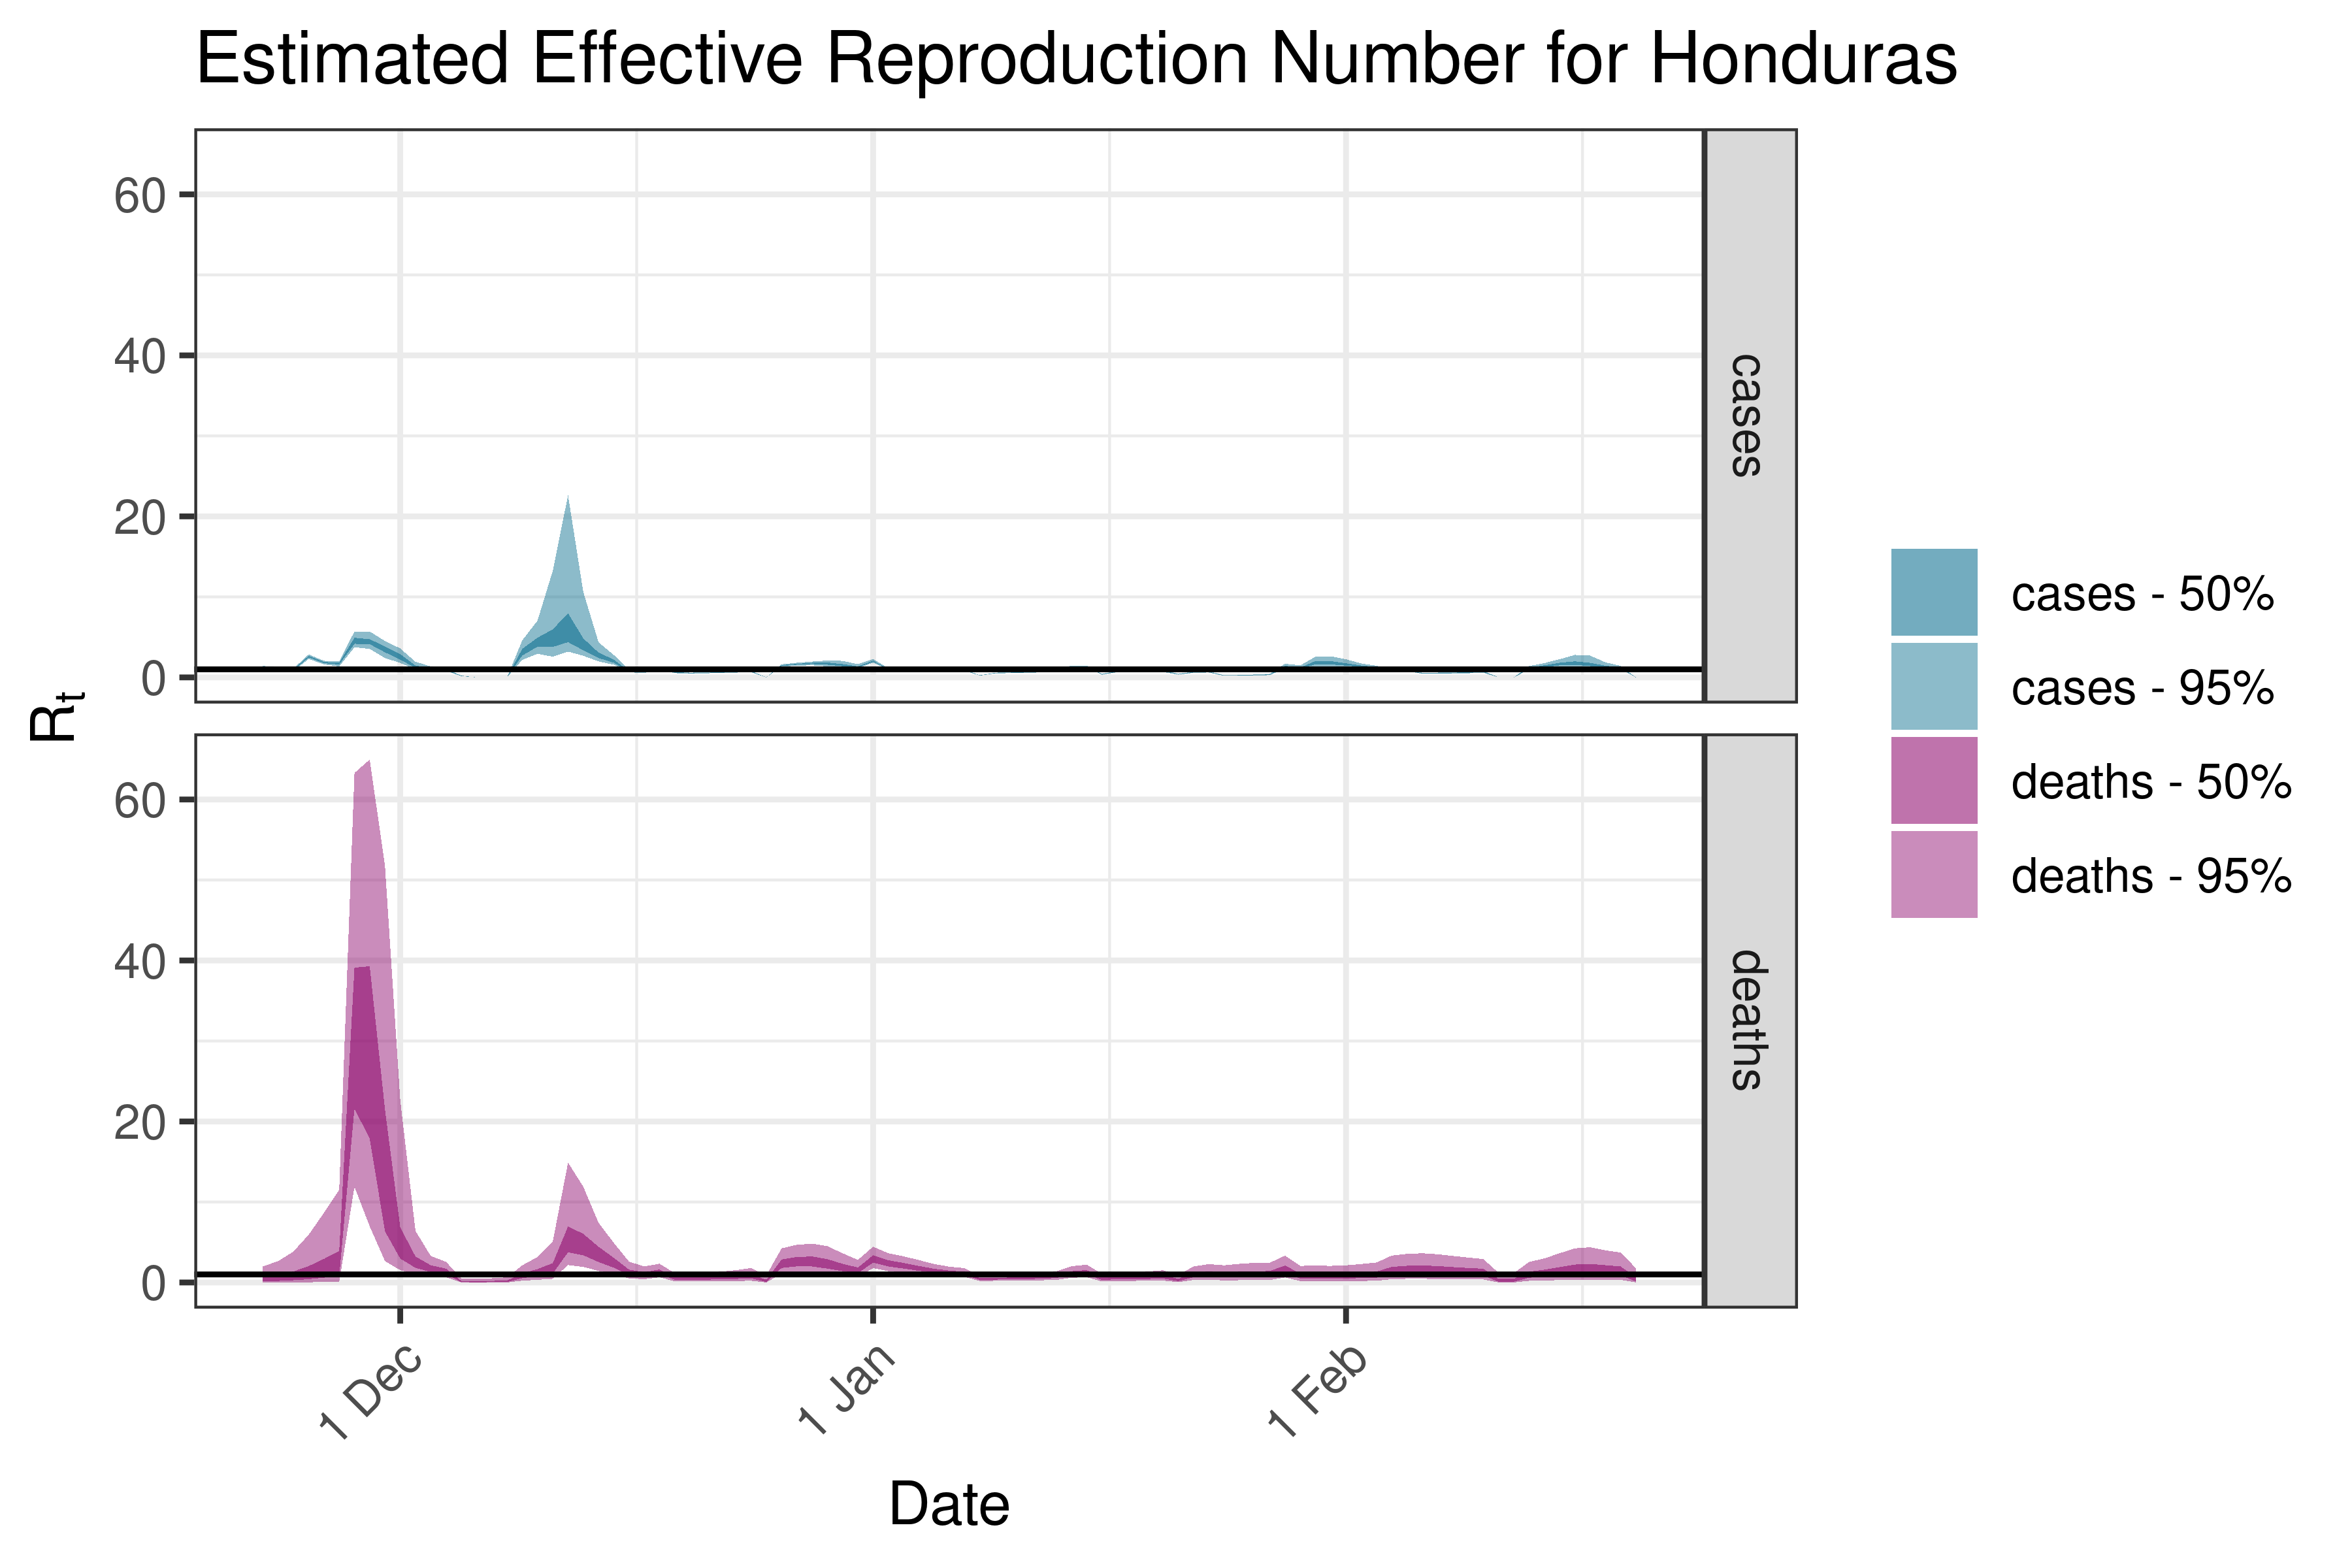
6.5.4.6 Honduras
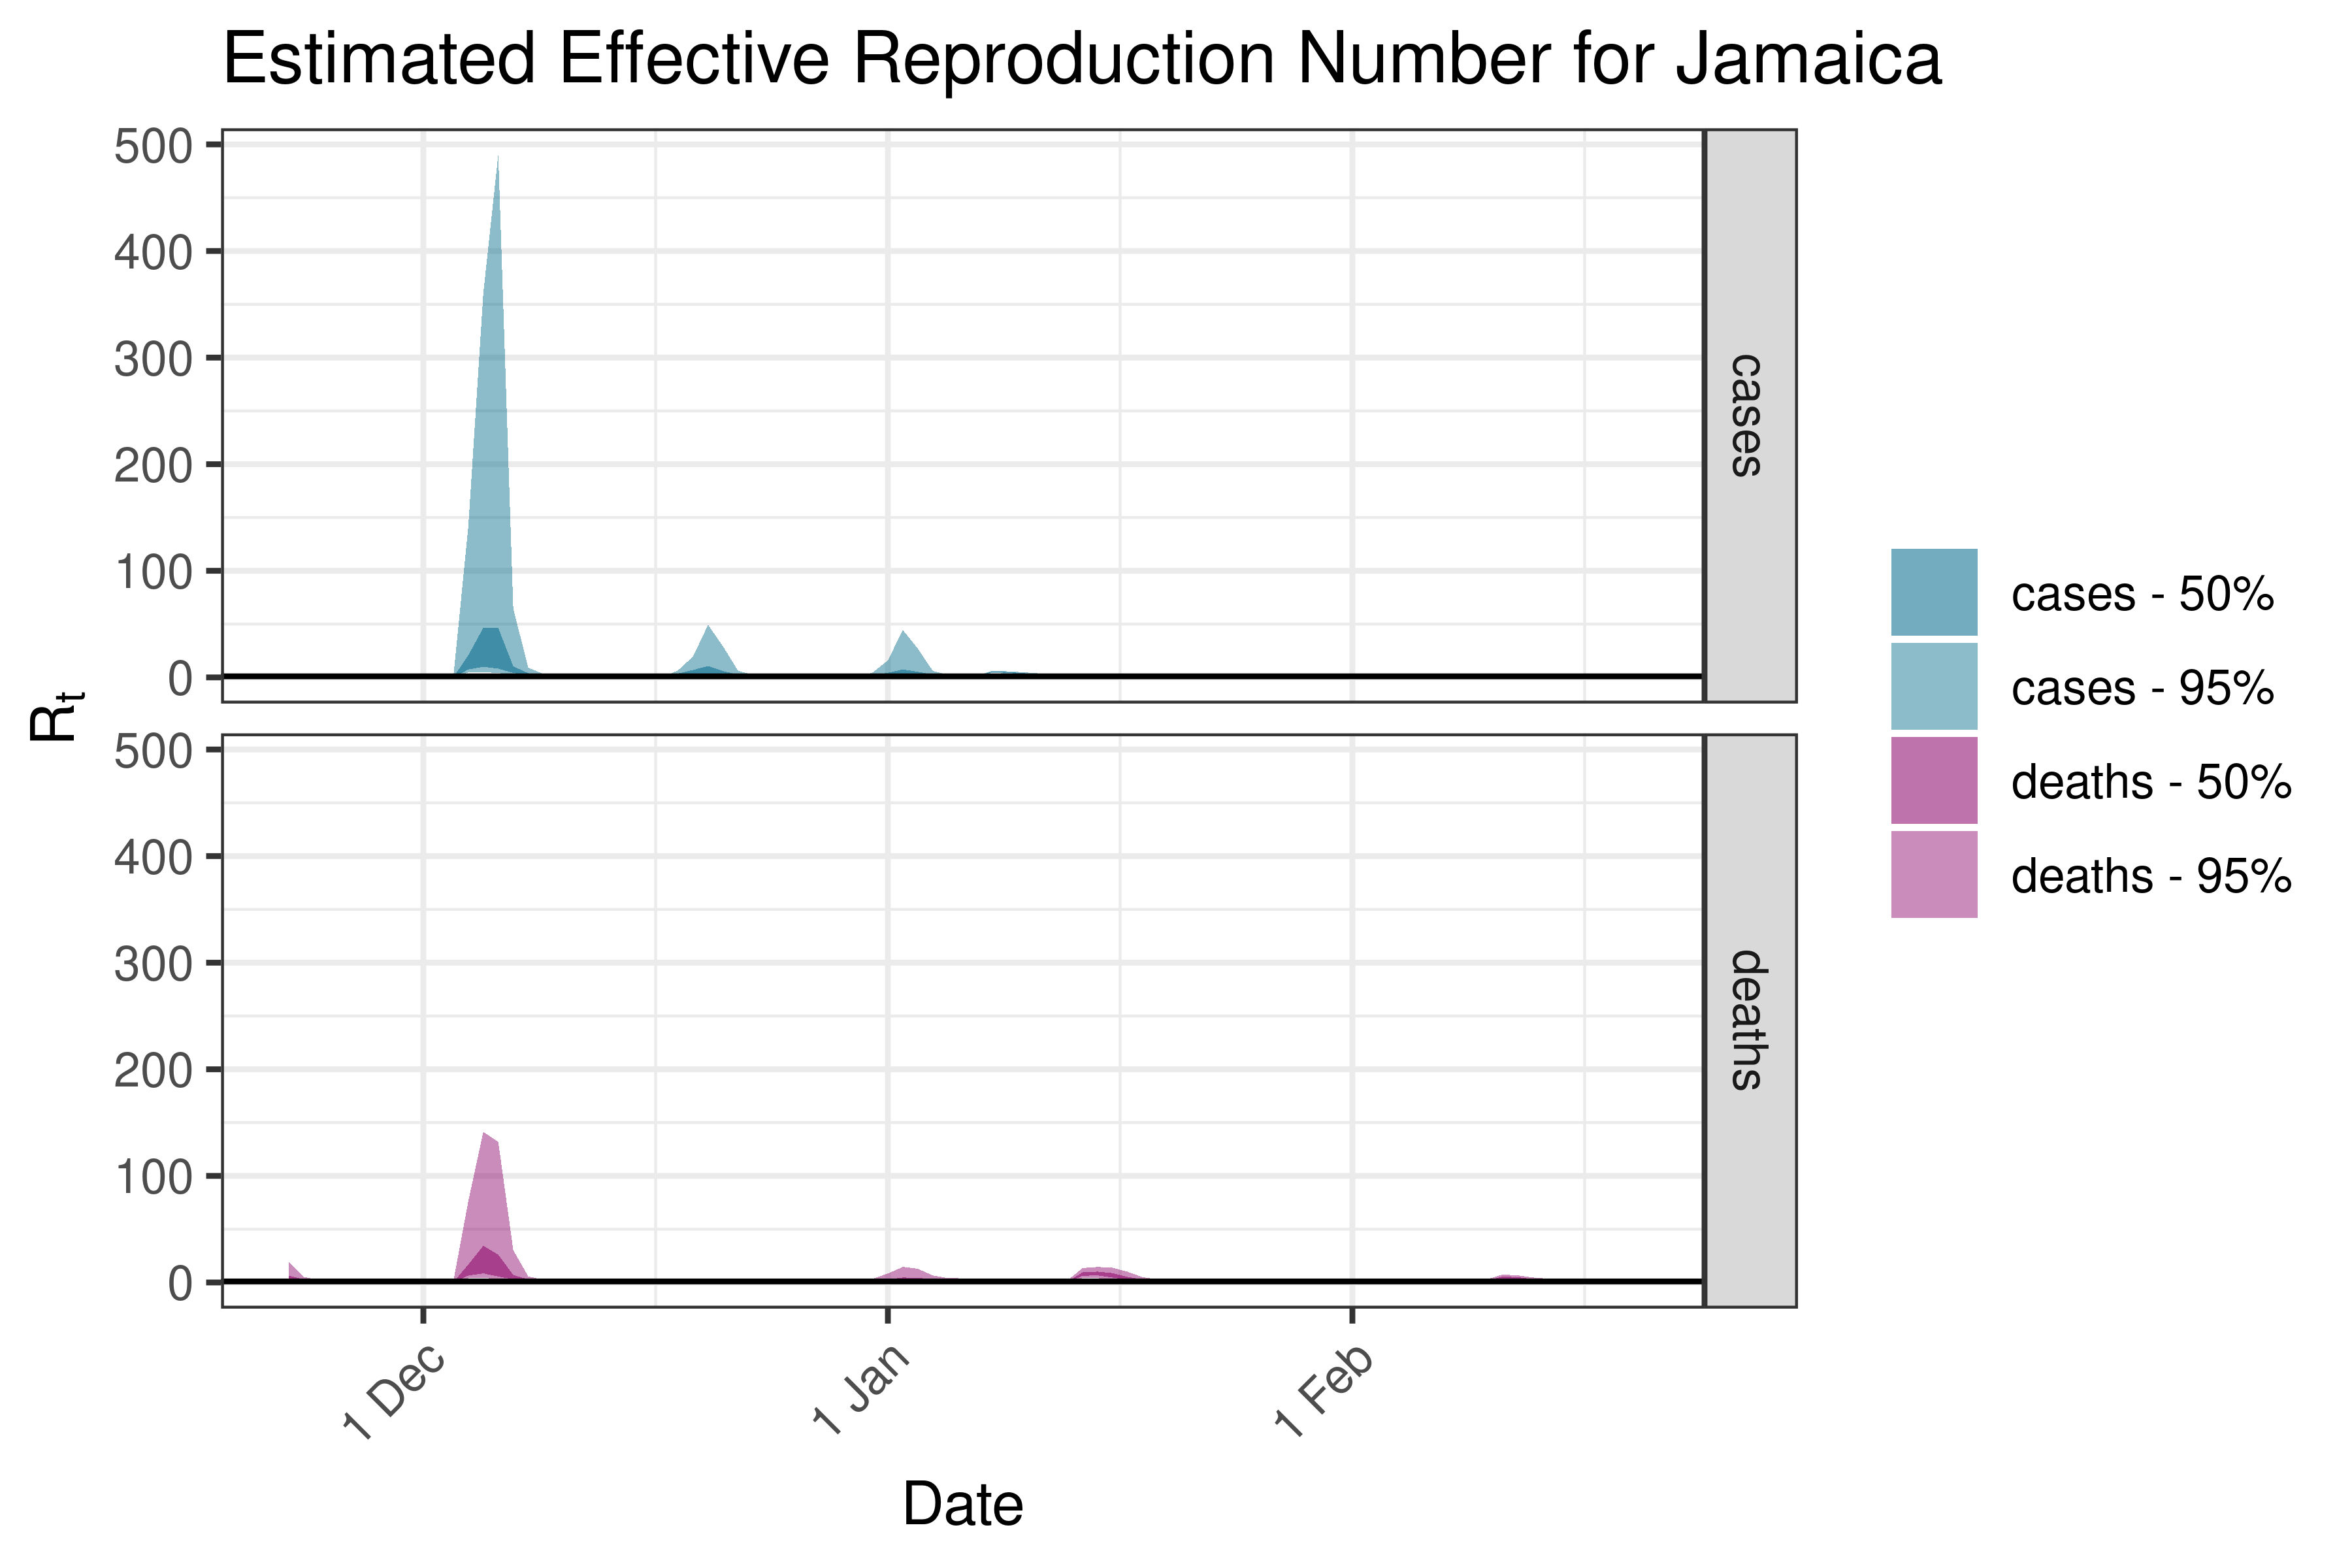
6.5.4.7 Jamaica
6.5.4.8 Mexico
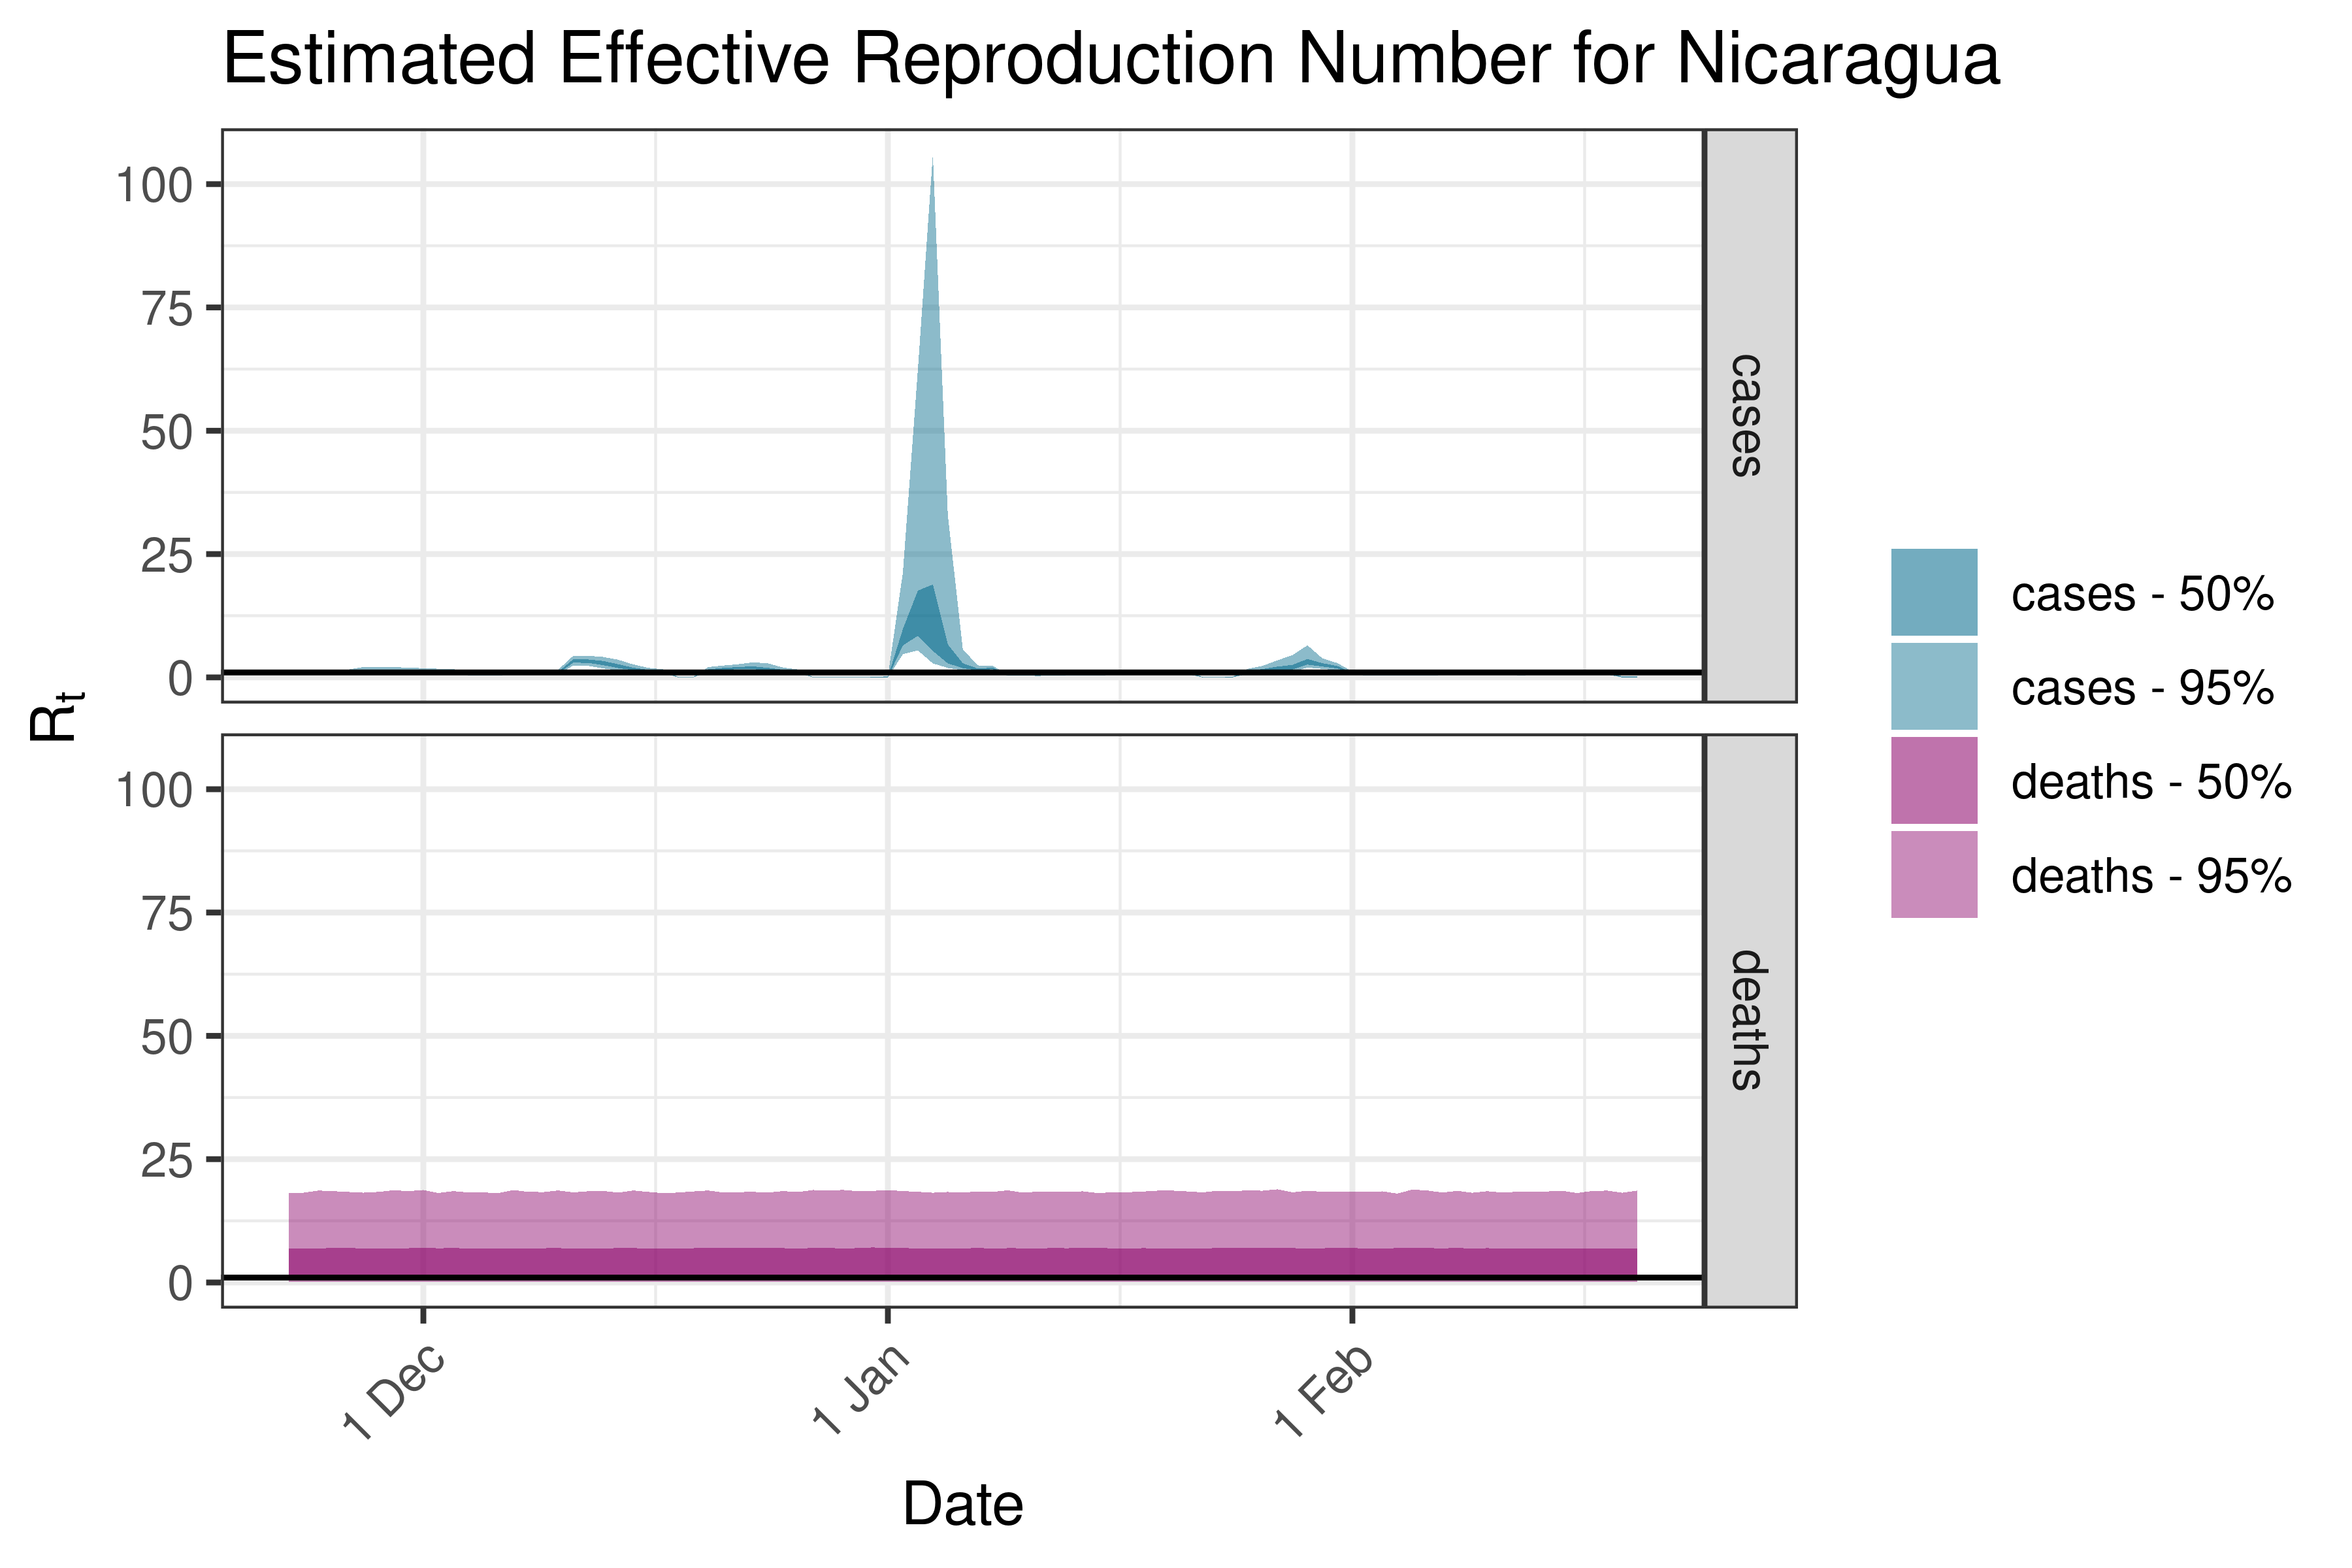
6.5.4.9 Nicaragua
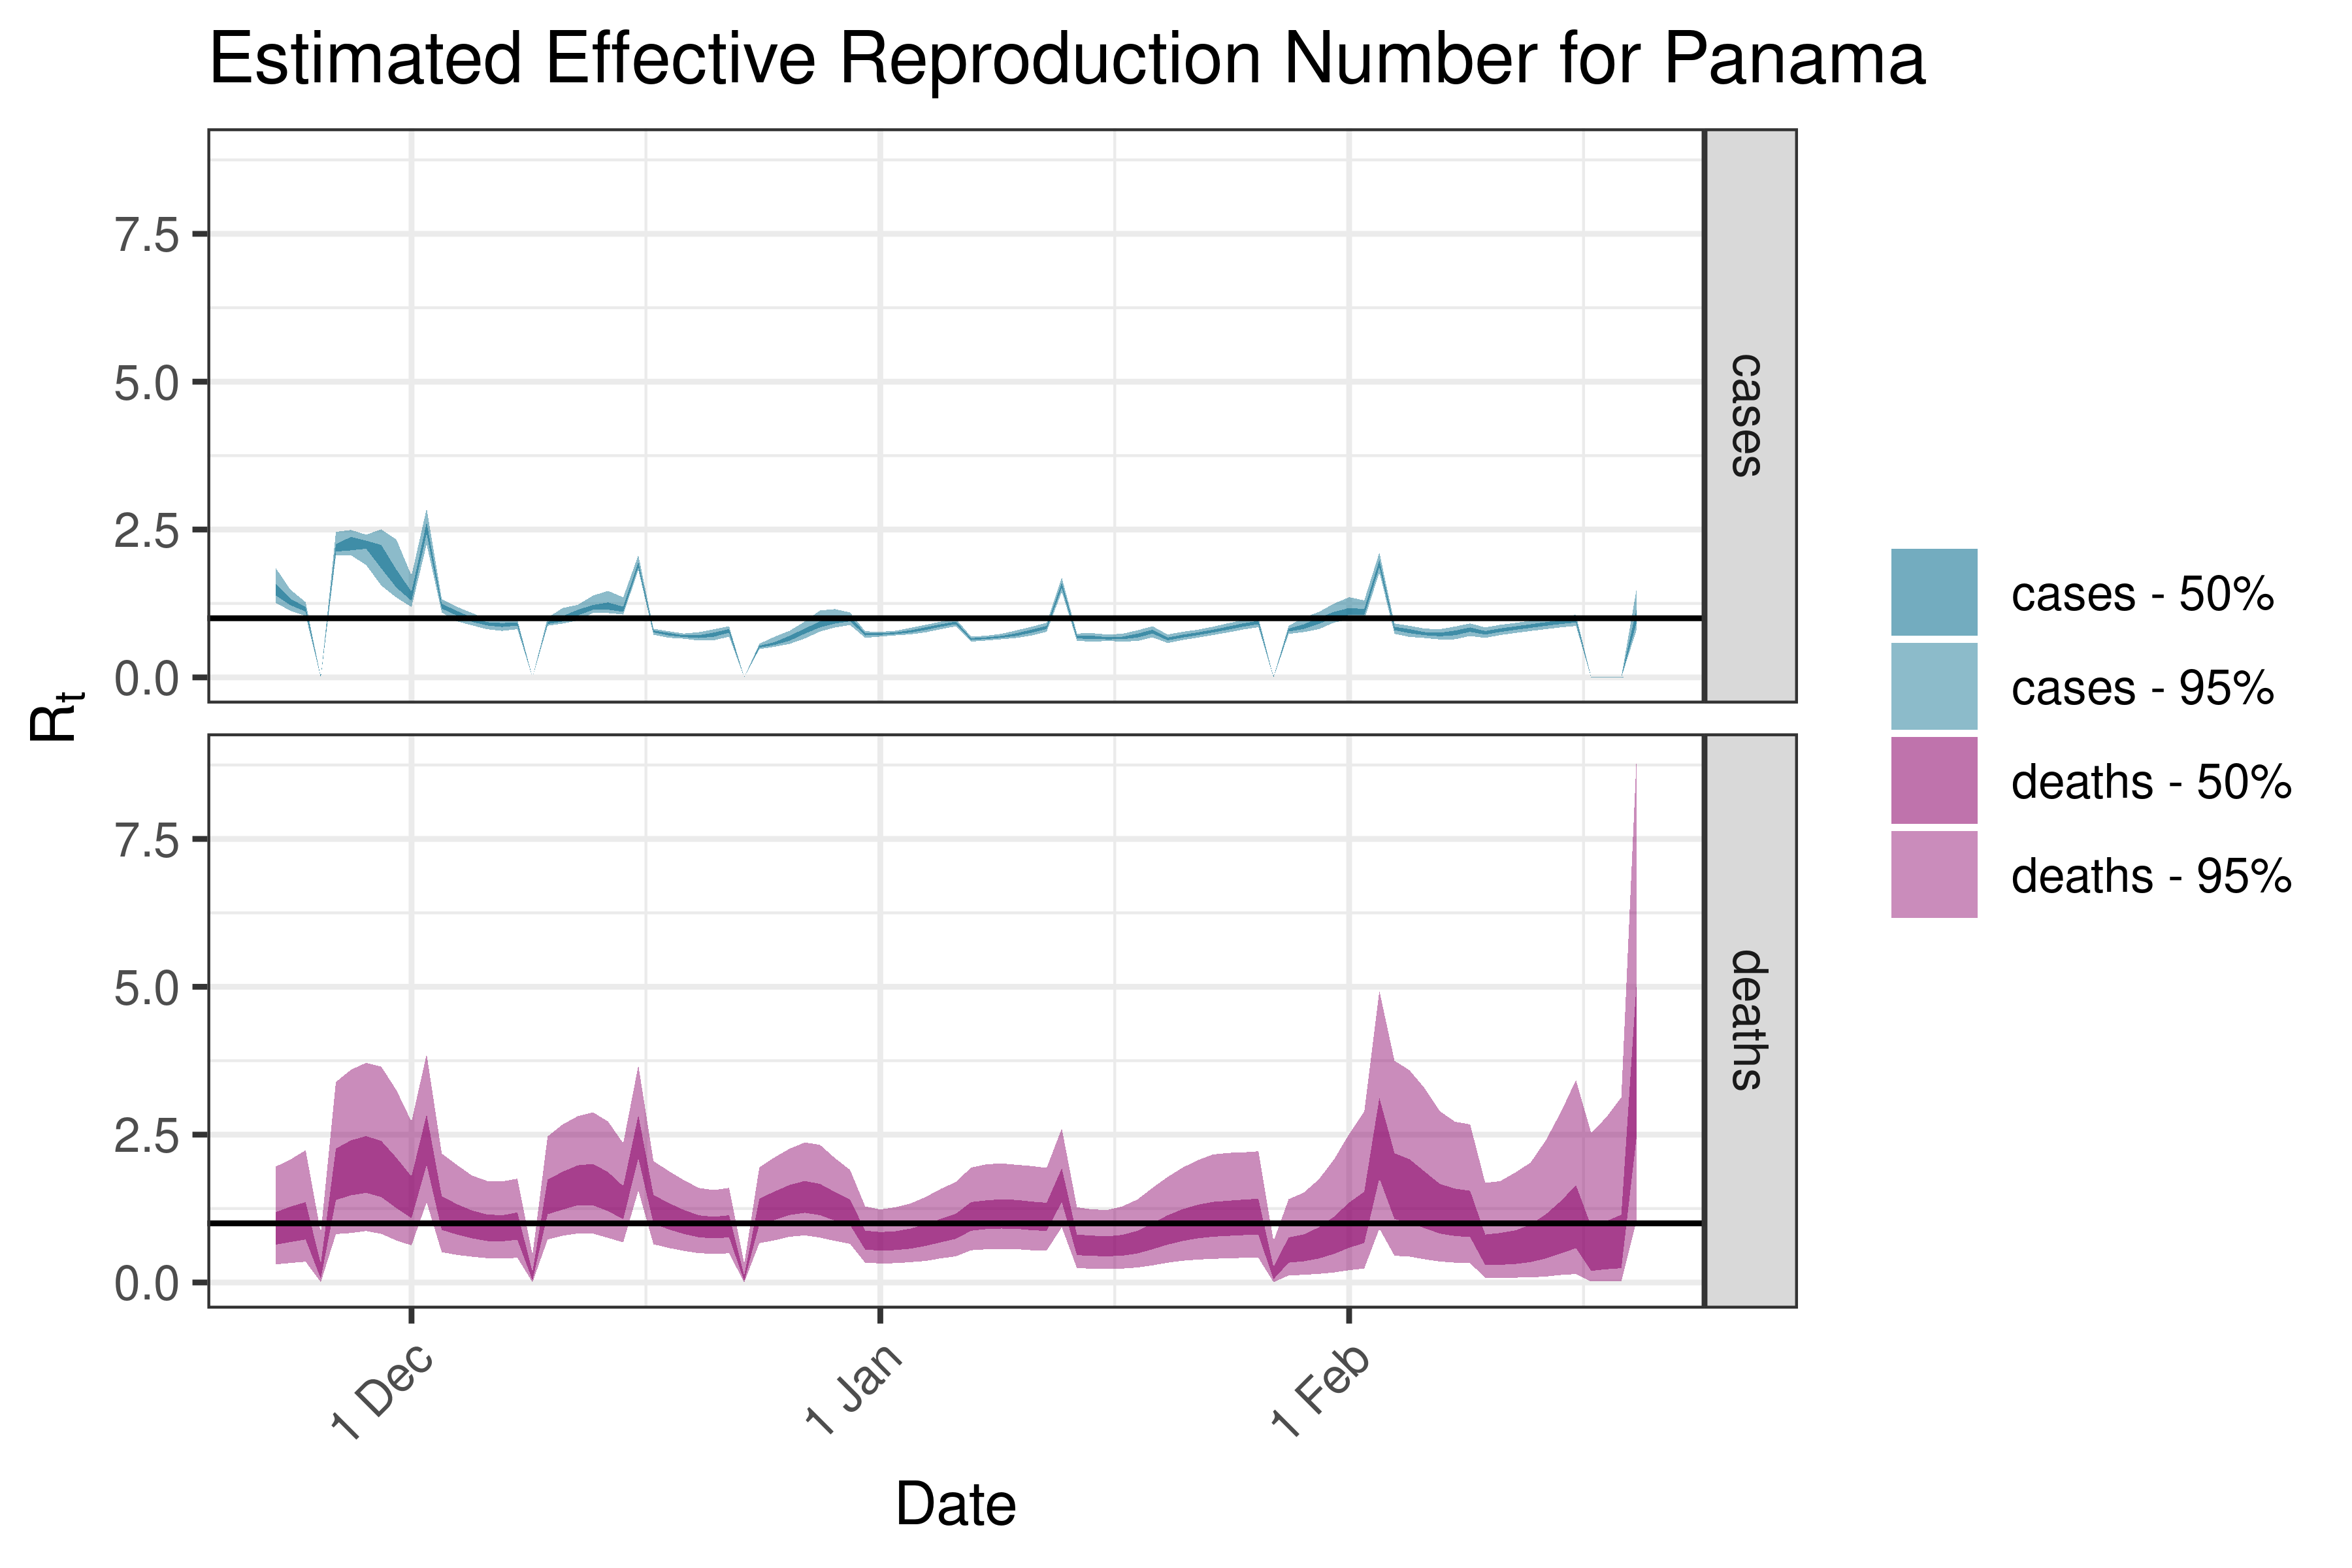
6.5.4.10 Panama
6.5.4.11 Trinidad and Tobago
6.5.4.12 United States
6.5.5 Oceania
6.5.5.1 Australia
6.5.5.2 Fiji
6.5.5.3 New Zealand
6.5.5.4 Papua New Guinea
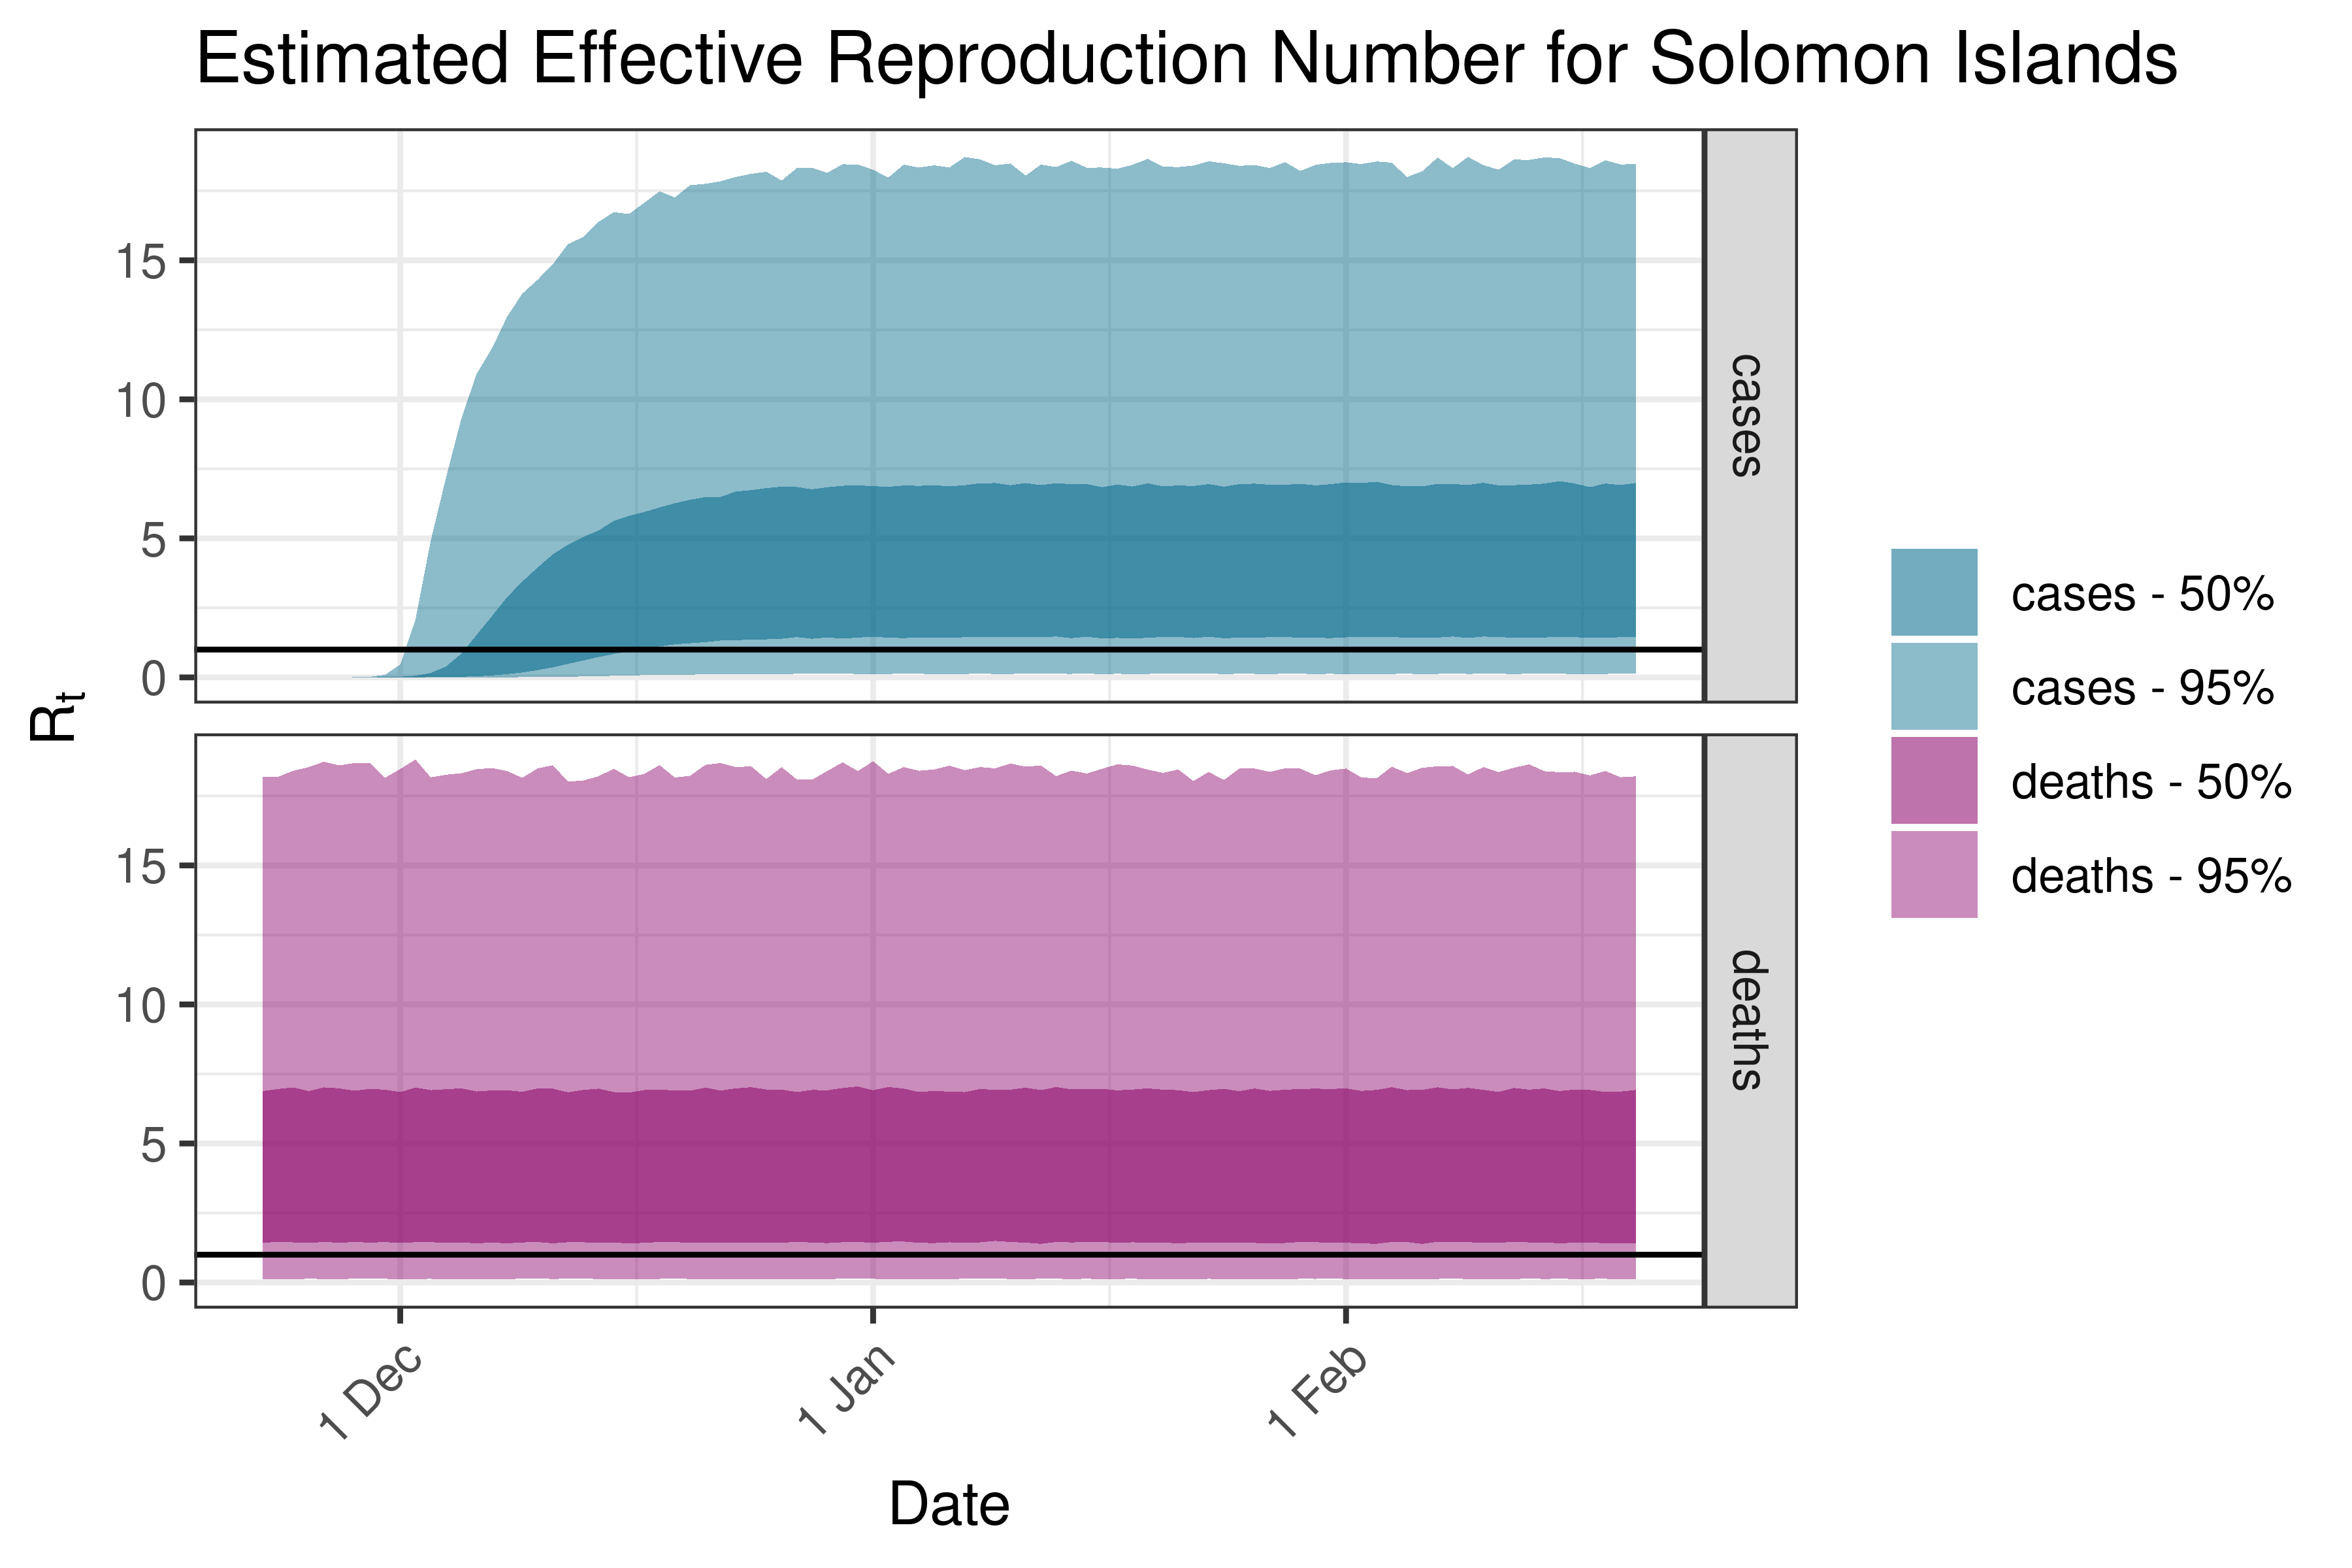
6.5.5.5 Solomon Islands
6.5.6 South America
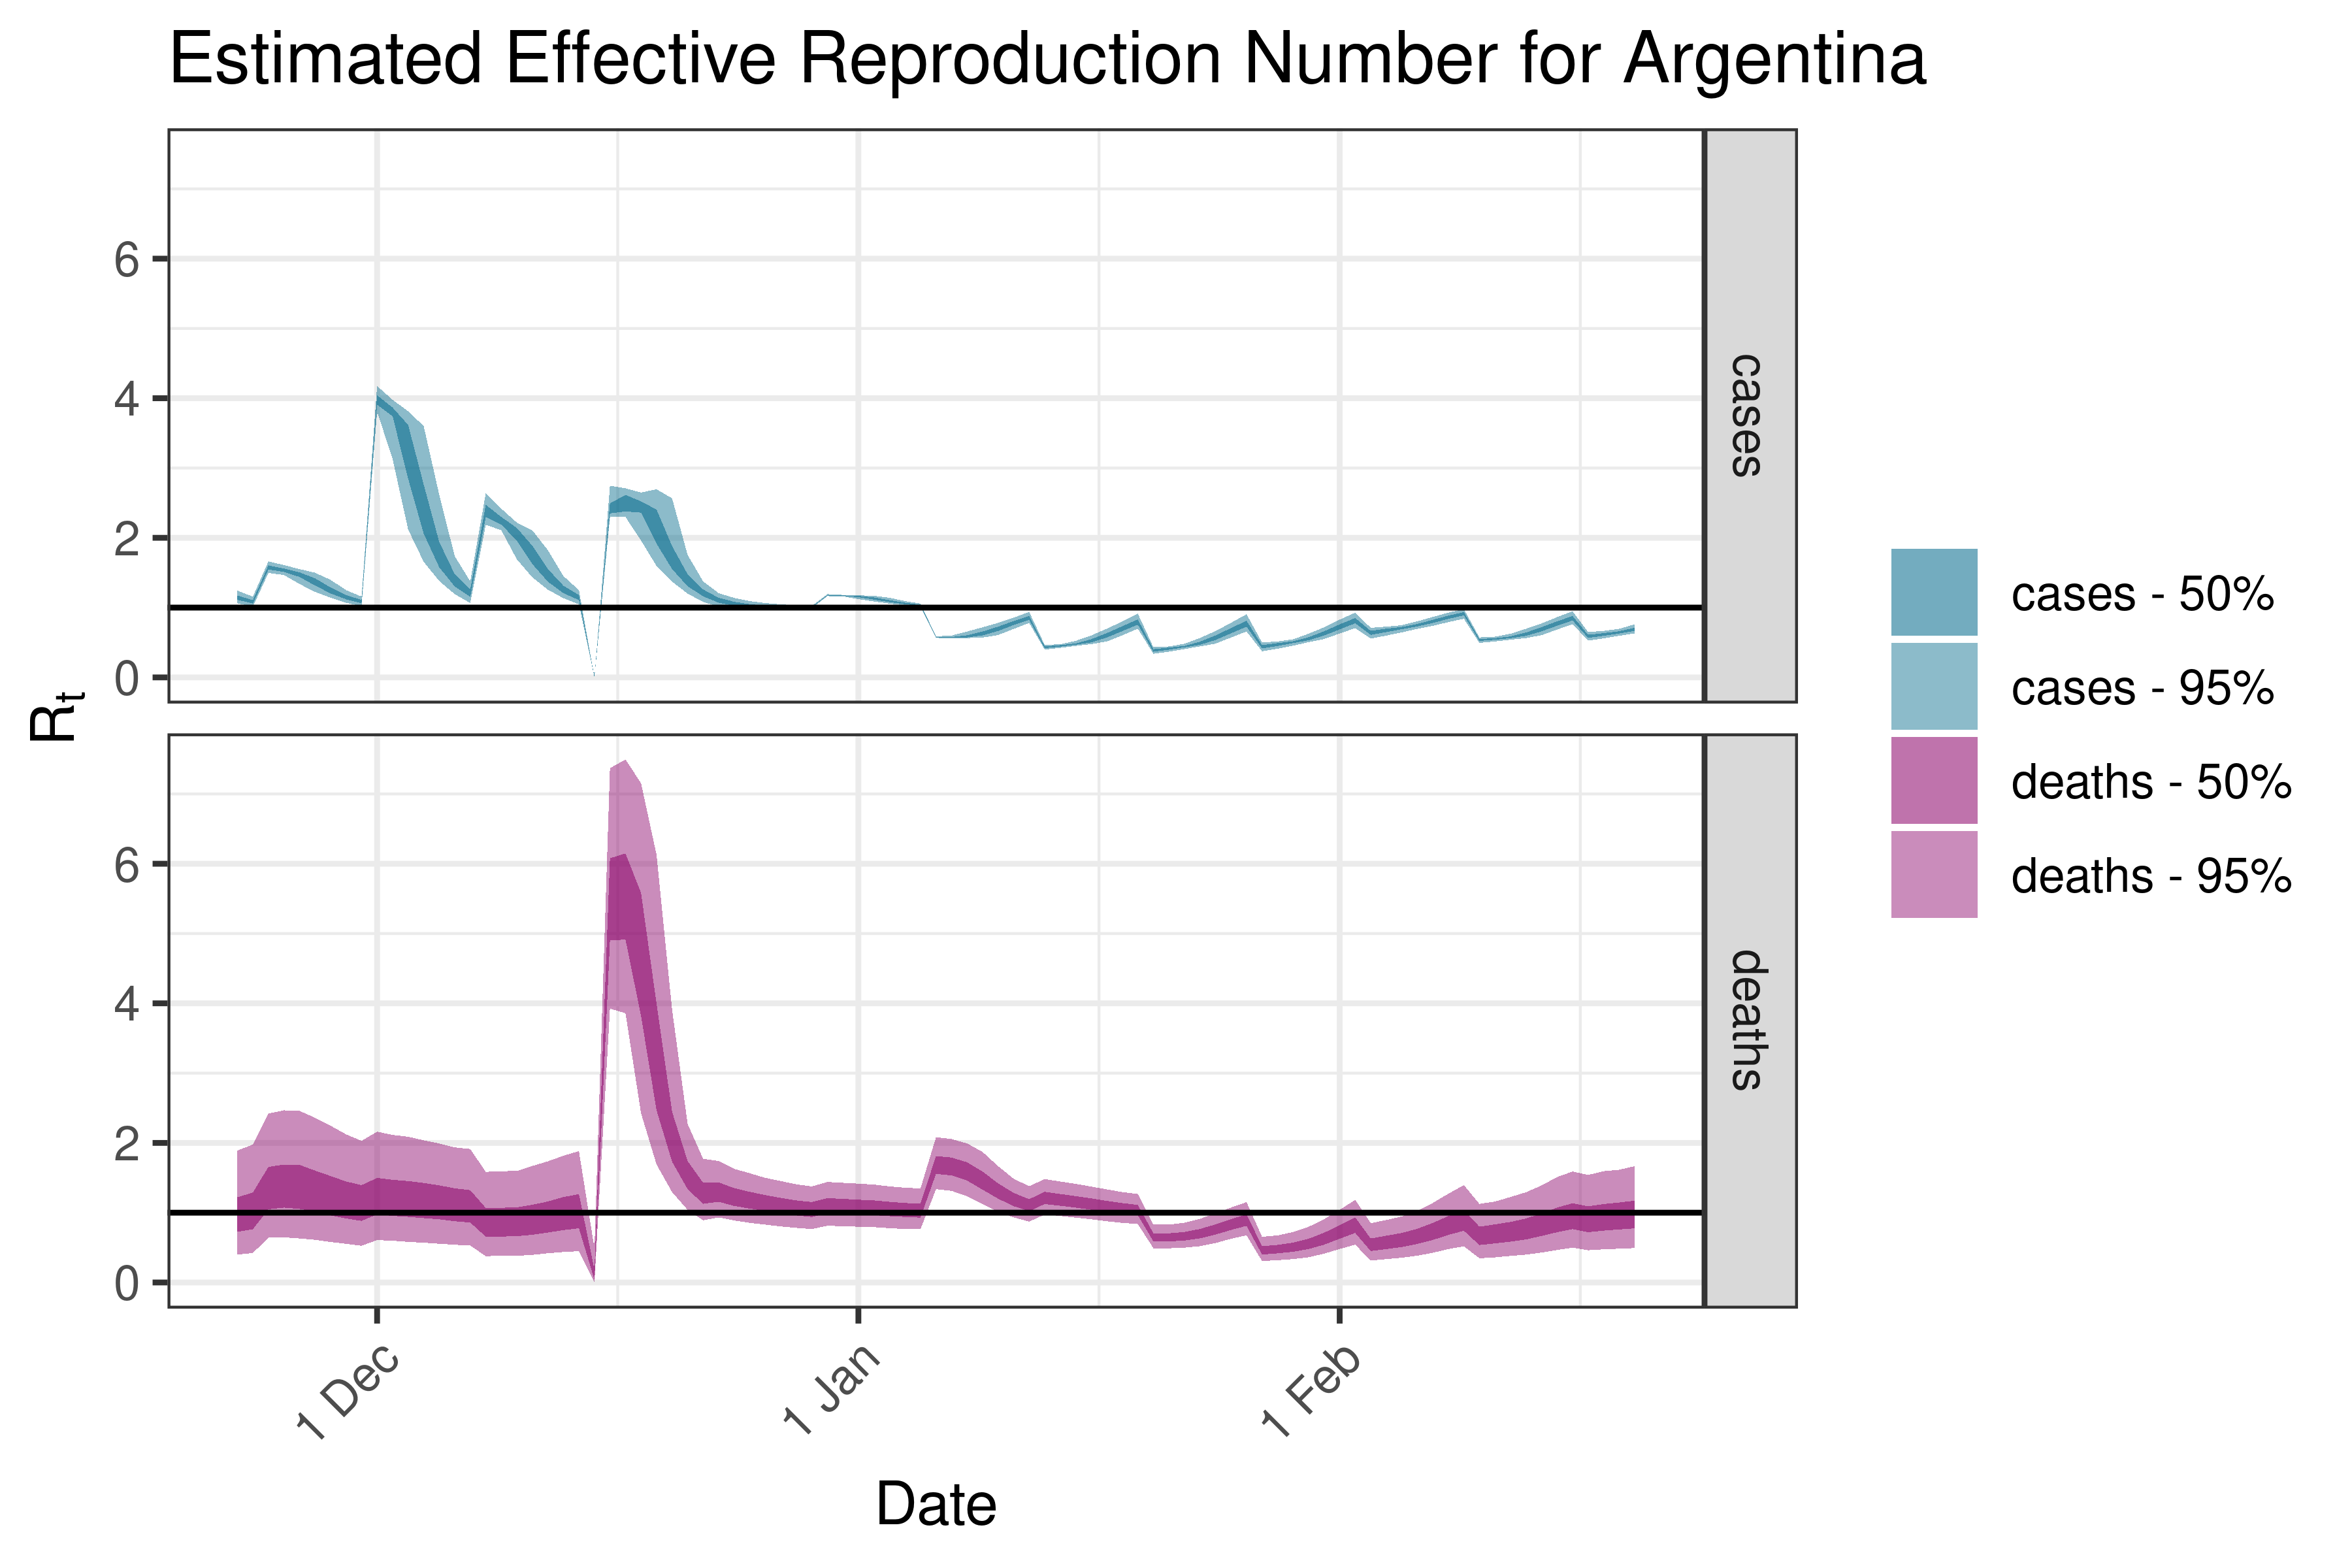
6.5.6.1 Argentina
6.5.6.2 Bolivia
6.5.6.3 Brazil
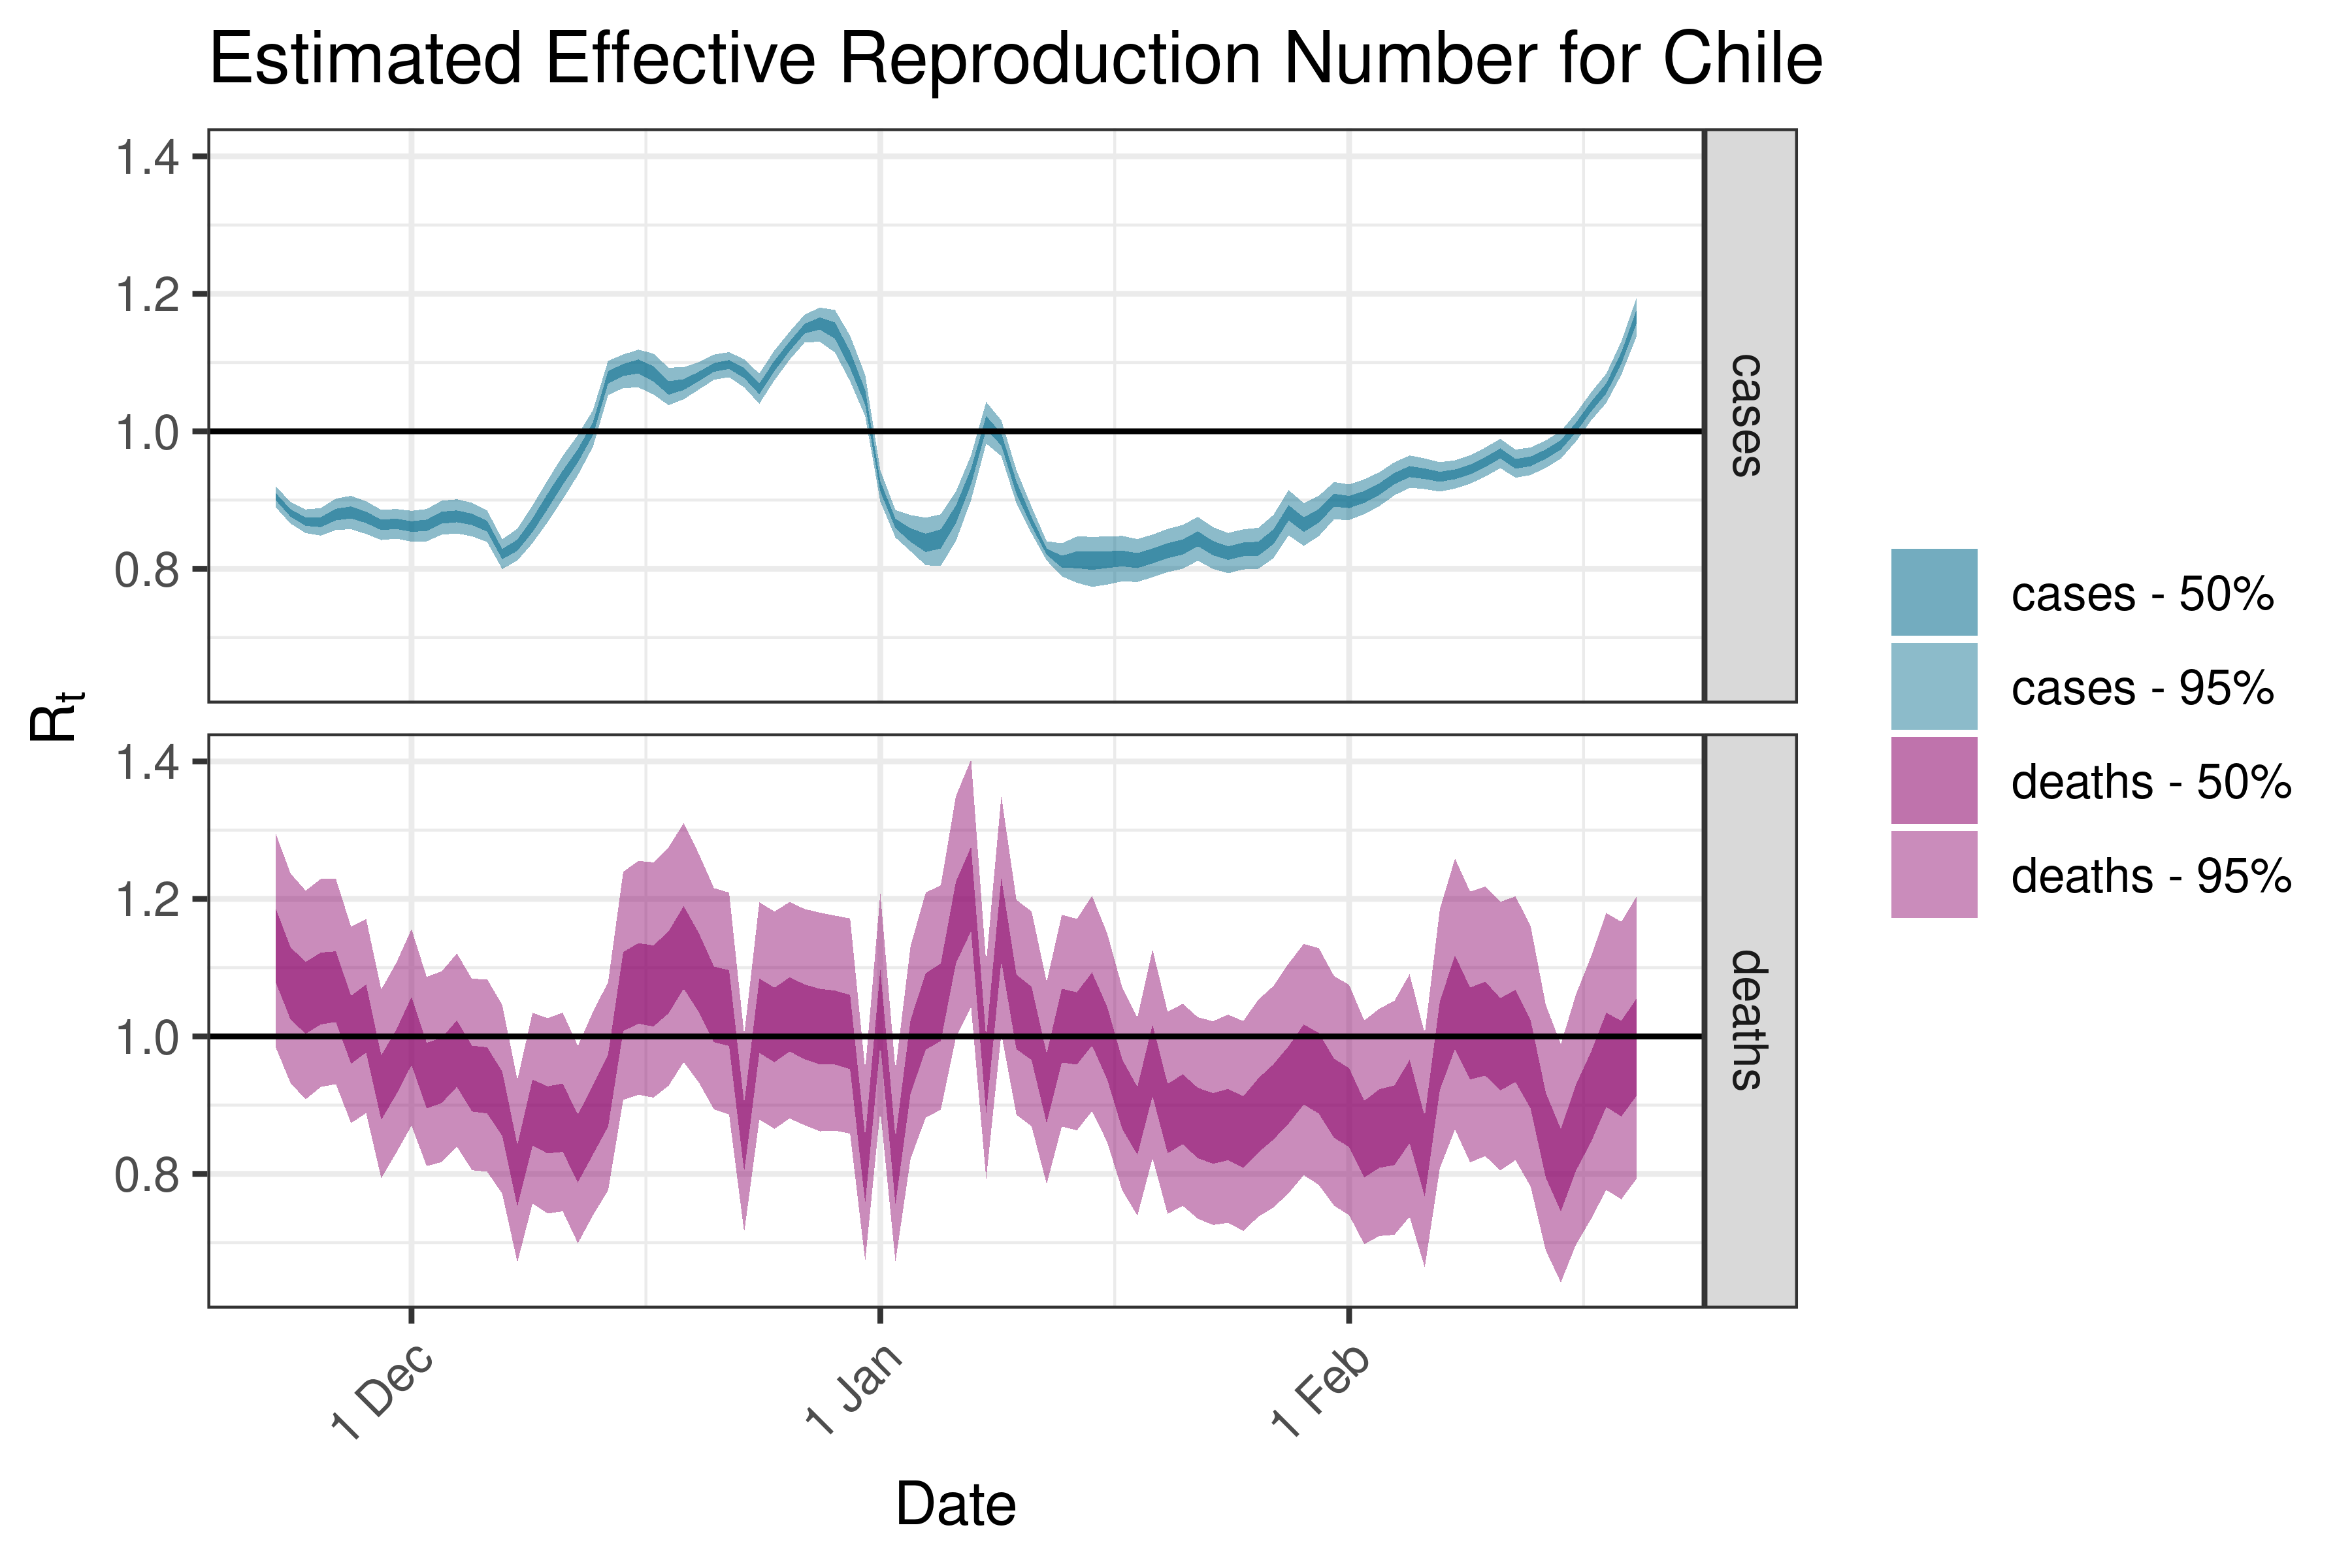
6.5.6.4 Chile
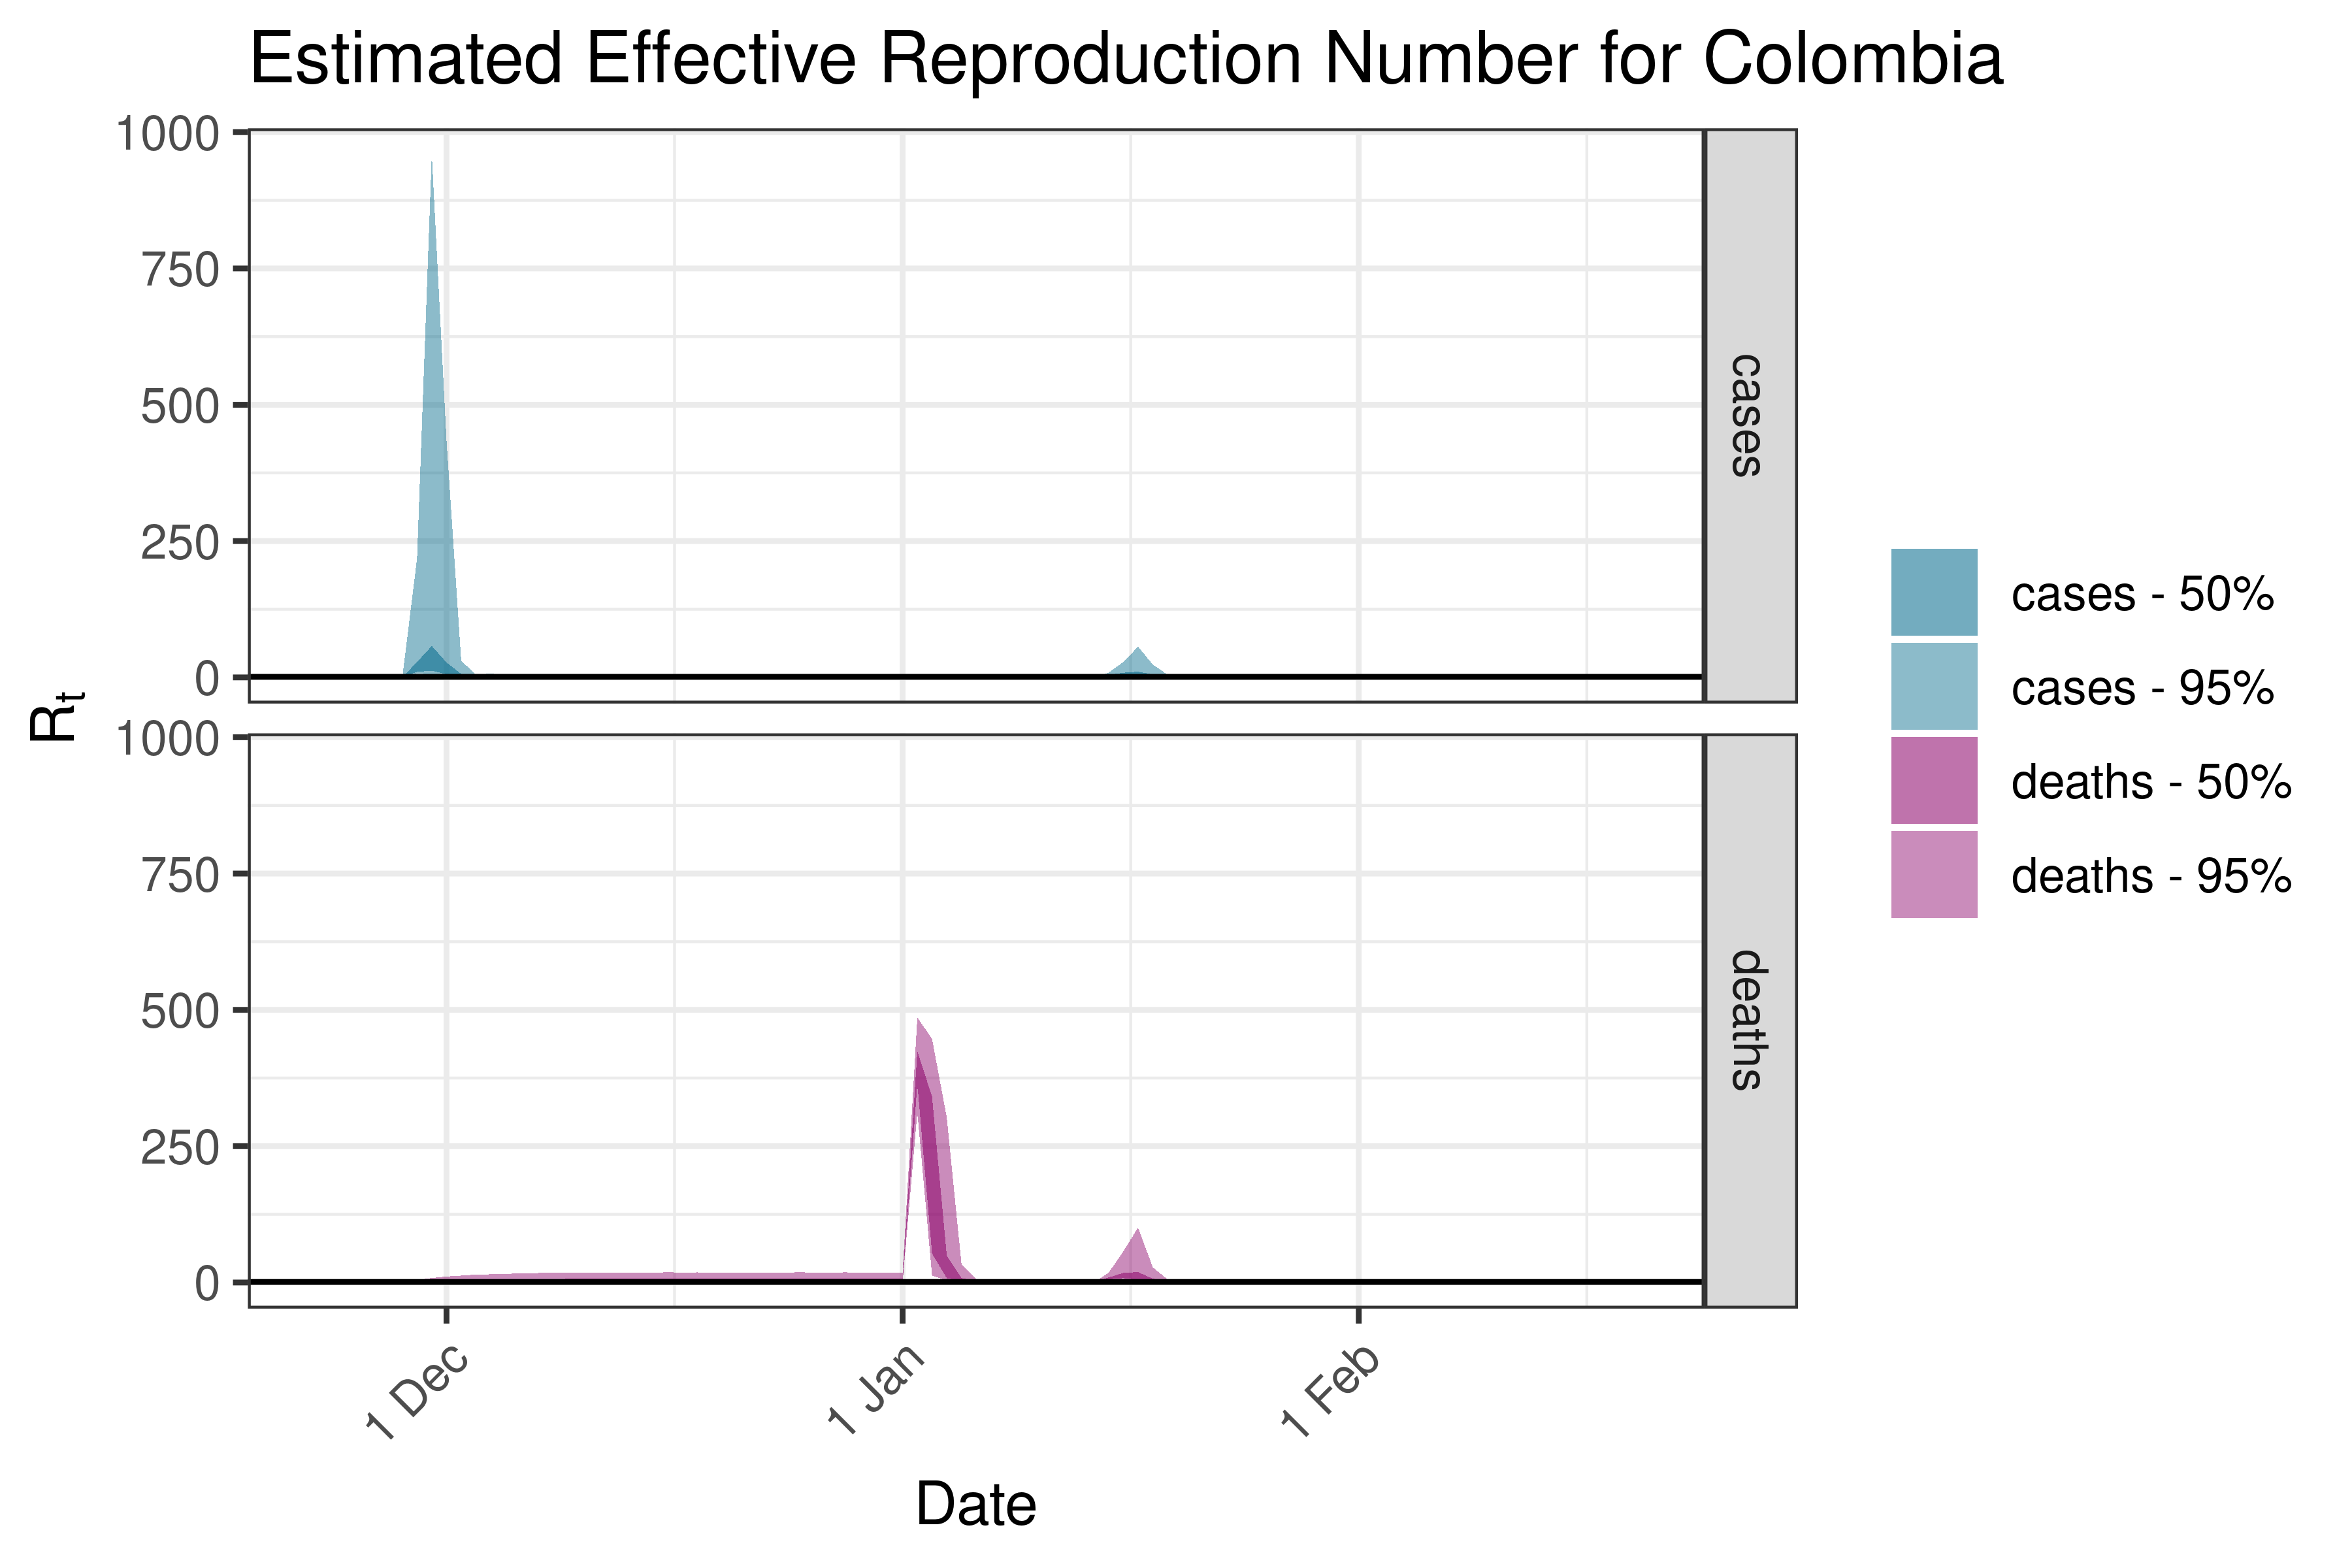
6.5.6.5 Colombia
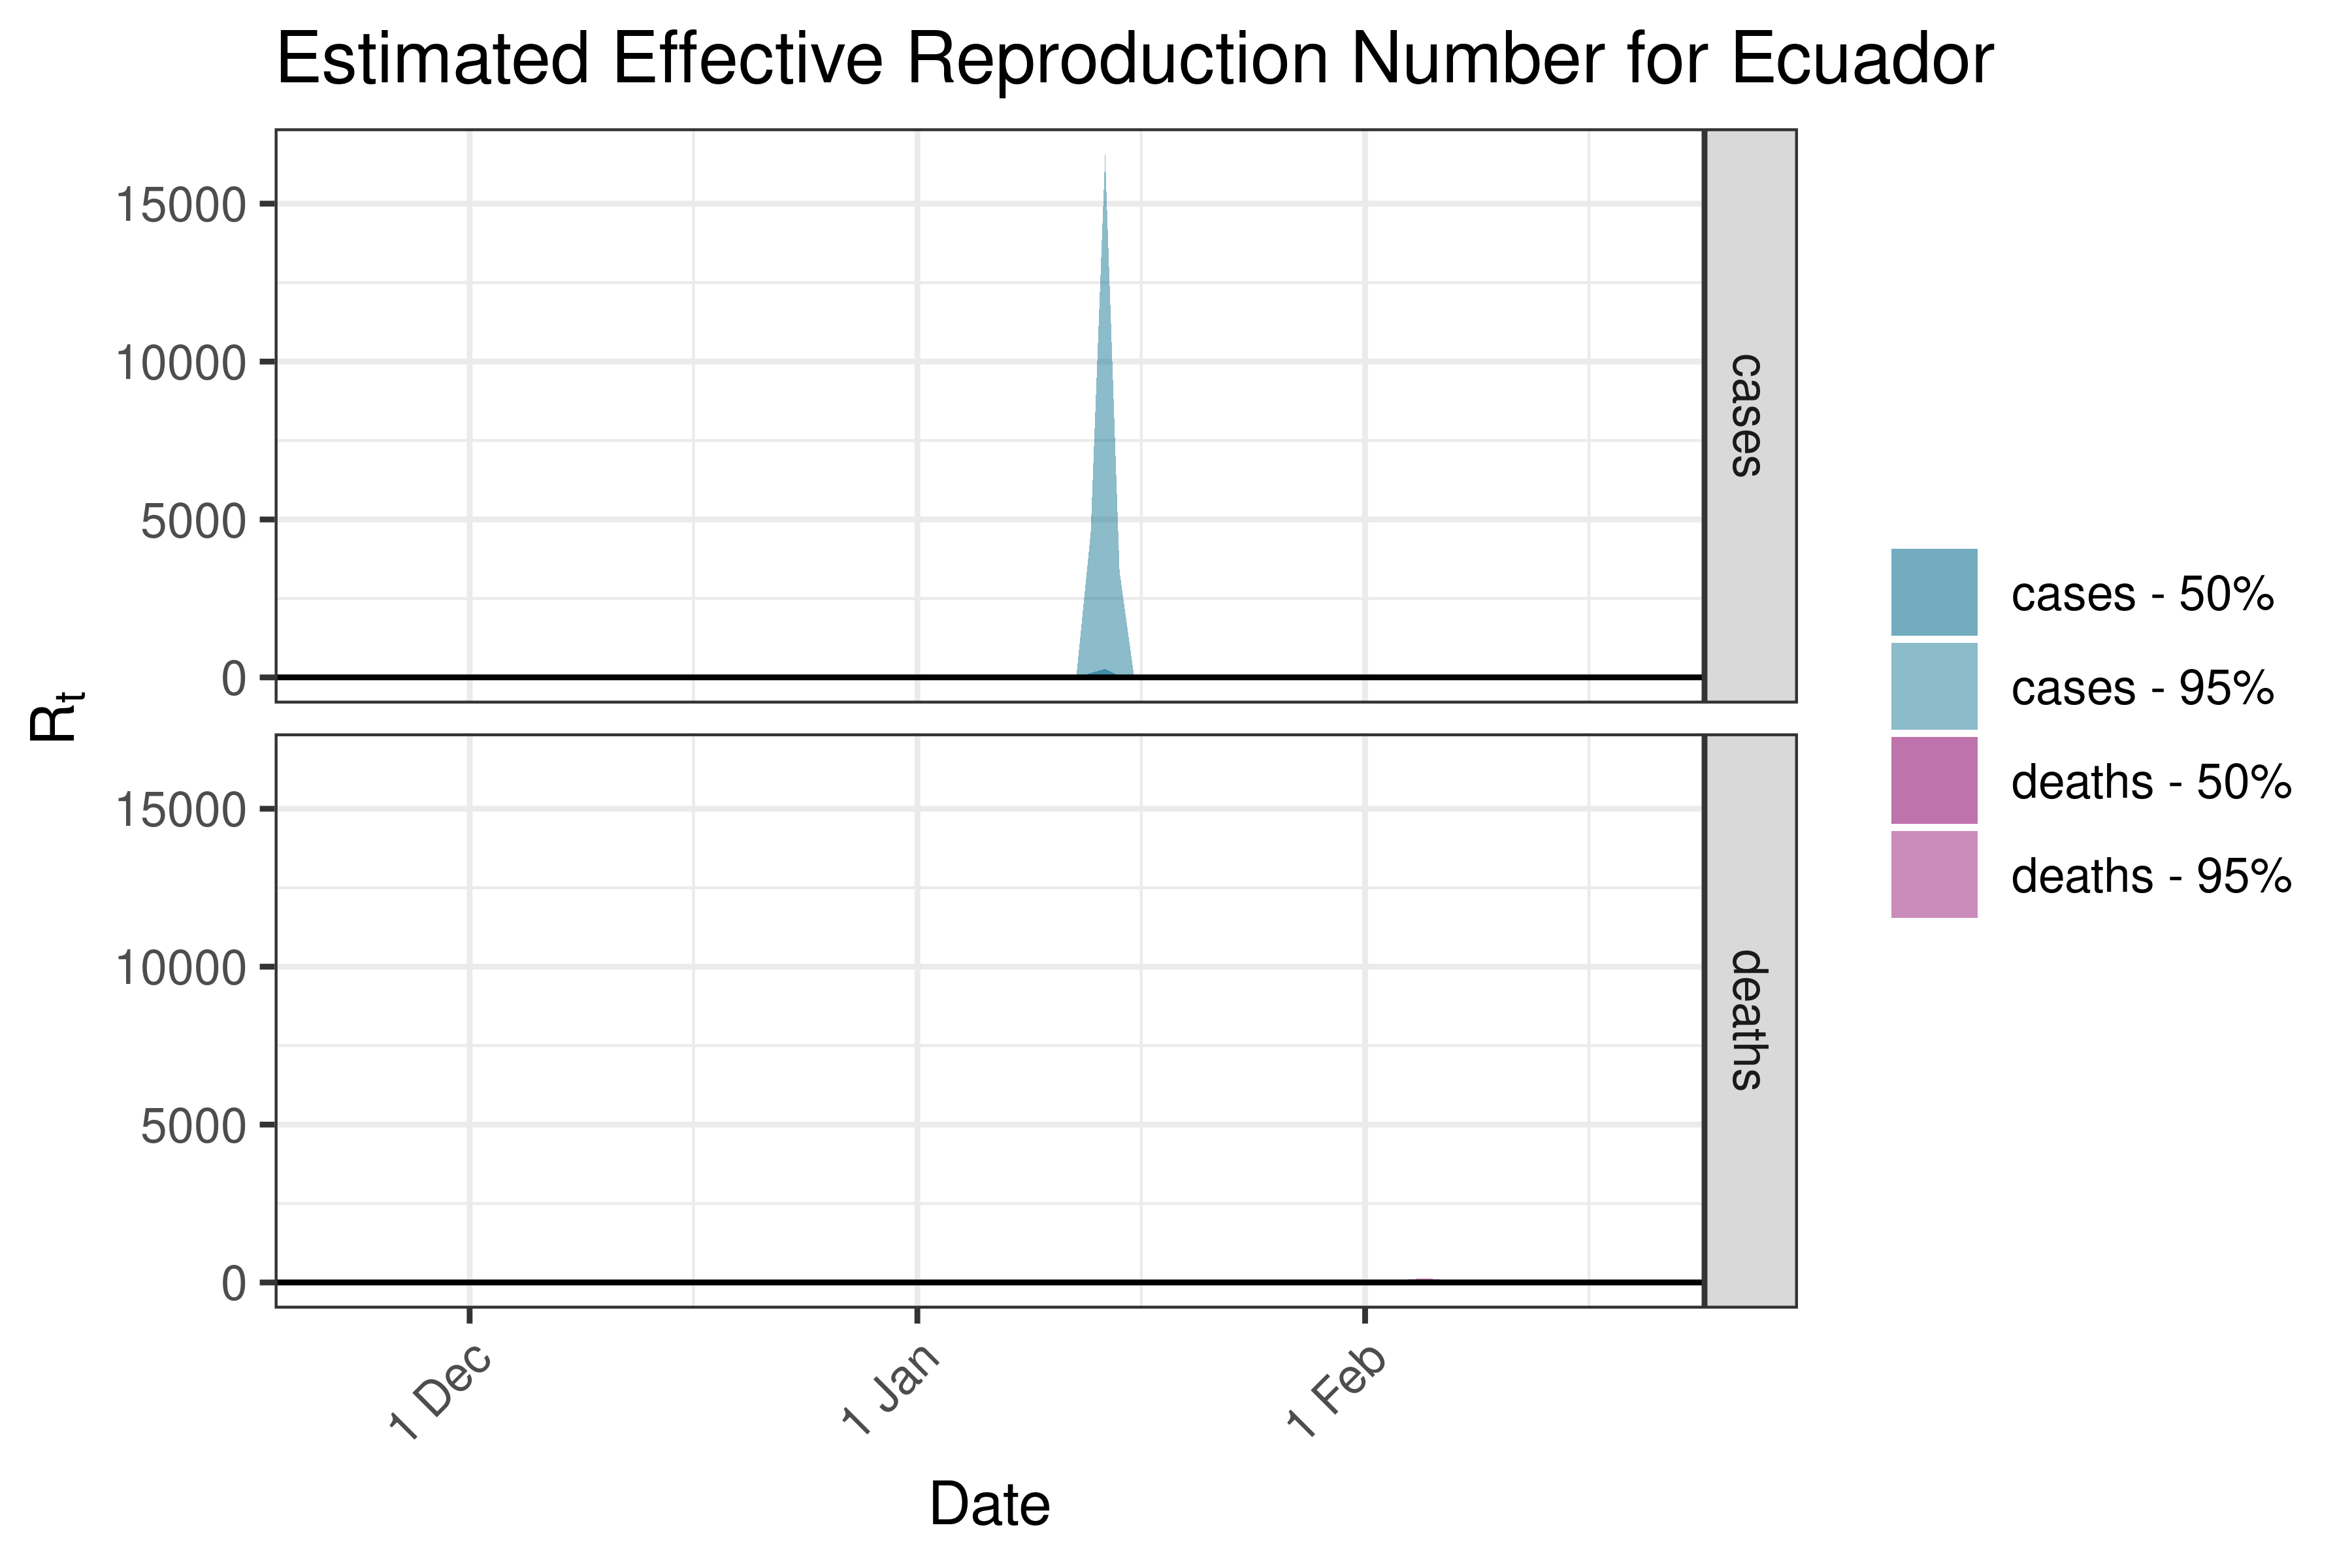
6.5.6.6 Ecuador
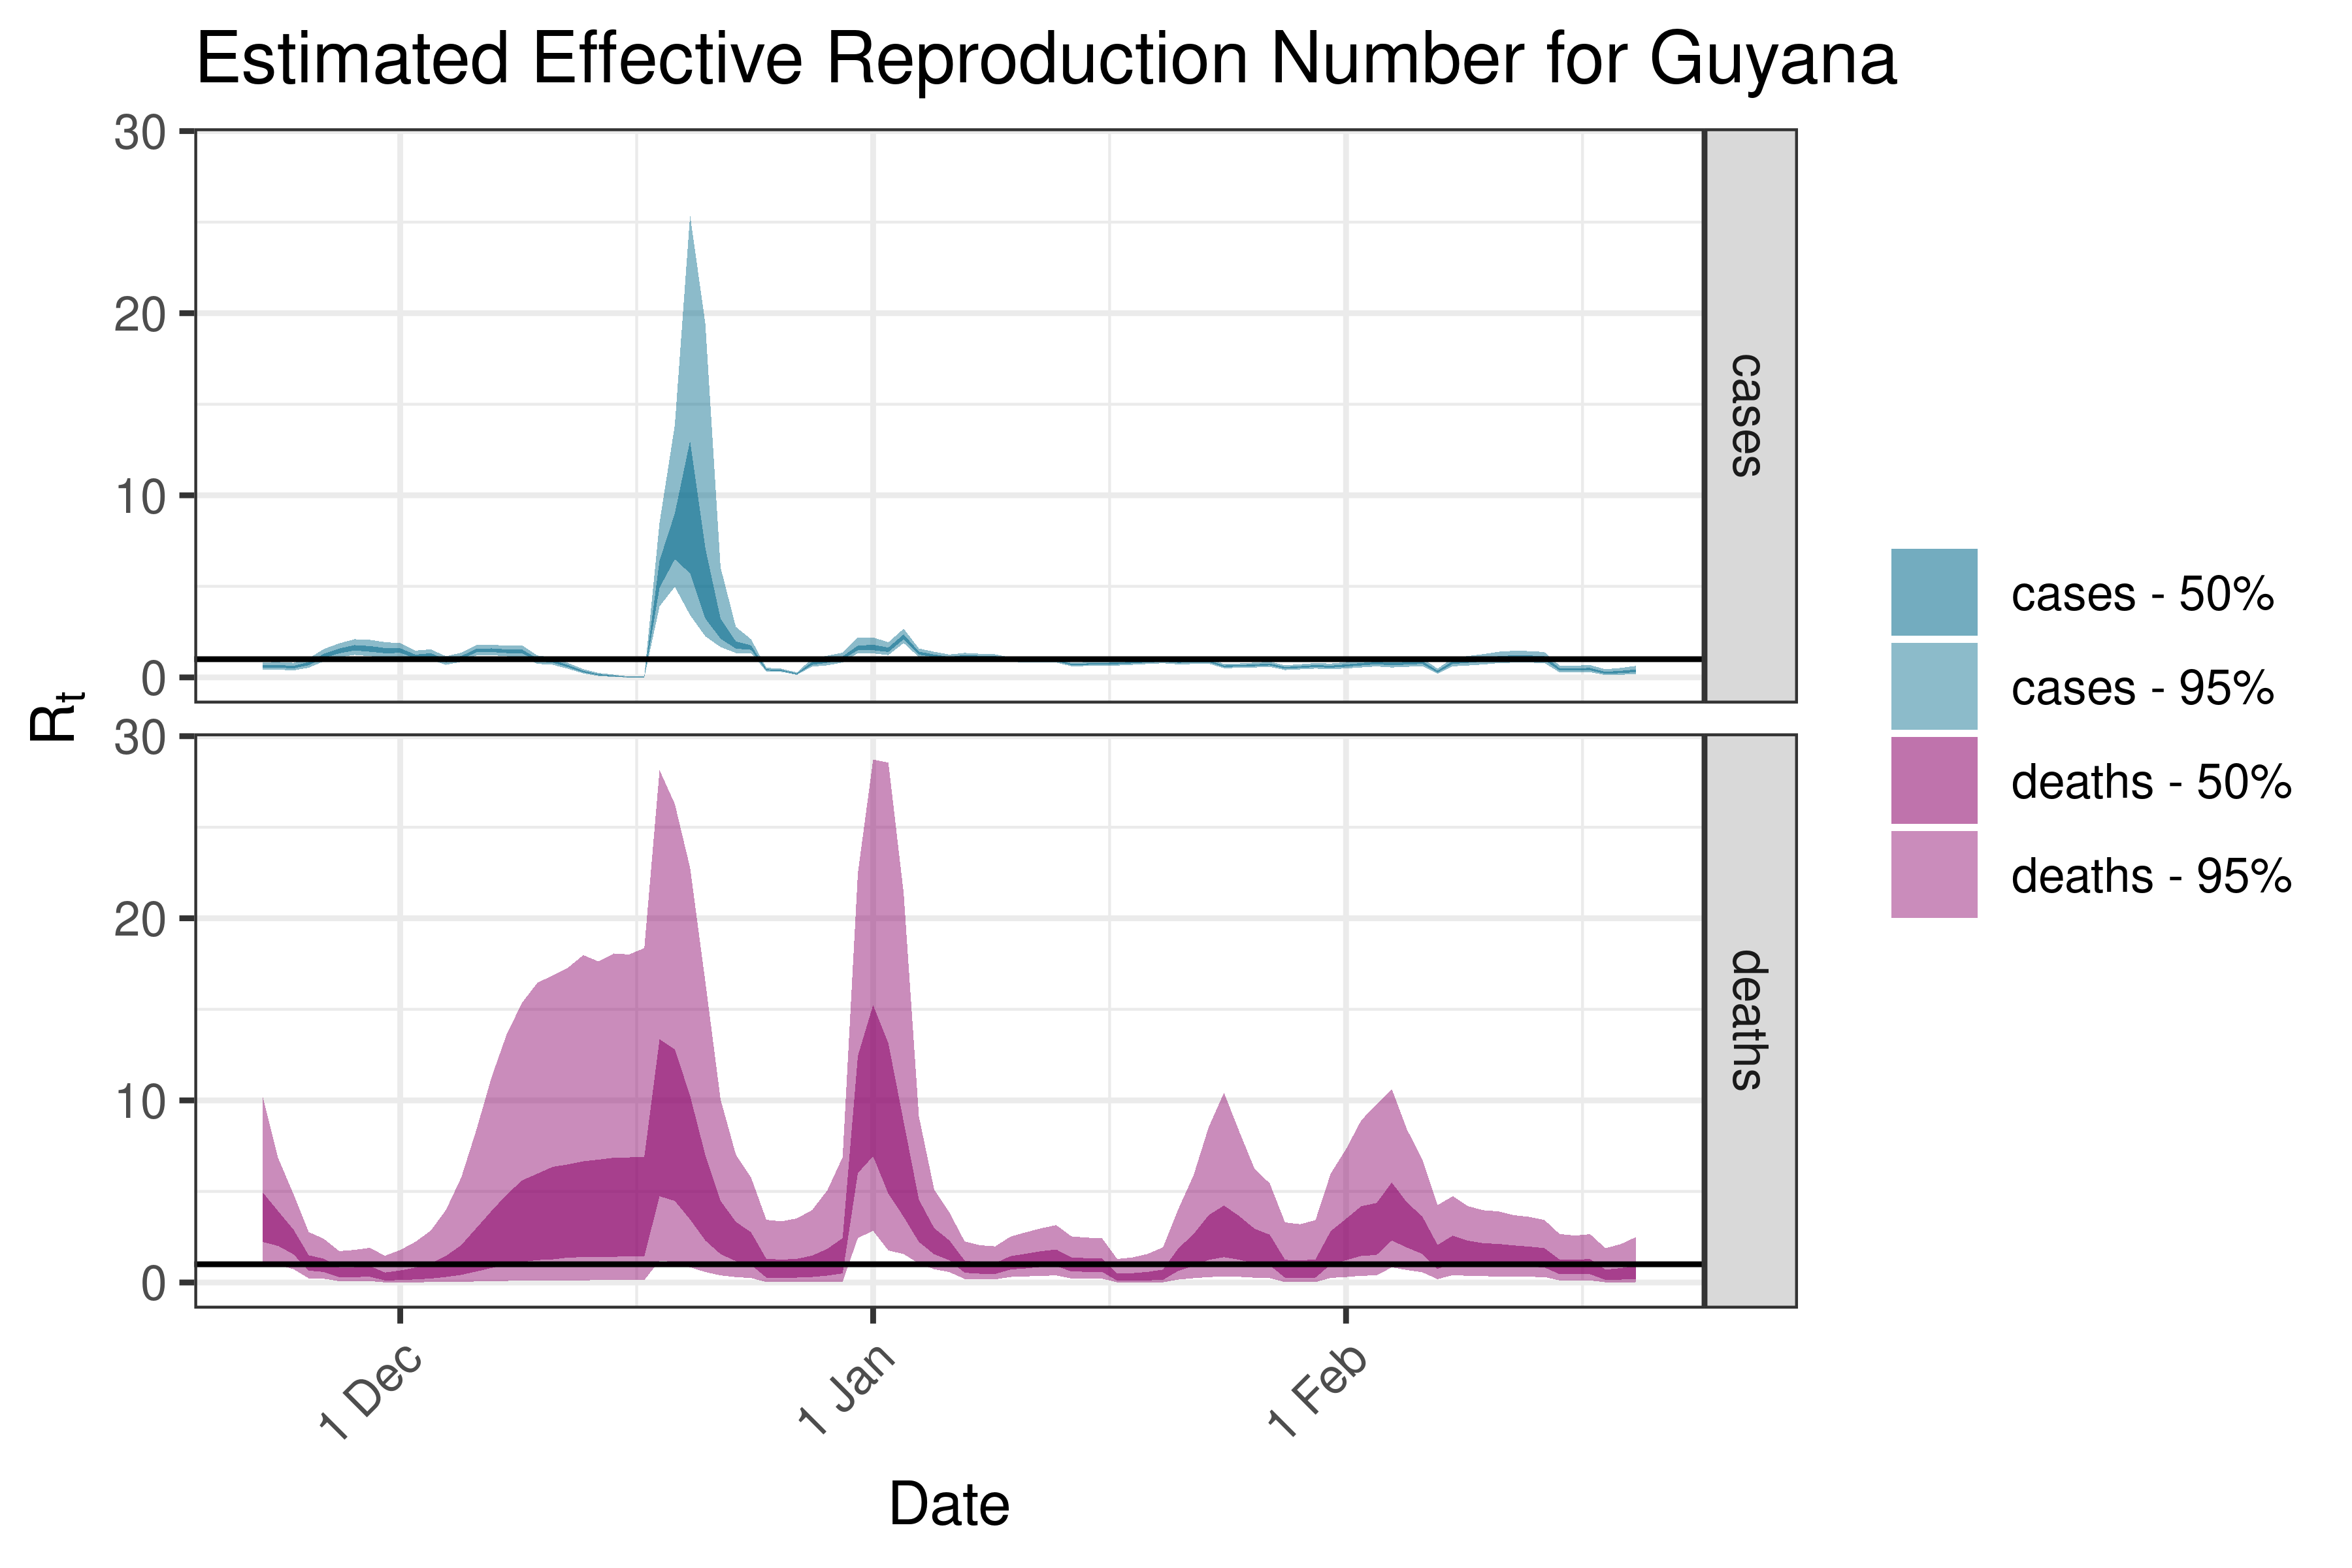
6.5.6.7 Guyana
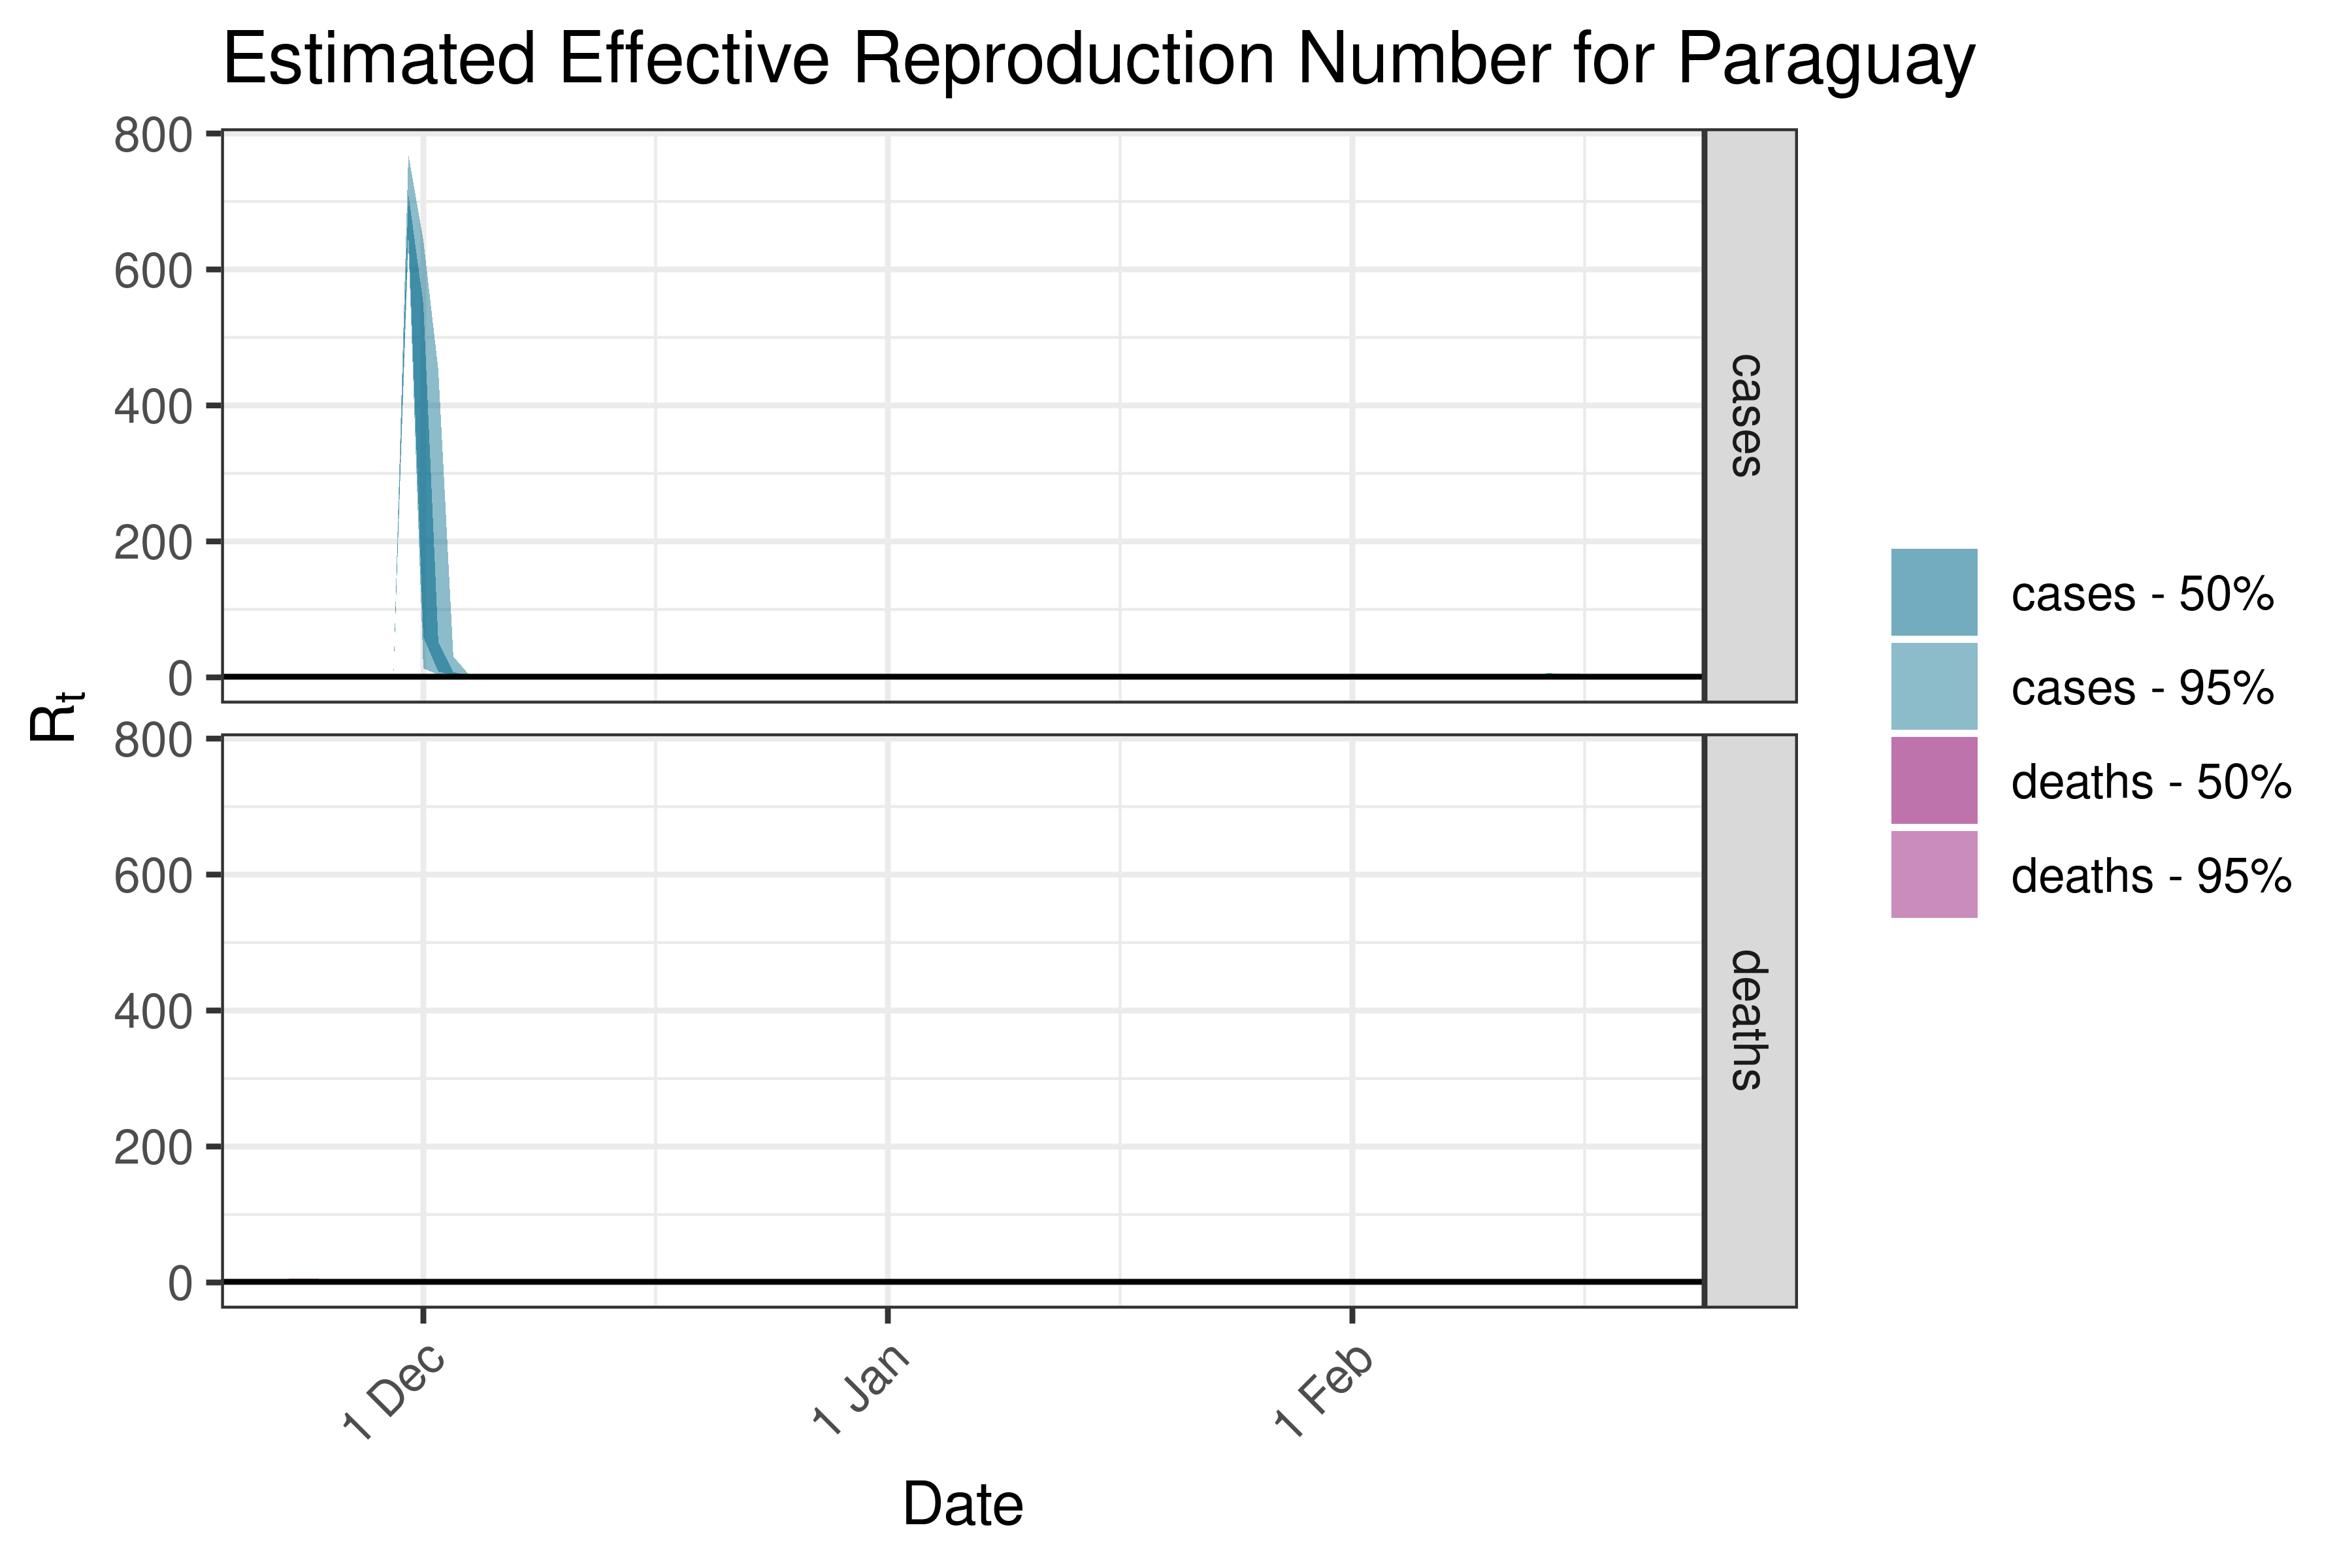
6.5.6.8 Paraguay
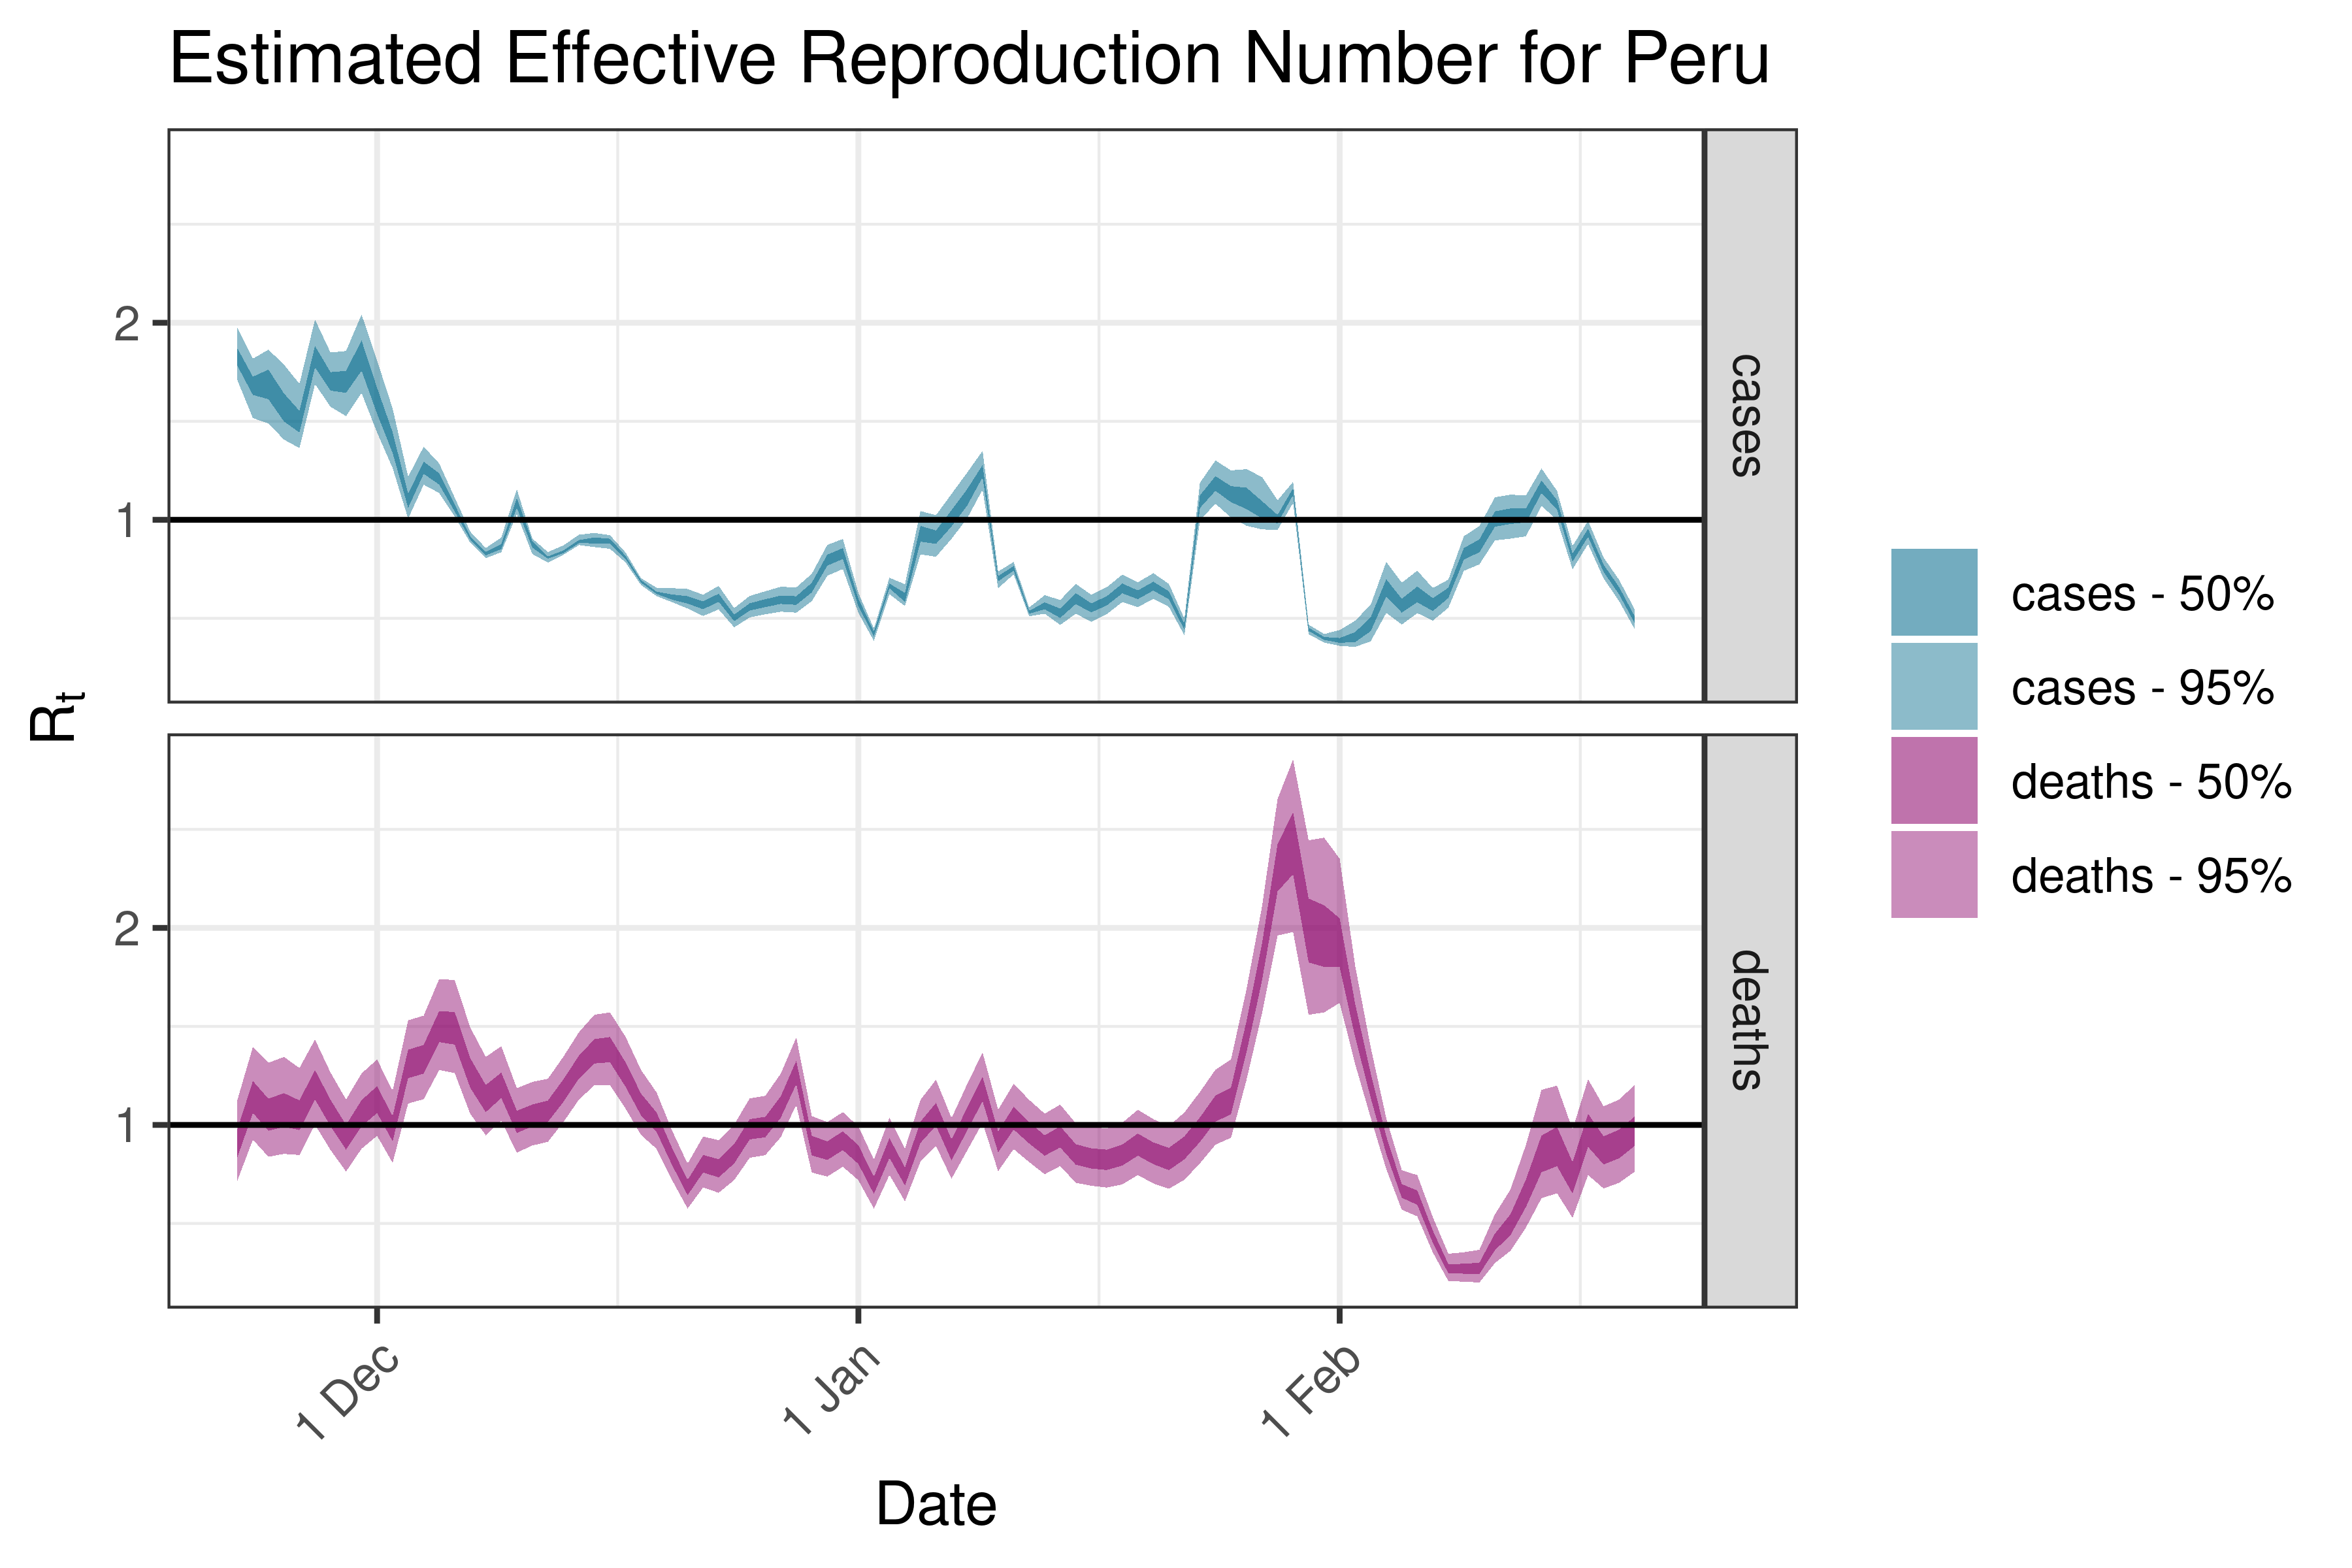
6.5.6.9 Peru
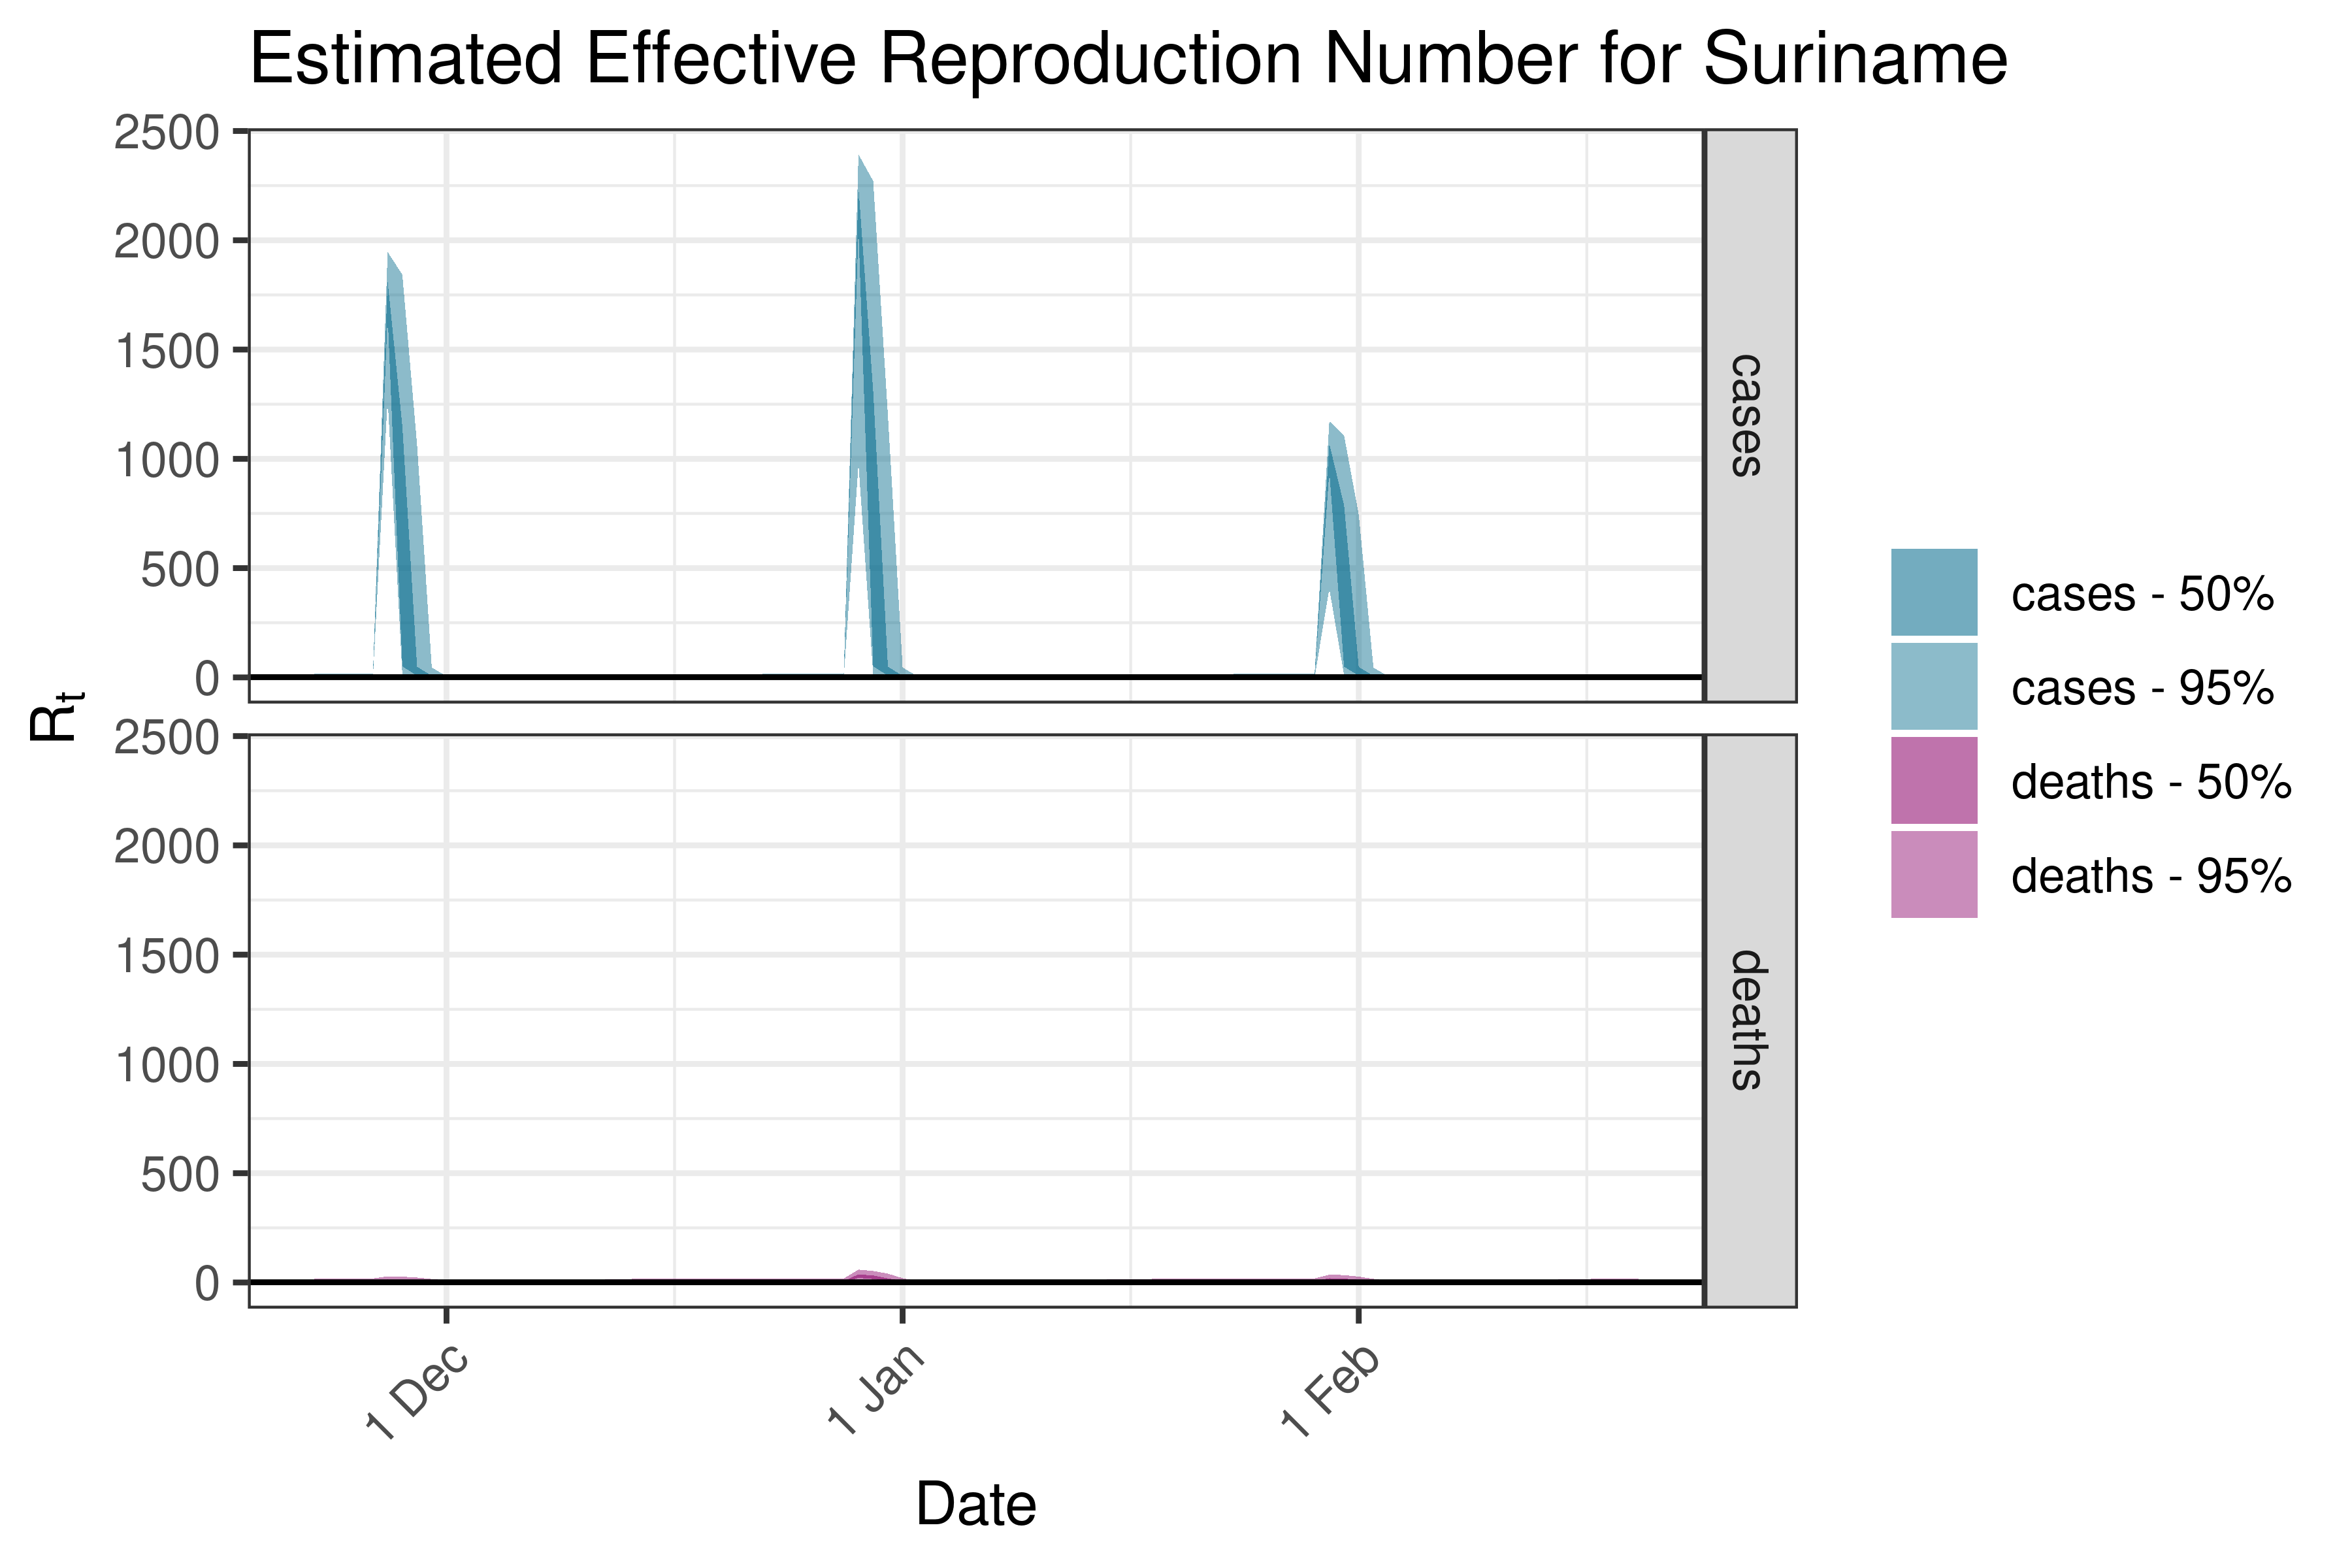
6.5.6.10 Suriname
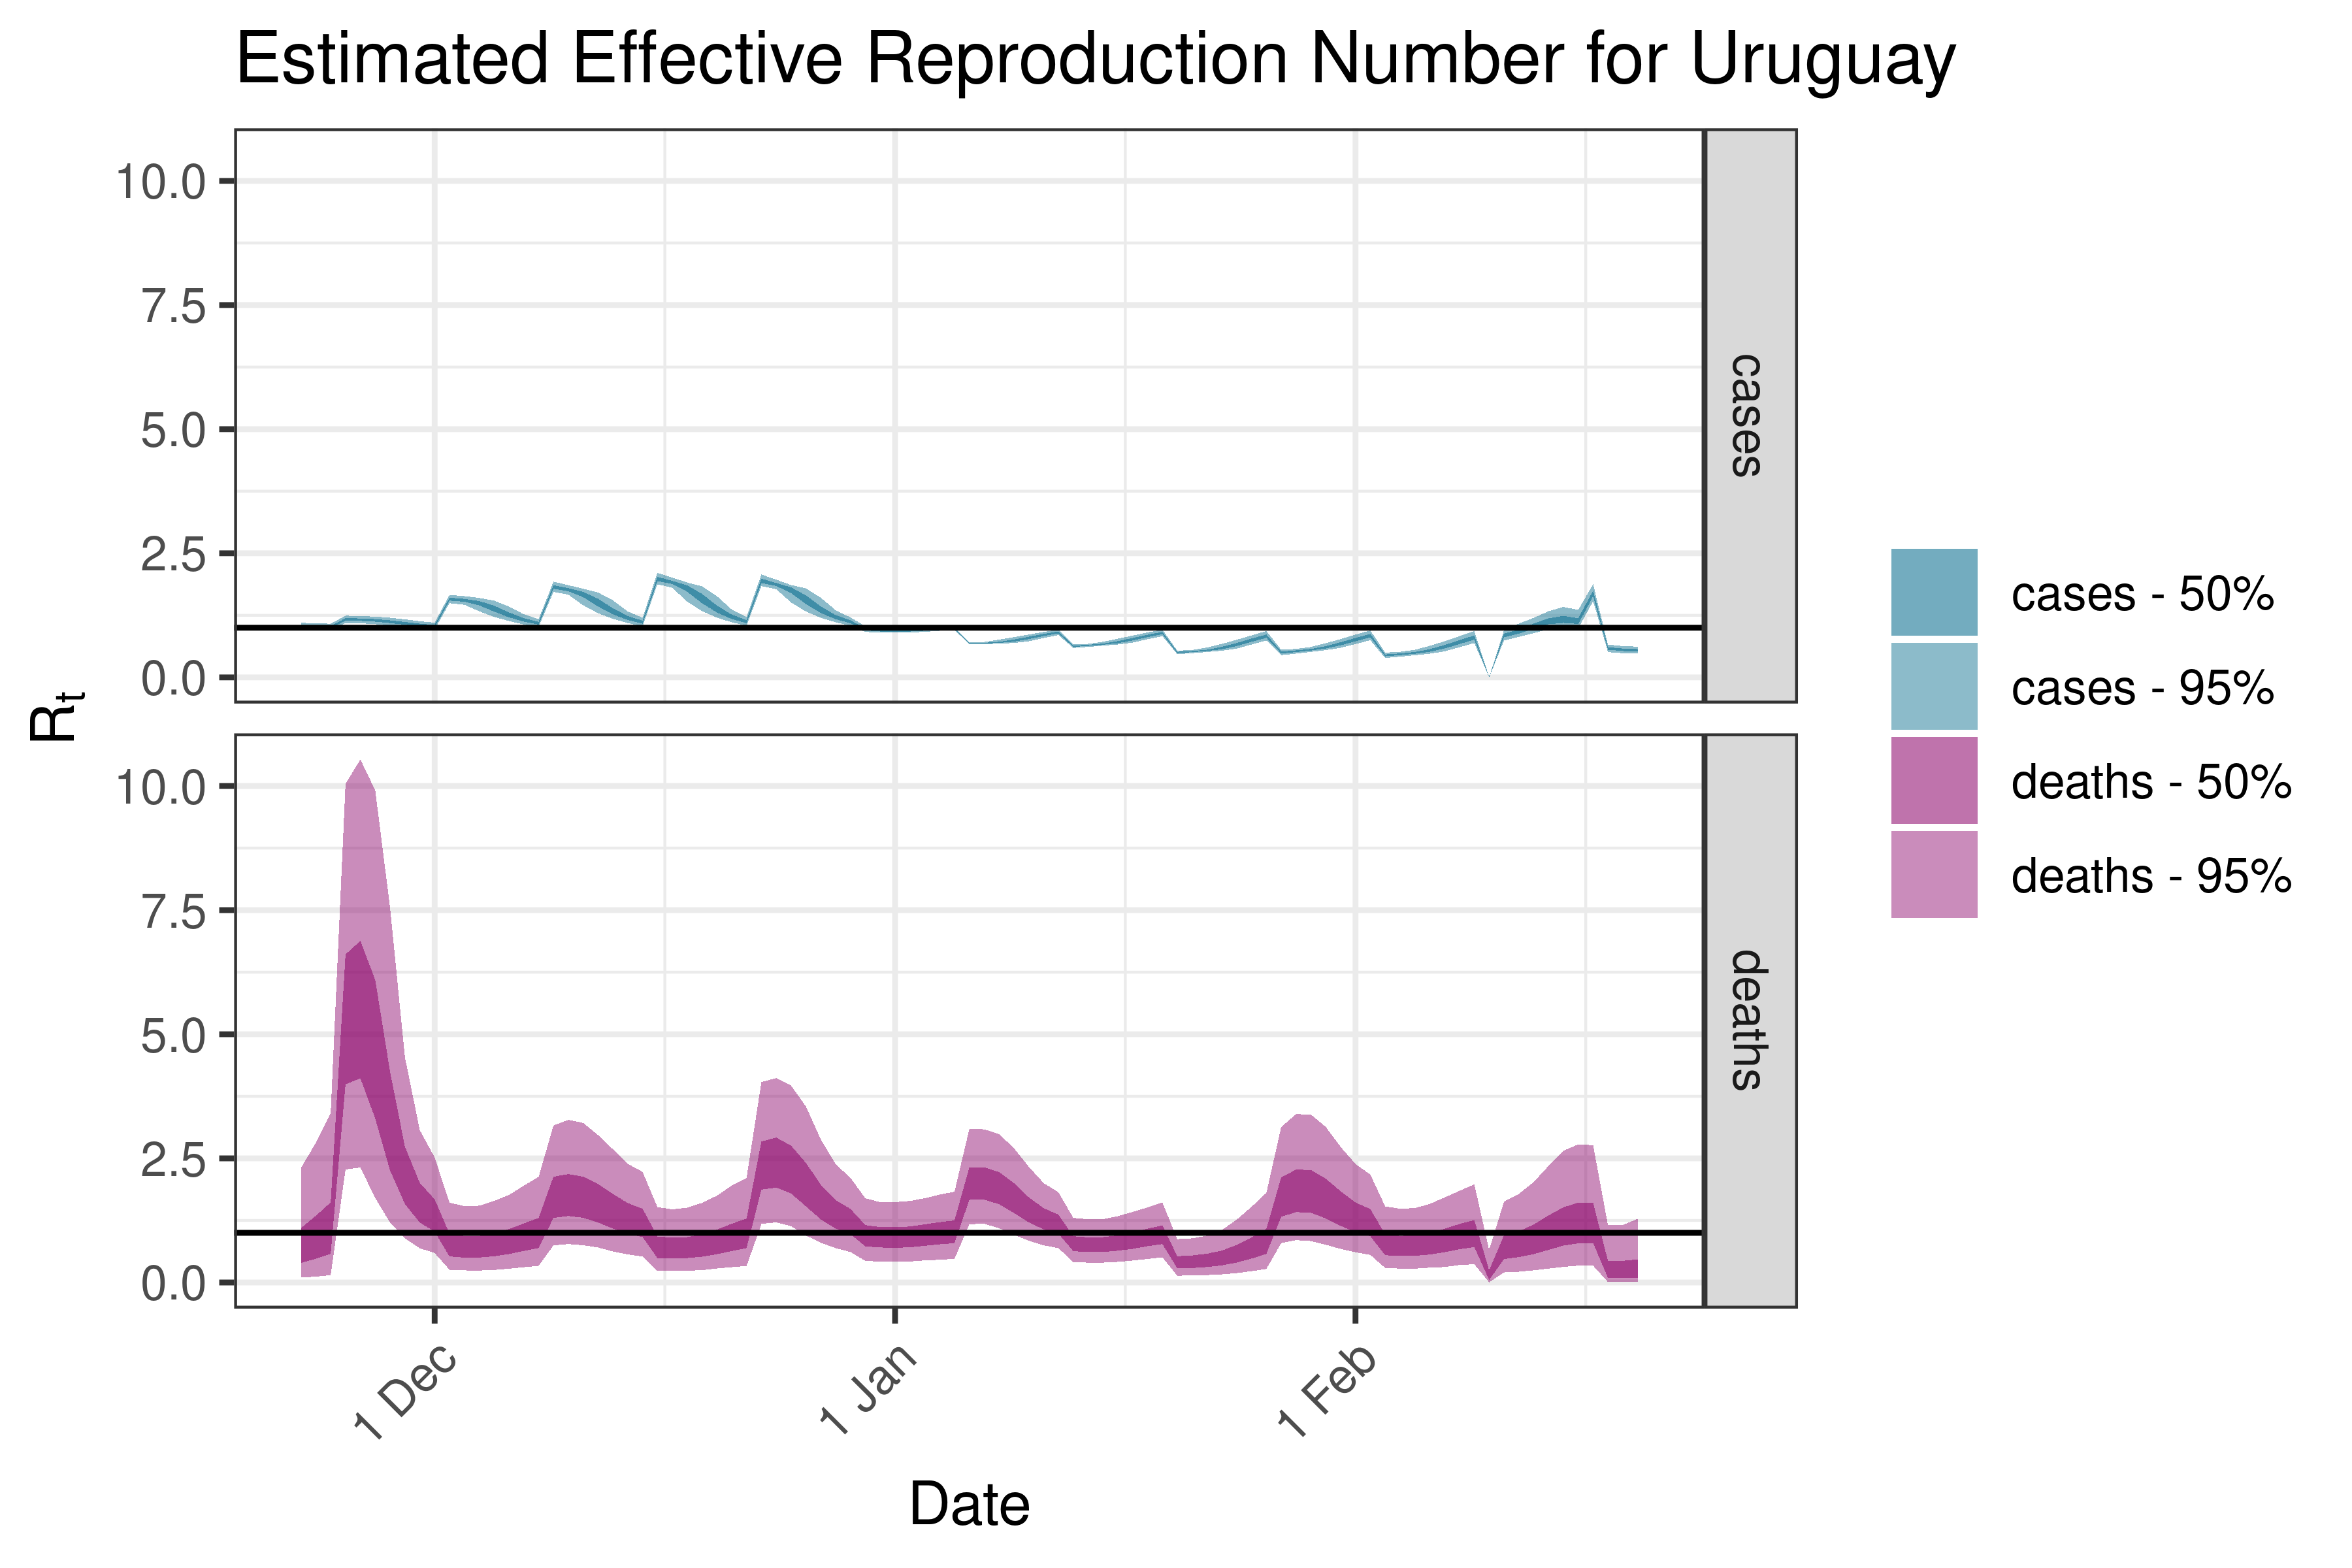
6.5.6.11 Uruguay
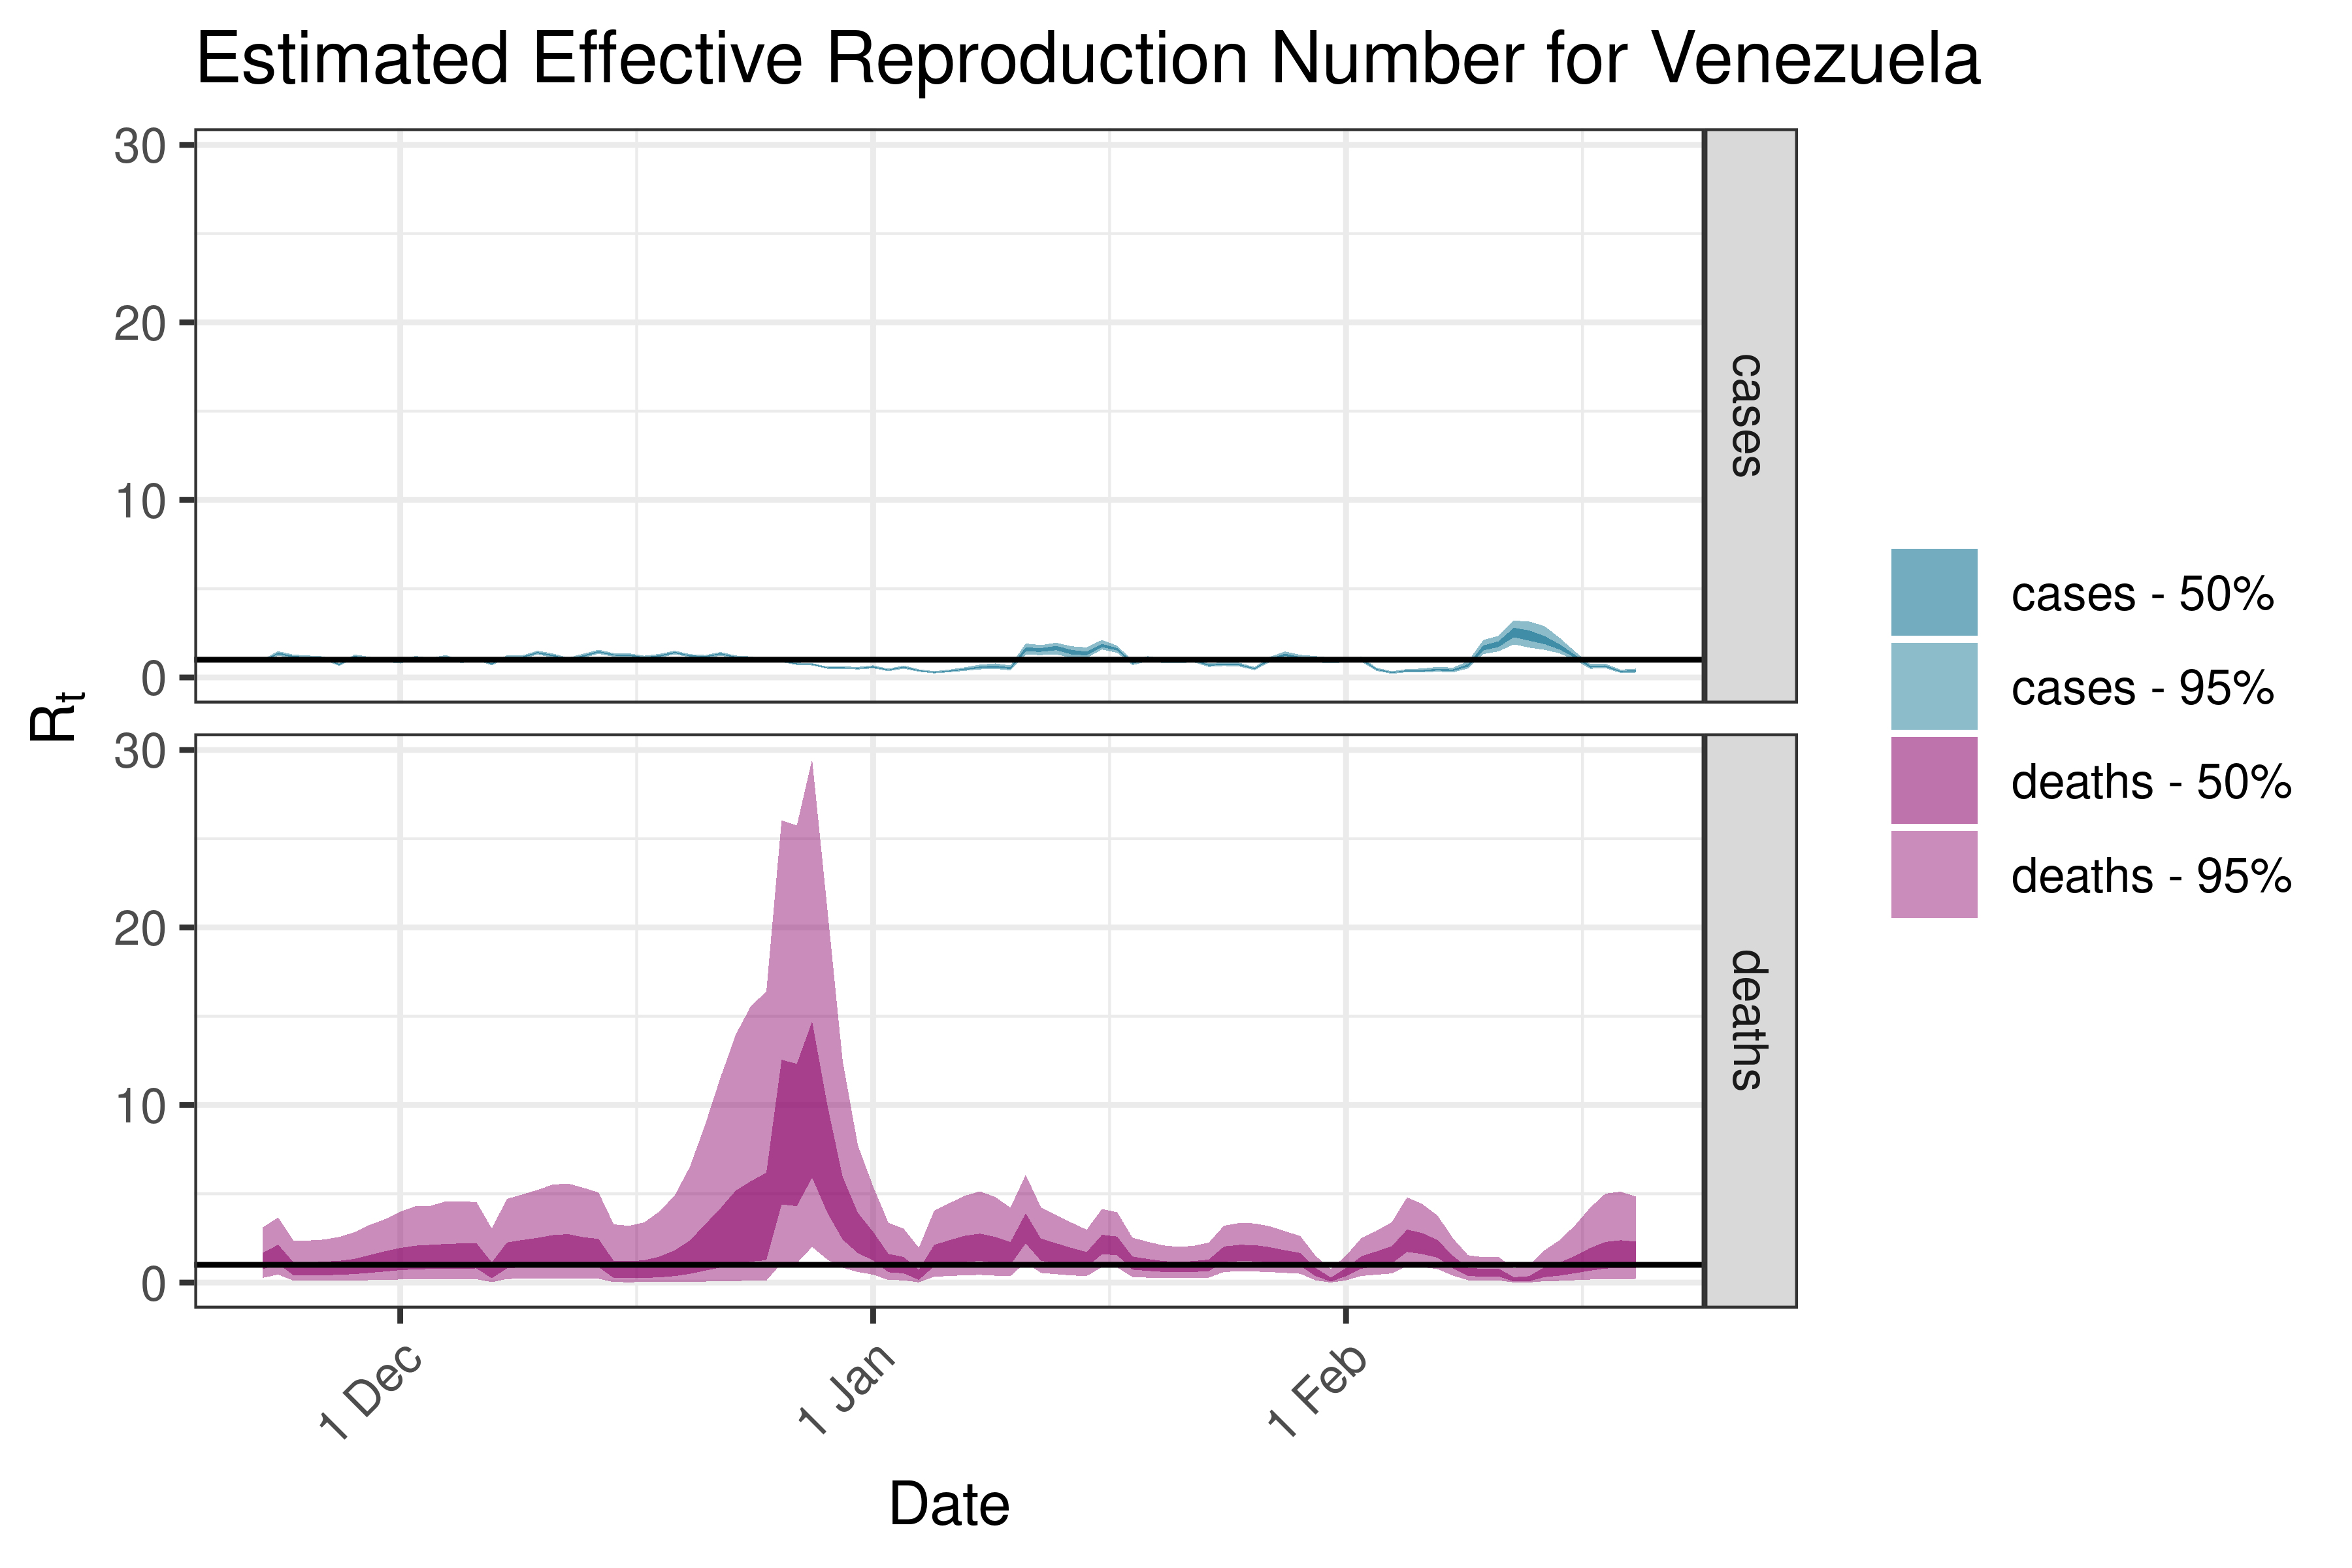
6.5.6.12 Venezuela
6.6 Detailed Output
Detailed output for all countries are saved to a comma-separated value file. The file can be found here.
7 Discussion
Limitation of this method to estimate the reproduction number are noted in [1]
- It’s sensitive to changes in transmissibility, changes in contact patterns, depletion of the susceptible population and control measures.
- It relies on an assumed generation interval assumptions.
- The size of the time window can affect the volatility of results.
- Results are time lagged with regards to true infection, more so in the case of the use of deaths.
- It’s sensitive to changes in case (or death) detection.
- The generation interval may change over time.
Further to the above the estimates are made under assumption that the cases and deaths are reported consistently over time. For cases this means that testing needs to be at similar levels and reported with similar lag. Should these change rapidly over an interval of a few weeks the above estimates of the effective reproduction numbers would be biased. For example a rapid expansion of testing over the last 3 weeks would results in overestimating recent effective reproduction numbers. Similarly any changes in reporting (over time and underreporting) of deaths would also bias estimates of the reproduction number estimated using deaths.
Estimates for the reproduction number are plotted in time period in which the relevant measure is recorded. Though in reality the infections giving rise to those estimates would have occurred roughly between a week to 4 weeks earlier depending on whether it was cases or deaths. These figures have not been shifted back.
Despite these limitation we believe the ease of calculation of this method and the ability to use multiple sources makes it useful as a monitoring tool.