Estimating the Effective Reproduction Number of COVID-19 in Australia
Louis Rossouw
2023-02-18 02:25:13 AEDT
1 Introduction
This paper contains estimates for the effective reproduction number
\(R_{t,m}\) over time \(t\) in various states \(m\) of Australia. This is done using the
methodology as described in [1]. These
have been implemented in R using EpiEstim package [2] which is what is used here. The methodology
and assumptions are described in more detail here.
This paper and it’s results should be updated roughly daily and is available online.
2 Updates
As this paper is updated over time this section will summarise significant changes. The code producing this paper is tracked using Git. The Git commit hash for this project at the time of generating this paper was 6cab0e089bd06c9688728ab585072be9bce67169.
The following major updates have been made:
- Initial code on 29 December 2021
- Removed percentage testing positive from report as use of antigen test distorts these graphs on 22 April 2022.
3 Data
3.1 Data Source
Data data is extracted from covid19data.com.au [3]. This contains the daily cases, tests and deaths for Australia nationally and by state. It also contains numbers currently in hospital, ICU and on ventilators Note this data does not contain daily admissions.
This report contains data up to 2023-02-10.
3.2 Data Fixes
The following fixes are applied to case, deaths and test data:
- Anywhere a cumulative figures that are lower than the day before are removed. These are probably usually due to corrections on previous days data.
- Data capturing issues and the removal of figures under the point in above results in gaps in the daily data. These are filled by linear interpolation of cumulative figures between the available dates.
- Daily counts are calculated using differences of cumulative figures.
- Hospitalisation, ICU and ventilator figures are not adjusted.
4 Methodology
The methodology is described in detail here. Here we estimate the effective reproduction number on cases.
5 Results
5.1 National
5.1.1 Tests
Below raw numbers of test by date are plotted on a 7-day moving average from 1 April 2020.
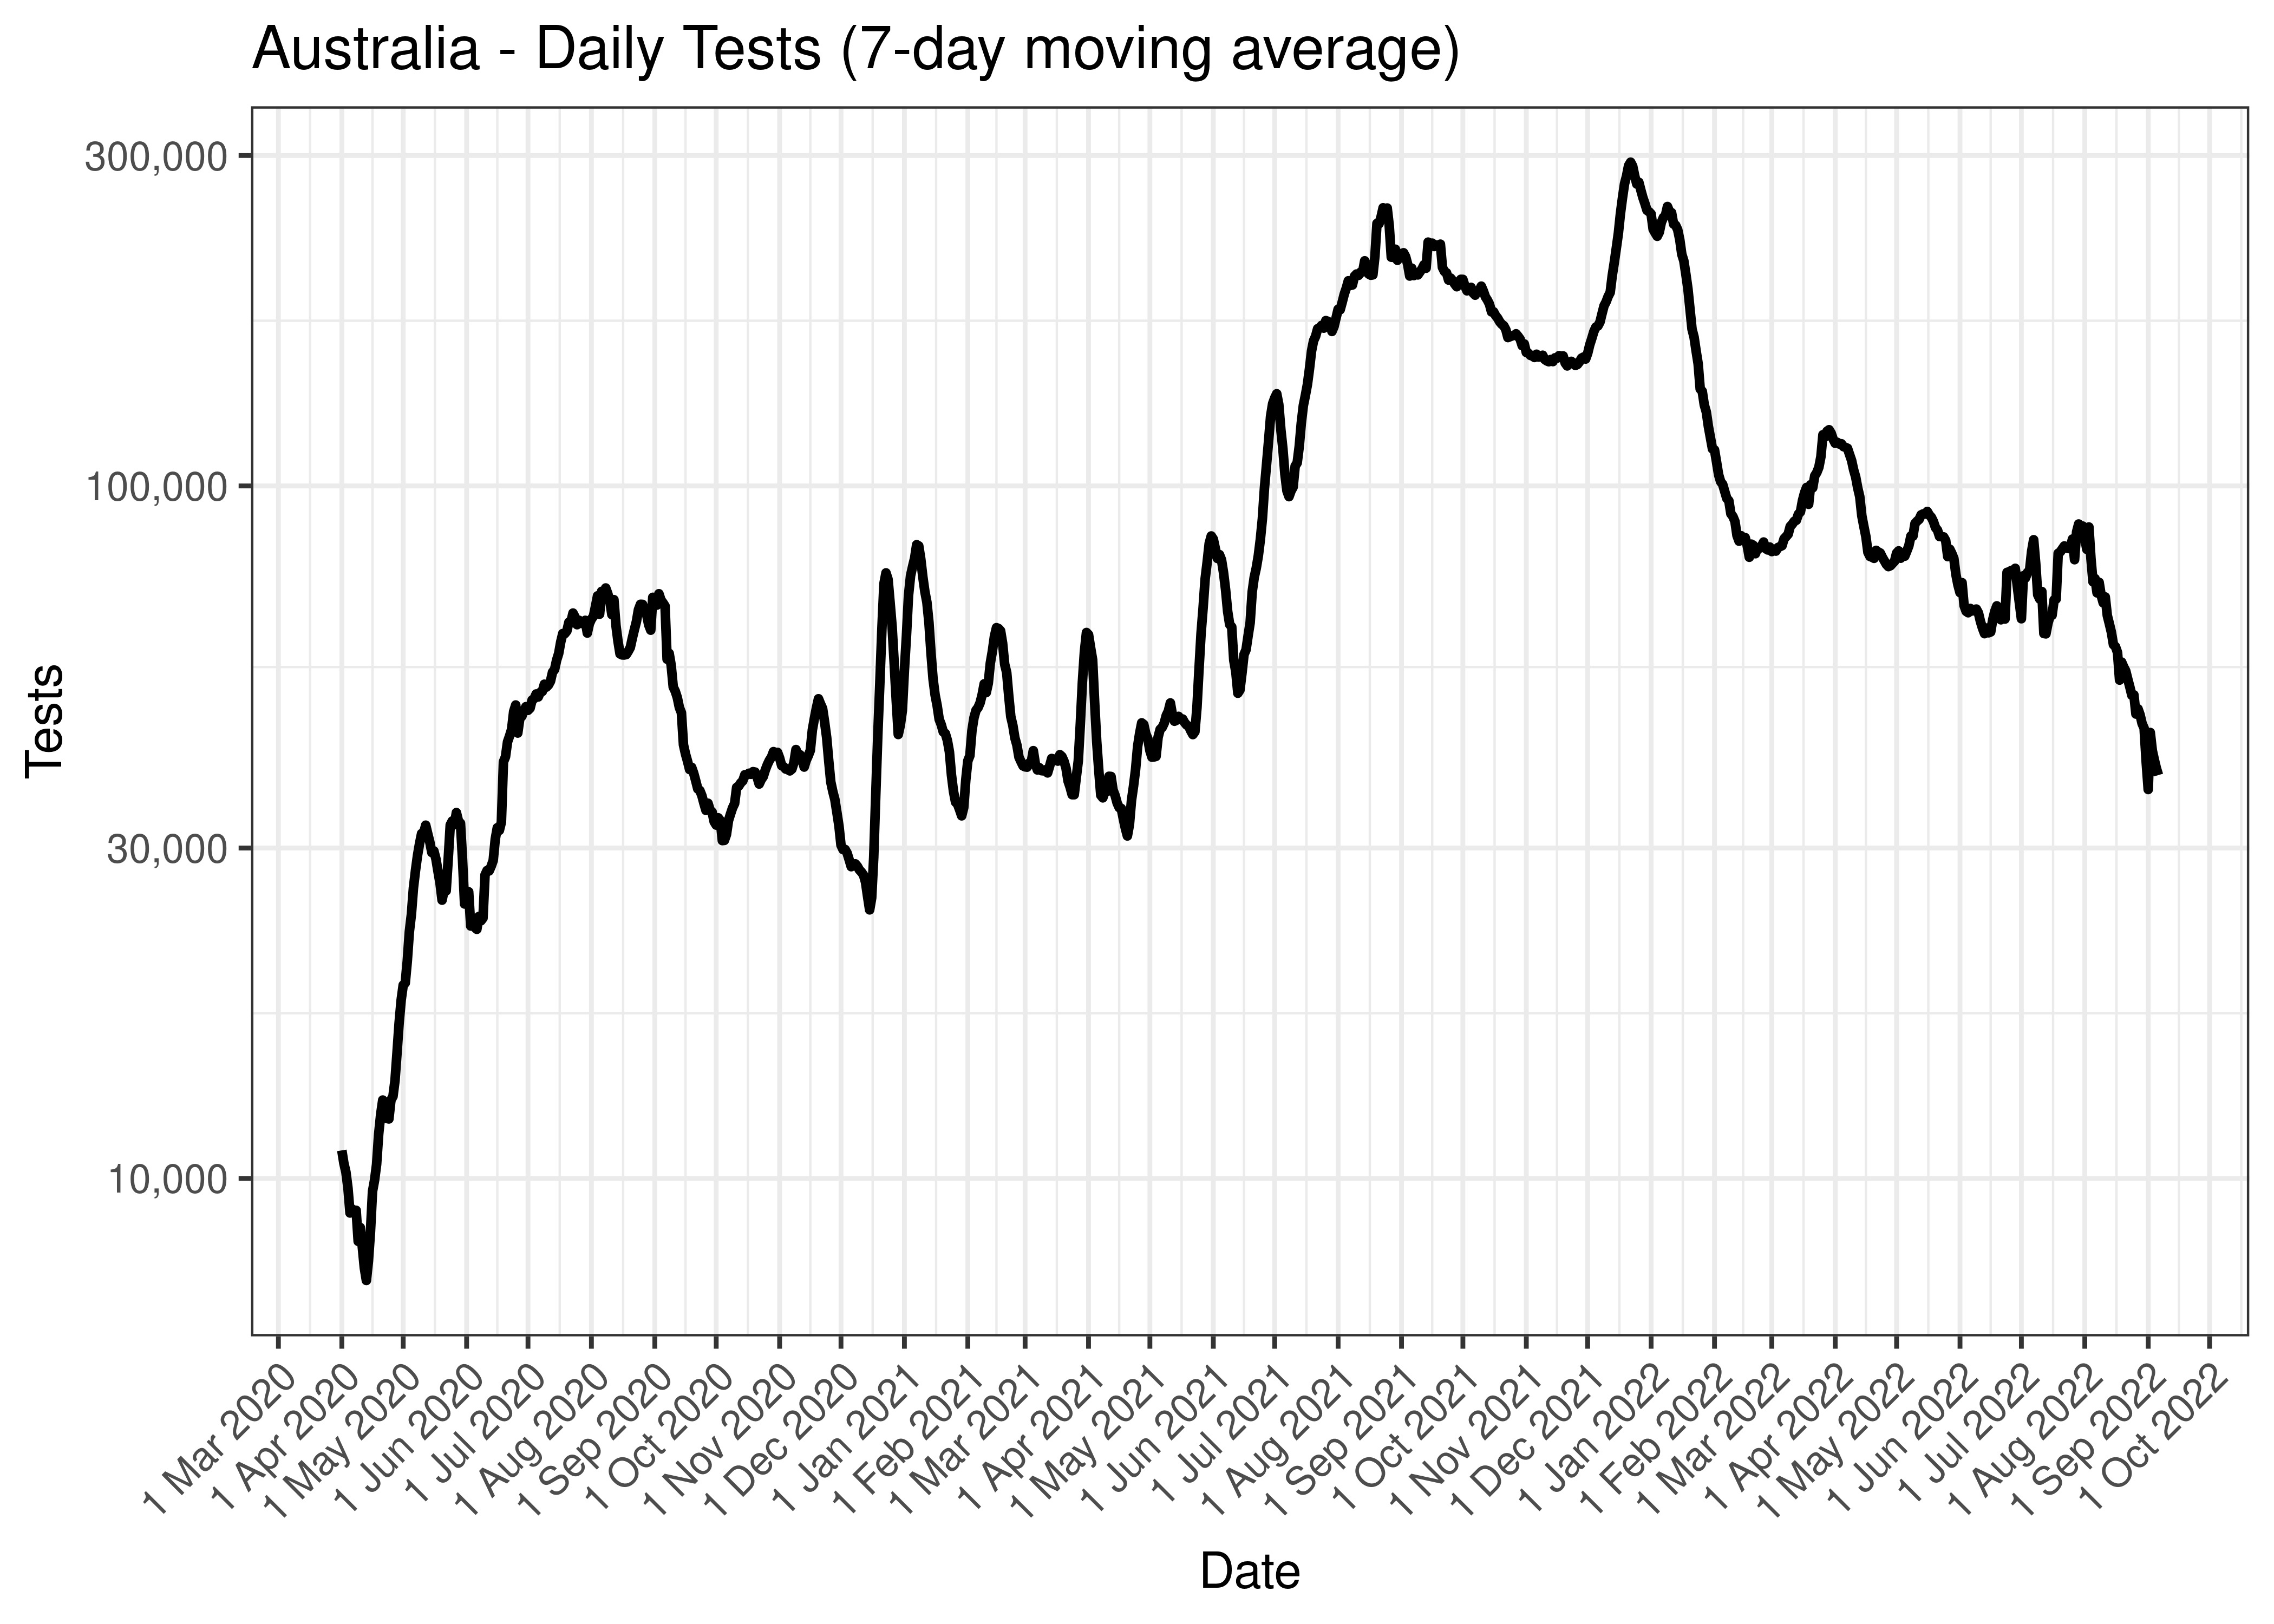
Australia - Daily Tests (7-day moving average)
The above chart is repeated below covering the last 30 days only.
Australia - Daily Tests for Last 30 Days (7-day moving average)
5.1.2 Cases
Cases are tabulated by date below. A centred 7-day moving average is also shown. The peak daily cases in previous waves (as measured by the moving average) is also shown.
| Date | Cases | 7-day Moving Average | Comment |
|---|---|---|---|
| 2020-03-26 | 379 | 376 | Wave 1 Peak |
| 2020-08-02 | 641 | 551 | Wave 2 Peak |
| 2021-10-12 | 1,809 | 2,310 | Wave 3 Peak |
| 2022-03-19 | 45,367 | 80,205 | Wave 4 Peak (to date) |
| 2023-02-03 | 17,536 | 2,505 | |
| 2023-02-04 | 0 | 2,505 | |
| 2023-02-05 | 0 | 2,505 | |
| 2023-02-06 | 0 | 2,505 | |
| 2023-02-07 | 0 | 2,484 | |
| 2023-02-08 | 0 | NA | |
| 2023-02-09 | 0 | NA | |
| 2023-02-10 | 17,387 | NA |
The above are based on the following dates:
- Wave 1 started on 2020-01-01.
- Wave 2 started on 2020-06-01.
- Wave 3 started on 2021-06-01.
- Wave 4 started on 2021-12-01.
Below a 7-day moving average daily case is plotted by on a log scale since start of the epidemic.
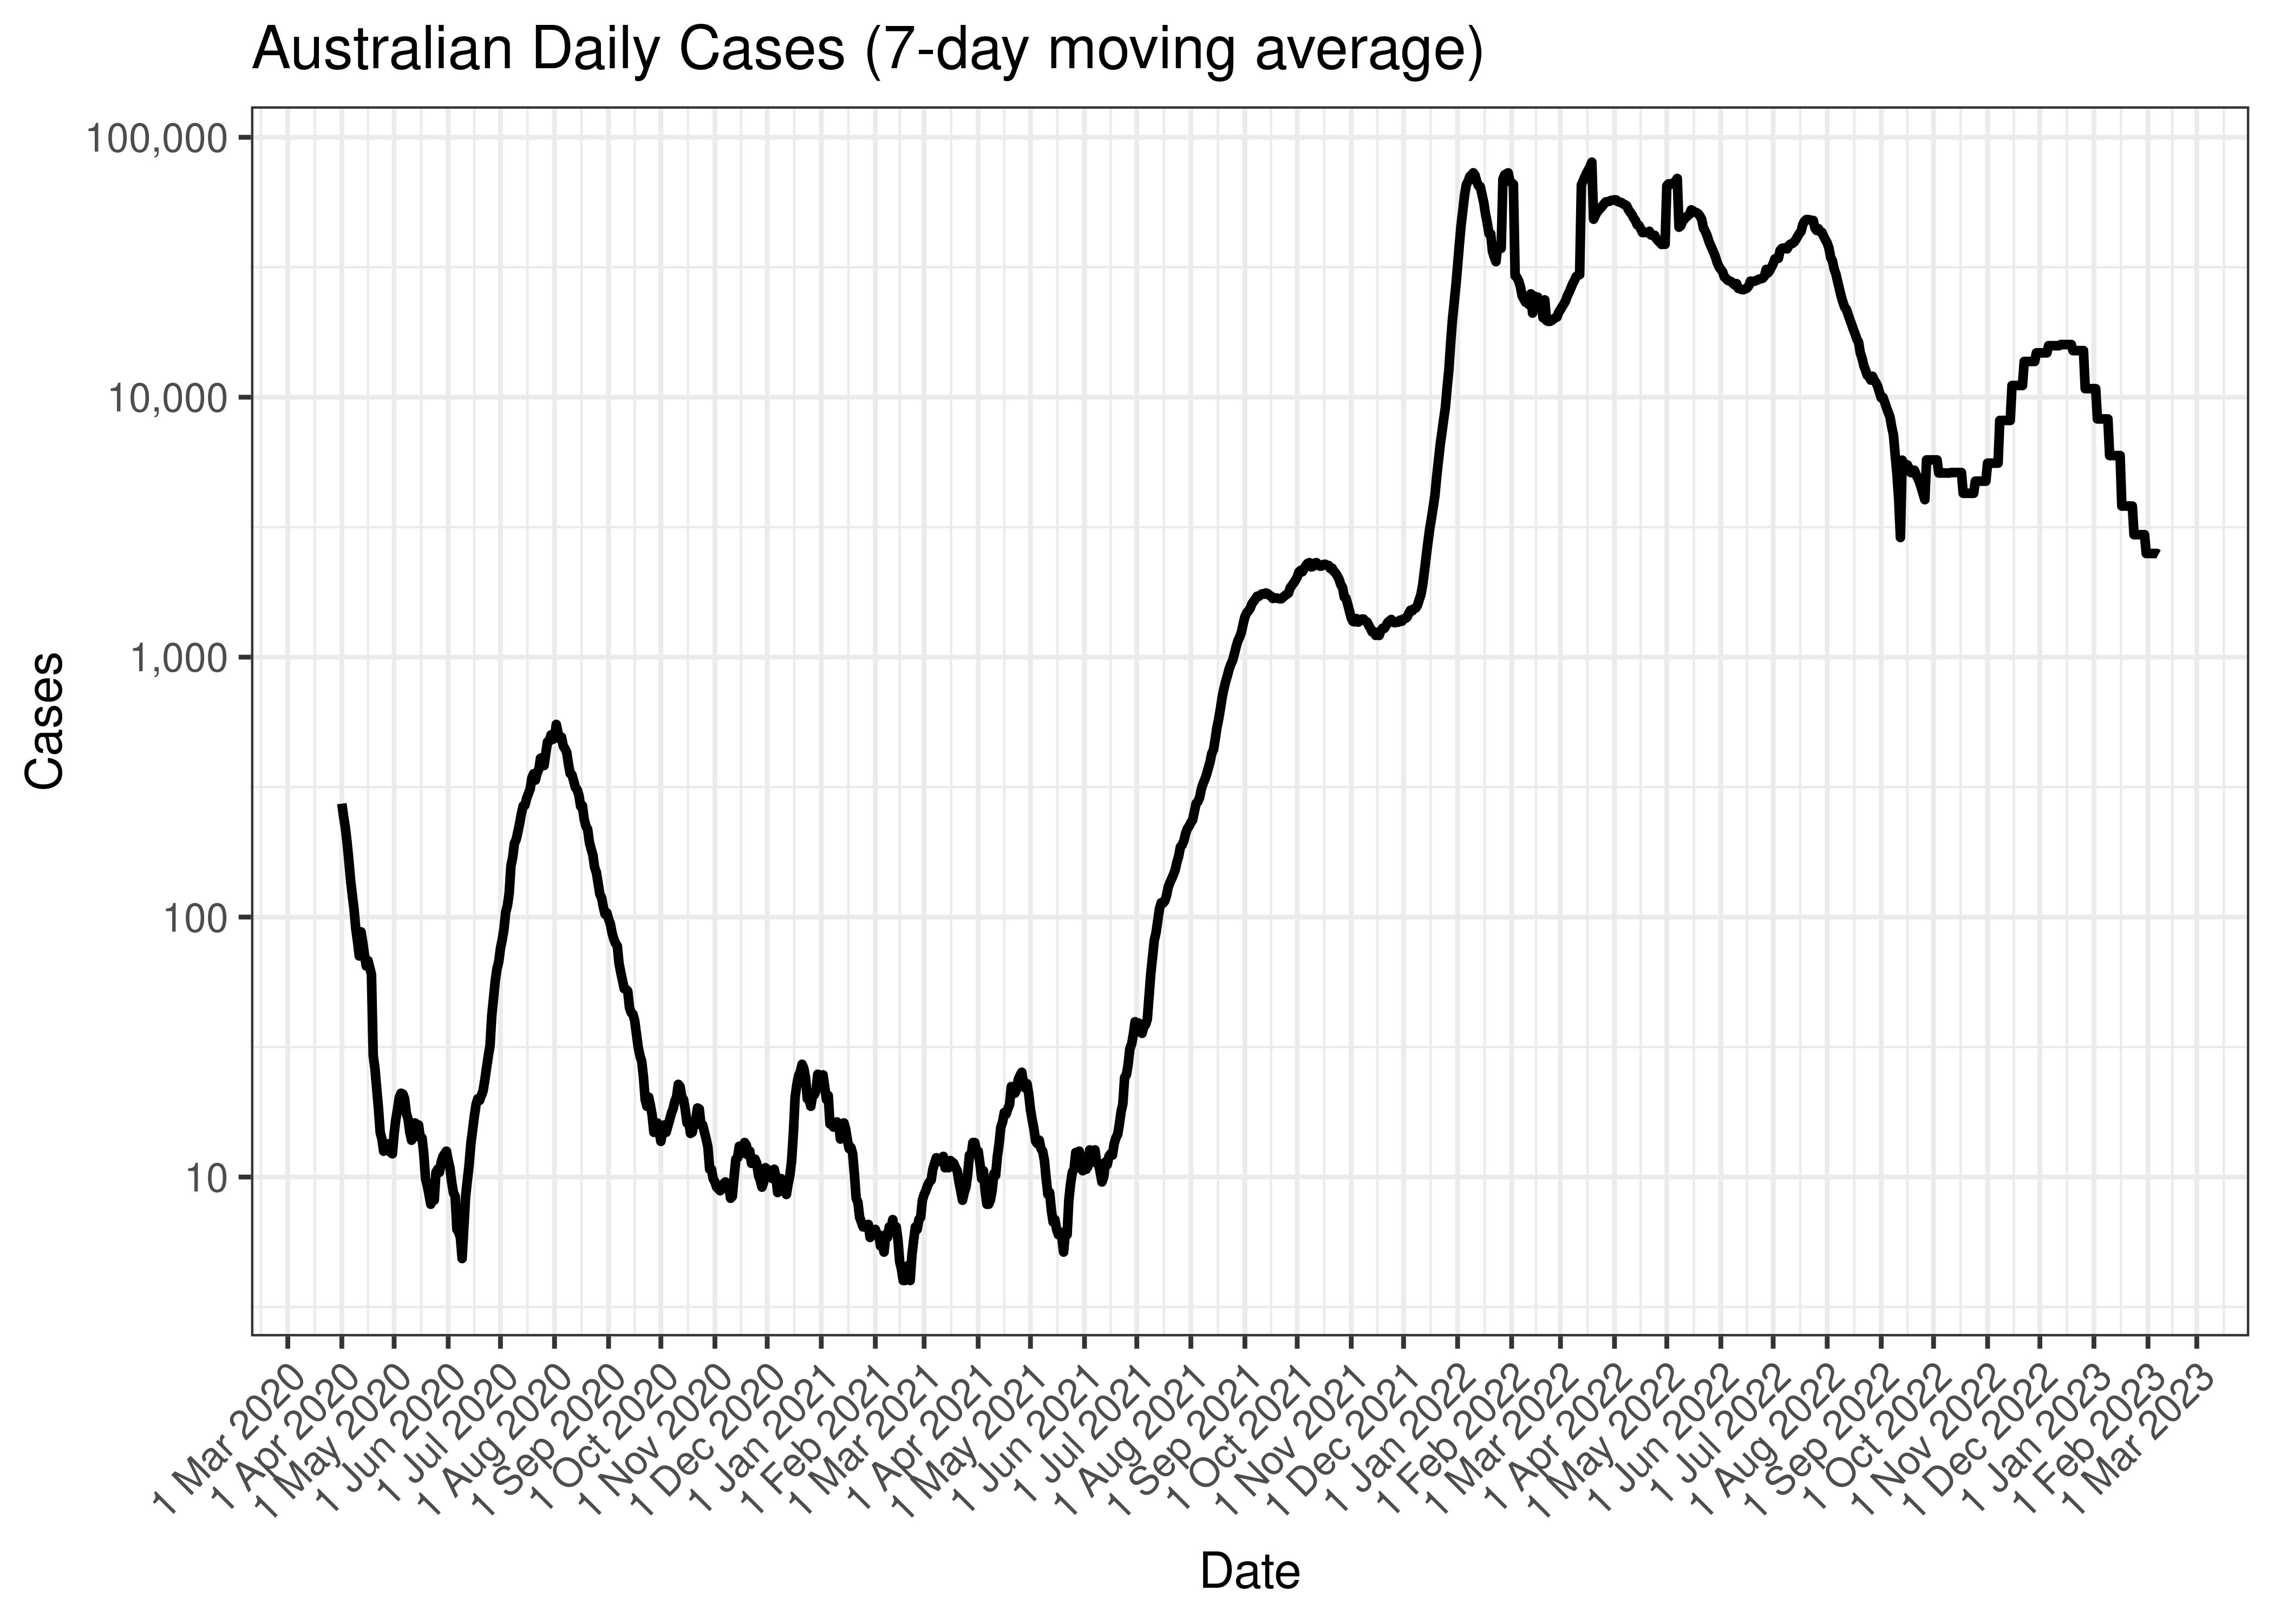
Australian Daily Cases (7-day moving average)
Below the above chart is repeated for the last 30-days:
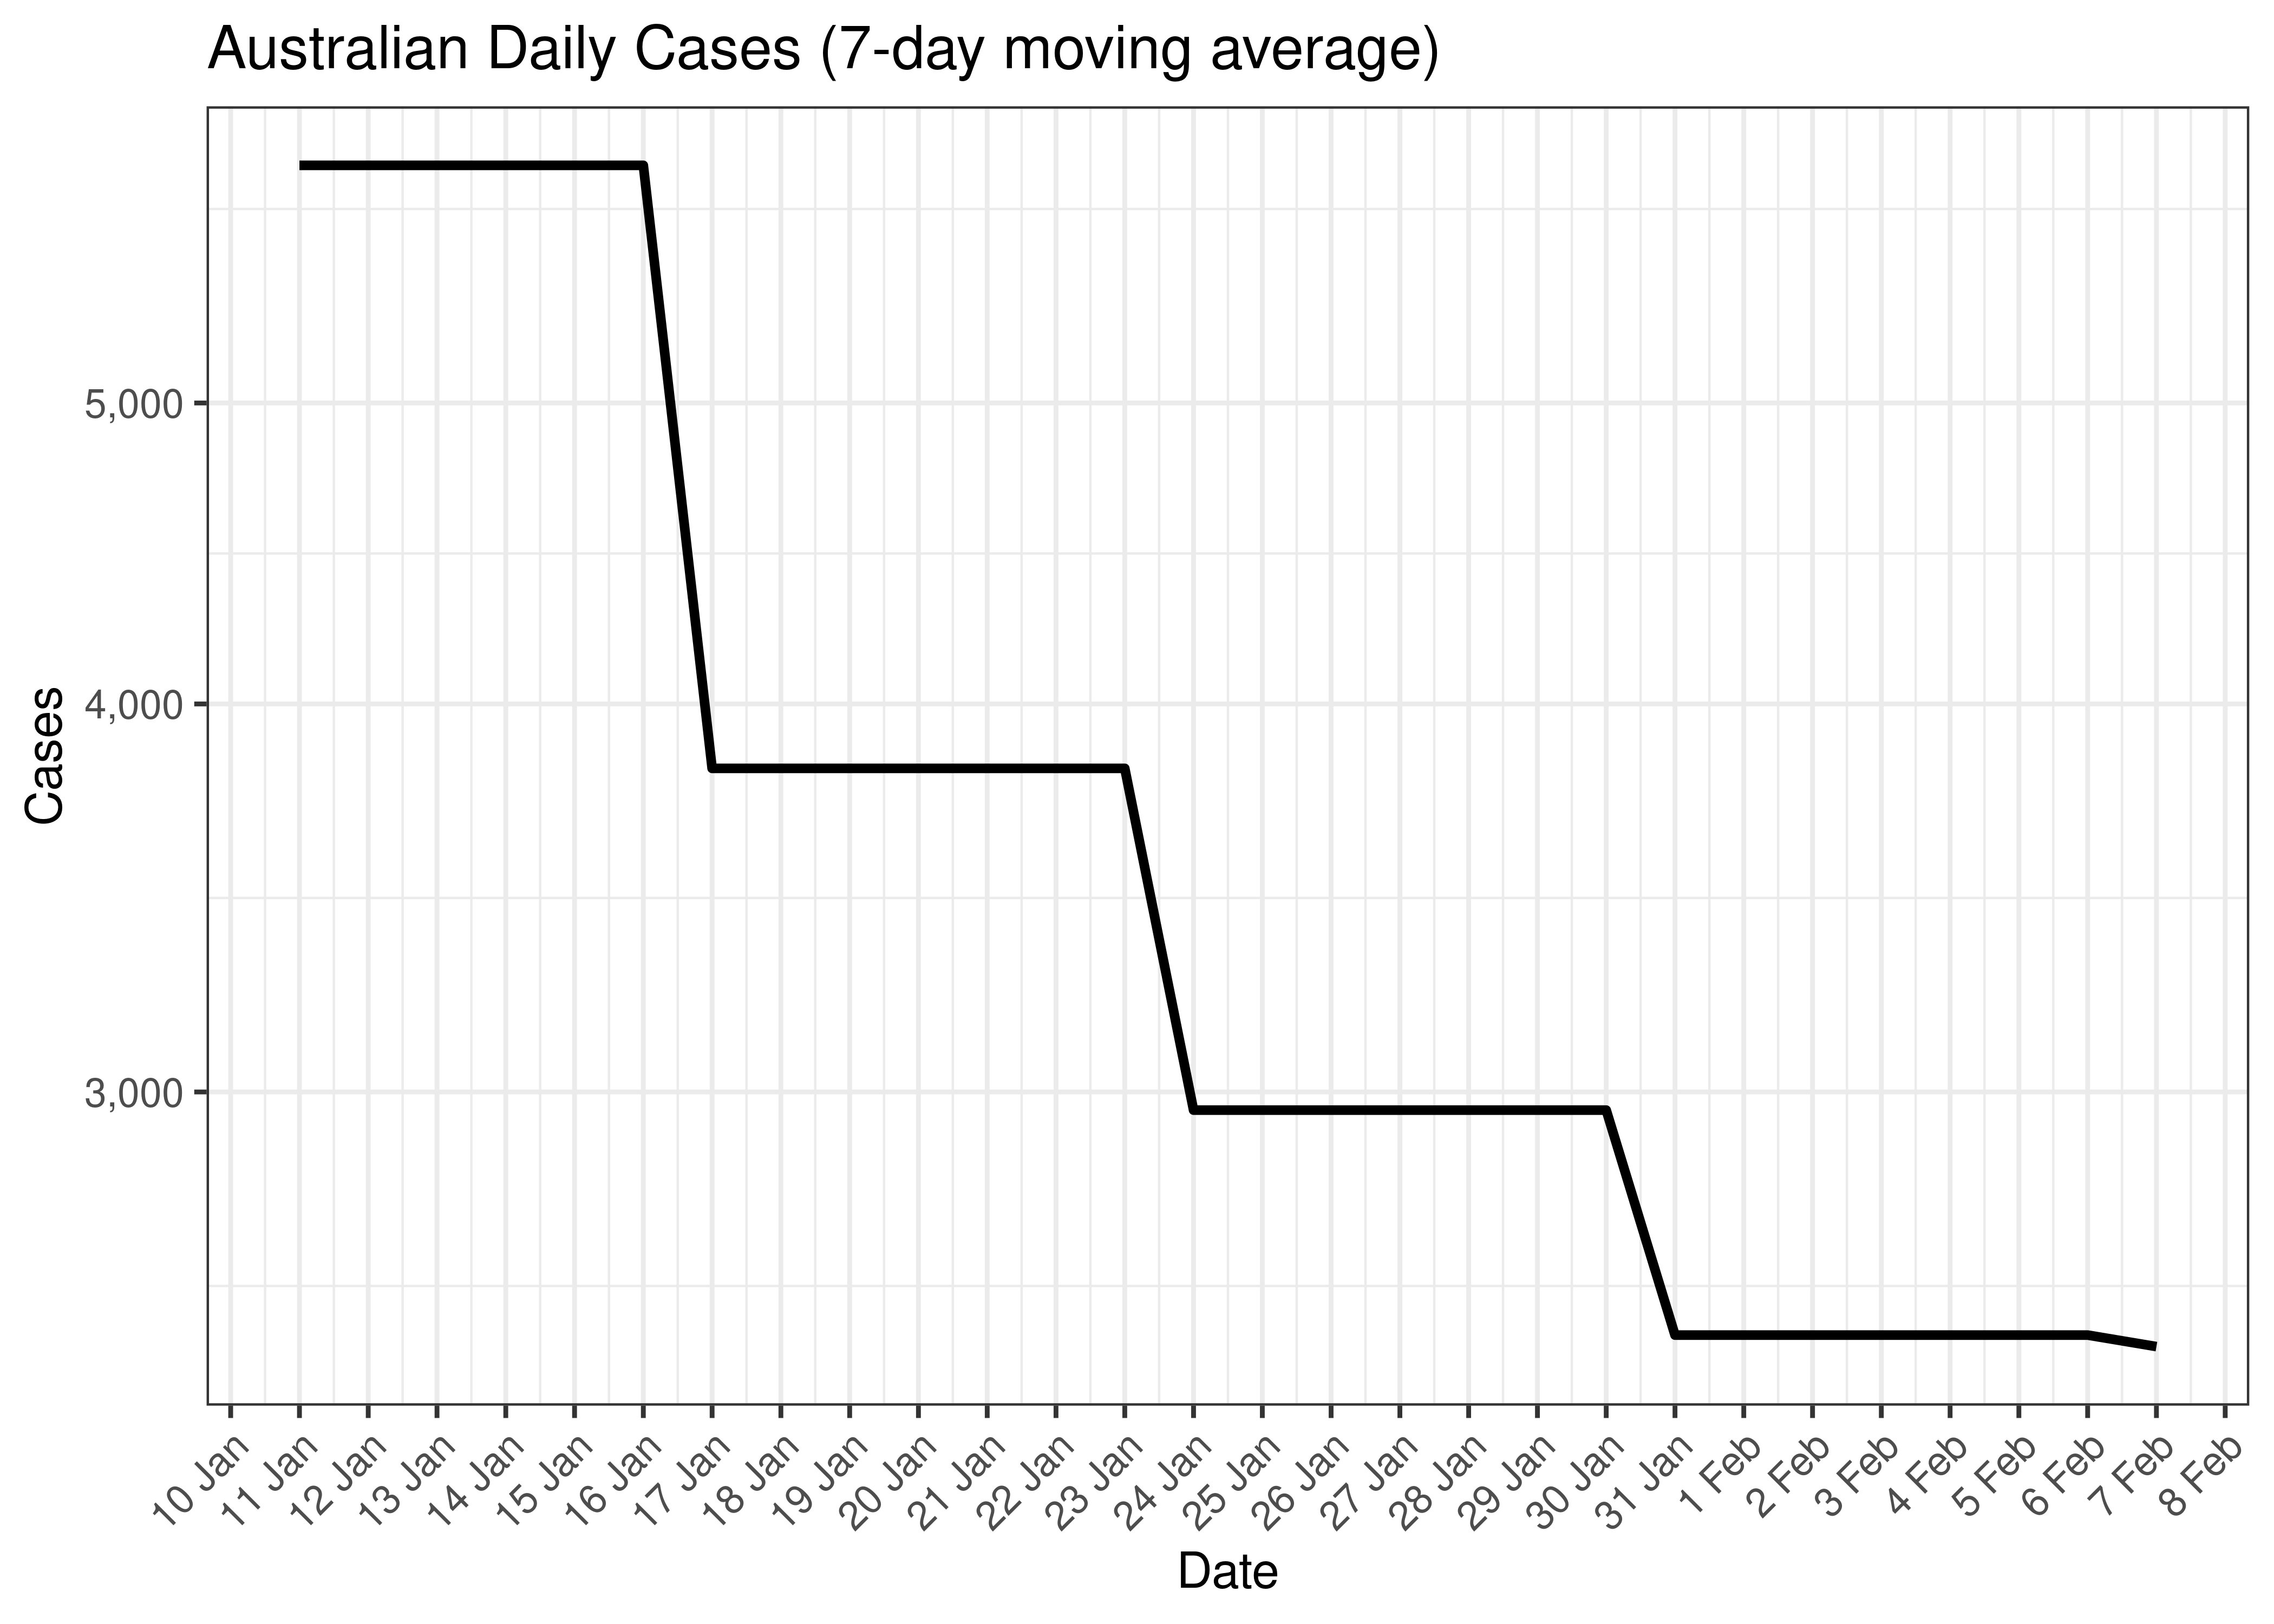
Australian Daily Cases for Last 30-days (7-day moving average)
Below a 7-day moving average daily case count is plotted by state on a log scale since start of the epidemic:
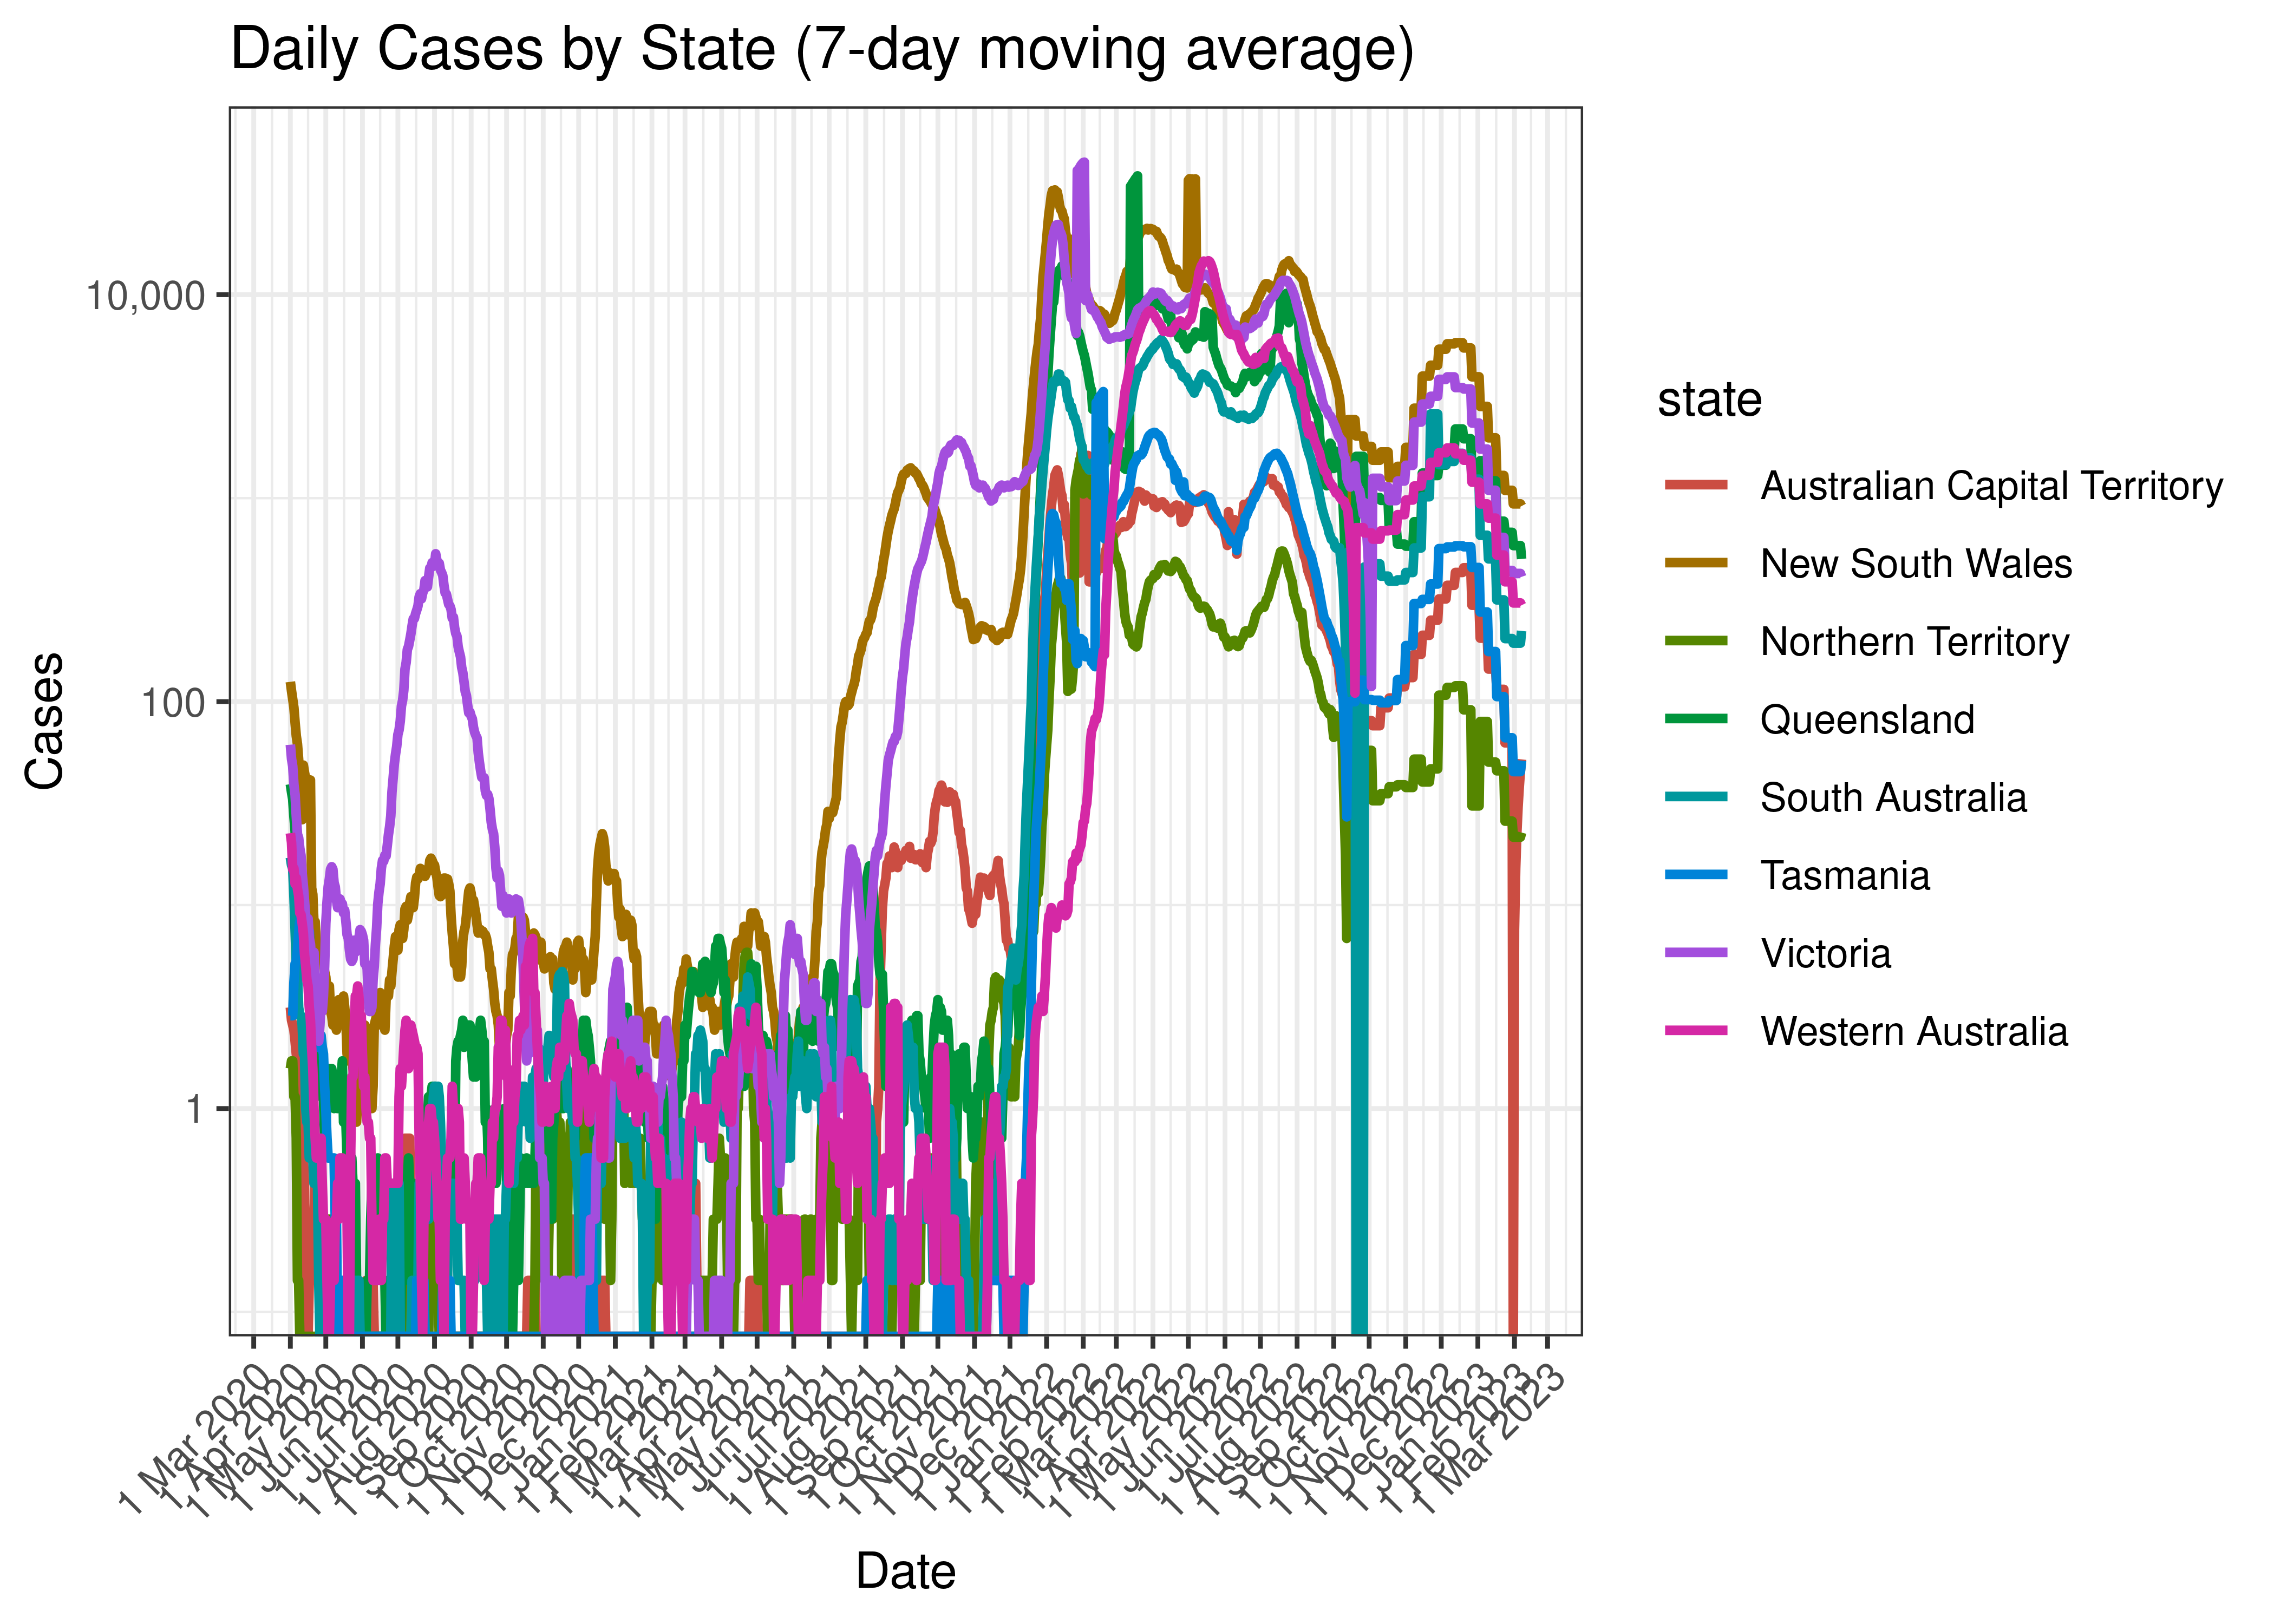
Daily Cases by State (7-day moving average)
Below the above chart is repeated for the last 30-days:
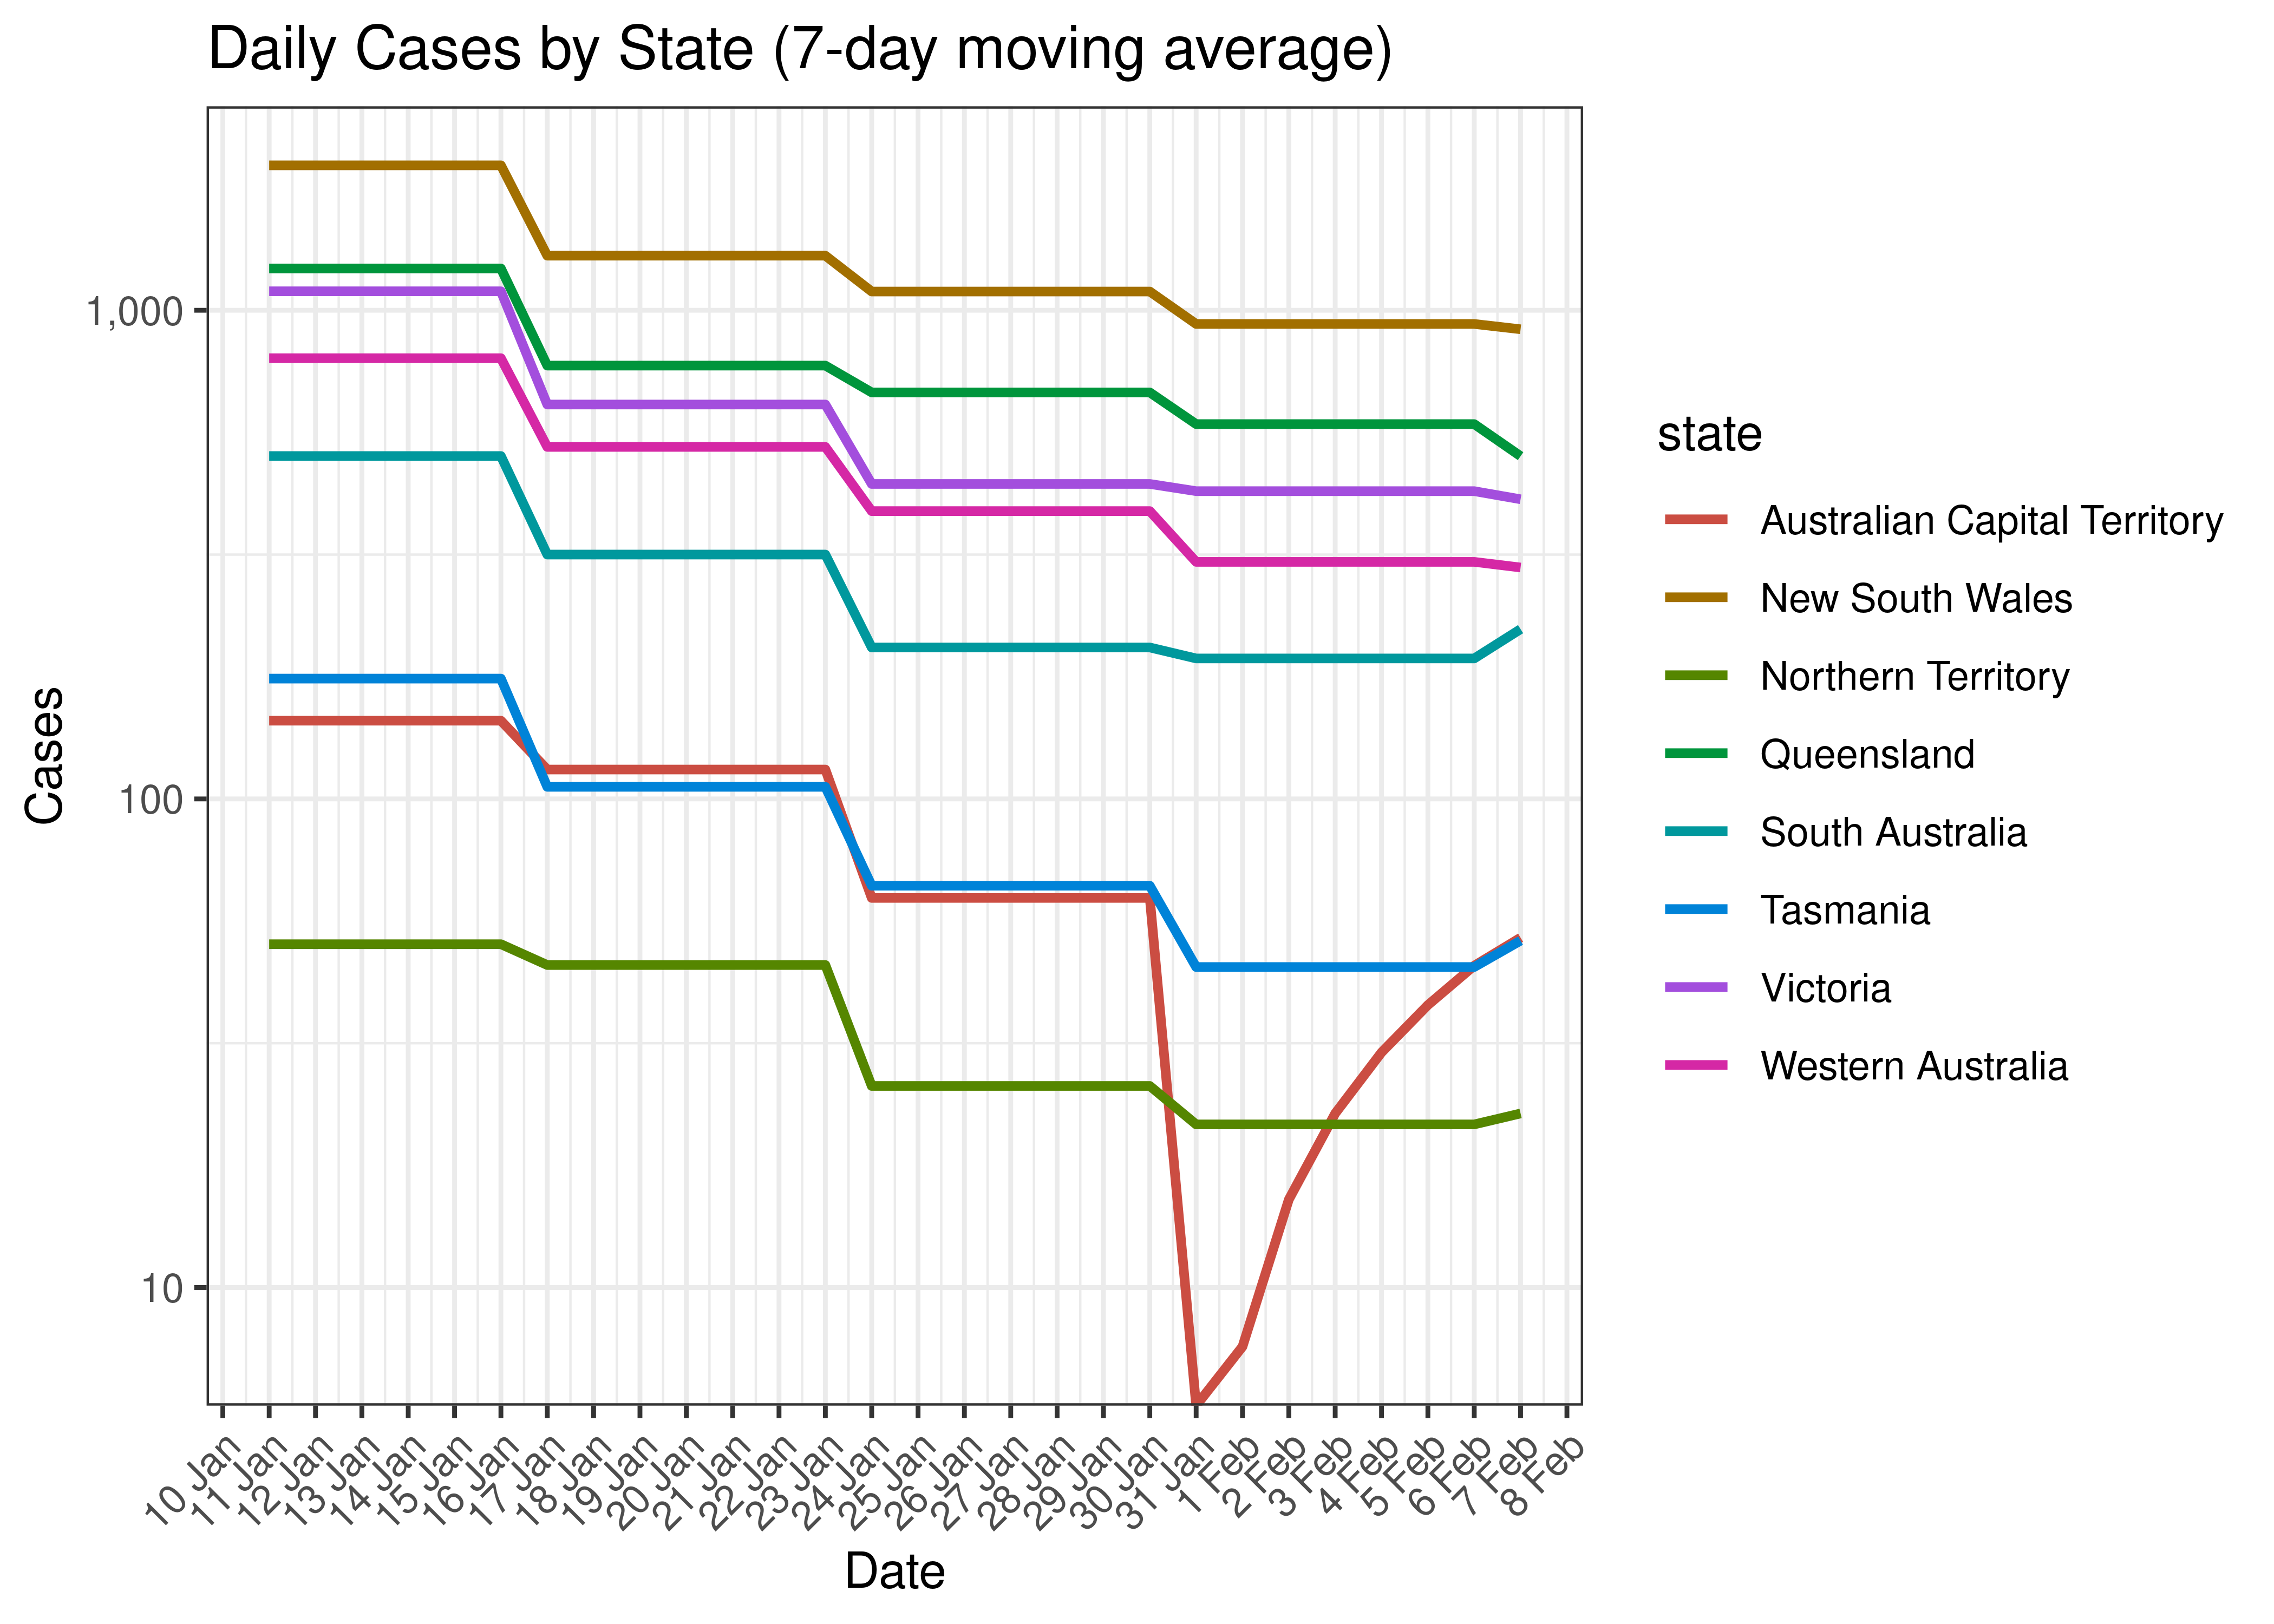
Daily Cases for Last 30-days by State (7-day moving average)
5.1.3 Hospitlisation
Counts of those in hospital are tabulated by report date below. A centred 7-day moving average is also shown. The peak daily admissions in previous waves (as measured by the moving average) is also shown.
| Date | In Hospital | 7-day Moving Average | Comment |
|---|---|---|---|
| 2020-04-04 | 460 | 415 | Wave 1 Peak |
| 2020-08-16 | 680 | 683 | Wave 2 Peak |
| 2021-09-25 | 1,529 | 1,524 | Wave 3 Peak |
| 2022-07-24 | 5,362 | 5,378 | Wave 4 Peak (to date) |
| 2023-02-03 | 0 | 0 | |
| 2023-02-04 | 0 | 0 | |
| 2023-02-05 | 0 | 0 | |
| 2023-02-06 | 0 | 0 | |
| 2023-02-07 | 0 | NA | |
| 2023-02-08 | 0 | NA | |
| 2023-02-09 | 0 | NA | |
| 2023-02-10 | NA | NA |
The above are based on the following dates:
- Wave 1 started on 2020-01-01.
- Wave 2 started on 2020-06-01.
- Wave 3 started on 2021-06-01.
- Wave 4 started on 2021-12-01.
Below a 7-day moving average of daily hospital counts is plotted by on a log scale since start of the epidemic. Note admissions are plotted by date.
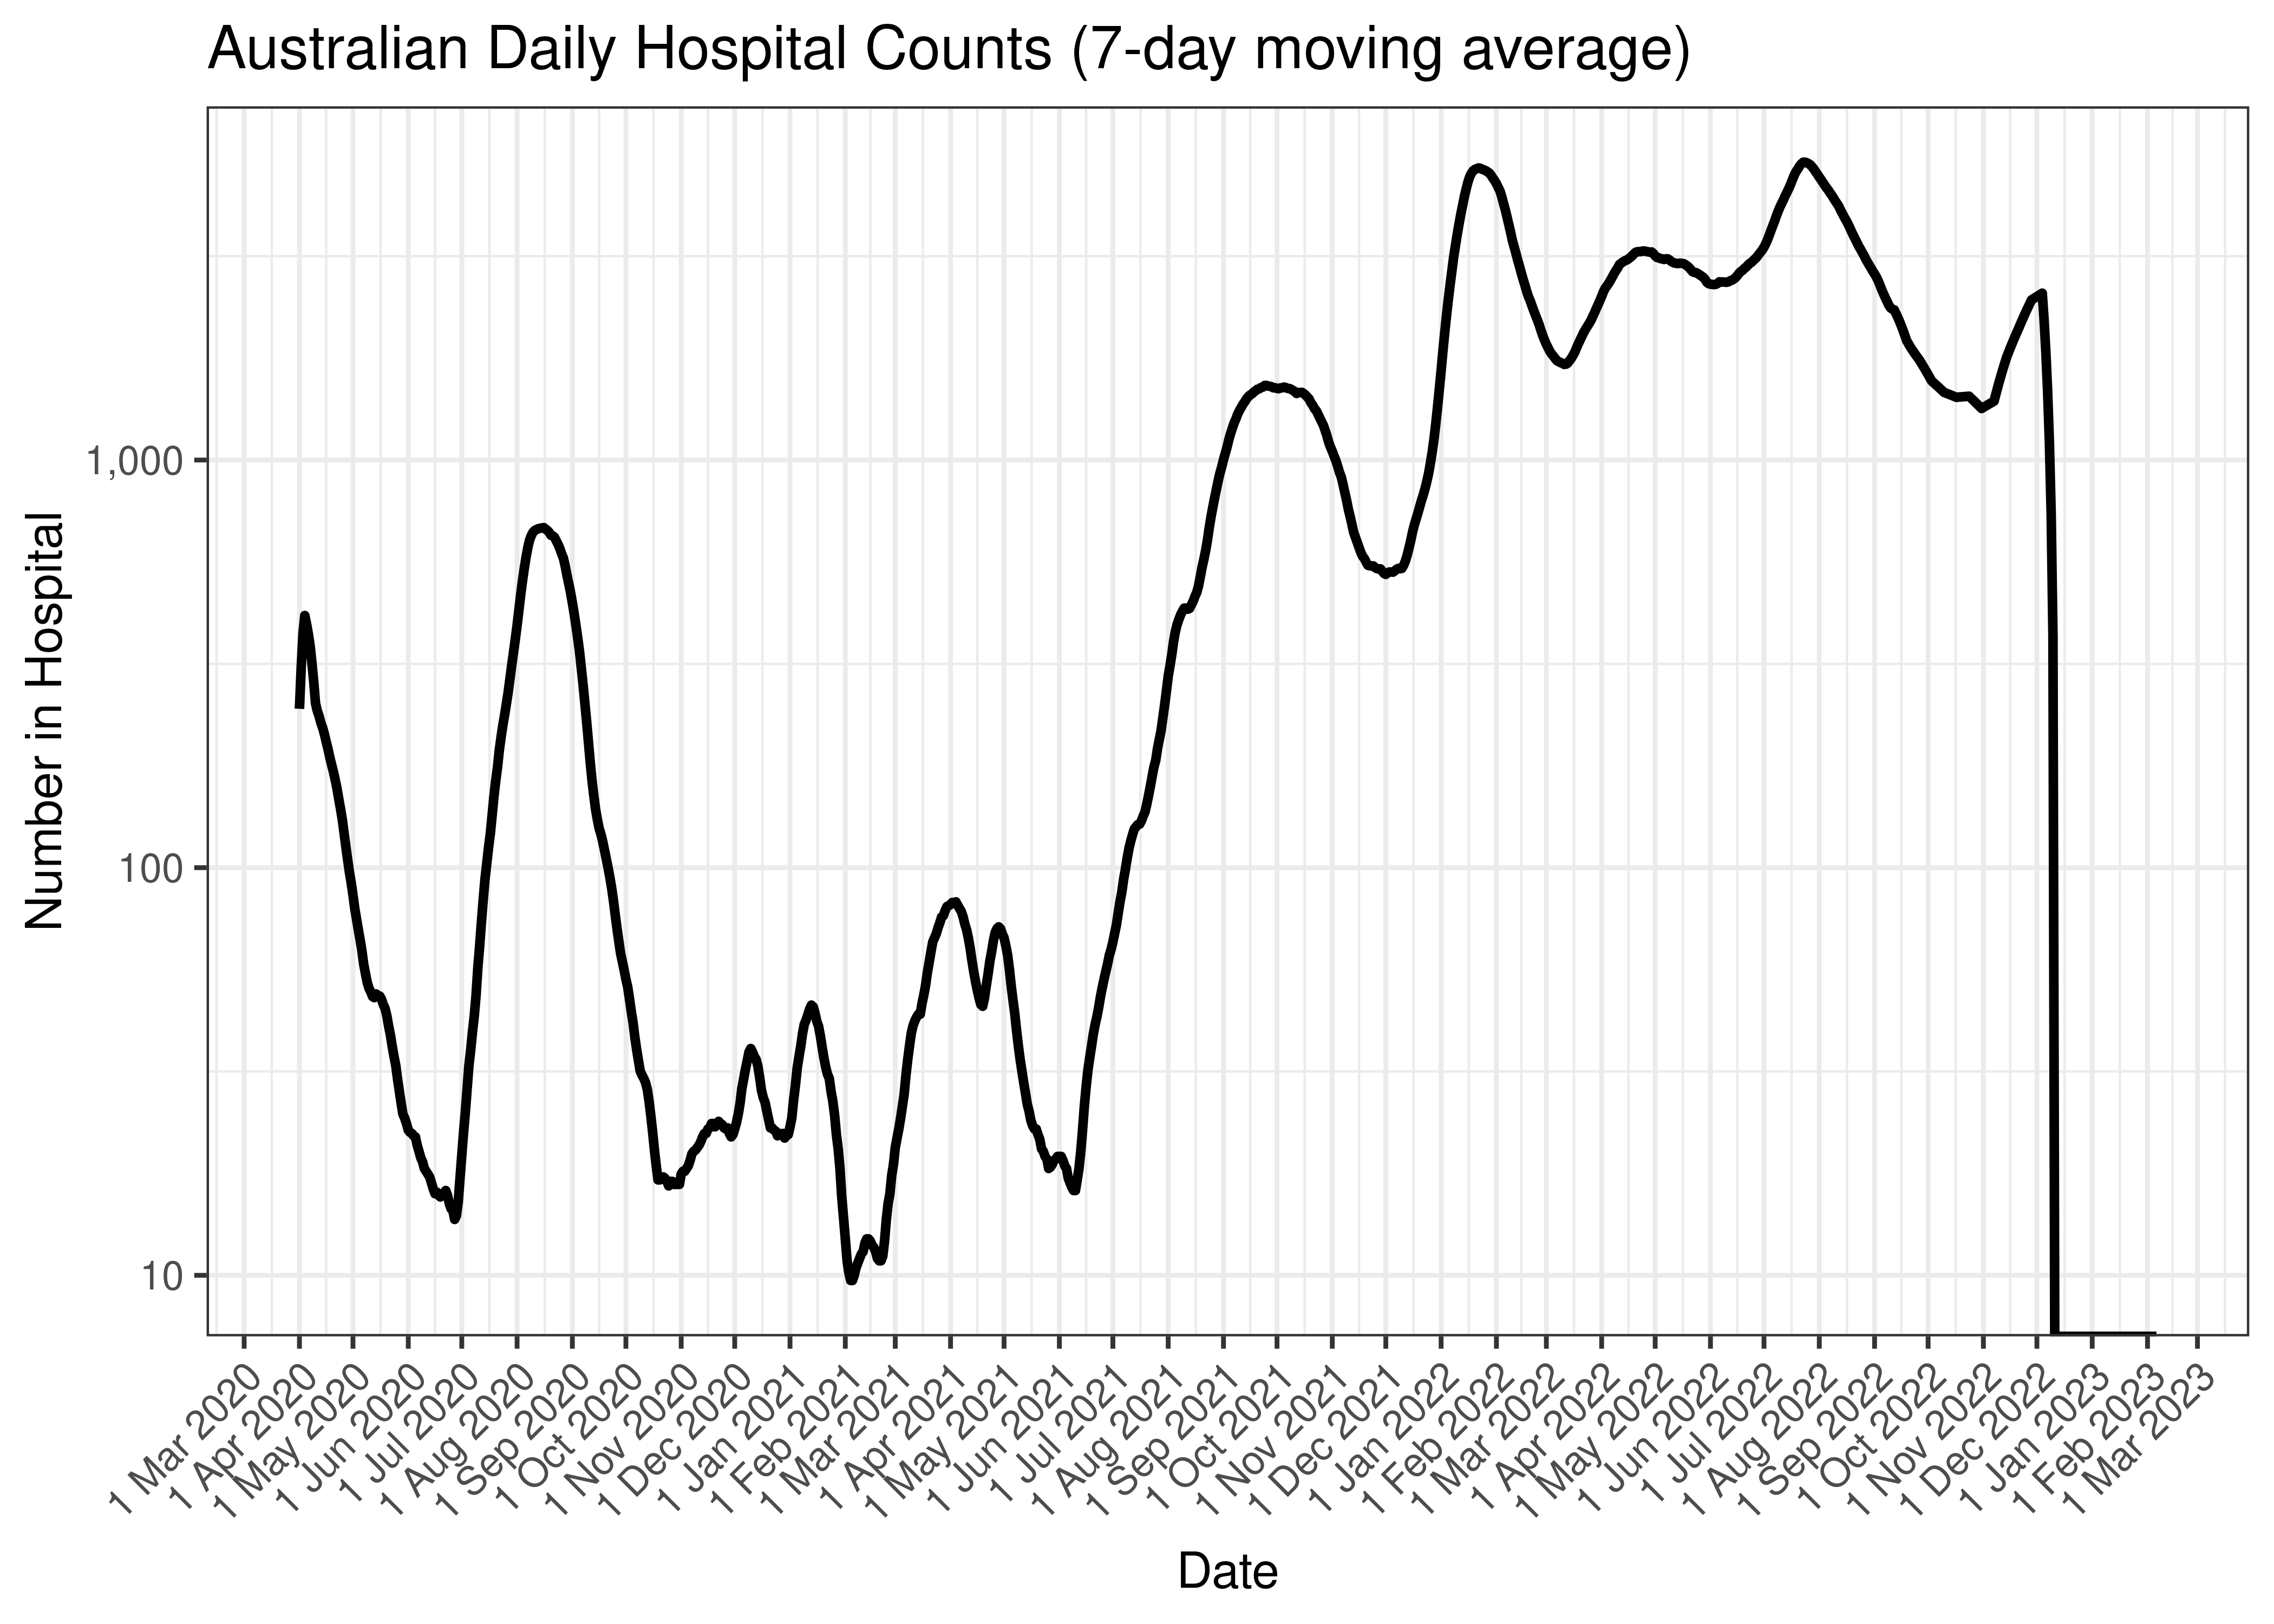
Australian Daily Hospital Counts (7-day moving average)
Below the above chart is repeated for the last 30-days:
Australian Daily Hospital Counts for Last 30-days (7-day moving average)
Below a 7-day moving average daily admissions are plotted by state on a log scale since start of the epidemic:
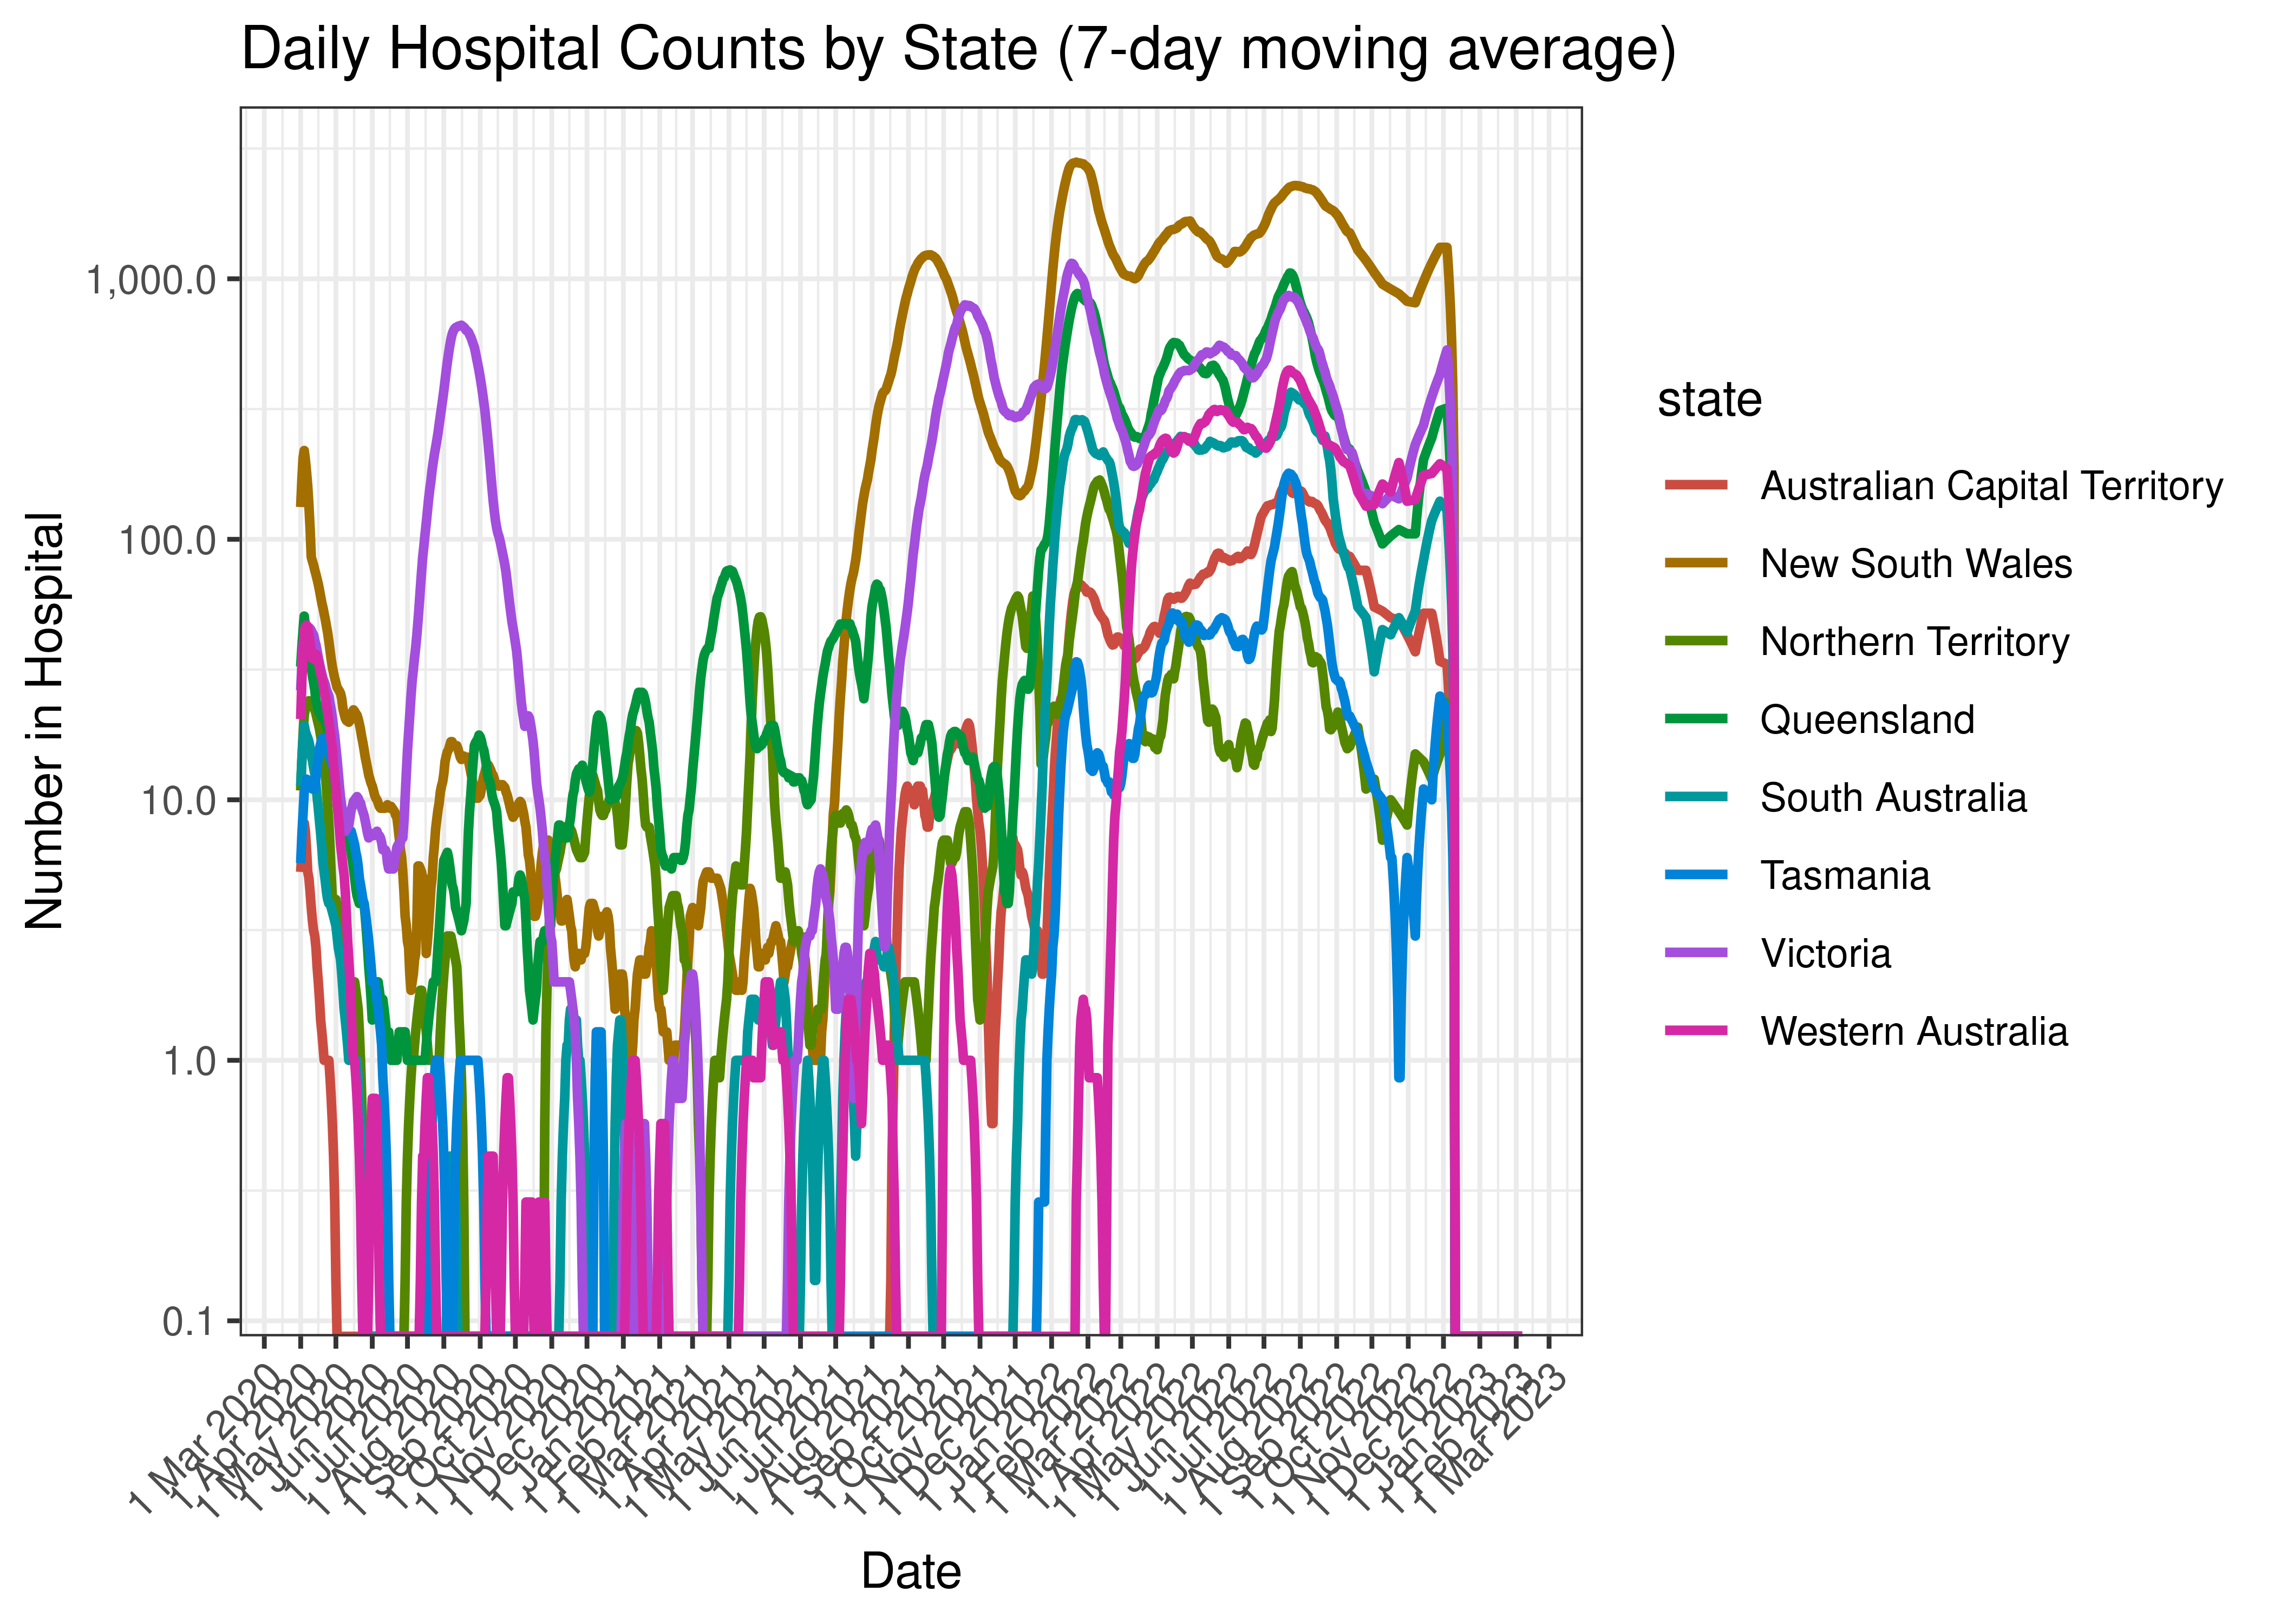
Daily Hospital Counts by State (7-day moving average)
Below the above chart is repeated for the last 30-days:
Daily Hospital Counts for Last 30-days by State (7-day moving average)
5.1.4 ICU
Counts of those in ICU are tabulated by report date below. A centred 7-day moving average is also shown. The peak daily admissions in previous waves (as measured by the moving average) is also shown.
| Date | In ICU | 7-day Moving Average | Comment |
|---|---|---|---|
| 2020-04-05 | 96 | 90 | Wave 1 Peak |
| 2020-04-06 | 96 | 90 | Wave 1 Peak |
| 2020-08-08 | 53 | 53 | Wave 2 Peak |
| 2020-08-09 | 51 | 53 | Wave 2 Peak |
| 2021-10-15 | 311 | 304 | Wave 3 Peak |
| 2022-01-19 | 425 | 415 | Wave 4 Peak (to date) |
| 2022-01-20 | 418 | 415 | Wave 4 Peak (to date) |
| 2023-02-03 | 0 | 0 | |
| 2023-02-04 | 0 | 0 | |
| 2023-02-05 | 0 | 0 | |
| 2023-02-06 | 0 | 0 | |
| 2023-02-07 | 0 | NA | |
| 2023-02-08 | 0 | NA | |
| 2023-02-09 | 0 | NA | |
| 2023-02-10 | NA | NA |
The above are based on the following dates:
- Wave 1 started on 2020-01-01.
- Wave 2 started on 2020-06-01.
- Wave 3 started on 2021-06-01.
- Wave 4 started on 2021-12-01.
Below a 7-day moving average of daily ICU counts is plotted by on a log scale since start of the epidemic. Note admissions are plotted by date.
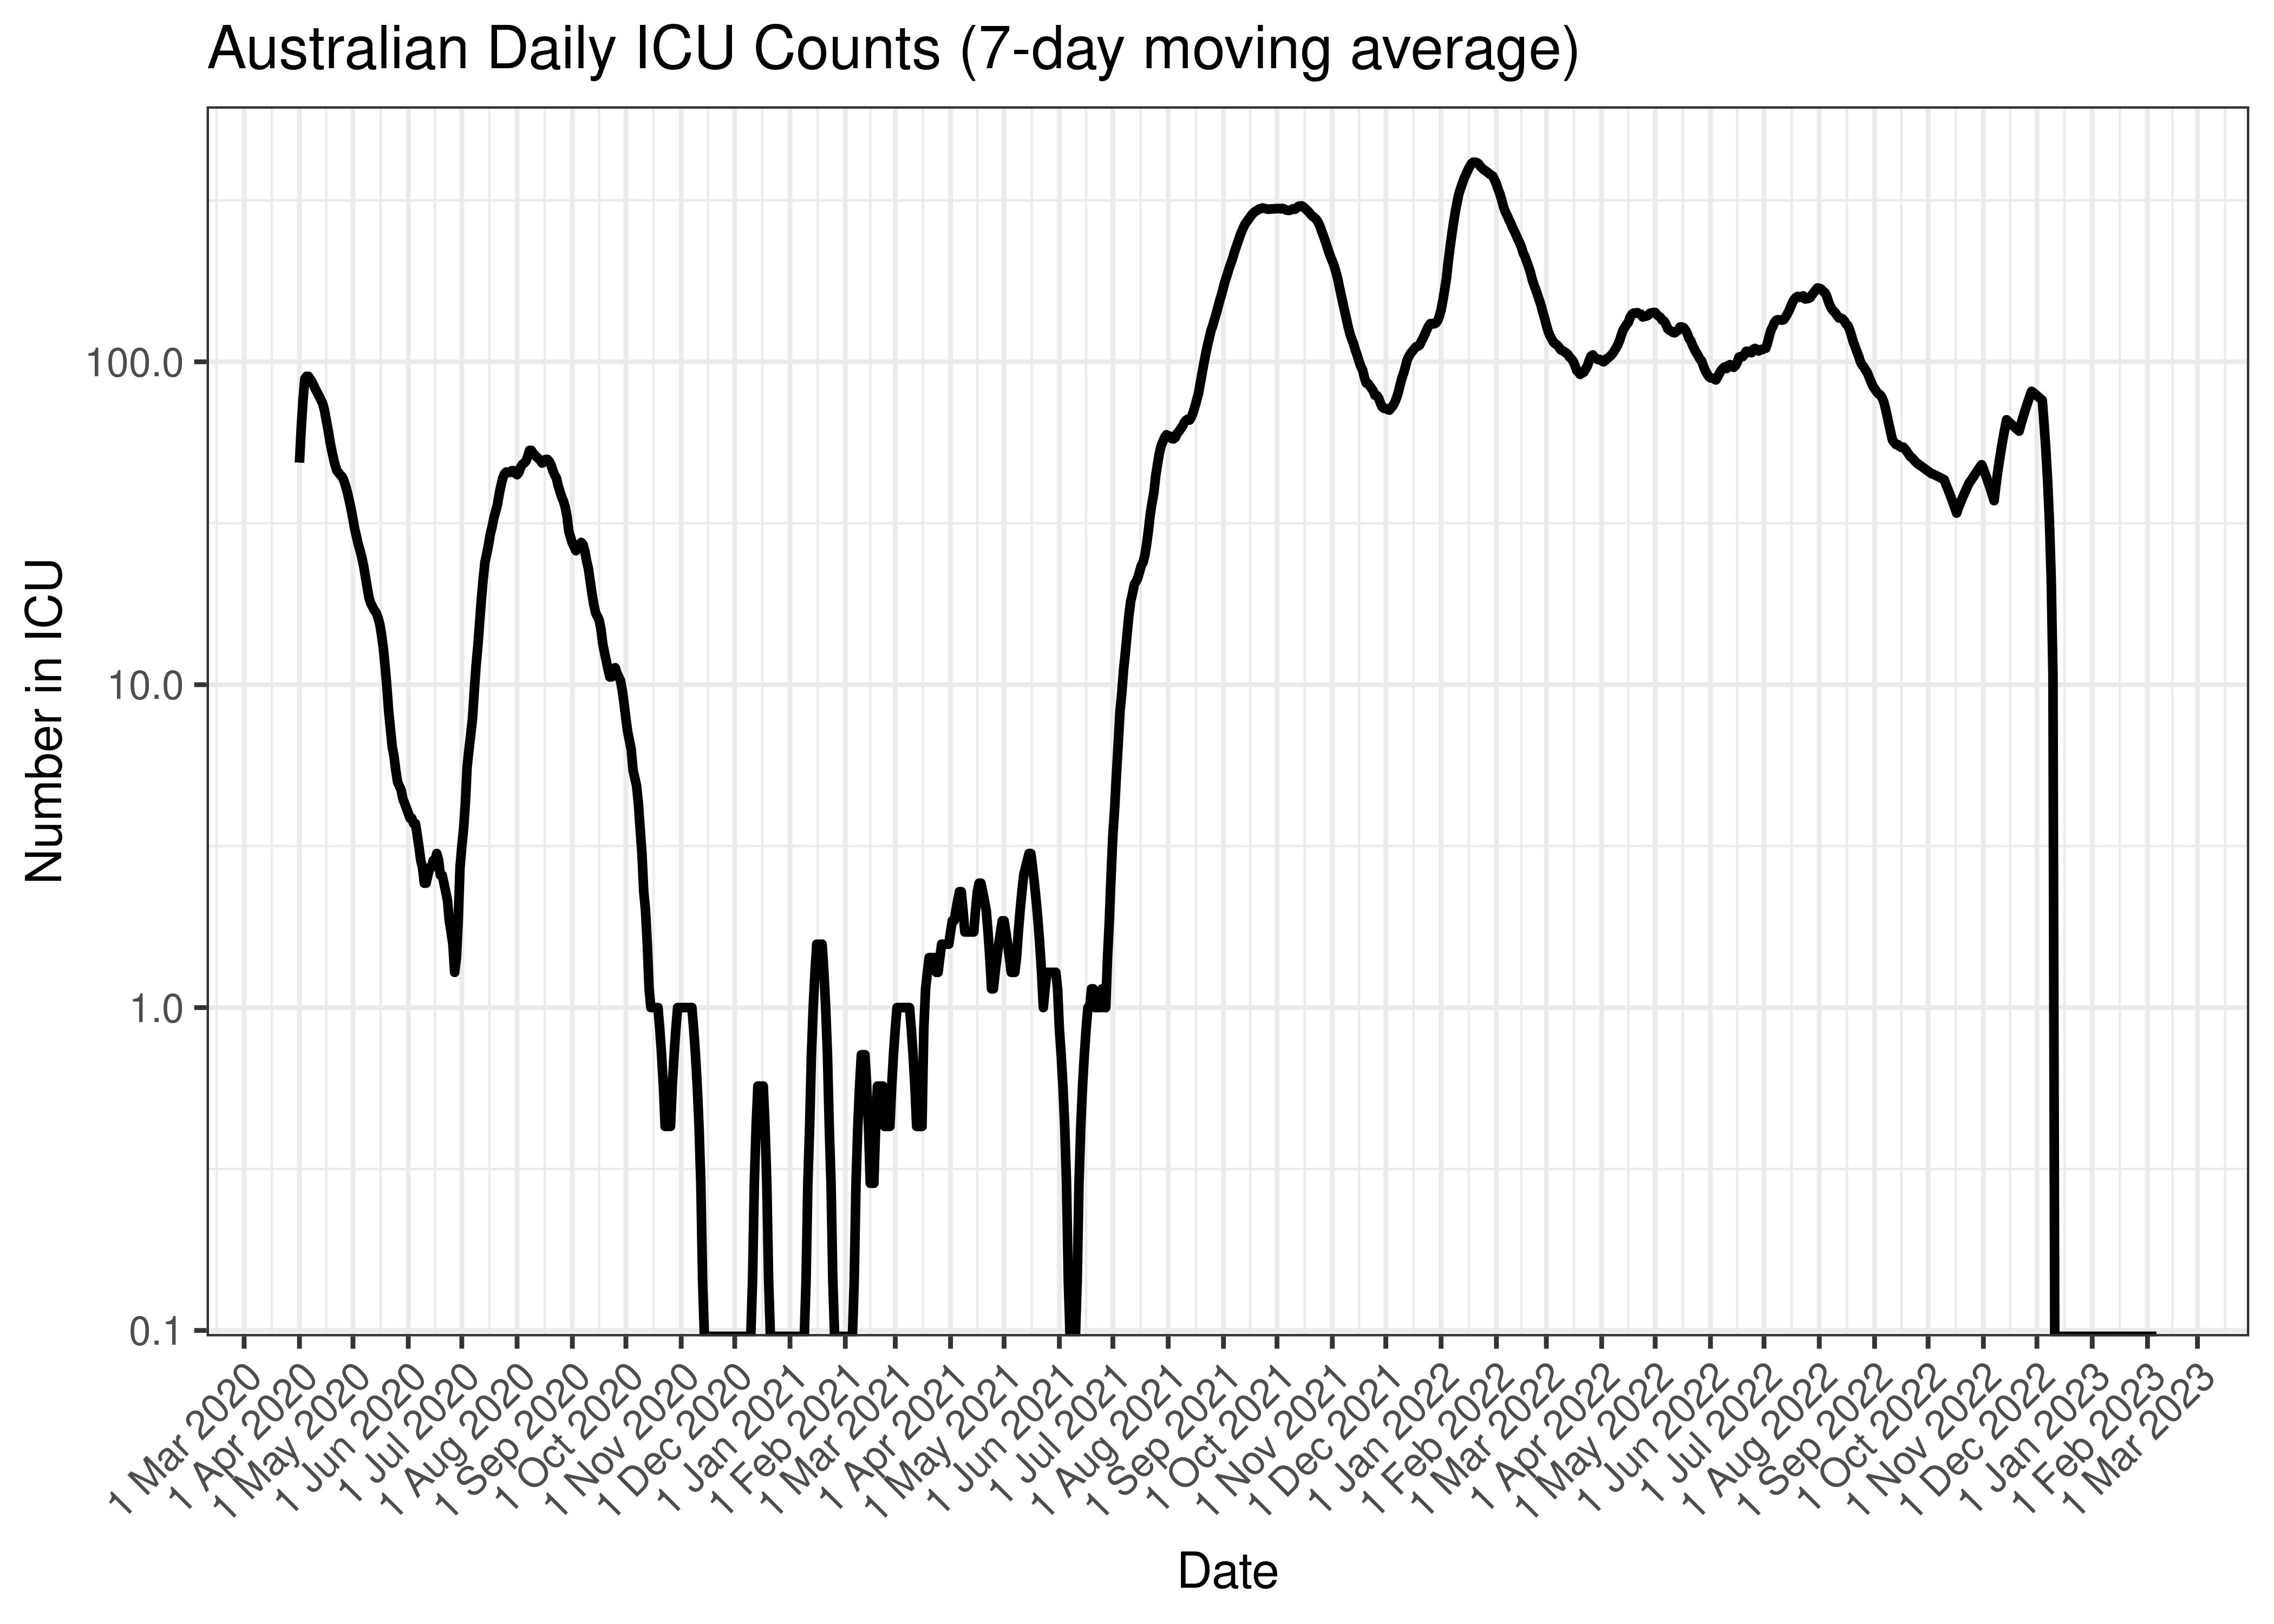
Australian Daily ICU Counts (7-day moving average)
Below the above chart is repeated for the last 30-days:
Australian Daily ICU Counts for Last 30-days (7-day moving average)
Below a 7-day moving average daily admissions are plotted by state on a log scale since start of the epidemic:
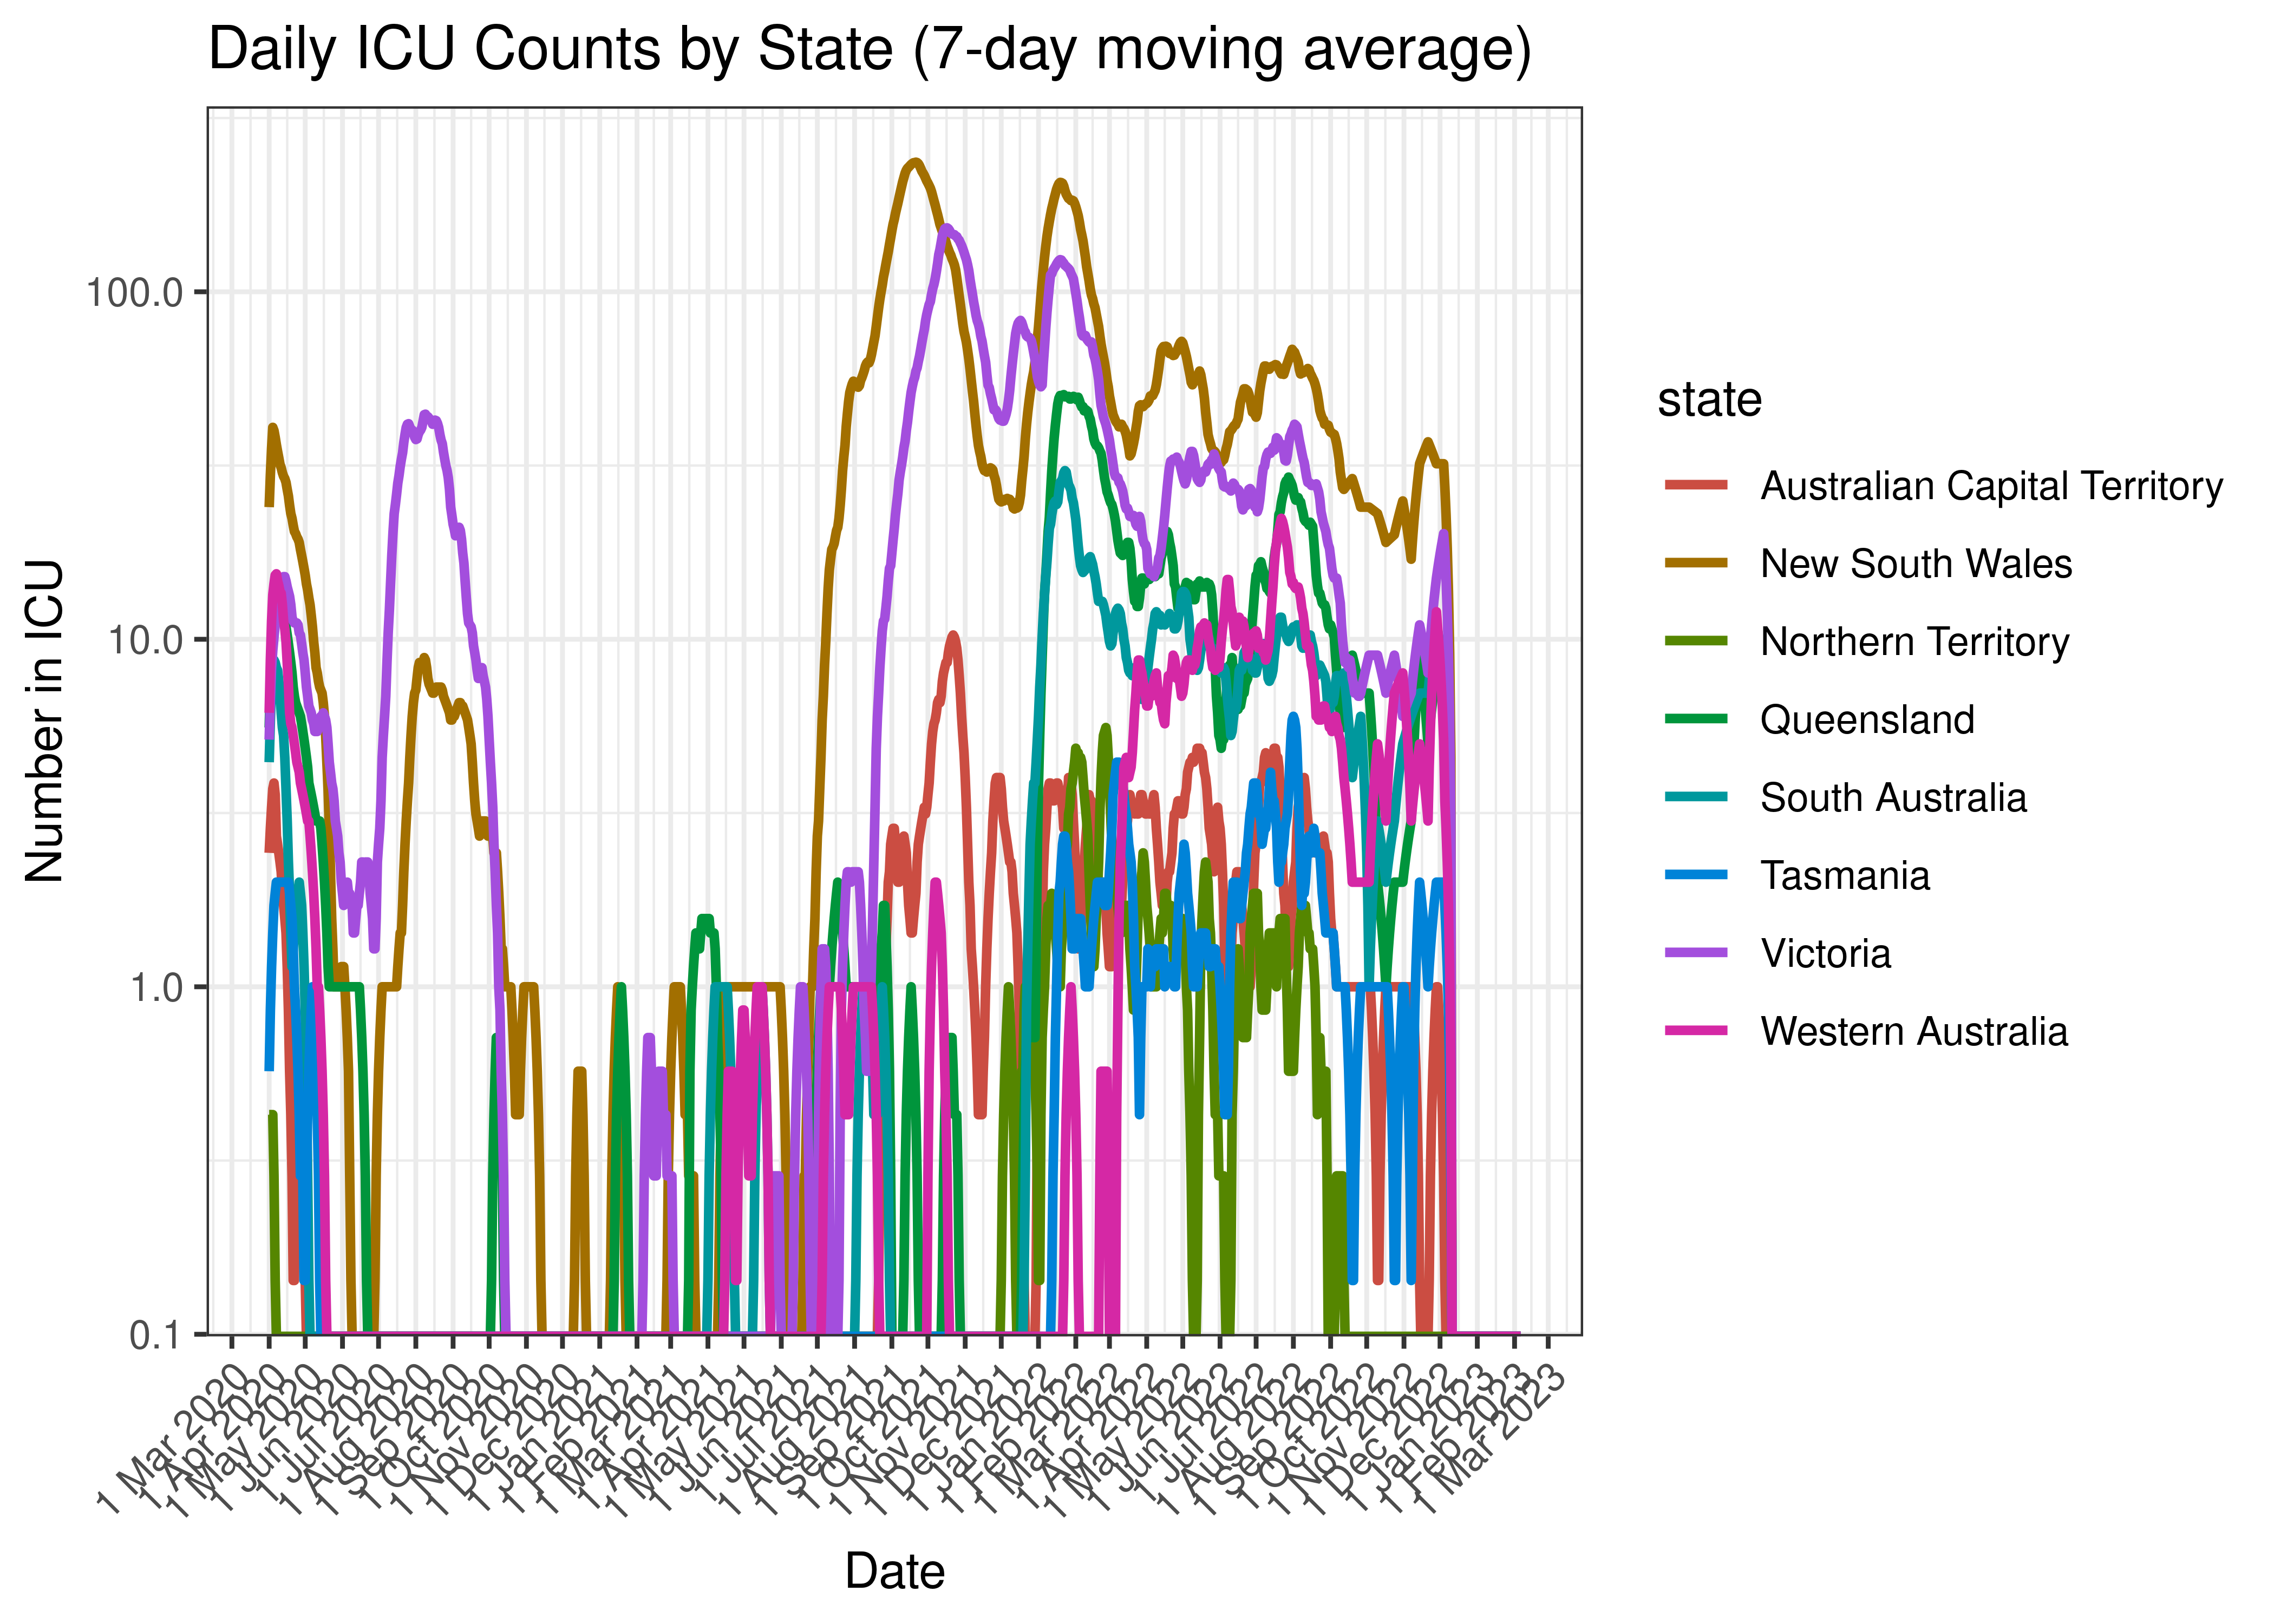
Daily ICU Counts by State (7-day moving average)
Below the above chart is repeated for the last 30-days:
Daily ICU Counts for Last 30-days by State (7-day moving average)
5.1.5 Ventilator
Counts of those on ventilators are tabulated by report date below. A centred 7-day moving average is also shown. The peak daily admissions in previous waves (as measured by the moving average) is also shown.
| Date | On Ventilators | 7-day Moving Average | Comment |
|---|---|---|---|
| 2020-04-13 | 46 | 40 | Wave 1 Peak |
| 2020-04-14 | 44 | 40 | Wave 1 Peak |
| 2020-08-08 | 35 | 34 | Wave 2 Peak |
| 2021-10-15 | 174 | 176 | Wave 3 Peak |
| 2022-01-23 | 138 | 136 | Wave 4 Peak (to date) |
| 2023-02-03 | 0 | 0 | |
| 2023-02-04 | 0 | 0 | |
| 2023-02-05 | 0 | 0 | |
| 2023-02-06 | 0 | 0 | |
| 2023-02-07 | 0 | NA | |
| 2023-02-08 | 0 | NA | |
| 2023-02-09 | 0 | NA | |
| 2023-02-10 | NA | NA |
The above are based on the following dates:
- Wave 1 started on 2020-01-01.
- Wave 2 started on 2020-06-01.
- Wave 3 started on 2021-06-01.
- Wave 4 started on 2021-12-01.
Below a 7-day moving average of daily ventilator counts is plotted by on a log scale since start of the epidemic. Note admissions are plotted by date.
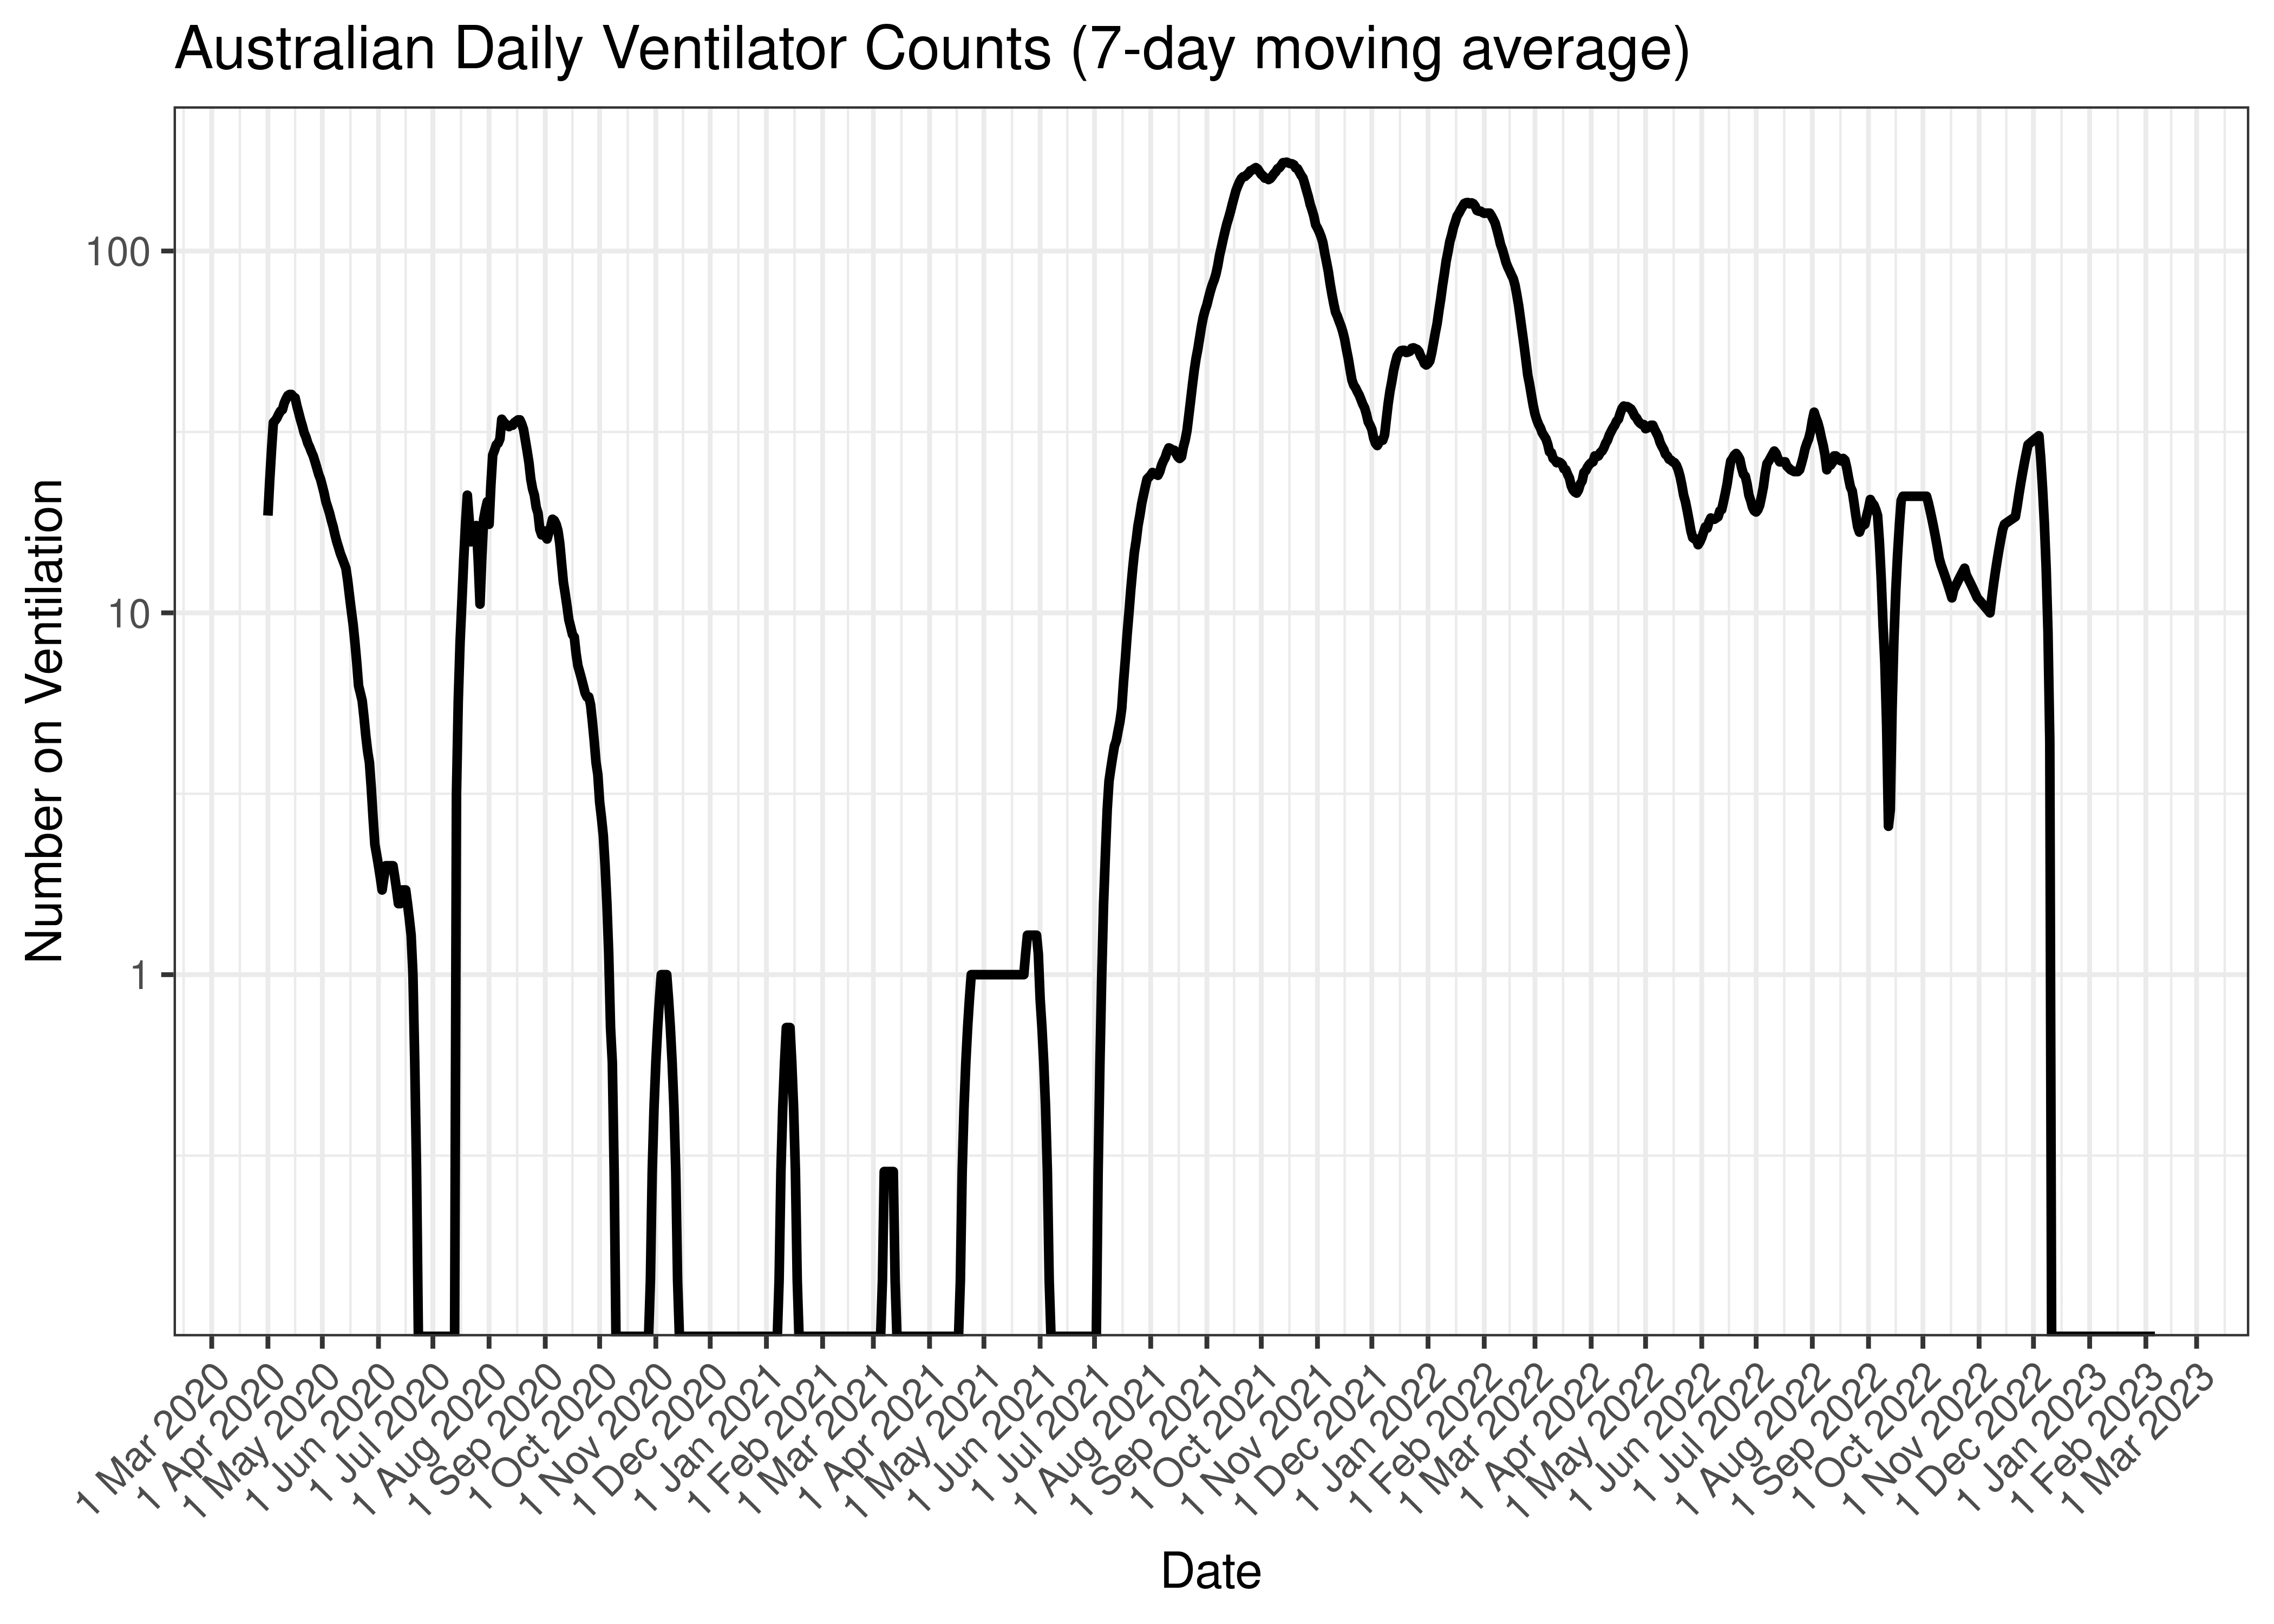
Australian Daily Ventilator Counts (7-day moving average)
Below the above chart is repeated for the last 30-days:
Australian Daily Ventilator Counts for Last 30-days (7-day moving average)
Below a 7-day moving average daily admissions are plotted by state on a log scale since start of the epidemic:
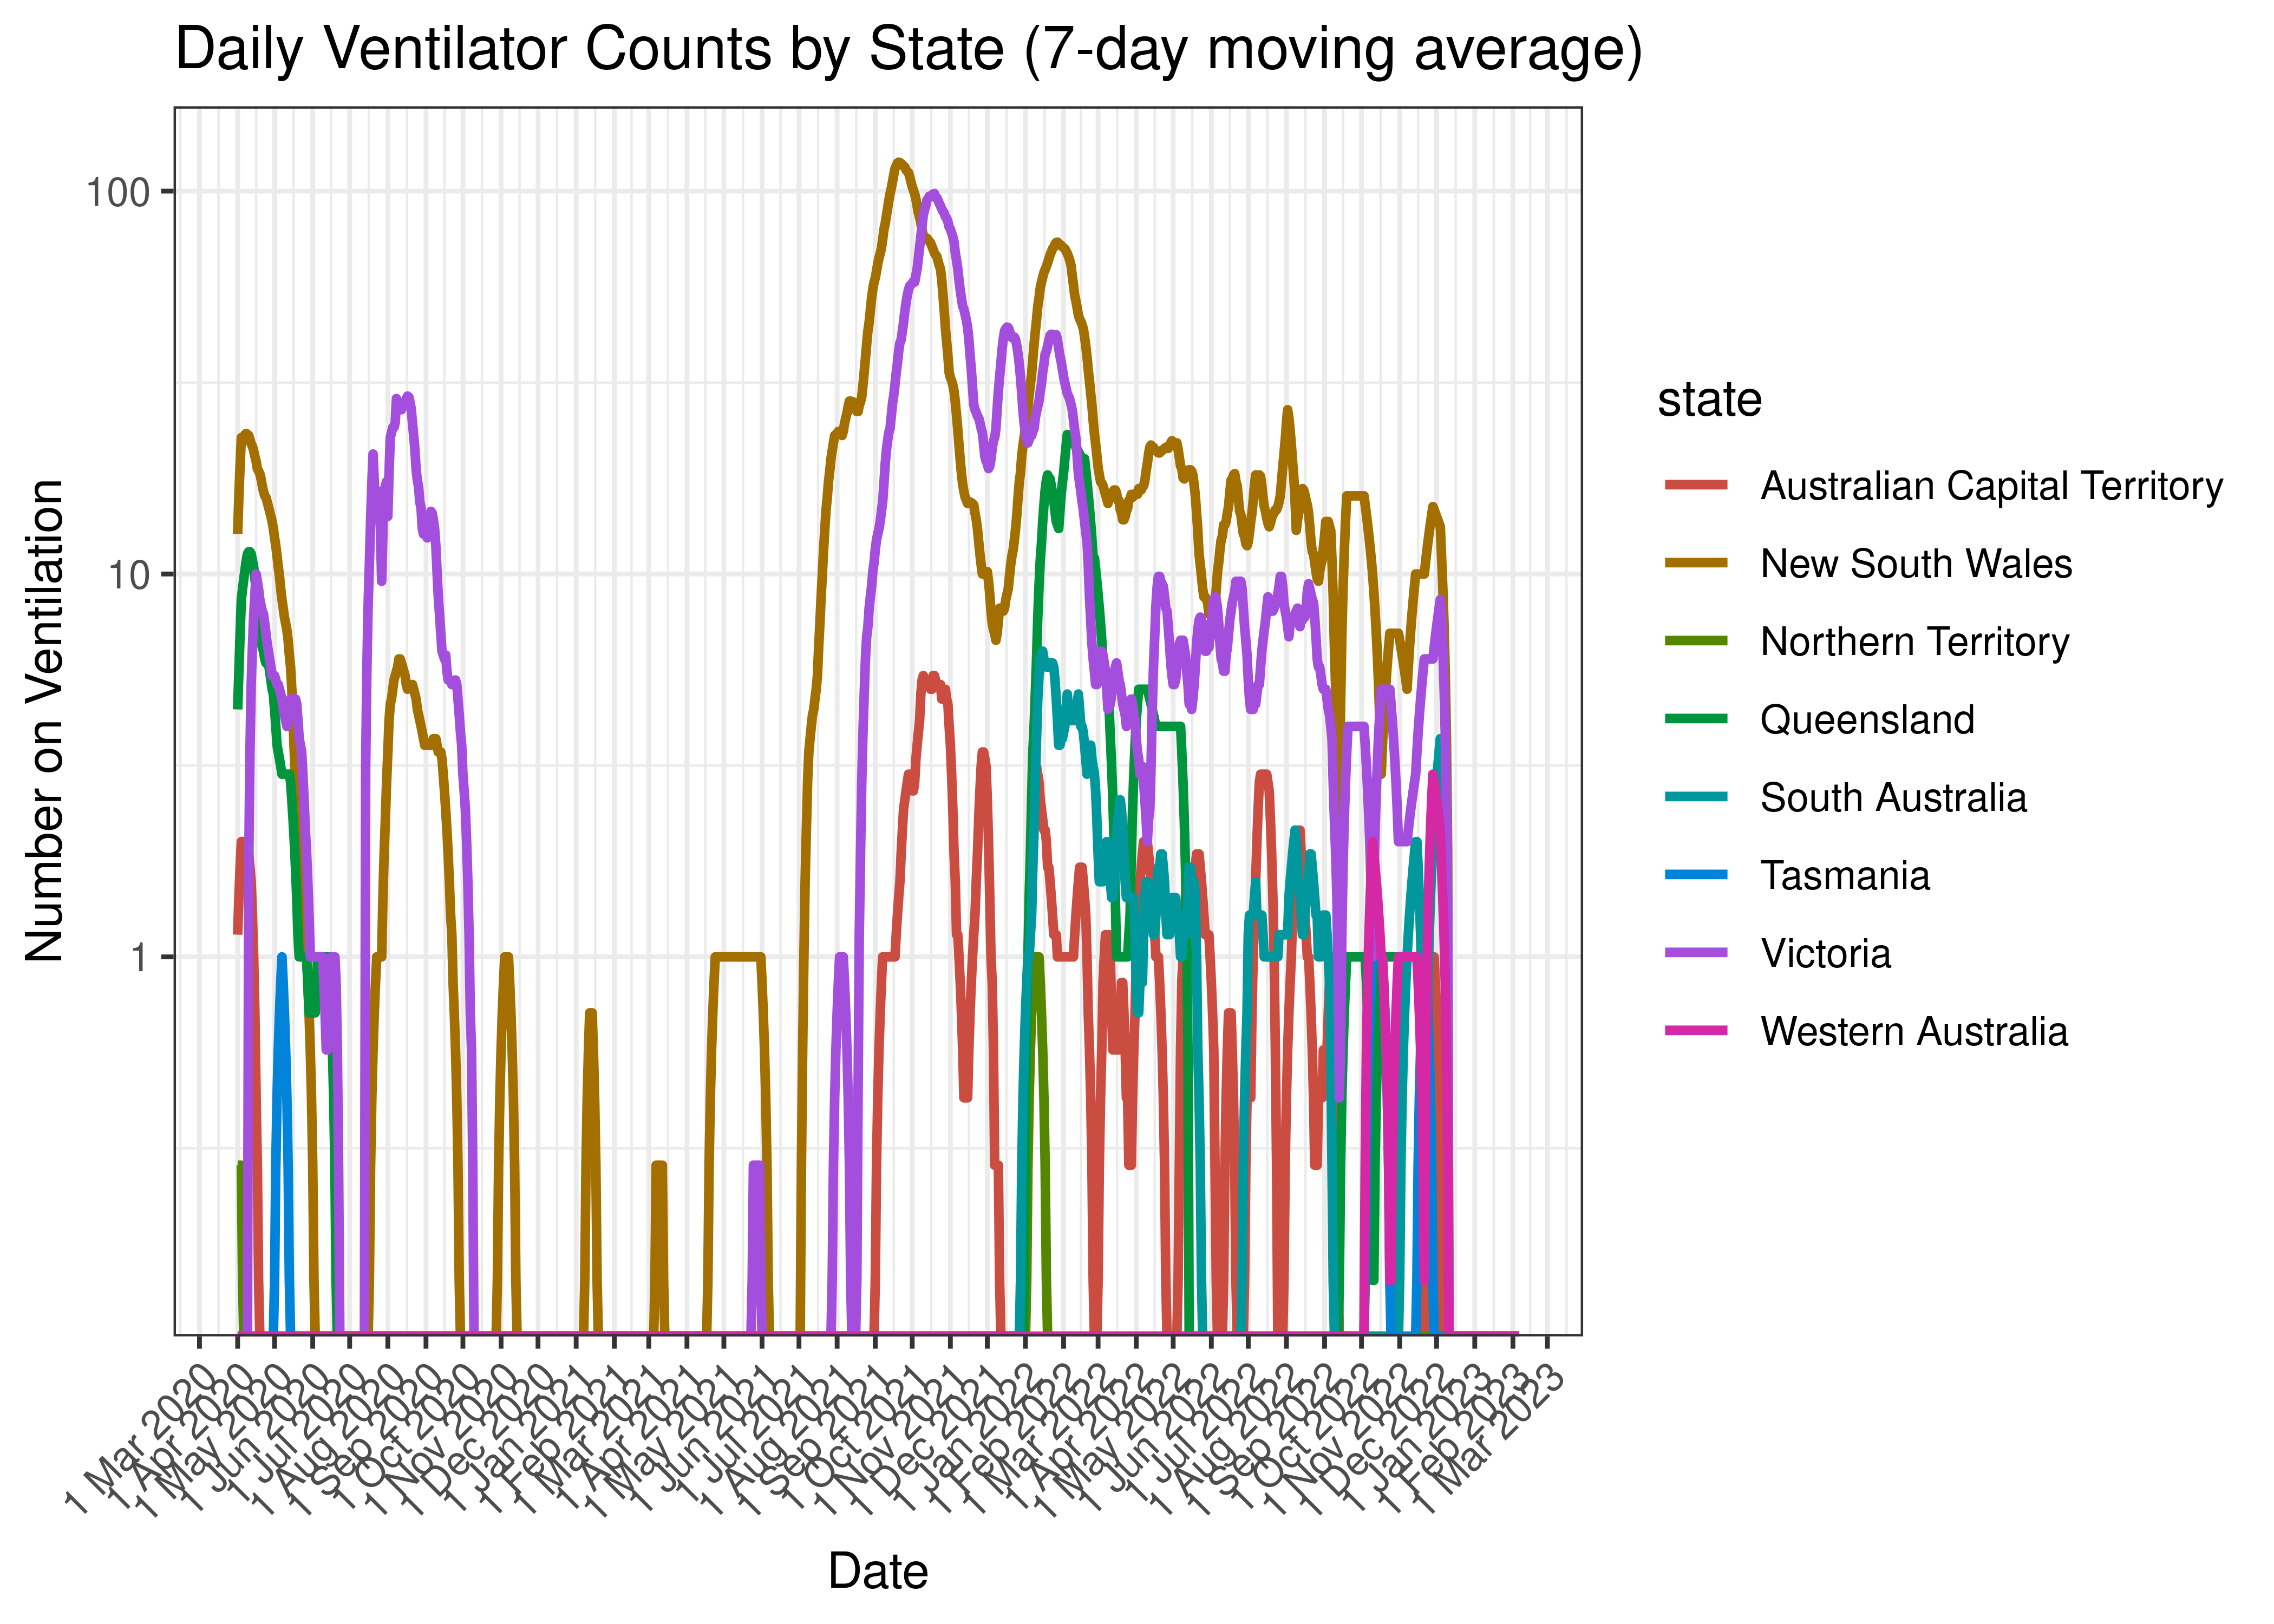
Daily Ventilator Counts by State (7-day moving average)
Below the above chart is repeated for the last 30-days:

Daily Ventilator Counts for Last 30-days by State (7-day moving average)
5.1.6 Deaths
Deaths are tabulated by report date below. A centred 7-day moving average is also shown. The peak daily deaths in previous waves (as measured by the moving average) is also shown.
| Date | Deaths | 7-day Moving Average | Comment |
|---|---|---|---|
| 2020-04-05 | 5 | 4 | Wave 1 Peak |
| 2020-09-01 | 5 | 22 | Wave 2 Peak |
| 2021-10-20 | 19 | 15 | Wave 3 Peak |
| 2022-07-28 | 125 | 97 | Wave 4 Peak (to date) |
| 2023-02-03 | 226 | 32 | |
| 2023-02-04 | 0 | 32 | |
| 2023-02-05 | 0 | 32 | |
| 2023-02-06 | 0 | 32 | |
| 2023-02-07 | 0 | 35 | |
| 2023-02-08 | 0 | NA | |
| 2023-02-09 | 0 | NA | |
| 2023-02-10 | 248 | NA |
The above are based on the following dates:
- Wave 1 started on 2020-01-01.
- Wave 2 started on 2020-06-01.
- Wave 3 started on 2021-06-01.
- Wave 4 started on 2021-12-01.
Below a 7-day moving average of daily deaths is plotted by on a log scale since start of the epidemic.
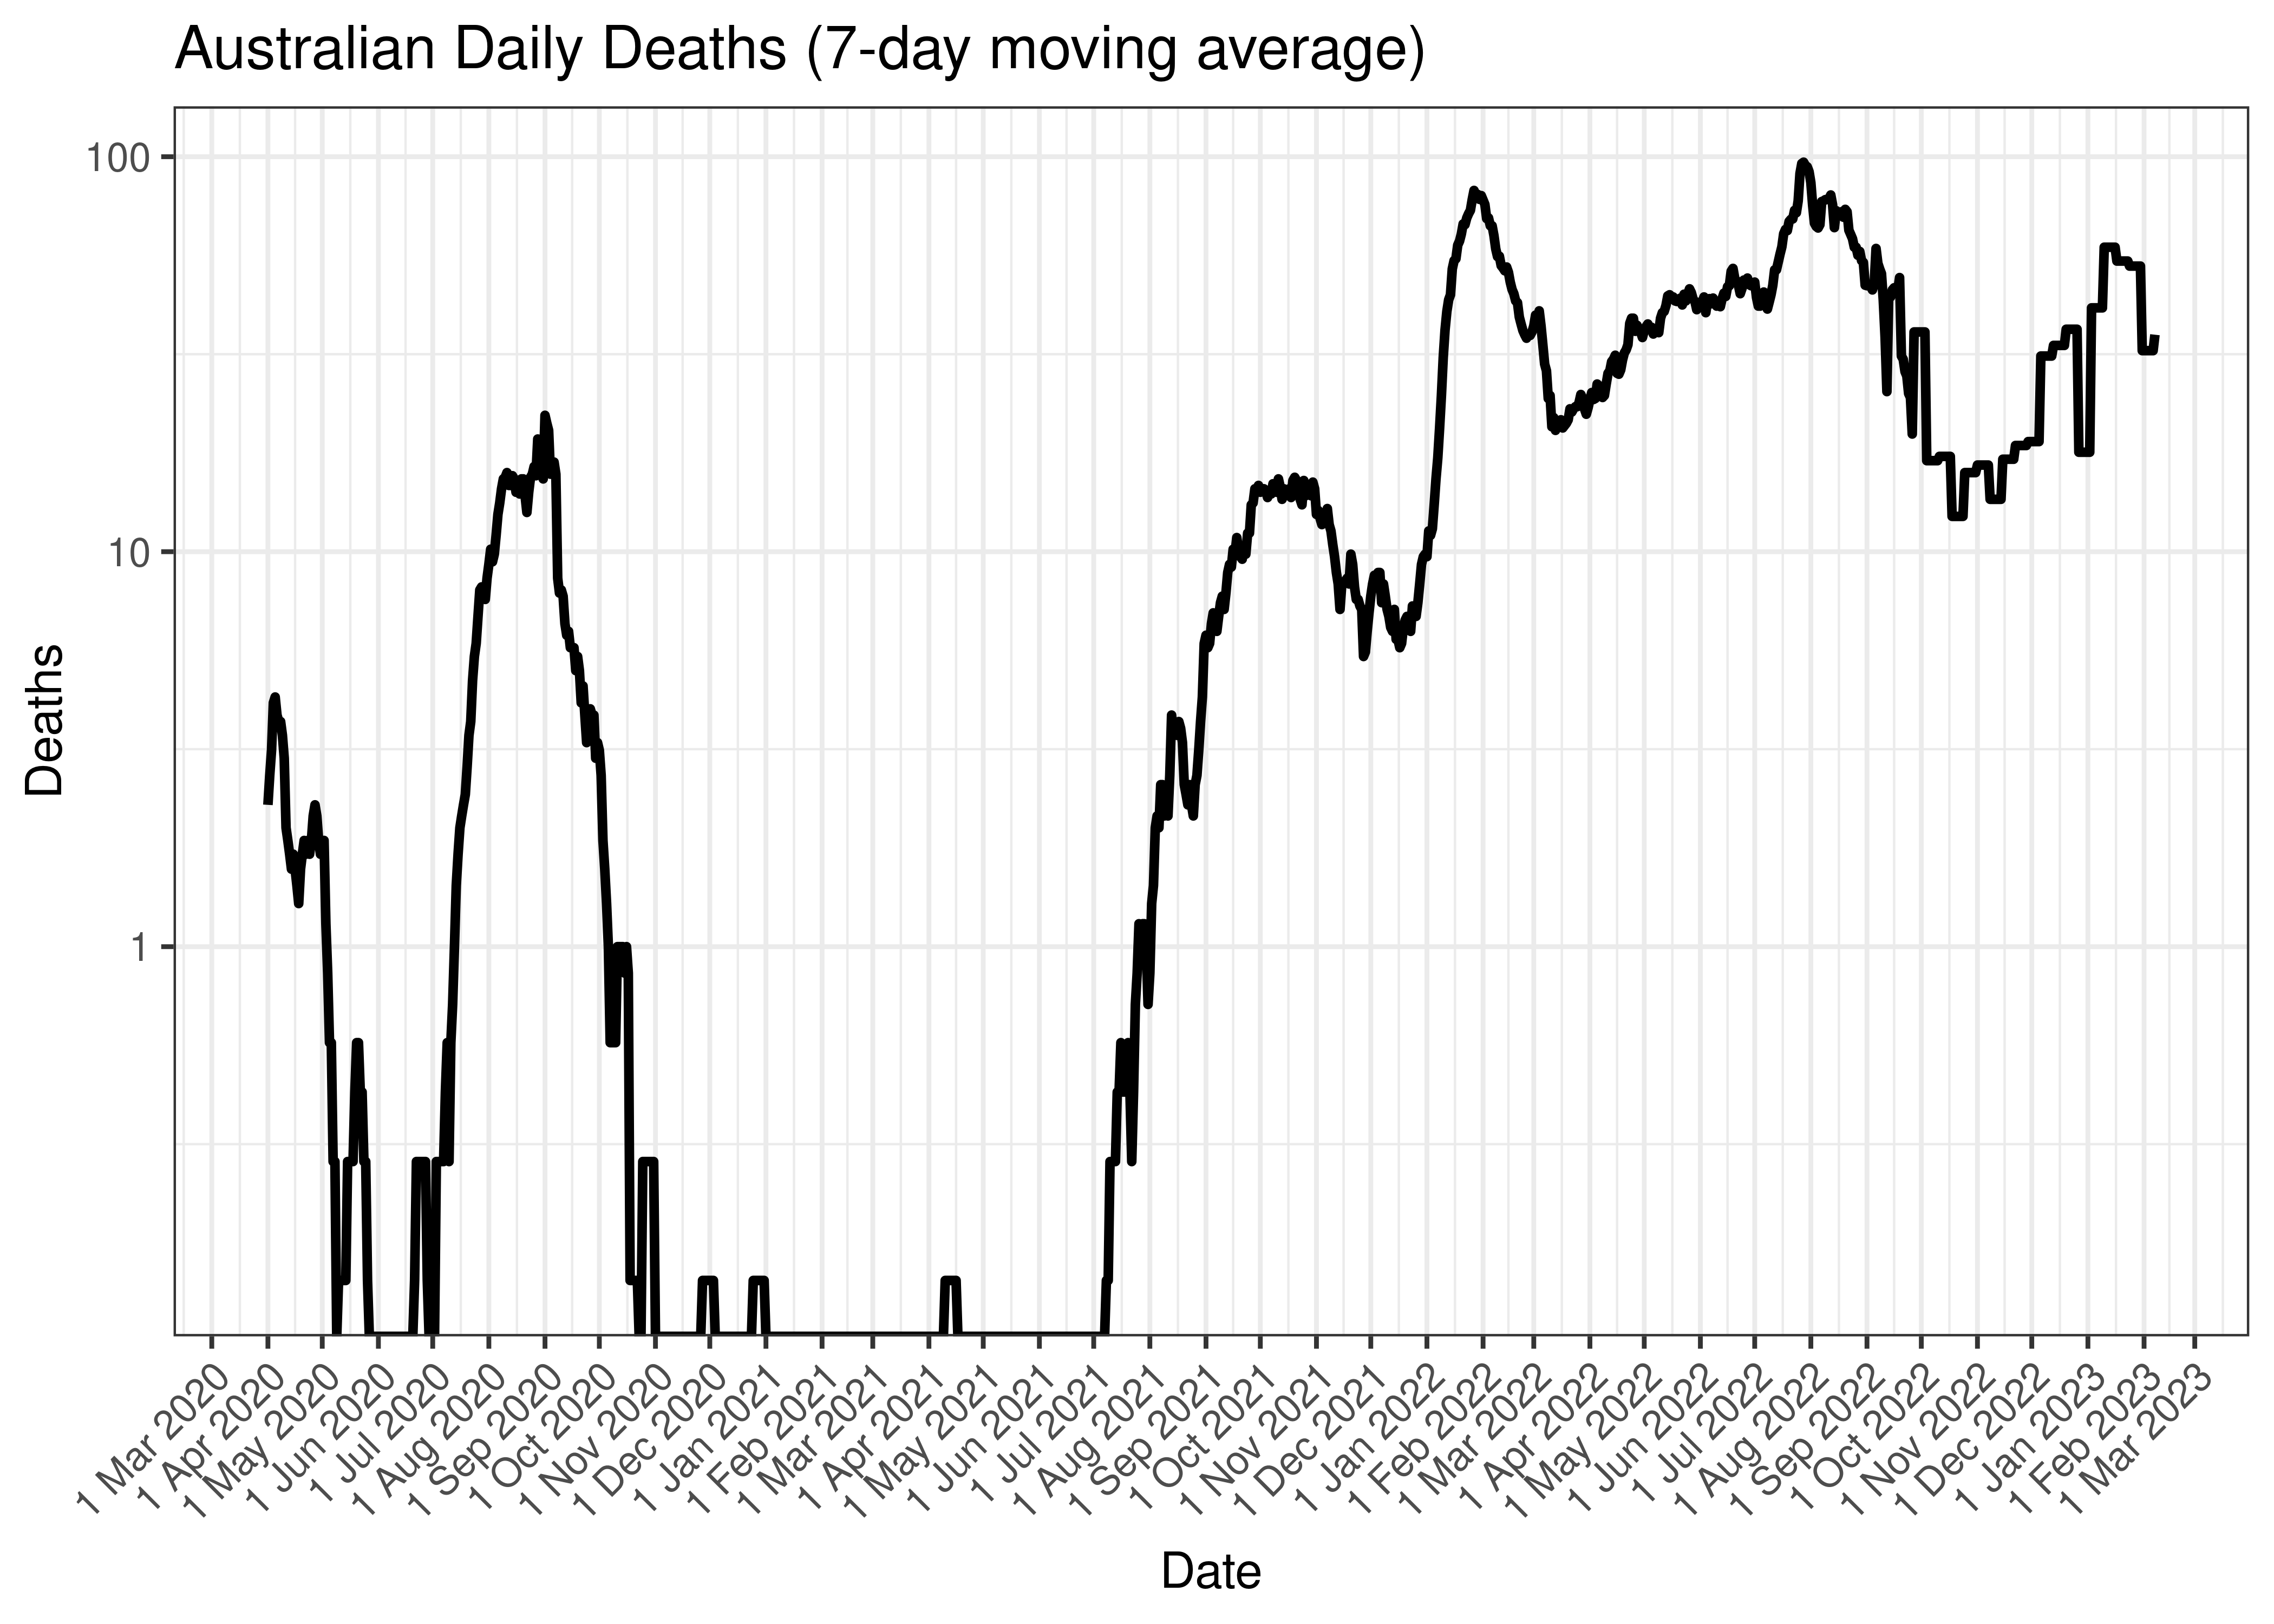
Daily Deaths (7-day moving average)
Below the above chart is repeated for the last 30-days:
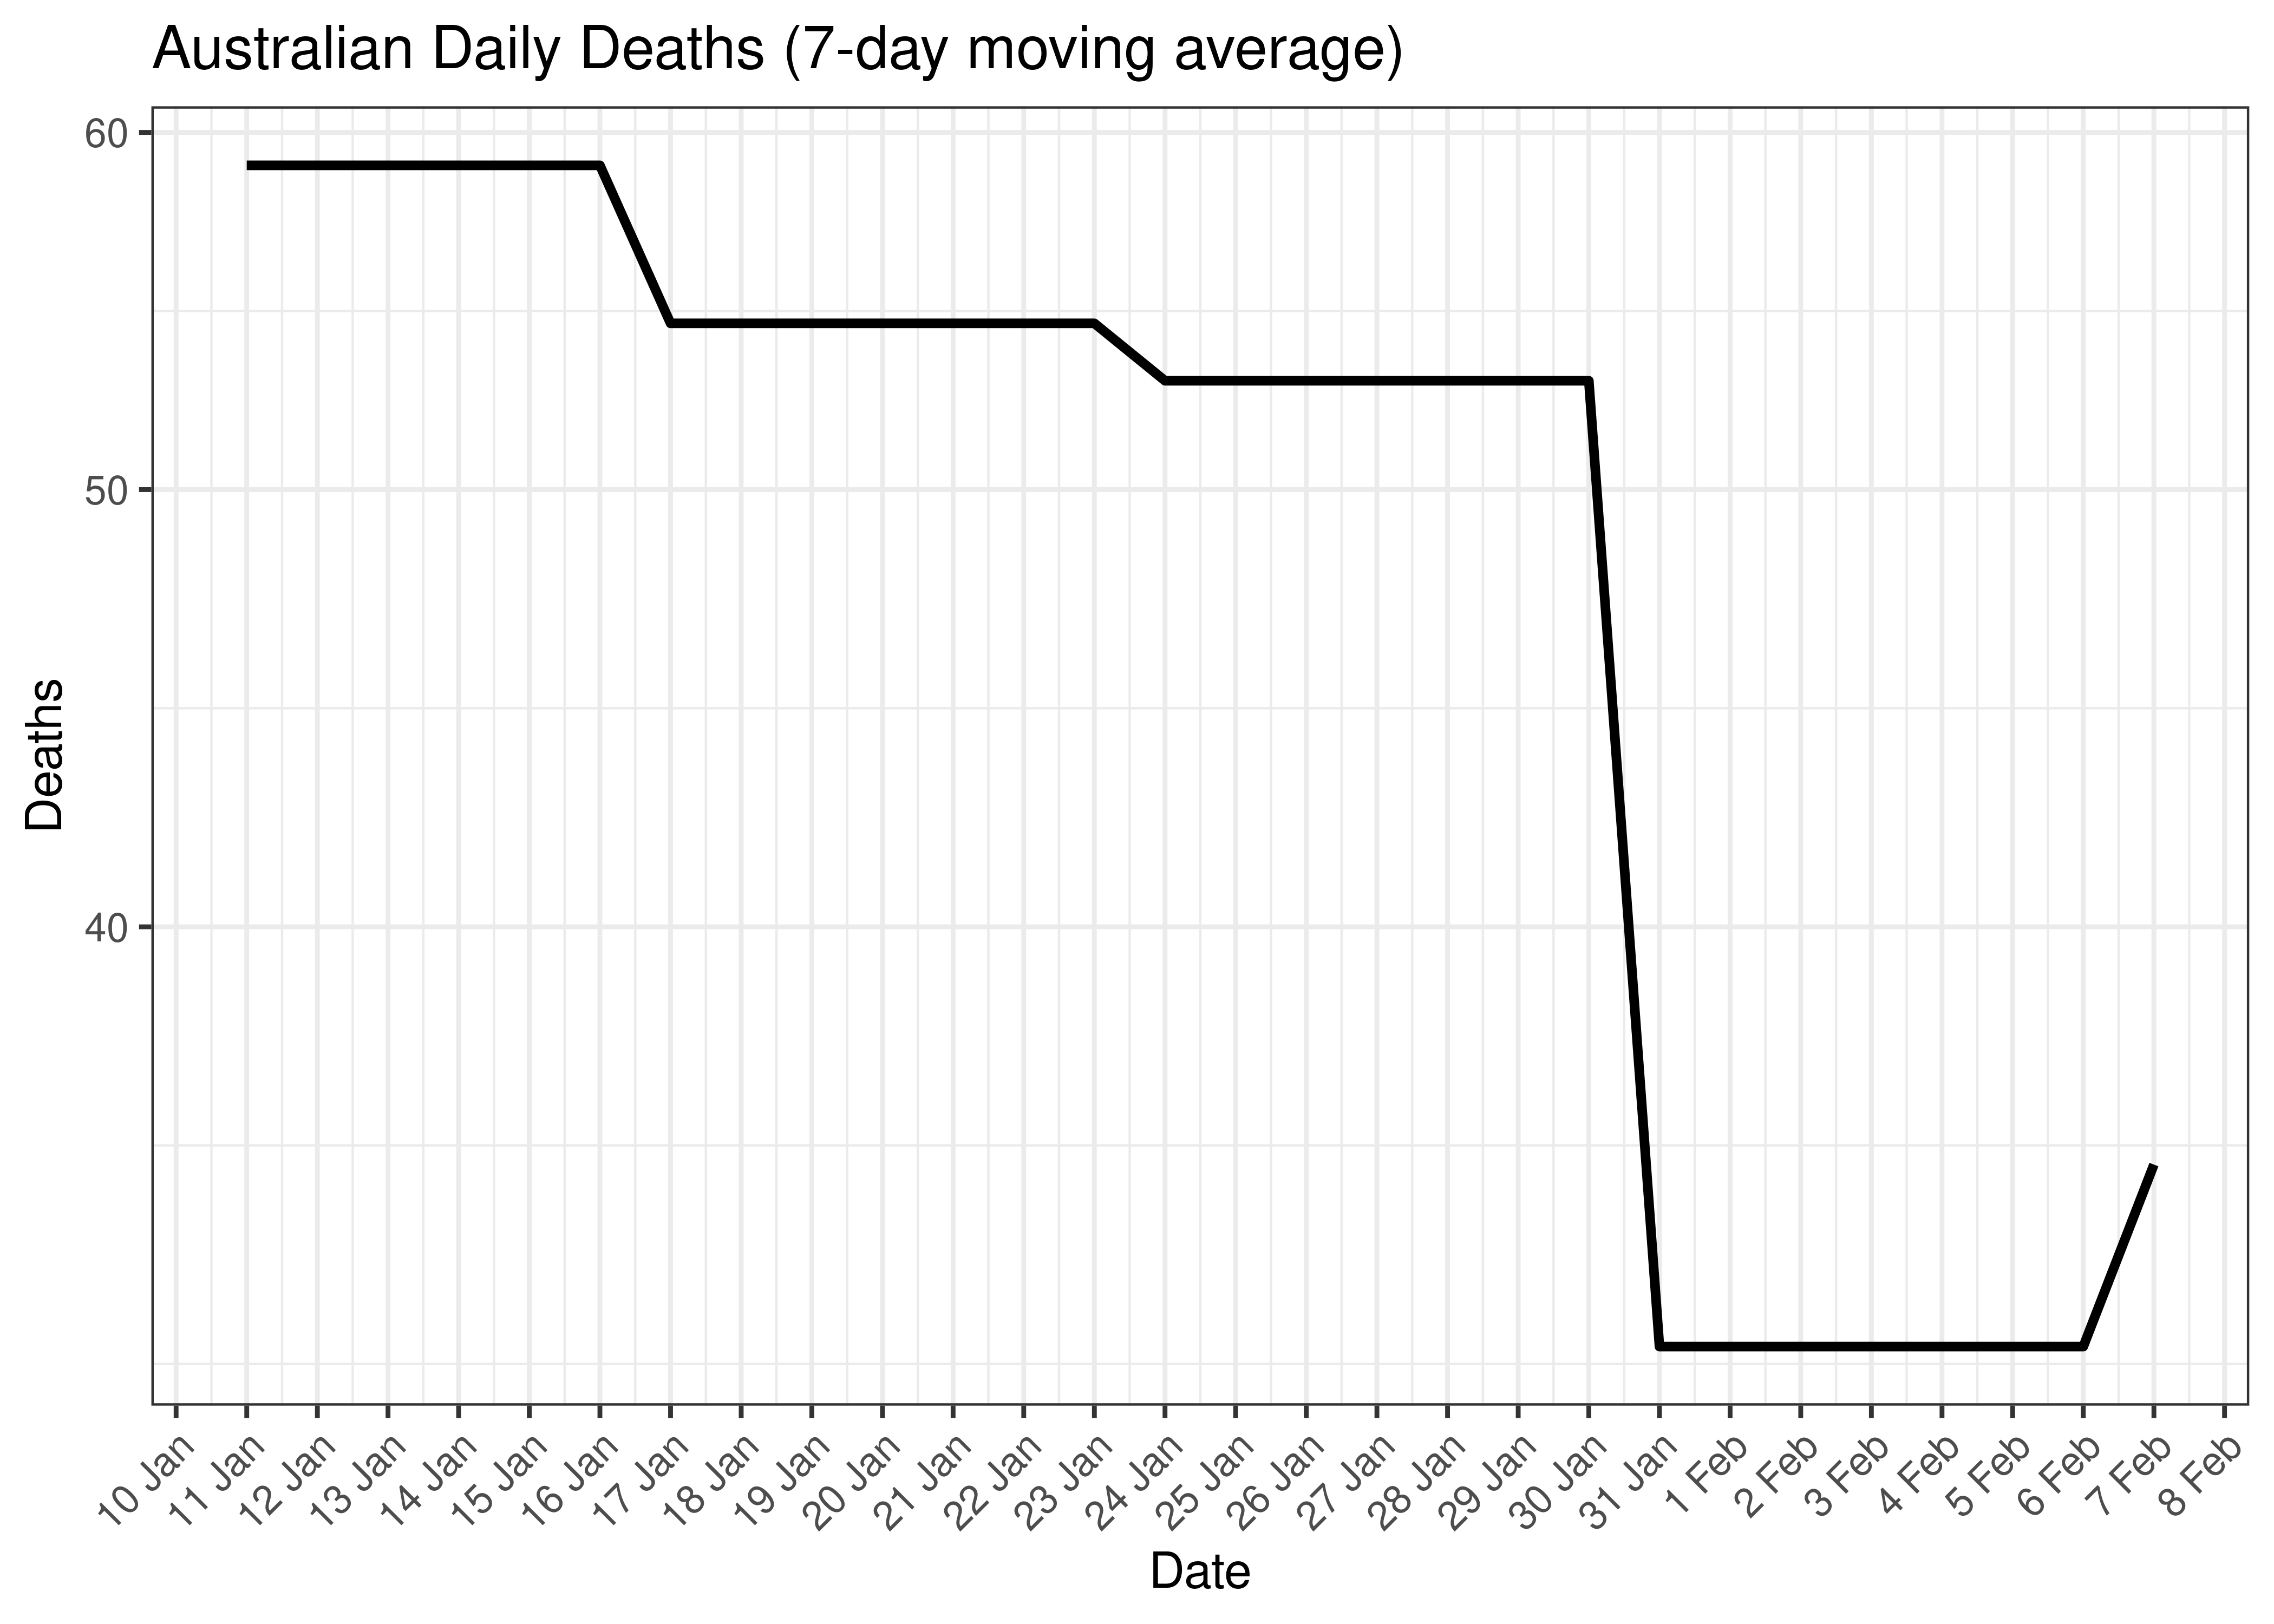
Australian Daily Deaths for Last 30-days (7-day moving average)
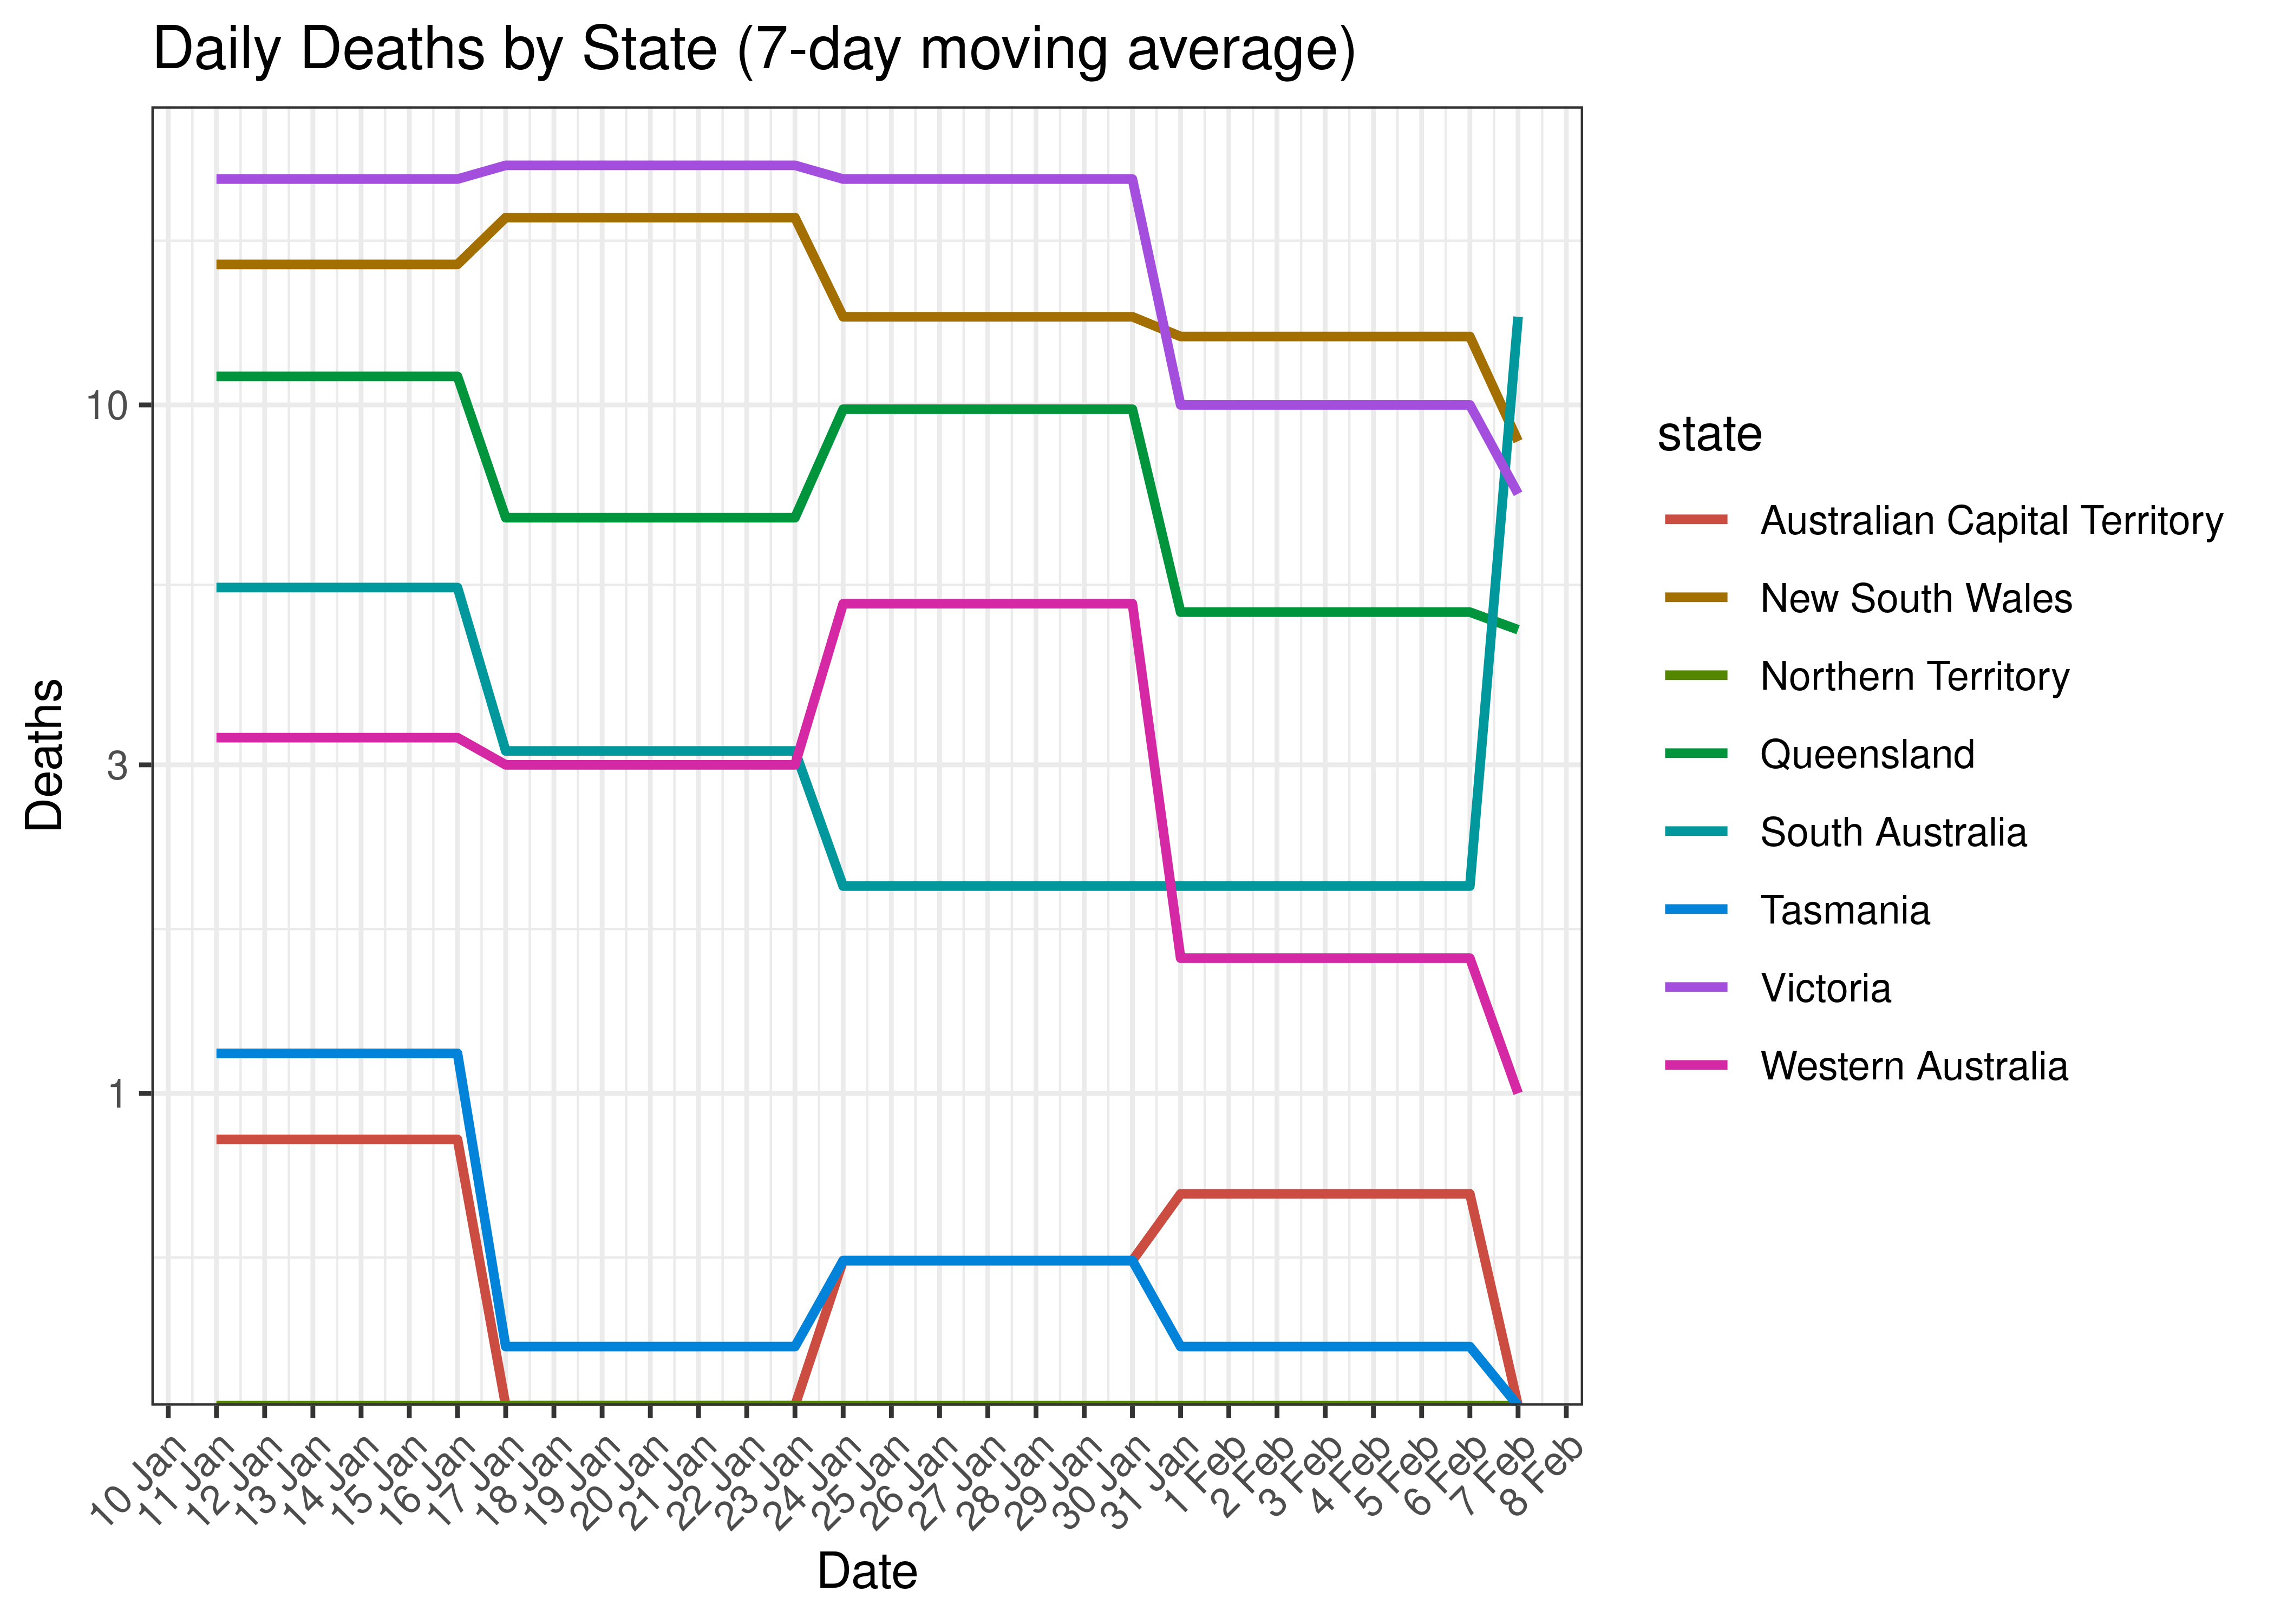
Below a 7-day moving average daily deaths are plotted by state on a log scale since start of the epidemic:
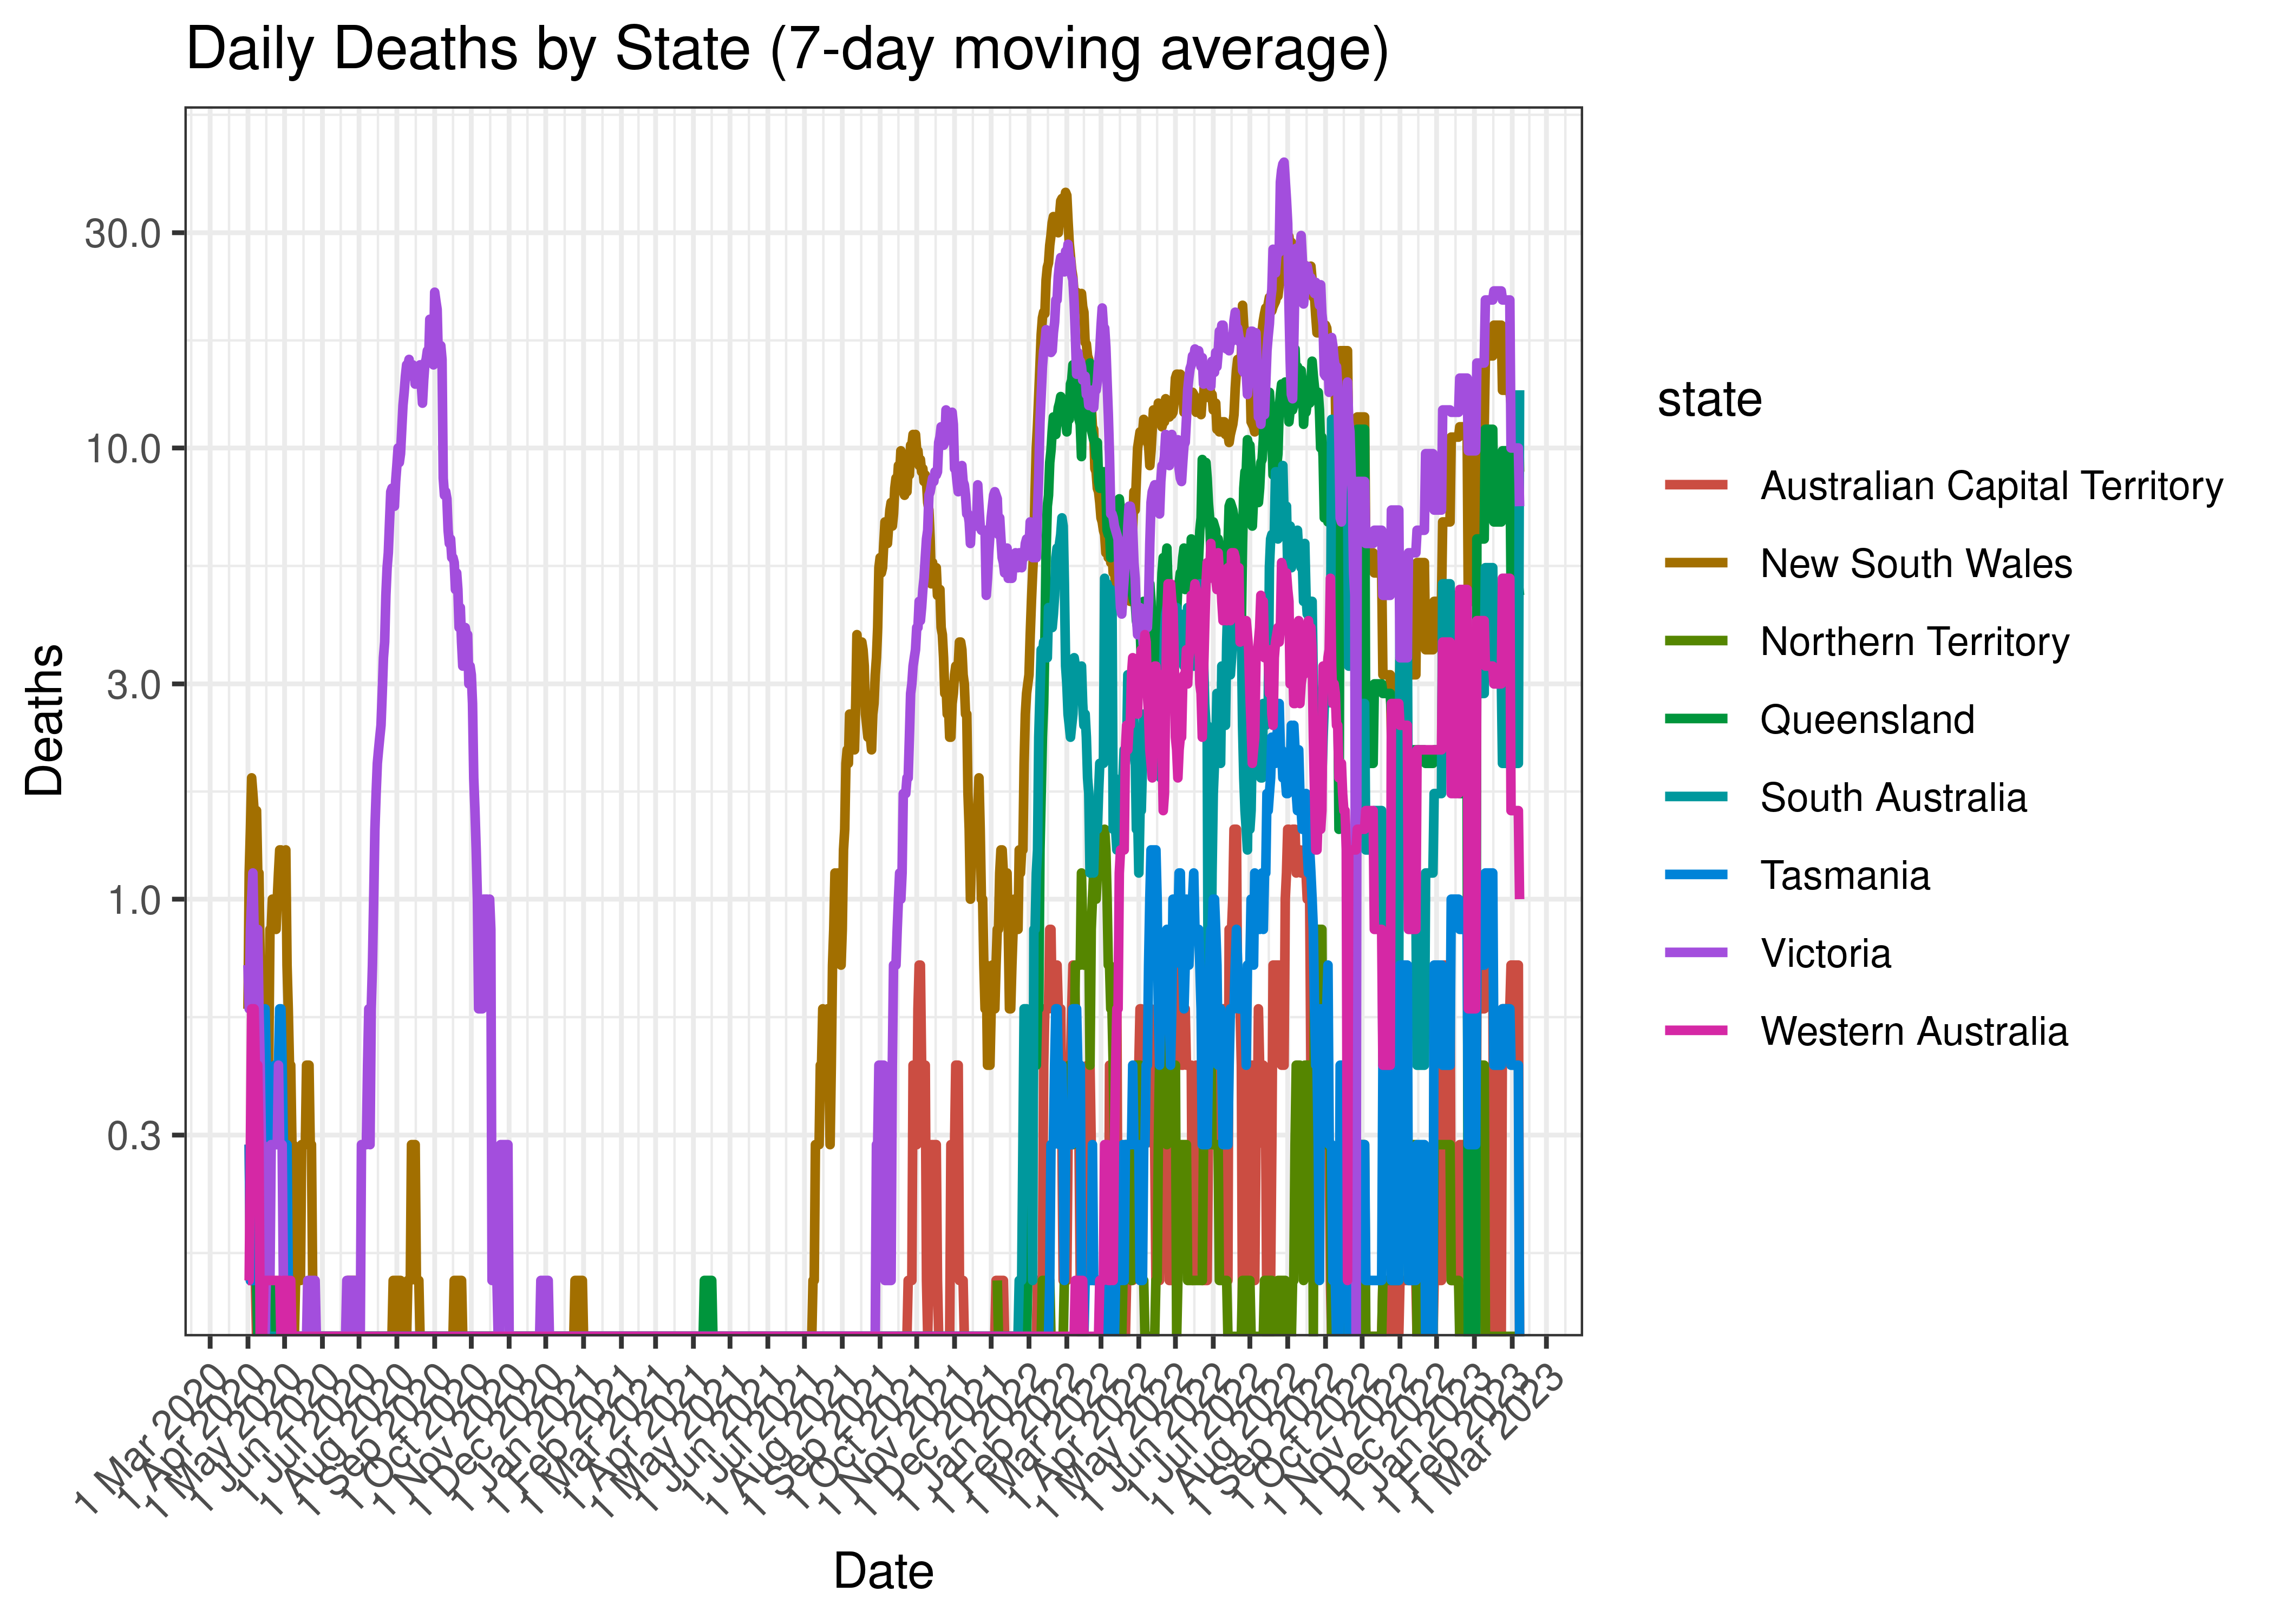
Daily Deaths by State (7-day moving average)
Below the above chart is repeated for the last 30-days:
Daily Deaths for Last 30-days by State (7-day moving average)
5.1.7 Cases, Hospital Counts and Deaths Combined
Below a 7-day moving average daily case, hospital counts and deaths are plotted by state on a log scale since start of the epidemic.
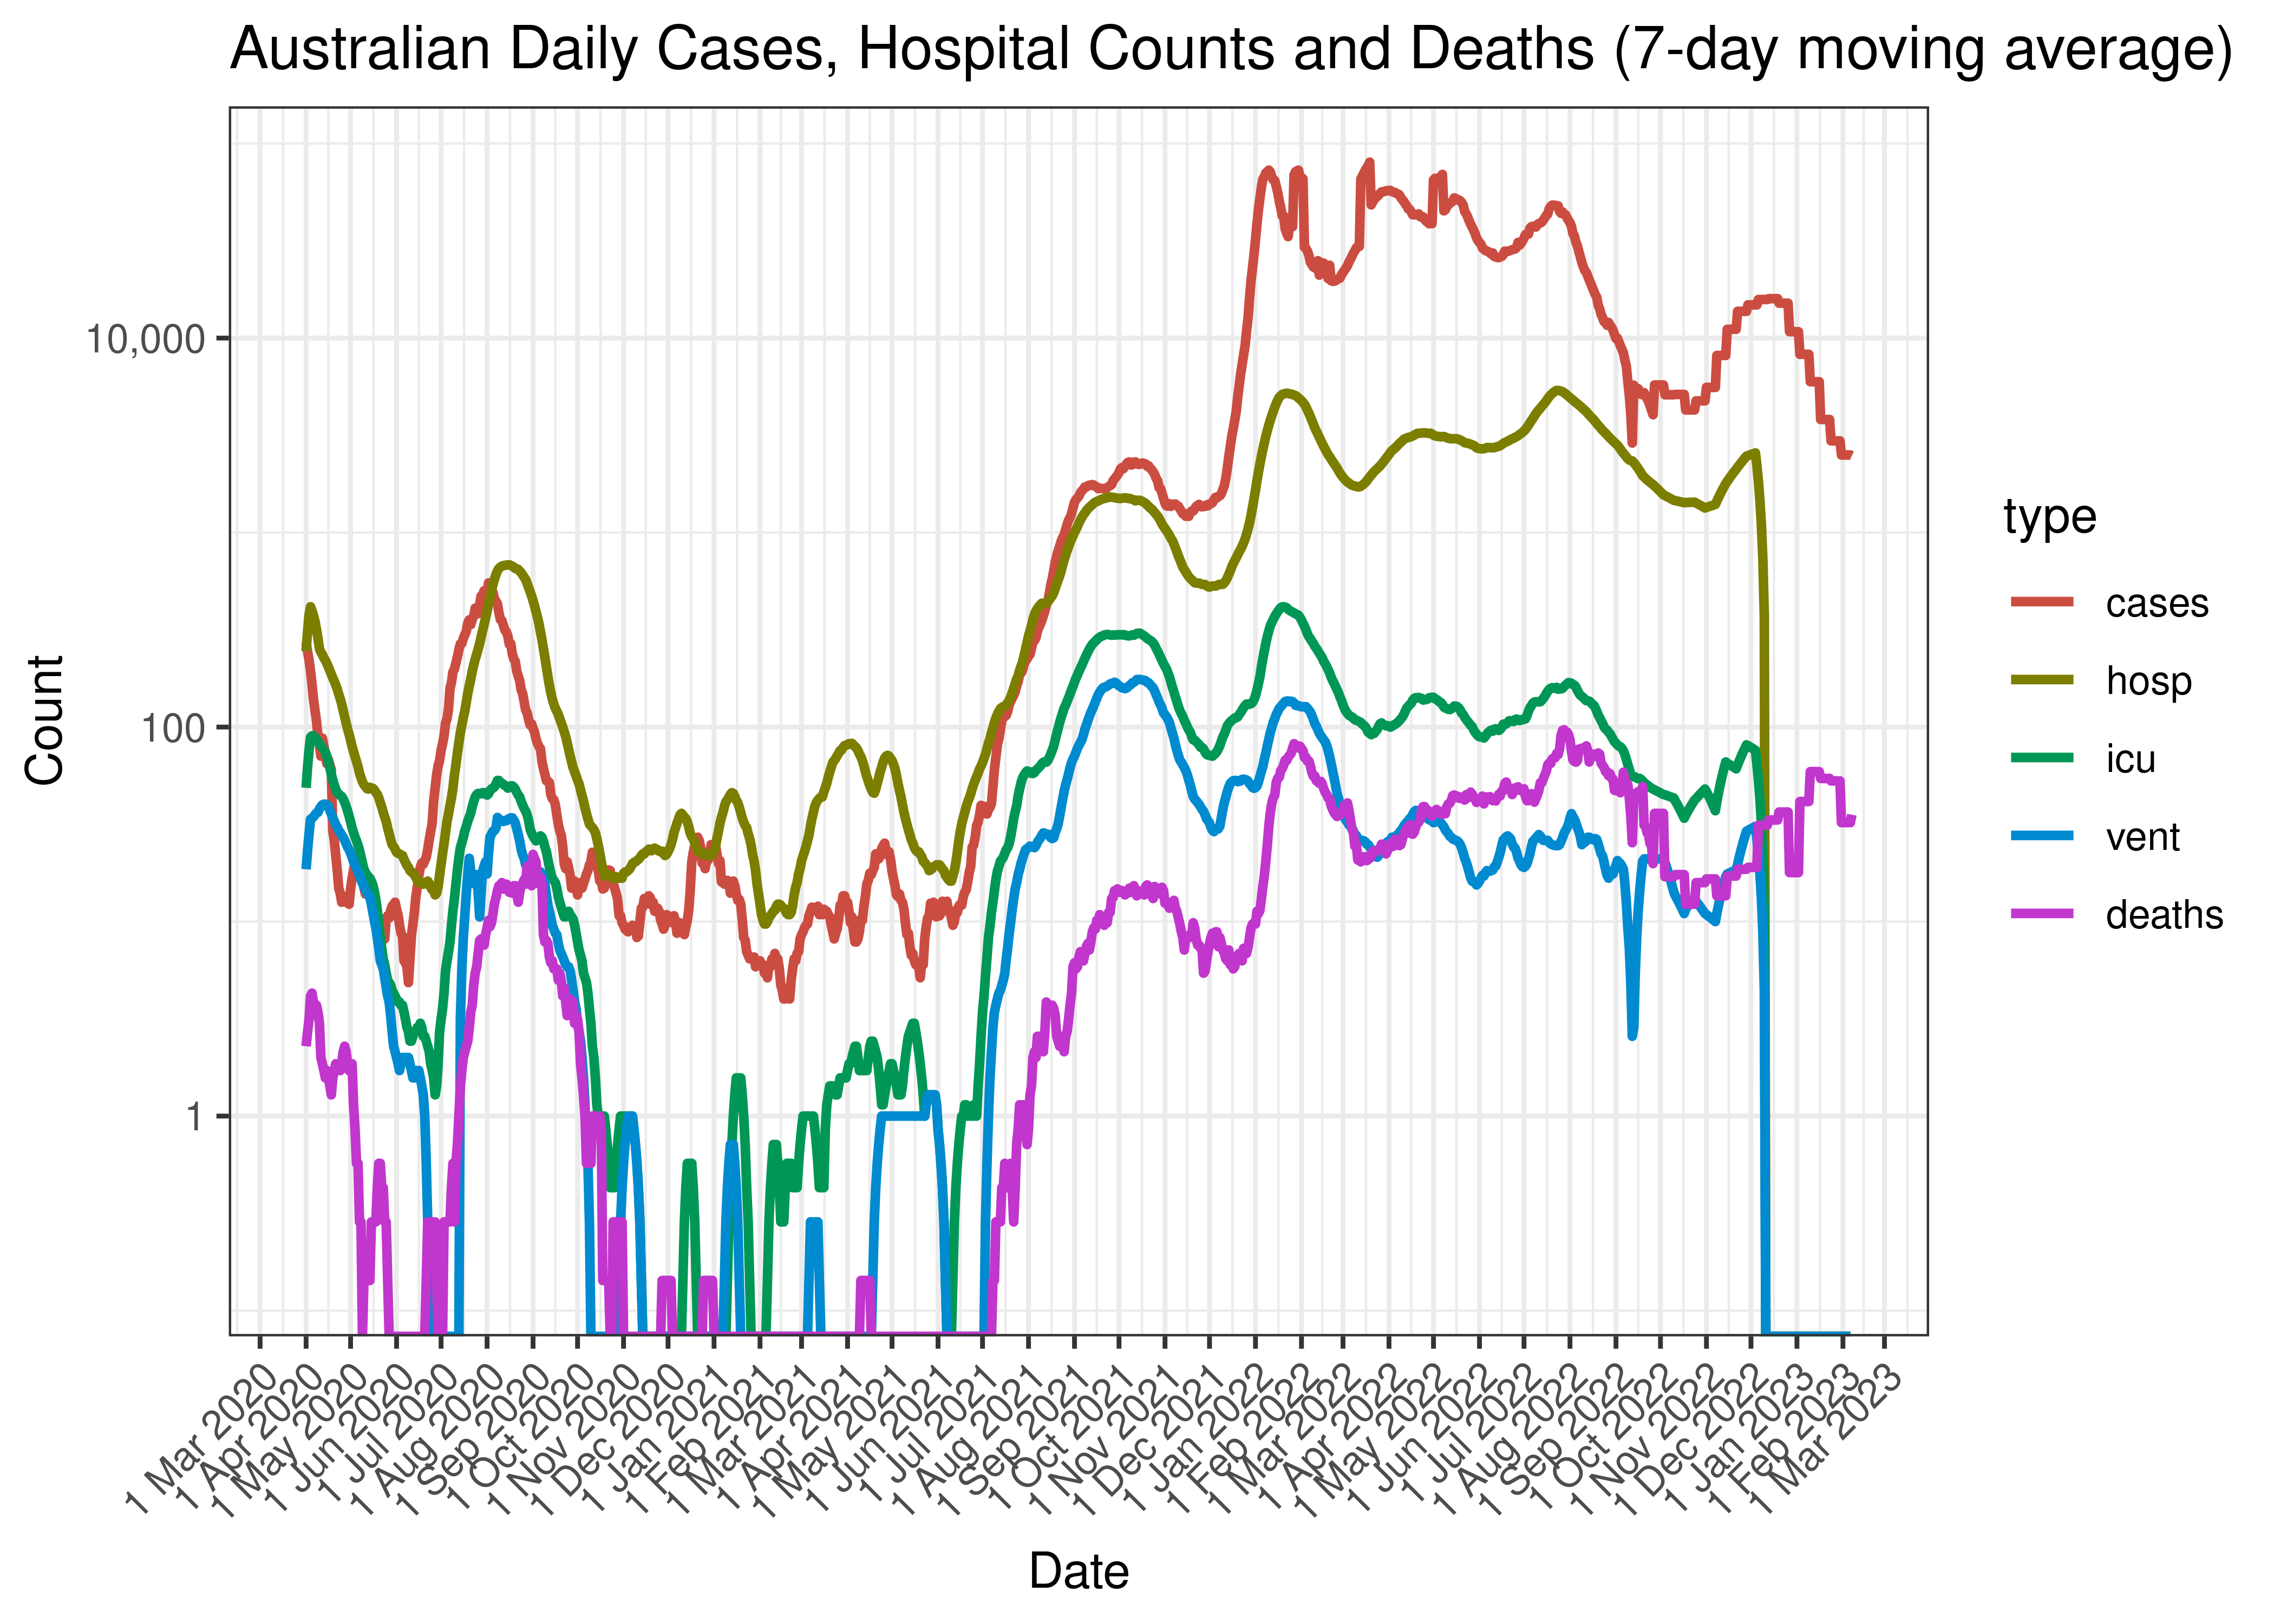
Australian Daily Cases, Hospital Counts and Deaths (7-day moving average)
Below the above chart is repeated for the last 30-days:
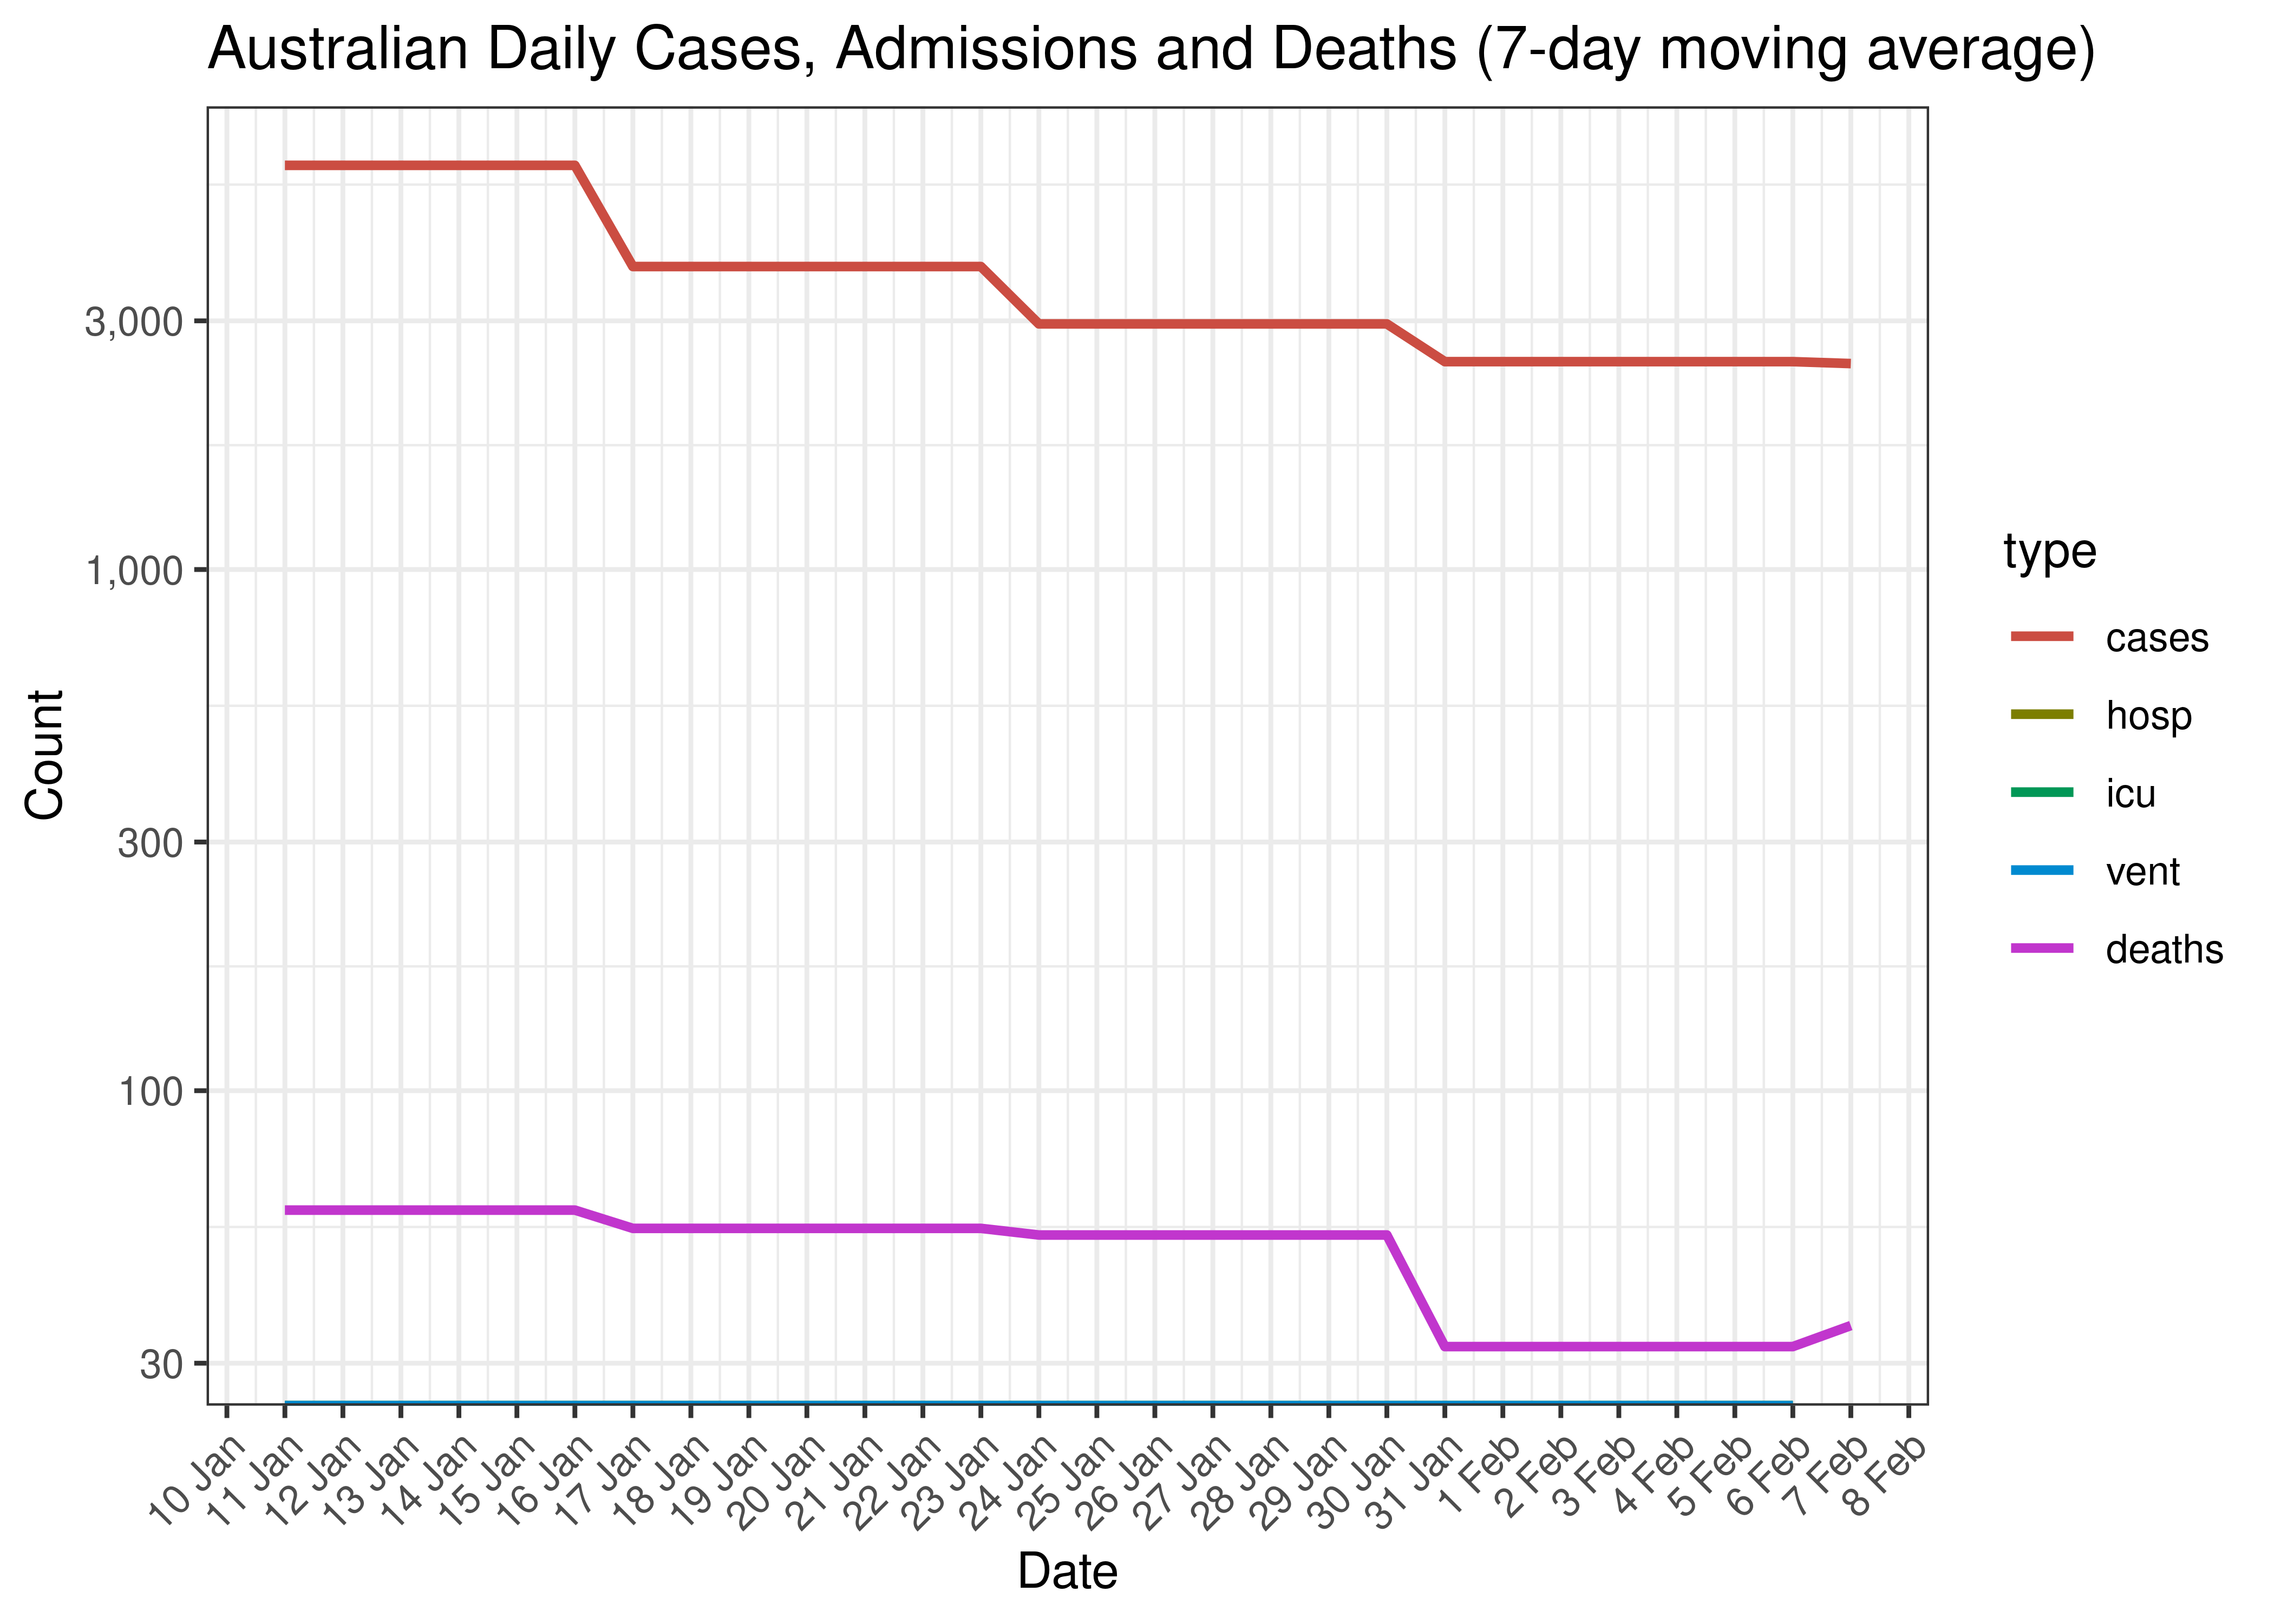
Australian Daily Cases, Admissions and Deaths for Last 30-days (7-day moving average)
5.1.8 Crude Ratios per Wave
Below crude rations are calculated between the waves. It’s based on the following starting dates:
- Wave 1 started on 2020-01-01.
- Wave 2 started on 2020-06-01.
- Wave 3 started on 2021-06-01.
- Wave 4 started on 2021-12-01.
Below crude ratios are tabulated and plotted. These ratios are:
- ICU ratio calculated as person days in ICU divided by person days in hospital.
- Ventilator ratio calculated as person days on ventilators divided by person days in hospital.
- Death ratio calculated as deaths divided by person days in hospital.
- Case fatality ratio is calcualted as deaths divided by cases.
| Wave | ICU Ratio | Ventilator Ratio | Death Ratio | Case Fatality Ratio | |
|---|---|---|---|---|---|
| Australia | Wave 1 | 28.5% | 15.8% | 1.2% | 1.40% |
| Australia | Wave 2 | 8.3% | 4.2% | 2.2% | 3.57% |
| Australia | Wave 3 | 18.6% | 9.5% | 0.9% | 0.61% |
| Australia | Wave 4 | 4.7% | 1.3% | 1.5% | 0.14% |
5.1.9 Reproduction Number
Below current (last weekly) effective reproduction number estimates are tabulated for Australia and by state.
| Type | Count (Per Day) | Week Ending | Reproduction Number [95% Confidence Interval] | |
|---|---|---|---|---|
| Australia | cases | 2,484 | 2023-02-10 | 0.97 [0.94 - 0.99] |
| State | Type | Count (Per Day) | Week Ending | Reproduction Number [95% Confidence Interval] |
|---|---|---|---|---|
| Australian Capital Territory | cases | 52 | 2023-02-10 | 2.06 [1.55 - 2.69] |
| New South Wales | cases | 914 | 2023-02-10 | 0.95 [0.92 - 0.98] |
| Northern Territory | cases | 23 | 2023-02-10 | 1.02 [0.87 - 1.19] |
| Queensland | cases | 503 | 2023-02-10 | 0.84 [0.81 - 0.87] |
| South Australia | cases | 223 | 2023-02-10 | 1.14 [1.08 - 1.20] |
| Tasmania | cases | 51 | 2023-02-10 | 1.06 [0.94 - 1.18] |
| Victoria | cases | 410 | 2023-02-10 | 0.96 [0.92 - 0.99] |
| Western Australia | cases | 298 | 2023-02-10 | 0.94 [0.89 - 0.98] |
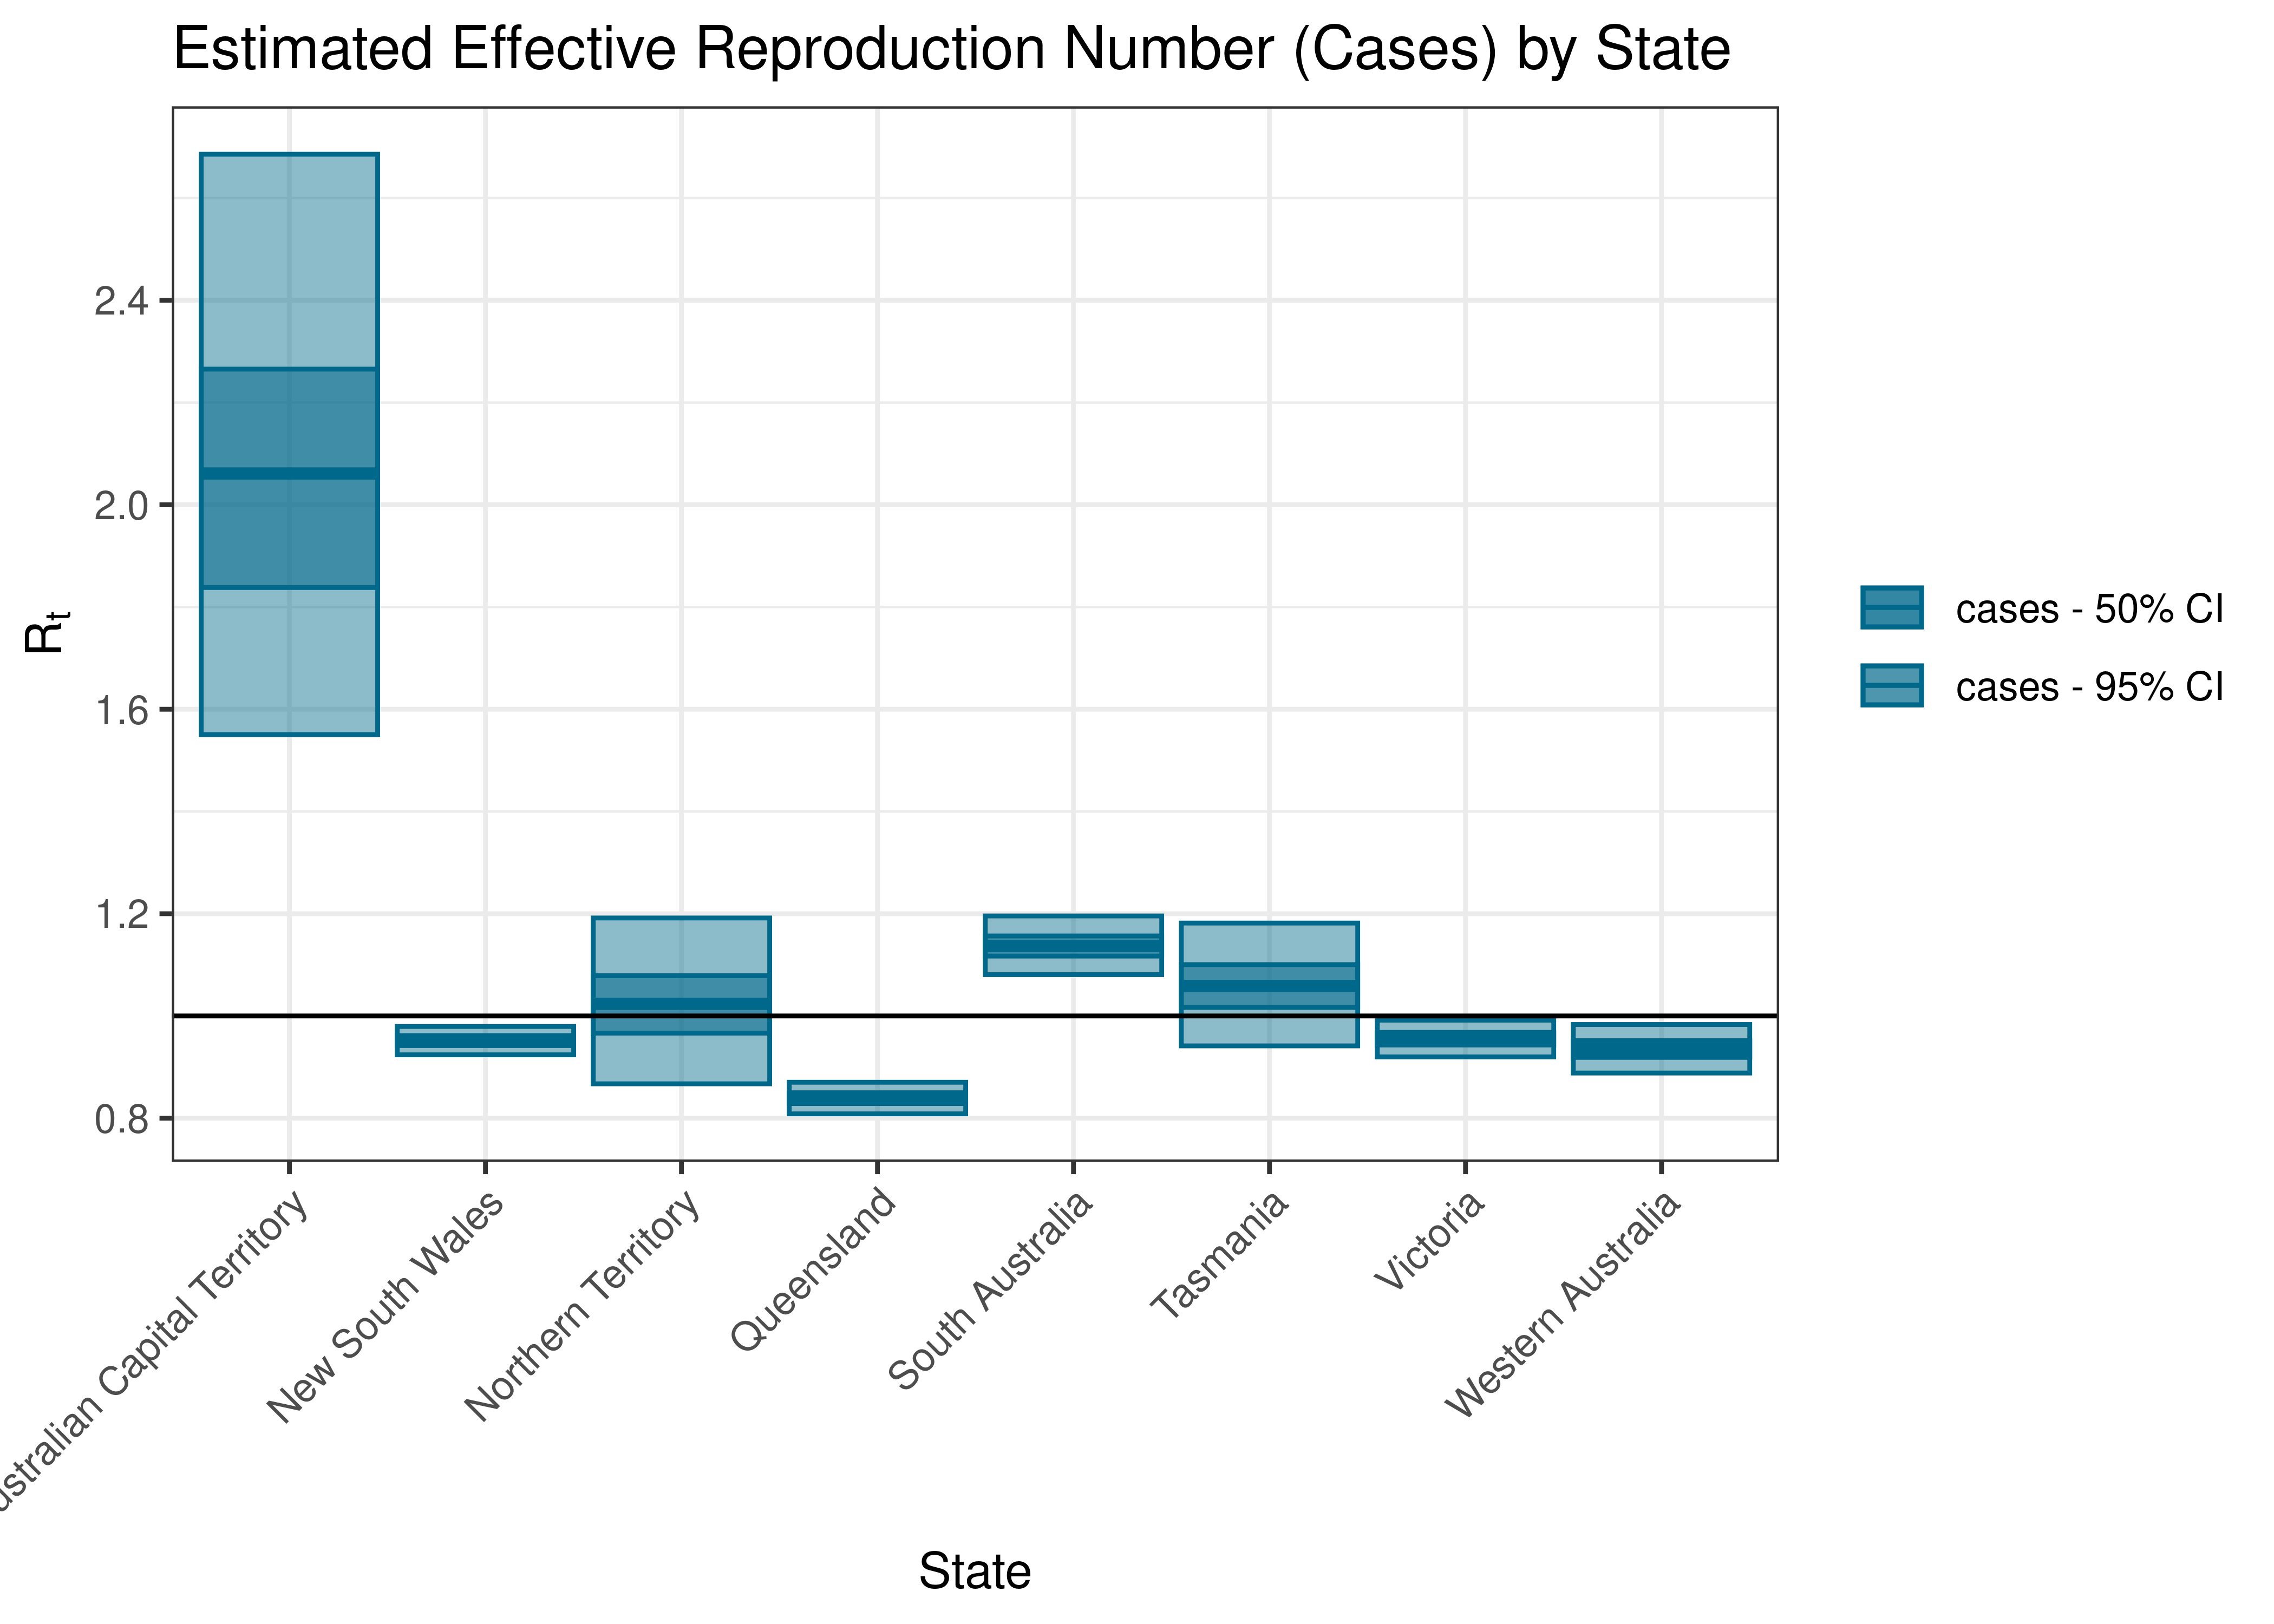
Estimated Effective Reproduction Number based on Cases by State
Below the effective reproduction number for Australia over the last 90 days are plotted together with a plot since start of the pandemic.
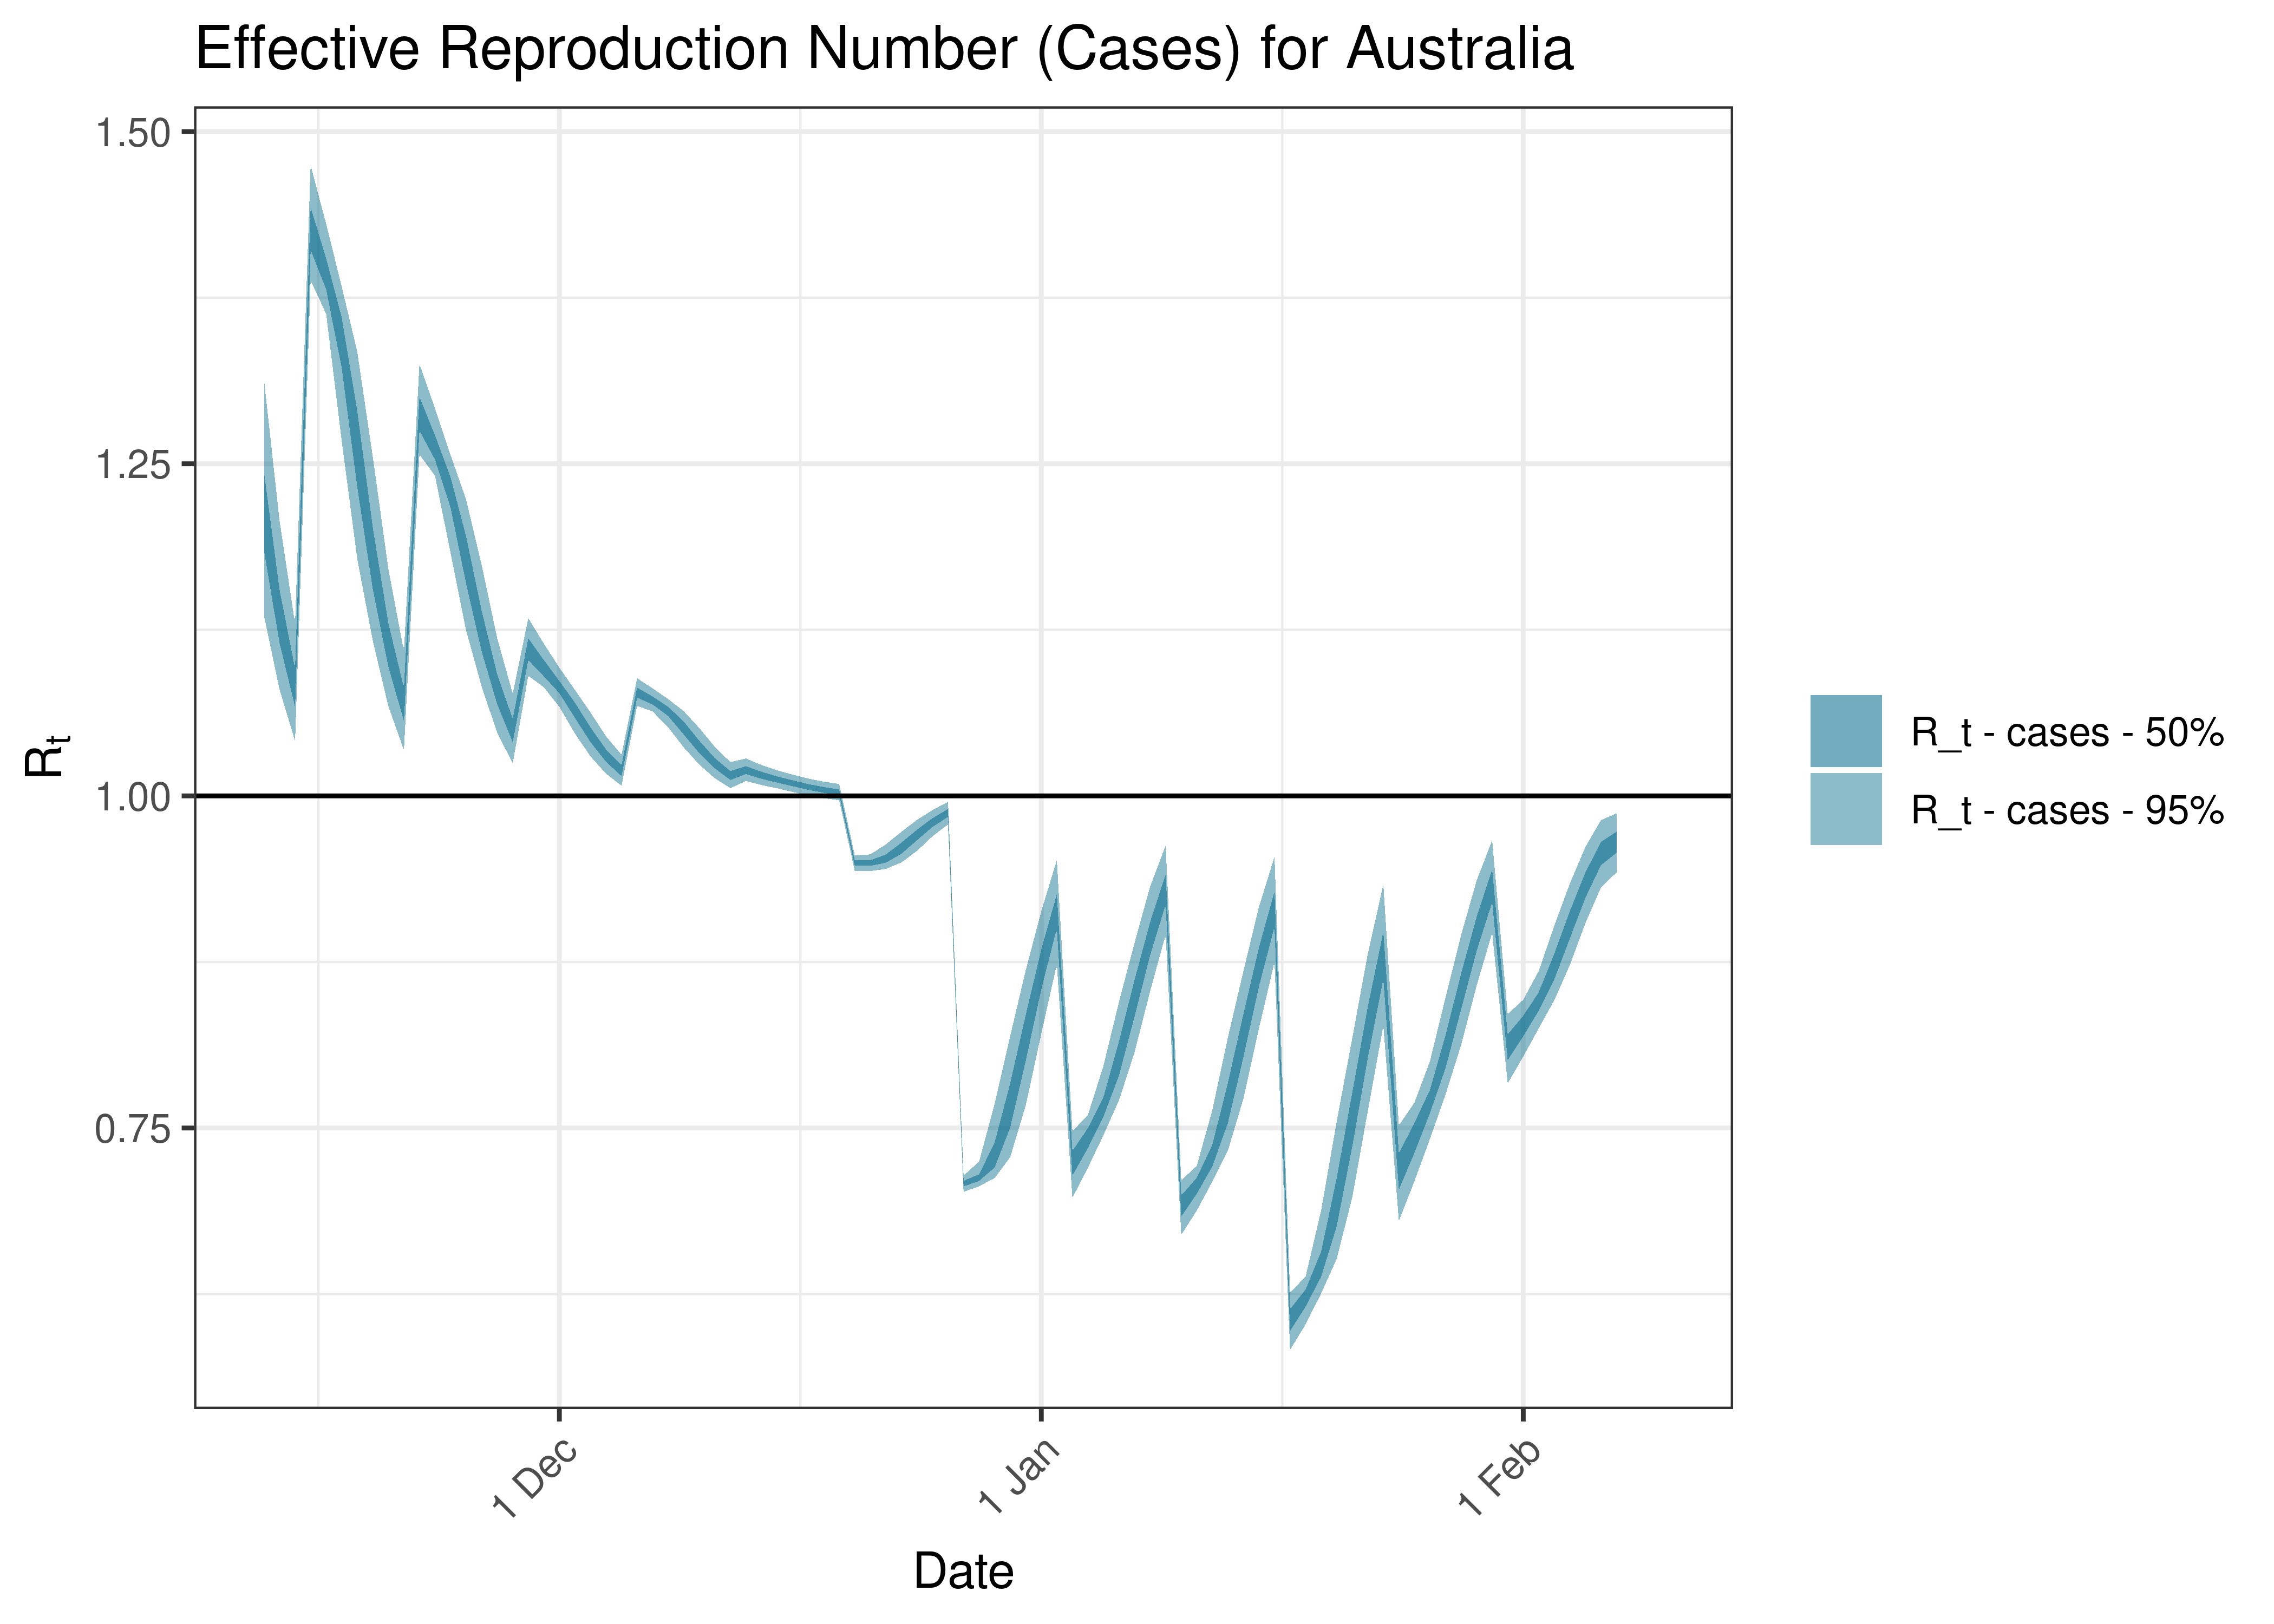
Estimated Effective Reproduction Number Based on Cases for Australia over last 90 days
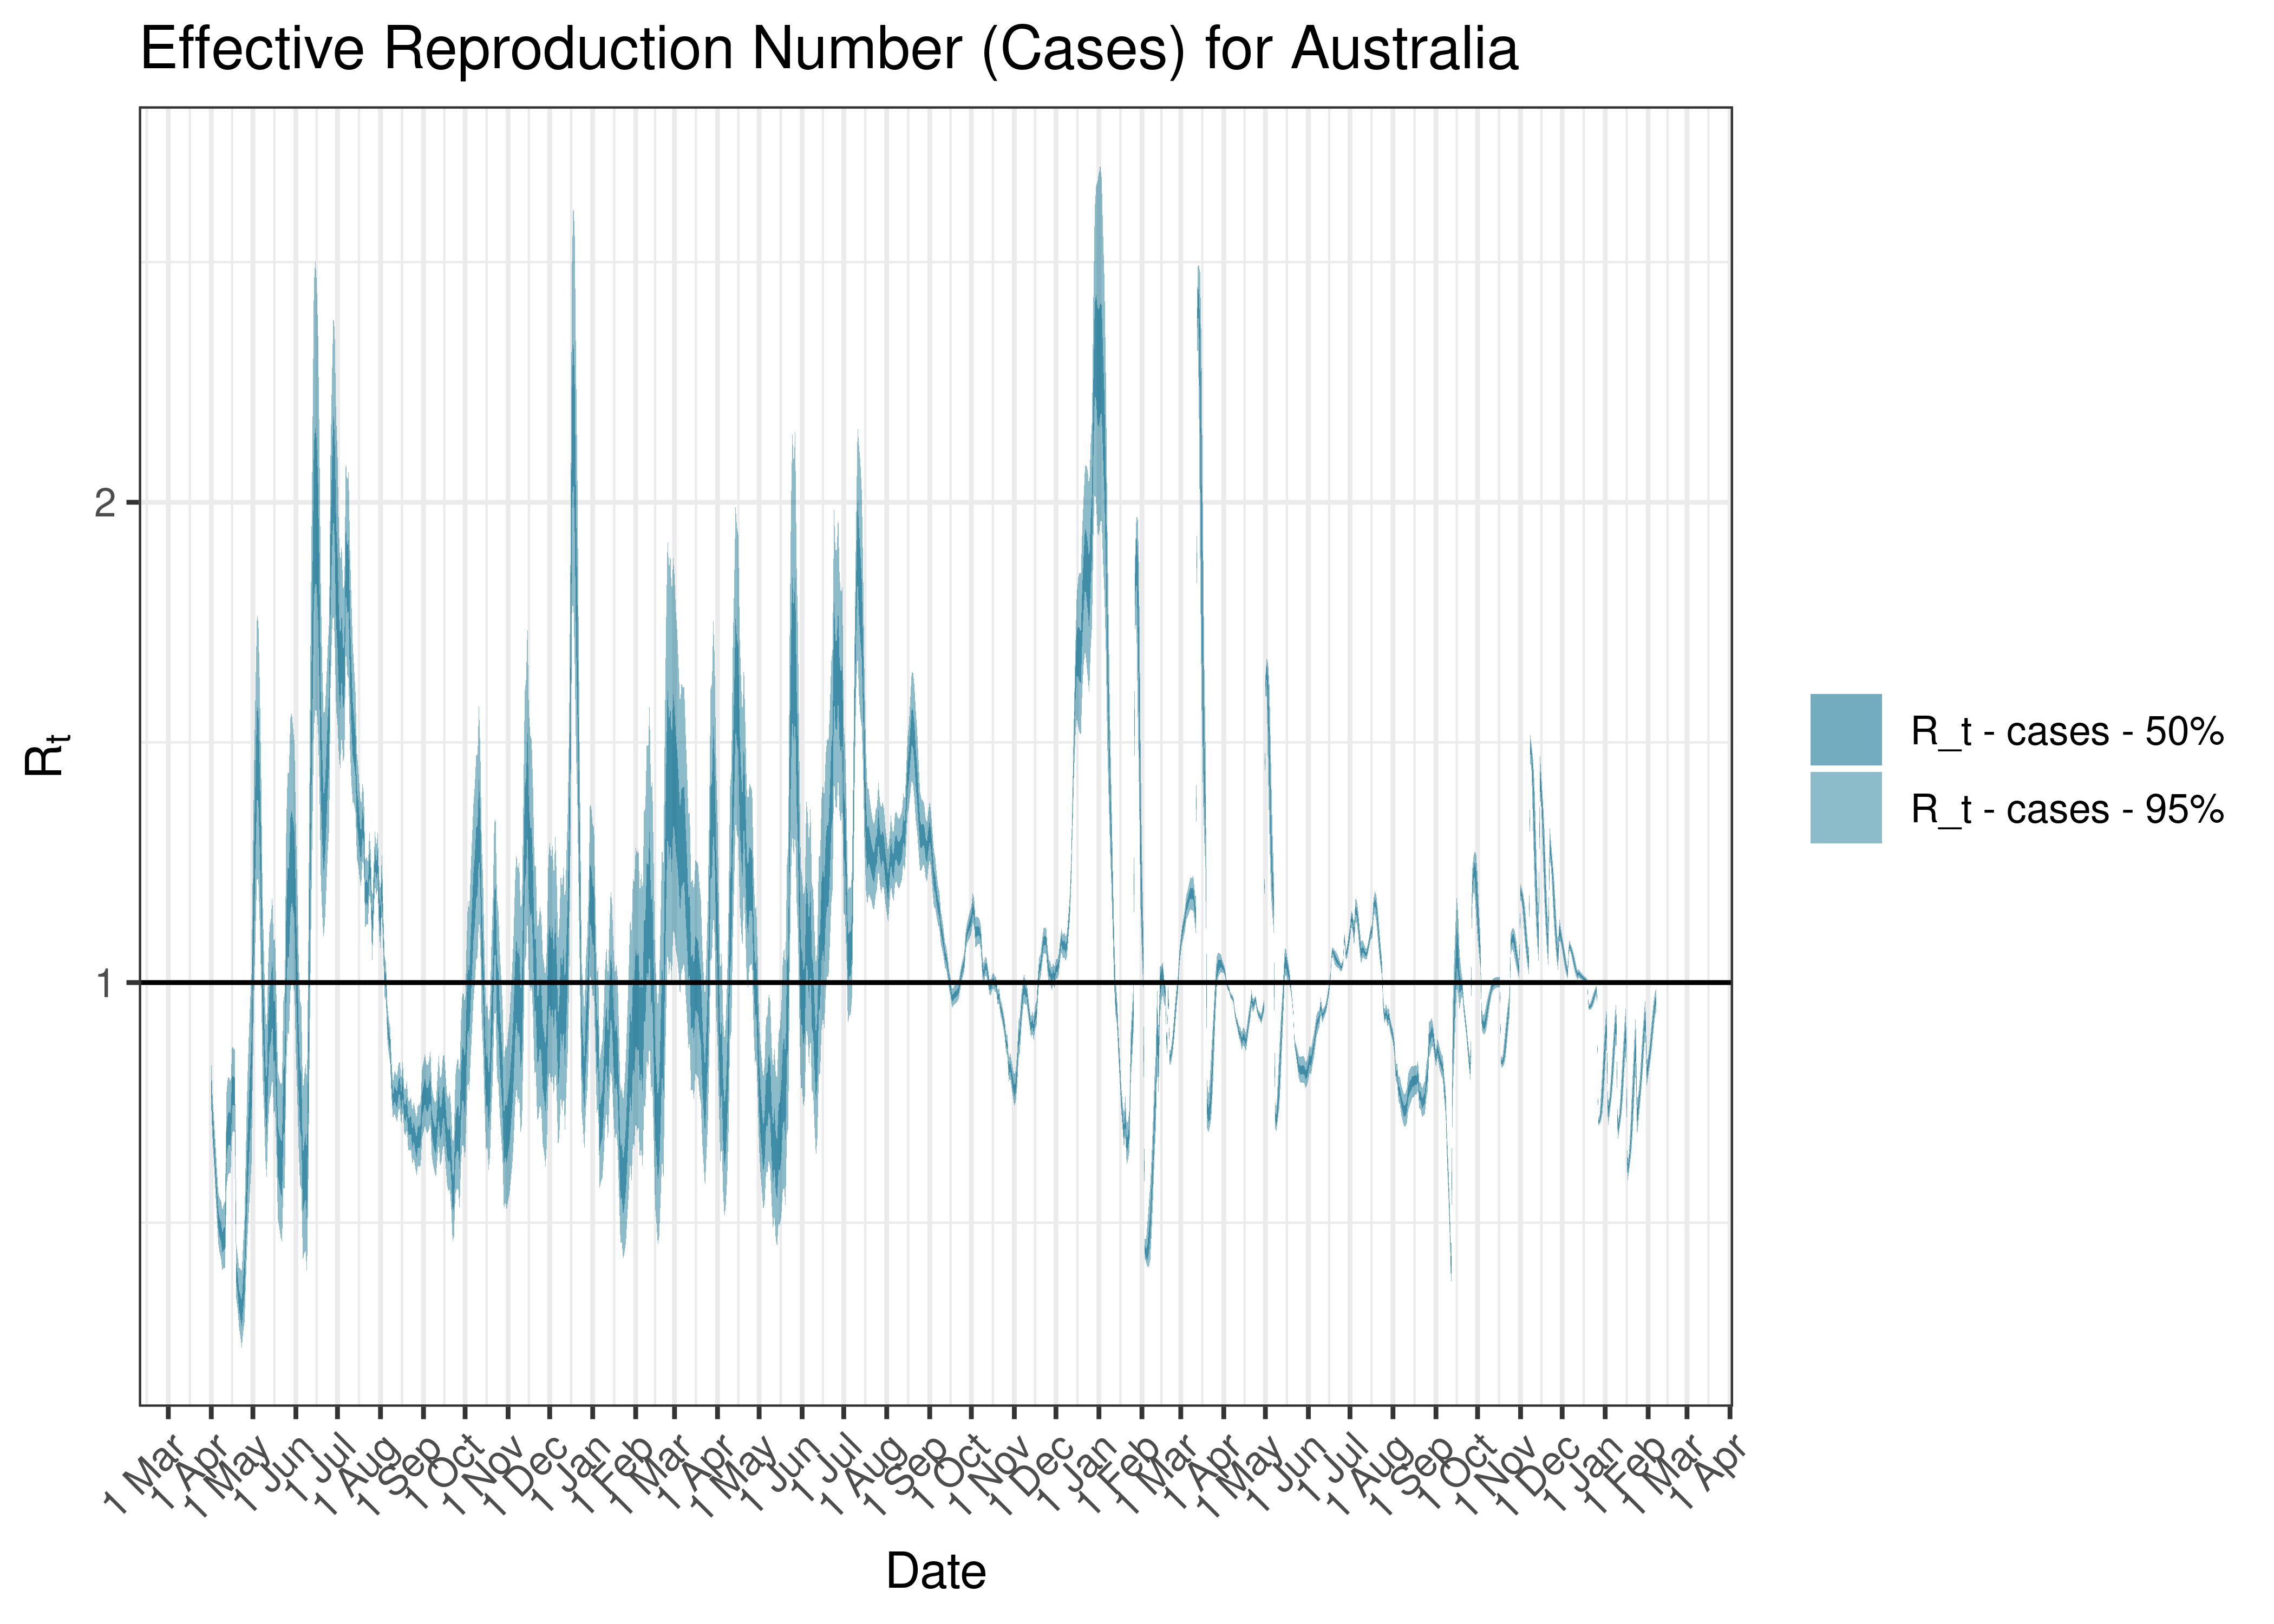
Estimated Effective Reproduction Number Based on Cases for Australia since 1 April 2020
5.2 Australian Capital Territory
5.2.1 Tests
Below raw numbers of test by date are plotted on a 7-day moving average from 1 April 2020.
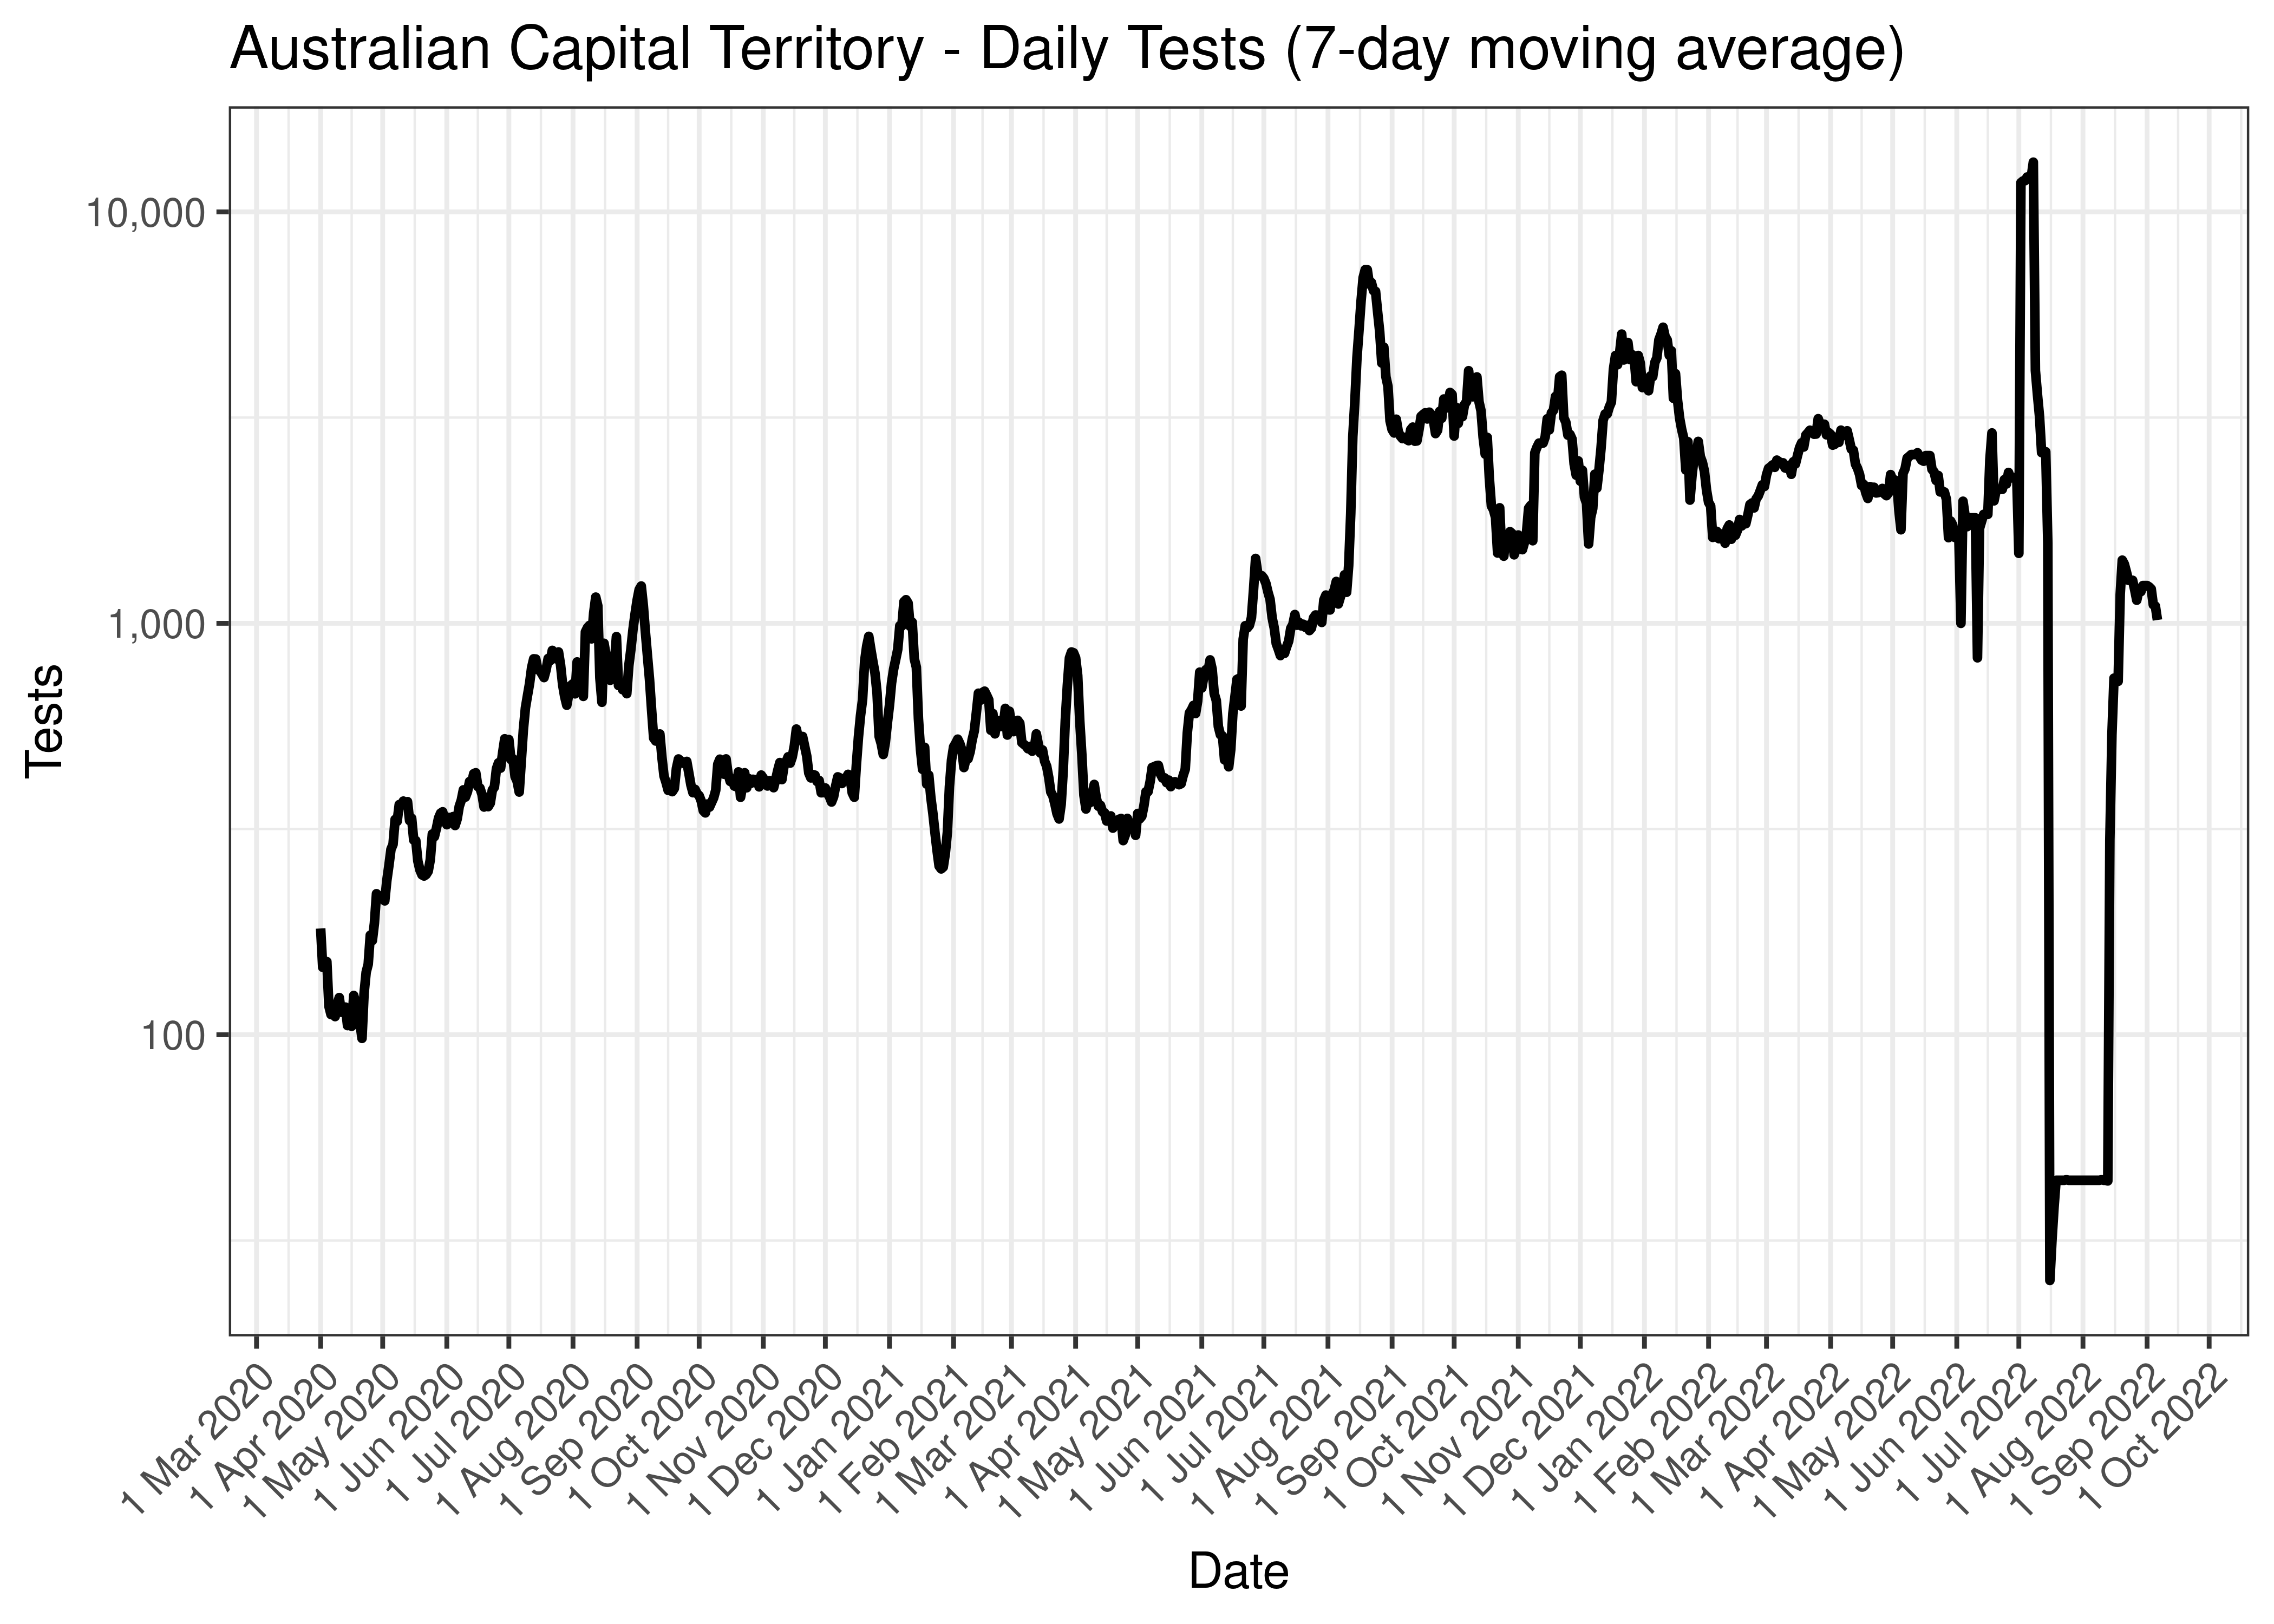
Australian Capital Territory - Daily Tests (7-day moving average)
The above chart is repeated below covering the last 30 days only.
Australian Capital Territory - Daily Tests for Last 30 Days (7-day moving average)
5.2.2 Cases
Cases are tabulated by specimen received date below. Cases include estimates for late reporting in recent days as well as adjustments for any public holidays. A centred 7-day moving average is also shown. The peak daily cases in previous waves (as measured by the moving average) is also shown.
| Date | Cases | 7-day Moving Average | Comment |
|---|---|---|---|
| 2021-10-04 | 28 | 39 | Wave 3 Peak |
| 2022-01-30 | 381 | 1,644 | Wave 4 Peak (to date) |
| 2023-02-03 | 0 | 23 | |
| 2023-02-04 | 53 | 30 | |
| 2023-02-05 | 53 | 38 | |
| 2023-02-06 | 53 | 46 | |
| 2023-02-07 | 53 | 52 | |
| 2023-02-08 | 53 | NA | |
| 2023-02-09 | 54 | NA | |
| 2023-02-10 | 45 | NA |
Below a 7-day moving average daily case count is plotted for Australian Capital Territory on a log scale since start of the epidemic:
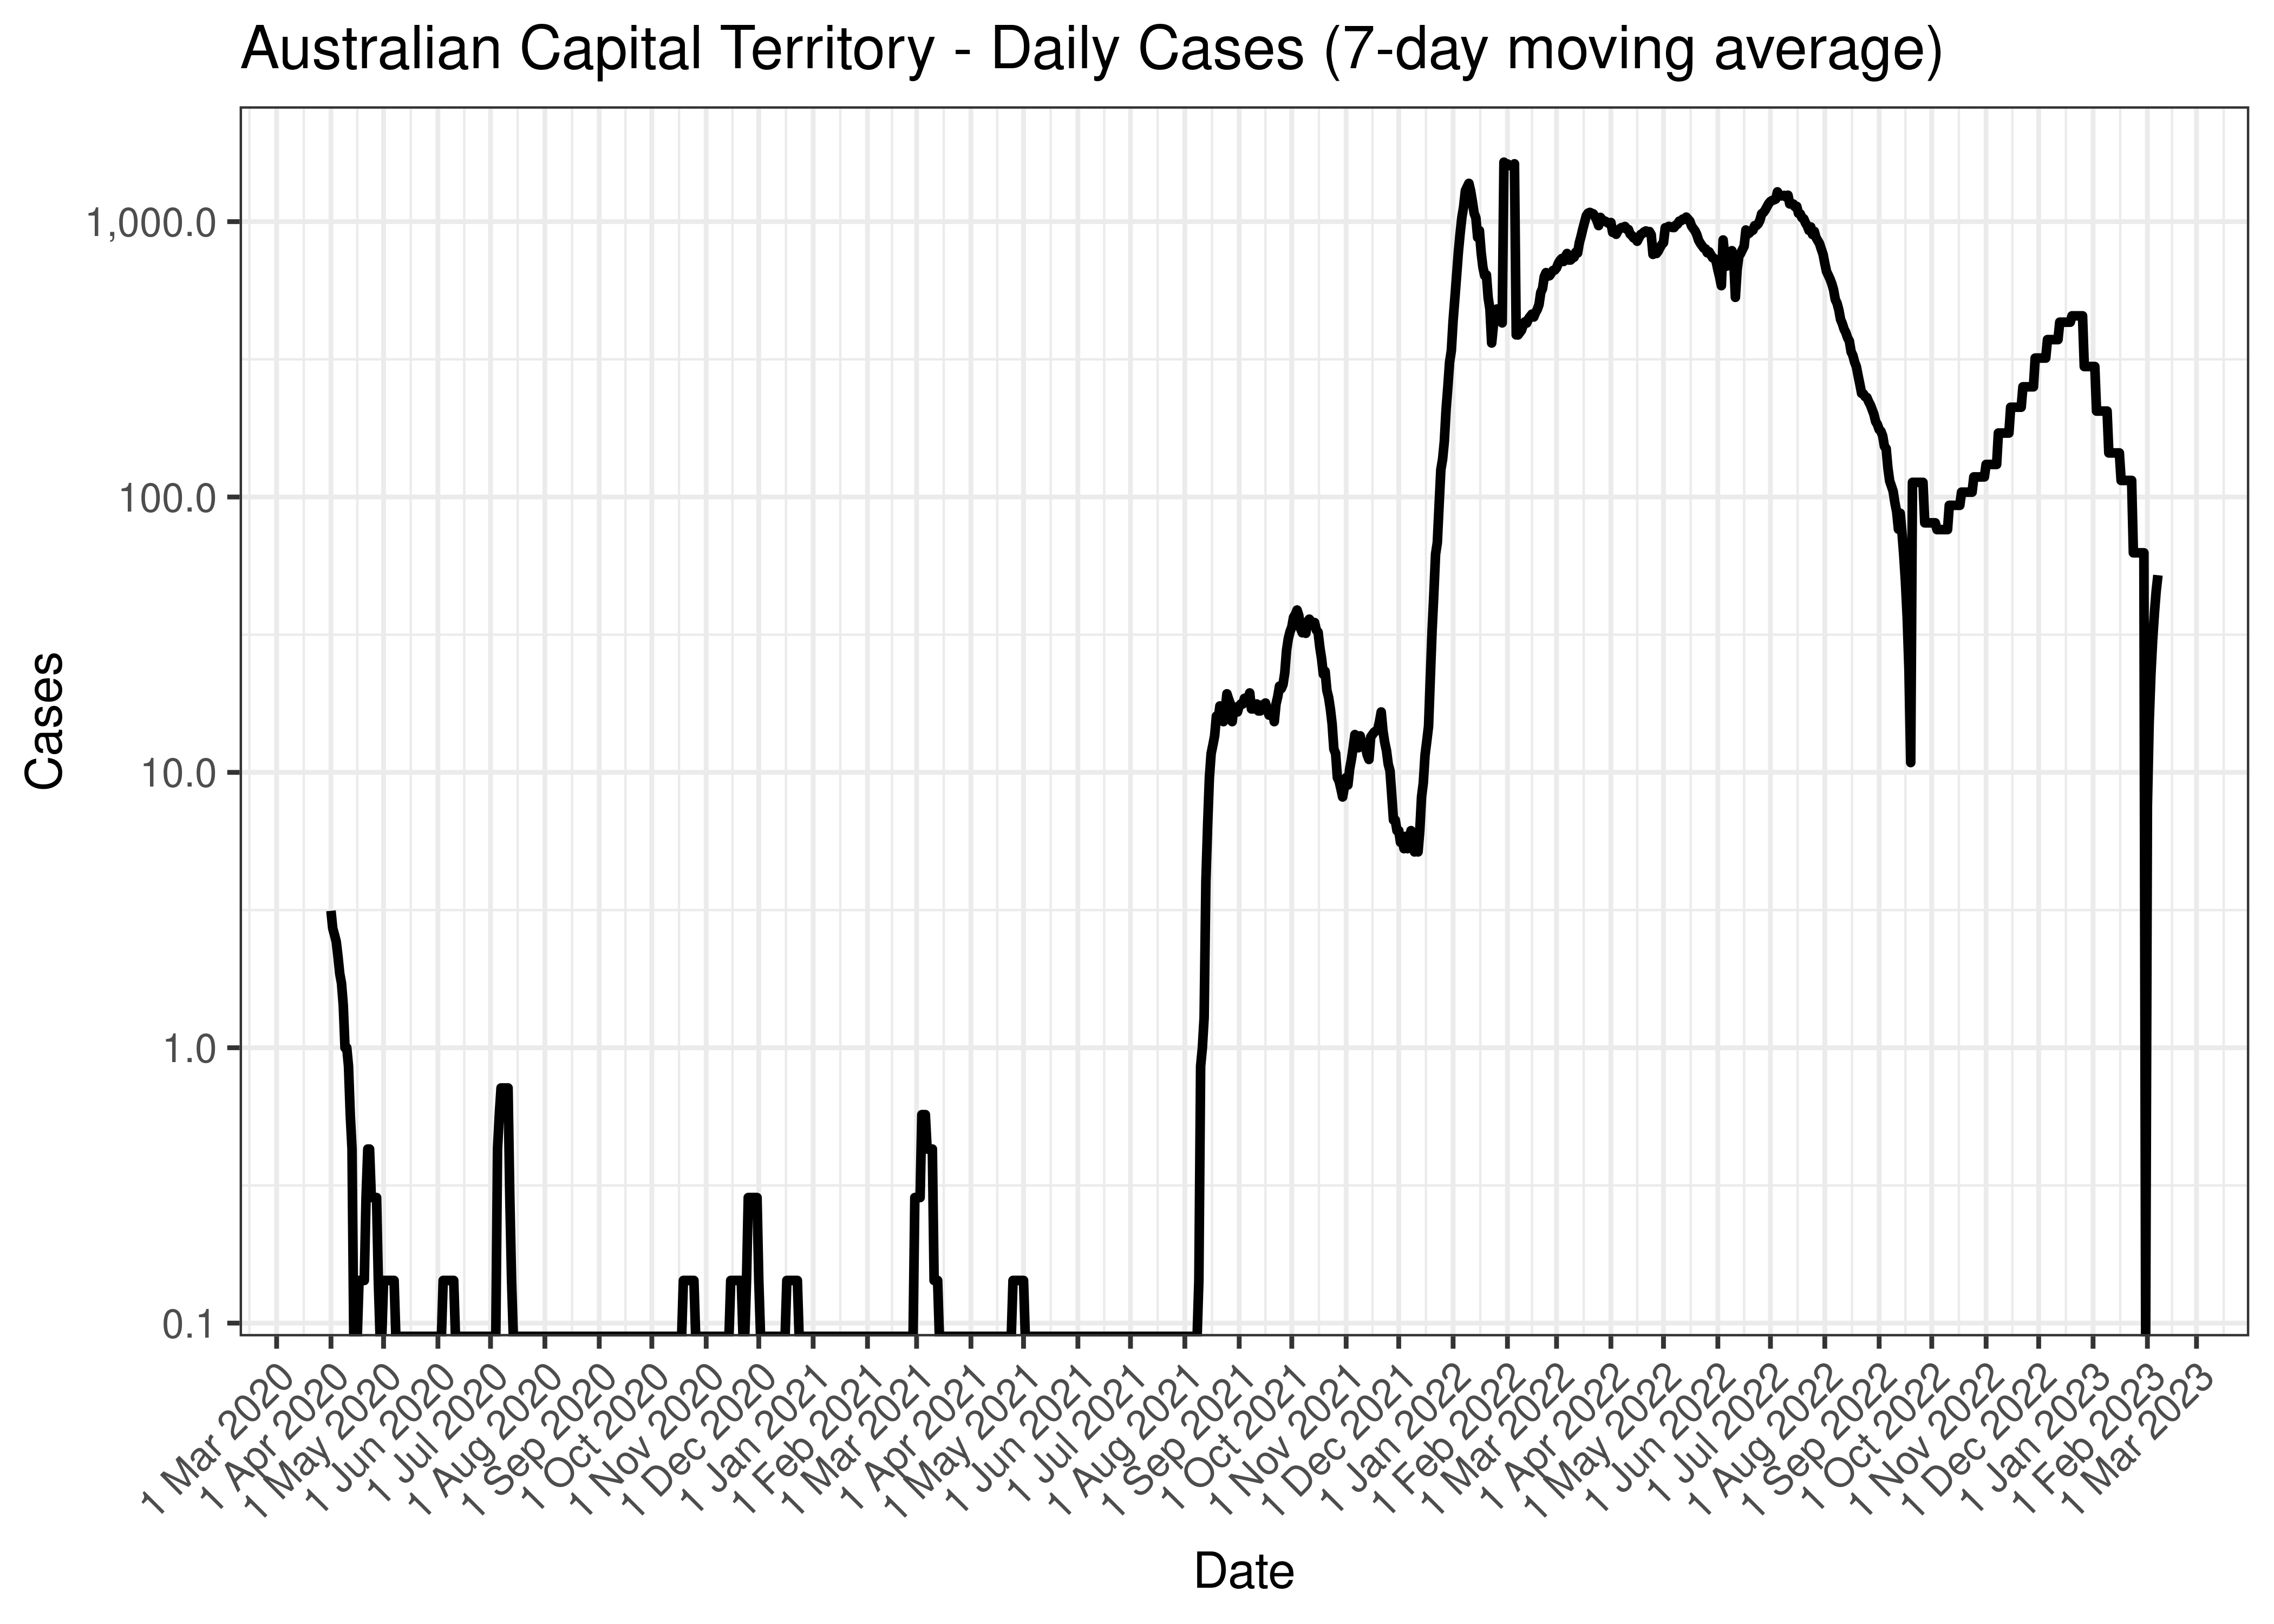
Australian Capital Territory - Daily Cases (7-day moving average)
Below the above chart is repeated for the last 30-days:
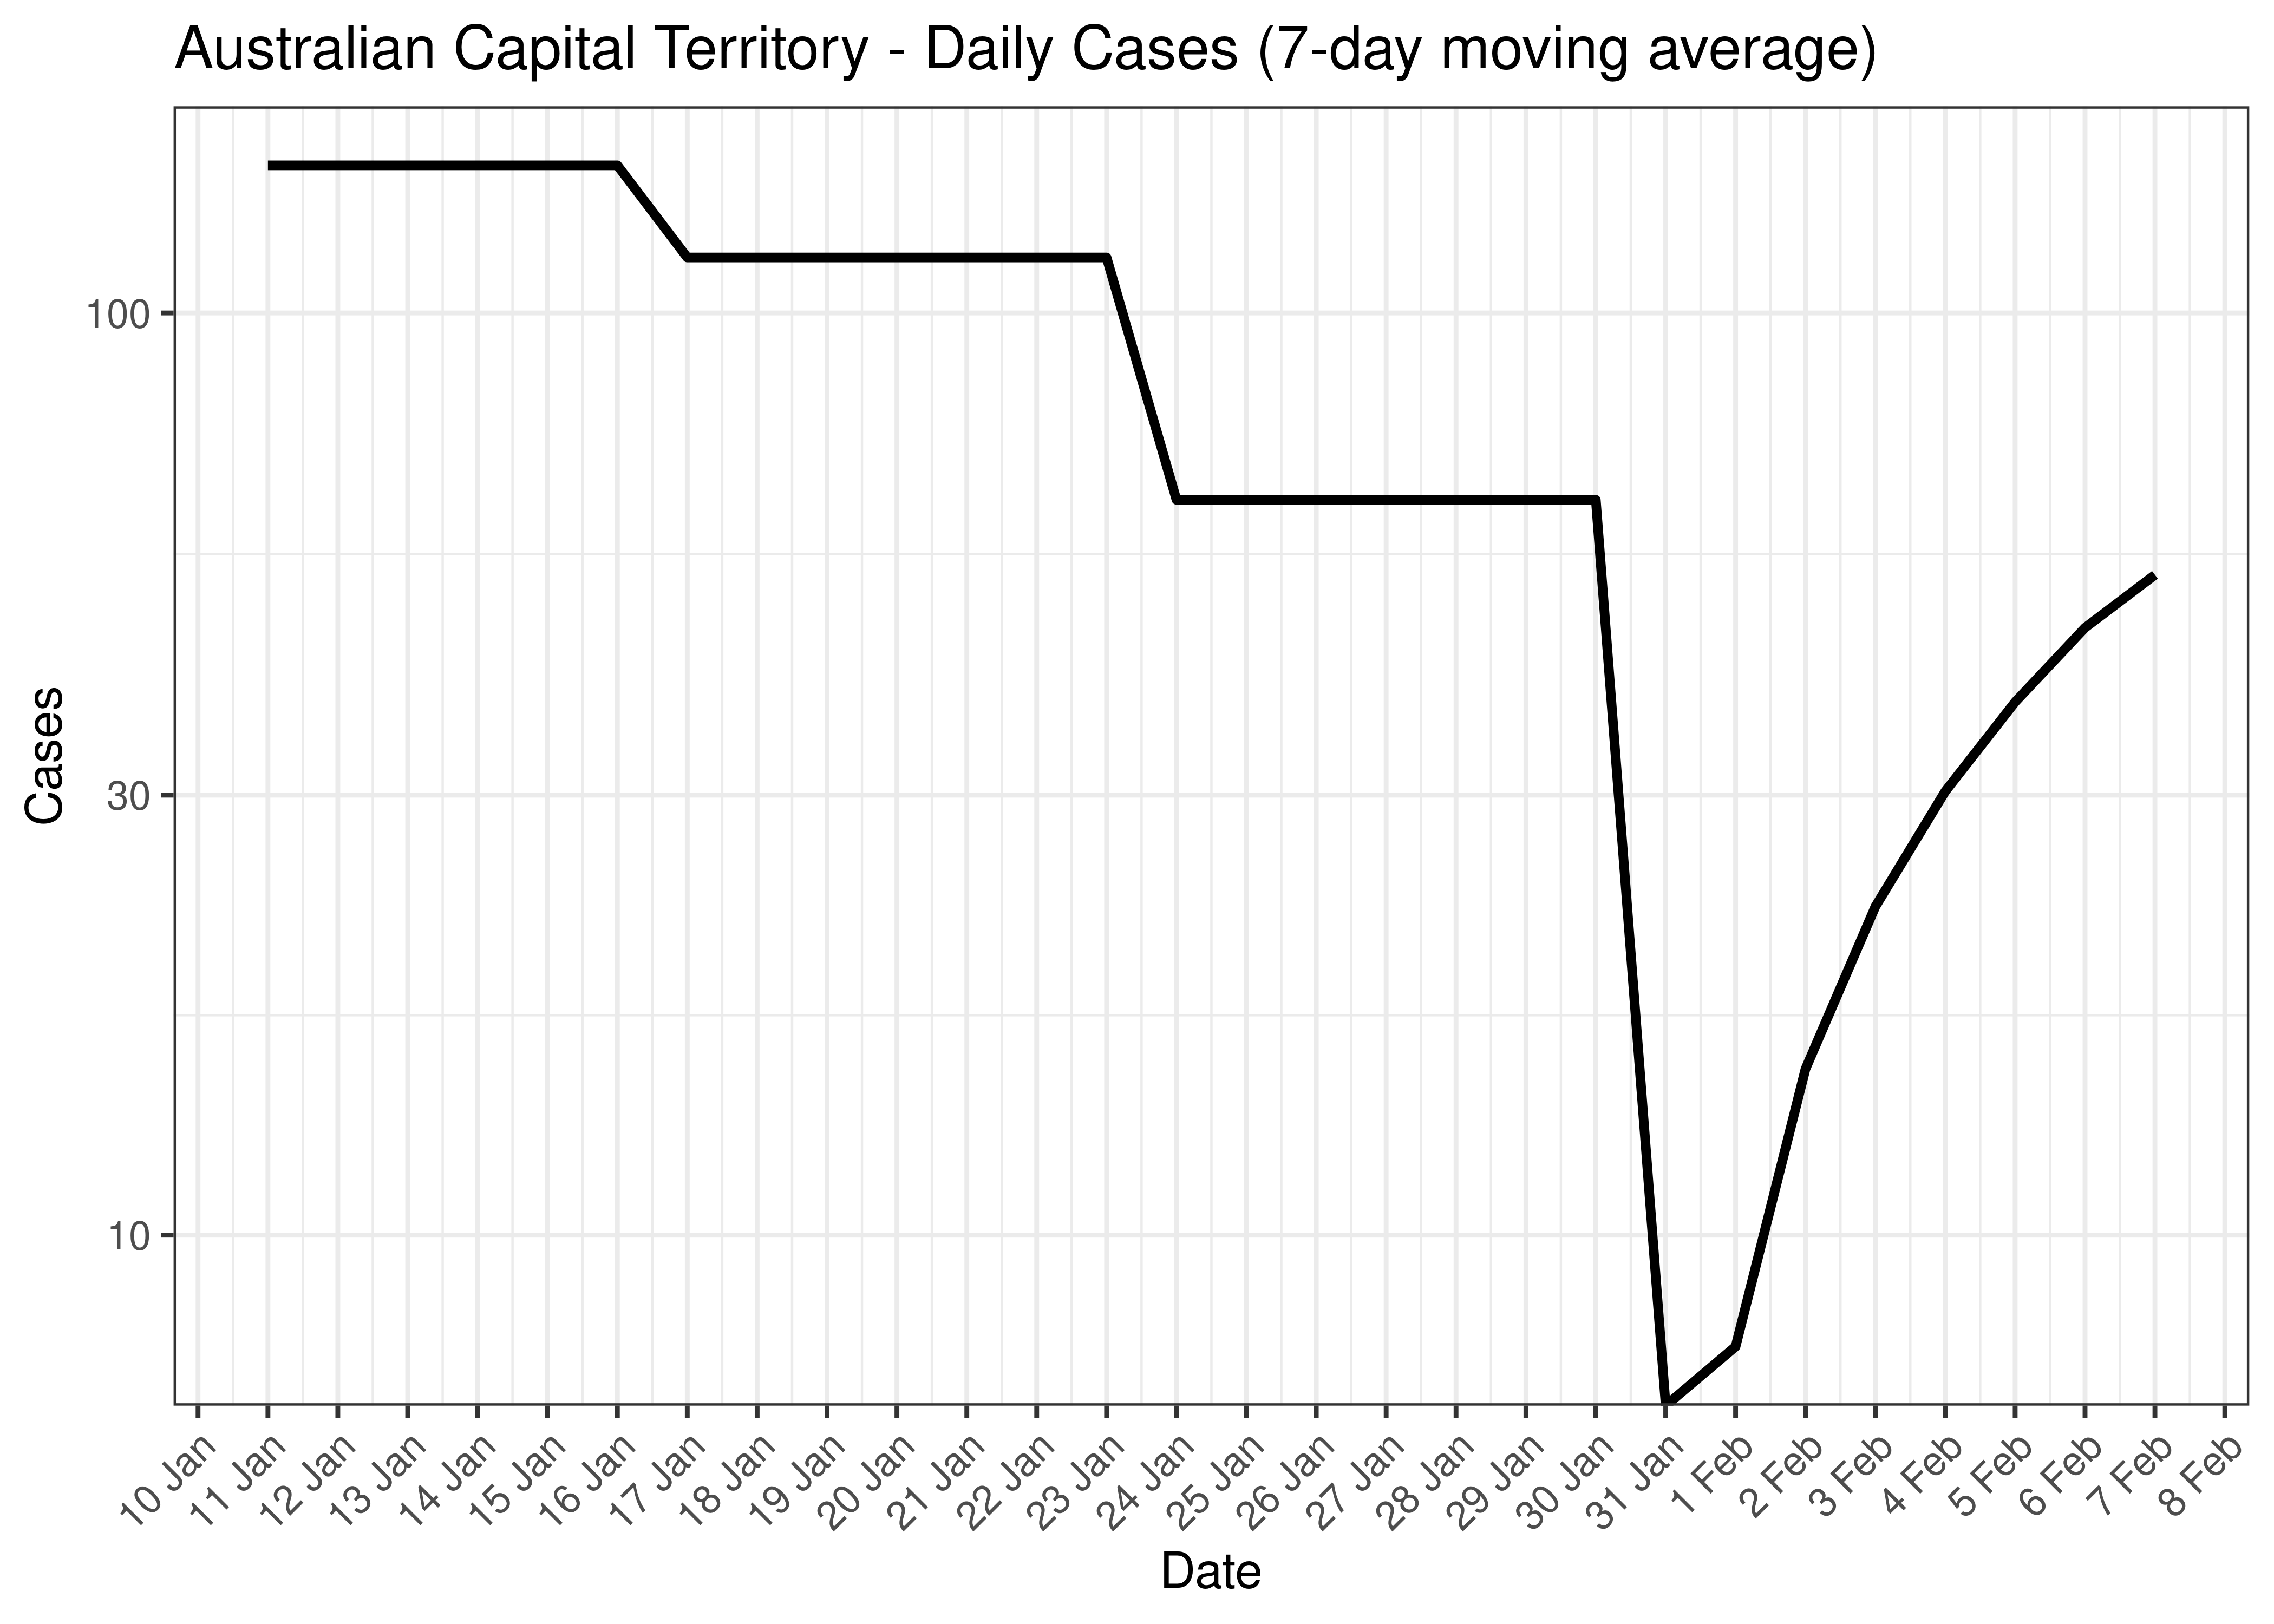
Australian Capital Territory - Daily Cases for Last 30-days (7-day moving average)
5.2.3 Hospitlisation
Counts of those in hospital are tabulated by report date below. A centred 7-day moving average is also shown. The peak daily admissions in previous waves (as measured by the moving average) is also shown.
| Date | In Hospital | 7-day Moving Average | Comment |
|---|---|---|---|
| 2021-10-22 | 20 | 20 | Wave 3 Peak |
| 2022-07-19 | 170 | 163 | Wave 4 Peak (to date) |
| 2023-02-03 | 0 | 0 | |
| 2023-02-04 | 0 | 0 | |
| 2023-02-05 | 0 | 0 | |
| 2023-02-06 | 0 | 0 | |
| 2023-02-07 | 0 | NA | |
| 2023-02-08 | 0 | NA | |
| 2023-02-09 | 0 | NA | |
| 2023-02-10 | NA | NA |
The above are based on the following dates:
- Wave 1 started on 2020-01-01.
- Wave 2 started on 2020-06-01.
- Wave 3 started on 2021-06-01.
- Wave 4 started on 2021-12-01.
Below a 7-day moving average of daily hospital counts is plotted by on a log scale since start of the epidemic. Note admissions are plotted by date.
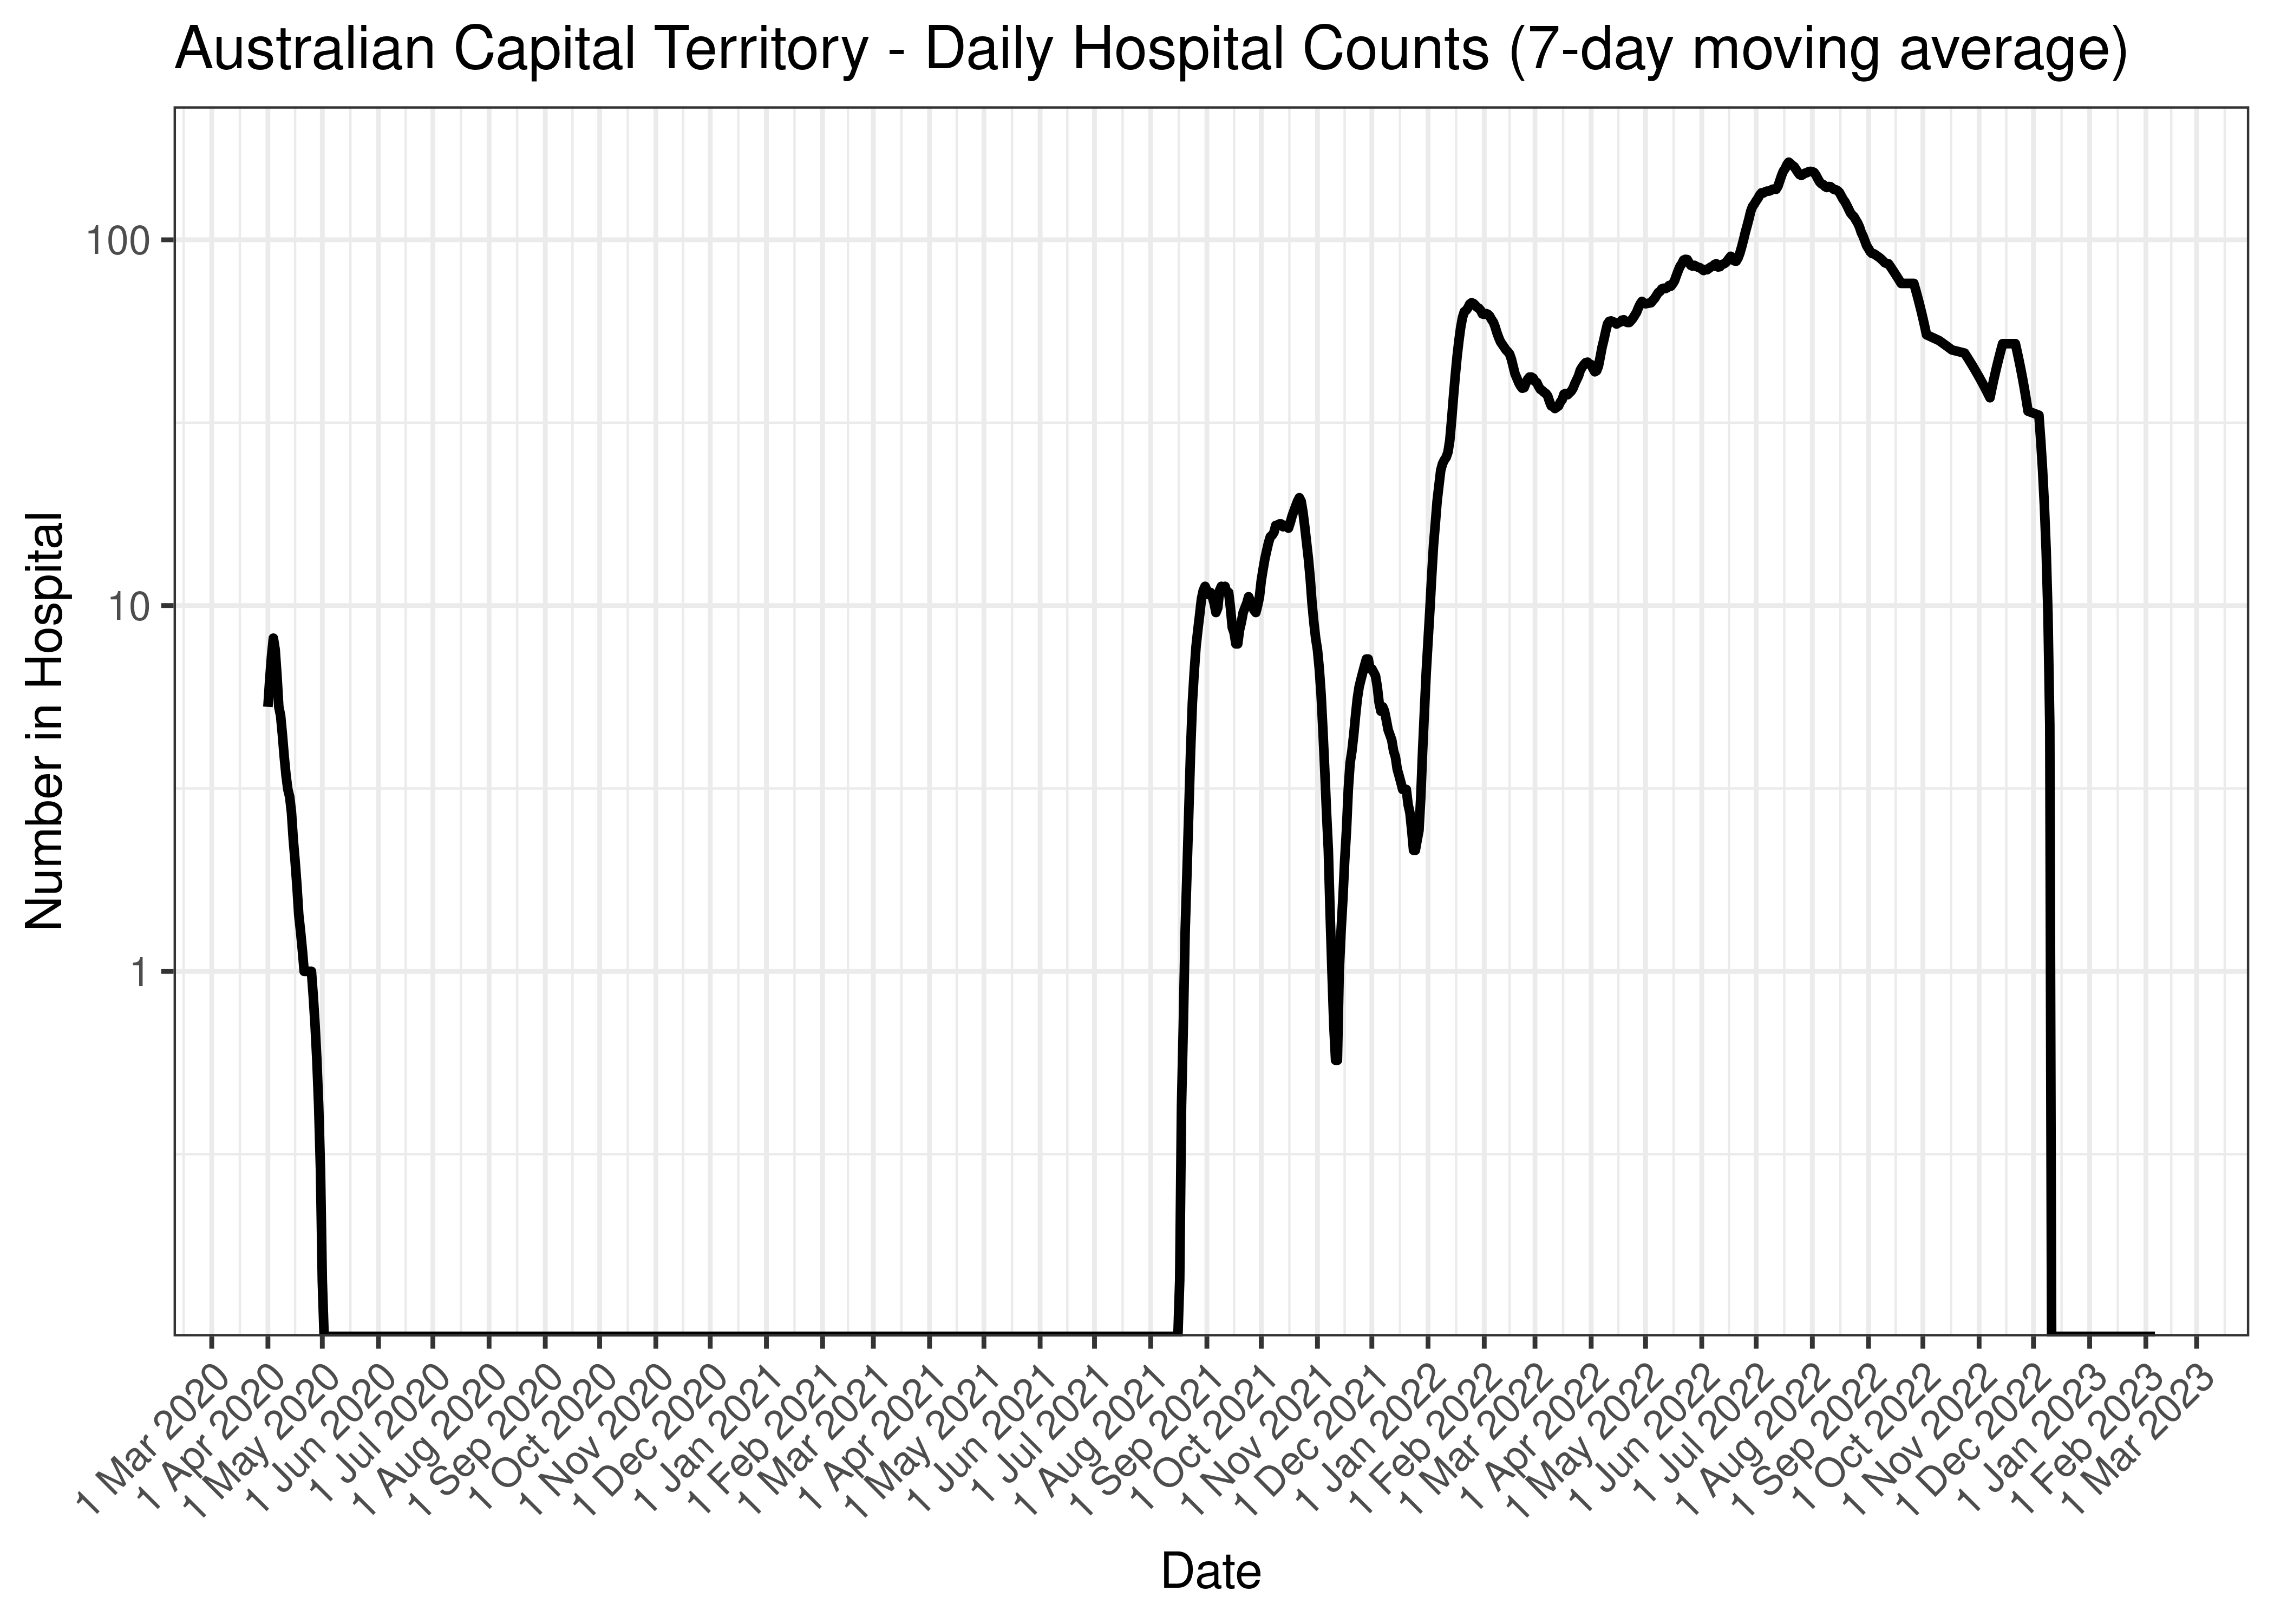
Australian Capital Territory - Daily Hospital Counts (7-day moving average)
Below the above chart is repeated for the last 30-days:
Australian Capital Territory - Daily Hospital Counts for Last 30-days (7-day moving average)
5.2.4 ICU
Counts of those in ICU are tabulated by report date below. A centred 7-day moving average is also shown. The peak daily admissions in previous waves (as measured by the moving average) is also shown.
| Date | In ICU | 7-day Moving Average | Comment |
|---|---|---|---|
| 2021-10-22 | 11 | 10 | Wave 3 Peak |
| 2023-02-03 | 0 | 0 | |
| 2023-02-04 | 0 | 0 | |
| 2023-02-05 | 0 | 0 | |
| 2023-02-06 | 0 | 0 | |
| 2023-02-07 | 0 | NA | |
| 2023-02-08 | 0 | NA | |
| 2023-02-09 | 0 | NA | |
| 2023-02-10 | NA | NA |
The above are based on the following dates:
- Wave 1 started on 2020-01-01.
- Wave 2 started on 2020-06-01.
- Wave 3 started on 2021-06-01.
- Wave 4 started on 2021-12-01.
Below a 7-day moving average of daily ICU counts is plotted by on a log scale since start of the epidemic. Note admissions are plotted by date.
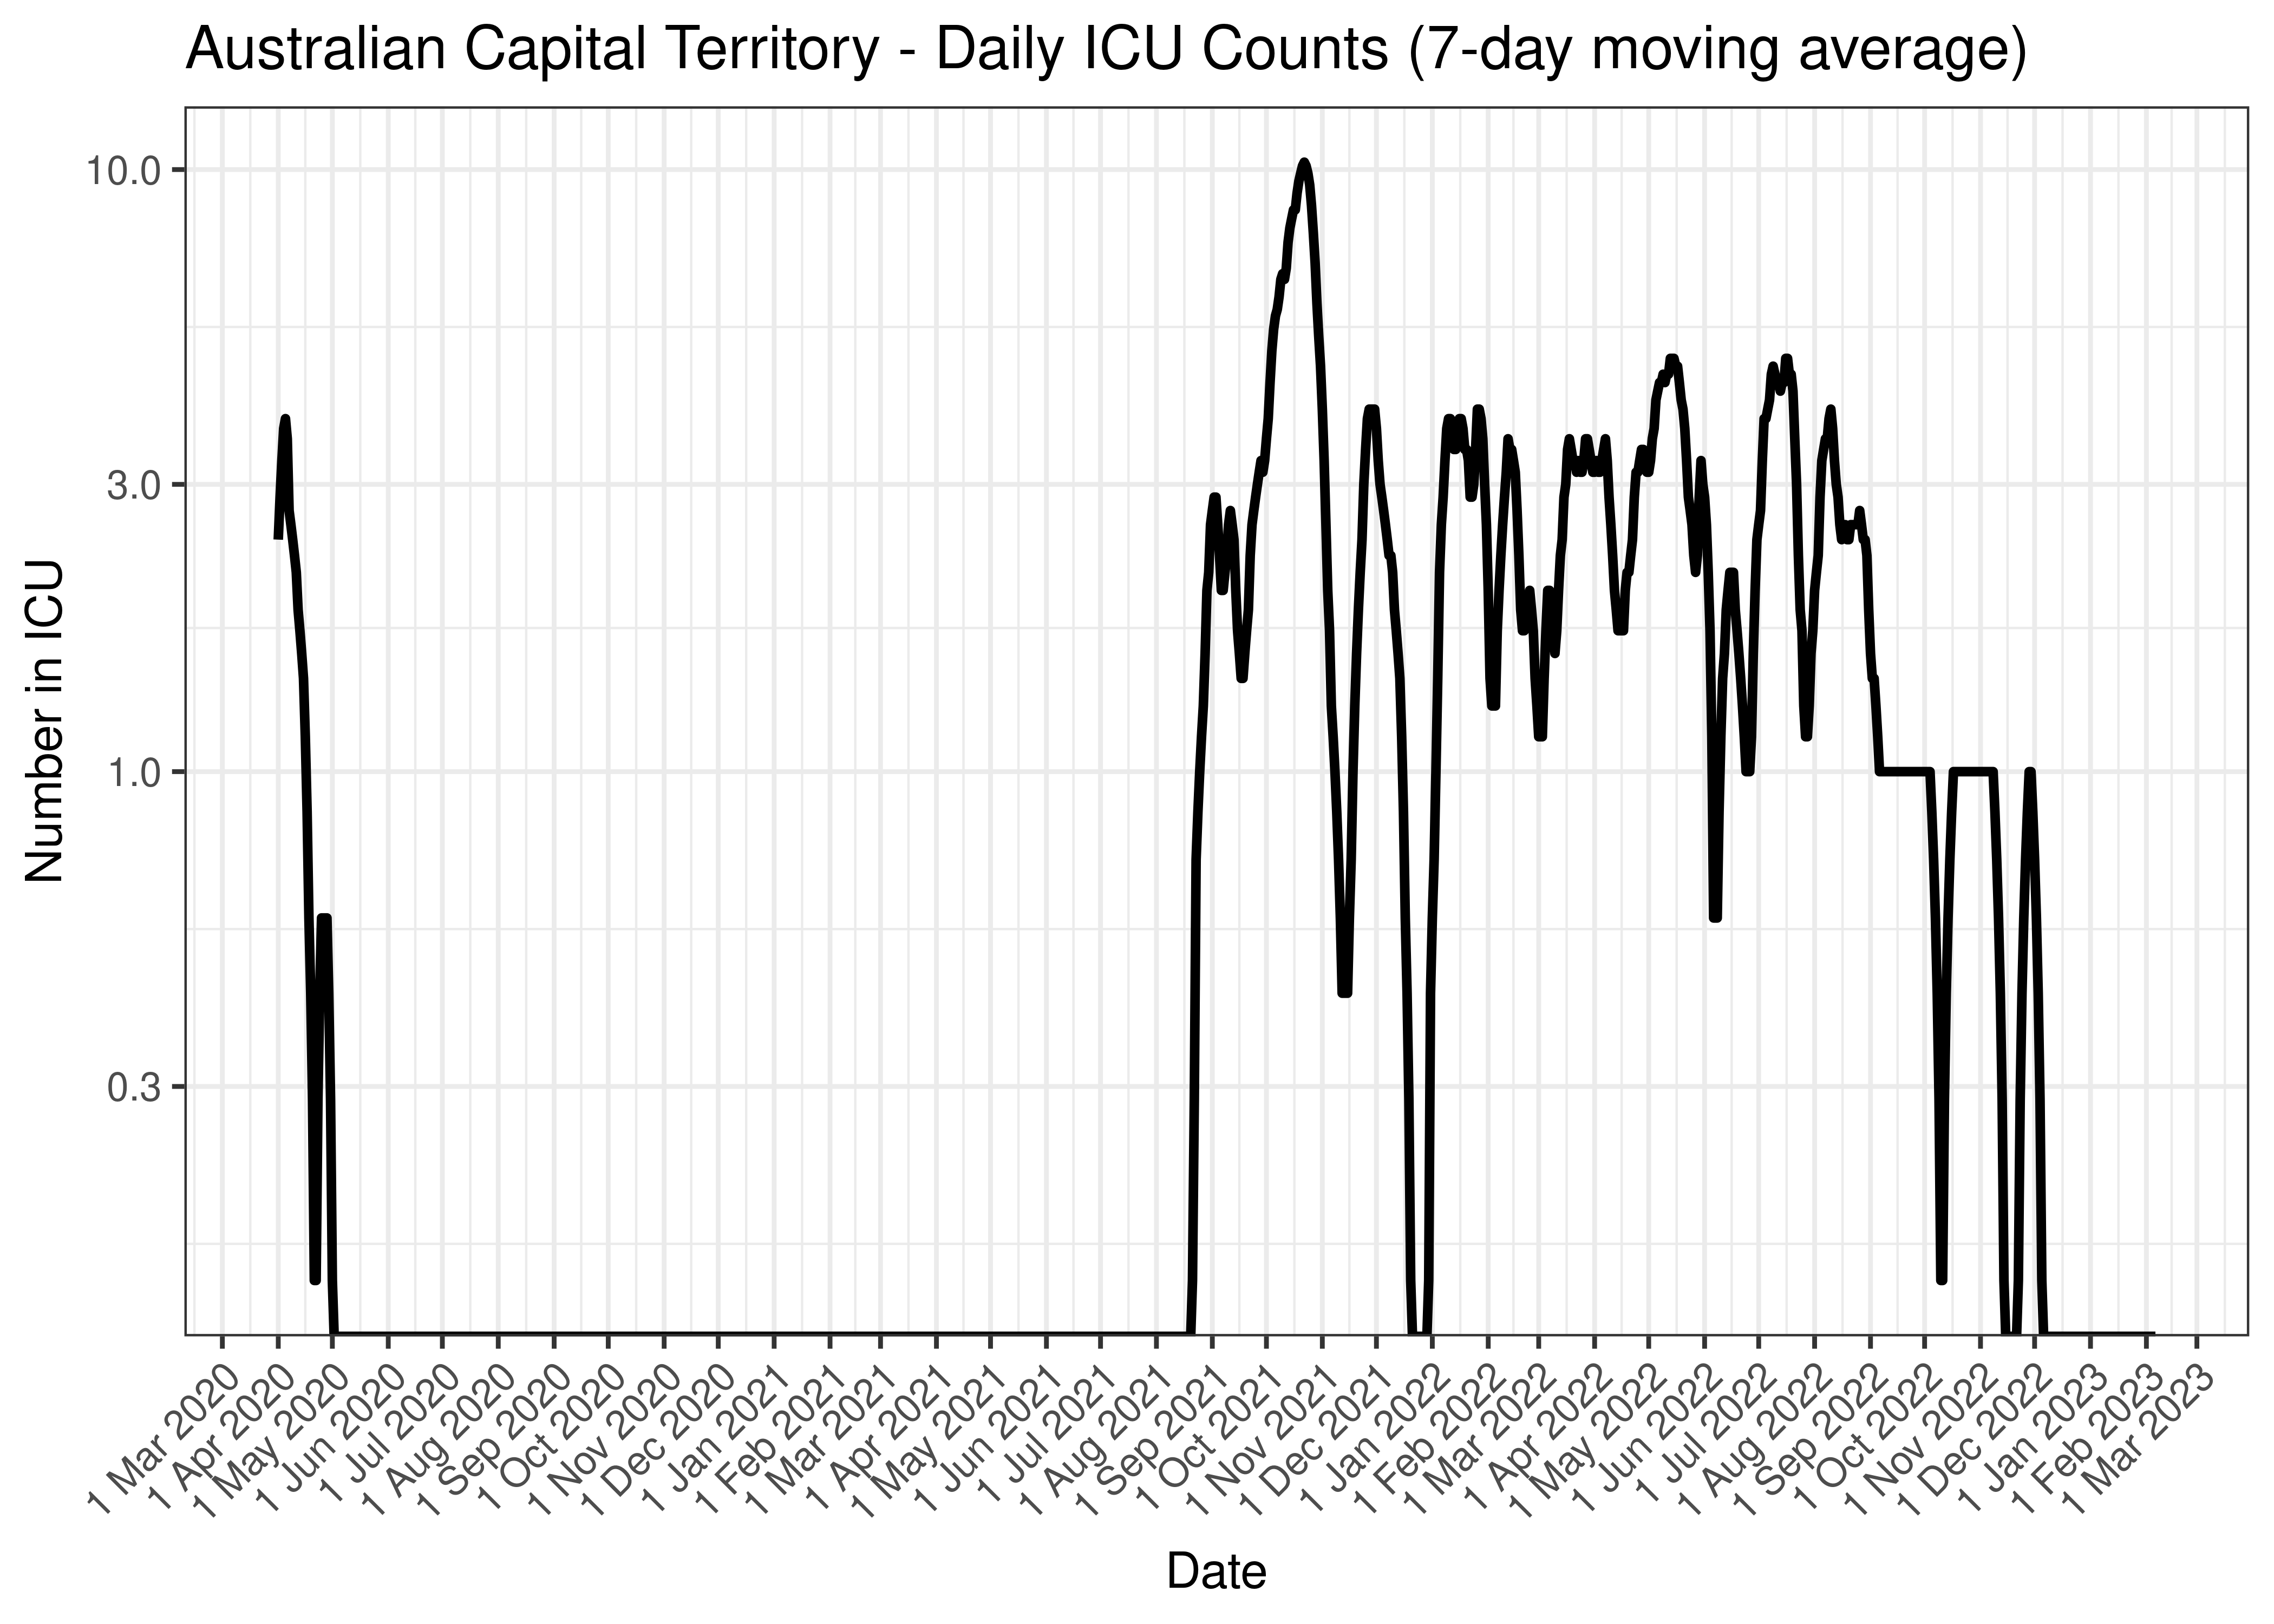
Australian Capital Territory - Daily ICU Counts (7-day moving average)
Below the above chart is repeated for the last 30-days:
Australian Capital Territory - Daily ICU Counts for Last 30-days (7-day moving average)
5.2.5 Ventilator
Counts of those on ventilators are tabulated by report date below. A centred 7-day moving average is also shown. The peak daily admissions in previous waves (as measured by the moving average) is also shown.
| Date | On Ventilators | 7-day Moving Average | Comment |
|---|---|---|---|
| 2023-02-03 | 0 | 0 | |
| 2023-02-04 | 0 | 0 | |
| 2023-02-05 | 0 | 0 | |
| 2023-02-06 | 0 | 0 | |
| 2023-02-07 | 0 | NA | |
| 2023-02-08 | 0 | NA | |
| 2023-02-09 | 0 | NA | |
| 2023-02-10 | NA | NA |
The above are based on the following dates:
- Wave 1 started on 2020-01-01.
- Wave 2 started on 2020-06-01.
- Wave 3 started on 2021-06-01.
- Wave 4 started on 2021-12-01.
Below a 7-day moving average of daily ventilator counts is plotted by on a log scale since start of the epidemic. Note admissions are plotted by date.
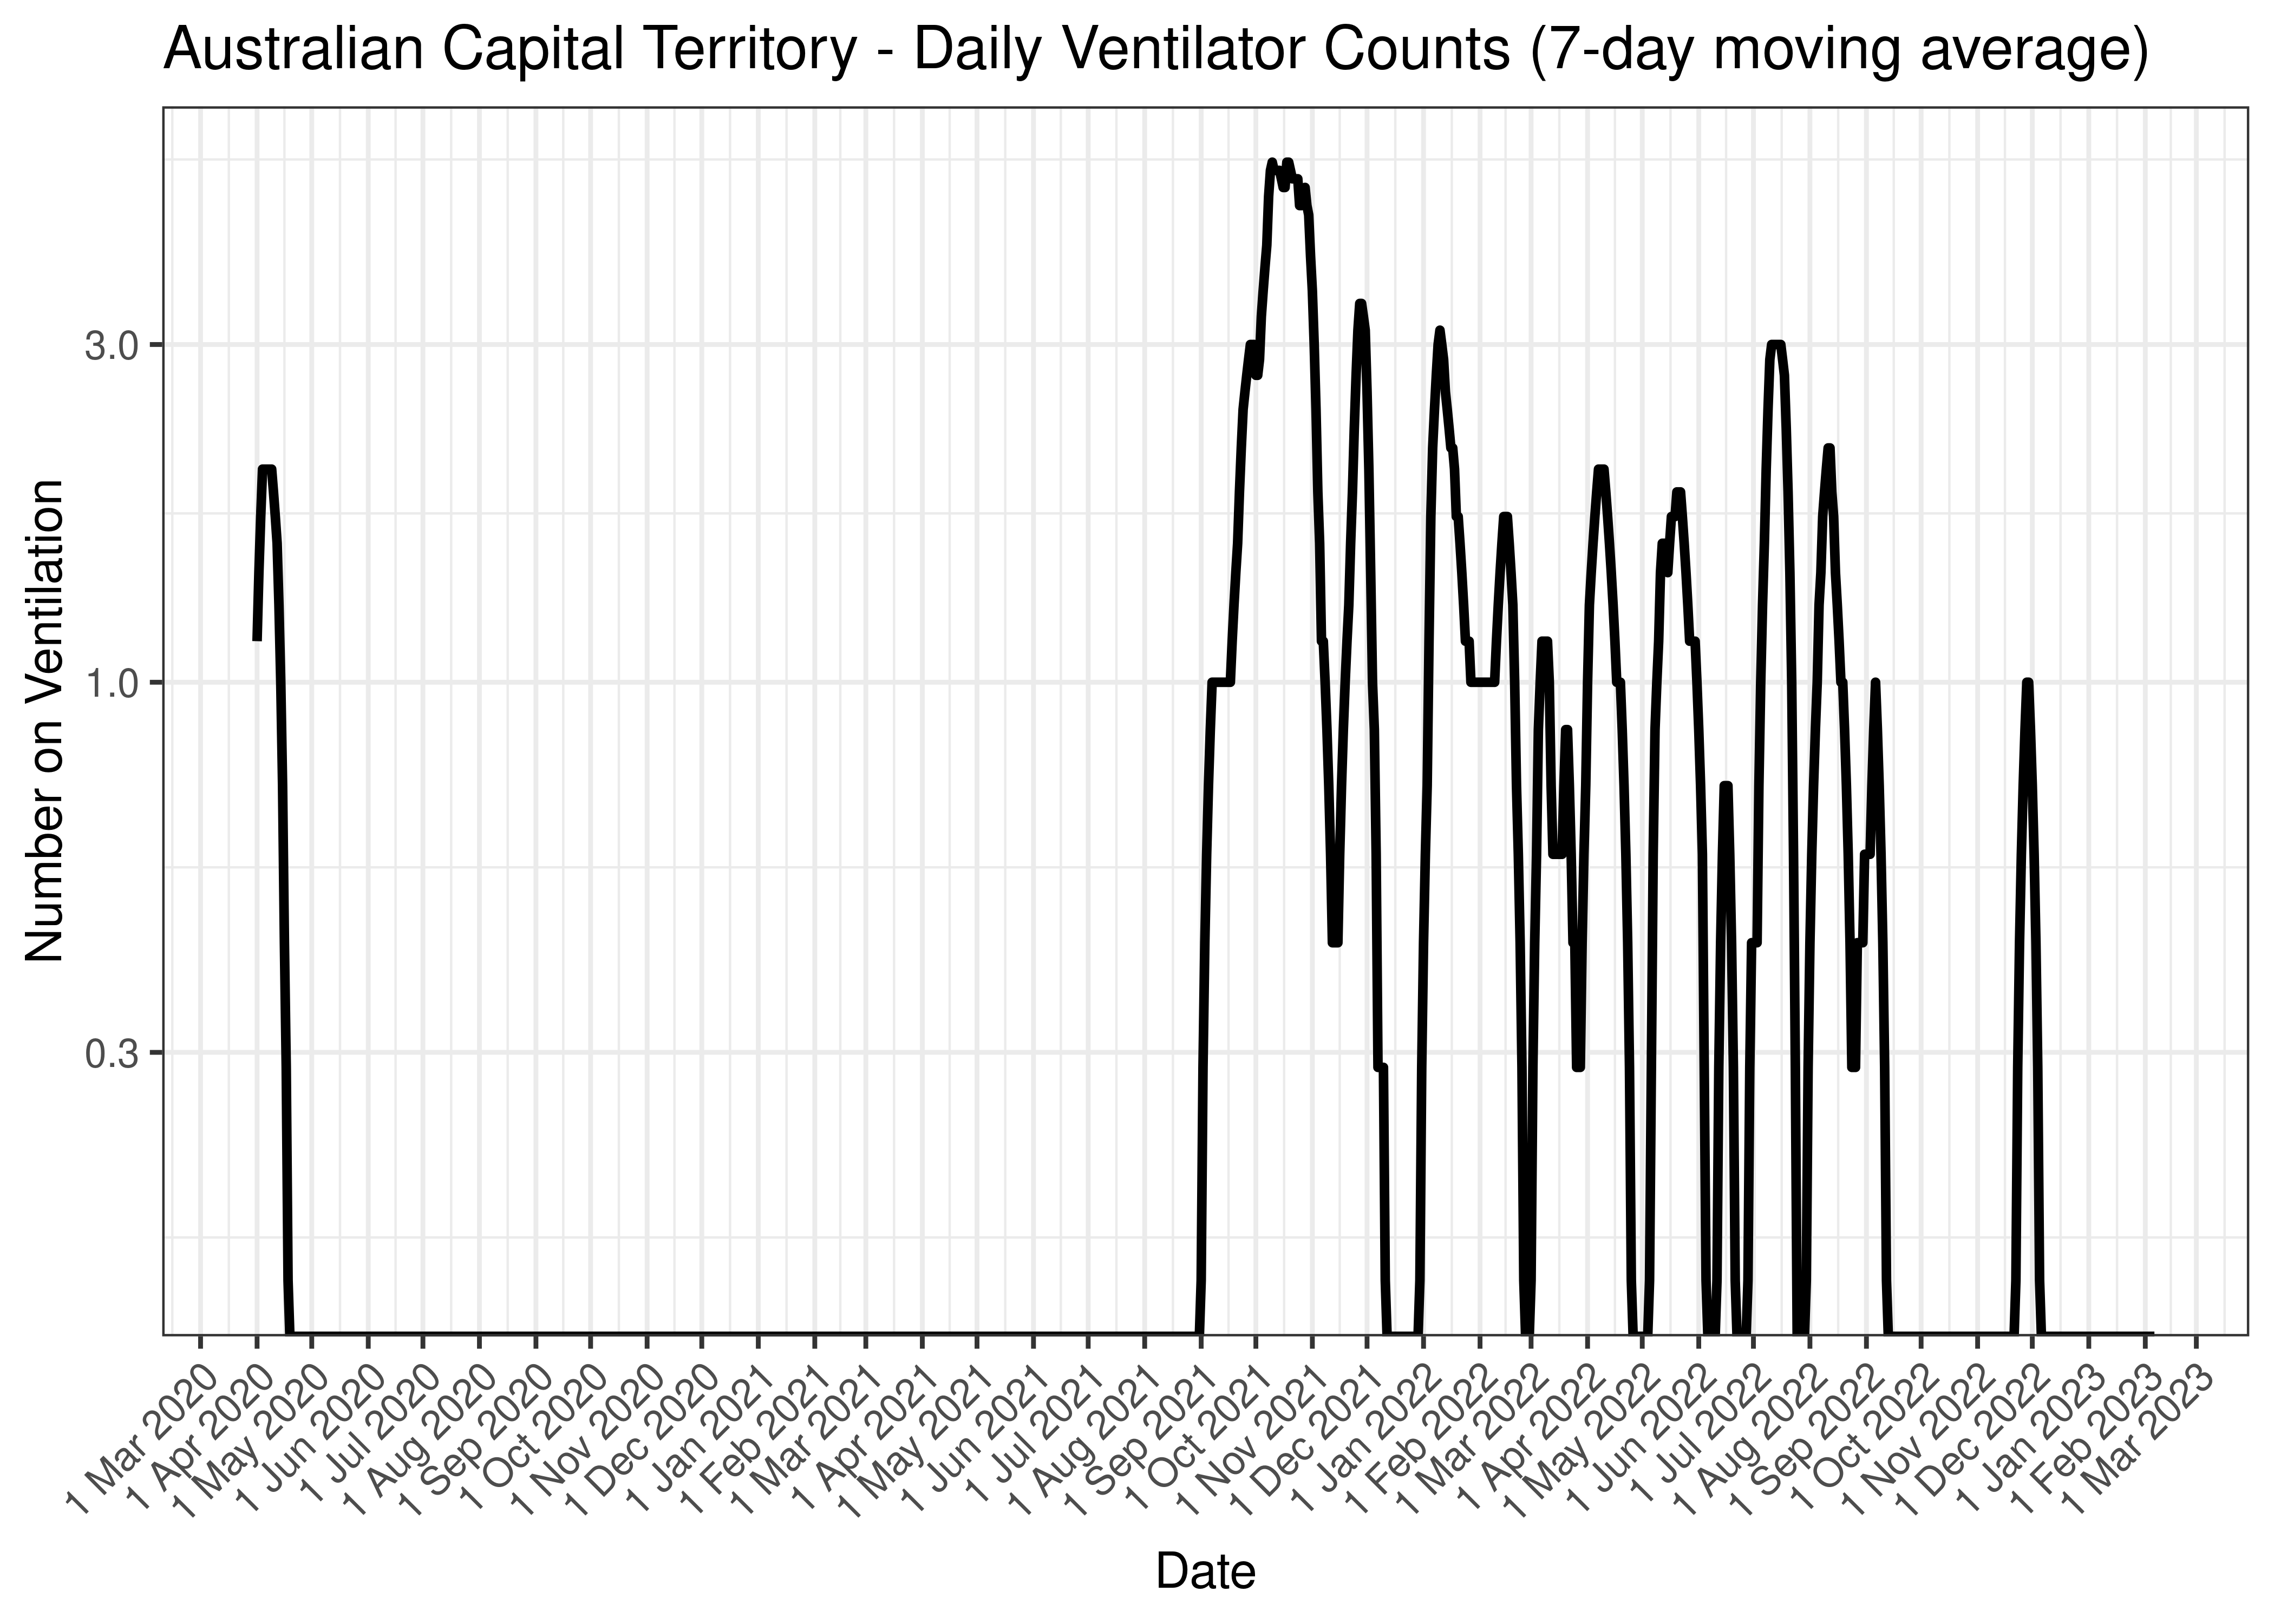
Australian Capital Territory - Daily Ventilator Counts (7-day moving average)
Below the above chart is repeated for the last 30-days:

Australian Capital Territory - Daily Ventilator Counts for Last 30-days (7-day moving average)
5.2.6 Deaths
Deaths are tabulated by report date below. A centred 7-day moving average is also shown. The peak daily deaths in previous waves (as measured by the moving average) is also shown.
| Date | Deaths | 7-day Moving Average | Comment |
|---|---|---|---|
| 2023-02-03 | 5 | 1 | |
| 2023-02-04 | 0 | 1 | |
| 2023-02-05 | 0 | 1 | |
| 2023-02-06 | 0 | 1 | |
| 2023-02-07 | 0 | 0 | |
| 2023-02-08 | 0 | NA | |
| 2023-02-09 | 0 | NA | |
| 2023-02-10 | 0 | NA |
The above are based on the following dates:
- Wave 1 started on 2020-01-01.
- Wave 2 started on 2020-06-01.
- Wave 3 started on 2021-06-01.
- Wave 4 started on 2021-12-01.
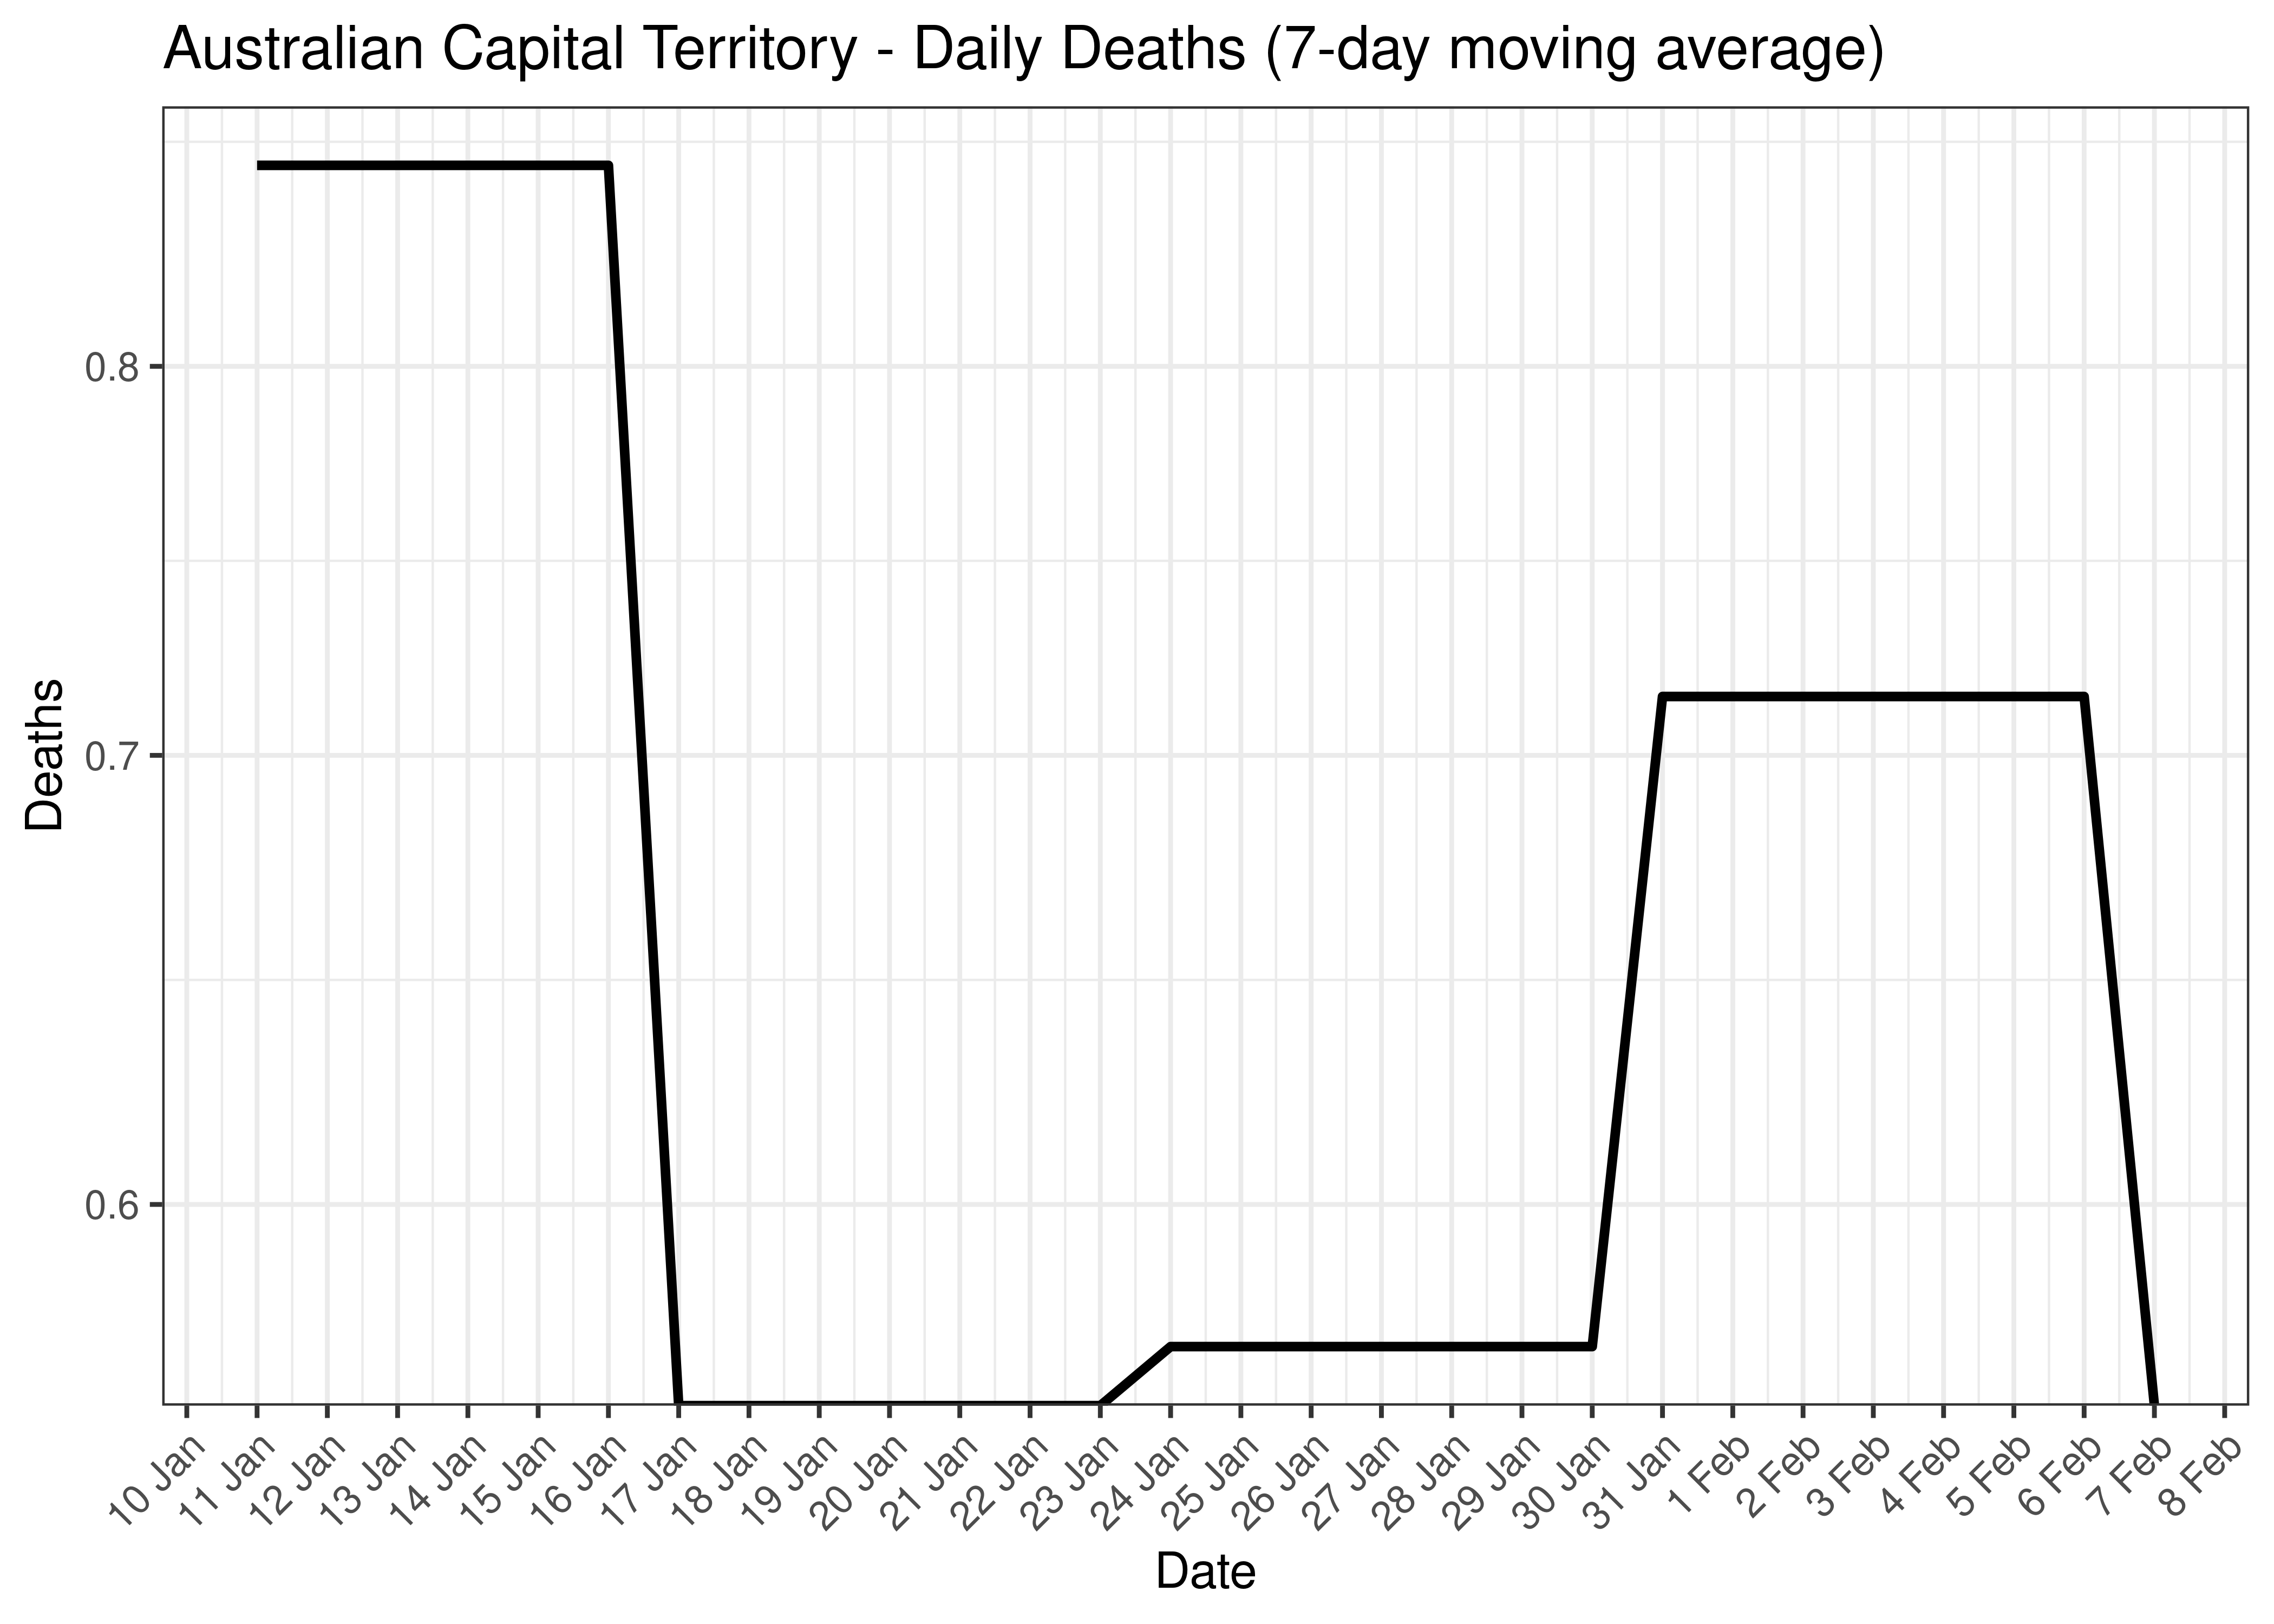
Below a 7-day moving average of daily deaths is plotted by on a log scale since start of the epidemic.
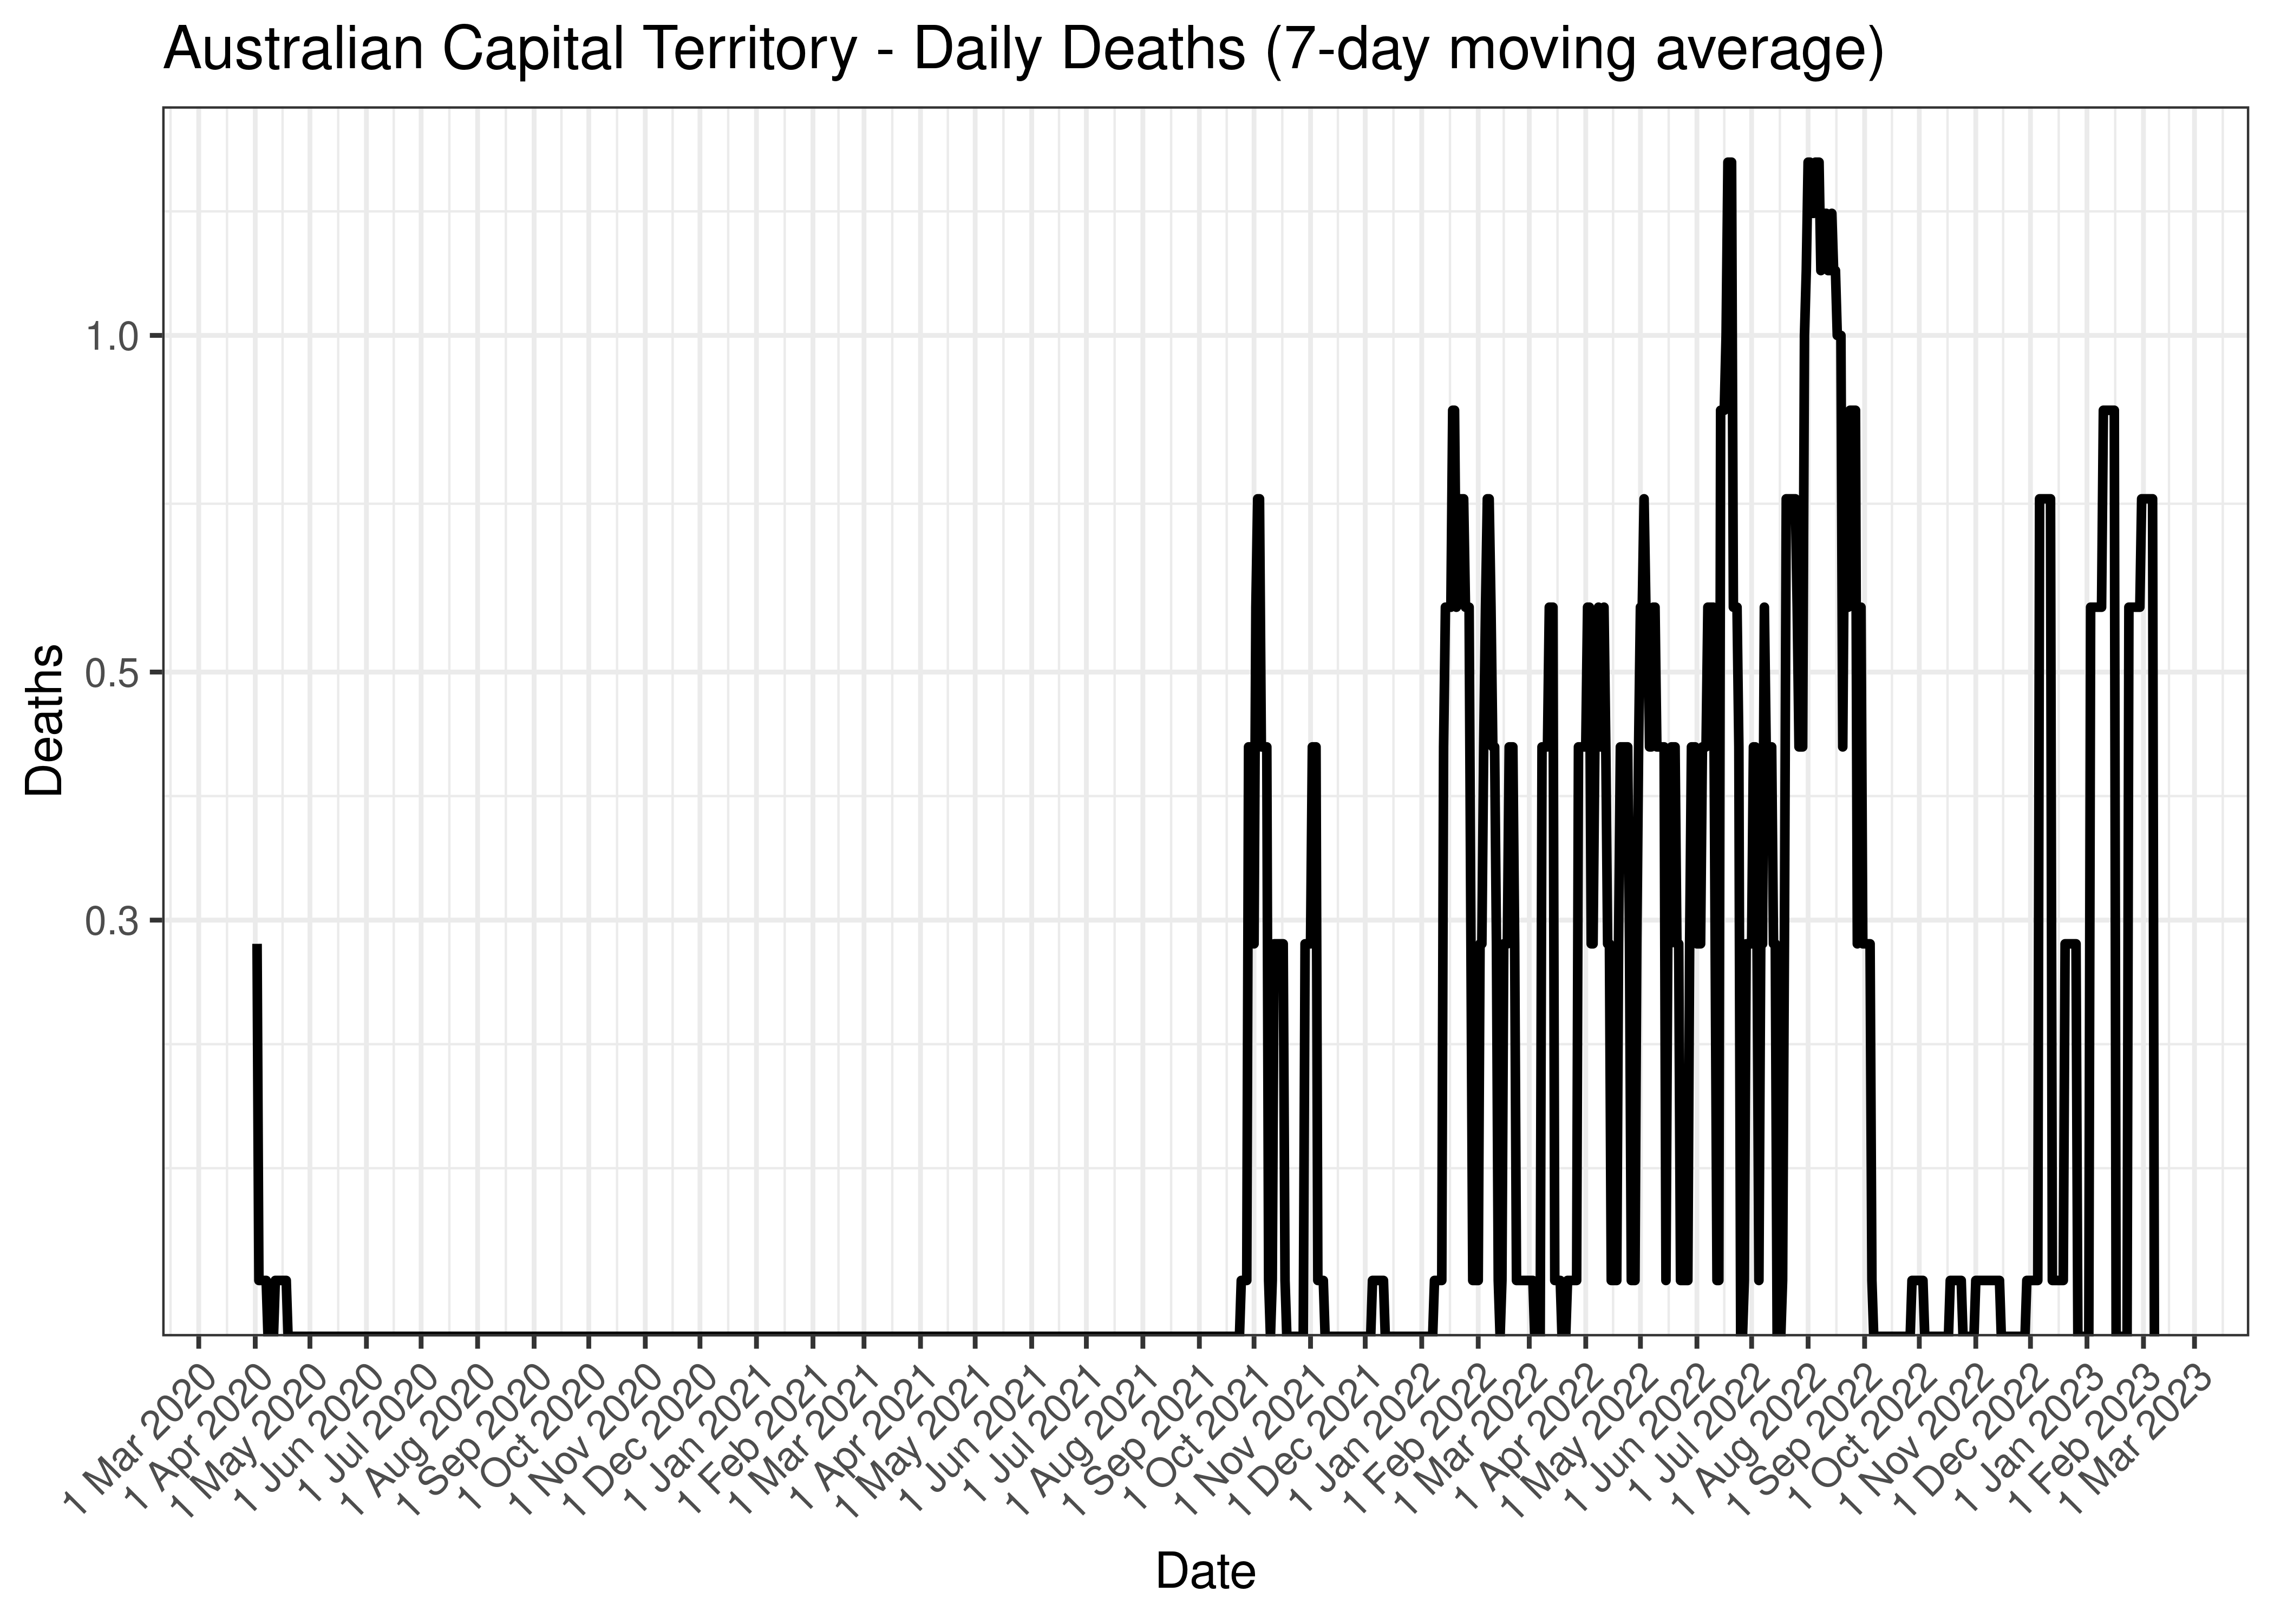
Australian Capital Territory - Daily Deaths (7-day moving average)
Below the above chart is repeated for the last 30-days:
Australian Capital Territory - Daily Deaths for Last 30-days (7-day moving average)
5.2.7 Cases, Hospital Counts and Deaths Combined
Below a 7-day moving average daily case, hospital counts and deaths are plotted by state on a log scale since start of the epidemic. Note admissions and excess deaths are plotted by date, whereas cases are plotted by specimen received date.
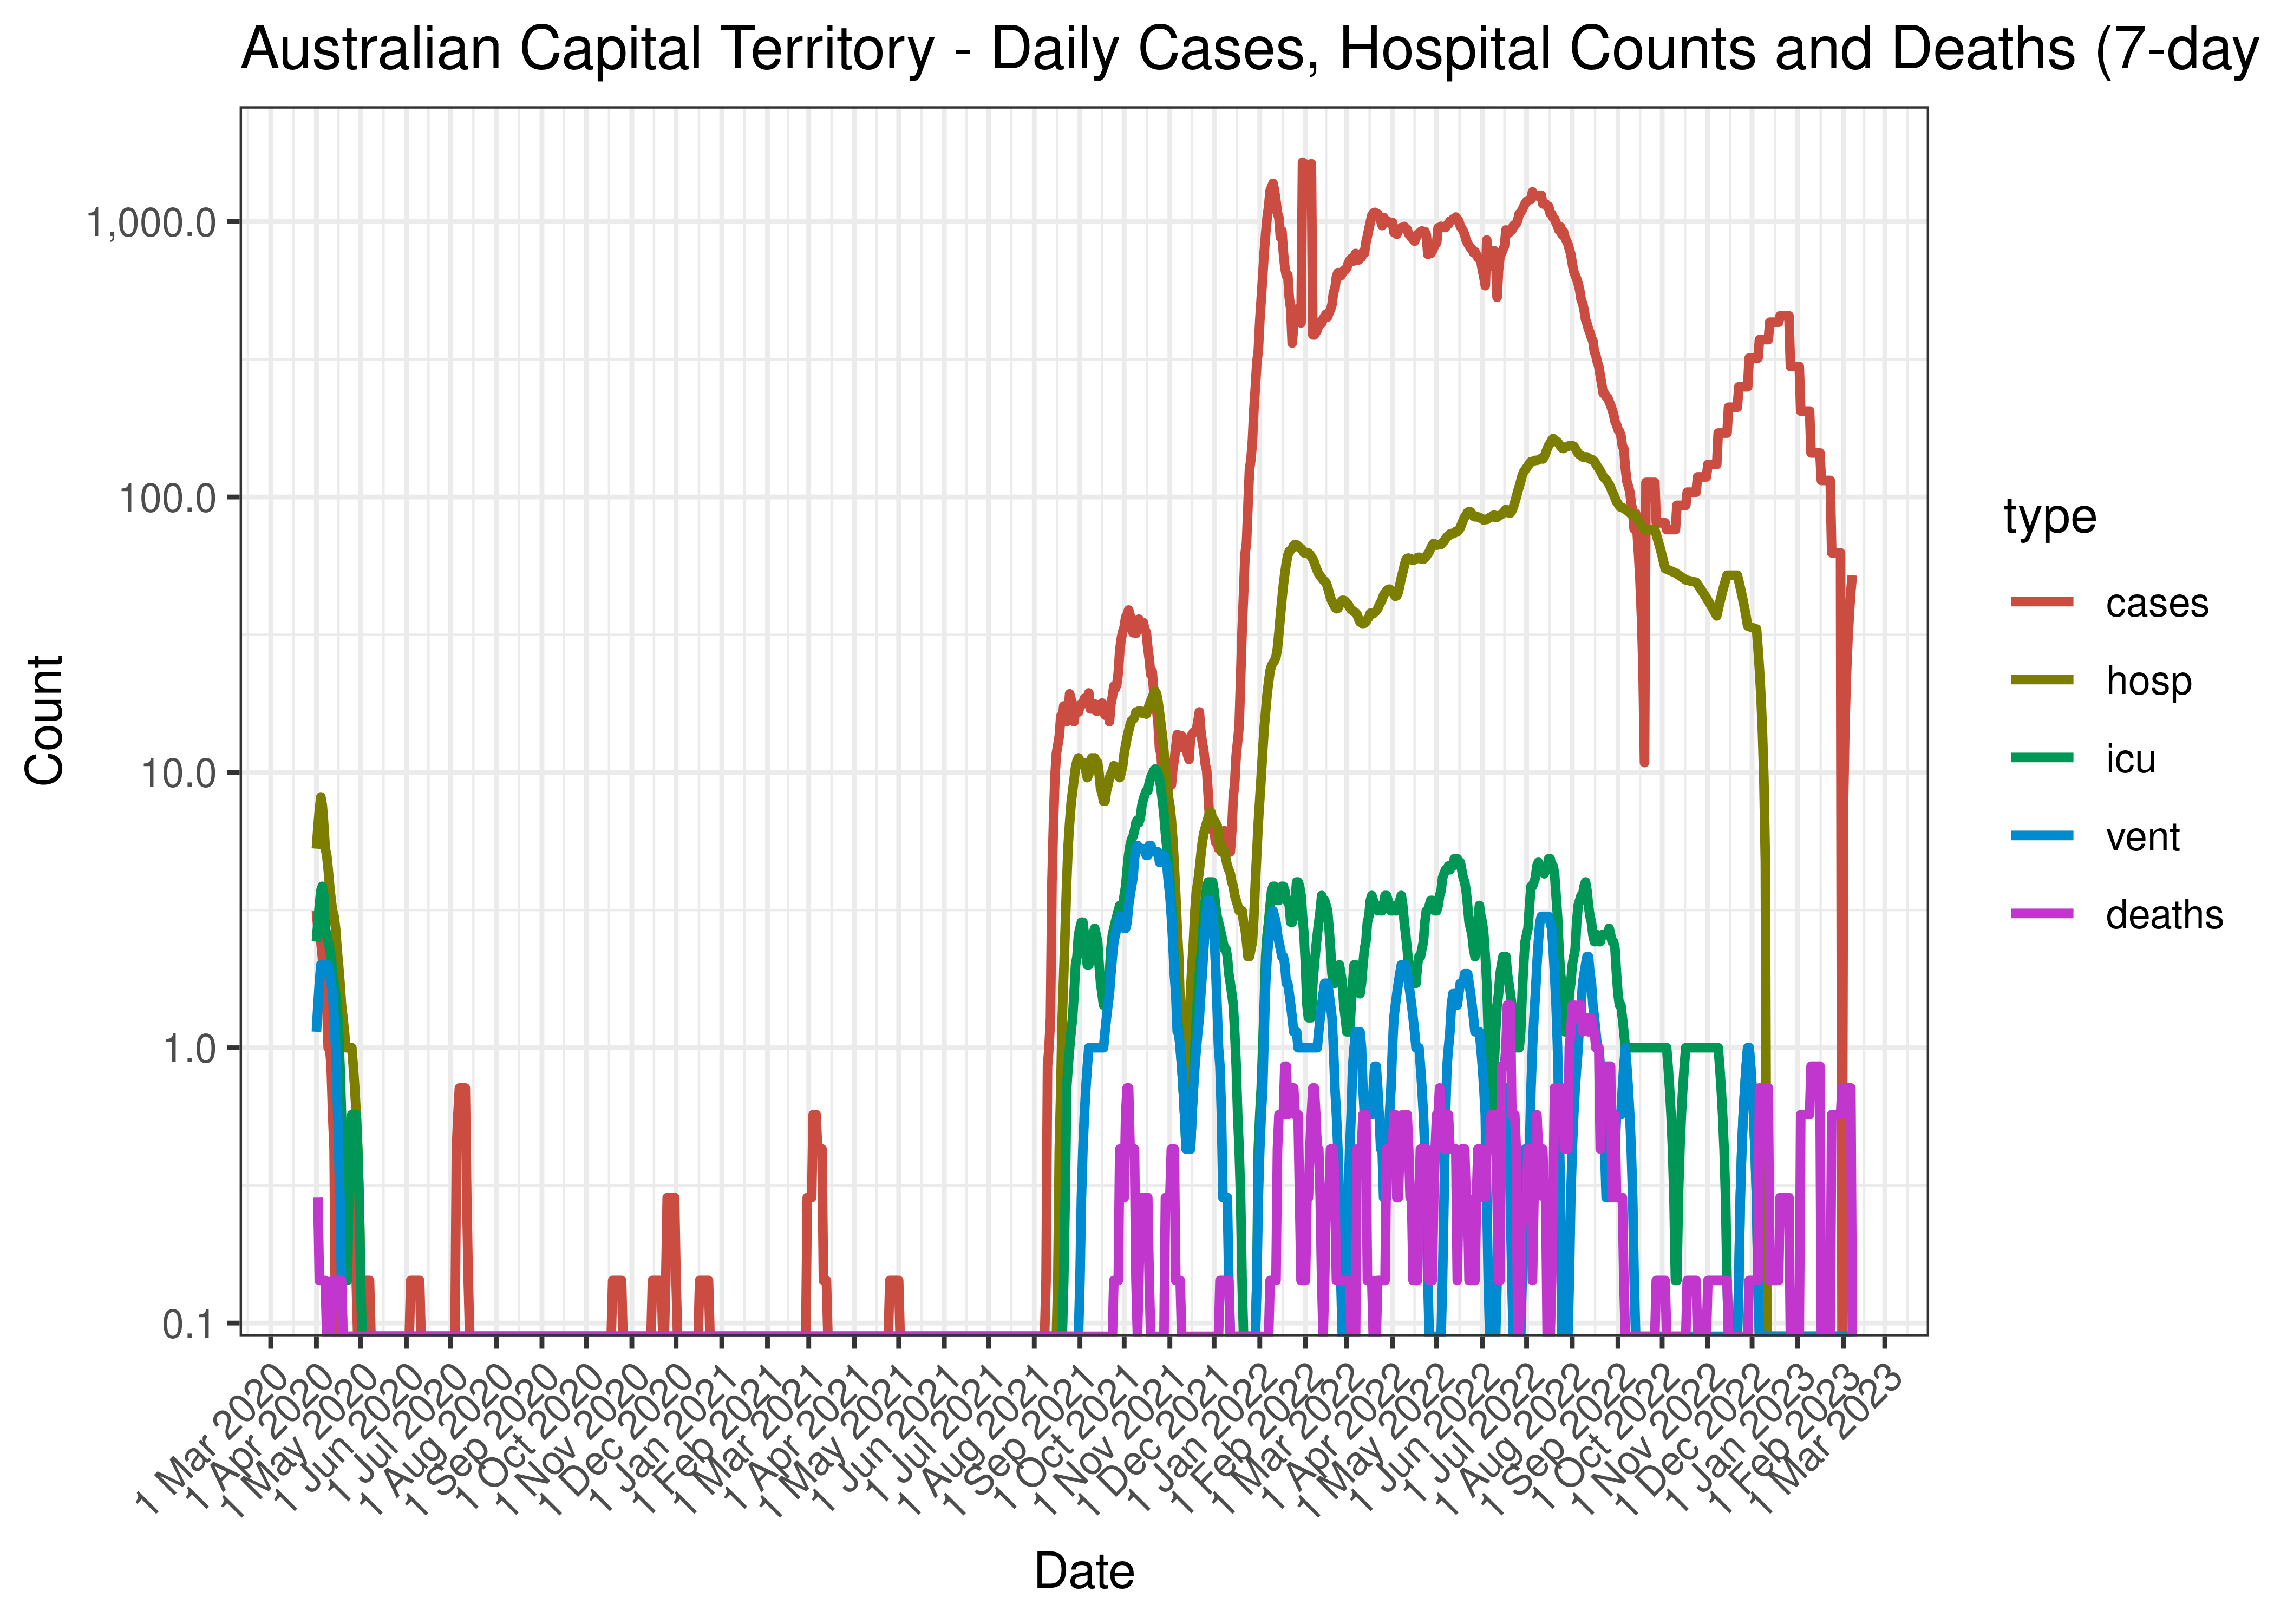
Australian Capital Territory - Daily Cases, Hospital Counts and Deaths (7-day moving average)
Below the above chart is repeated for the last 30-days:
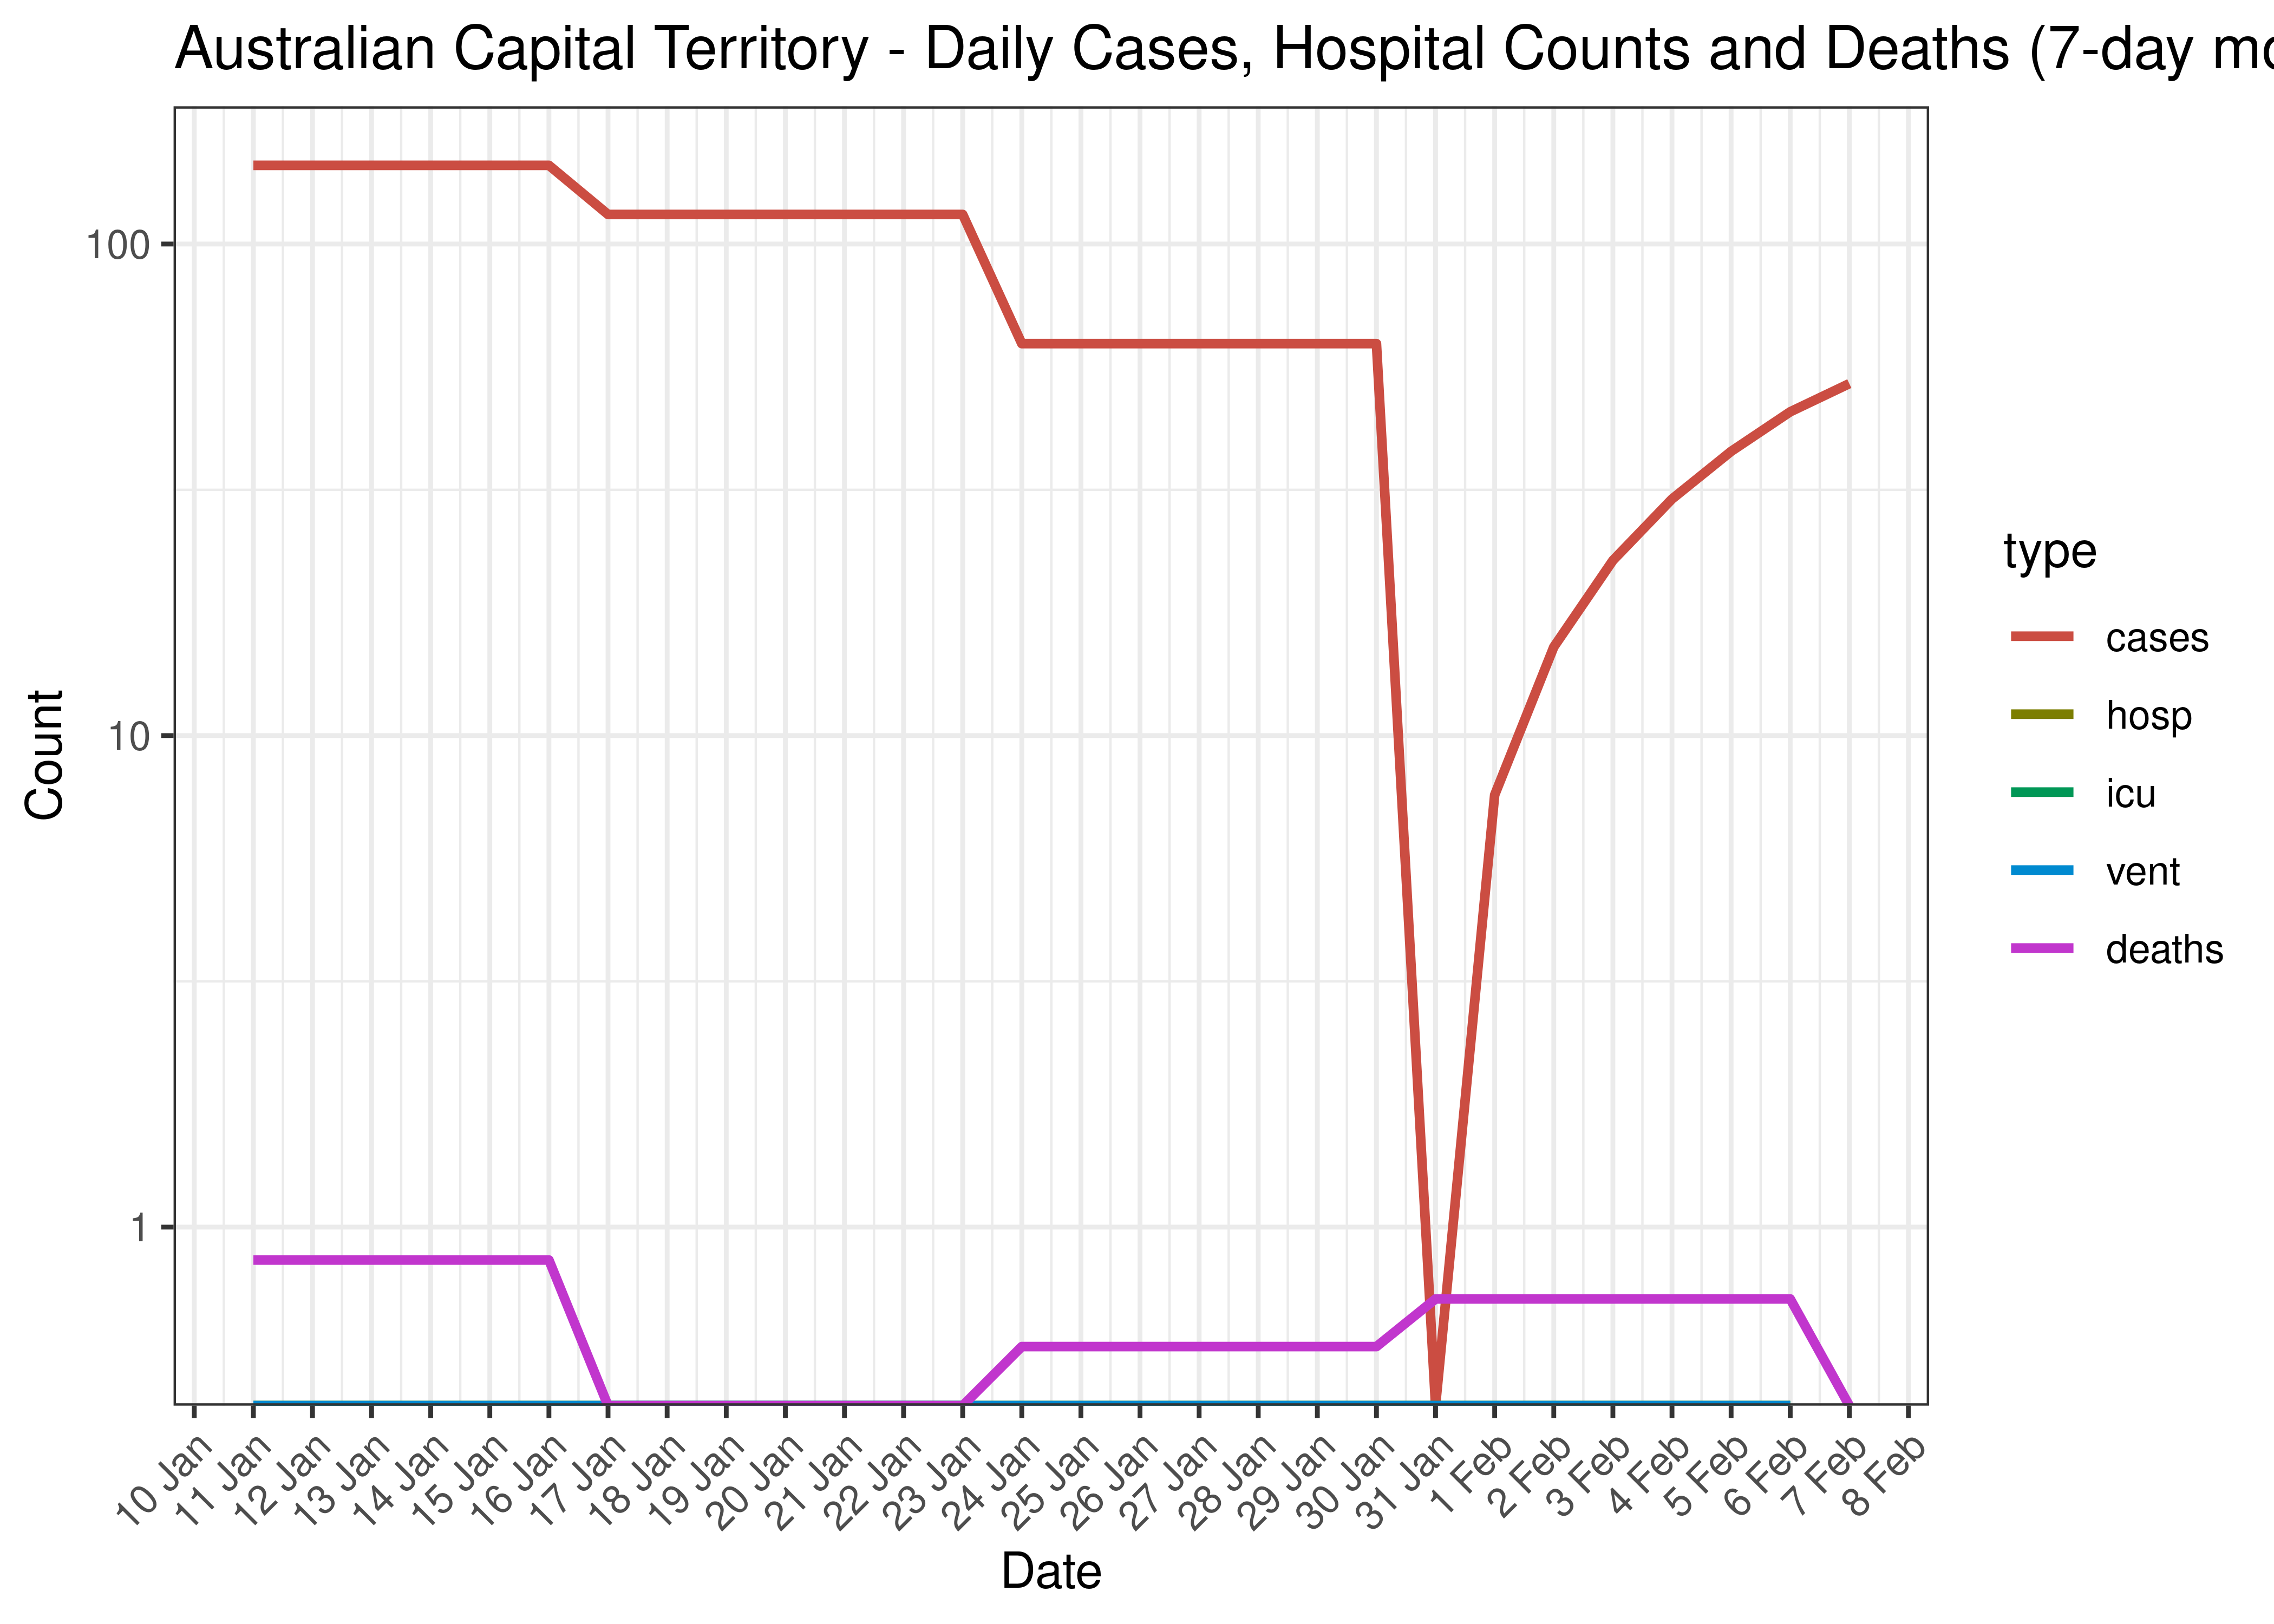
Australian Capital Territory - Daily Cases, Admissions and Deaths for Last 30-days (7-day moving average)
5.2.8 Crude Ratios per Wave
Below crude rations are calculated between the waves. It’s based on the following starting dates:
- Wave 1 started on 2020-01-01.
- Wave 2 started on 2020-06-01.
- Wave 3 started on 2021-06-01.
- Wave 4 started on 2021-12-01.
Below crude ratios are tabulated and plotted. These ratios are:
- ICU ratio calculated as person days in ICU divided by person days in hospital.
- Ventilator ratio calculated as person days on ventilators divided by person days in hospital.
- Death ratio calculated as deaths divided by person days in hospital.
- Case fatality ratio is calcualted as deaths divided by cases.
| Wave | ICU Ratio | Ventilator Ratio | Death Ratio | Case Fatality Ratio | |
|---|---|---|---|---|---|
| Australian Capital Territory | Wave 1 | 50.0% | 27.6% | 3.1% | 2.80% |
| Australian Capital Territory | Wave 2 | NA | NA | NA | 0.00% |
| Australian Capital Territory | Wave 3 | 38.0% | 24.5% | 1.1% | 0.55% |
| Australian Capital Territory | Wave 4 | 3.1% | 1.1% | 0.5% | 0.06% |
5.2.9 Reproduction Number
Below current (last weekly) effective reproduction number estimates are tabulated for Australia and by state.
| Type | Count (Per Day) | Week Ending | Reproduction Number [95% Confidence Interval] | |
|---|---|---|---|---|
| Australian Capital Territory | cases | 52 | 2023-02-10 | 2.06 [1.55 - 2.69] |
Below the effective reproduction number for Australia over the last 90 days are plotted together with a plot since start of the pandemic.
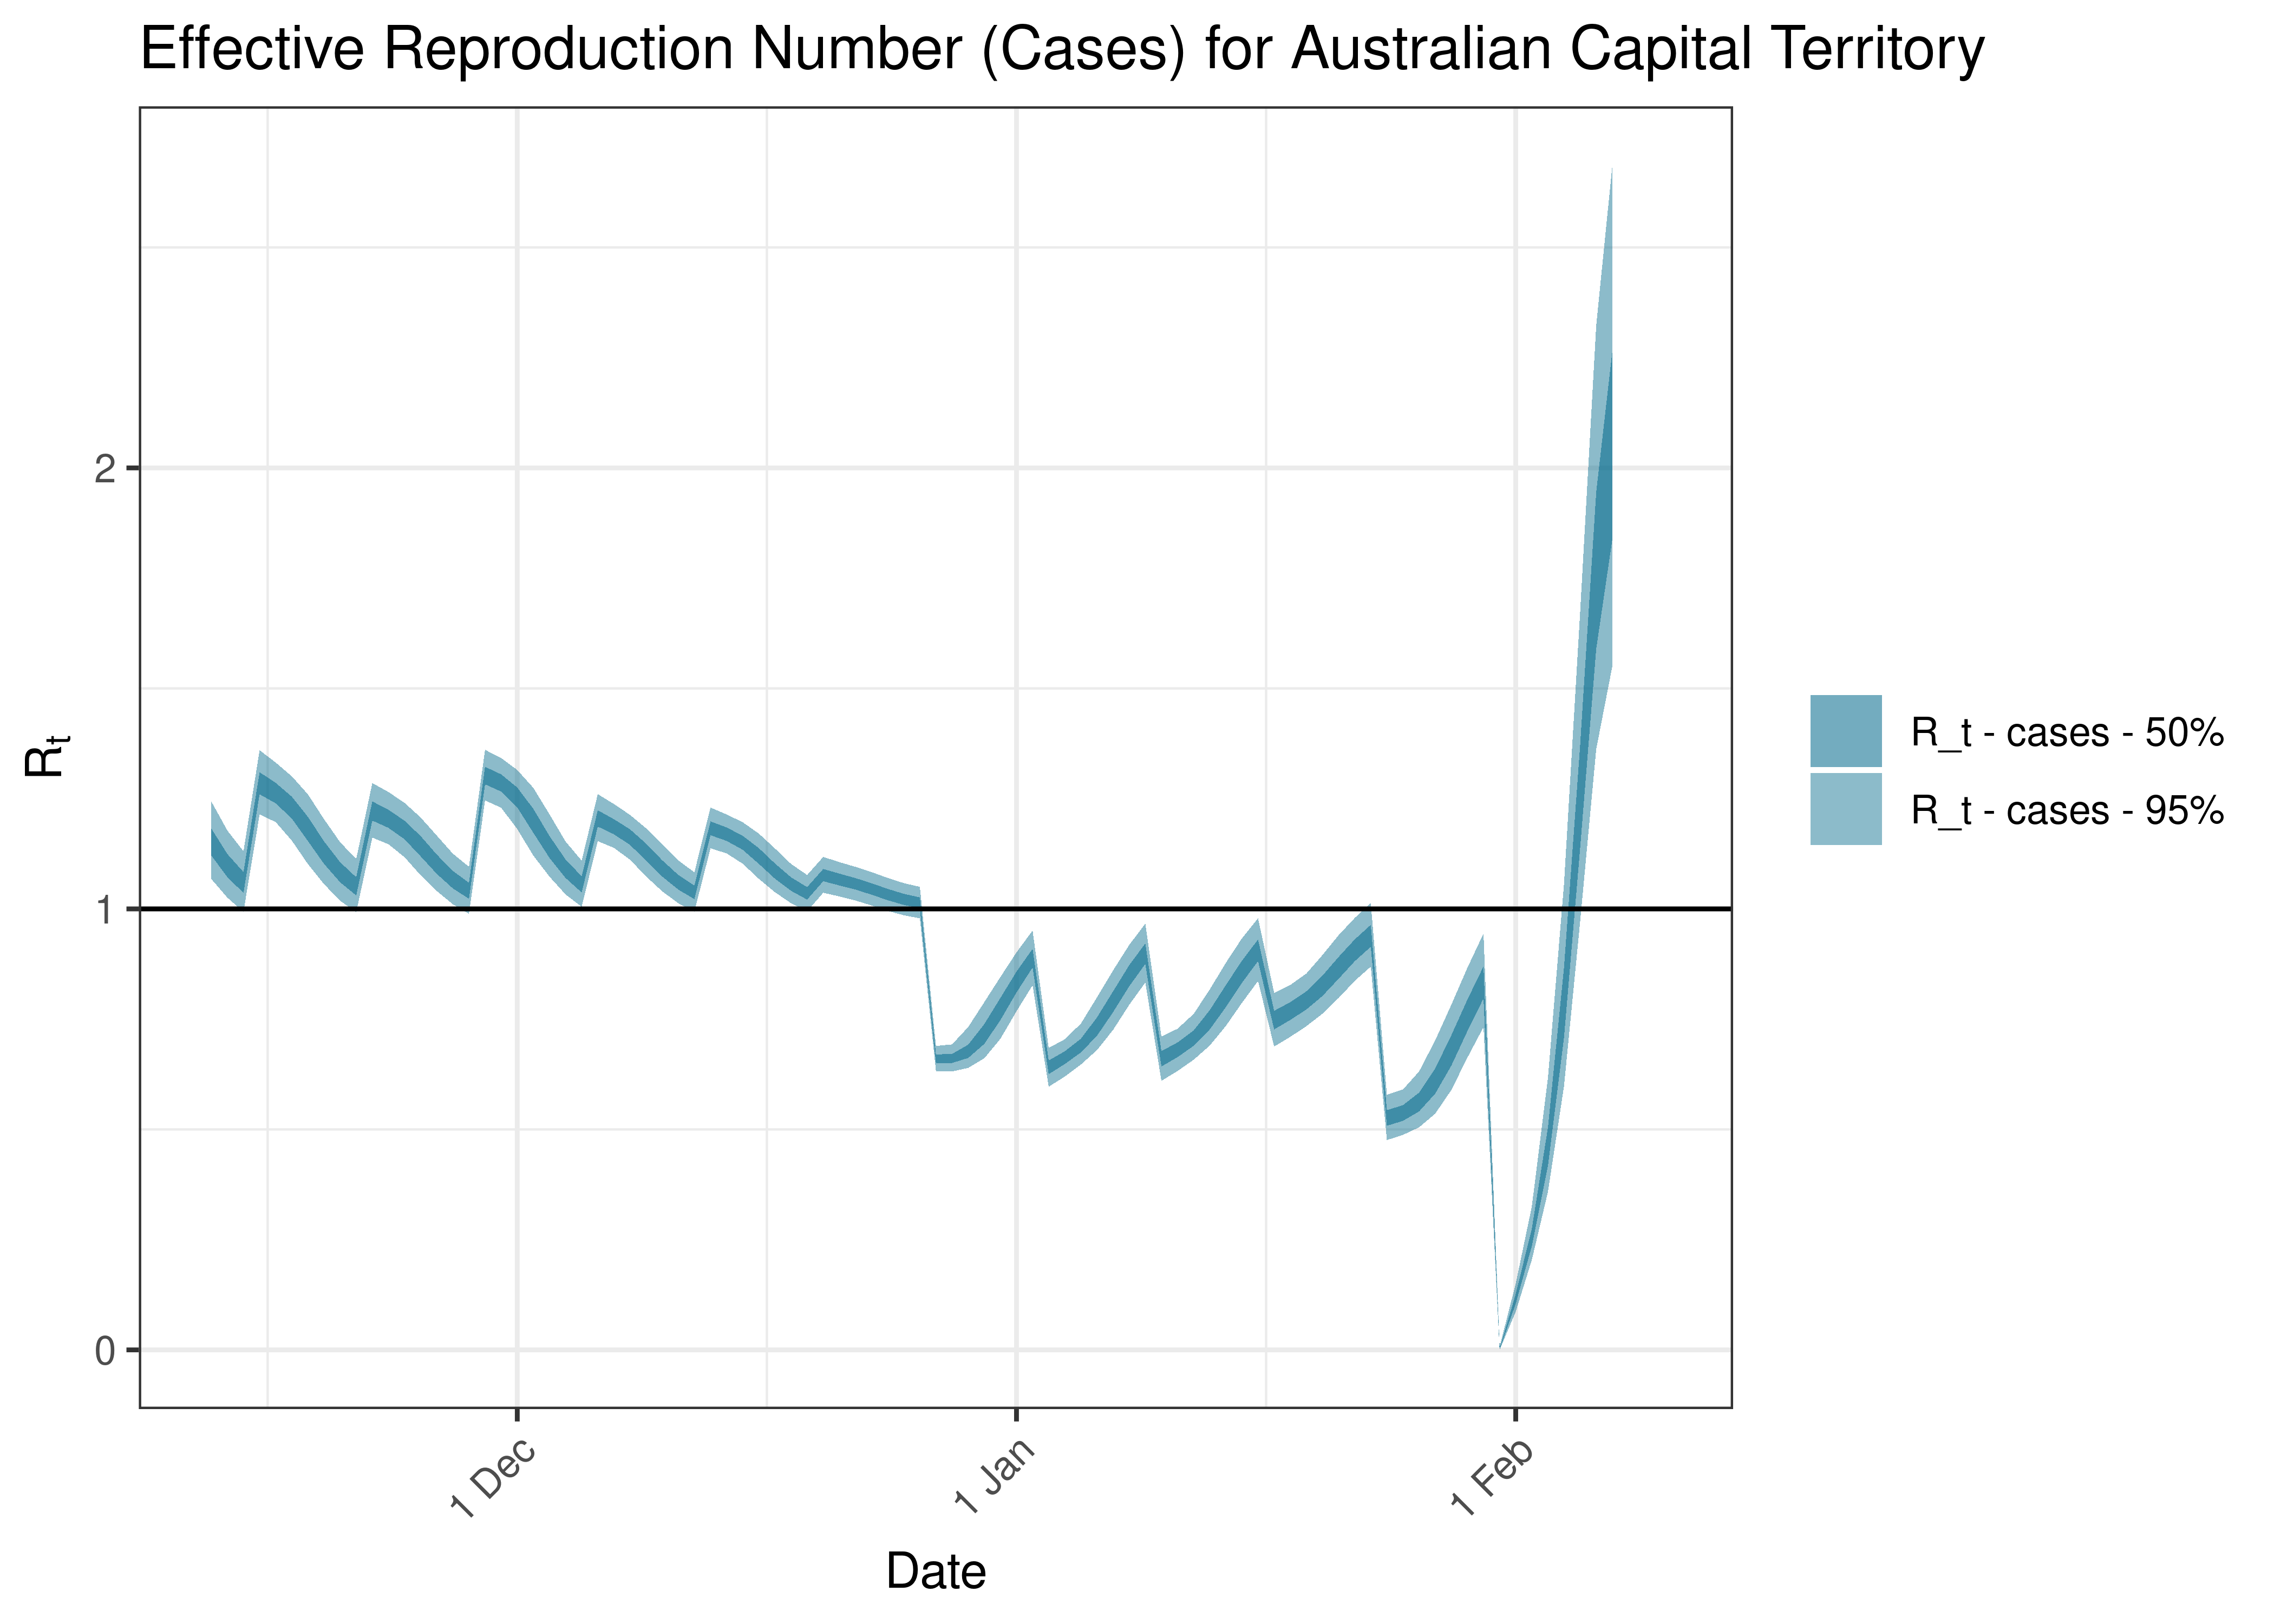
Estimated Effective Reproduction Number Based on Cases for Australian Capital Territory over last 90 days
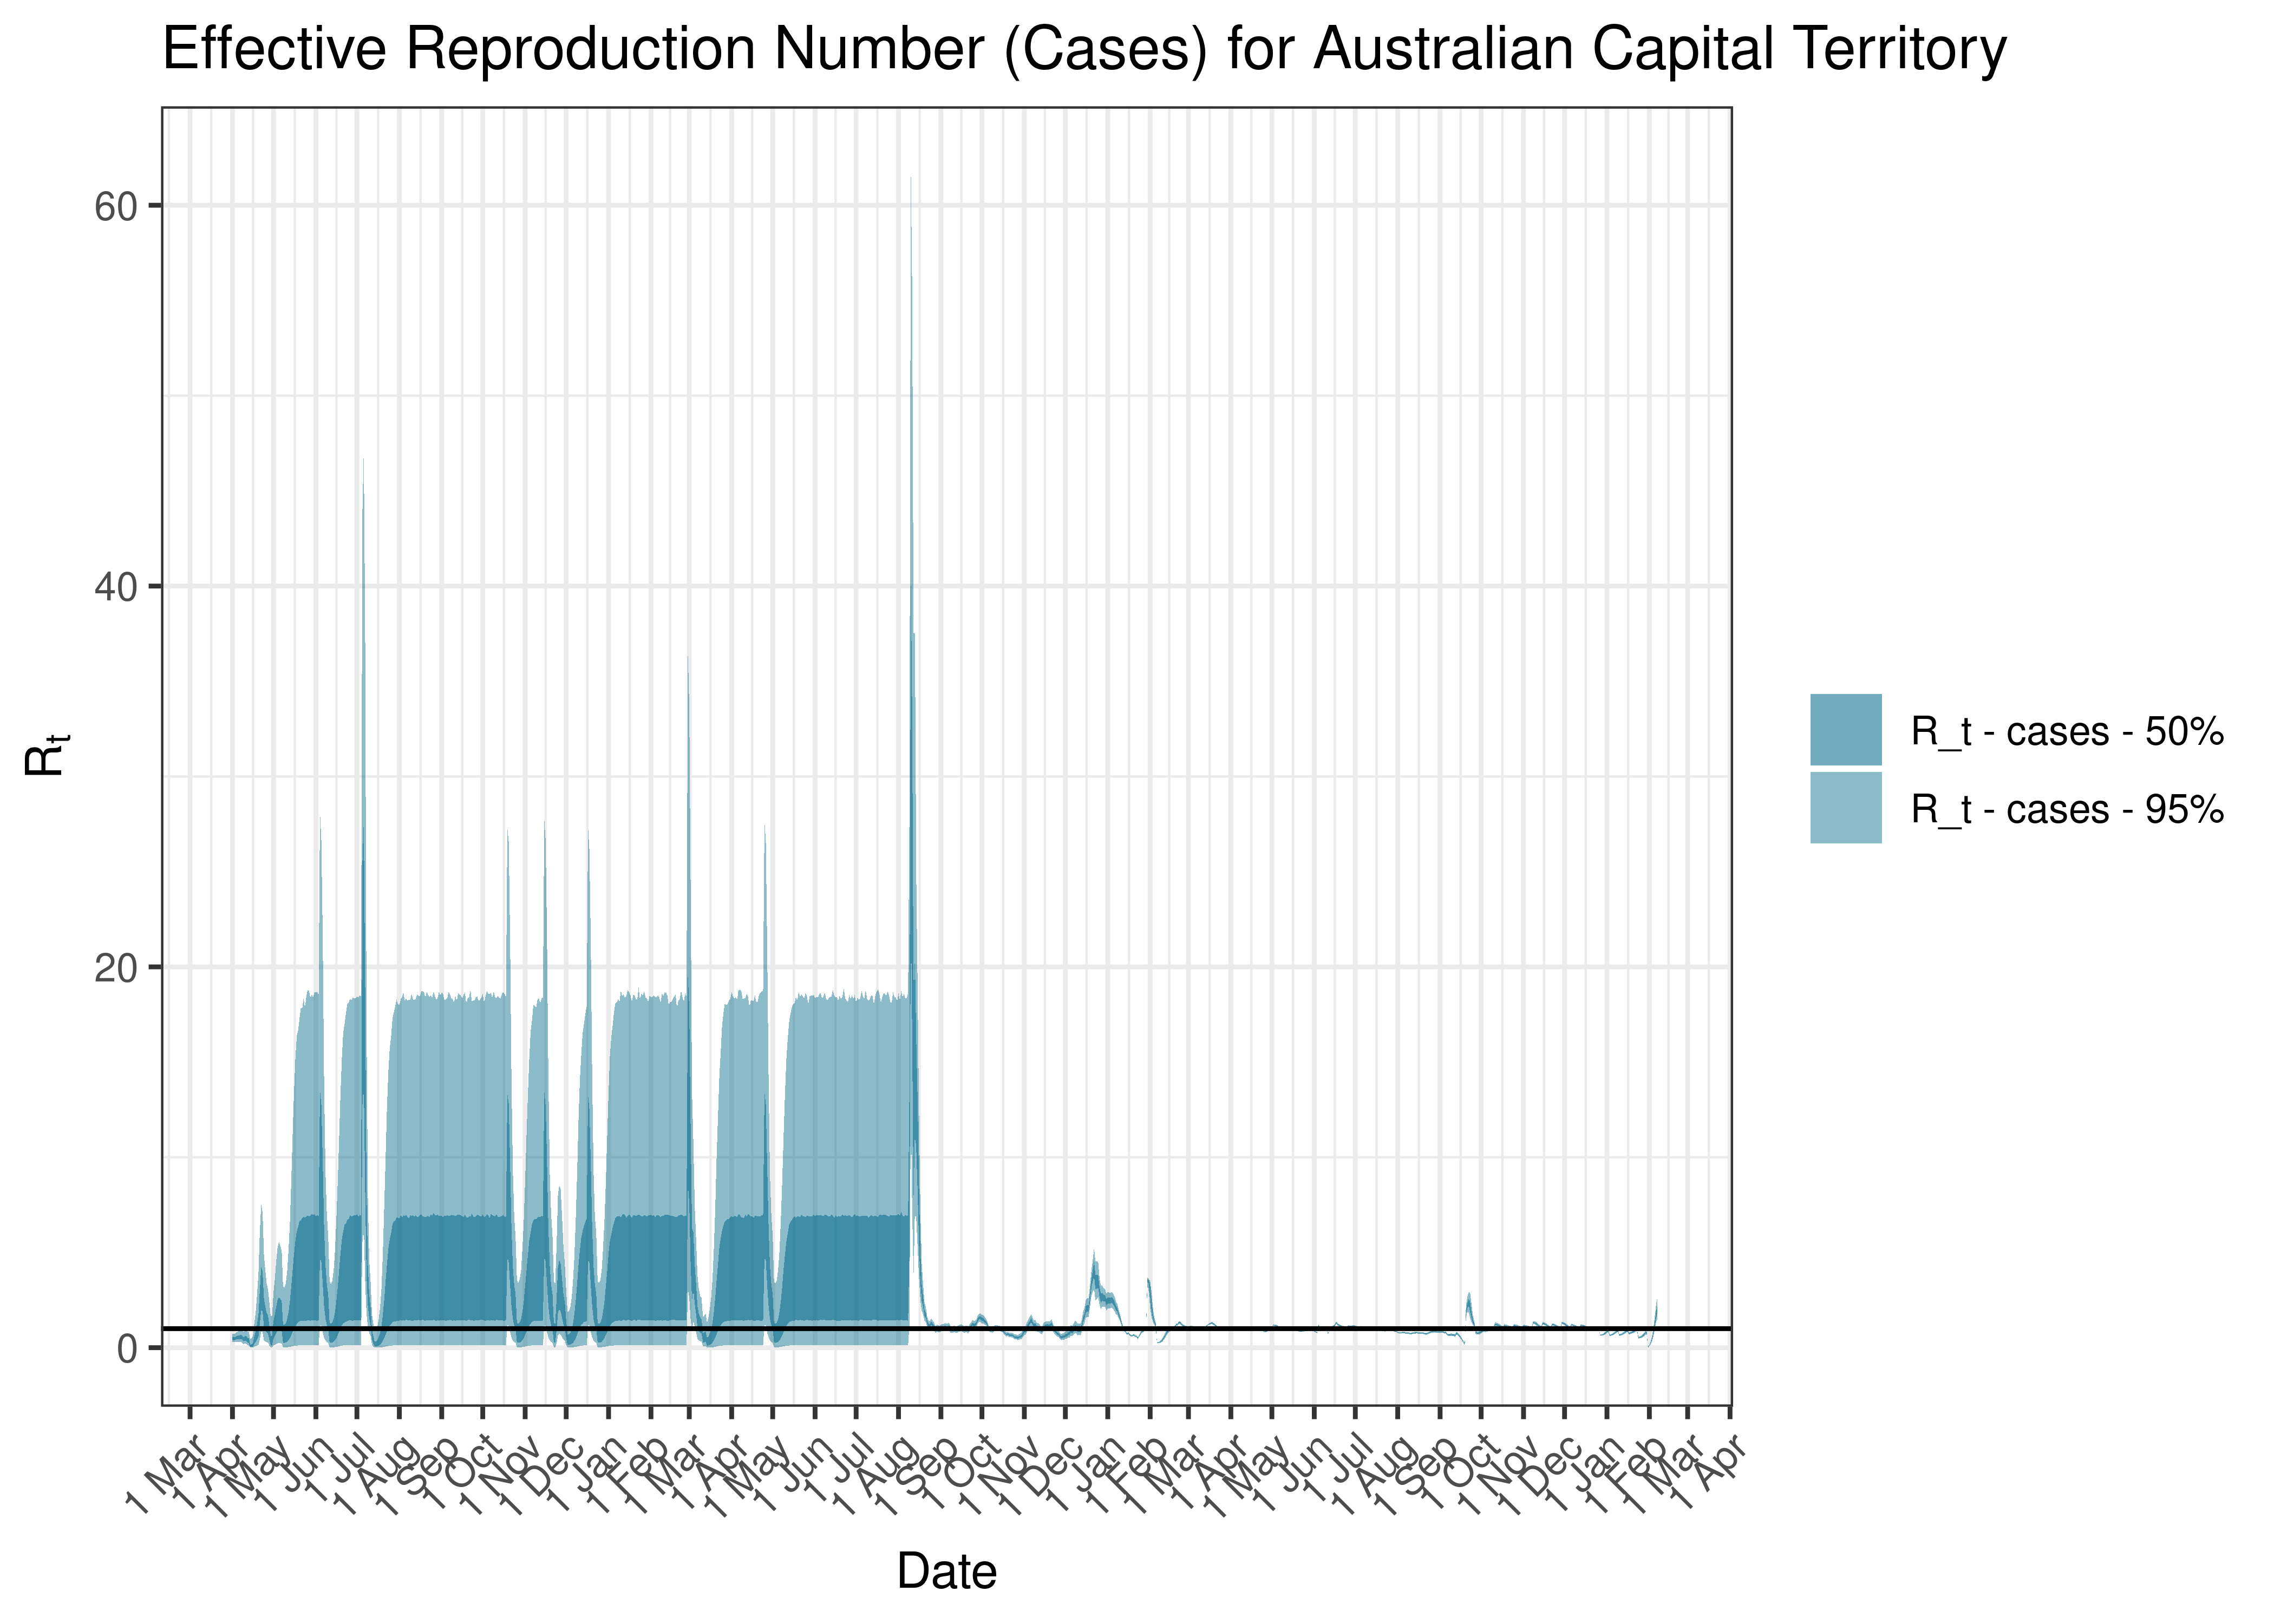
Estimated Effective Reproduction Number Based on Cases for Australian Capital Territory since 1 April 2020
5.3 New South Wales
5.3.1 Tests
Below raw numbers of test by date are plotted on a 7-day moving average from 1 April 2020.
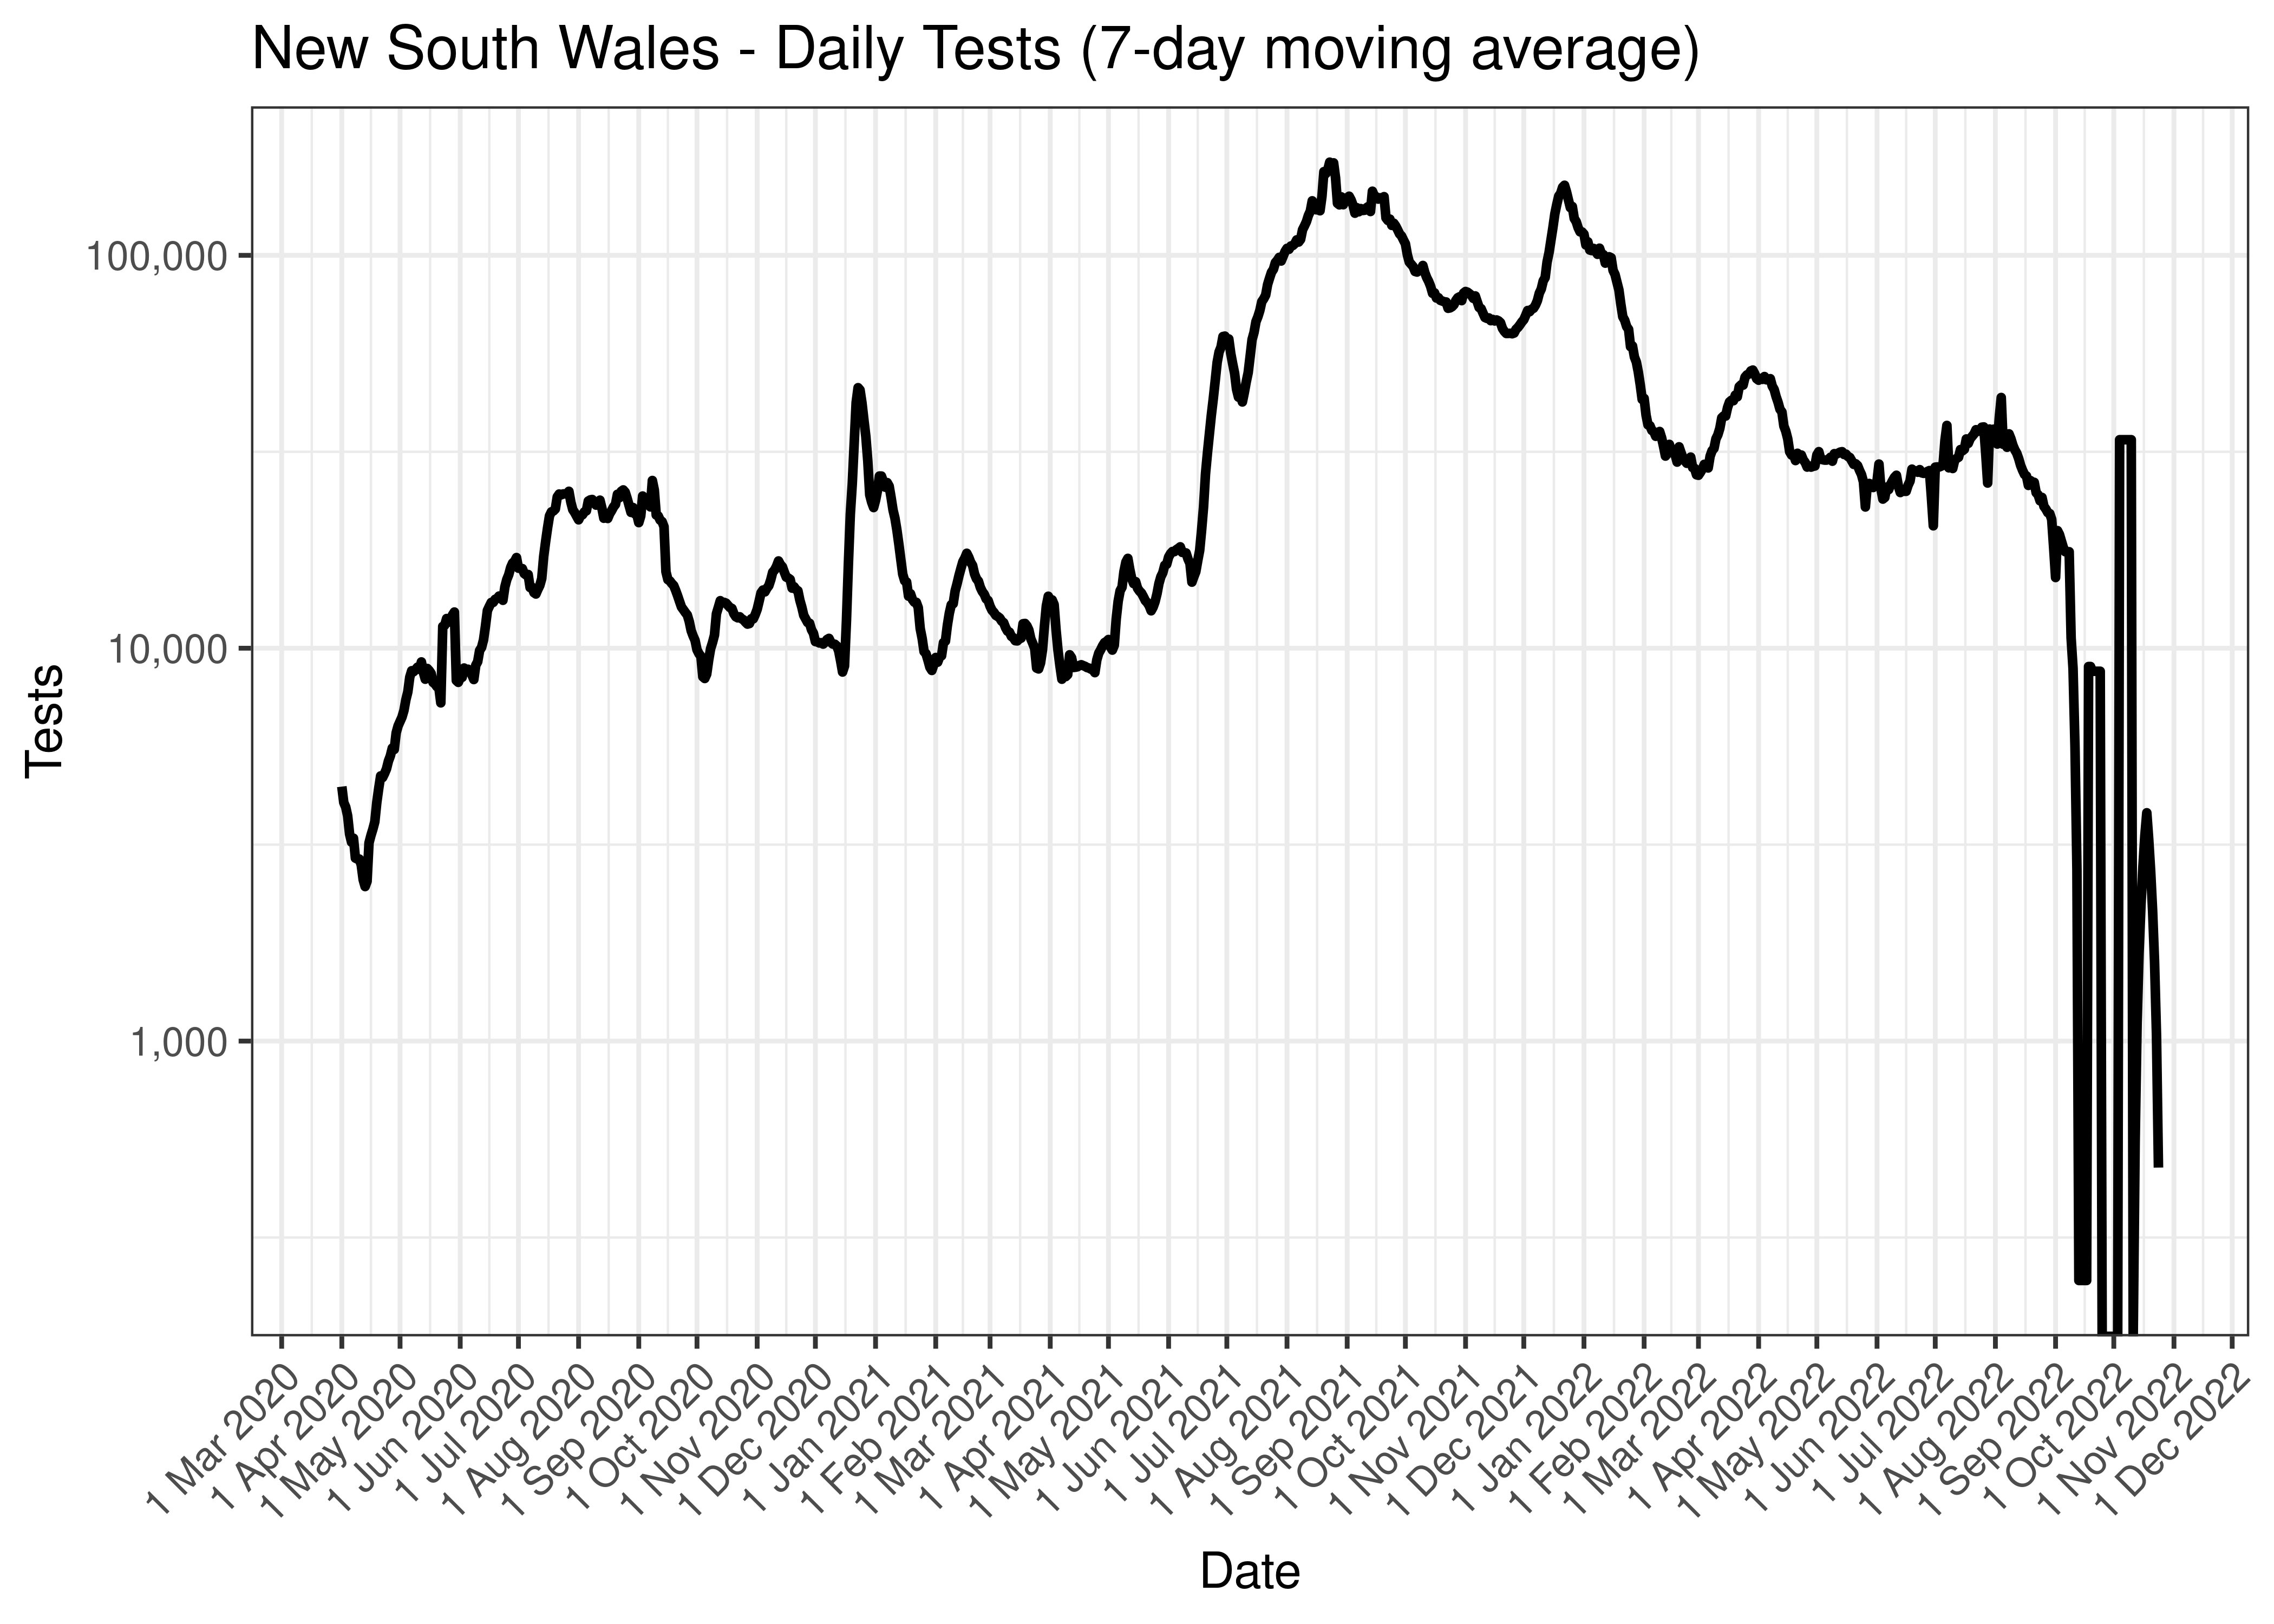
New South Wales - Daily Tests (7-day moving average)
The above chart is repeated below covering the last 30 days only.

New South Wales - Daily Tests for Last 30 Days (7-day moving average)
5.3.2 Cases
Cases are tabulated by specimen received date below. Cases include estimates for late reporting in recent days as well as adjustments for any public holidays. A centred 7-day moving average is also shown. The peak daily cases in previous waves (as measured by the moving average) is also shown.
| Date | Cases | 7-day Moving Average | Comment |
|---|---|---|---|
| 2020-03-26 | 190 | 180 | Wave 1 Peak |
| 2020-12-21 | 23 | 22 | Wave 2 Peak |
| 2021-09-08 | 1,457 | 1,409 | Wave 3 Peak |
| 2022-05-02 | 7,619 | 37,150 | Wave 4 Peak (to date) |
| 2023-02-03 | 6,563 | 938 | |
| 2023-02-04 | 0 | 938 | |
| 2023-02-05 | 0 | 938 | |
| 2023-02-06 | 0 | 938 | |
| 2023-02-07 | 0 | 914 | |
| 2023-02-08 | 0 | NA | |
| 2023-02-09 | 0 | NA | |
| 2023-02-10 | 6,401 | NA |
Below a 7-day moving average daily case count is plotted for New South Wales on a log scale since start of the epidemic:
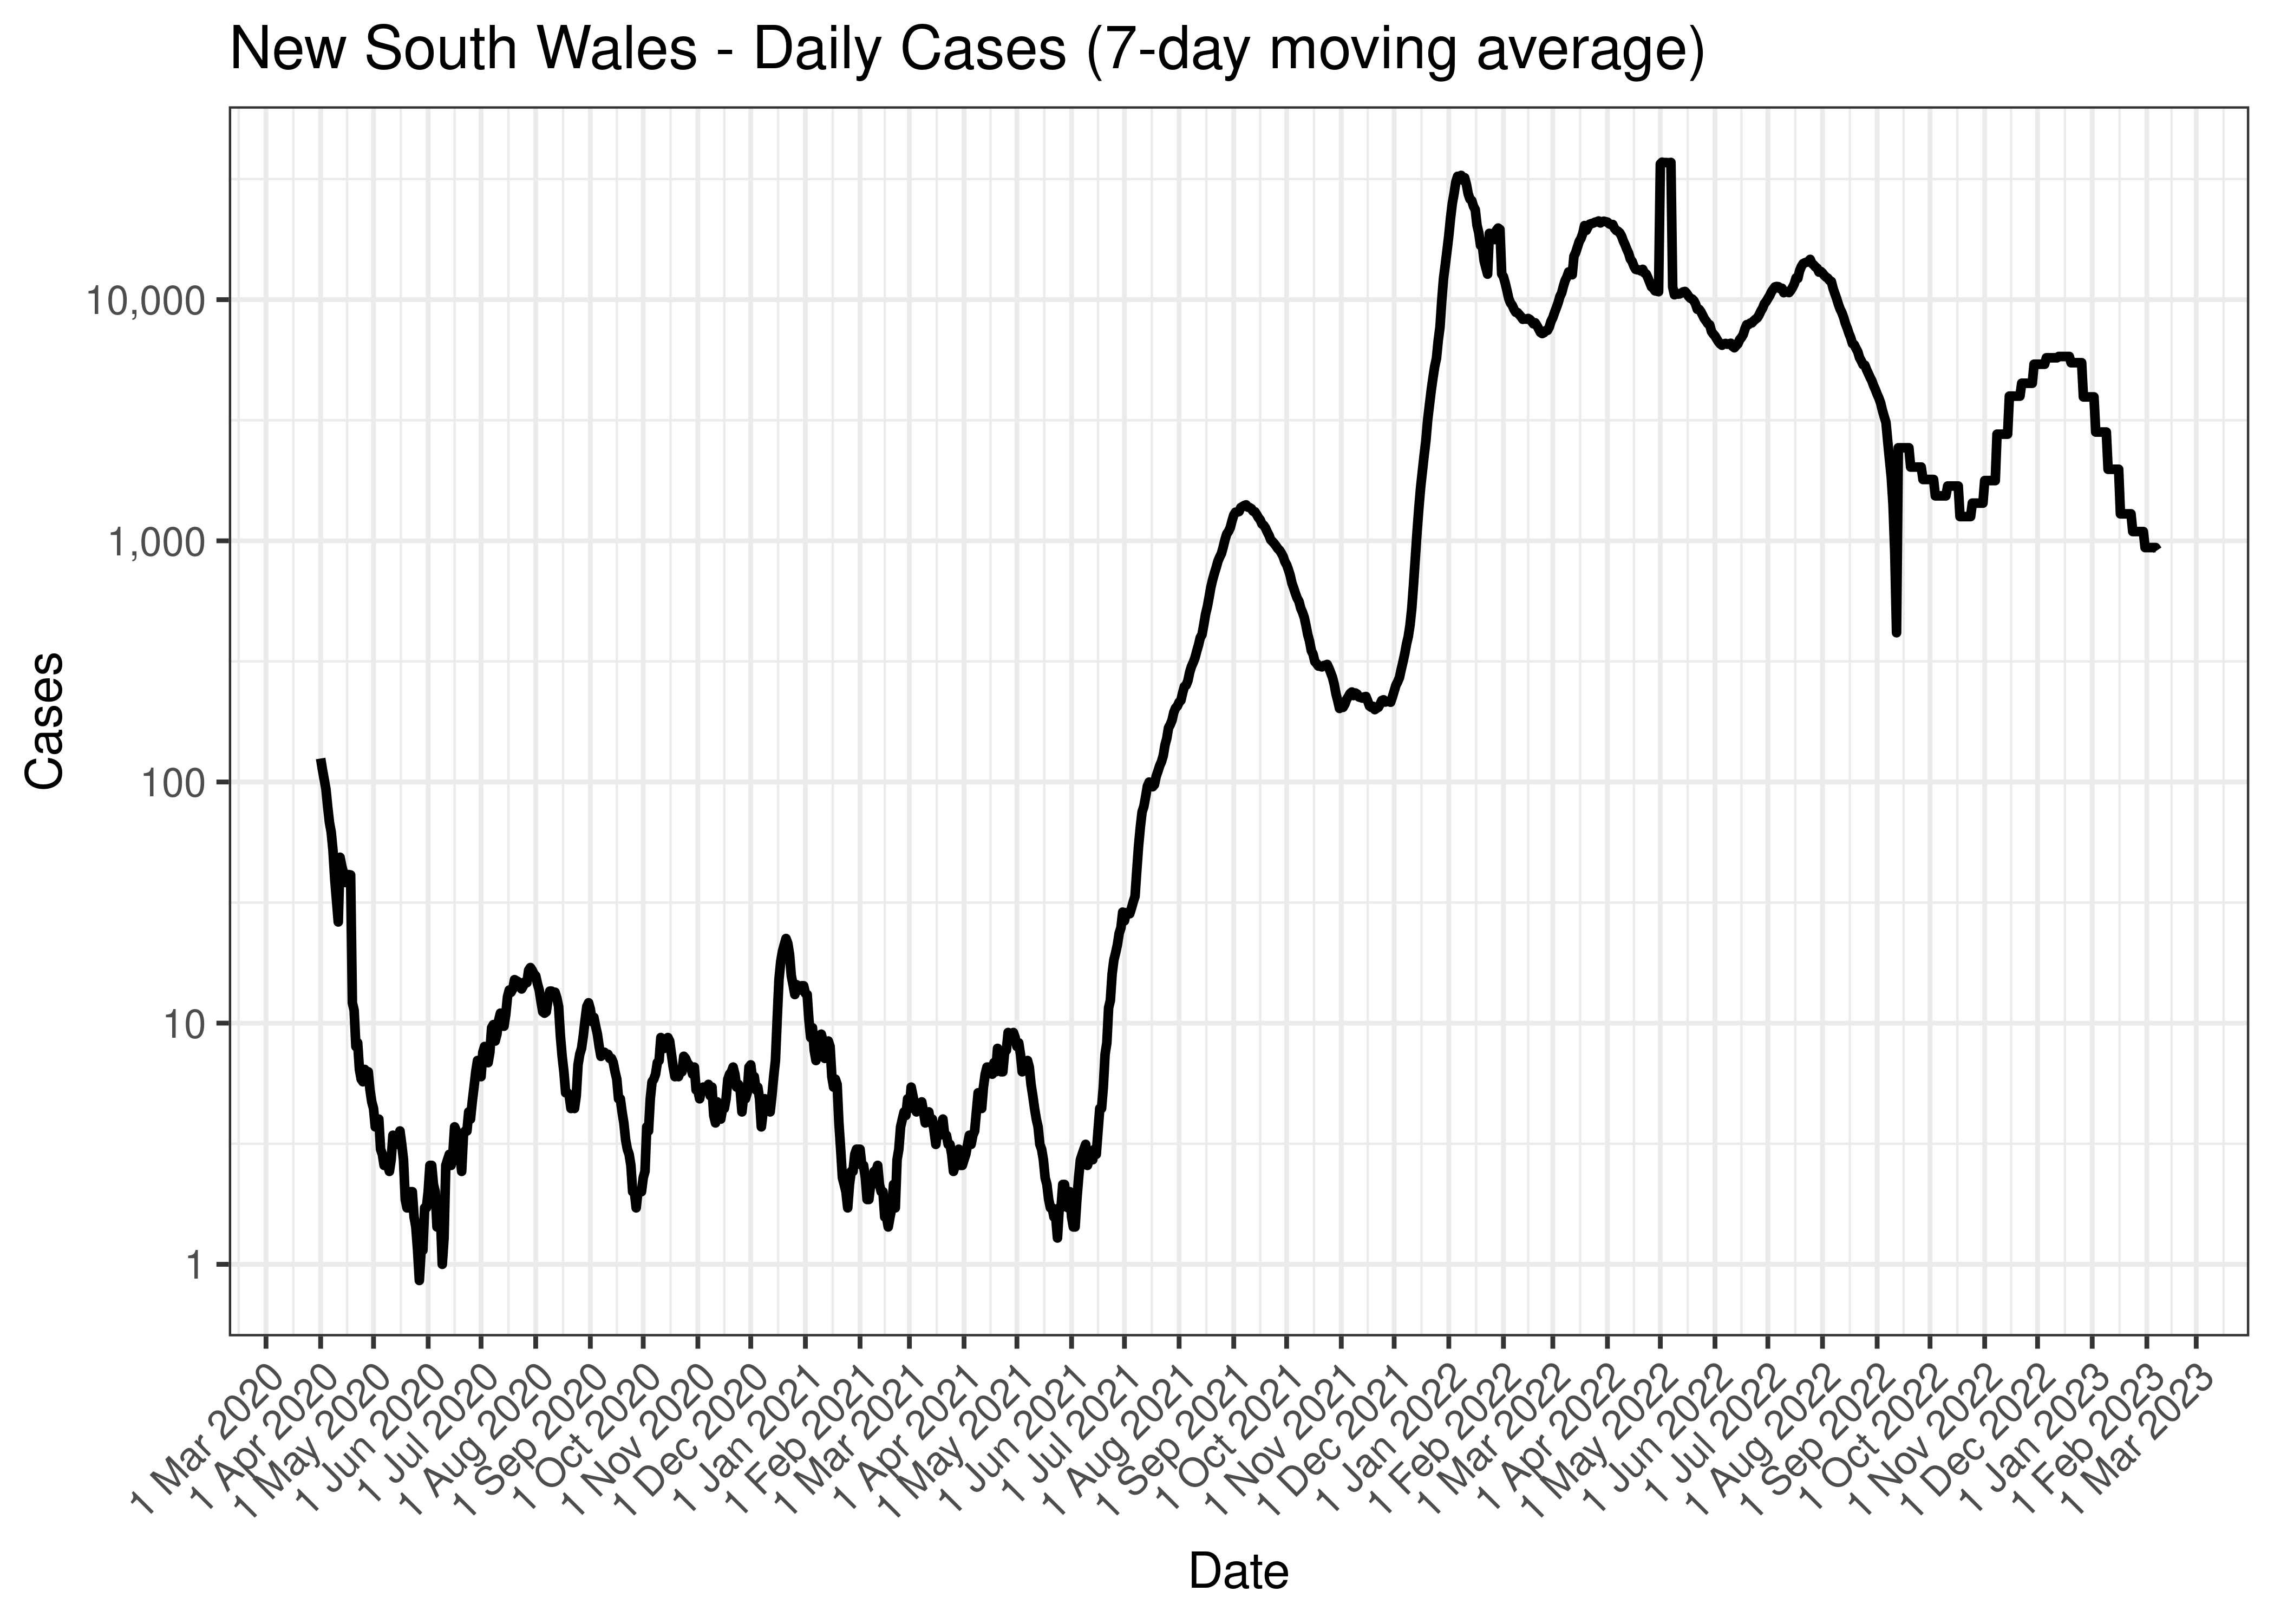
New South Wales - Daily Cases (7-day moving average)
Below the above chart is repeated for the last 30-days:
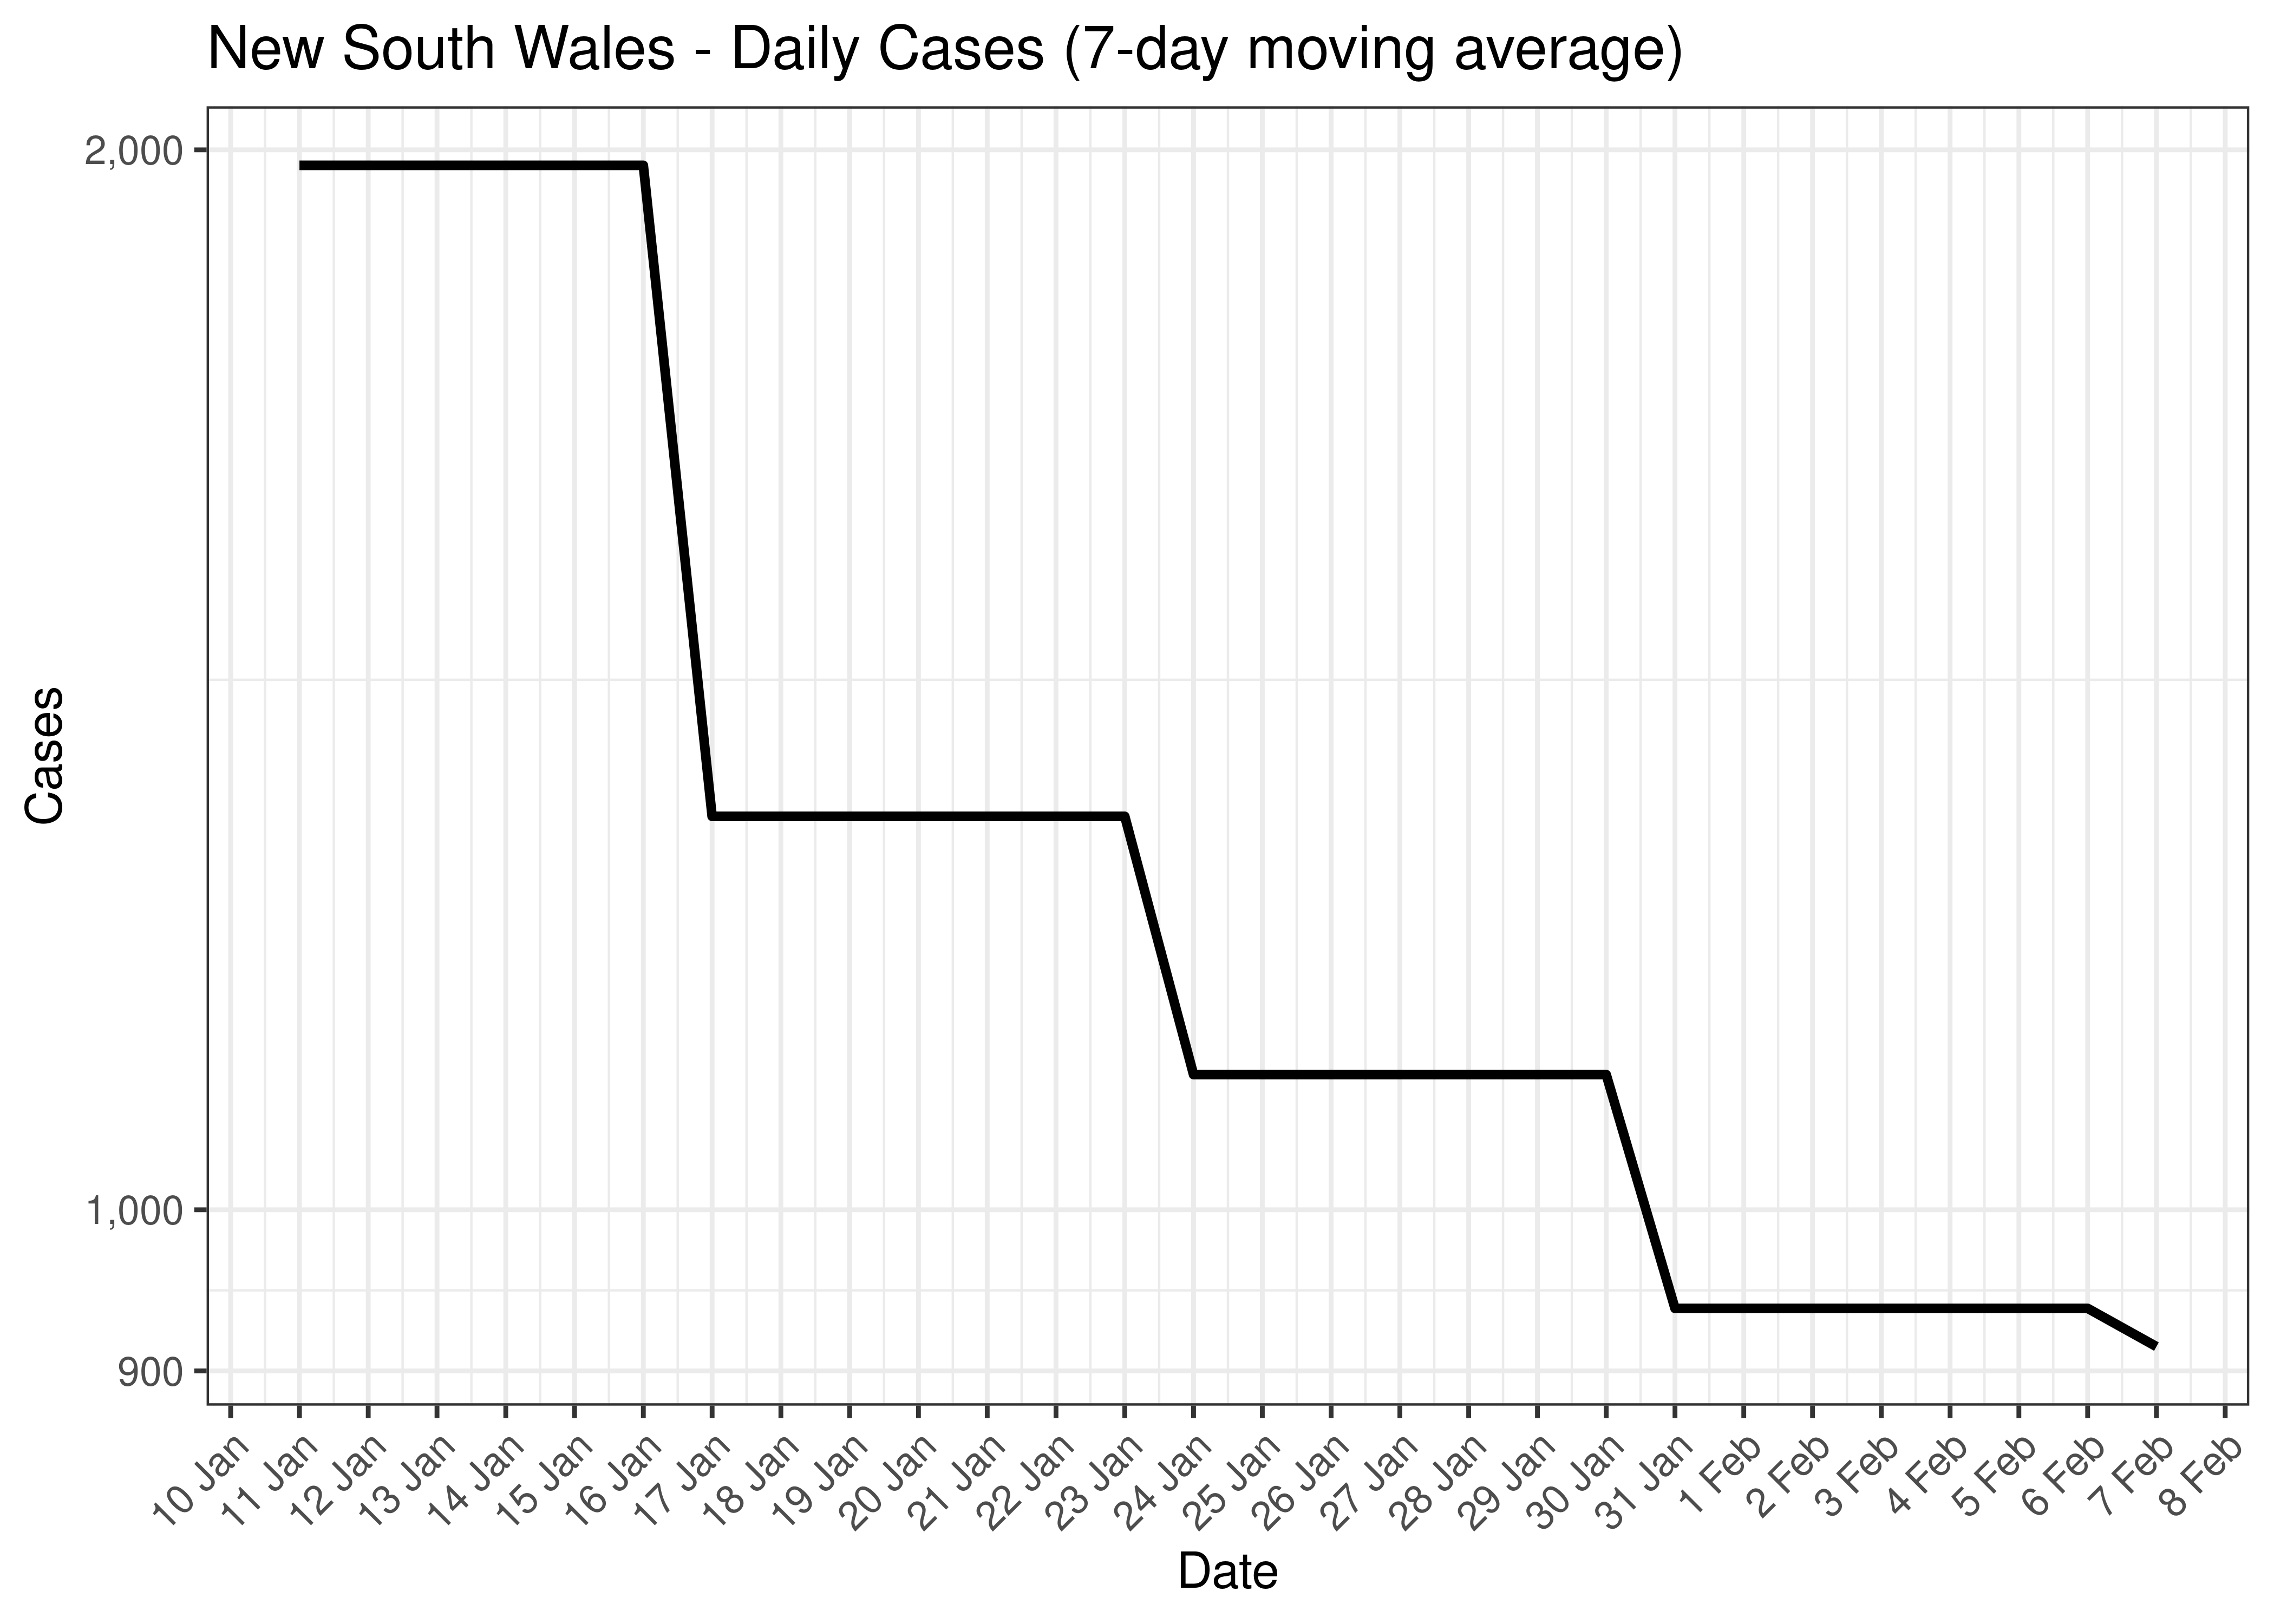
New South Wales - Daily Cases for Last 30-days (7-day moving average)
5.3.3 Hospitlisation
Counts of those in hospital are tabulated by report date below. A centred 7-day moving average is also shown. The peak daily admissions in previous waves (as measured by the moving average) is also shown.
| Date | In Hospital | 7-day Moving Average | Comment |
|---|---|---|---|
| 2020-04-04 | 251 | 219 | Wave 1 Peak |
| 2020-08-07 | 15 | 17 | Wave 2 Peak |
| 2020-08-08 | 15 | 17 | Wave 2 Peak |
| 2021-09-20 | 1,207 | 1,236 | Wave 3 Peak |
| 2022-01-22 | 2,762 | 2,803 | Wave 4 Peak (to date) |
| 2023-02-03 | 0 | 0 | |
| 2023-02-04 | 0 | 0 | |
| 2023-02-05 | 0 | 0 | |
| 2023-02-06 | 0 | 0 | |
| 2023-02-07 | 0 | NA | |
| 2023-02-08 | 0 | NA | |
| 2023-02-09 | 0 | NA | |
| 2023-02-10 | NA | NA |
The above are based on the following dates:
- Wave 1 started on 2020-01-01.
- Wave 2 started on 2020-06-01.
- Wave 3 started on 2021-06-01.
- Wave 4 started on 2021-12-01.
Below a 7-day moving average of daily hospital counts is plotted by on a log scale since start of the epidemic. Note admissions are plotted by date.
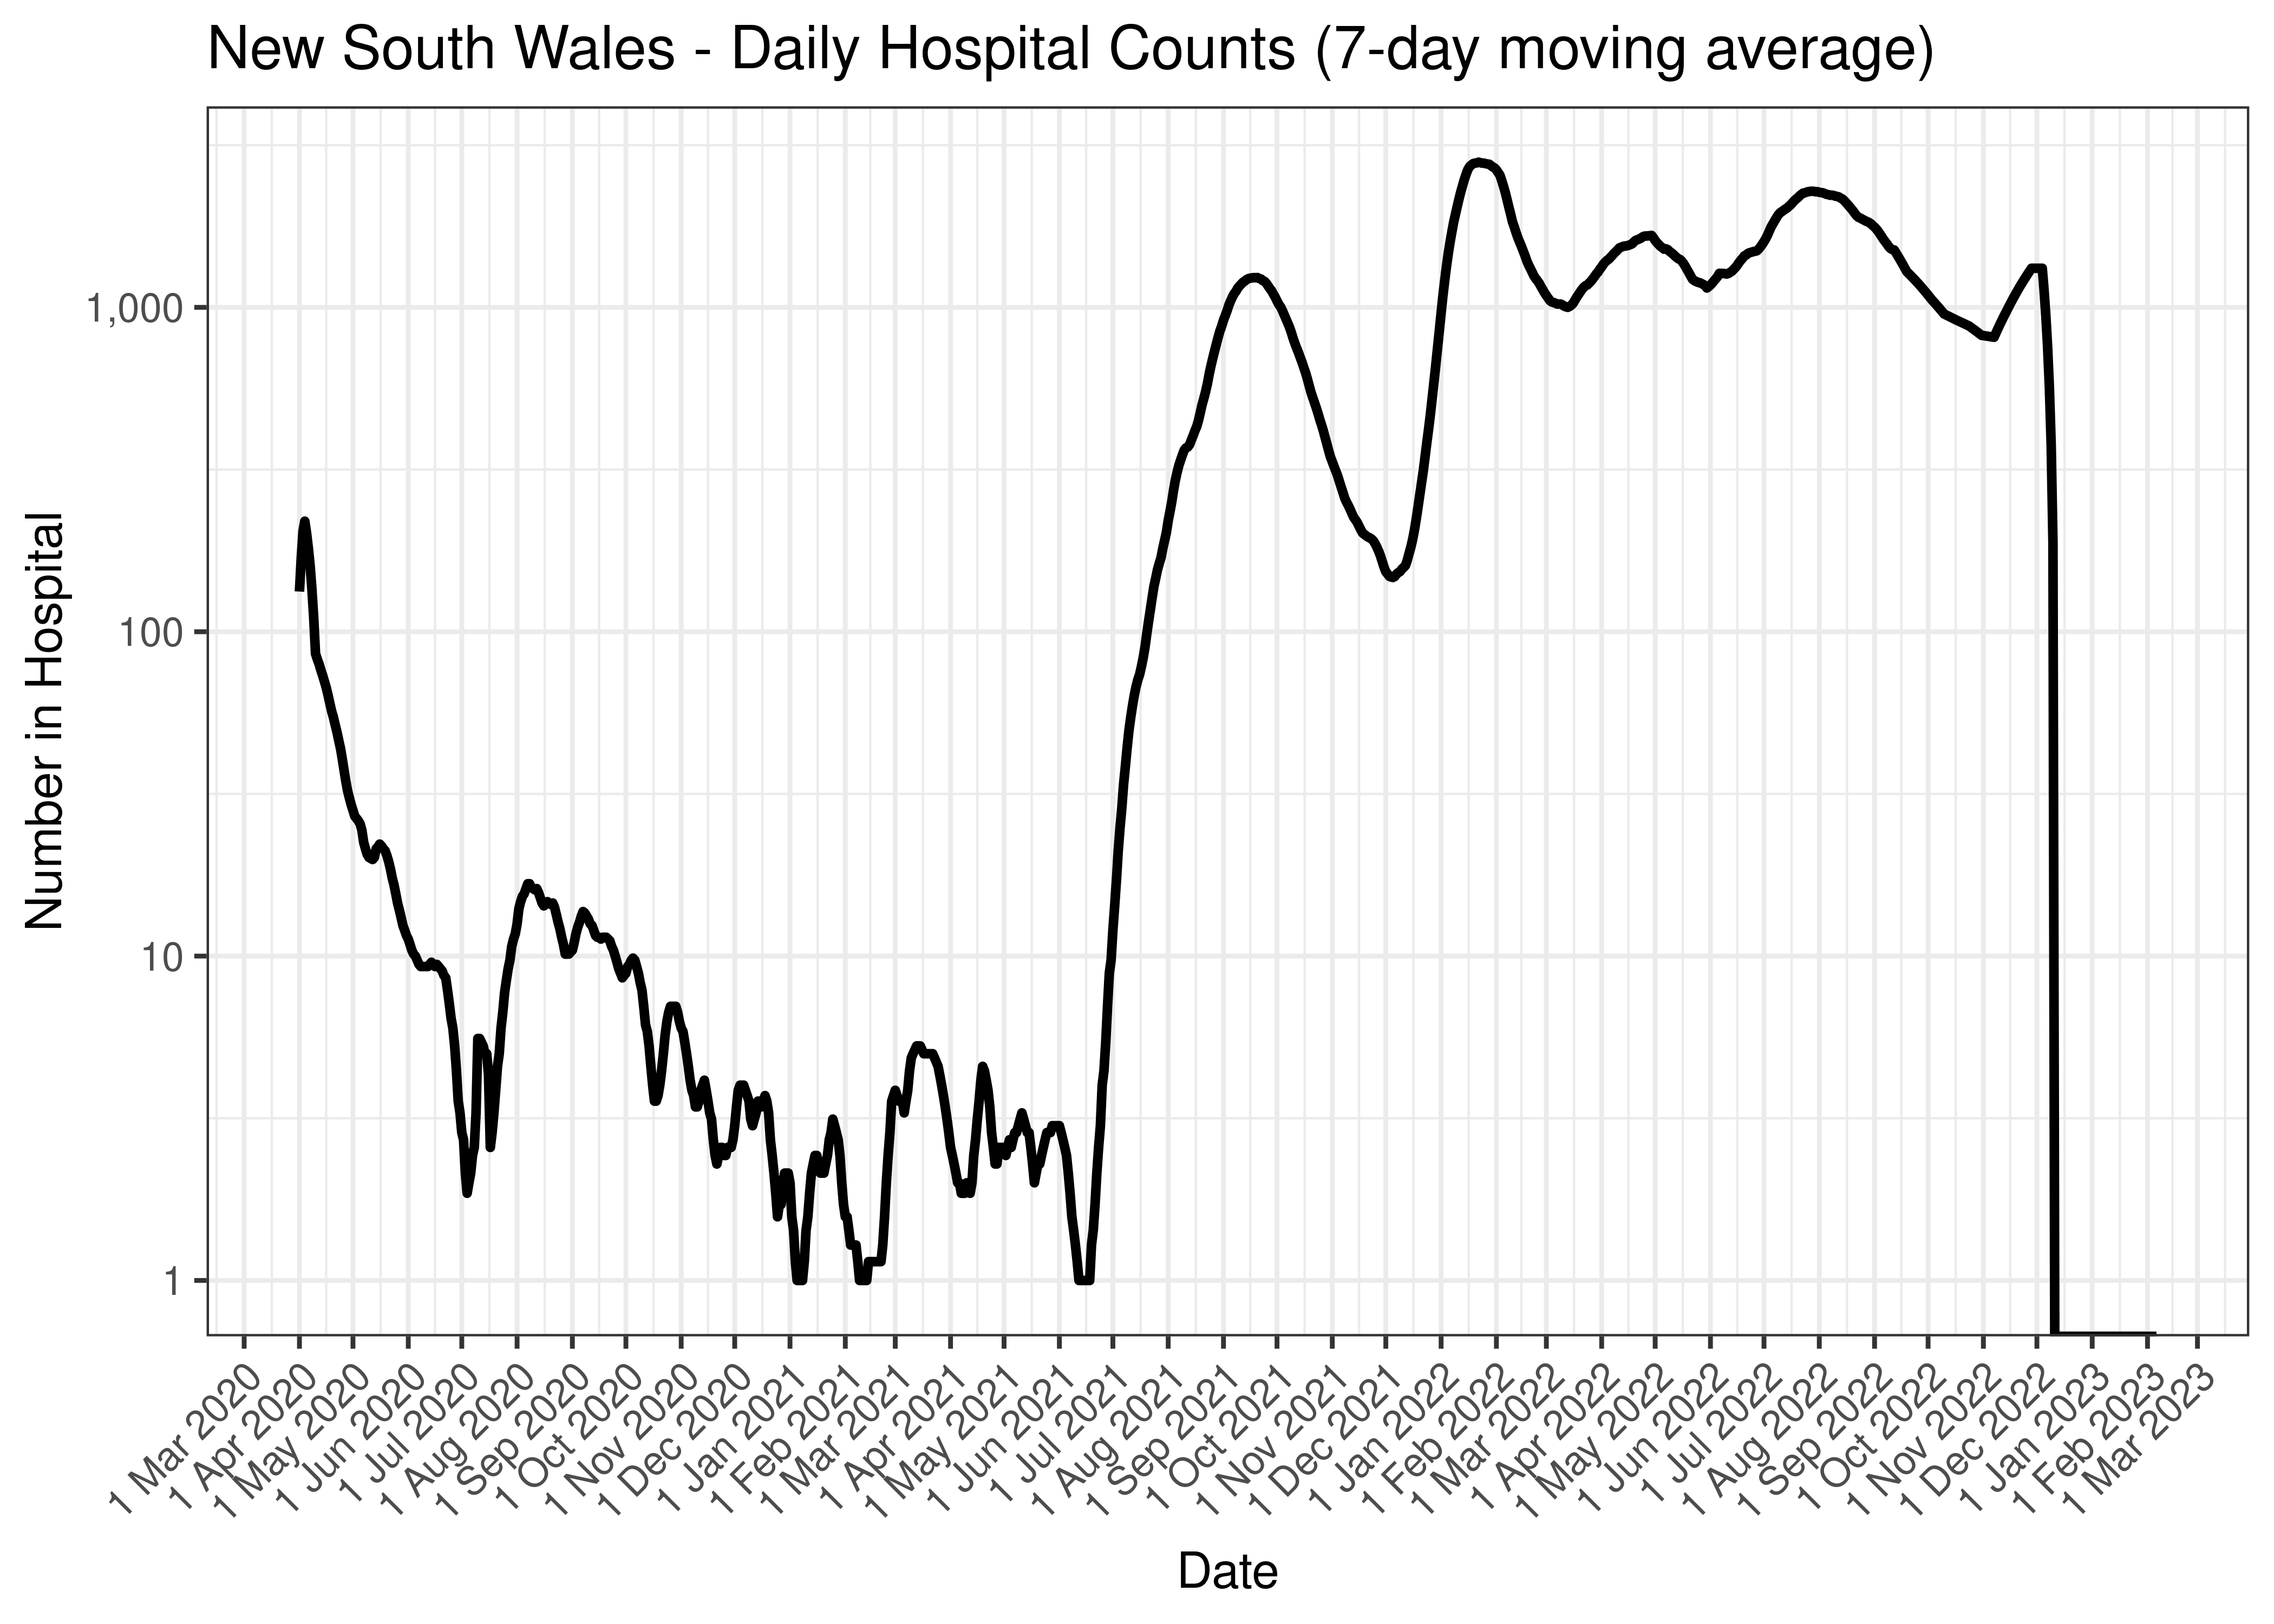
New South Wales - Daily Hospital Counts (7-day moving average)
Below the above chart is repeated for the last 30-days:
New South Wales - Daily Hospital Counts for Last 30-days (7-day moving average)
5.3.4 ICU
Counts of those in ICU are tabulated by report date below. A centred 7-day moving average is also shown. The peak daily admissions in previous waves (as measured by the moving average) is also shown.
| Date | In ICU | 7-day Moving Average | Comment |
|---|---|---|---|
| 2020-04-04 | 41 | 41 | Wave 1 Peak |
| 2021-09-21 | 242 | 236 | Wave 3 Peak |
| 2022-01-19 | 217 | 206 | Wave 4 Peak (to date) |
| 2023-02-03 | 0 | 0 | |
| 2023-02-04 | 0 | 0 | |
| 2023-02-05 | 0 | 0 | |
| 2023-02-06 | 0 | 0 | |
| 2023-02-07 | 0 | NA | |
| 2023-02-08 | 0 | NA | |
| 2023-02-09 | 0 | NA | |
| 2023-02-10 | NA | NA |
The above are based on the following dates:
- Wave 1 started on 2020-01-01.
- Wave 2 started on 2020-06-01.
- Wave 3 started on 2021-06-01.
- Wave 4 started on 2021-12-01.
Below a 7-day moving average of daily ICU counts is plotted by on a log scale since start of the epidemic. Note admissions are plotted by date.
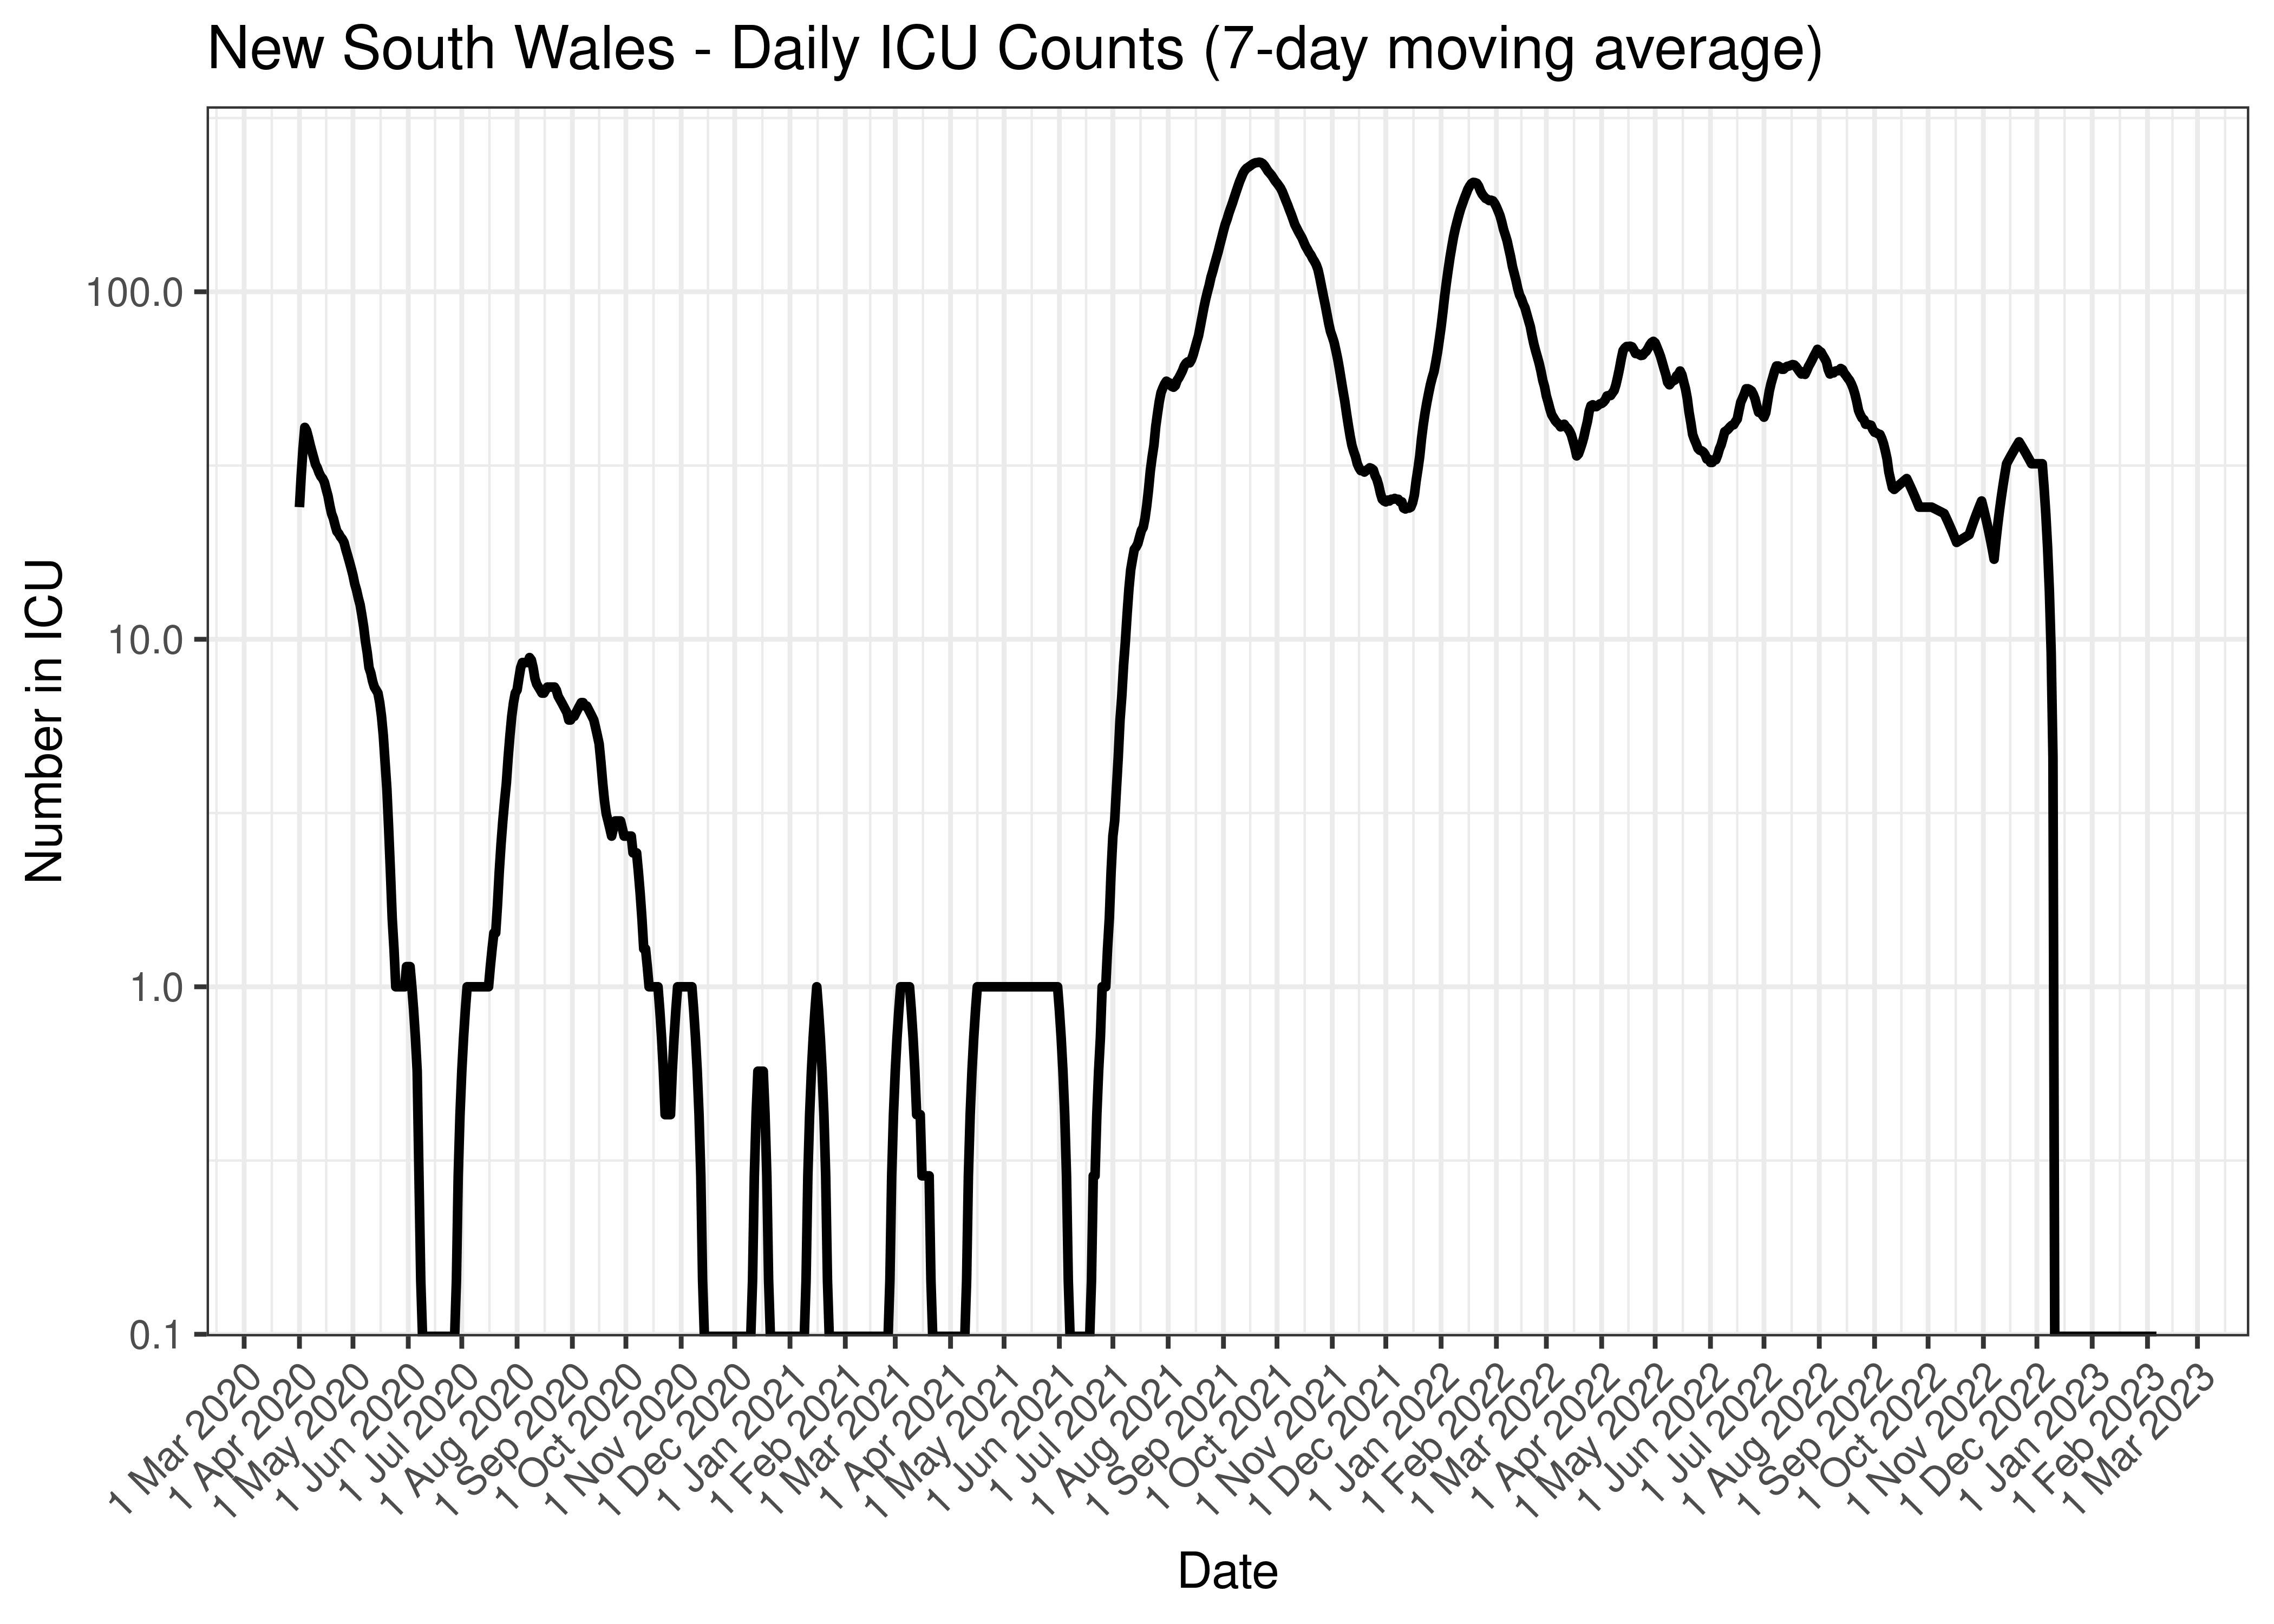
New South Wales - Daily ICU Counts (7-day moving average)
Below the above chart is repeated for the last 30-days:
New South Wales - Daily ICU Counts for Last 30-days (7-day moving average)
5.3.5 Ventilator
Counts of those on ventilators are tabulated by report date below. A centred 7-day moving average is also shown. The peak daily admissions in previous waves (as measured by the moving average) is also shown.
| Date | On Ventilators | 7-day Moving Average | Comment |
|---|---|---|---|
| 2020-04-08 | 23 | 23 | Wave 1 Peak |
| 2021-09-20 | 123 | 119 | Wave 3 Peak |
| 2022-01-27 | 72 | 74 | Wave 4 Peak (to date) |
| 2023-02-03 | 0 | 0 | |
| 2023-02-04 | 0 | 0 | |
| 2023-02-05 | 0 | 0 | |
| 2023-02-06 | 0 | 0 | |
| 2023-02-07 | 0 | NA | |
| 2023-02-08 | 0 | NA | |
| 2023-02-09 | 0 | NA | |
| 2023-02-10 | NA | NA |
The above are based on the following dates:
- Wave 1 started on 2020-01-01.
- Wave 2 started on 2020-06-01.
- Wave 3 started on 2021-06-01.
- Wave 4 started on 2021-12-01.
Below a 7-day moving average of daily ventilator counts is plotted by on a log scale since start of the epidemic. Note admissions are plotted by date.
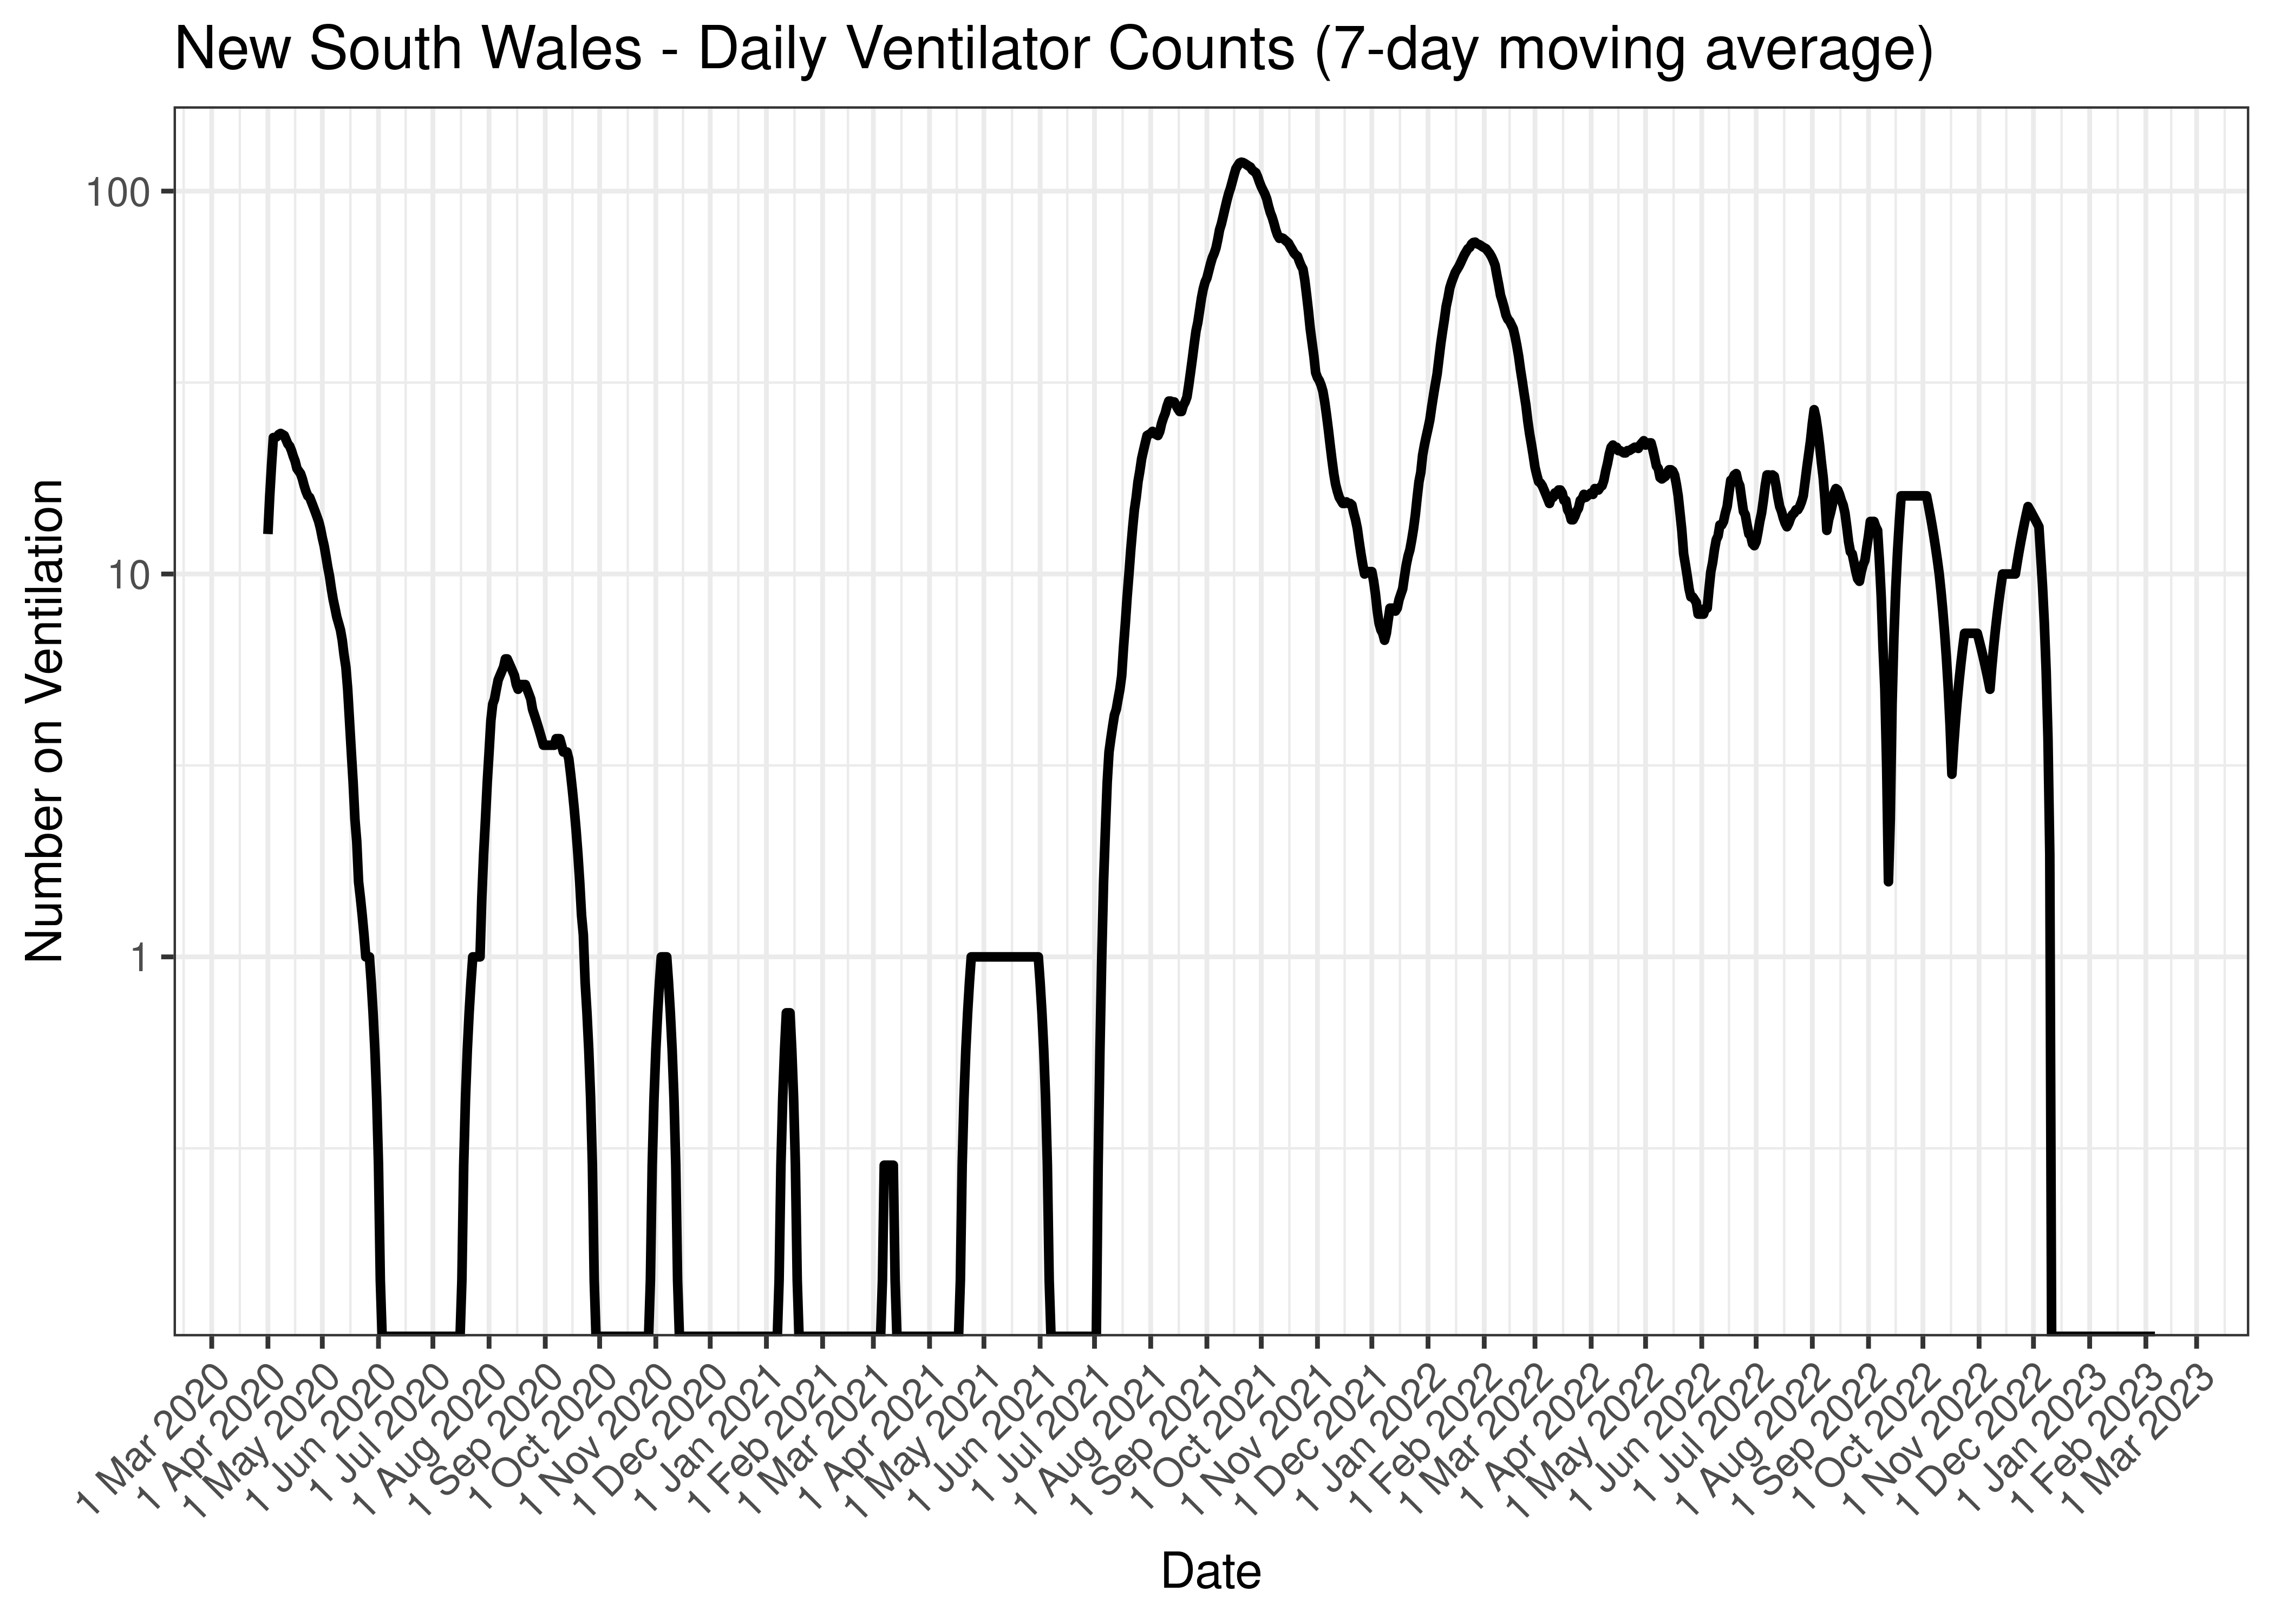
New South Wales - Daily Ventilator Counts (7-day moving average)
Below the above chart is repeated for the last 30-days:
New South Wales - Daily Ventilator Counts for Last 30-days (7-day moving average)
5.3.6 Deaths
Deaths are tabulated by report date below. A centred 7-day moving average is also shown. The peak daily deaths in previous waves (as measured by the moving average) is also shown.
| Date | Deaths | 7-day Moving Average | Comment |
|---|---|---|---|
| 2021-09-28 | 7 | 11 | Wave 3 Peak |
| 2021-09-30 | 6 | 11 | Wave 3 Peak |
| 2022-01-31 | 27 | 37 | Wave 4 Peak (to date) |
| 2023-02-03 | 88 | 13 | |
| 2023-02-04 | 0 | 13 | |
| 2023-02-05 | 0 | 13 | |
| 2023-02-06 | 0 | 13 | |
| 2023-02-07 | 0 | 9 | |
| 2023-02-08 | 0 | NA | |
| 2023-02-09 | 0 | NA | |
| 2023-02-10 | 62 | NA |
The above are based on the following dates:
- Wave 1 started on 2020-01-01.
- Wave 2 started on 2020-06-01.
- Wave 3 started on 2021-06-01.
- Wave 4 started on 2021-12-01.
Below a 7-day moving average of daily deaths is plotted by on a log scale since start of the epidemic.
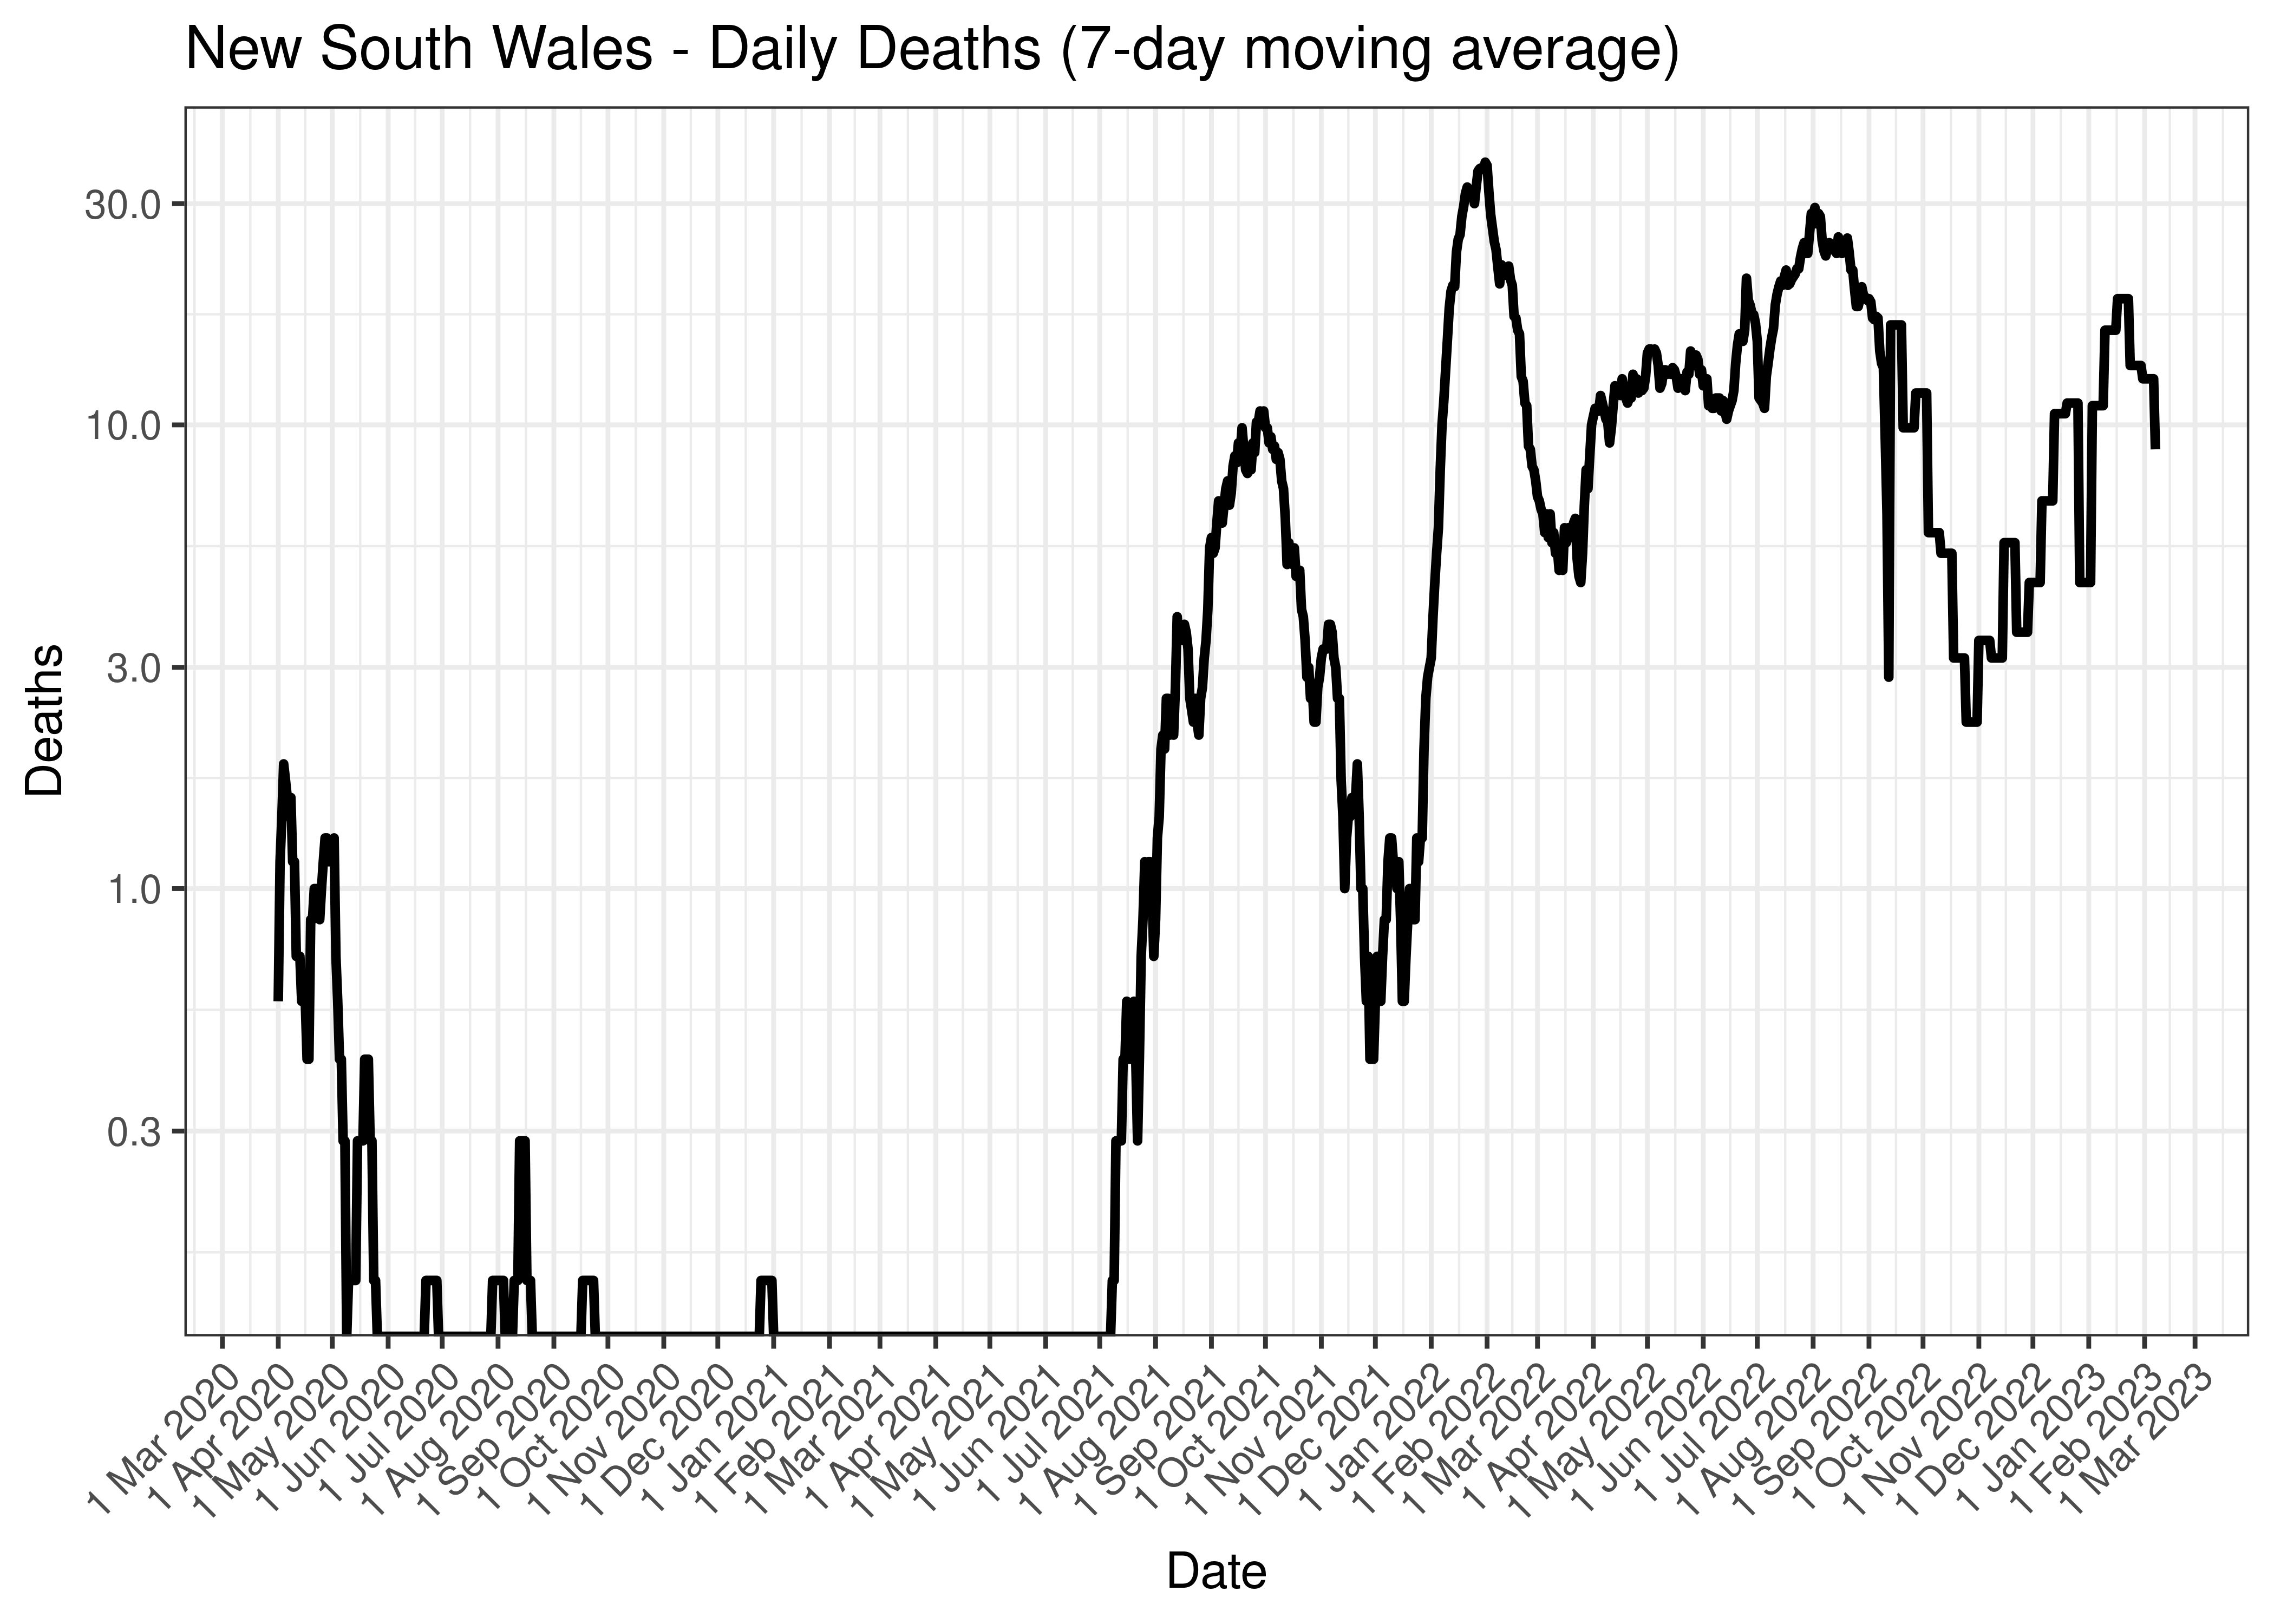
New South Wales - Daily Deaths (7-day moving average)
Below the above chart is repeated for the last 30-days:
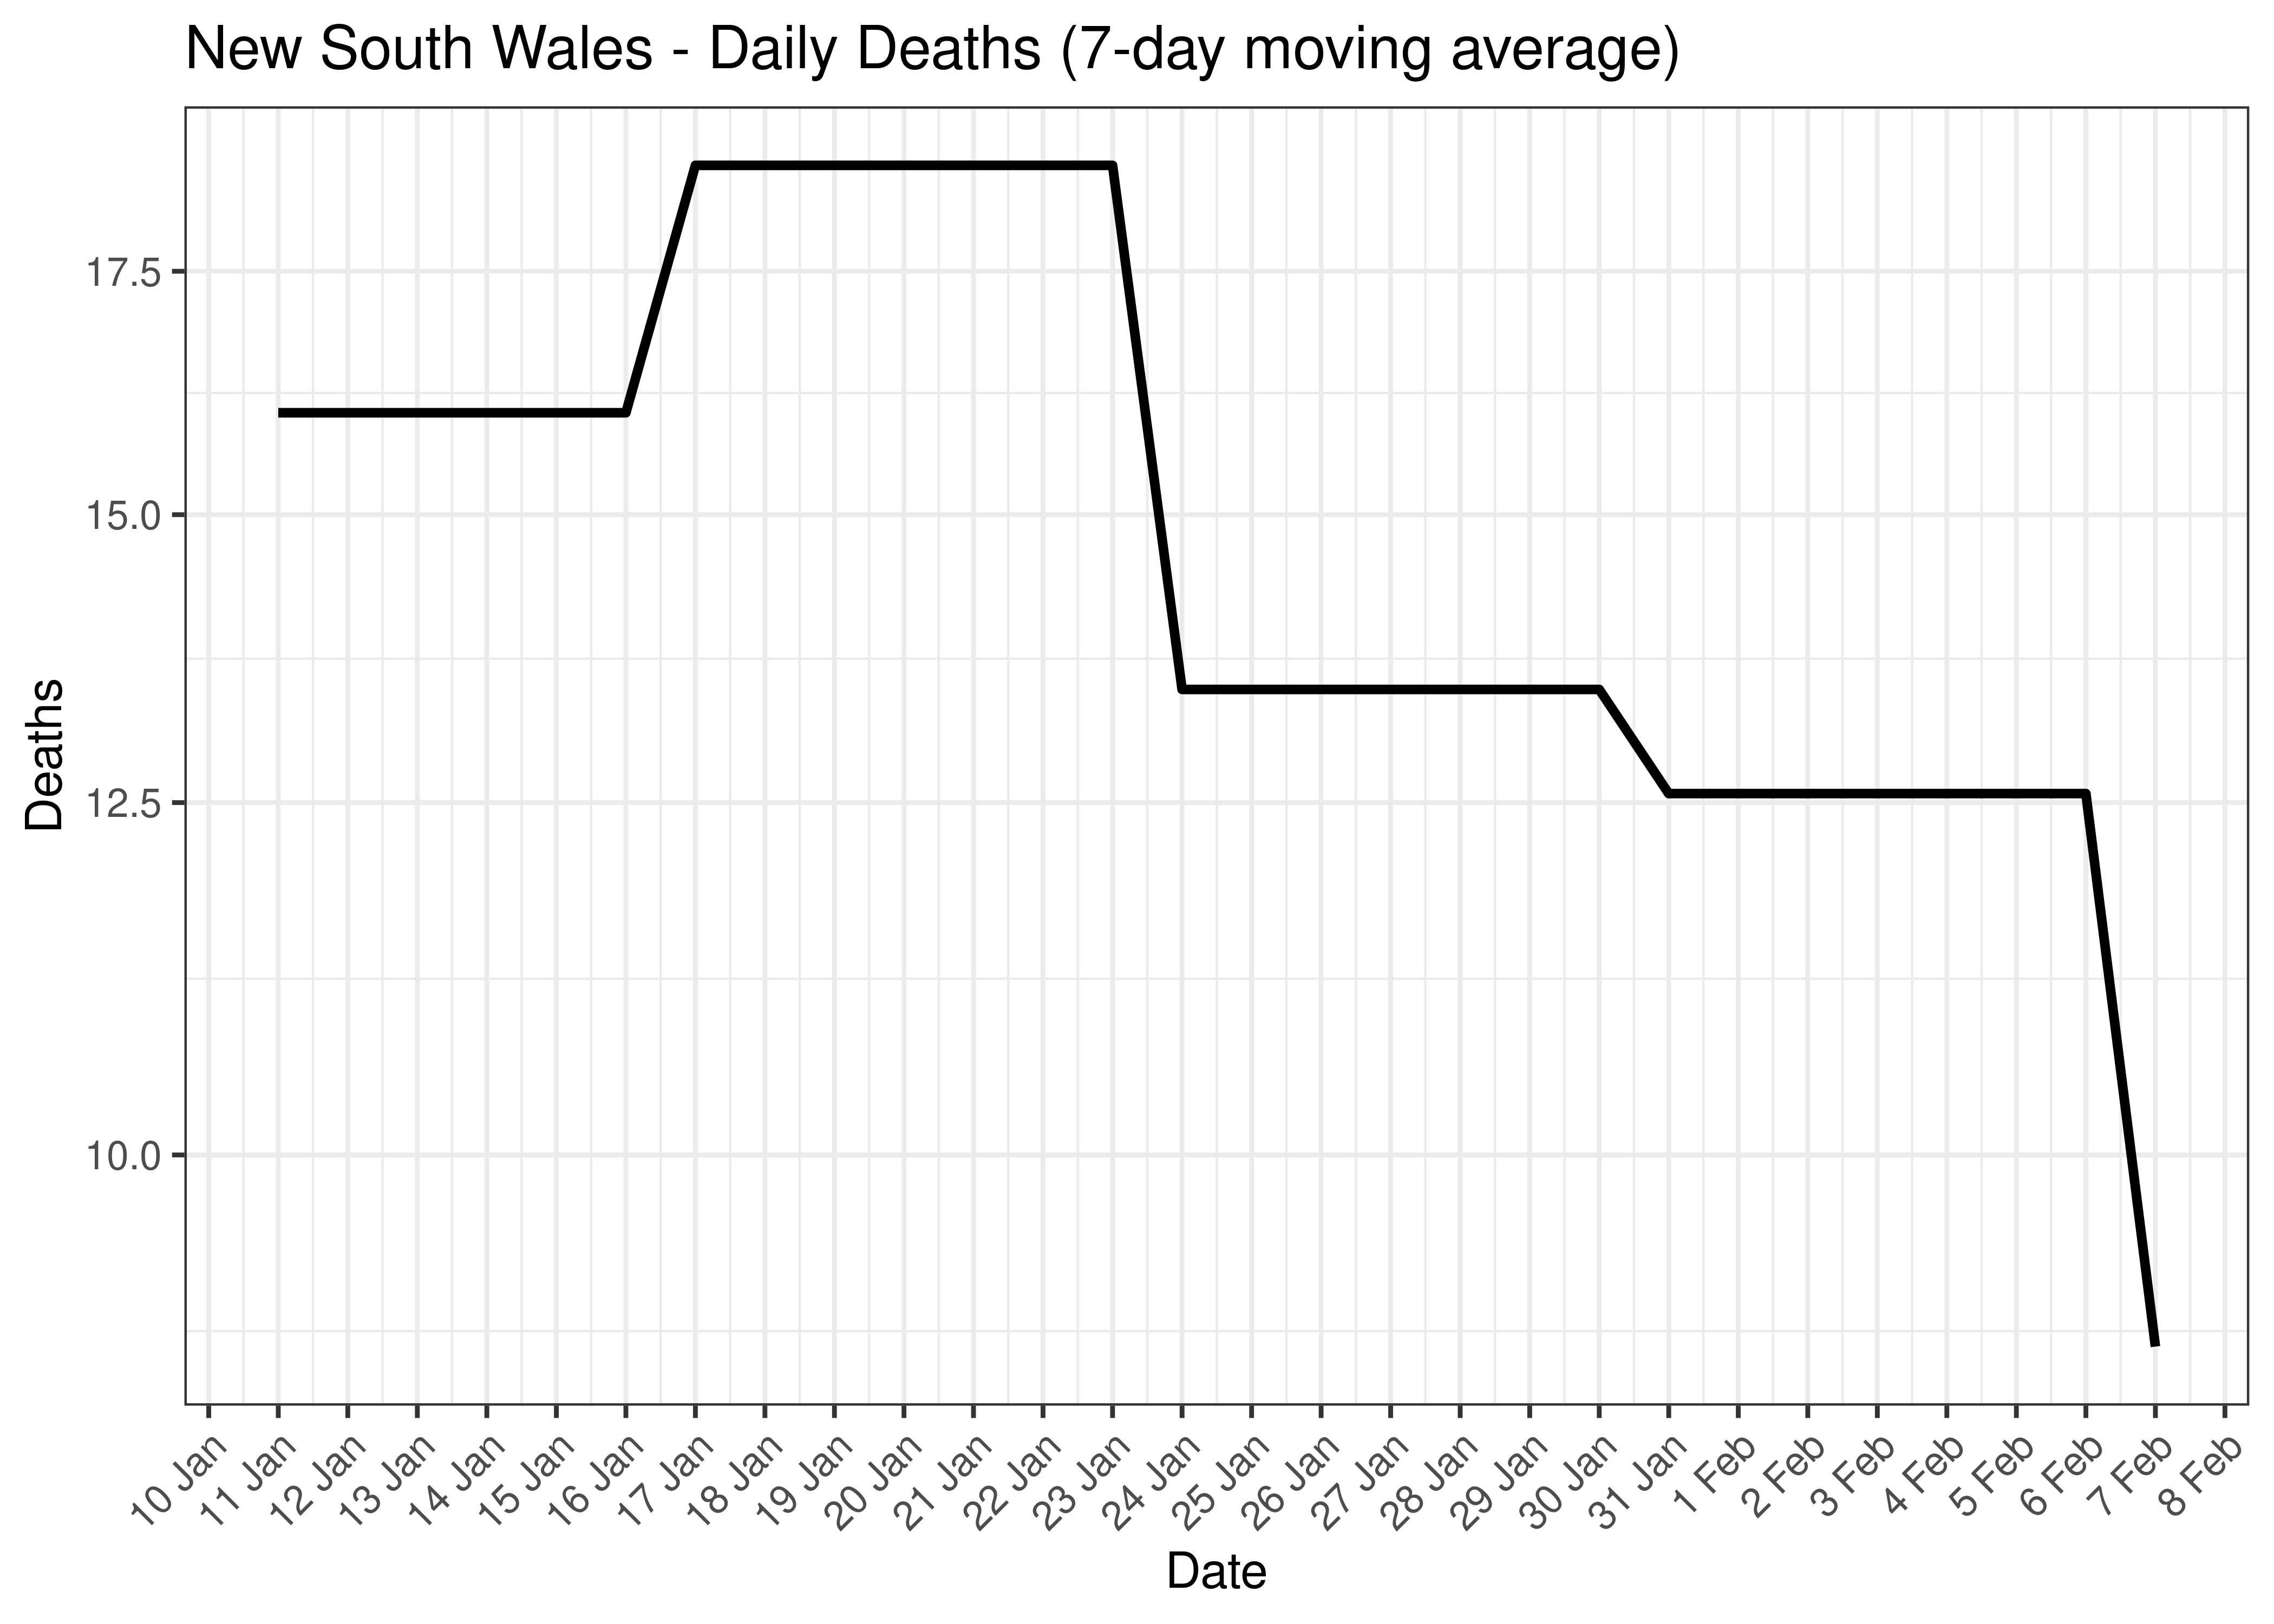
New South Wales - Daily Deaths for Last 30-days (7-day moving average)
5.3.7 Cases, Hospital Counts and Deaths Combined
Below a 7-day moving average daily case, hospital counts and deaths are plotted by state on a log scale since start of the epidemic. Note admissions and excess deaths are plotted by date, whereas cases are plotted by specimen received date.
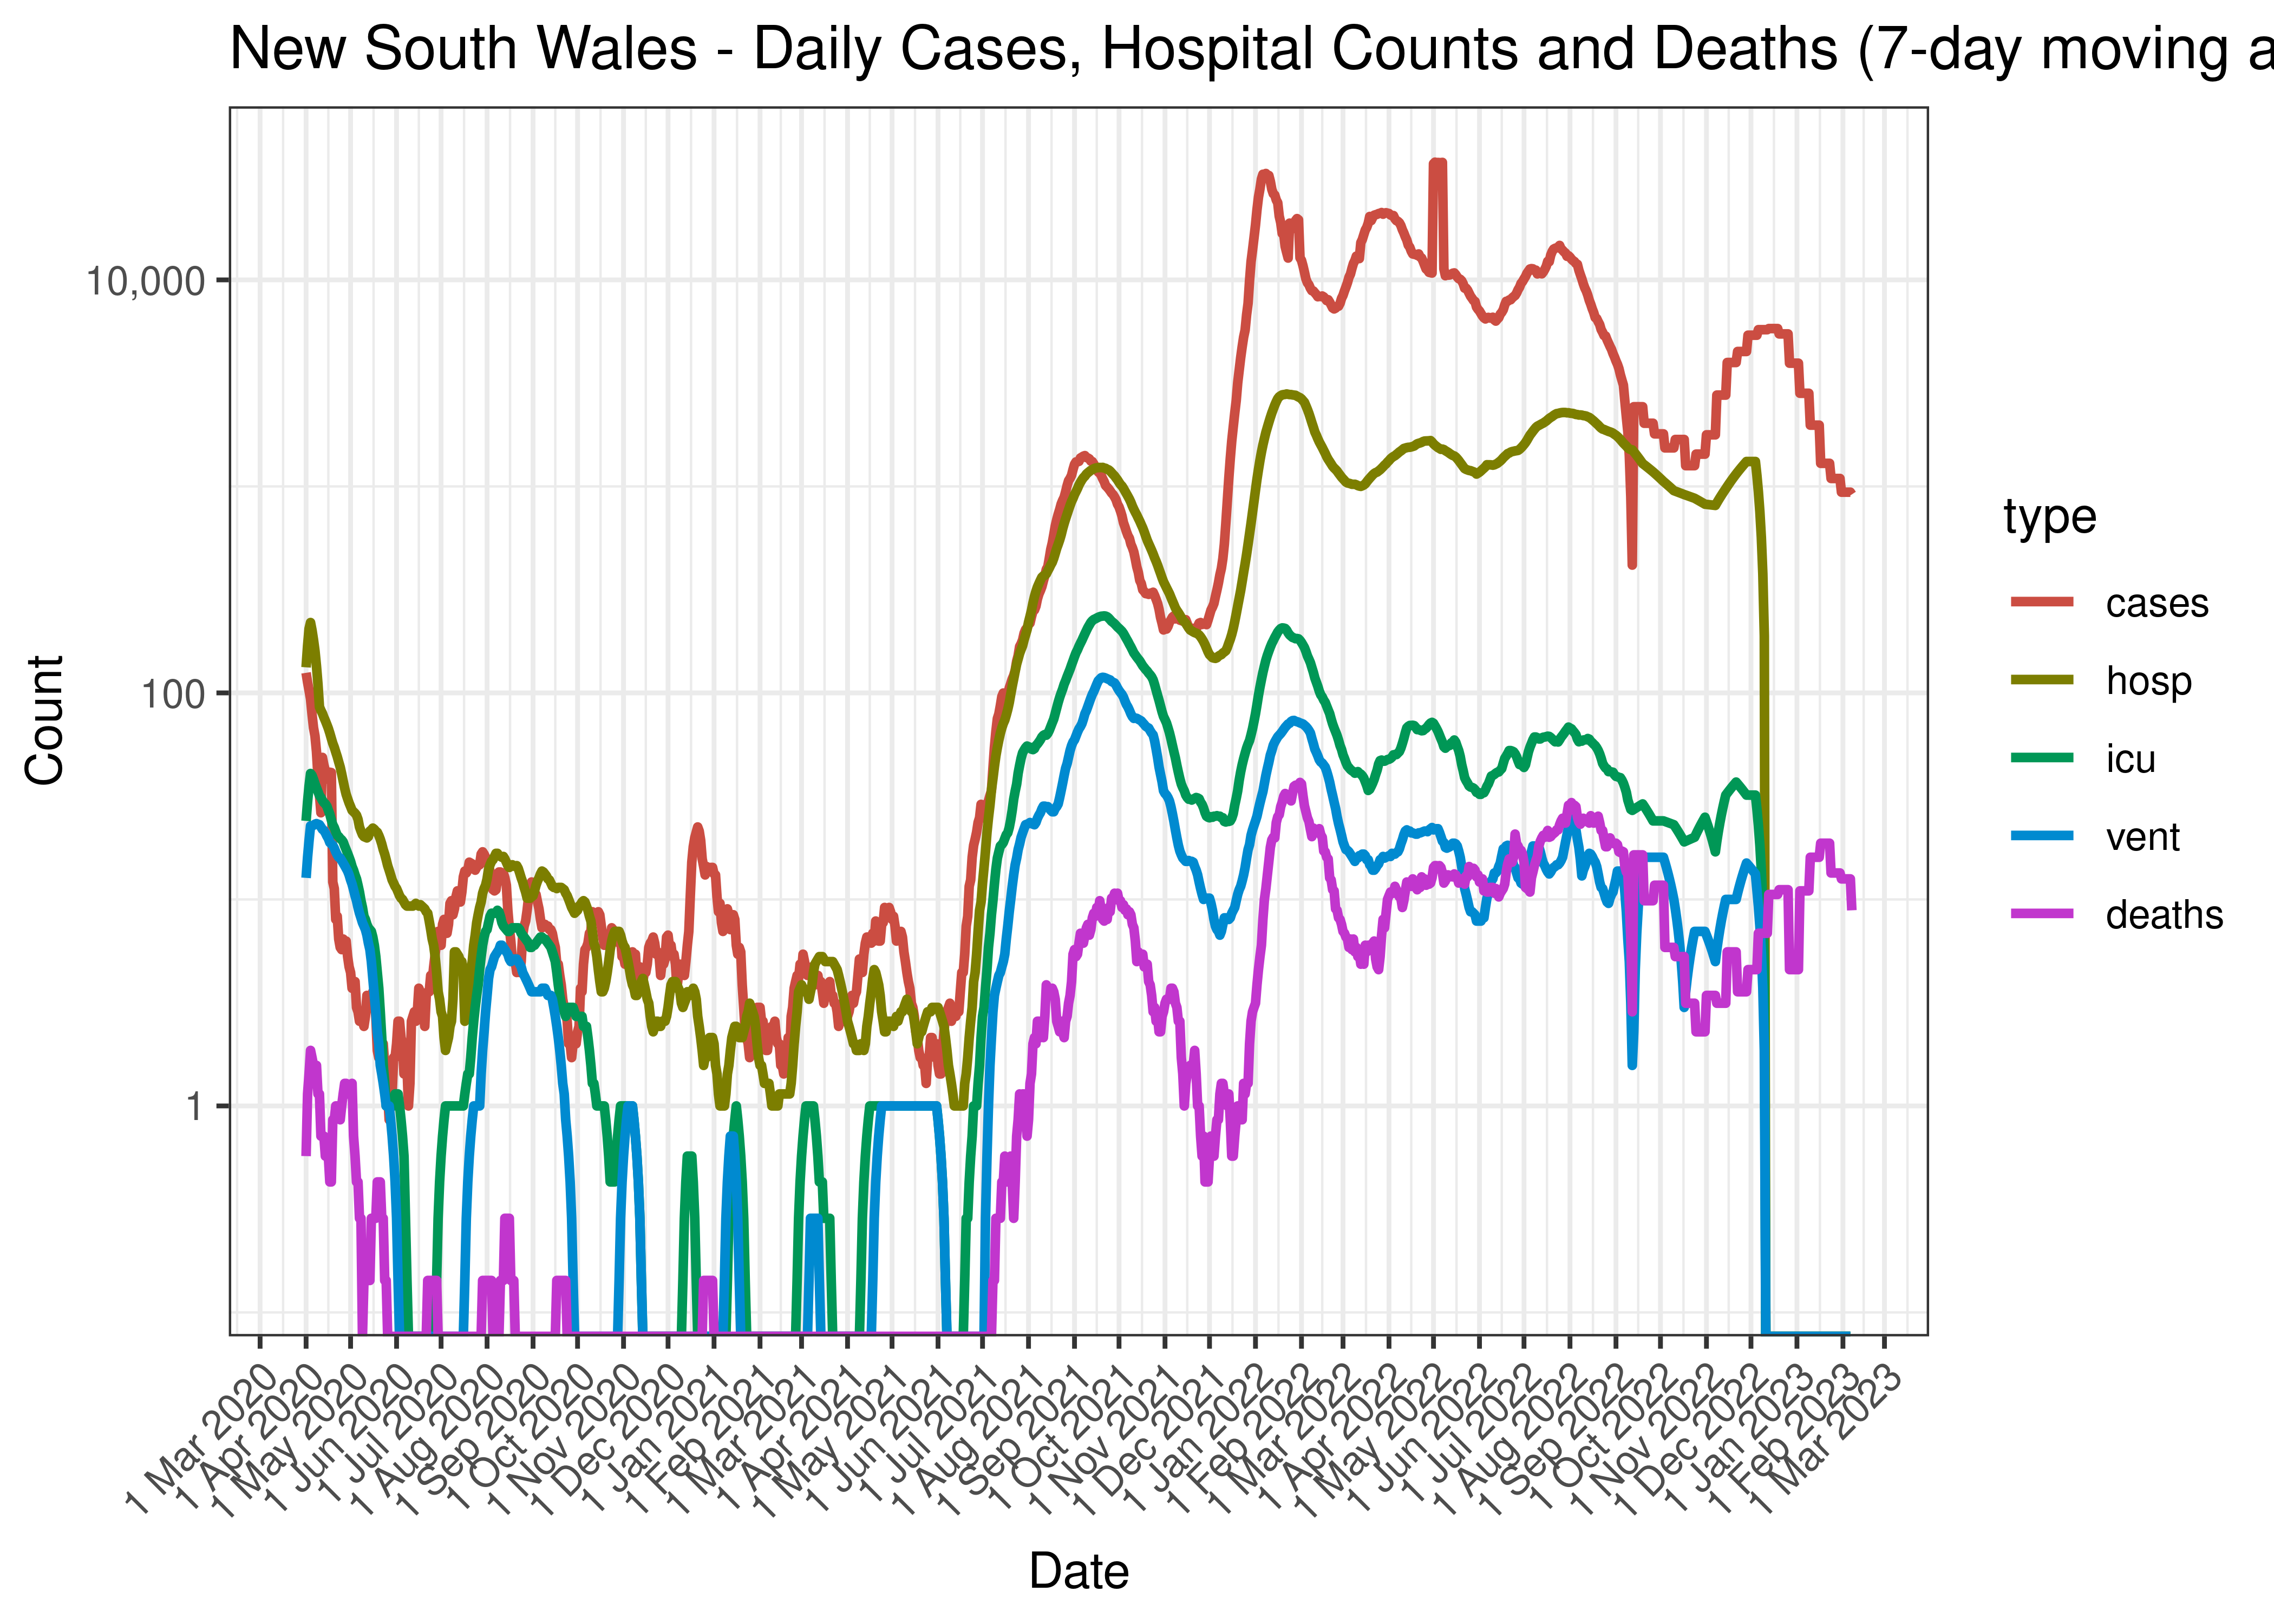
New South Wales - Daily Cases, Hospital Counts and Deaths (7-day moving average)
Below the above chart is repeated for the last 30-days:
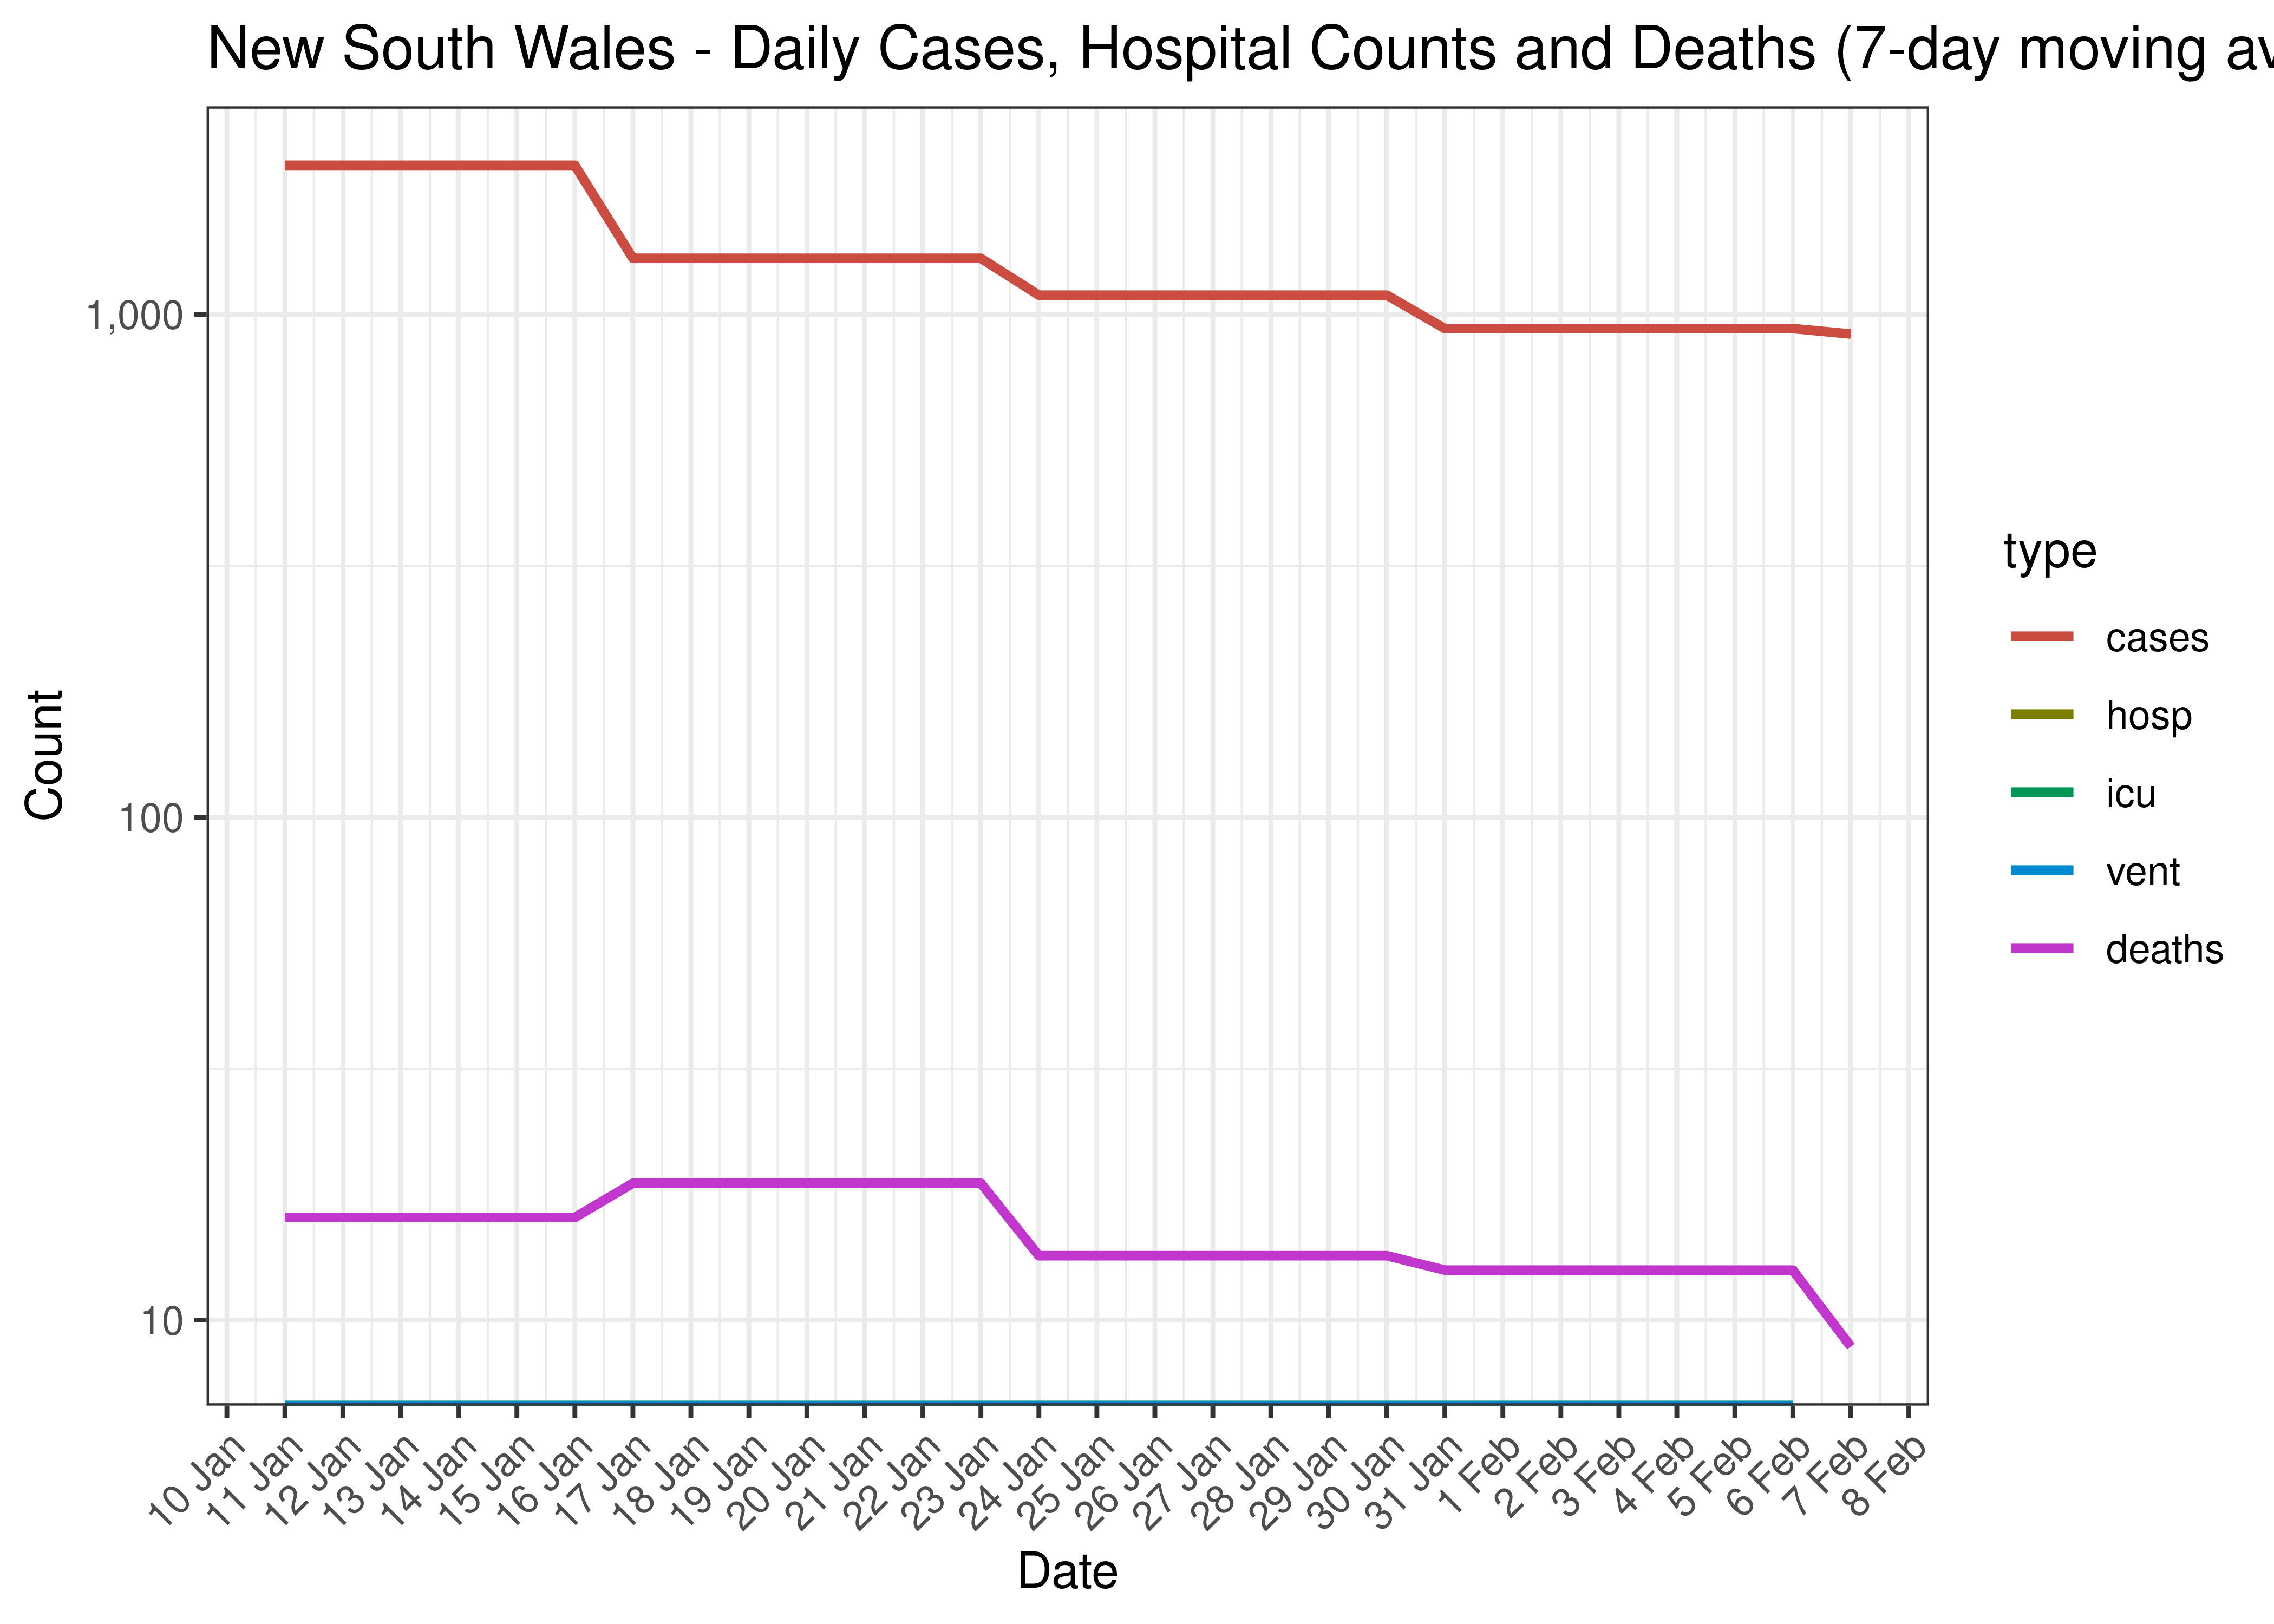
New South Wales - Daily Cases, Admissions and Deaths for Last 30-days (7-day moving average)
5.3.8 Crude Ratios per Wave
Below crude rations are calculated between the waves. It’s based on the following starting dates:
- Wave 1 started on 2020-01-01.
- Wave 2 started on 2020-06-01.
- Wave 3 started on 2021-06-01.
- Wave 4 started on 2021-12-01.
Below crude ratios are tabulated and plotted. These ratios are:
- ICU ratio calculated as person days in ICU divided by person days in hospital.
- Ventilator ratio calculated as person days on ventilators divided by person days in hospital.
- Death ratio calculated as deaths divided by person days in hospital.
- Case fatality ratio is calcualted as deaths divided by cases.
| Wave | ICU Ratio | Ventilator Ratio | Death Ratio | Case Fatality Ratio | |
|---|---|---|---|---|---|
| New South Wales | Wave 1 | 29.7% | 21.0% | 1.4% | 1.49% |
| New South Wales | Wave 2 | 28.4% | 14.7% | 0.3% | 0.26% |
| New South Wales | Wave 3 | 19.1% | 8.7% | 0.7% | 0.75% |
| New South Wales | Wave 4 | 4.0% | 1.4% | 0.9% | 0.13% |
5.3.9 Reproduction Number
Below current (last weekly) effective reproduction number estimates are tabulated for Australia and by state.
| Type | Count (Per Day) | Week Ending | Reproduction Number [95% Confidence Interval] | |
|---|---|---|---|---|
| New South Wales | cases | 914 | 2023-02-10 | 0.95 [0.92 - 0.98] |
Below the effective reproduction number for Australia over the last 90 days are plotted together with a plot since start of the pandemic.
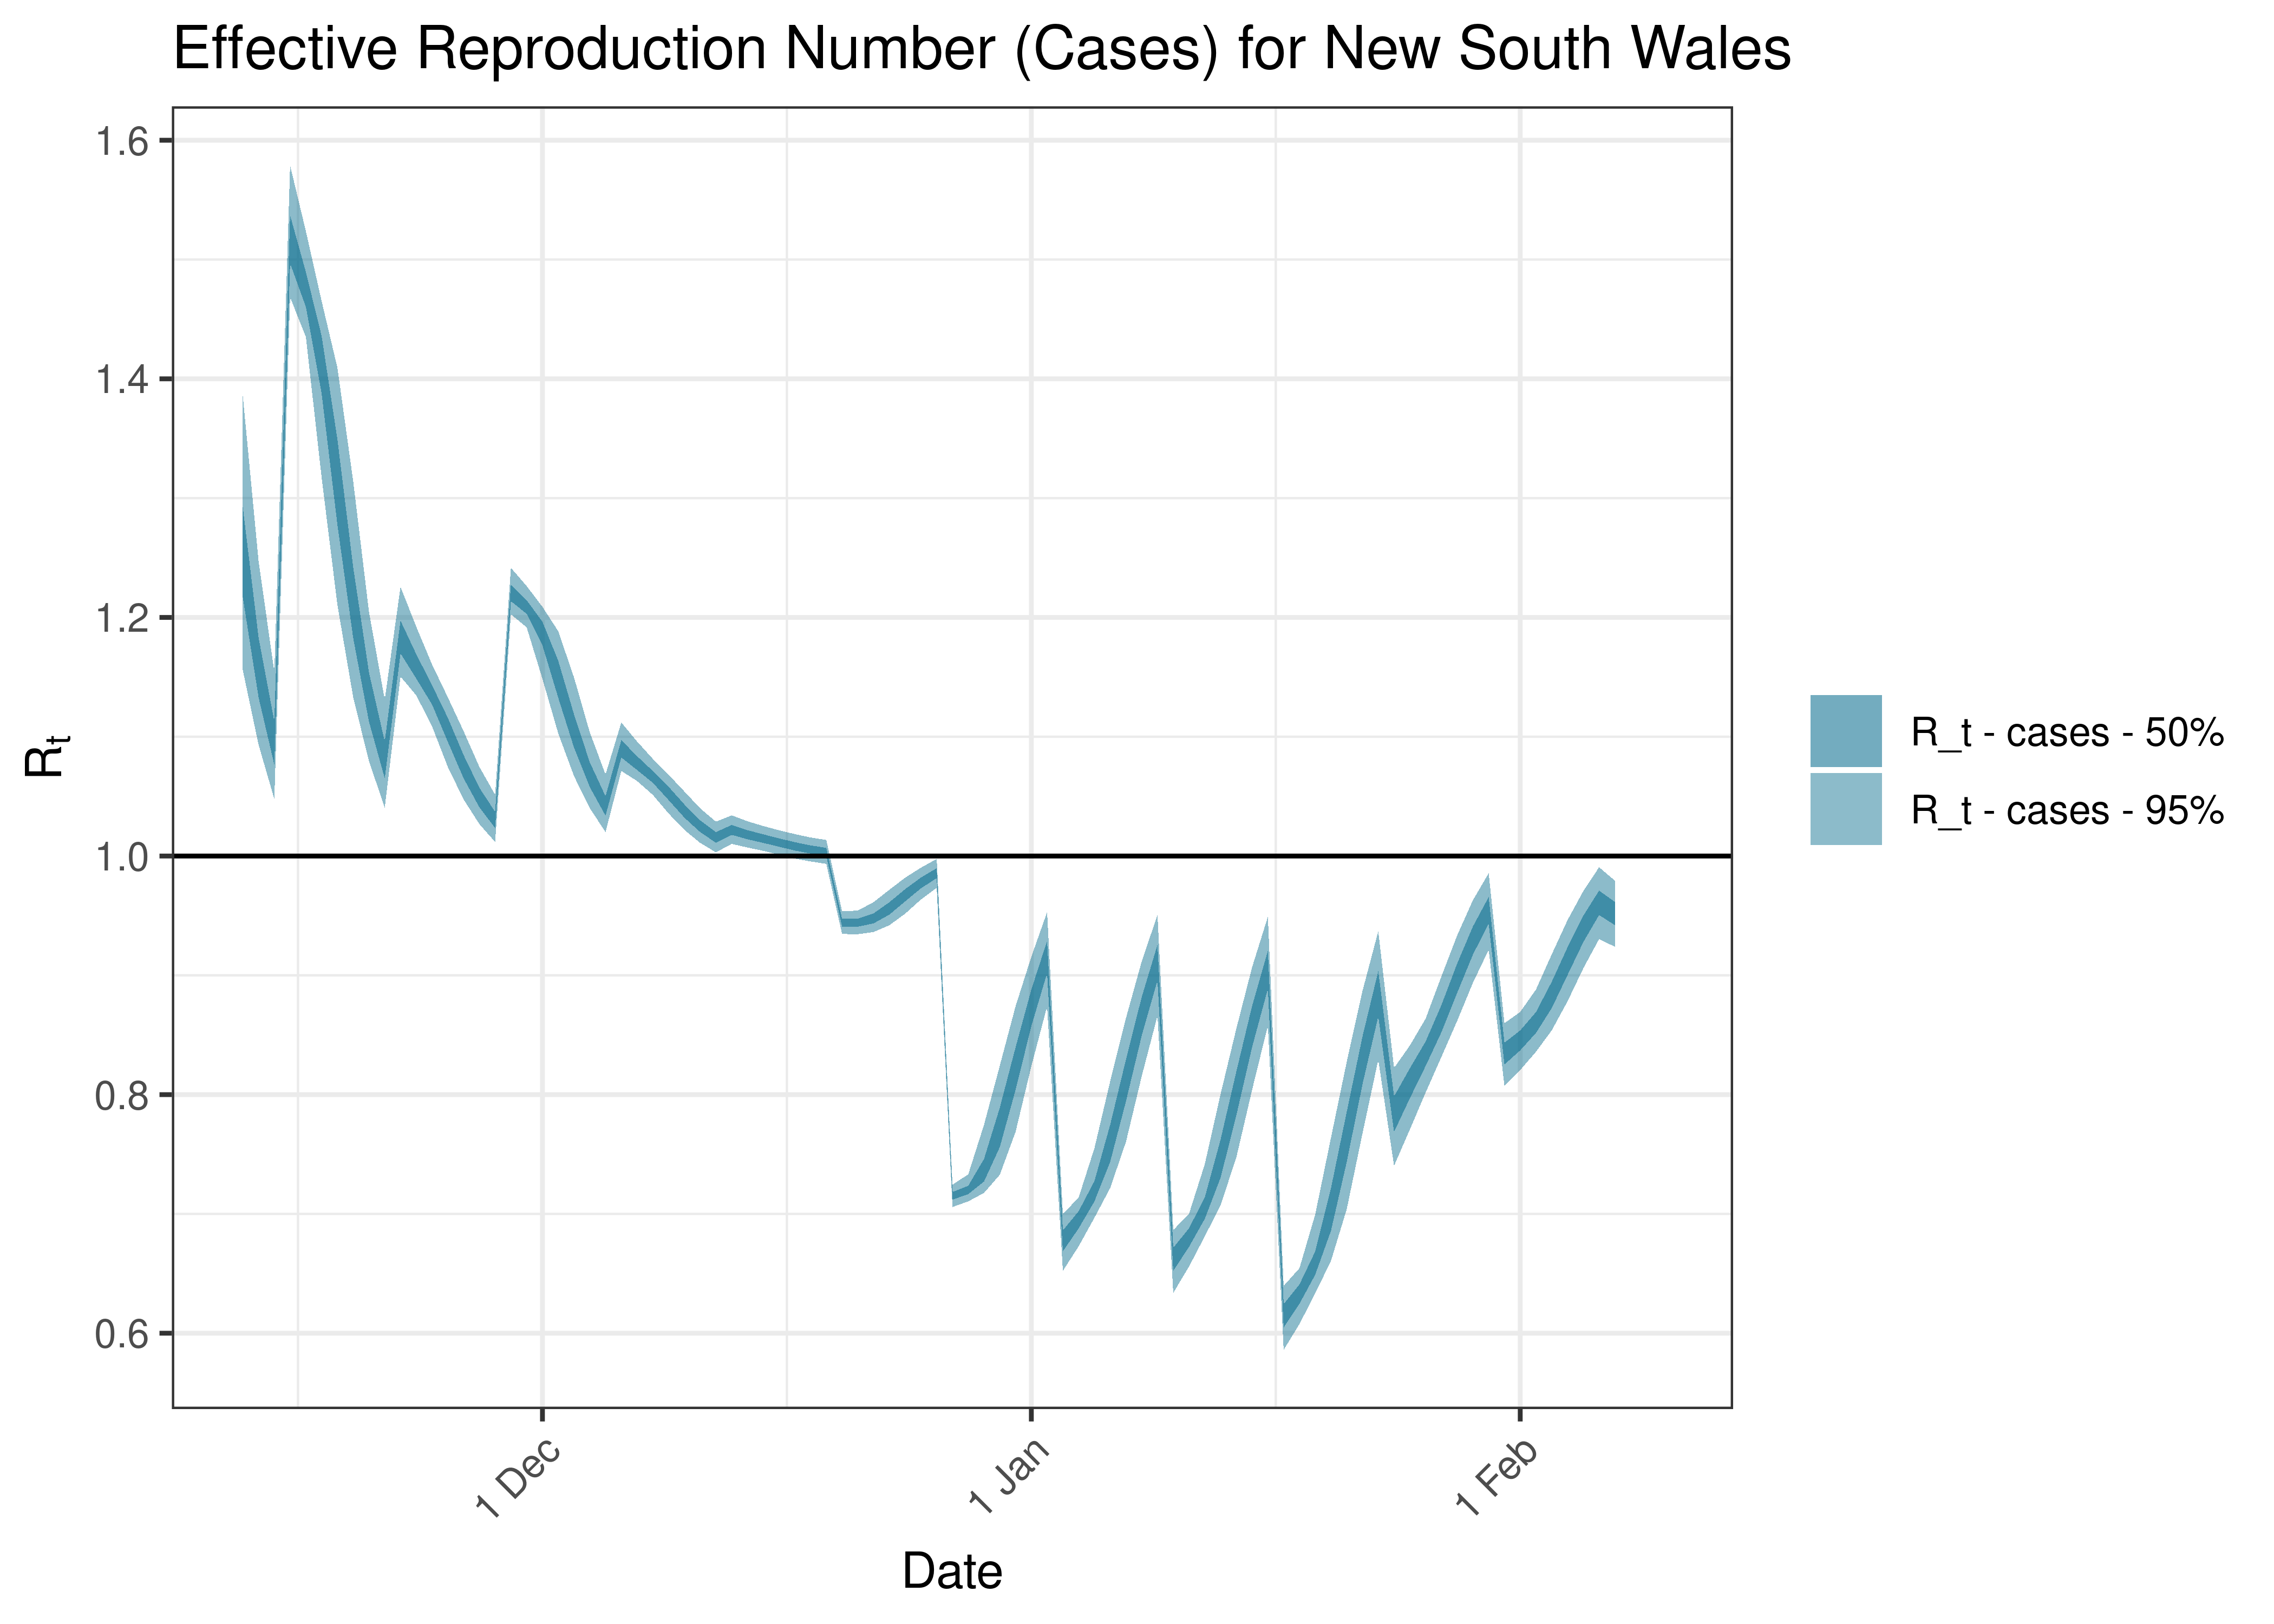
Estimated Effective Reproduction Number Based on Cases for New South Wales over last 90 days
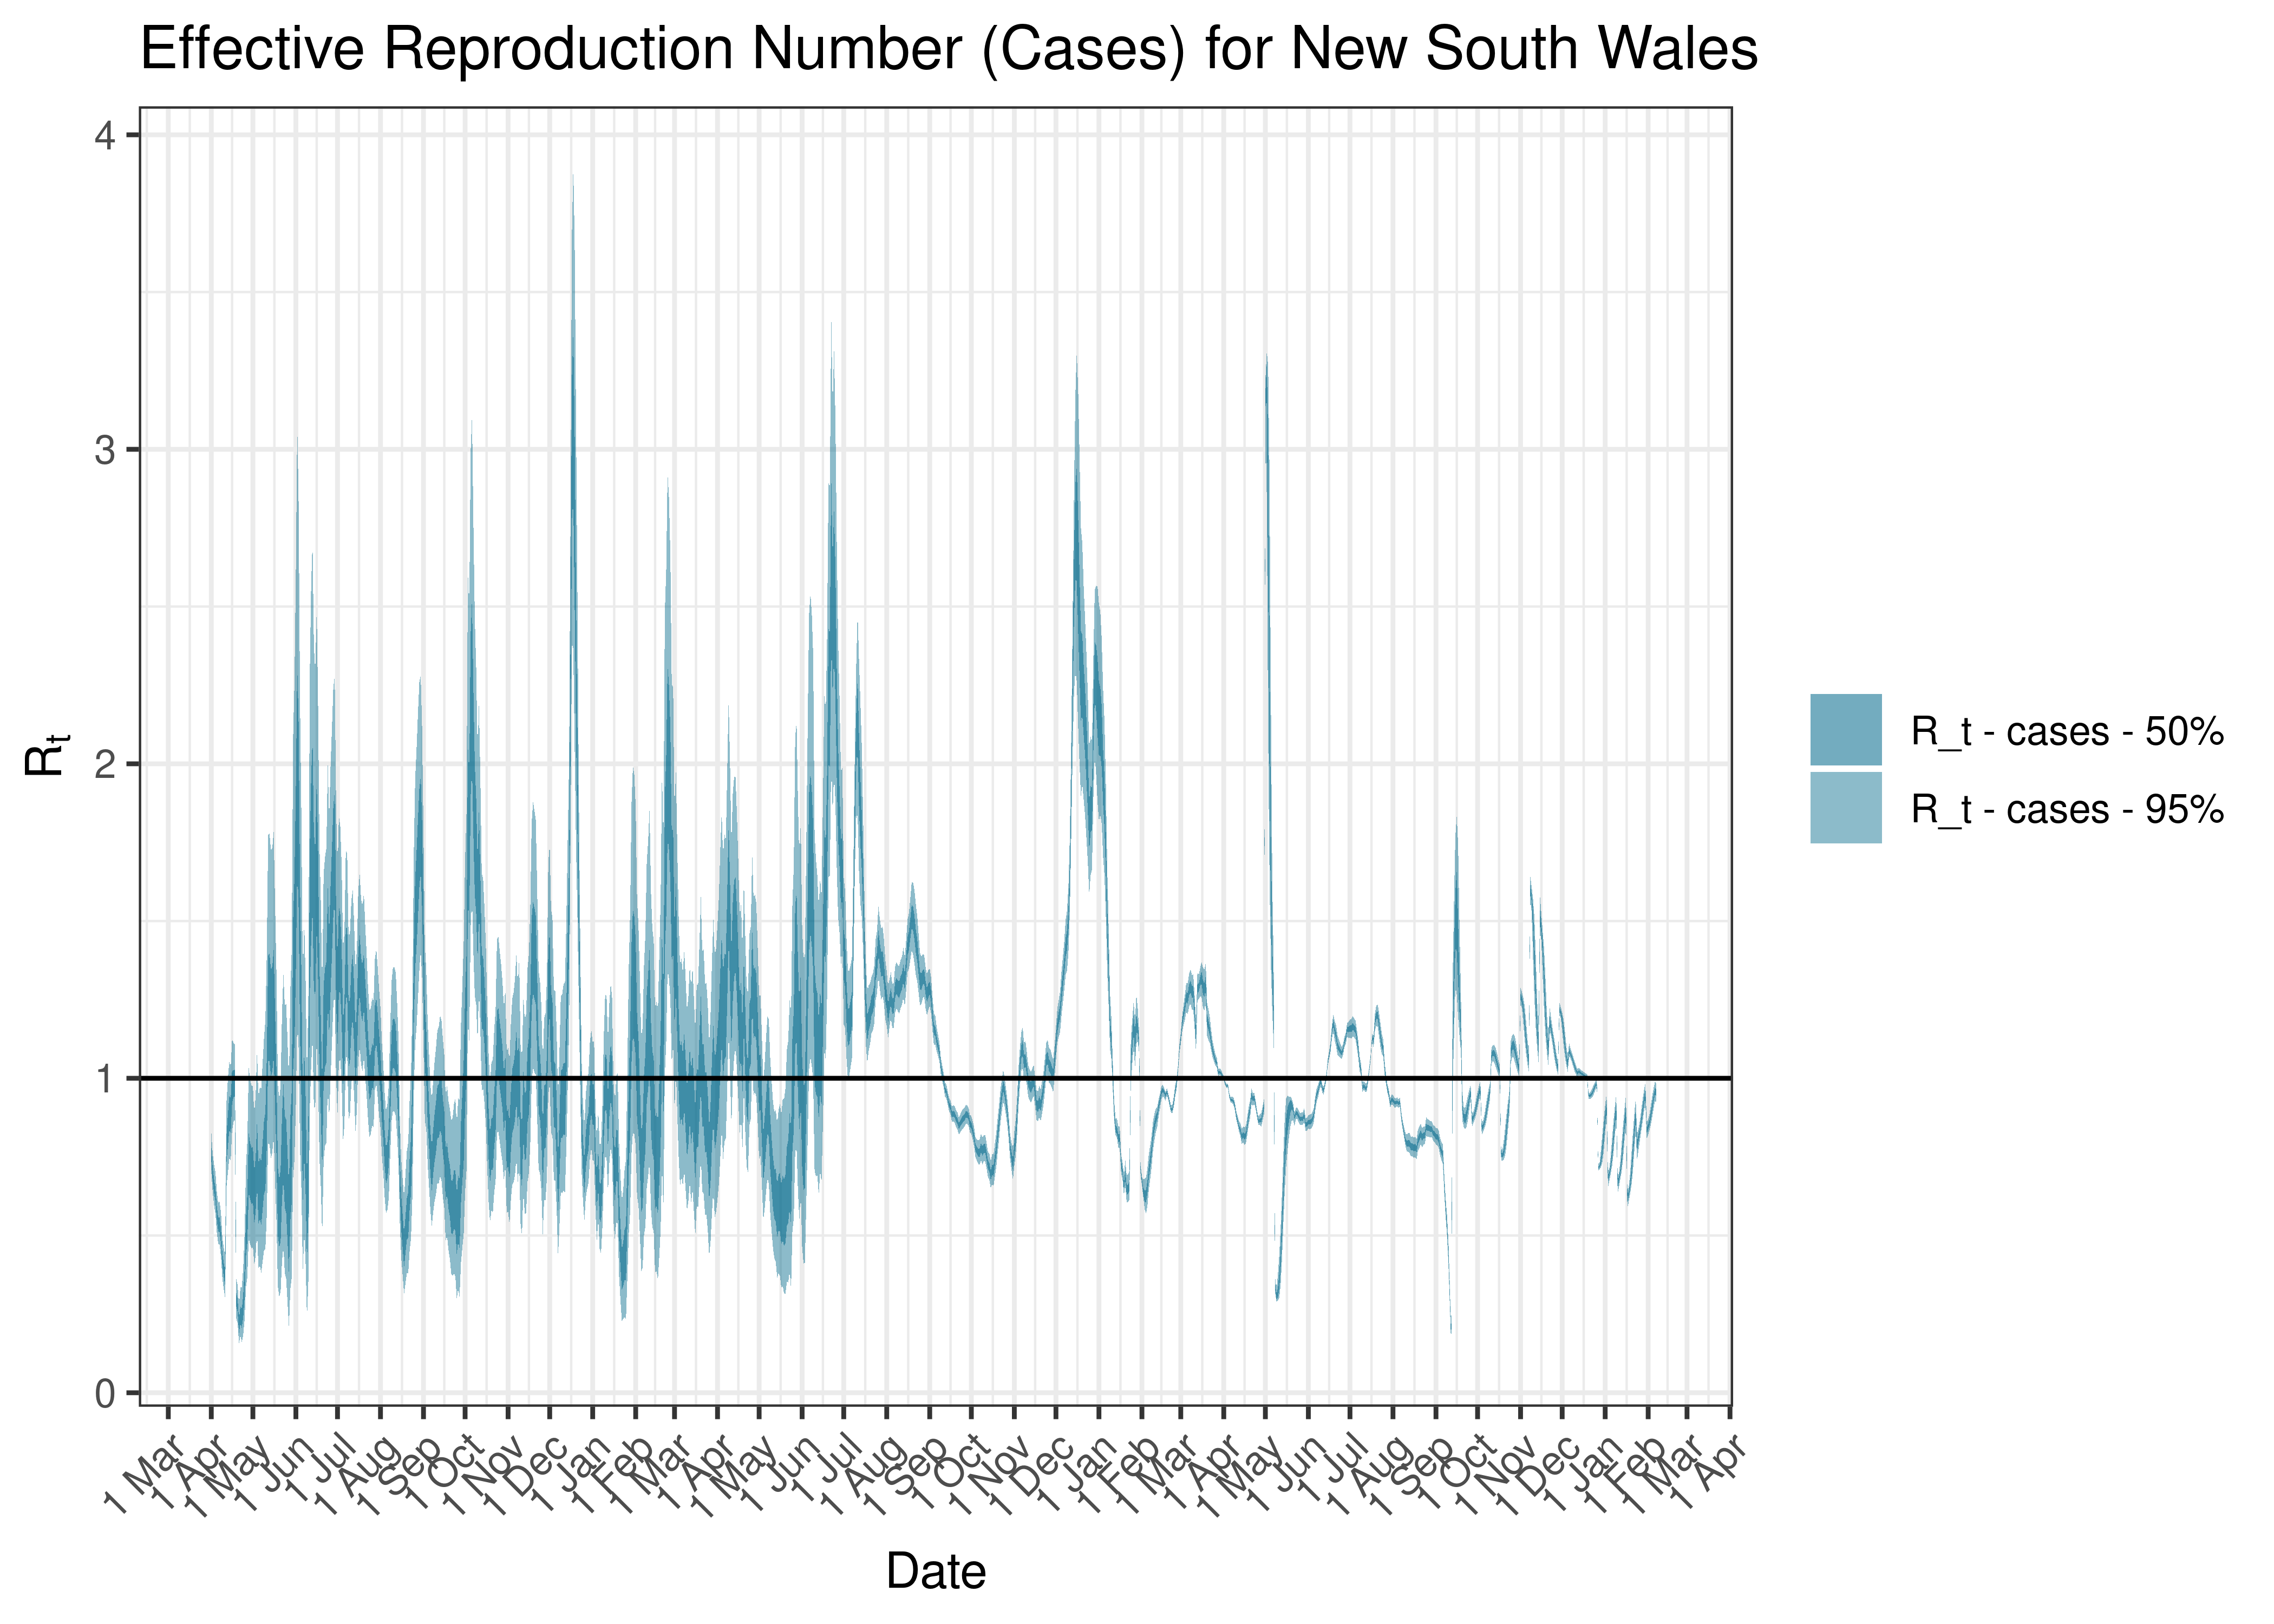
Estimated Effective Reproduction Number Based on Cases for New South Wales since 1 April 2020
5.4 Northern Territory
5.4.1 Tests
Below raw numbers of test by date are plotted on a 7-day moving average from 1 April 2020.
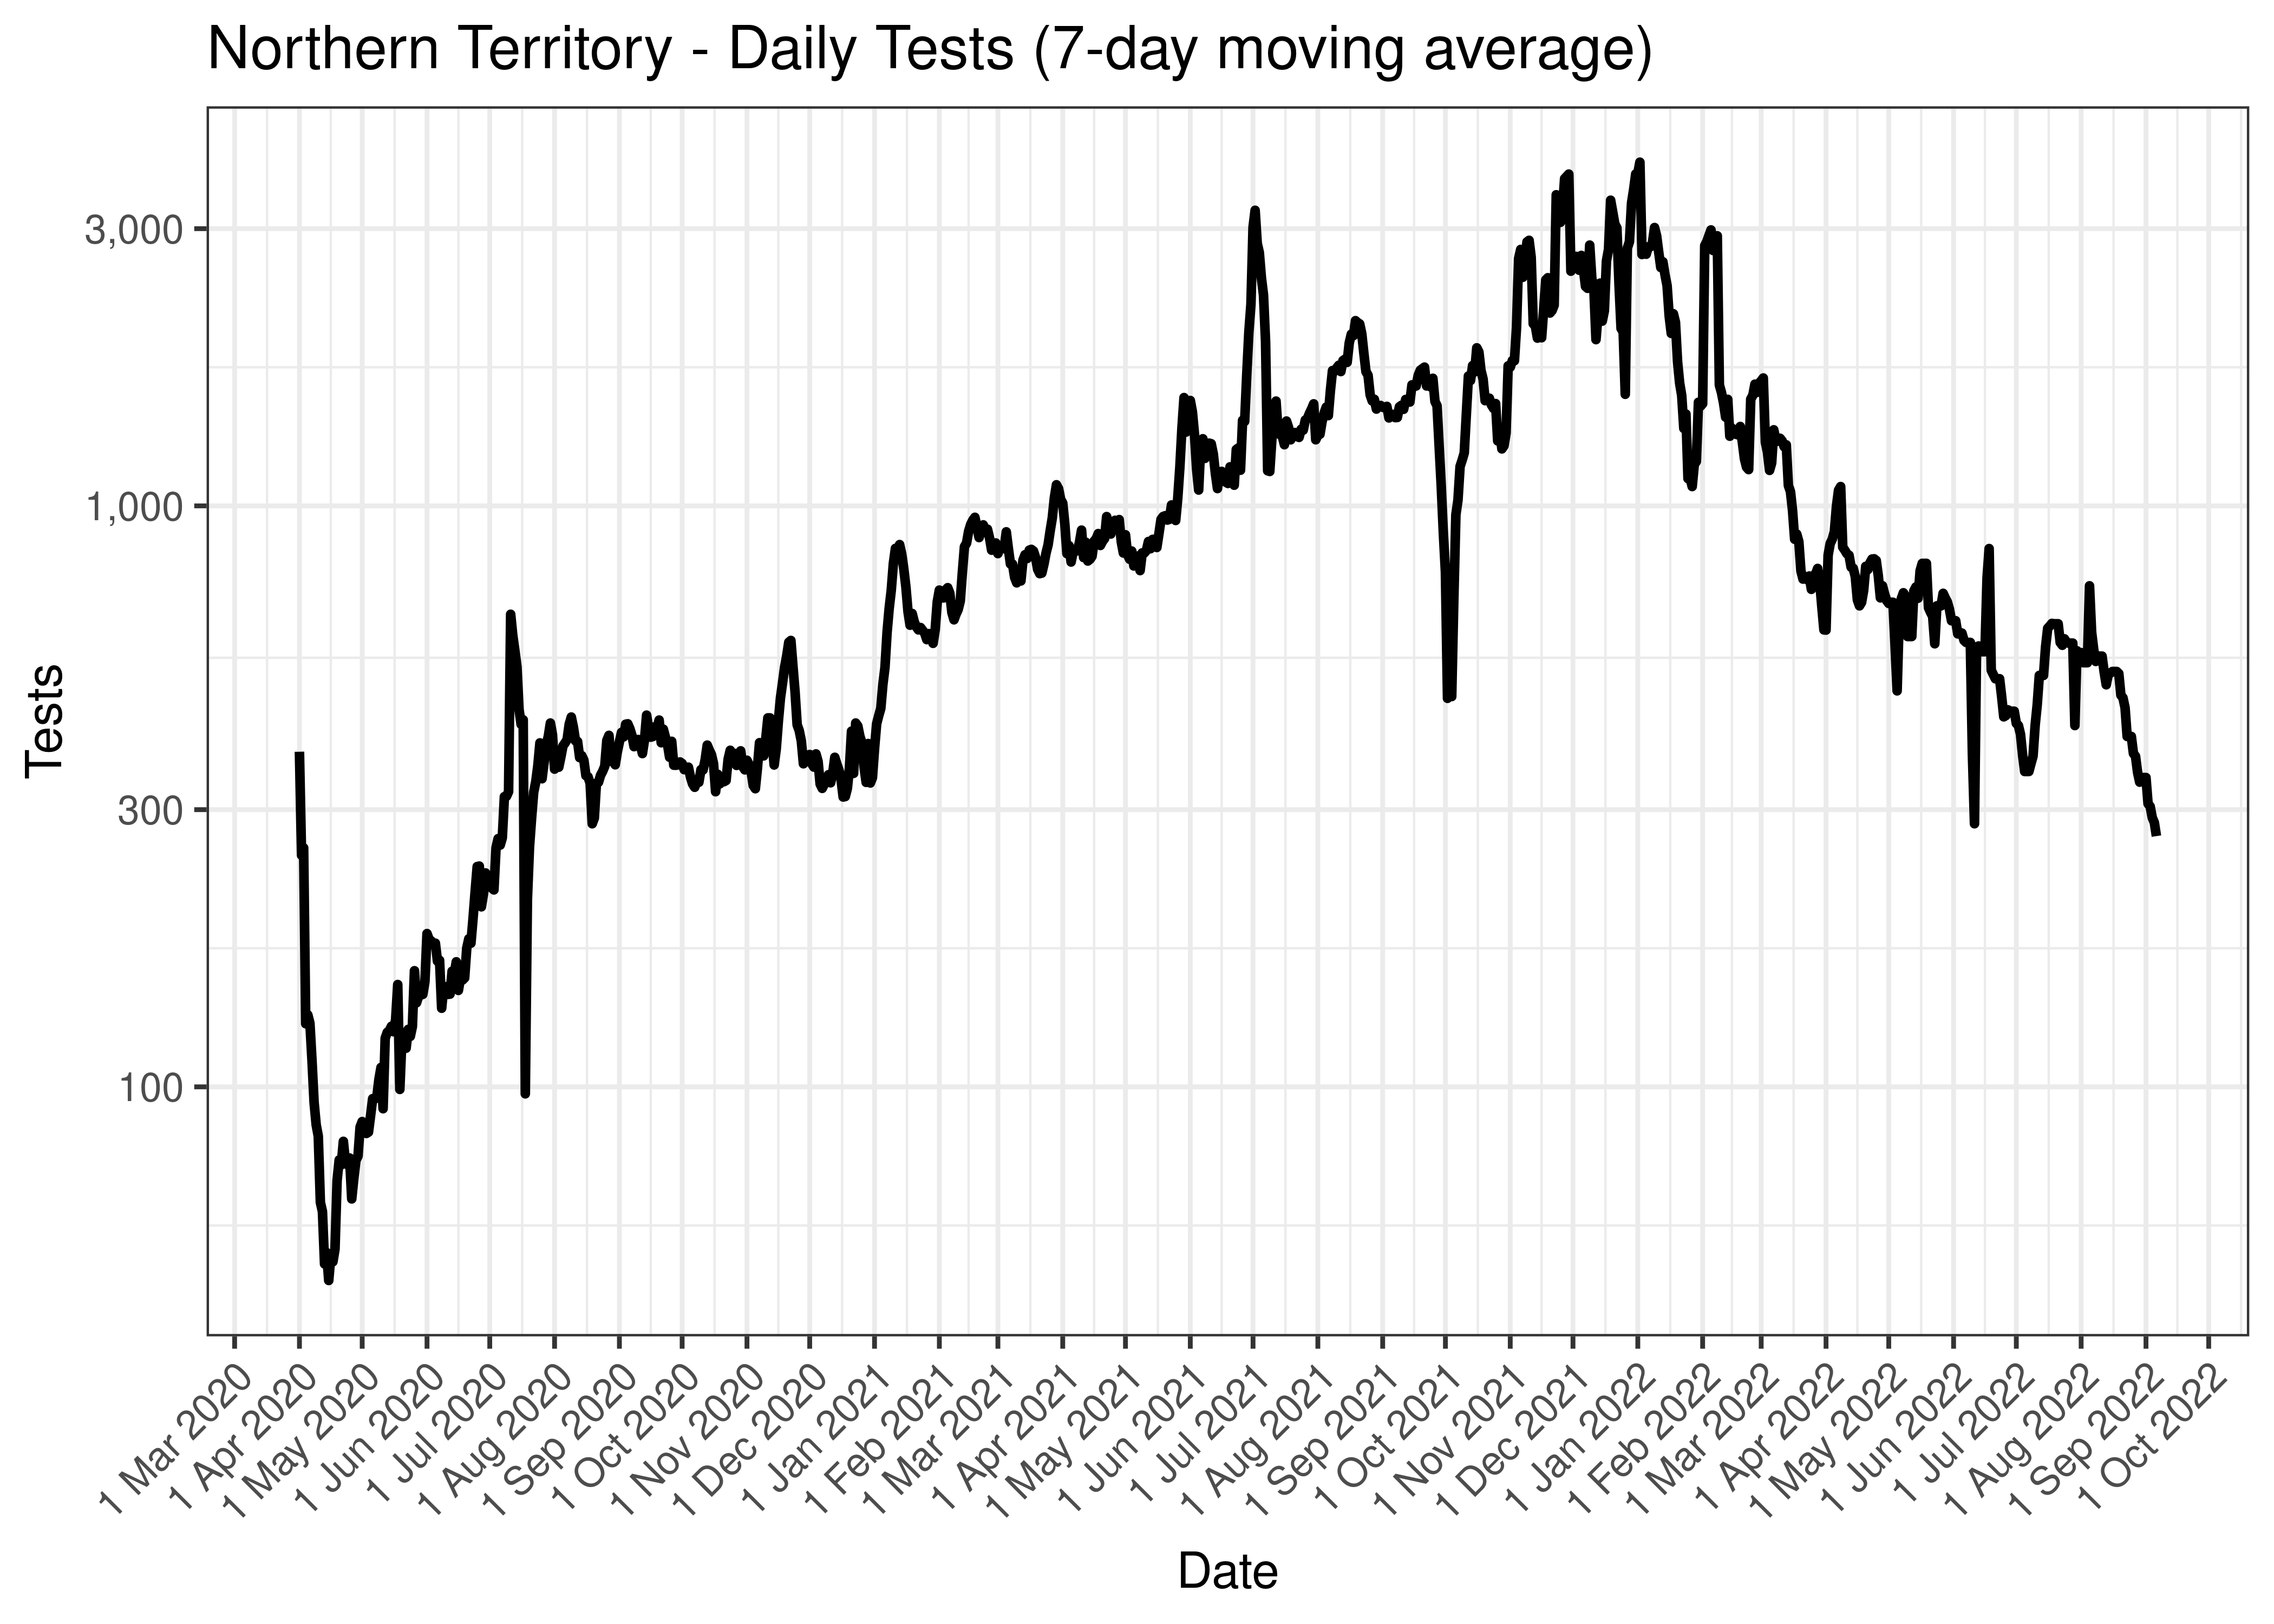
Northern Territory - Daily Tests (7-day moving average)
The above chart is repeated below covering the last 30 days only.
Northern Territory - Daily Tests for Last 30 Days (7-day moving average)
5.4.2 Cases
Cases are tabulated by specimen received date below. Cases include estimates for late reporting in recent days as well as adjustments for any public holidays. A centred 7-day moving average is also shown. The peak daily cases in previous waves (as measured by the moving average) is also shown.
| Date | Cases | 7-day Moving Average | Comment |
|---|---|---|---|
| 2022-01-31 | 717 | 1,794 | Wave 4 Peak (to date) |
| 2023-02-03 | 151 | 22 | |
| 2023-02-04 | 0 | 22 | |
| 2023-02-05 | 0 | 22 | |
| 2023-02-06 | 0 | 22 | |
| 2023-02-07 | 0 | 23 | |
| 2023-02-08 | 0 | NA | |
| 2023-02-09 | 0 | NA | |
| 2023-02-10 | 159 | NA |
Below a 7-day moving average daily case count is plotted for Northern Territory on a log scale since start of the epidemic:
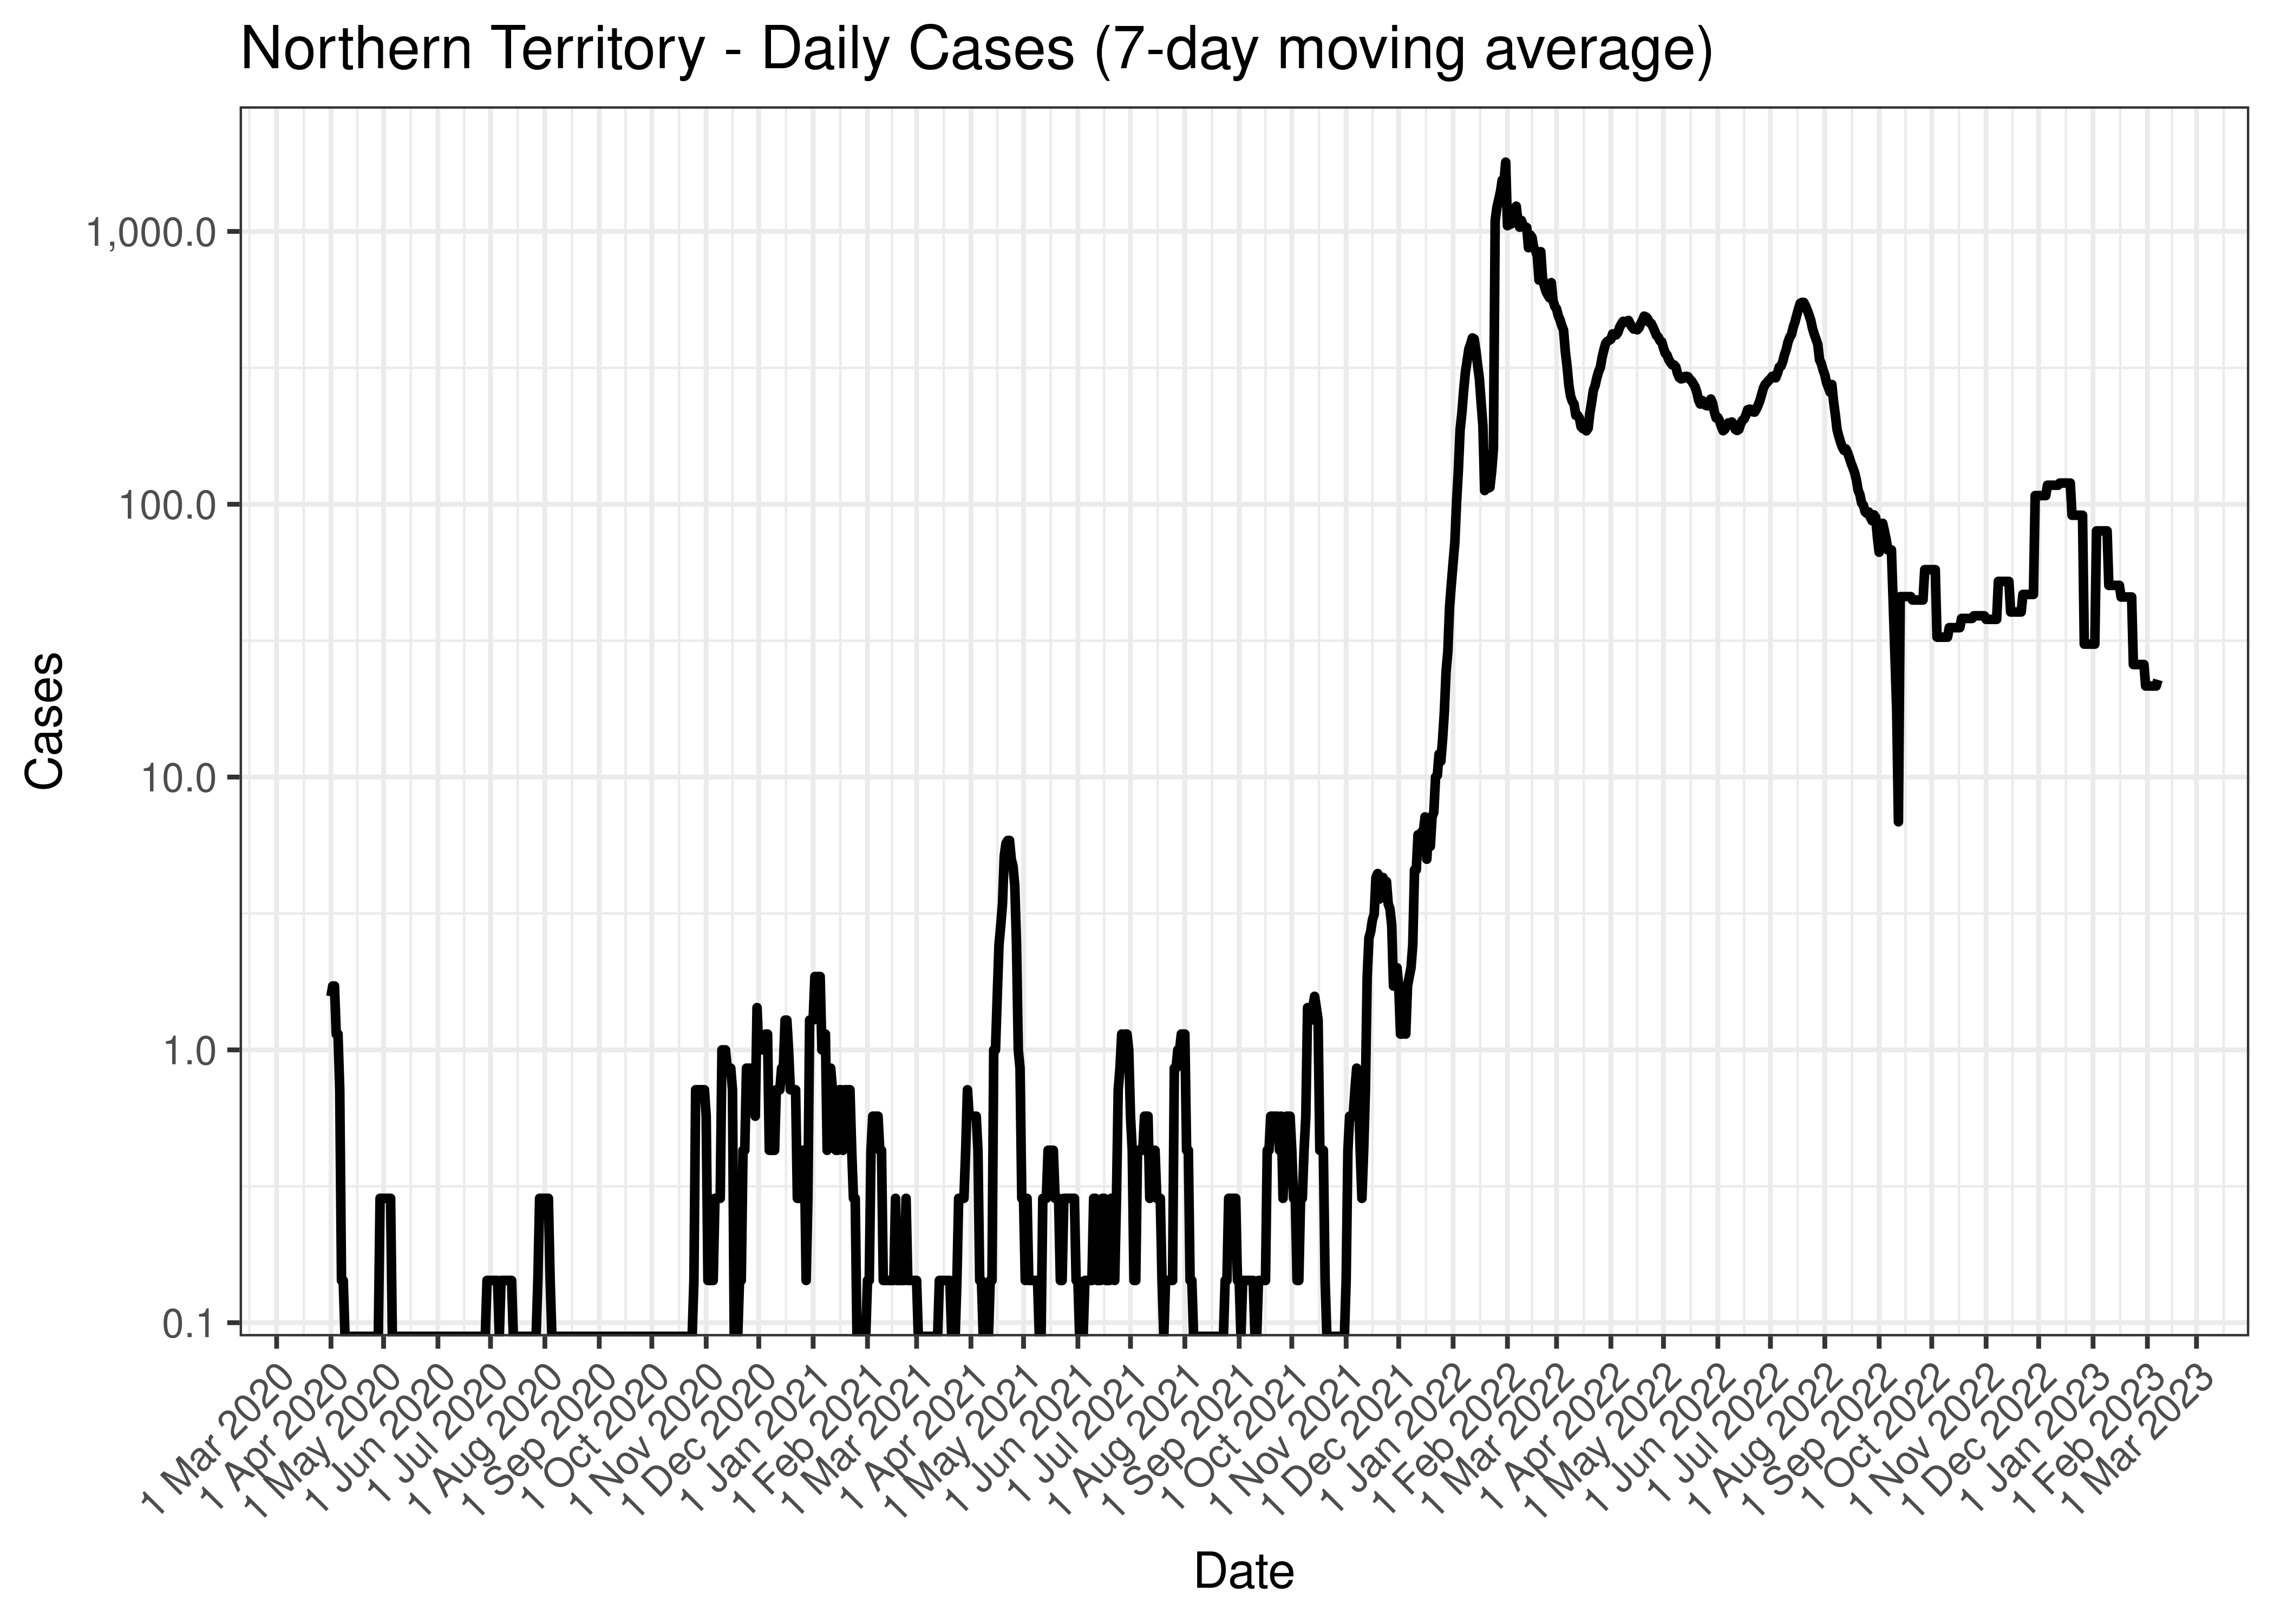
Northern Territory - Daily Cases (7-day moving average)
Below the above chart is repeated for the last 30-days:
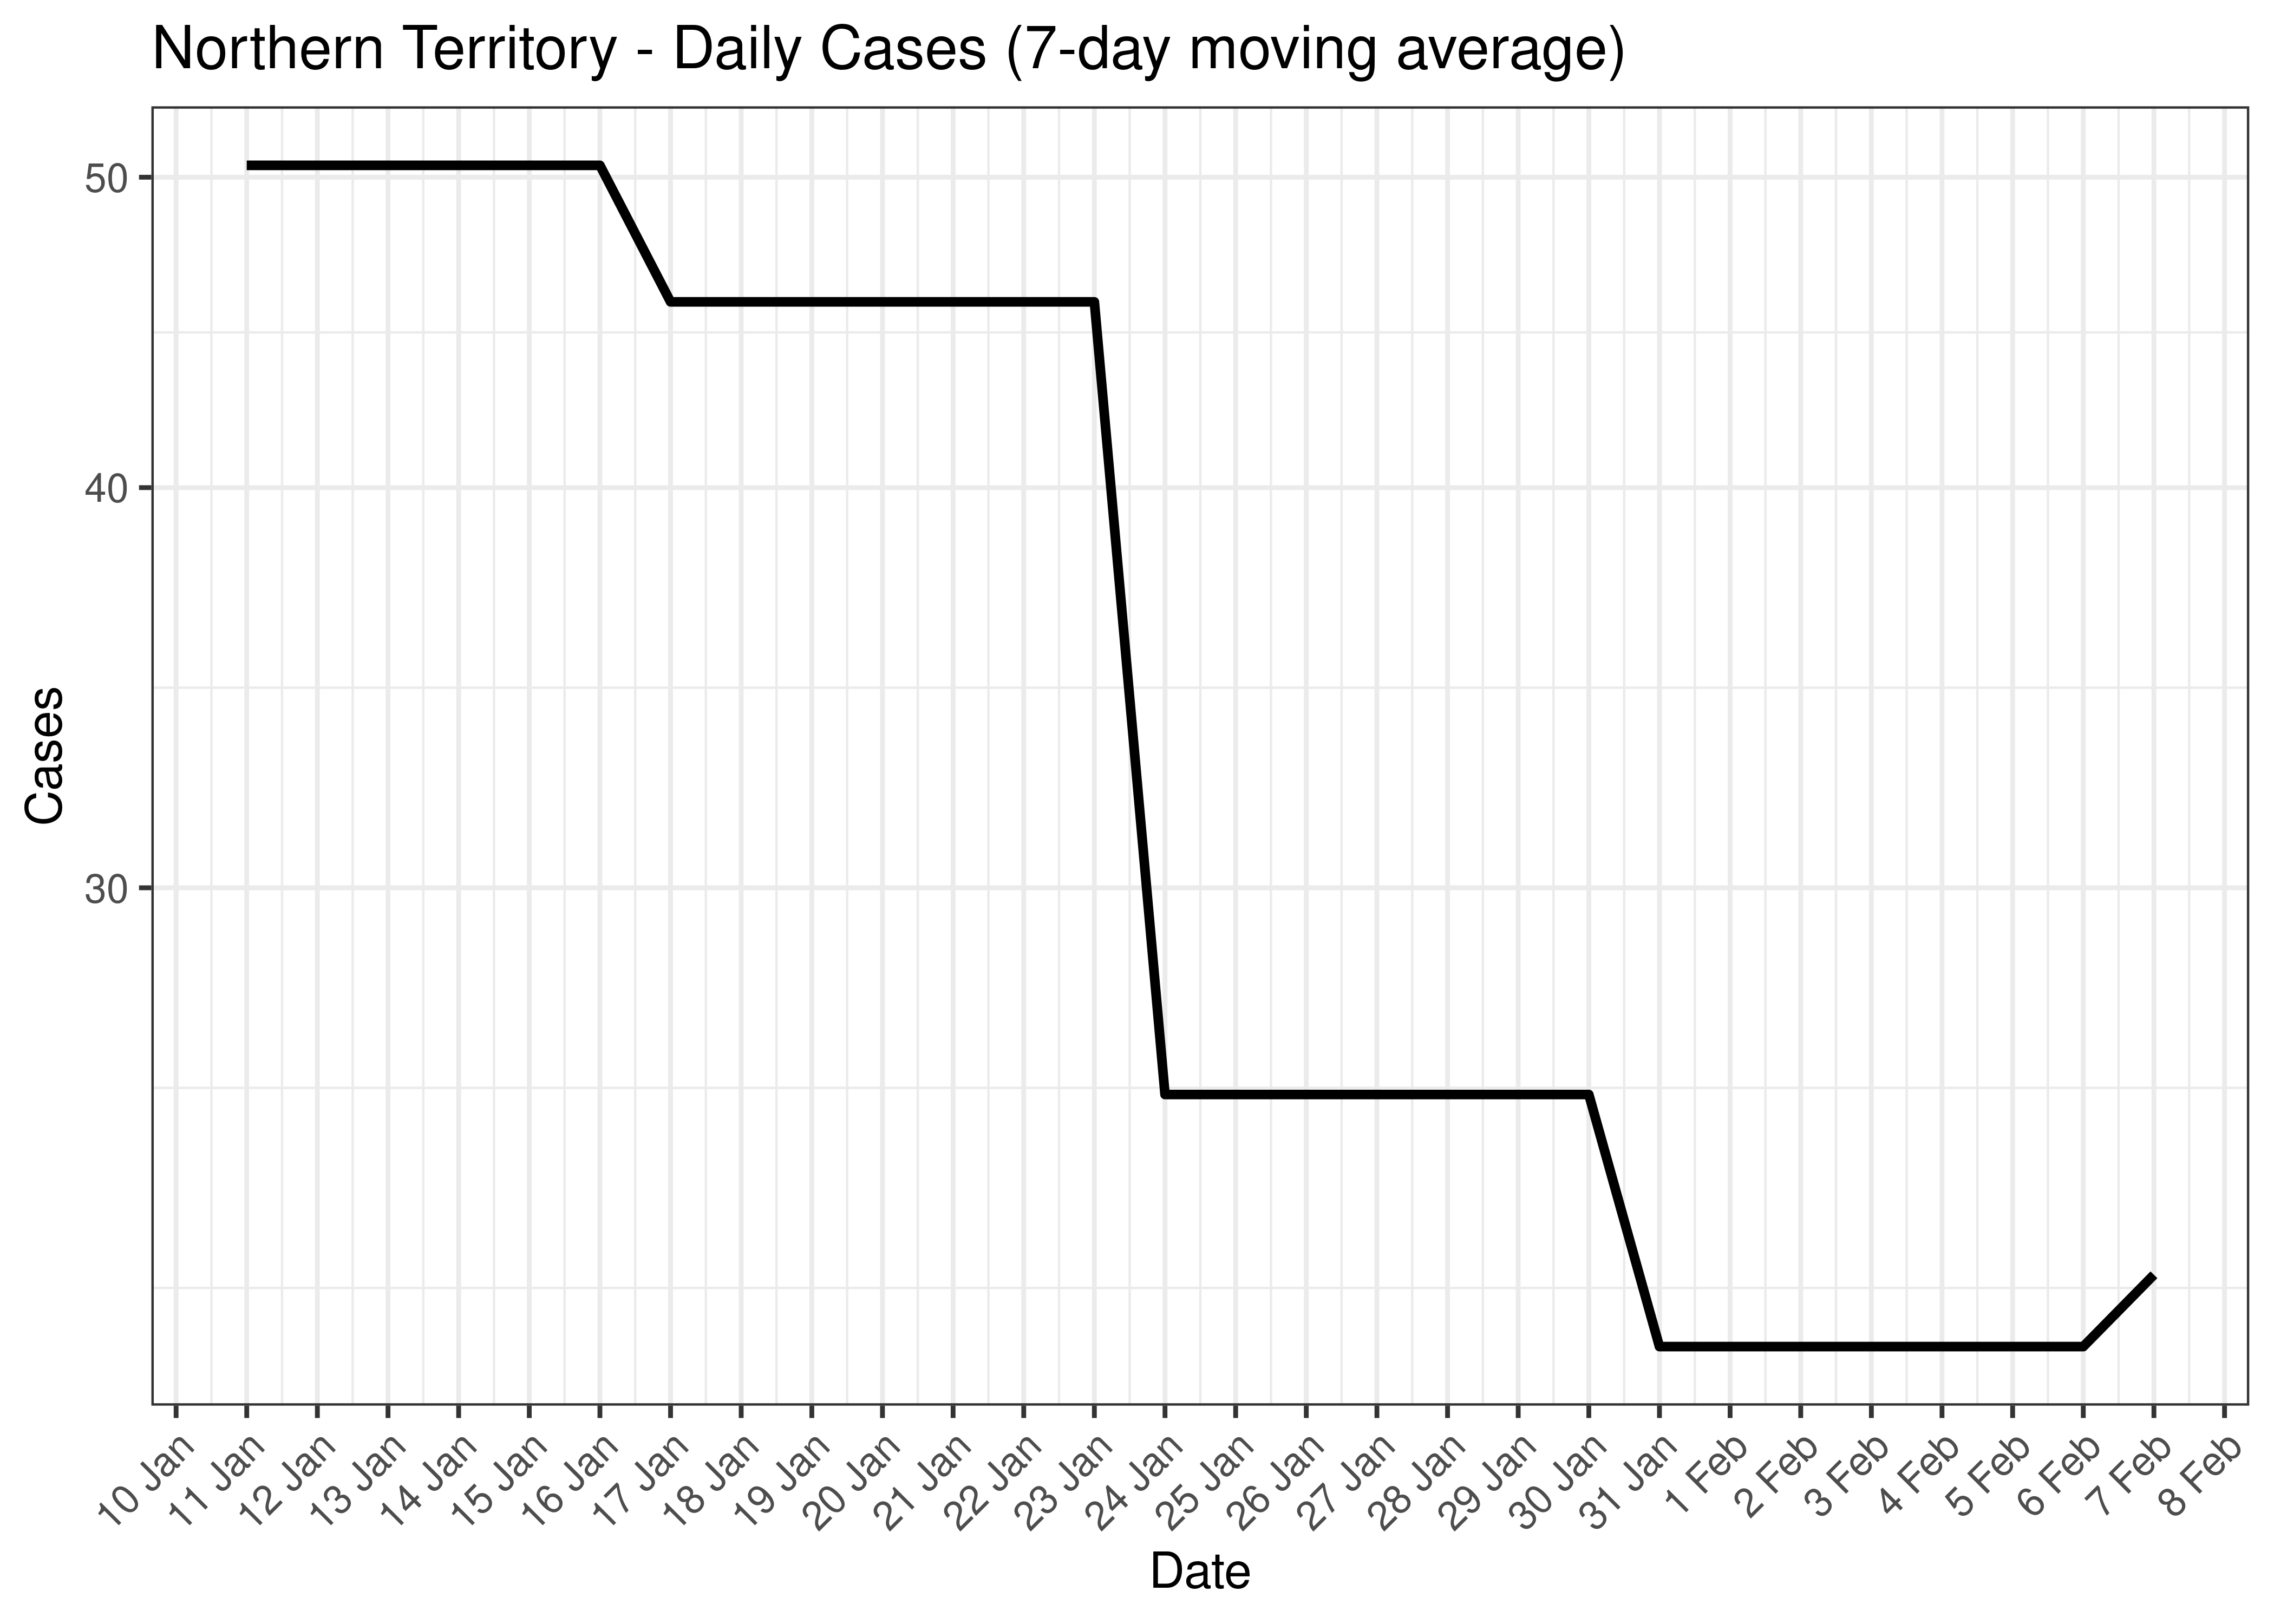
Northern Territory - Daily Cases for Last 30-days (7-day moving average)
5.4.3 Hospitlisation
Counts of those in hospital are tabulated by report date below. A centred 7-day moving average is also shown. The peak daily admissions in previous waves (as measured by the moving average) is also shown.
| Date | In Hospital | 7-day Moving Average | Comment |
|---|---|---|---|
| 2020-04-08 | 24 | 24 | Wave 1 Peak |
| 2021-04-28 | 52 | 50 | Wave 2 Peak |
| 2021-11-30 | 58 | 57 | Wave 3 Peak |
| 2022-02-11 | 164 | 169 | Wave 4 Peak (to date) |
| 2023-02-03 | 0 | 0 | |
| 2023-02-04 | 0 | 0 | |
| 2023-02-05 | 0 | 0 | |
| 2023-02-06 | 0 | 0 | |
| 2023-02-07 | 0 | NA | |
| 2023-02-08 | 0 | NA | |
| 2023-02-09 | 0 | NA | |
| 2023-02-10 | NA | NA |
The above are based on the following dates:
- Wave 1 started on 2020-01-01.
- Wave 2 started on 2020-06-01.
- Wave 3 started on 2021-06-01.
- Wave 4 started on 2021-12-01.
Below a 7-day moving average of daily hospital counts is plotted by on a log scale since start of the epidemic. Note admissions are plotted by date.
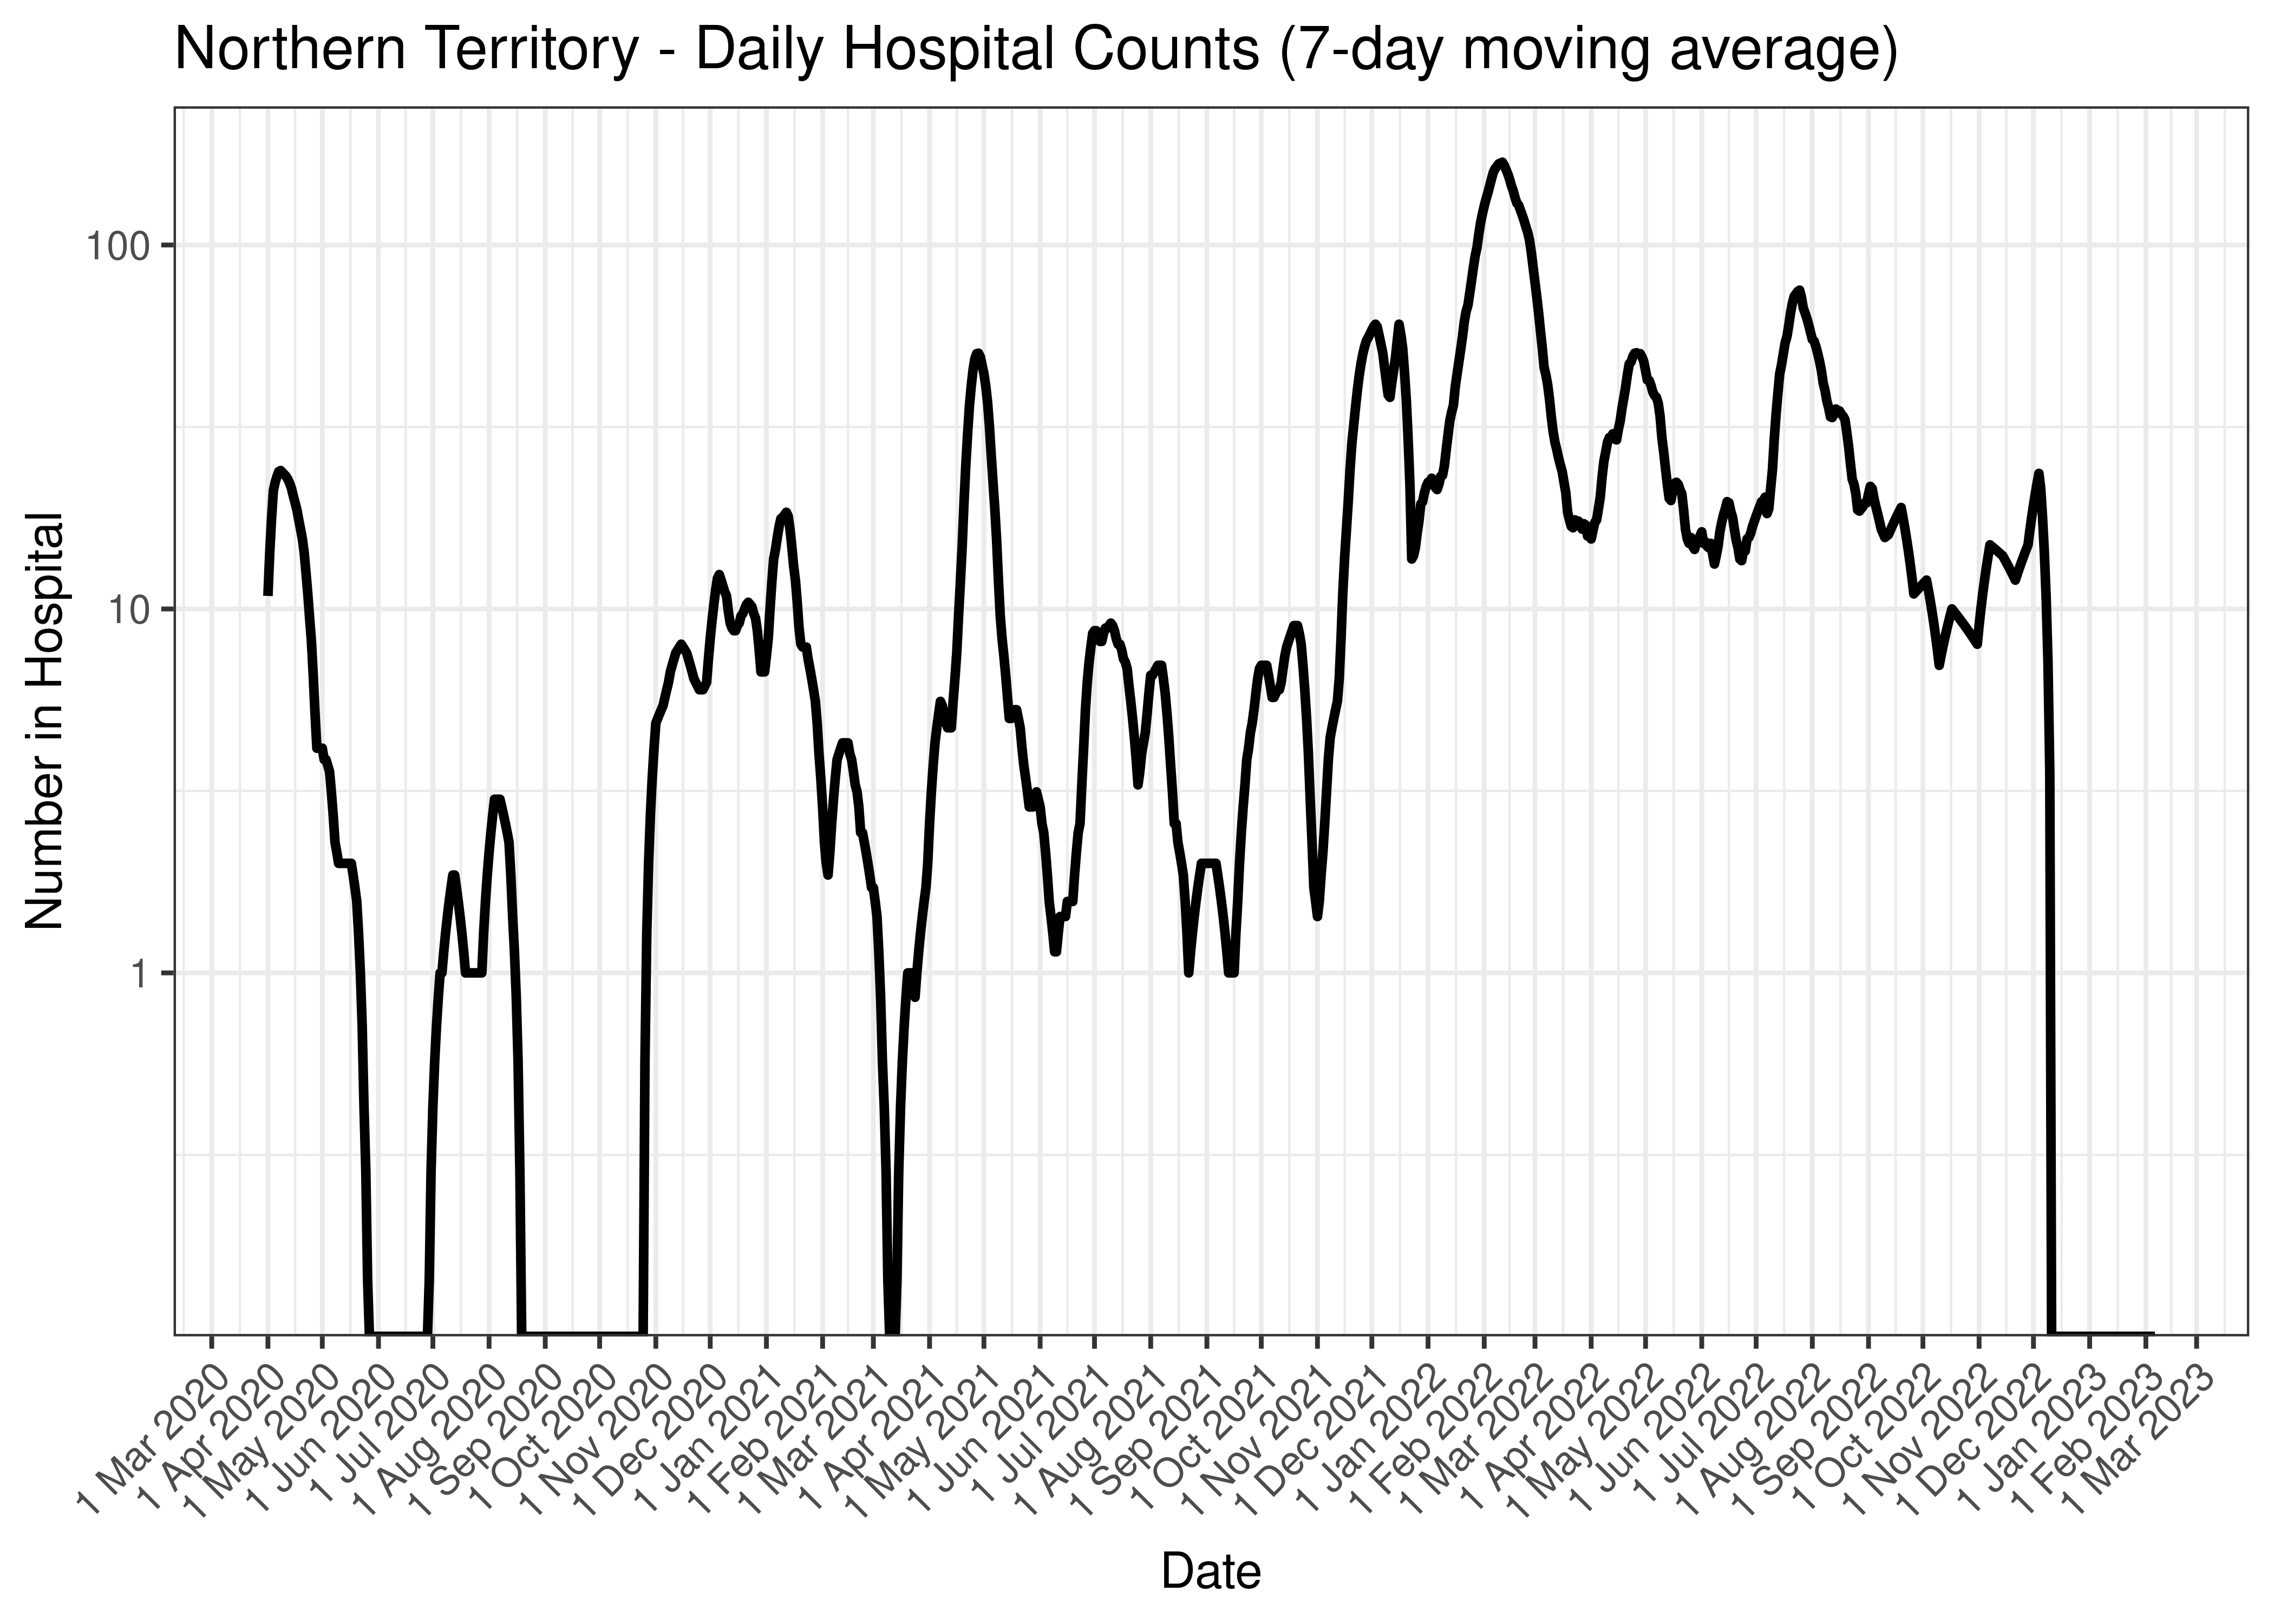
Northern Territory - Daily Hospital Counts (7-day moving average)
Below the above chart is repeated for the last 30-days:
Northern Territory - Daily Hospital Counts for Last 30-days (7-day moving average)
5.4.4 ICU
Counts of those in ICU are tabulated by report date below. A centred 7-day moving average is also shown. The peak daily admissions in previous waves (as measured by the moving average) is also shown.
| Date | In ICU | 7-day Moving Average | Comment |
|---|---|---|---|
| 2023-02-03 | 0 | 0 | |
| 2023-02-04 | 0 | 0 | |
| 2023-02-05 | 0 | 0 | |
| 2023-02-06 | 0 | 0 | |
| 2023-02-07 | 0 | NA | |
| 2023-02-08 | 0 | NA | |
| 2023-02-09 | 0 | NA | |
| 2023-02-10 | NA | NA |
The above are based on the following dates:
- Wave 1 started on 2020-01-01.
- Wave 2 started on 2020-06-01.
- Wave 3 started on 2021-06-01.
- Wave 4 started on 2021-12-01.
Below a 7-day moving average of daily ICU counts is plotted by on a log scale since start of the epidemic. Note admissions are plotted by date.
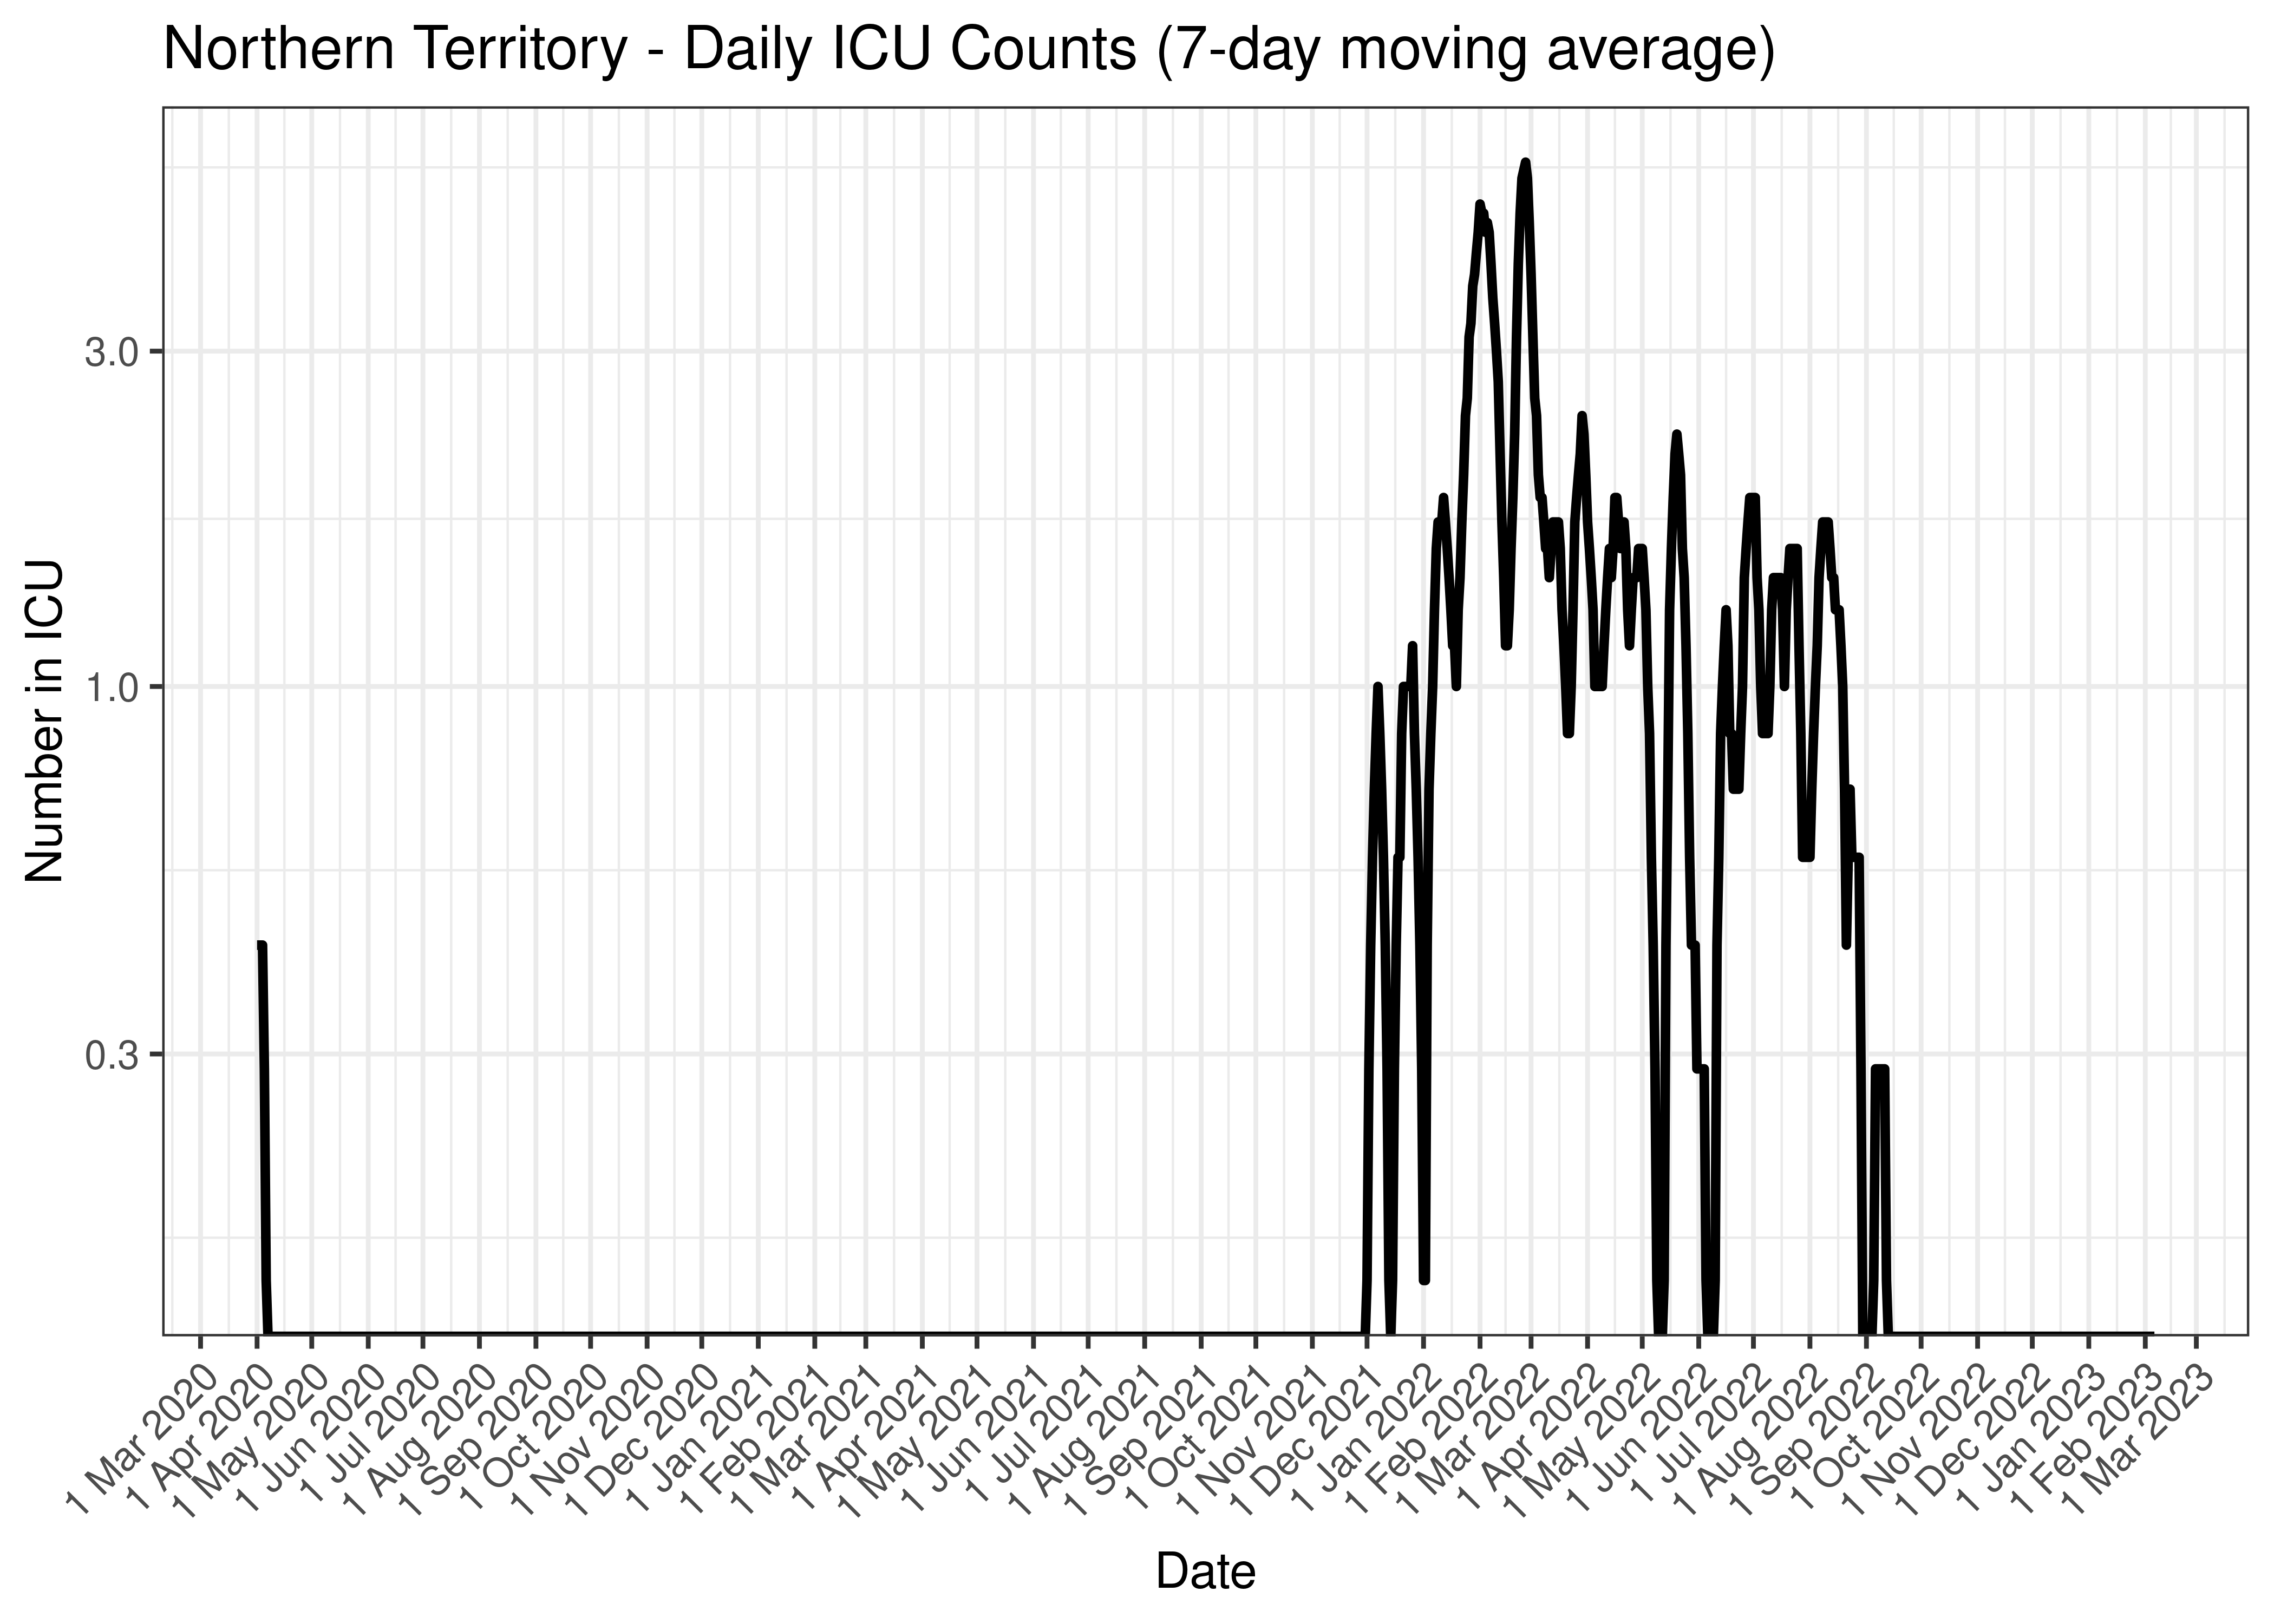
Northern Territory - Daily ICU Counts (7-day moving average)
Below the above chart is repeated for the last 30-days:

Northern Territory - Daily ICU Counts for Last 30-days (7-day moving average)
5.4.5 Ventilator
Counts of those on ventilators are tabulated by report date below. A centred 7-day moving average is also shown. The peak daily admissions in previous waves (as measured by the moving average) is also shown.
| Date | On Ventilators | 7-day Moving Average | Comment |
|---|---|---|---|
| 2023-02-03 | 0 | 0 | |
| 2023-02-04 | 0 | 0 | |
| 2023-02-05 | 0 | 0 | |
| 2023-02-06 | 0 | 0 | |
| 2023-02-07 | 0 | NA | |
| 2023-02-08 | 0 | NA | |
| 2023-02-09 | 0 | NA | |
| 2023-02-10 | NA | NA |
The above are based on the following dates:
- Wave 1 started on 2020-01-01.
- Wave 2 started on 2020-06-01.
- Wave 3 started on 2021-06-01.
- Wave 4 started on 2021-12-01.
Below a 7-day moving average of daily ventilator counts is plotted by on a log scale since start of the epidemic. Note admissions are plotted by date.
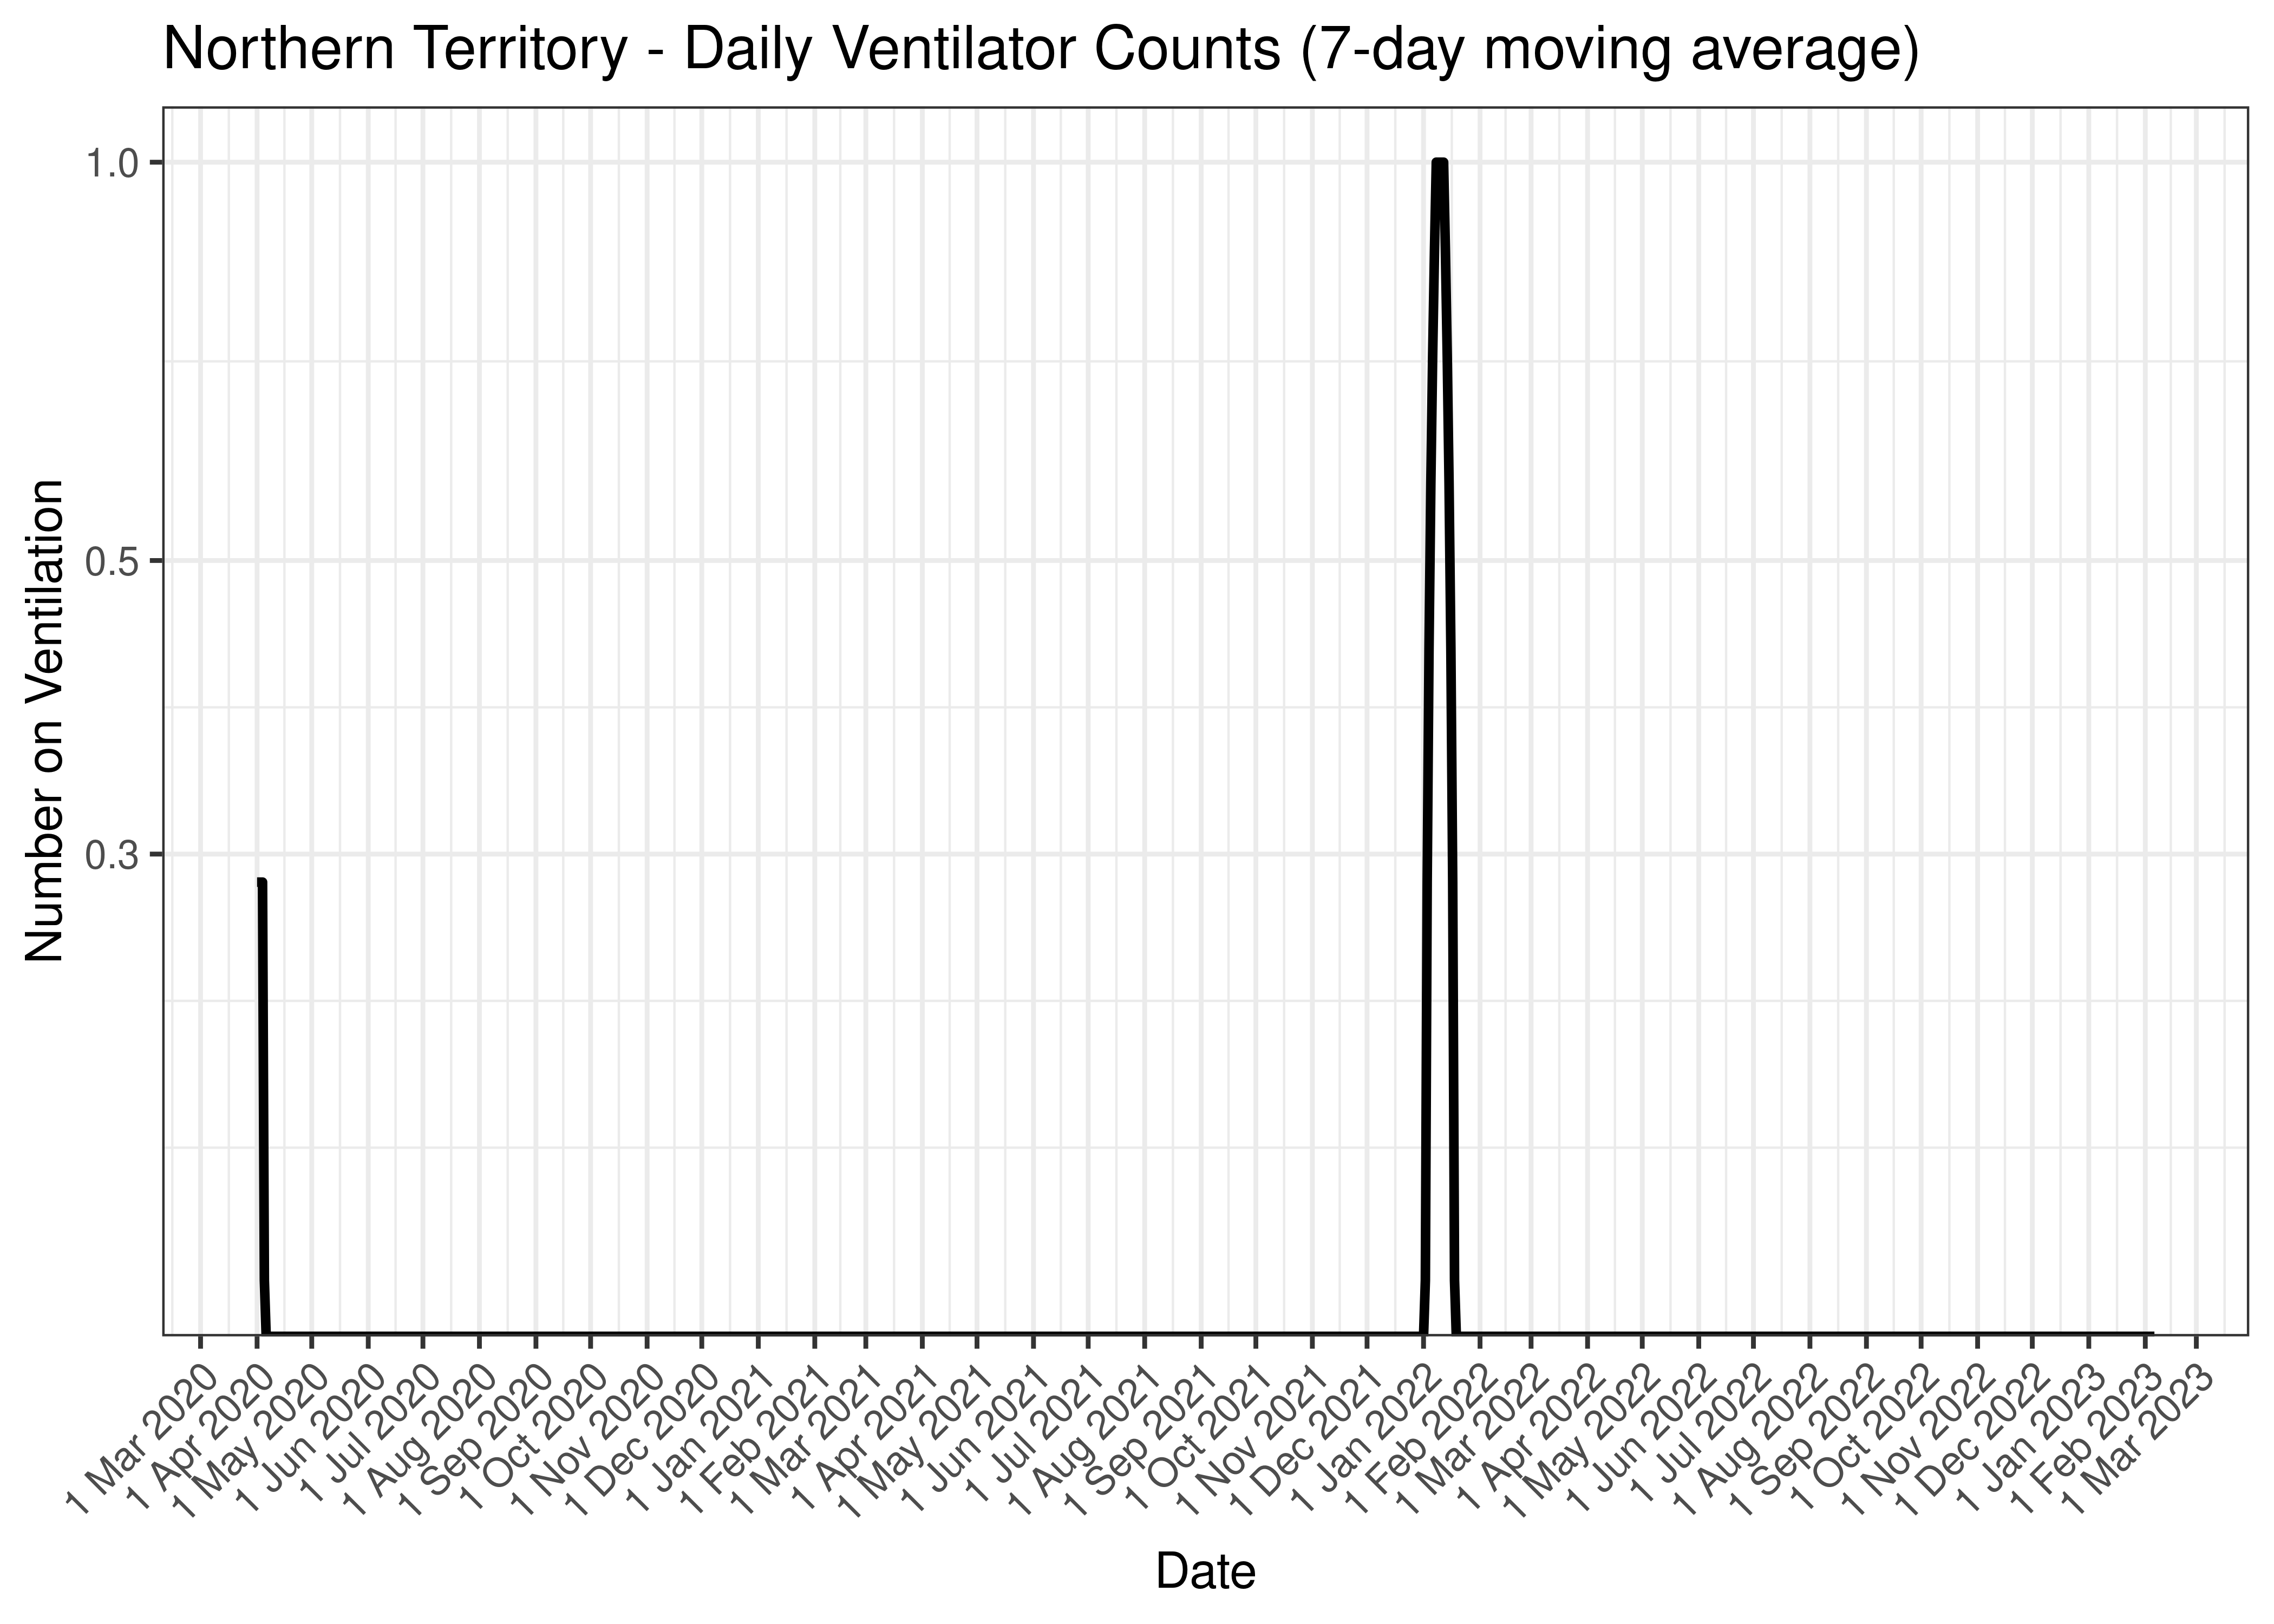
Northern Territory - Daily Ventilator Counts (7-day moving average)
Below the above chart is repeated for the last 30-days:
Northern Territory - Daily Ventilator Counts for Last 30-days (7-day moving average)
5.4.6 Deaths
Deaths are tabulated by report date below. A centred 7-day moving average is also shown. The peak daily deaths in previous waves (as measured by the moving average) is also shown.
| Date | Deaths | 7-day Moving Average | Comment |
|---|---|---|---|
| 2023-02-03 | 0 | 0 | |
| 2023-02-04 | 0 | 0 | |
| 2023-02-05 | 0 | 0 | |
| 2023-02-06 | 0 | 0 | |
| 2023-02-07 | 0 | 0 | |
| 2023-02-08 | 0 | NA | |
| 2023-02-09 | 0 | NA | |
| 2023-02-10 | 0 | NA |
The above are based on the following dates:
- Wave 1 started on 2020-01-01.
- Wave 2 started on 2020-06-01.
- Wave 3 started on 2021-06-01.
- Wave 4 started on 2021-12-01.
Below a 7-day moving average of daily deaths is plotted by on a log scale since start of the epidemic.
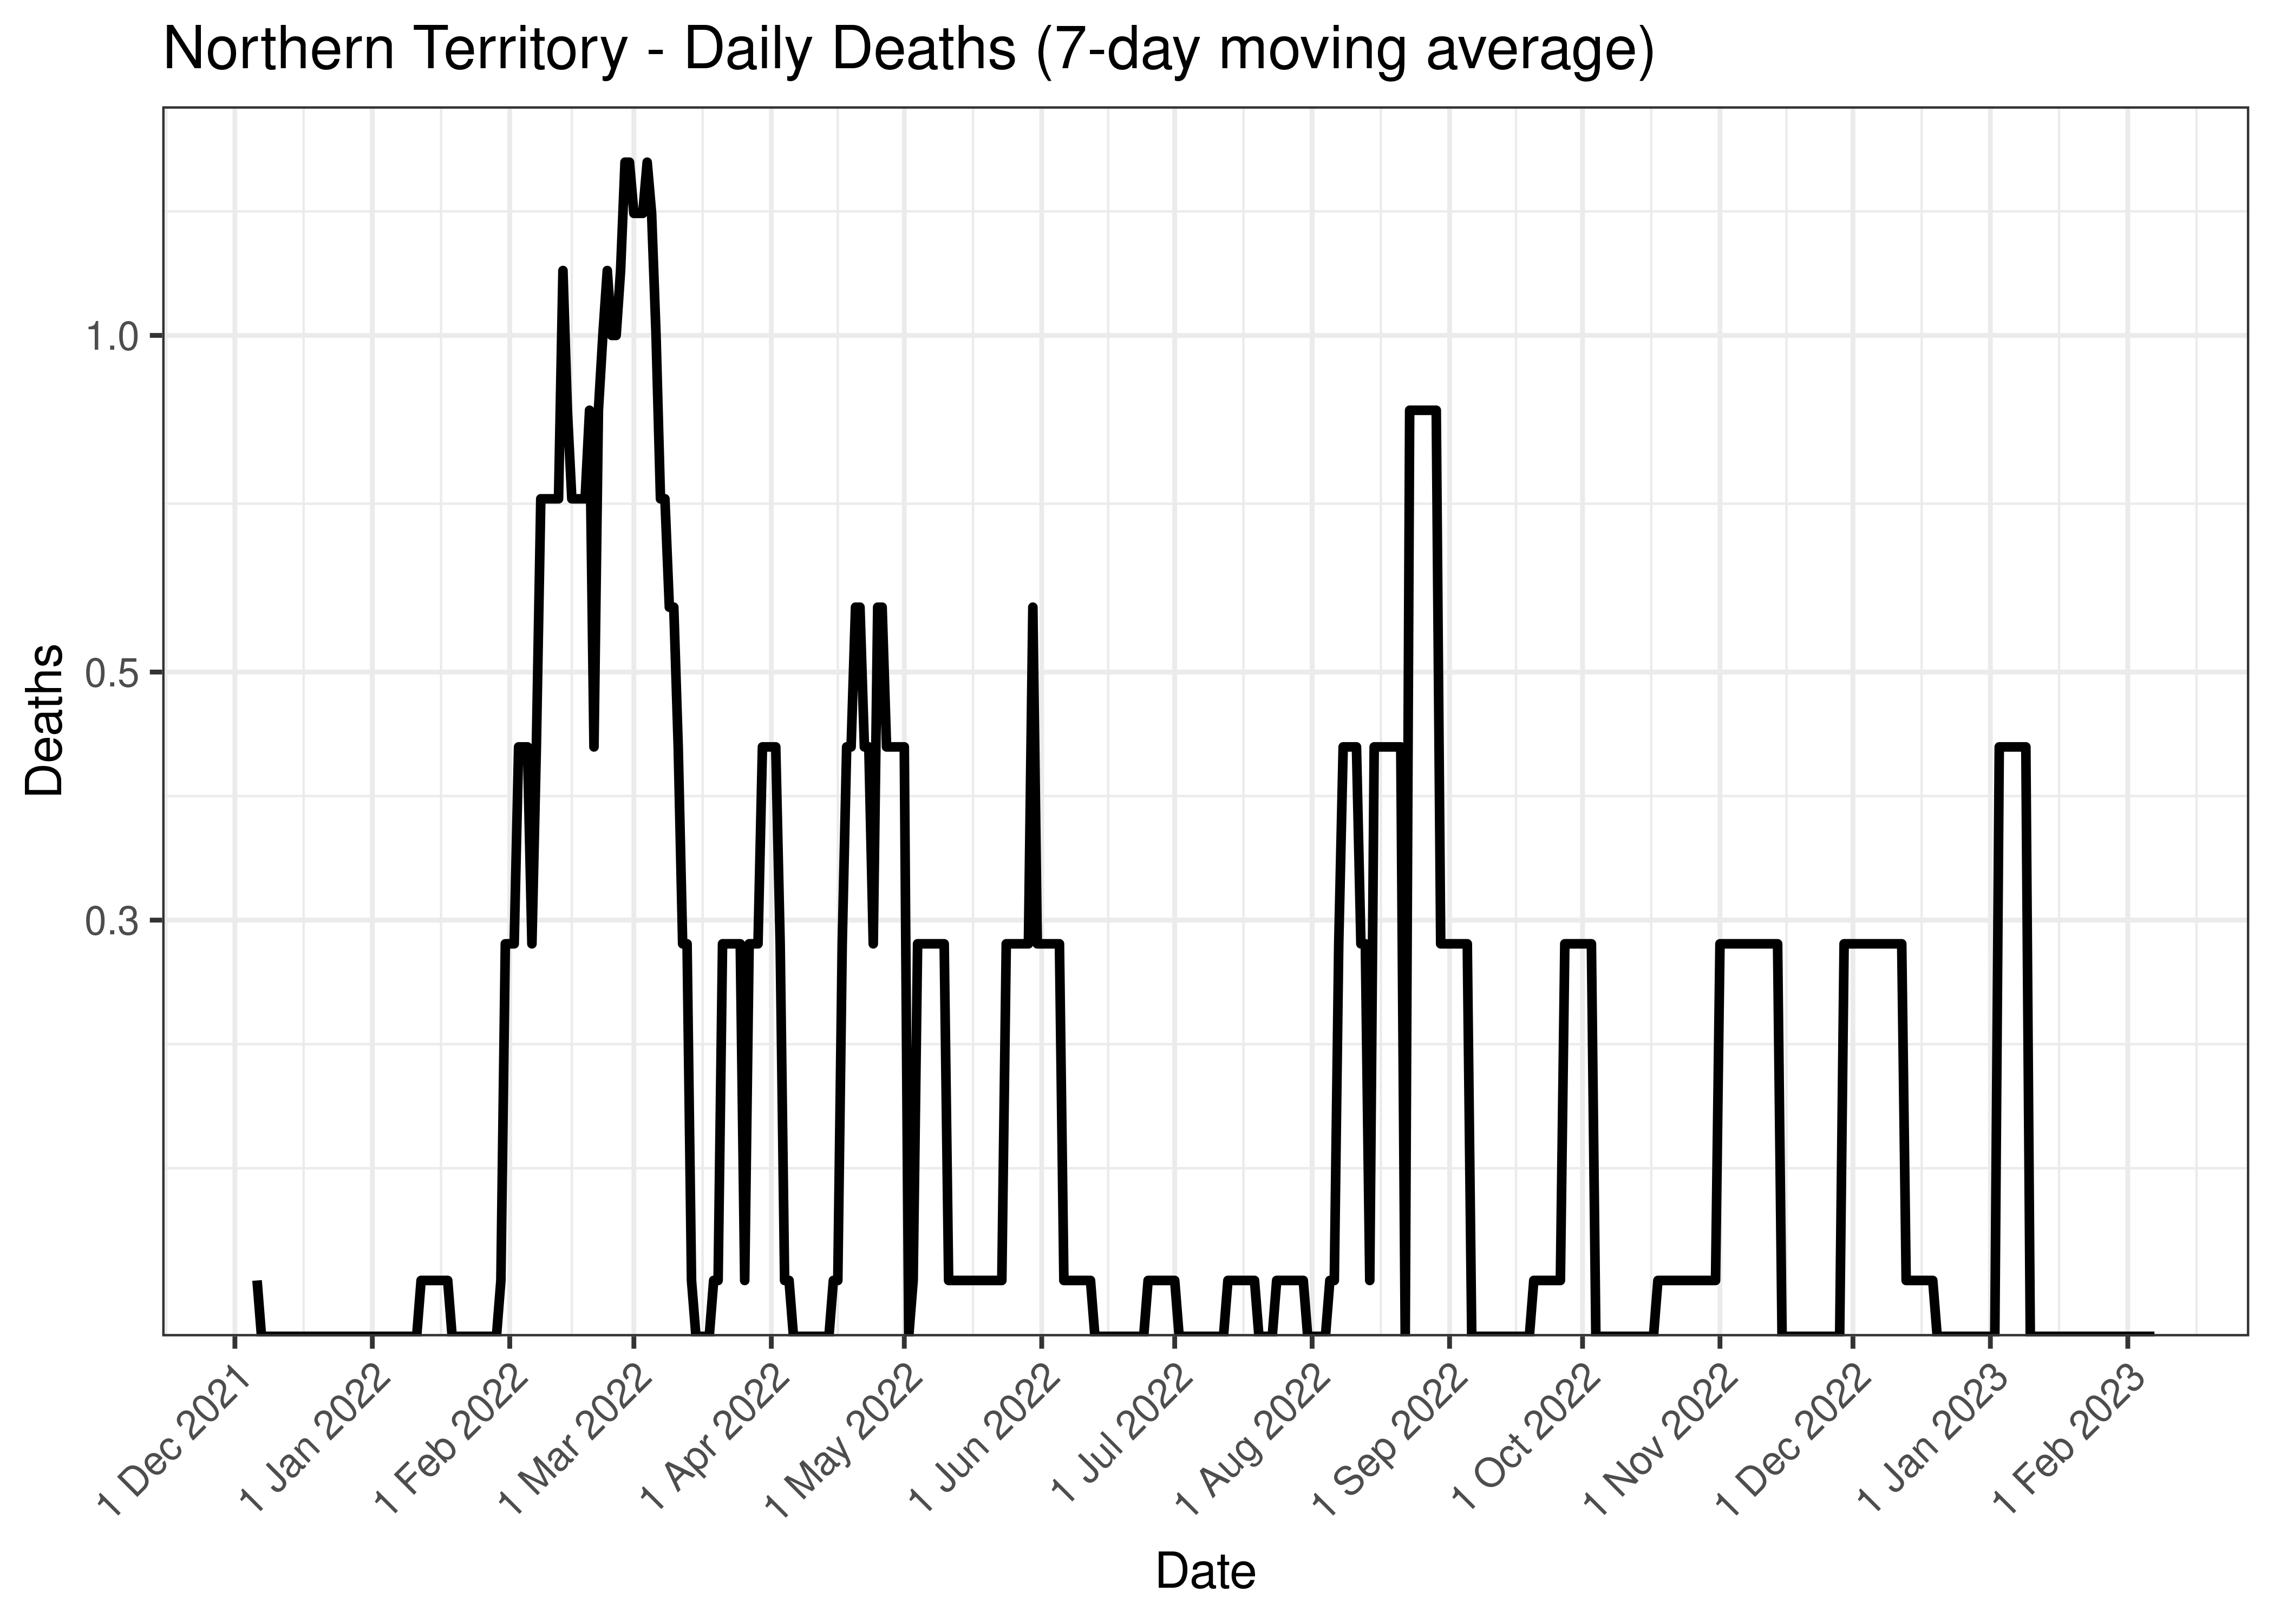
Northern Territory - Daily Deaths (7-day moving average)
Below the above chart is repeated for the last 30-days:

Northern Territory - Daily Deaths for Last 30-days (7-day moving average)
5.4.7 Cases, Hospital Counts and Deaths Combined
Below a 7-day moving average daily case, hospital counts and deaths are plotted by state on a log scale since start of the epidemic. Note admissions and excess deaths are plotted by date, whereas cases are plotted by specimen received date.
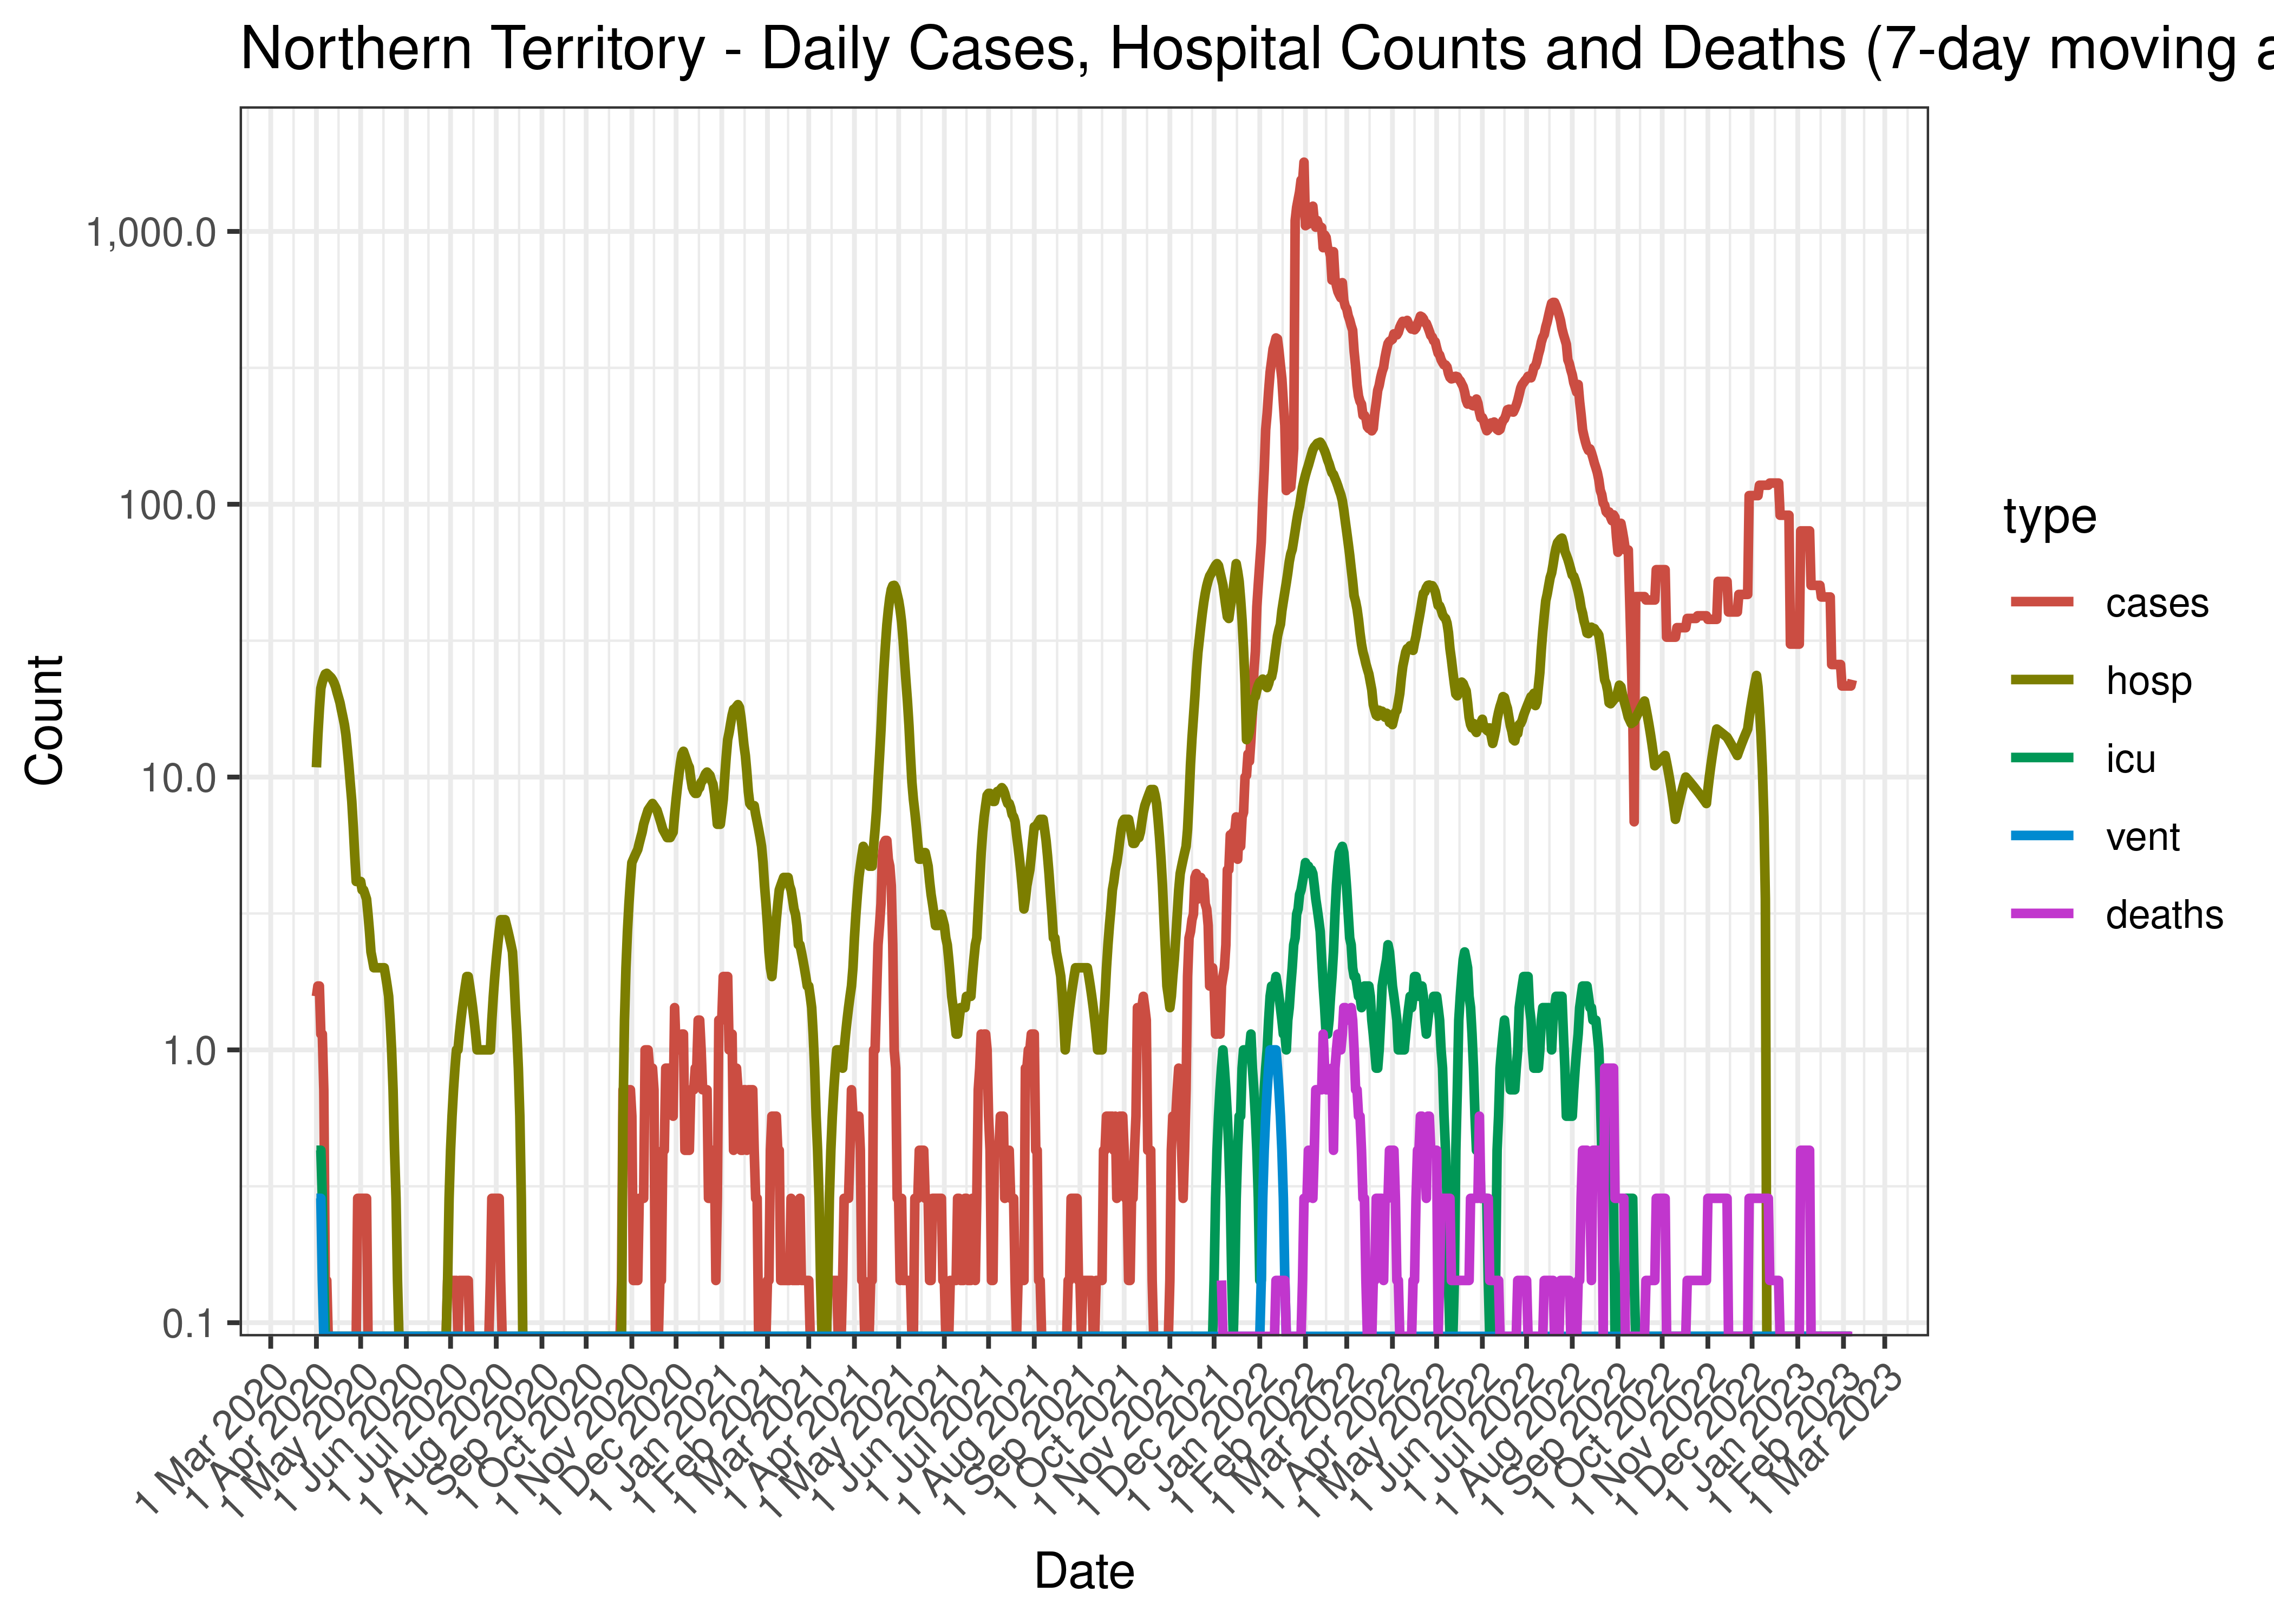
Northern Territory - Daily Cases, Hospital Counts and Deaths (7-day moving average)
Below the above chart is repeated for the last 30-days:
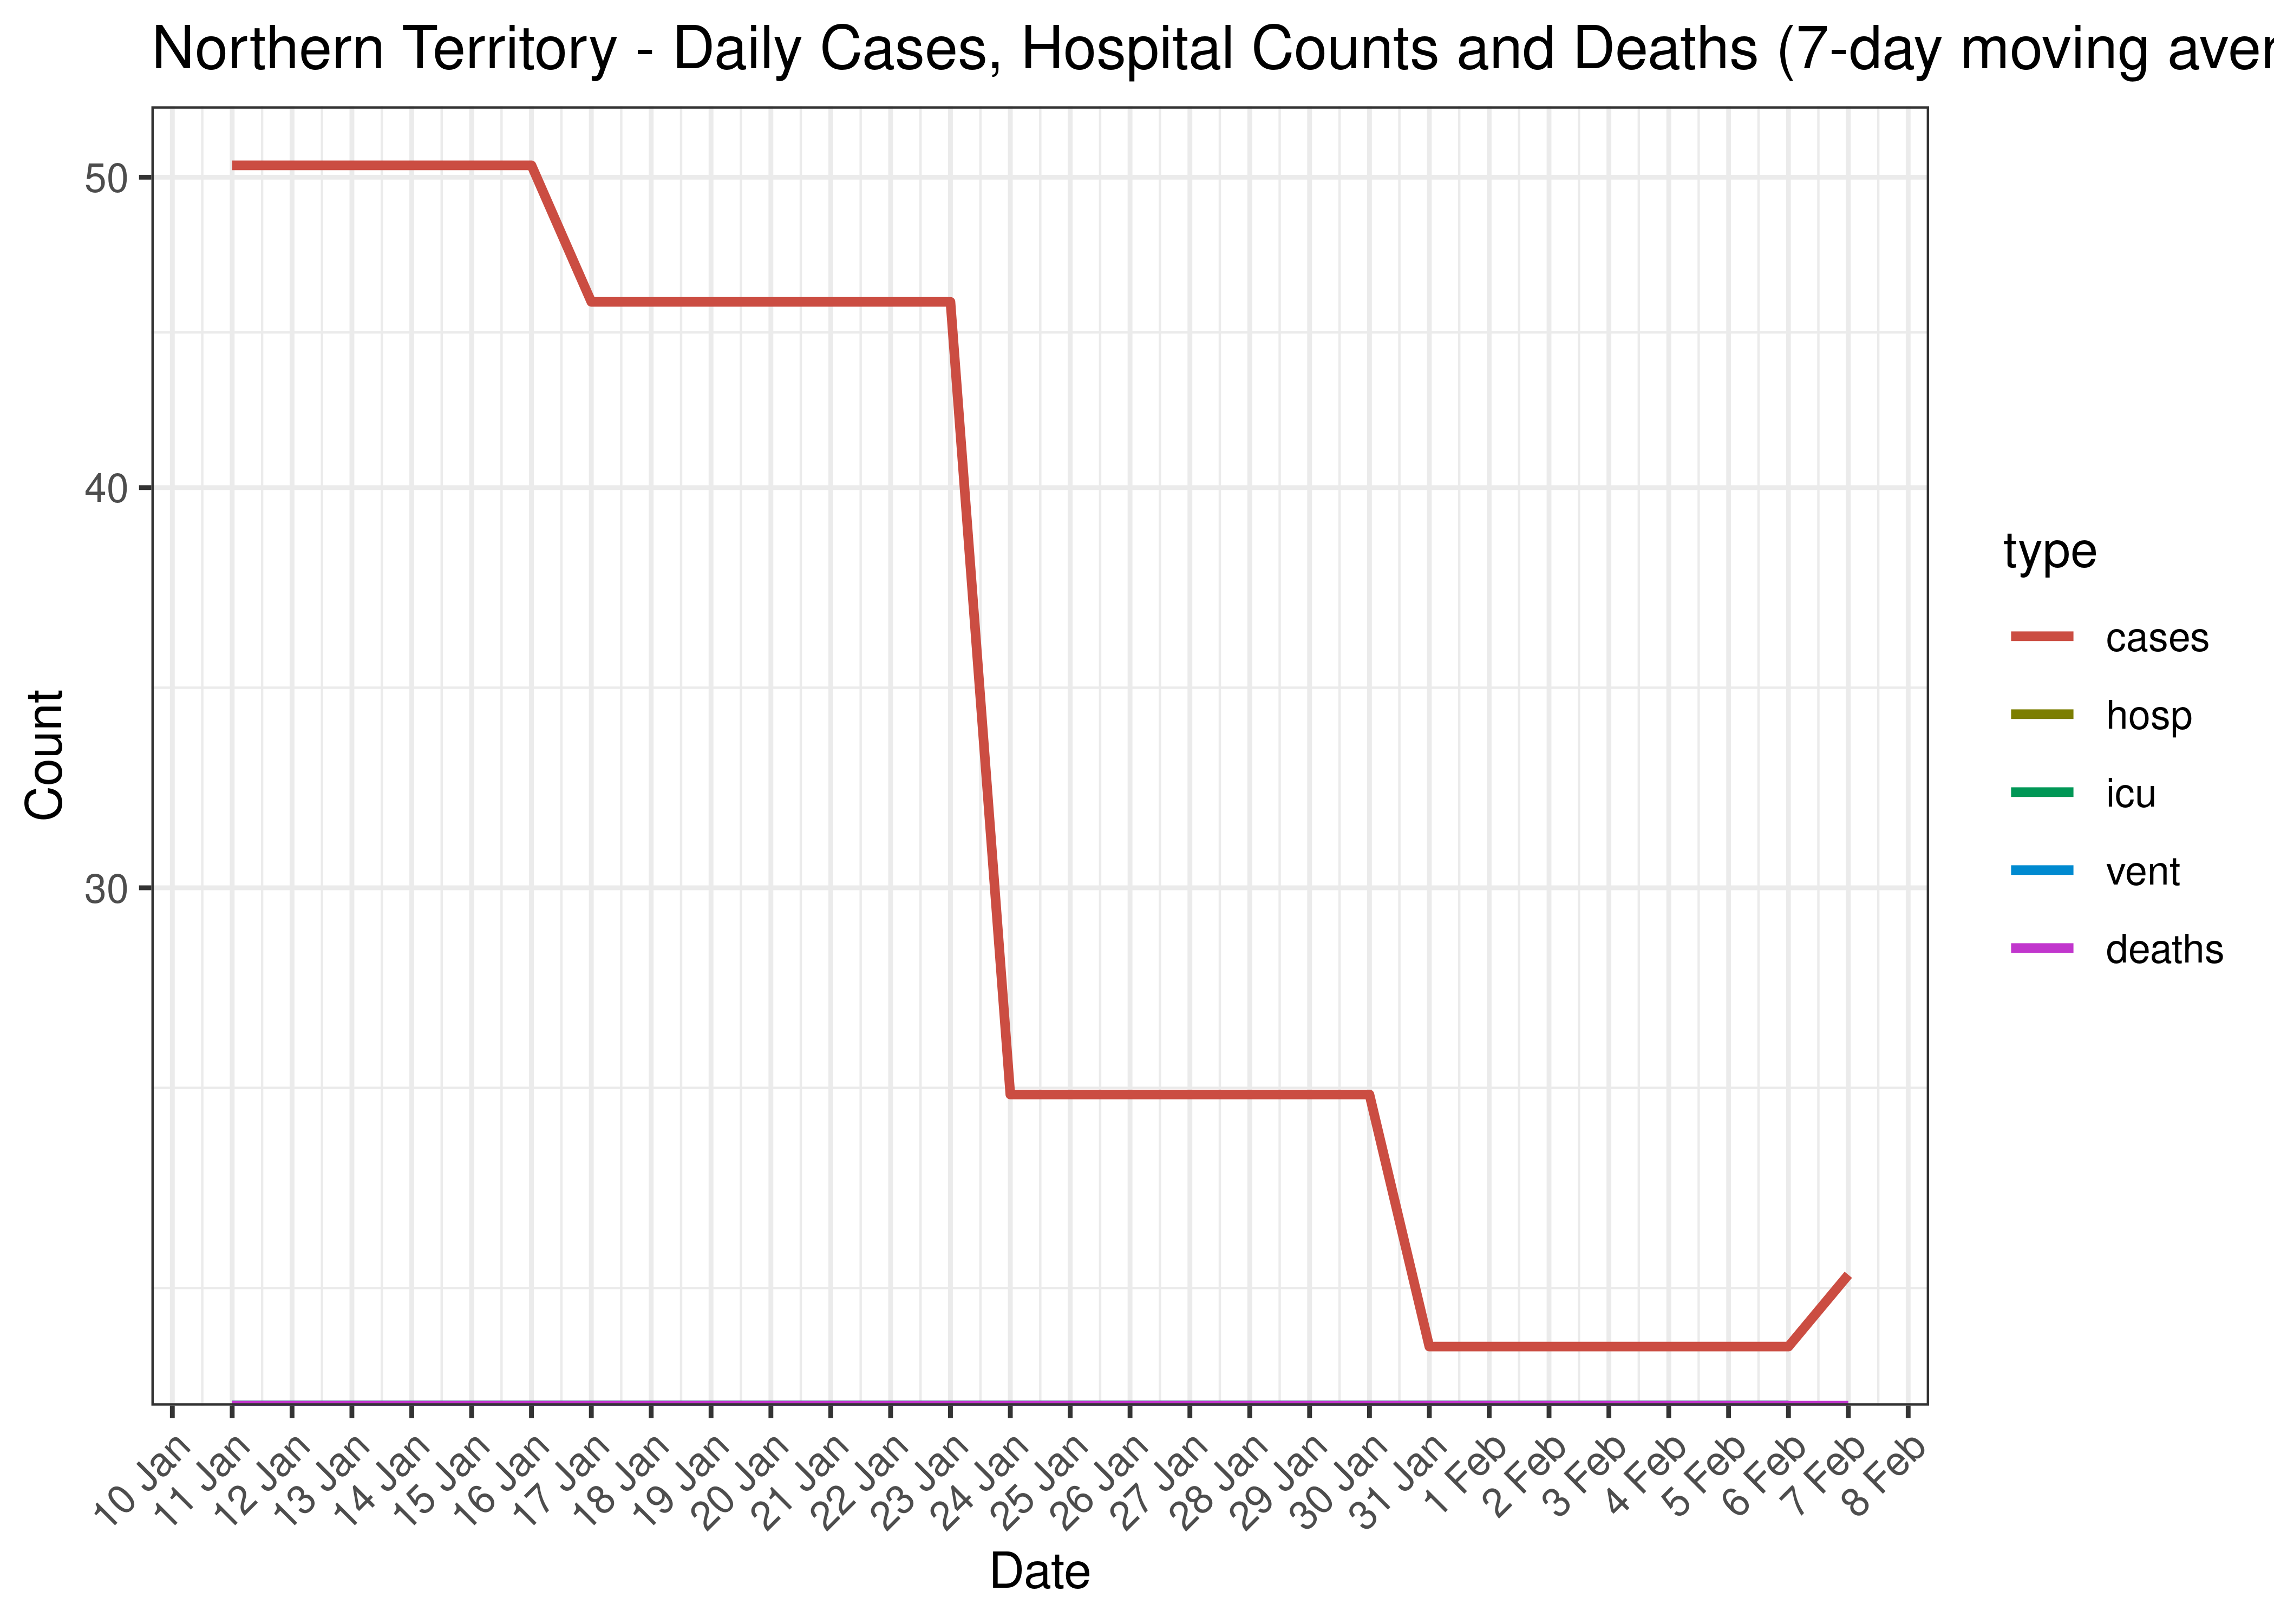
Northern Territory - Daily Cases, Admissions and Deaths for Last 30-days (7-day moving average)
5.4.8 Crude Ratios per Wave
Below crude rations are calculated between the waves. It’s based on the following starting dates:
- Wave 1 started on 2020-01-01.
- Wave 2 started on 2020-06-01.
- Wave 3 started on 2021-06-01.
- Wave 4 started on 2021-12-01.
Below crude ratios are tabulated and plotted. These ratios are:
- ICU ratio calculated as person days in ICU divided by person days in hospital.
- Ventilator ratio calculated as person days on ventilators divided by person days in hospital.
- Death ratio calculated as deaths divided by person days in hospital.
- Case fatality ratio is calcualted as deaths divided by cases.
| Wave | ICU Ratio | Ventilator Ratio | Death Ratio | Case Fatality Ratio | |
|---|---|---|---|---|---|
| Northern Territory | Wave 1 | 0.5% | 0.4% | NA | NA |
| Northern Territory | Wave 2 | 0.0% | 0.0% | NA | NA |
| Northern Territory | Wave 3 | 0.0% | 0.0% | NA | NA |
| Northern Territory | Wave 4 | 2.9% | 0.1% | 0.6% | 0.08% |
5.4.9 Reproduction Number
Below current (last weekly) effective reproduction number estimates are tabulated for Australia and by state.
| Type | Count (Per Day) | Week Ending | Reproduction Number [95% Confidence Interval] | |
|---|---|---|---|---|
| Northern Territory | cases | 23 | 2023-02-10 | 1.02 [0.87 - 1.19] |
Below the effective reproduction number for Australia over the last 90 days are plotted together with a plot since start of the pandemic.
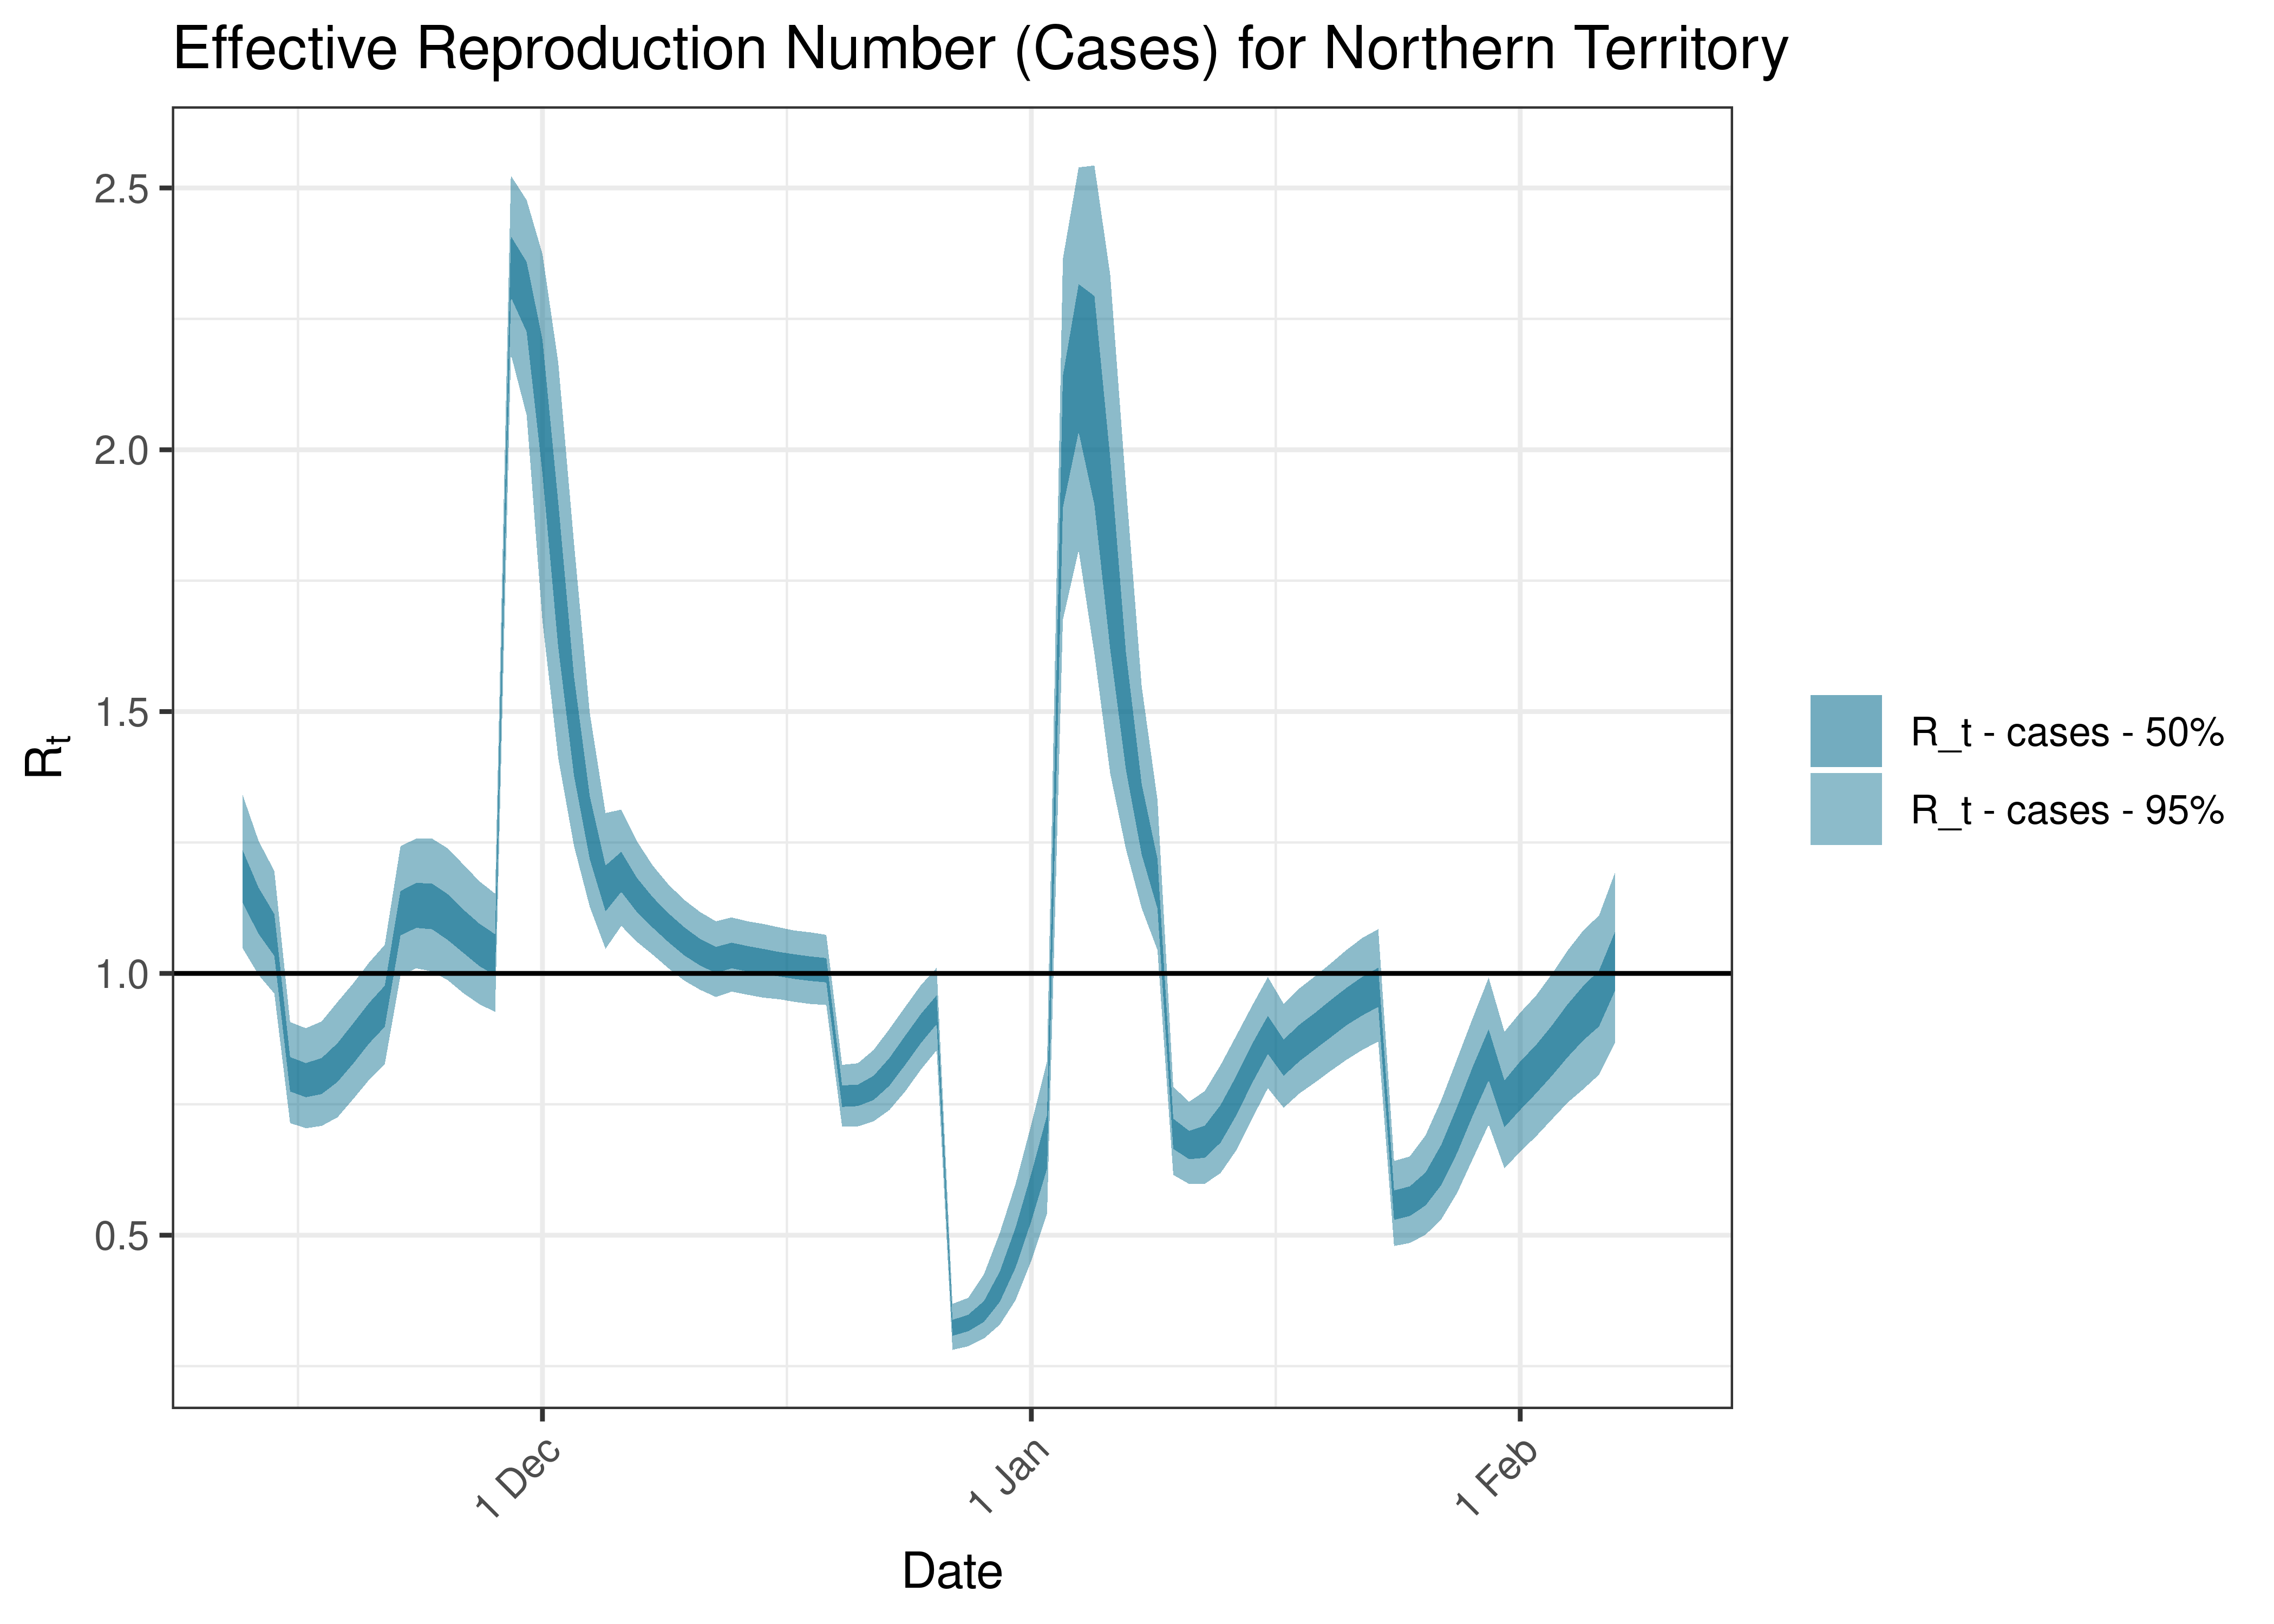
Estimated Effective Reproduction Number Based on Cases for Northern Territory over last 90 days
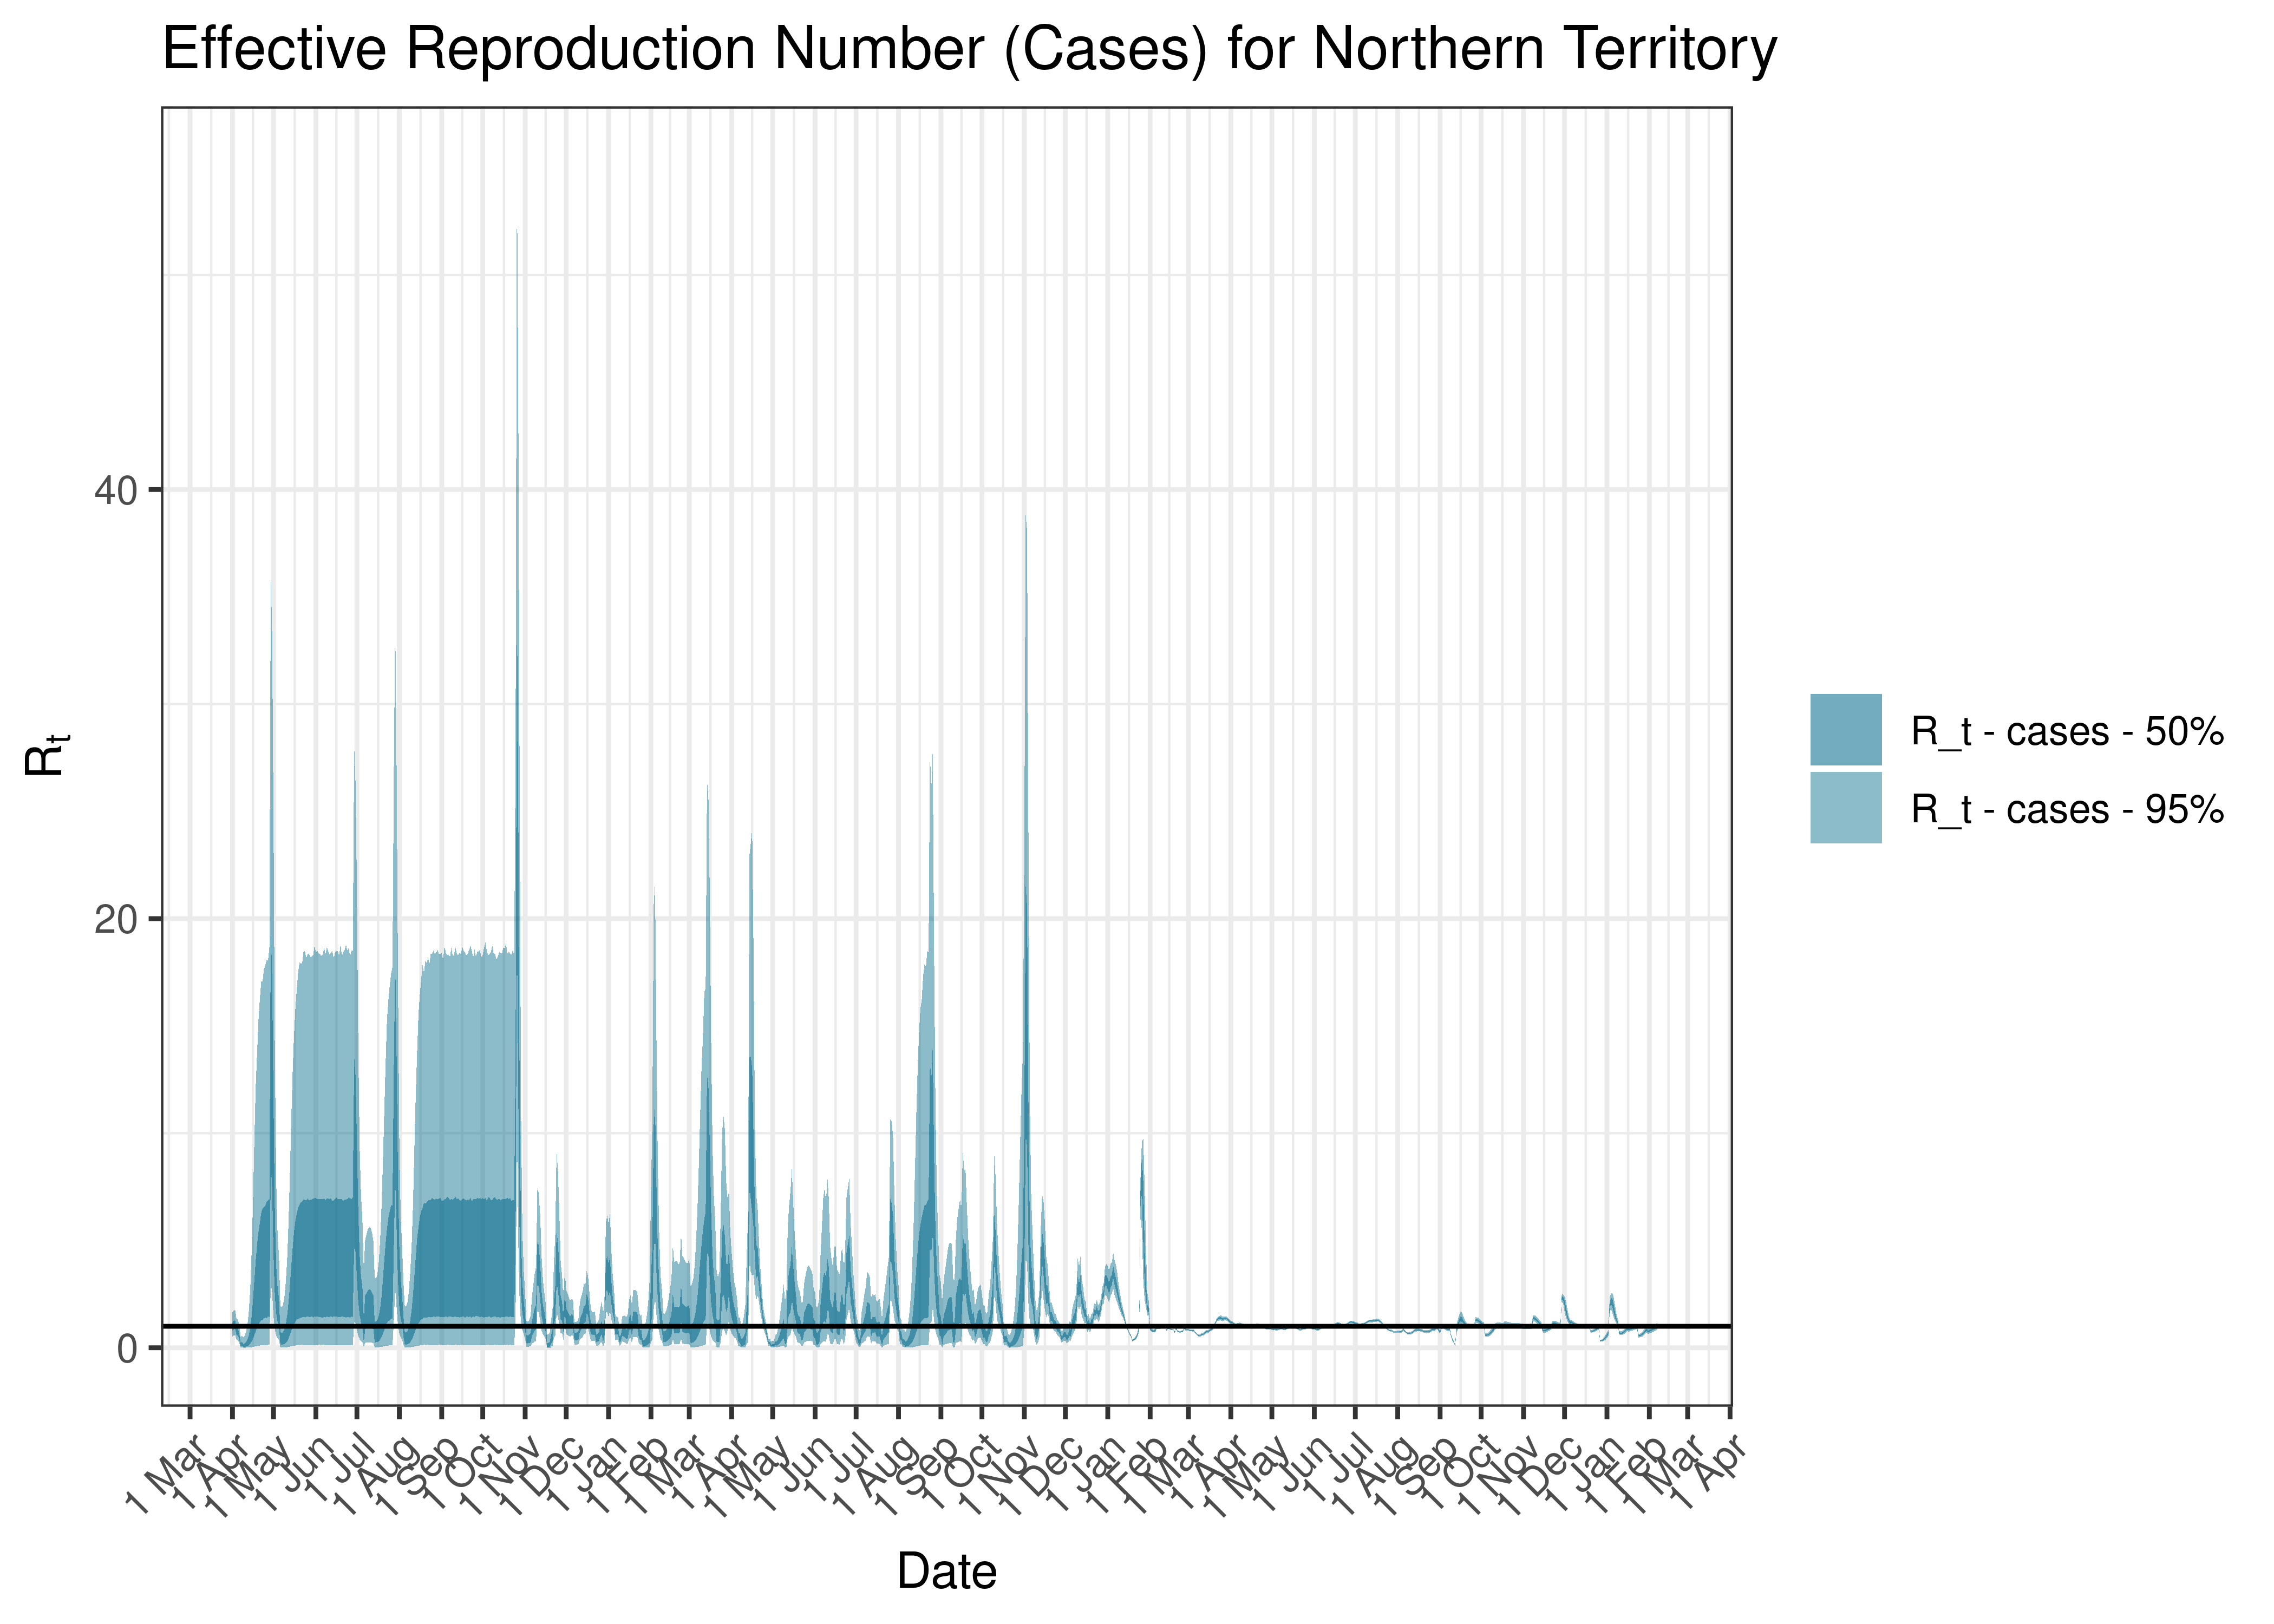
Estimated Effective Reproduction Number Based on Cases for Northern Territory since 1 April 2020
5.5 Queensland
5.5.1 Tests
Below raw numbers of test by date are plotted on a 7-day moving average from 1 April 2020.
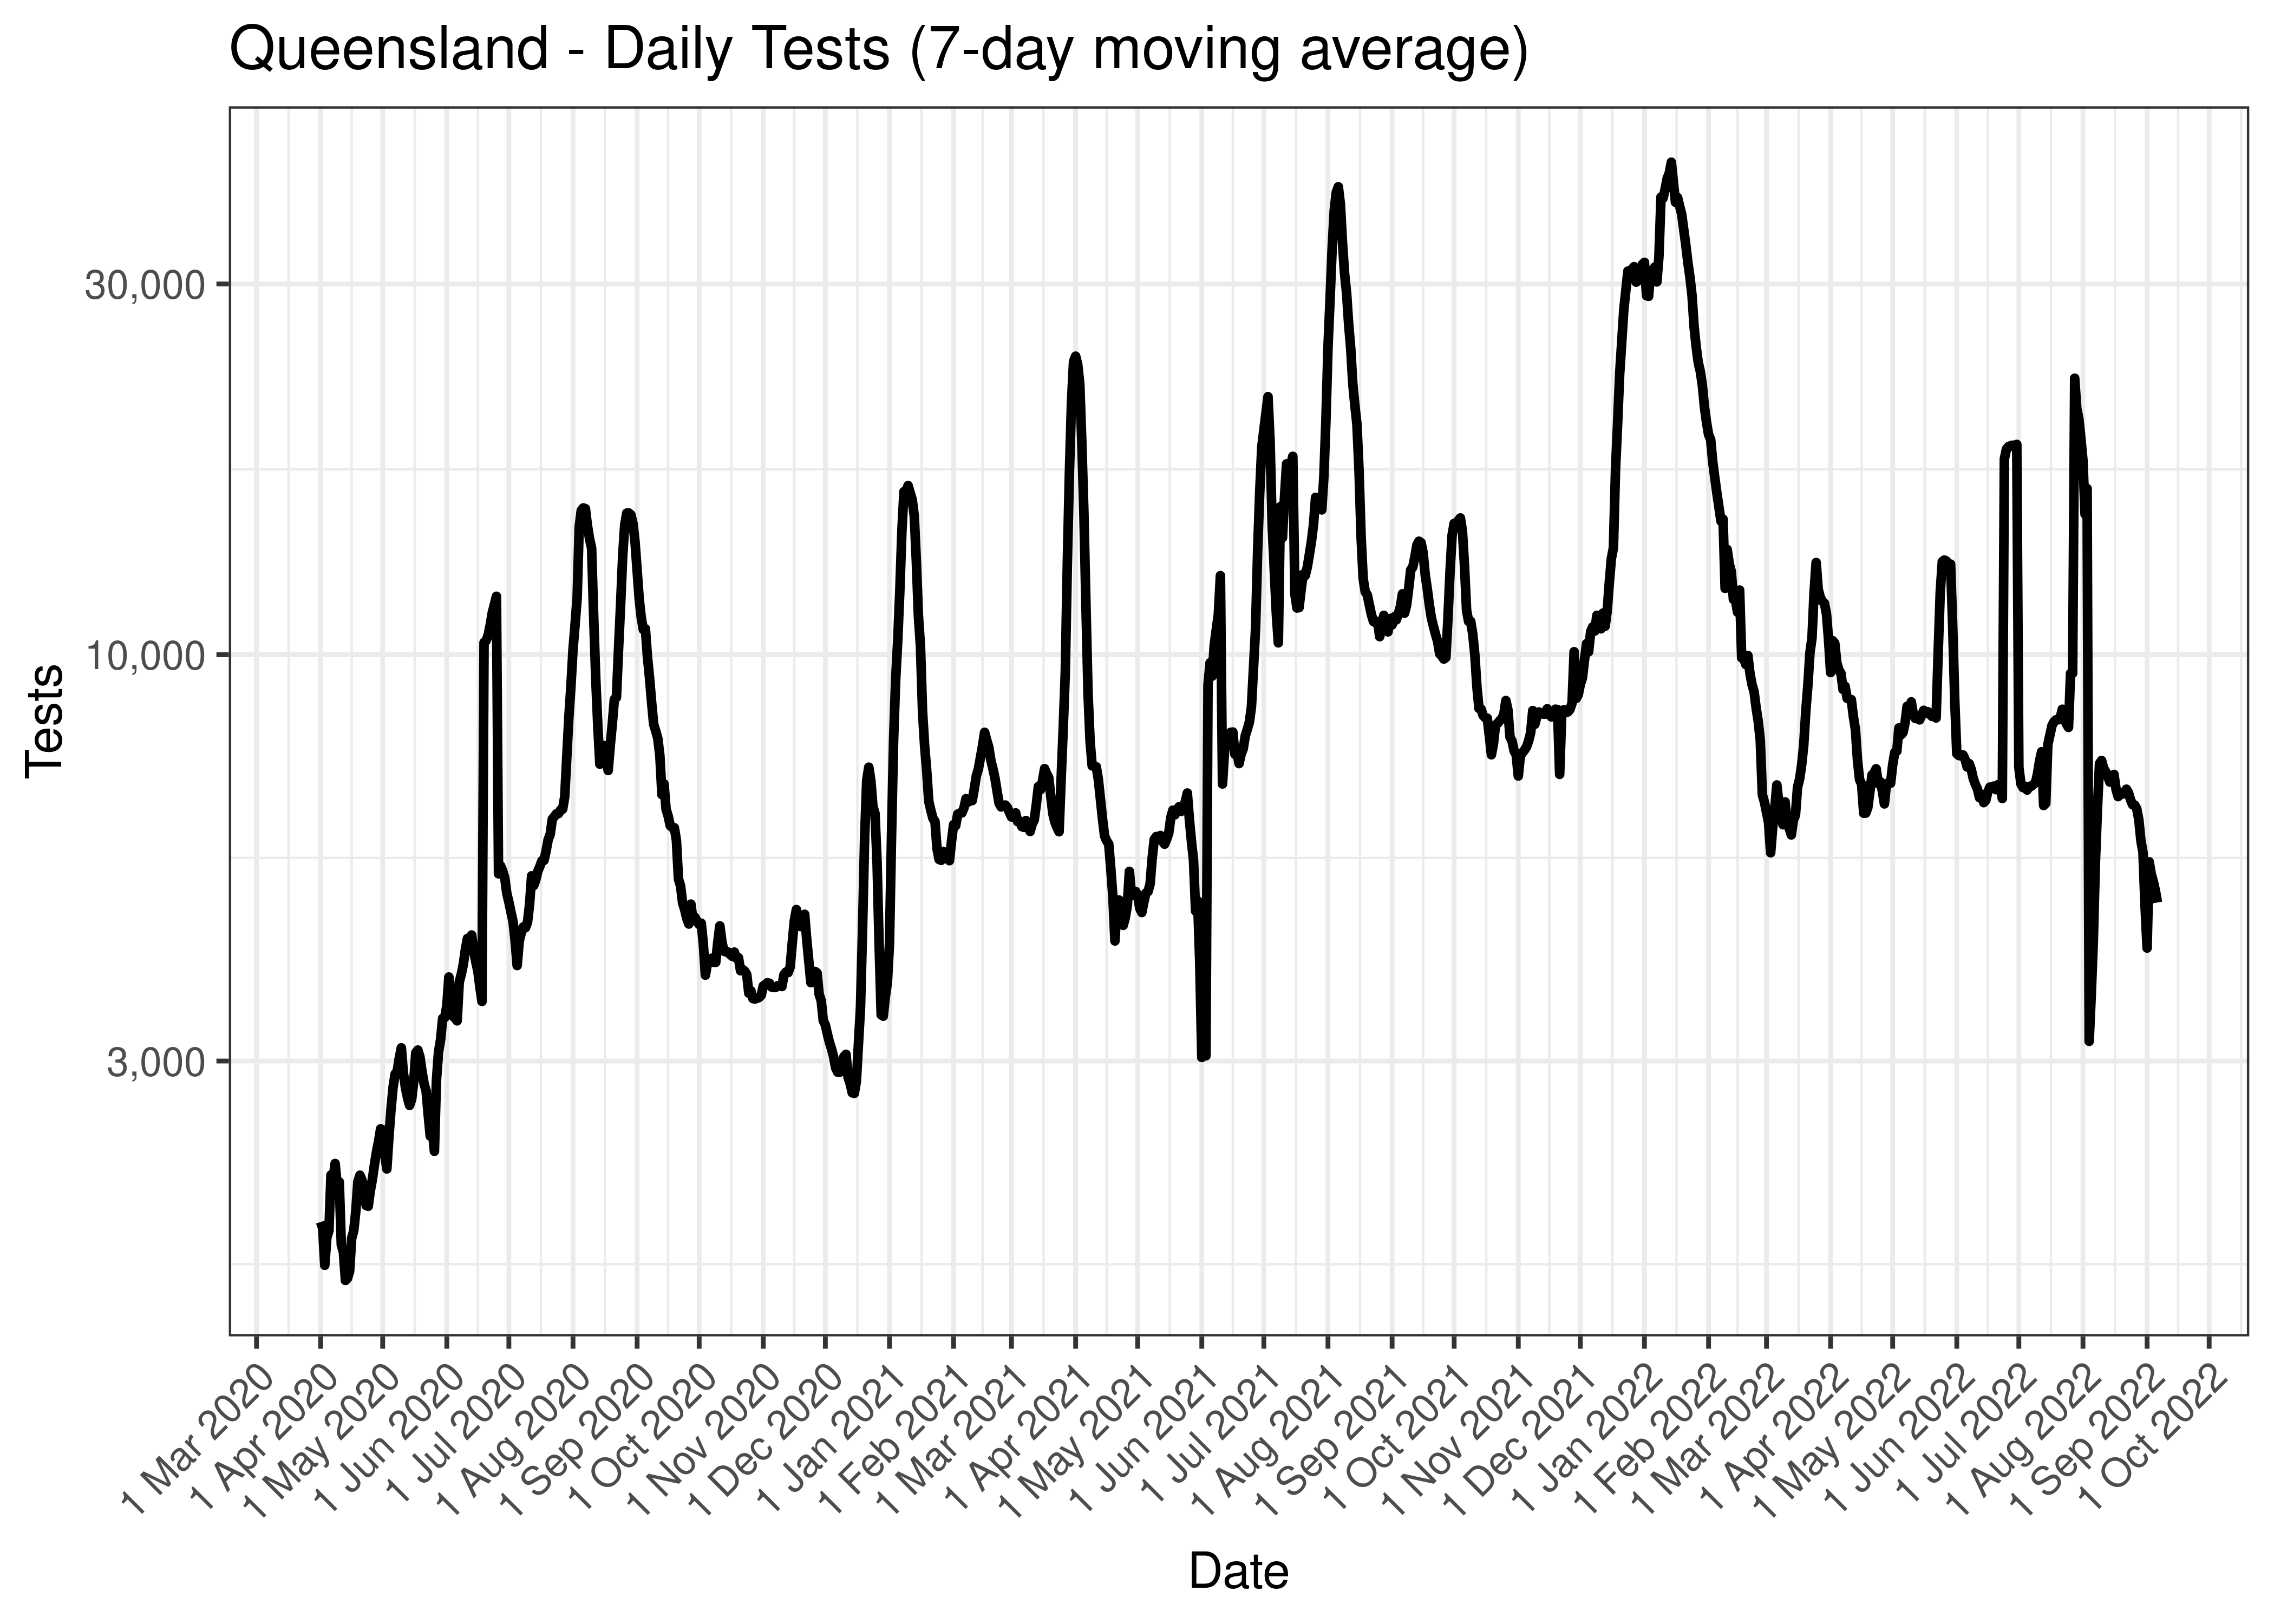
Queensland - Daily Tests (7-day moving average)
The above chart is repeated below covering the last 30 days only.
Queensland - Daily Tests for Last 30 Days (7-day moving average)
5.5.2 Cases
Cases are tabulated by specimen received date below. Cases include estimates for late reporting in recent days as well as adjustments for any public holidays. A centred 7-day moving average is also shown. The peak daily cases in previous waves (as measured by the moving average) is also shown.
| Date | Cases | 7-day Moving Average | Comment |
|---|---|---|---|
| 2020-03-25 | 46 | 58 | Wave 1 Peak |
| 2021-08-04 | 19 | 16 | Wave 3 Peak |
| 2021-08-05 | 27 | 16 | Wave 3 Peak |
| 2022-03-19 | 6,093 | 38,377 | Wave 4 Peak (to date) |
| 2023-02-03 | 4,094 | 585 | |
| 2023-02-04 | 0 | 585 | |
| 2023-02-05 | 0 | 585 | |
| 2023-02-06 | 0 | 585 | |
| 2023-02-07 | 0 | 503 | |
| 2023-02-08 | 0 | NA | |
| 2023-02-09 | 0 | NA | |
| 2023-02-10 | 3,520 | NA |
Below a 7-day moving average daily case count is plotted for Queensland on a log scale since start of the epidemic:
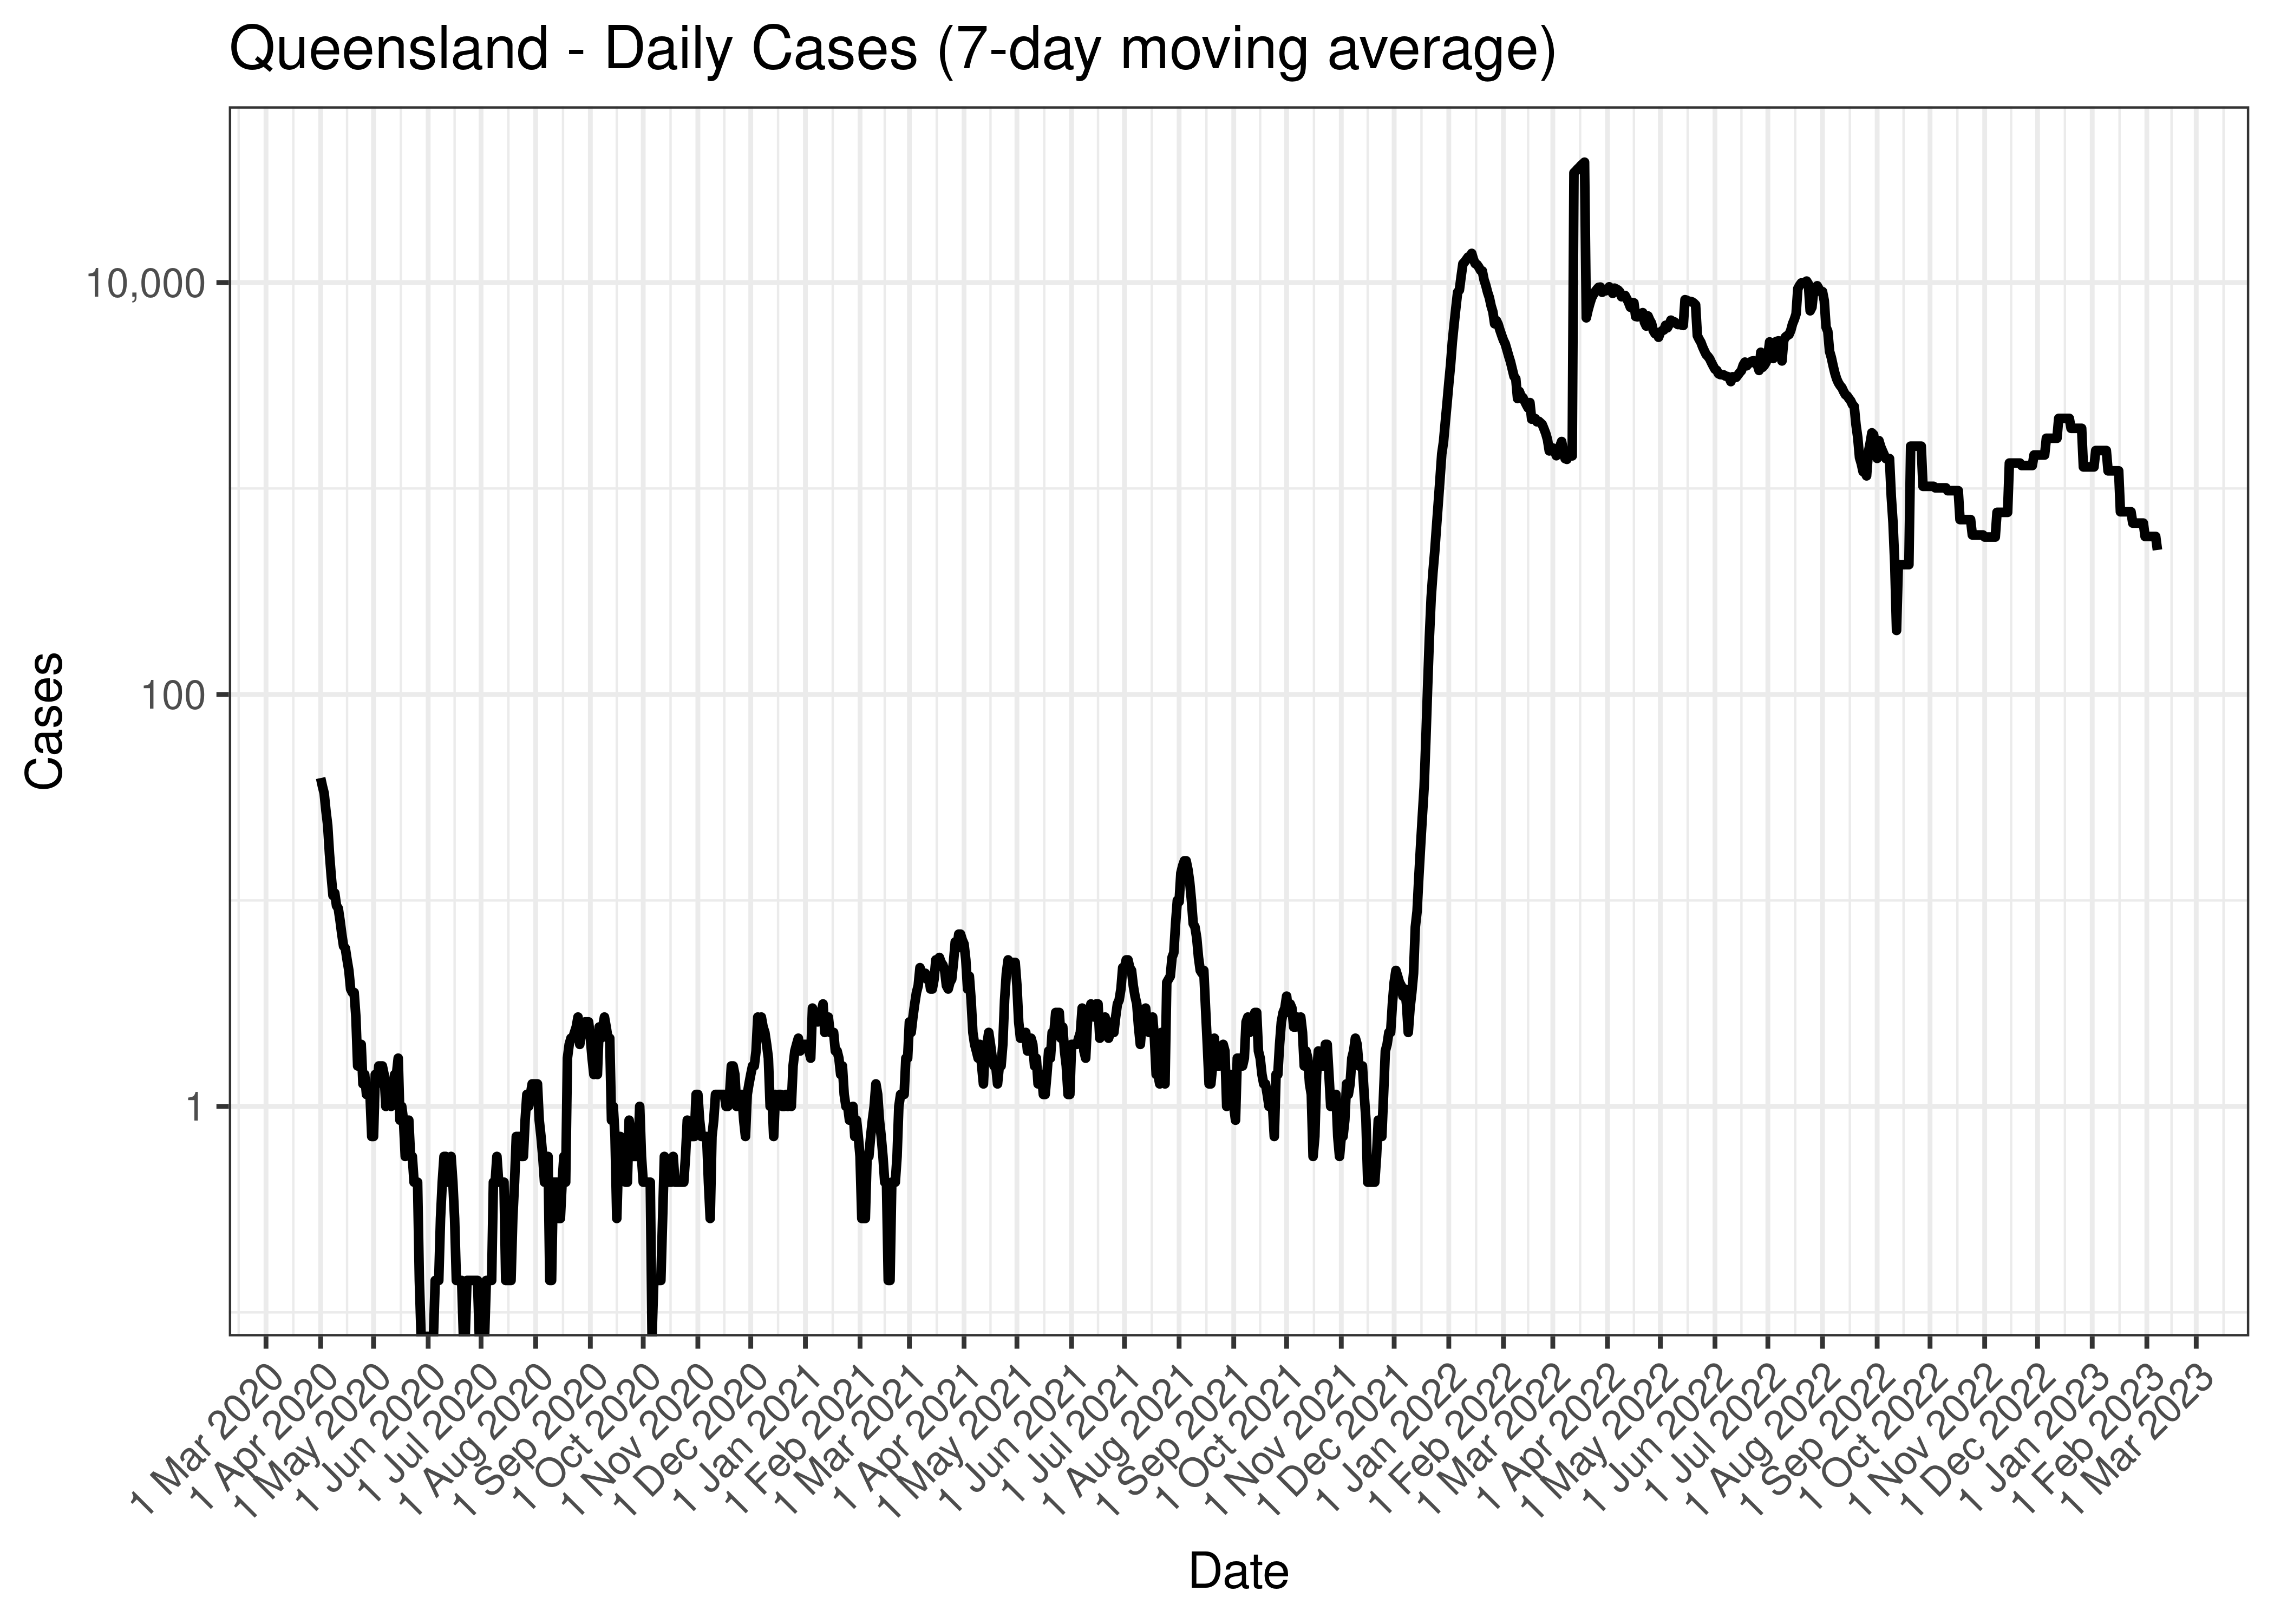
Queensland - Daily Cases (7-day moving average)
Below the above chart is repeated for the last 30-days:
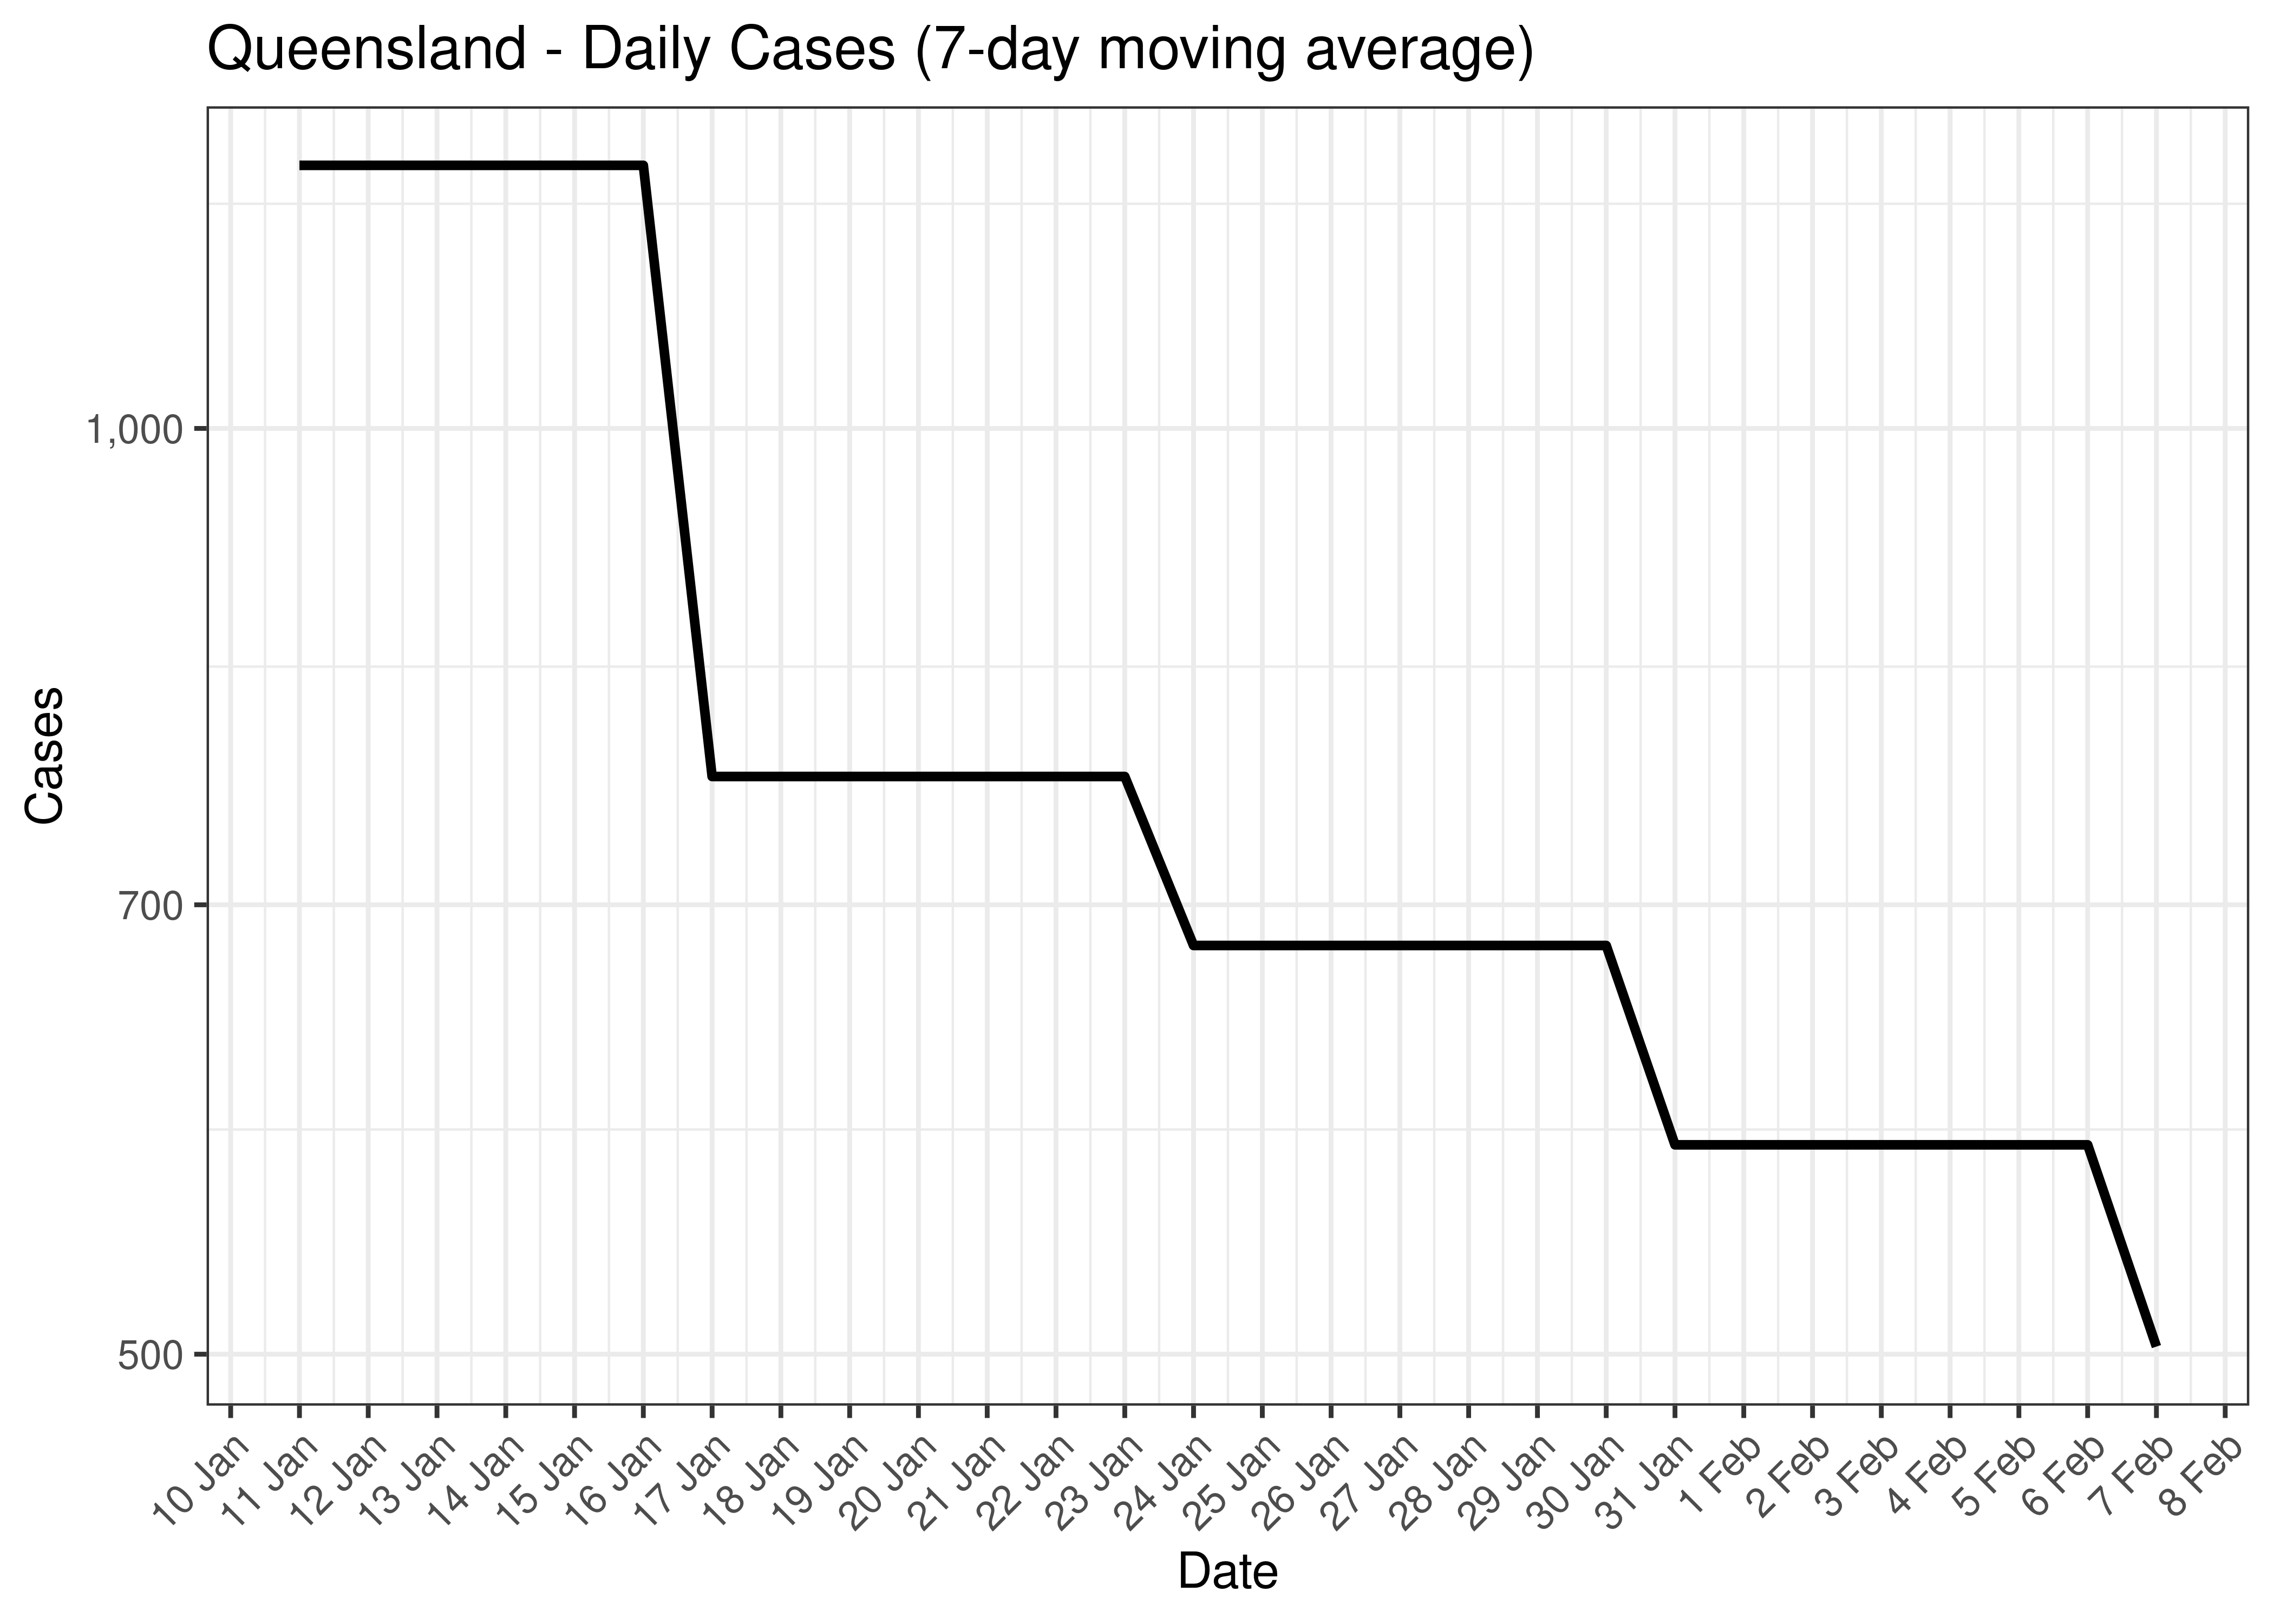
Queensland - Daily Cases for Last 30-days (7-day moving average)
5.5.3 Hospitlisation
Counts of those in hospital are tabulated by report date below. A centred 7-day moving average is also shown. The peak daily admissions in previous waves (as measured by the moving average) is also shown.
| Date | In Hospital | 7-day Moving Average | Comment |
|---|---|---|---|
| 2020-04-04 | 47 | 51 | Wave 1 Peak |
| 2021-04-02 | 82 | 76 | Wave 2 Peak |
| 2021-08-05 | 65 | 67 | Wave 3 Peak |
| 2022-07-23 | 1,061 | 1,053 | Wave 4 Peak (to date) |
| 2023-02-03 | 0 | 0 | |
| 2023-02-04 | 0 | 0 | |
| 2023-02-05 | 0 | 0 | |
| 2023-02-06 | 0 | 0 | |
| 2023-02-07 | 0 | NA | |
| 2023-02-08 | 0 | NA | |
| 2023-02-09 | 0 | NA | |
| 2023-02-10 | NA | NA |
The above are based on the following dates:
- Wave 1 started on 2020-01-01.
- Wave 2 started on 2020-06-01.
- Wave 3 started on 2021-06-01.
- Wave 4 started on 2021-12-01.
Below a 7-day moving average of daily hospital counts is plotted by on a log scale since start of the epidemic. Note admissions are plotted by date.
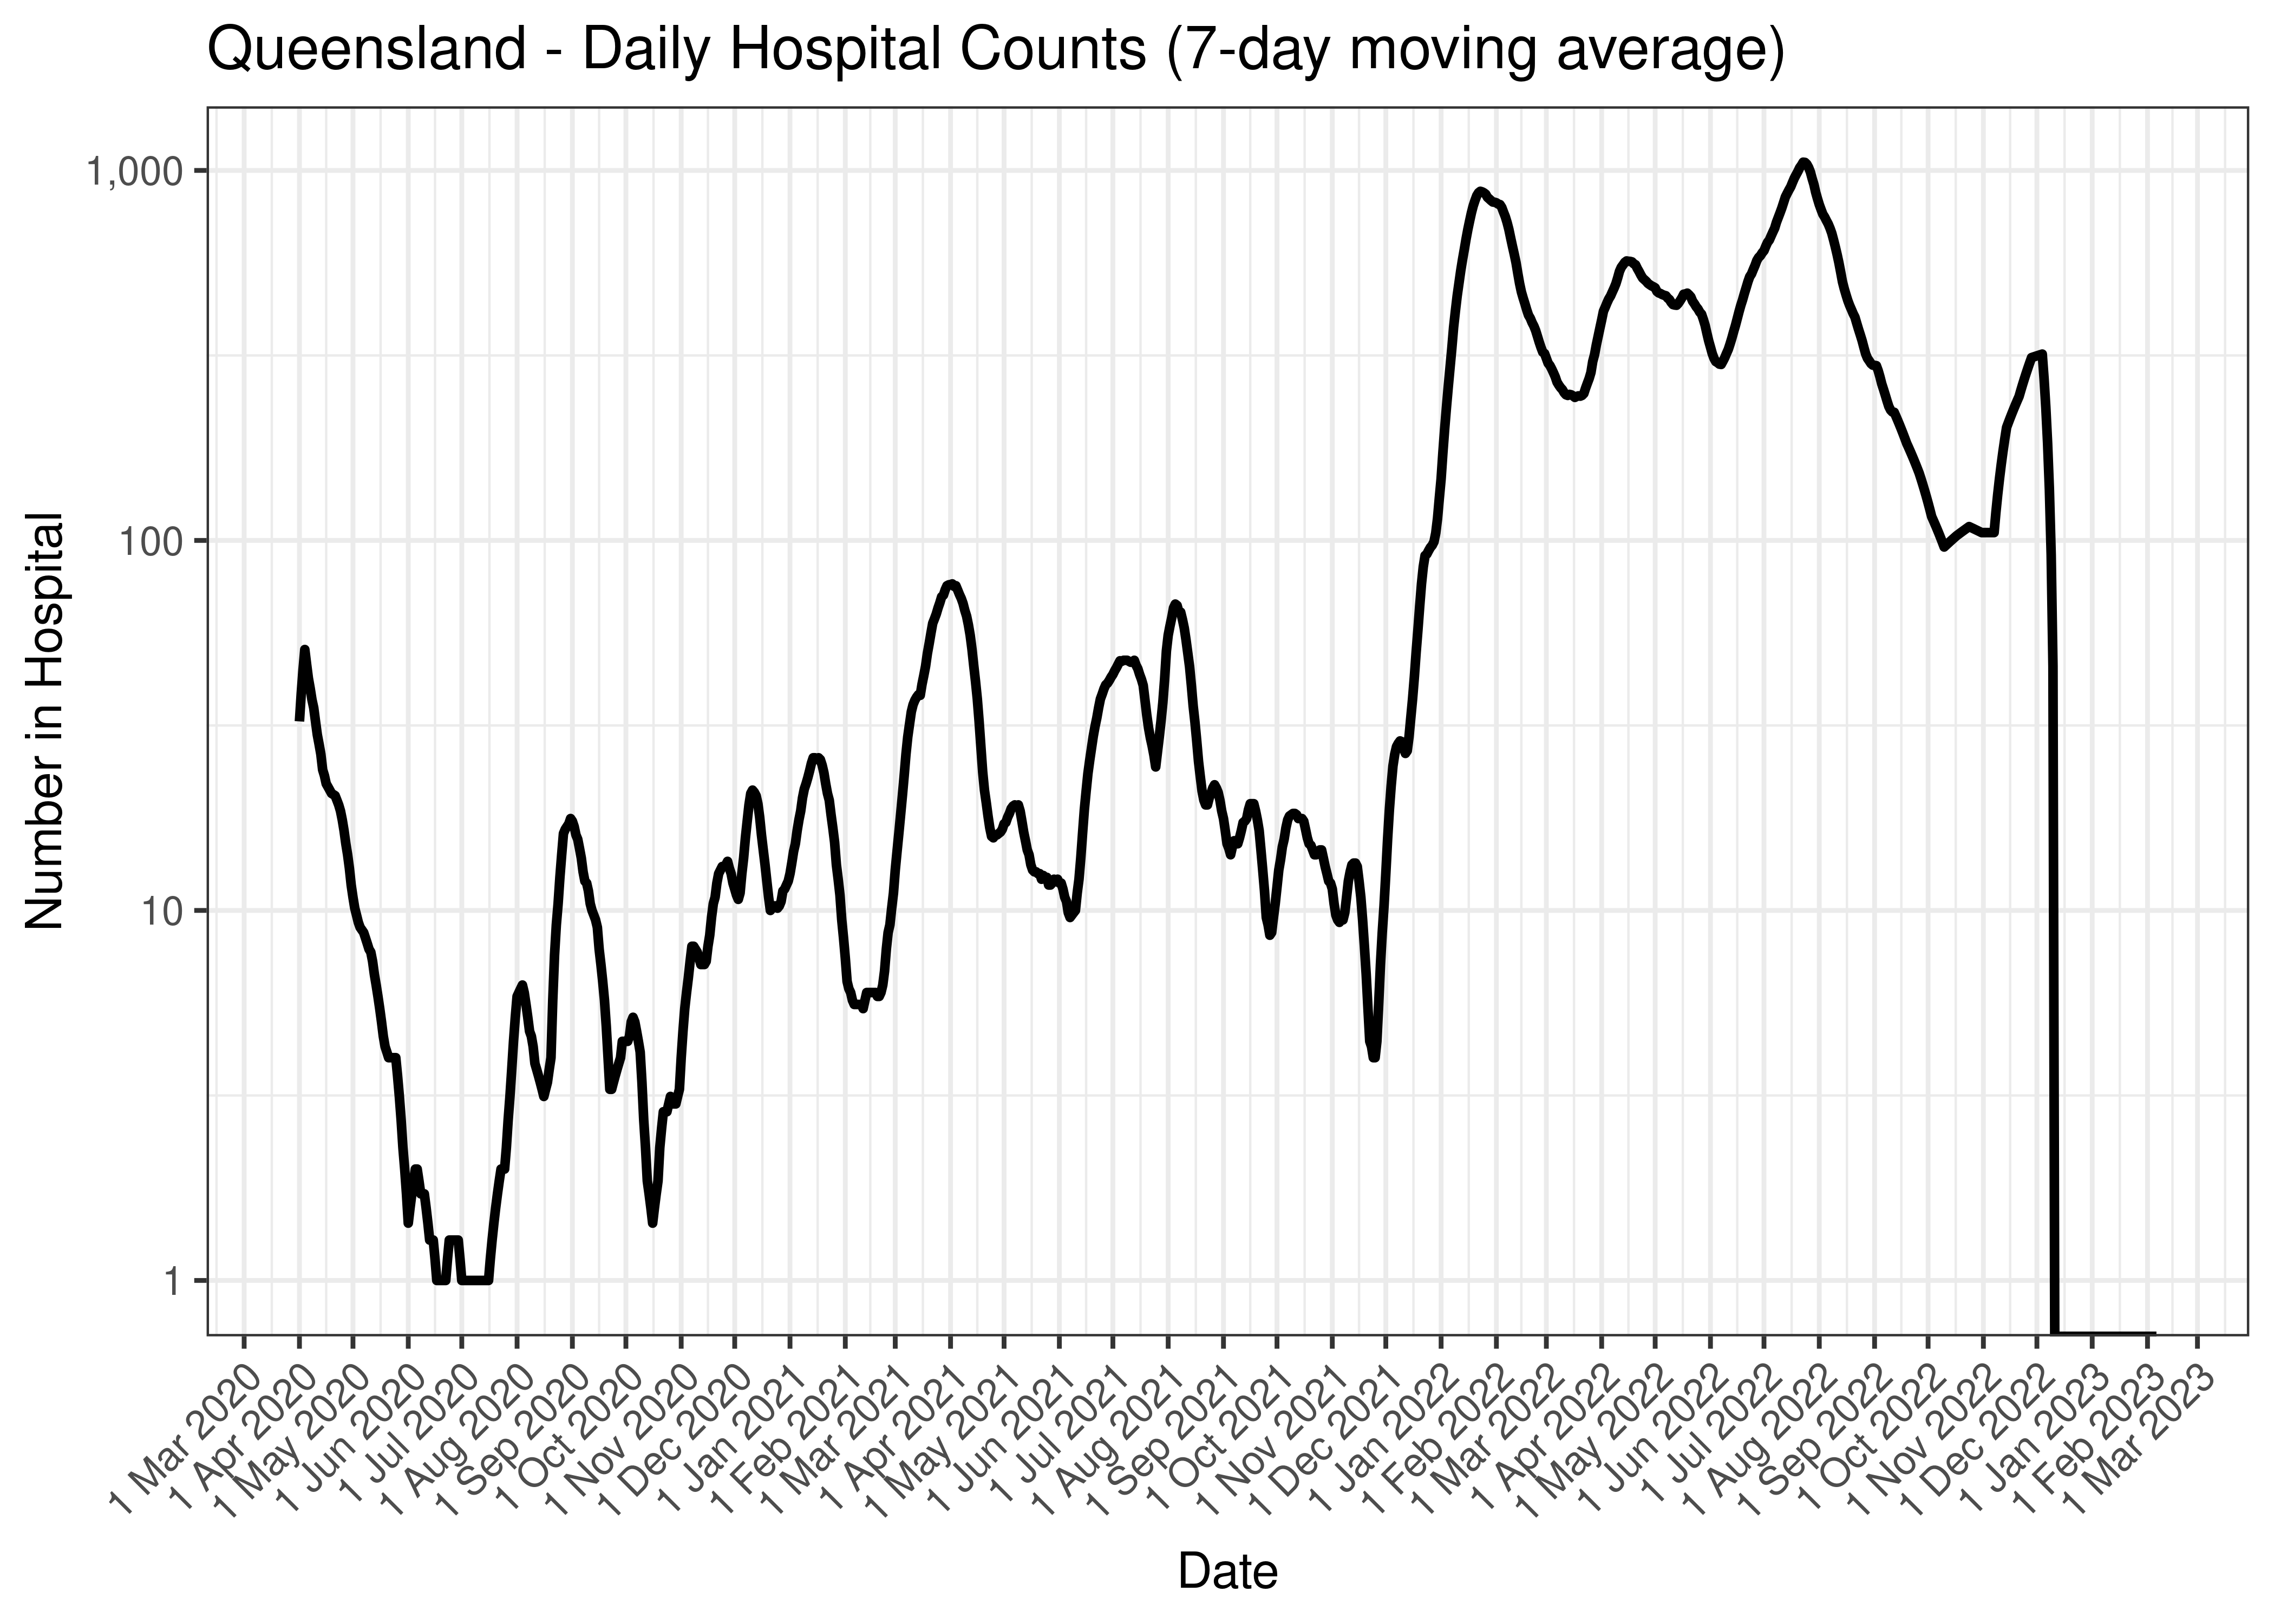
Queensland - Daily Hospital Counts (7-day moving average)
Below the above chart is repeated for the last 30-days:
Queensland - Daily Hospital Counts for Last 30-days (7-day moving average)
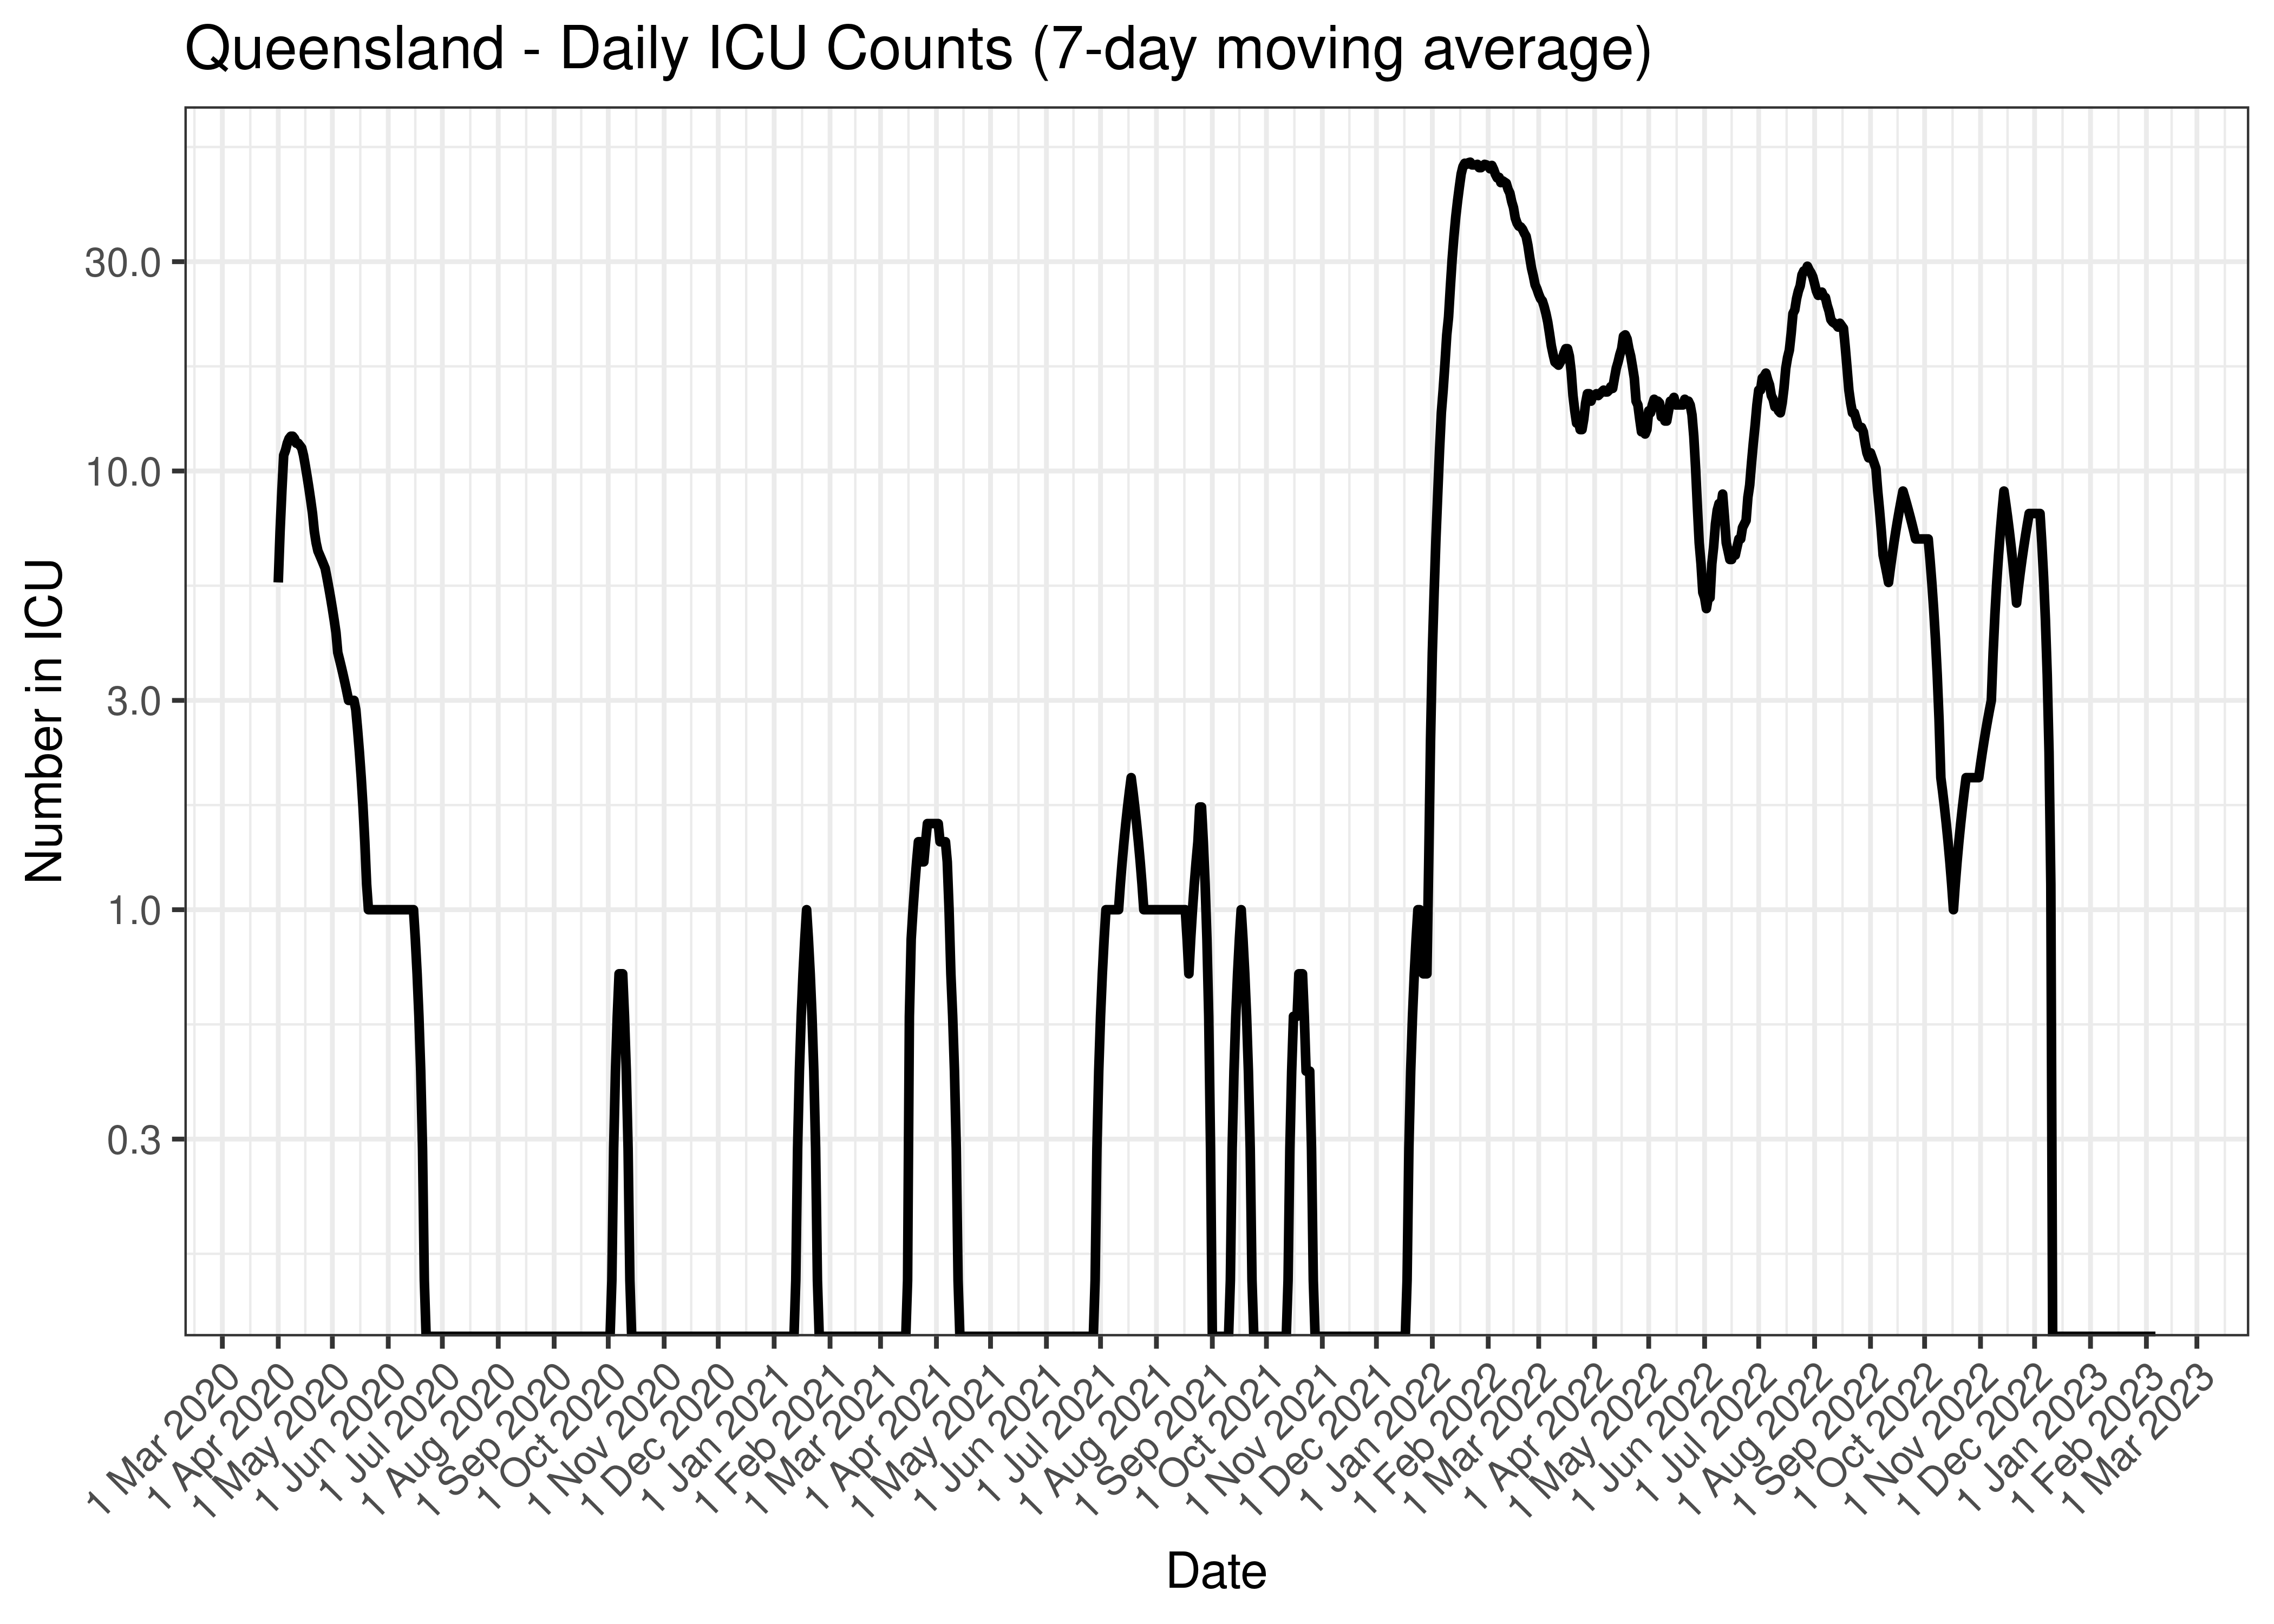
5.5.4 ICU
Counts of those in ICU are tabulated by report date below. A centred 7-day moving average is also shown. The peak daily admissions in previous waves (as measured by the moving average) is also shown.
| Date | In ICU | 7-day Moving Average | Comment |
|---|---|---|---|
| 2020-04-08 | 11 | 12 | Wave 1 Peak |
| 2020-04-09 | 12 | 12 | Wave 1 Peak |
| 2022-01-22 | 52 | 51 | Wave 4 Peak (to date) |
| 2023-02-03 | 0 | 0 | |
| 2023-02-04 | 0 | 0 | |
| 2023-02-05 | 0 | 0 | |
| 2023-02-06 | 0 | 0 | |
| 2023-02-07 | 0 | NA | |
| 2023-02-08 | 0 | NA | |
| 2023-02-09 | 0 | NA | |
| 2023-02-10 | NA | NA |
The above are based on the following dates:
- Wave 1 started on 2020-01-01.
- Wave 2 started on 2020-06-01.
- Wave 3 started on 2021-06-01.
- Wave 4 started on 2021-12-01.
Below a 7-day moving average of daily ICU counts is plotted by on a log scale since start of the epidemic. Note admissions are plotted by date.
Queensland - Daily ICU Counts (7-day moving average)
Below the above chart is repeated for the last 30-days:
Queensland - Daily ICU Counts for Last 30-days (7-day moving average)
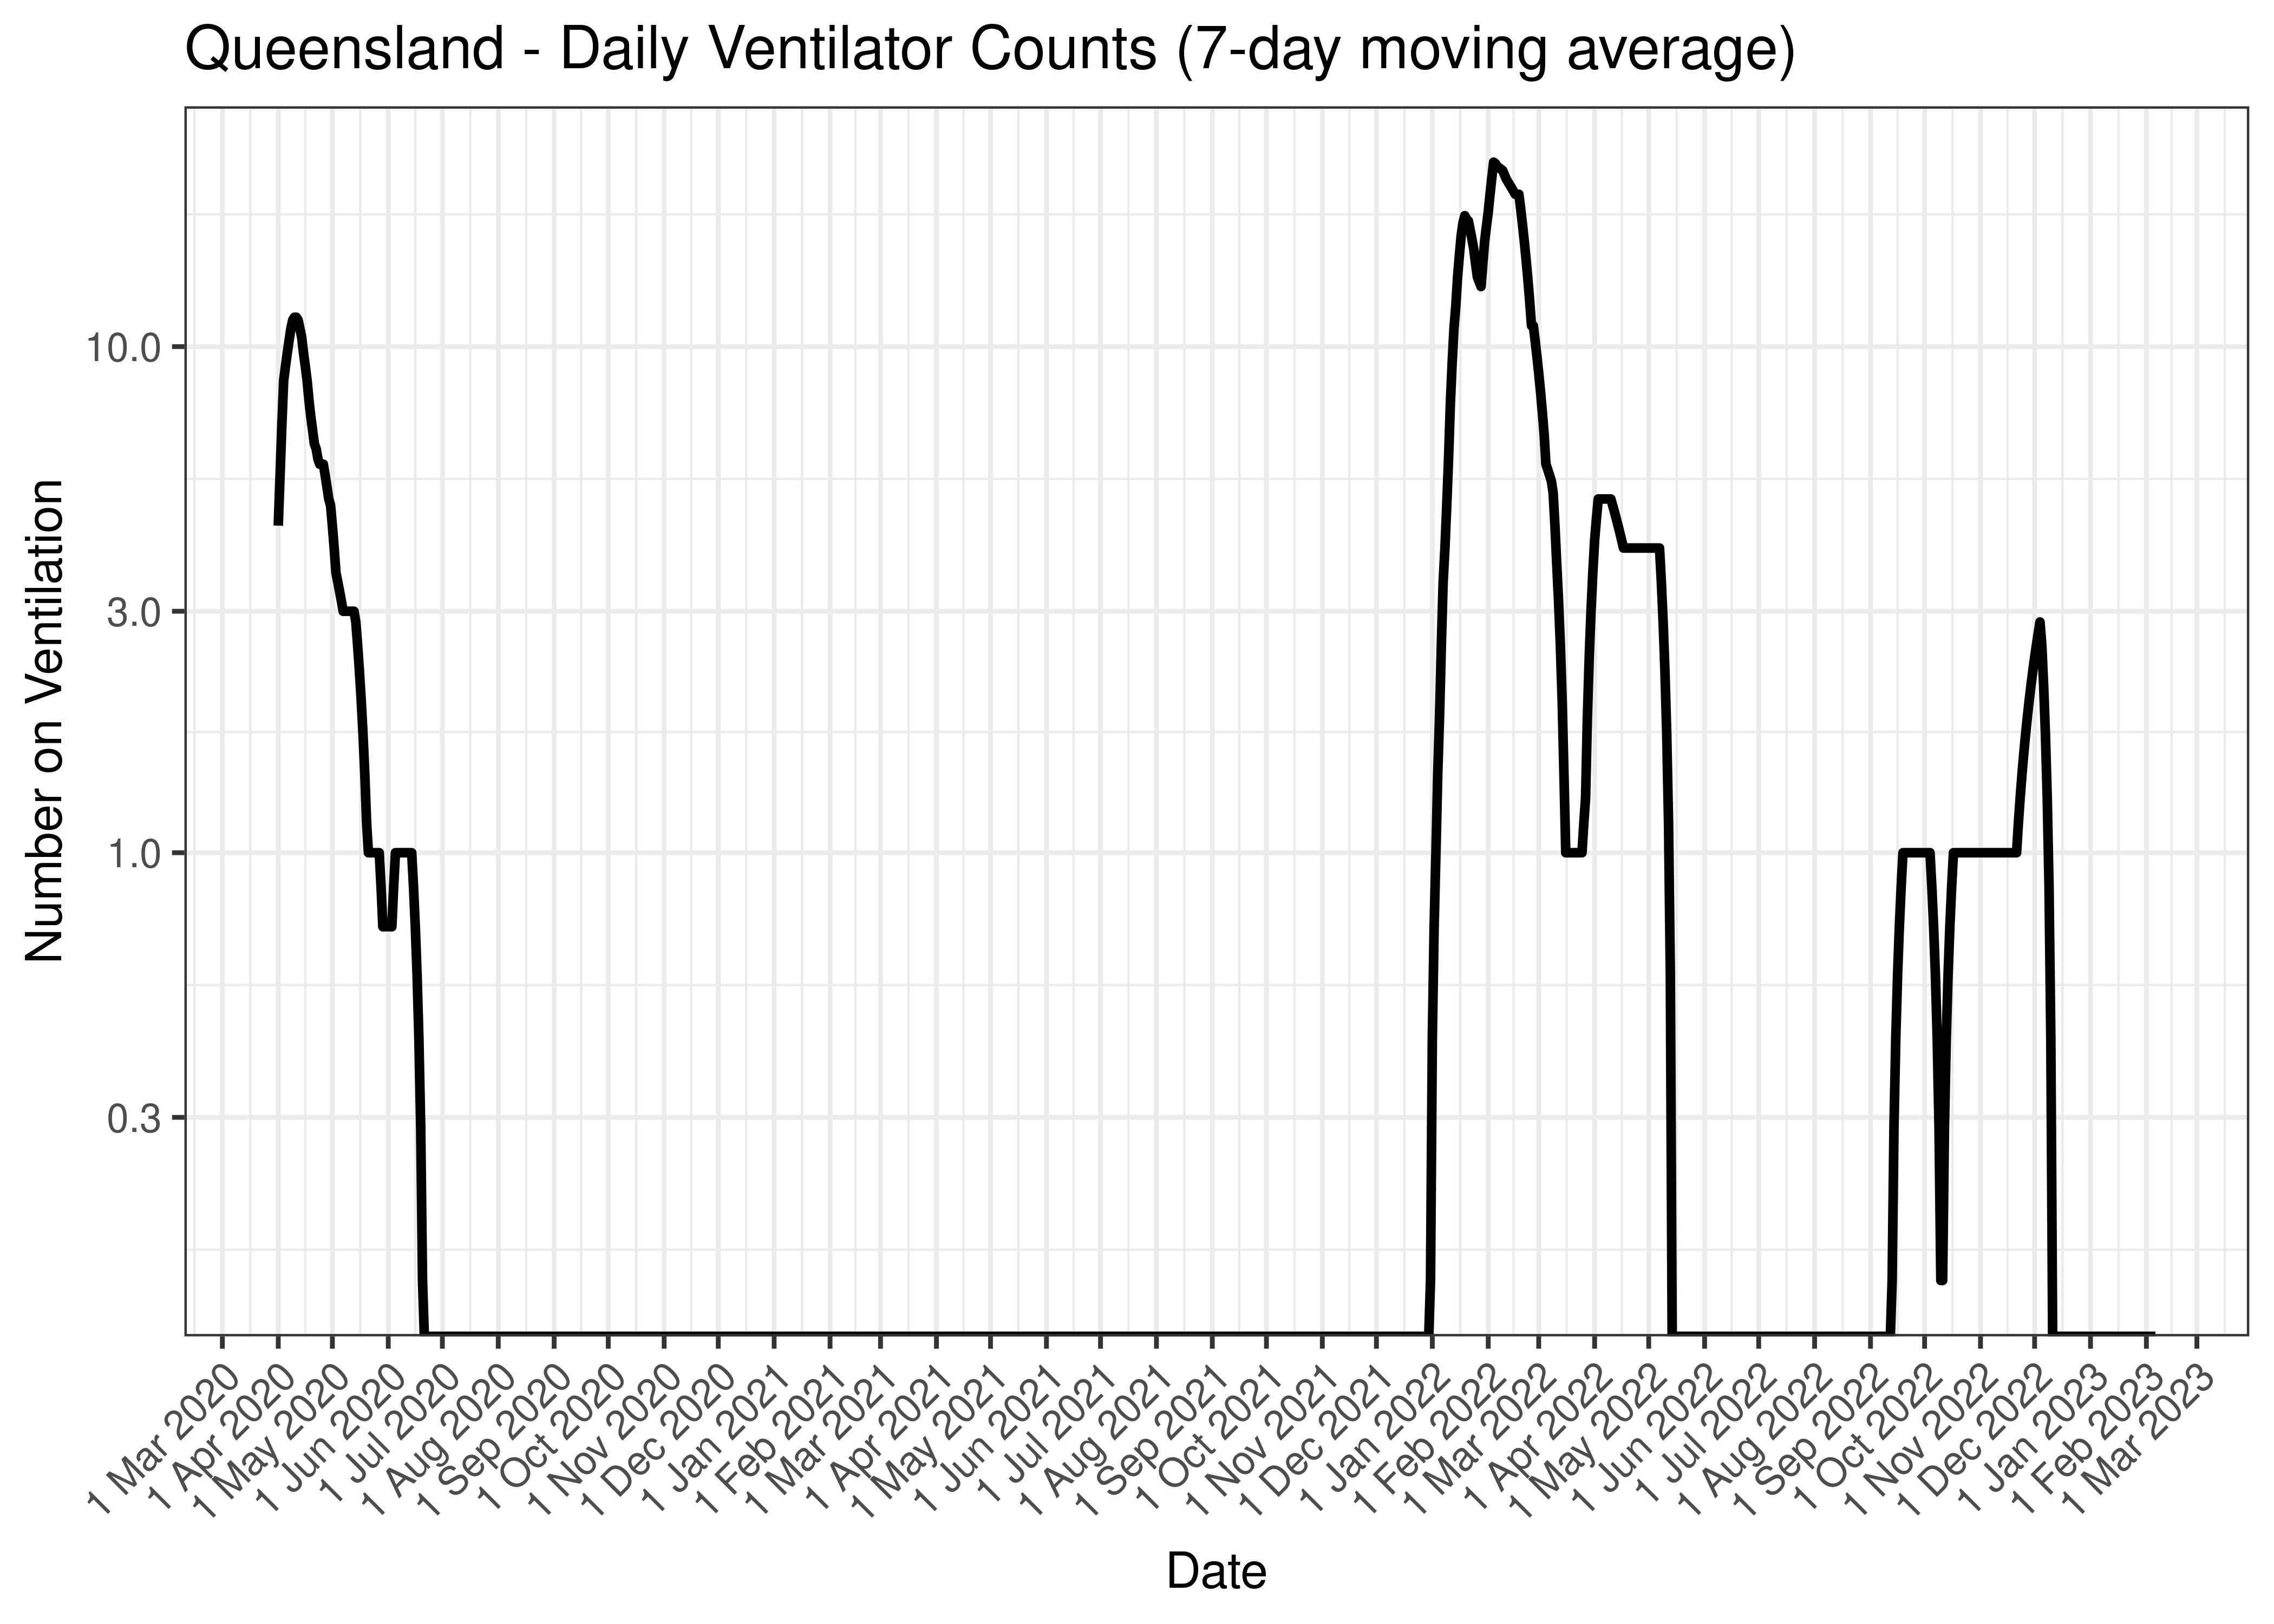
5.5.5 Ventilator
Counts of those on ventilators are tabulated by report date below. A centred 7-day moving average is also shown. The peak daily admissions in previous waves (as measured by the moving average) is also shown.
| Date | On Ventilators | 7-day Moving Average | Comment |
|---|---|---|---|
| 2020-04-10 | 12 | 11 | Wave 1 Peak |
| 2020-04-11 | 12 | 11 | Wave 1 Peak |
| 2022-02-04 | 23 | 23 | Wave 4 Peak (to date) |
| 2023-02-03 | 0 | 0 | |
| 2023-02-04 | 0 | 0 | |
| 2023-02-05 | 0 | 0 | |
| 2023-02-06 | 0 | 0 | |
| 2023-02-07 | 0 | NA | |
| 2023-02-08 | 0 | NA | |
| 2023-02-09 | 0 | NA | |
| 2023-02-10 | NA | NA |
The above are based on the following dates:
- Wave 1 started on 2020-01-01.
- Wave 2 started on 2020-06-01.
- Wave 3 started on 2021-06-01.
- Wave 4 started on 2021-12-01.
Below a 7-day moving average of daily ventilator counts is plotted by on a log scale since start of the epidemic. Note admissions are plotted by date.
Queensland - Daily Ventilator Counts (7-day moving average)
Below the above chart is repeated for the last 30-days:
Queensland - Daily Ventilator Counts for Last 30-days (7-day moving average)
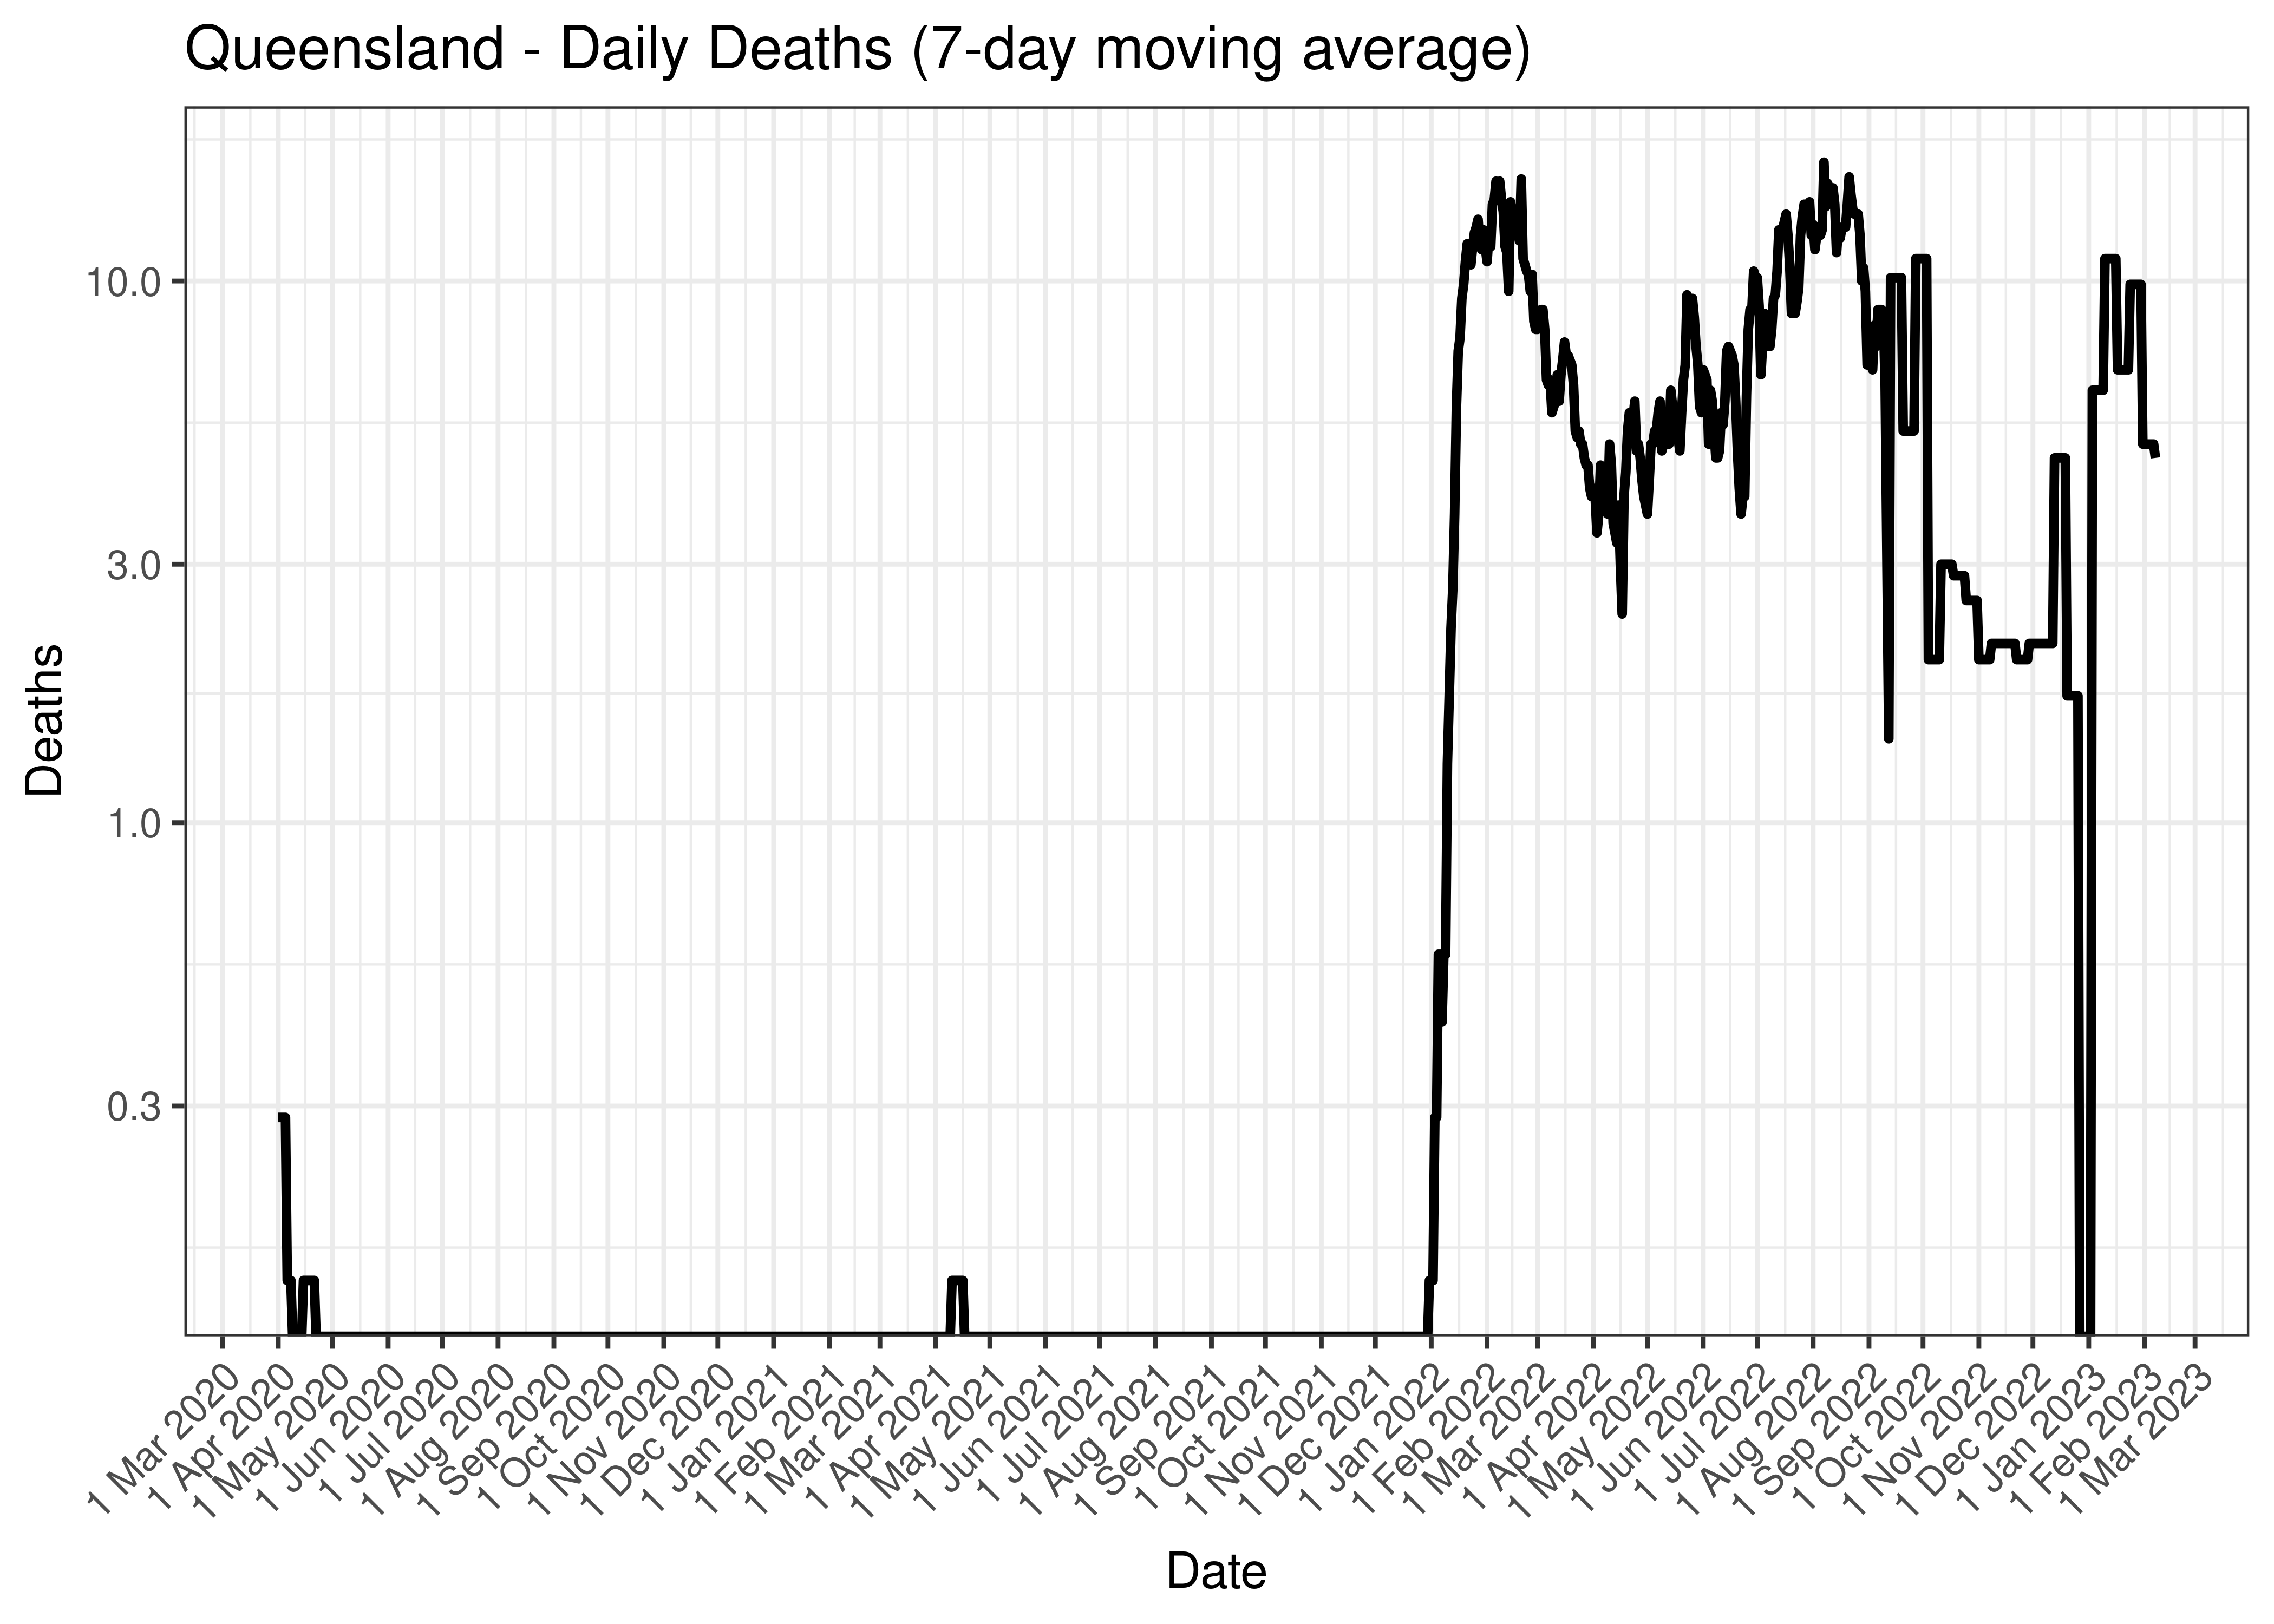
5.5.6 Deaths
Deaths are tabulated by report date below. A centred 7-day moving average is also shown. The peak daily deaths in previous waves (as measured by the moving average) is also shown.
| Date | Deaths | 7-day Moving Average | Comment |
|---|---|---|---|
| 2022-08-07 | 0 | 17 | Wave 4 Peak (to date) |
| 2023-02-03 | 35 | 5 | |
| 2023-02-04 | 0 | 5 | |
| 2023-02-05 | 0 | 5 | |
| 2023-02-06 | 0 | 5 | |
| 2023-02-07 | 0 | 5 | |
| 2023-02-08 | 0 | NA | |
| 2023-02-09 | 0 | NA | |
| 2023-02-10 | 33 | NA |
The above are based on the following dates:
- Wave 1 started on 2020-01-01.
- Wave 2 started on 2020-06-01.
- Wave 3 started on 2021-06-01.
- Wave 4 started on 2021-12-01.
Below a 7-day moving average of daily deaths is plotted by on a log scale since start of the epidemic.
Queensland - Daily Deaths (7-day moving average)
Below the above chart is repeated for the last 30-days:
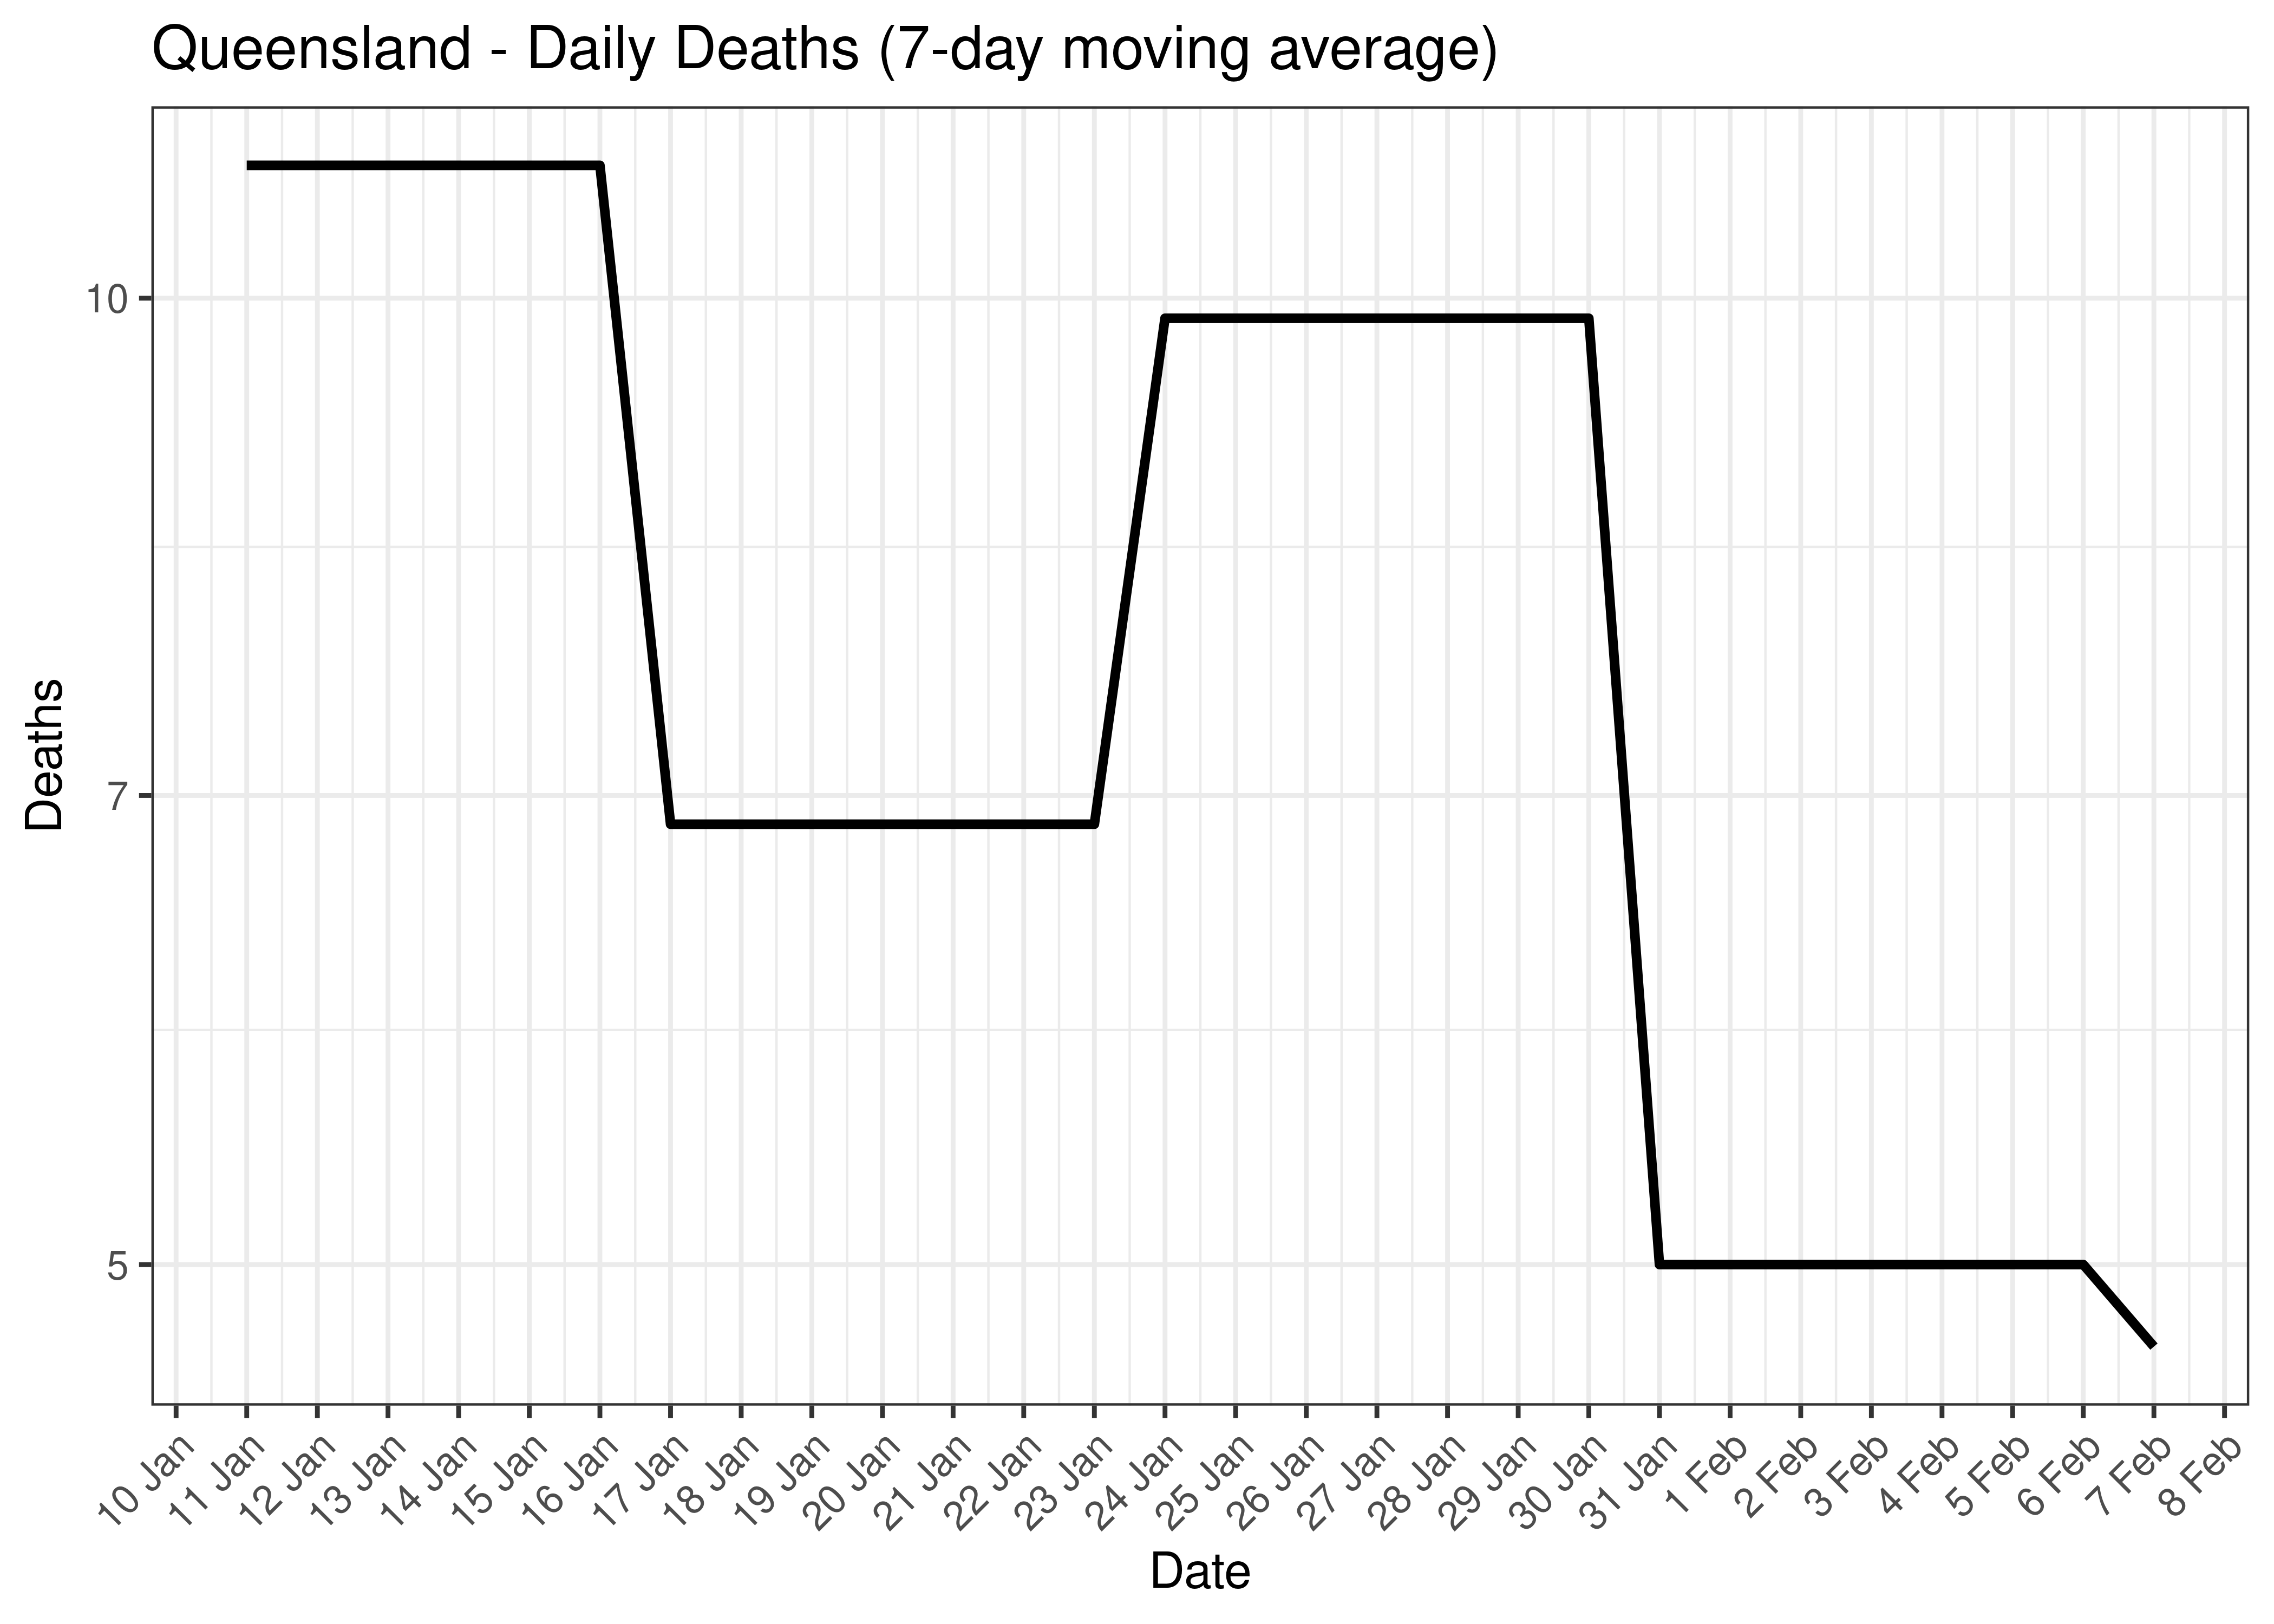
Queensland - Daily Deaths for Last 30-days (7-day moving average)
5.5.7 Cases, Hospital Counts and Deaths Combined
Below a 7-day moving average daily case, hospital counts and deaths are plotted by state on a log scale since start of the epidemic. Note admissions and excess deaths are plotted by date, whereas cases are plotted by specimen received date.
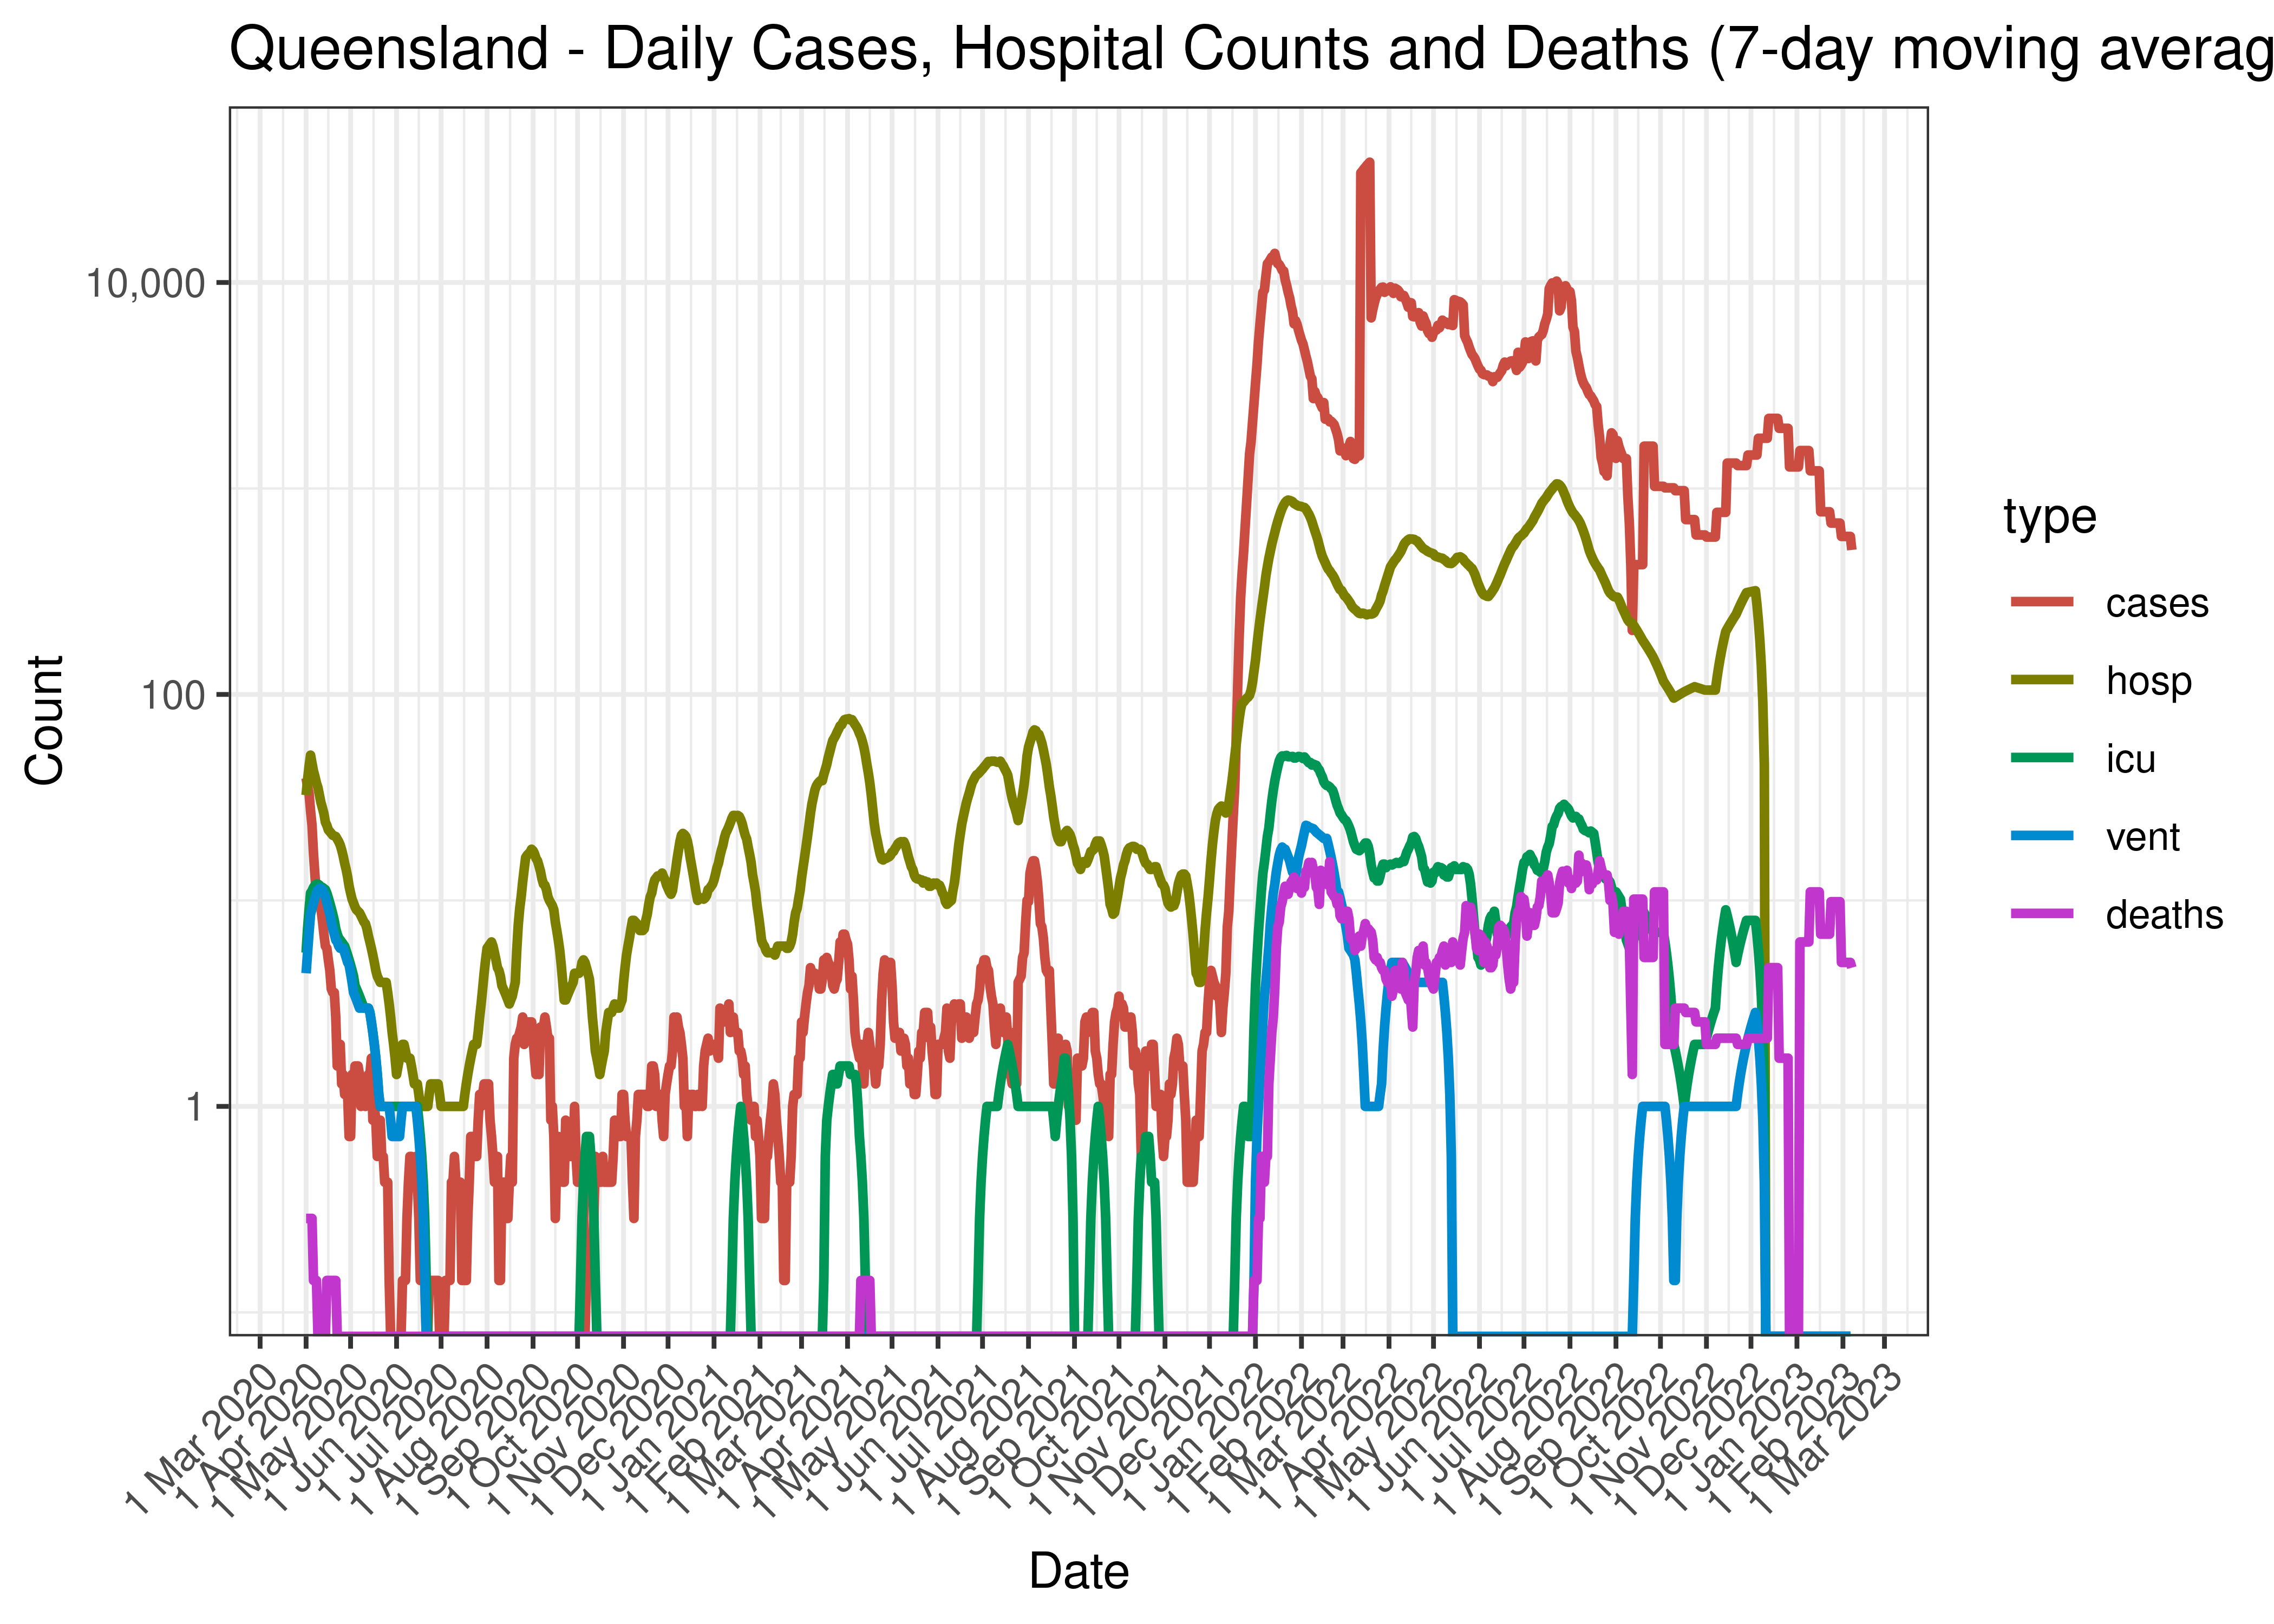
Queensland - Daily Cases, Hospital Counts and Deaths (7-day moving average)
Below the above chart is repeated for the last 30-days:
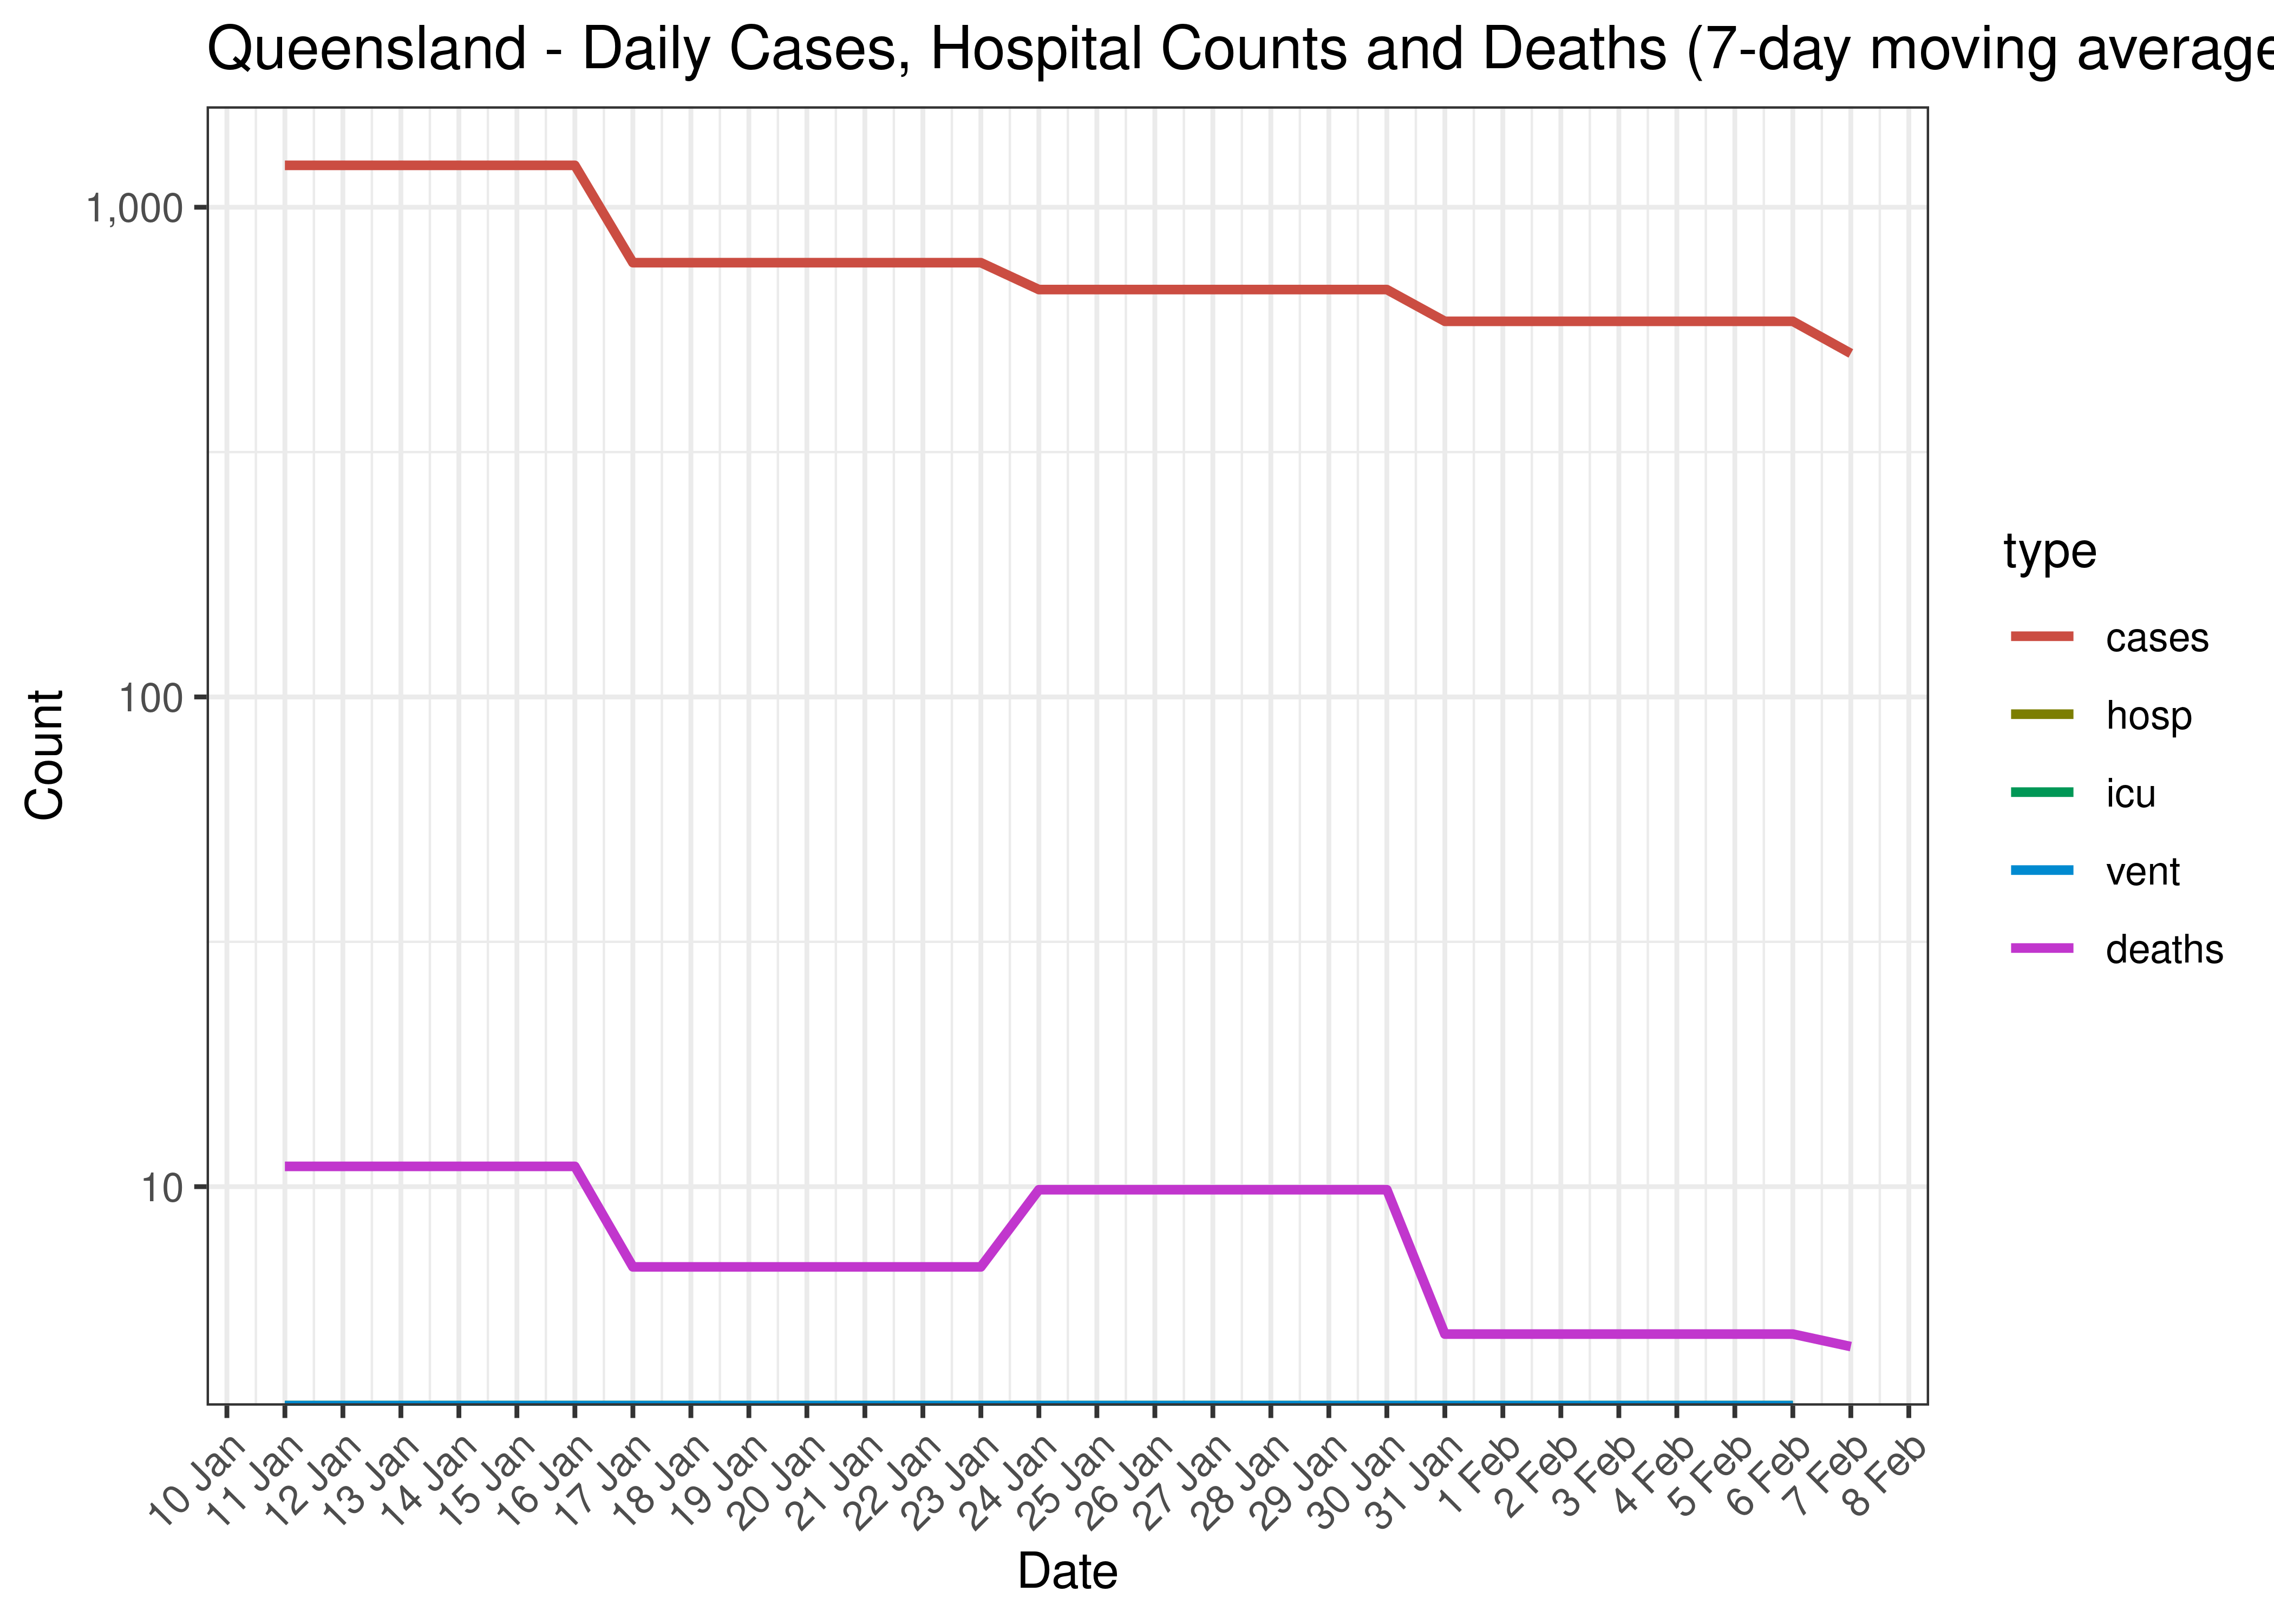
Queensland - Daily Cases, Admissions and Deaths for Last 30-days (7-day moving average)
5.5.8 Crude Ratios per Wave
Below crude rations are calculated between the waves. It’s based on the following starting dates:
- Wave 1 started on 2020-01-01.
- Wave 2 started on 2020-06-01.
- Wave 3 started on 2021-06-01.
- Wave 4 started on 2021-12-01.
Below crude ratios are tabulated and plotted. These ratios are:
- ICU ratio calculated as person days in ICU divided by person days in hospital.
- Ventilator ratio calculated as person days on ventilators divided by person days in hospital.
- Death ratio calculated as deaths divided by person days in hospital.
- Case fatality ratio is calcualted as deaths divided by cases.
| Wave | ICU Ratio | Ventilator Ratio | Death Ratio | Case Fatality Ratio | |
|---|---|---|---|---|---|
| Queensland | Wave 1 | 33.4% | 30.0% | 0.6% | 0.57% |
| Queensland | Wave 2 | 1.2% | 0.3% | 0.0% | 0.18% |
| Queensland | Wave 3 | 1.9% | 0.0% | 0.0% | 0.00% |
| Queensland | Wave 4 | 3.9% | 0.8% | 1.7% | 0.14% |
5.5.9 Reproduction Number
Below current (last weekly) effective reproduction number estimates are tabulated for Australia and by state.
| Type | Count (Per Day) | Week Ending | Reproduction Number [95% Confidence Interval] | |
|---|---|---|---|---|
| Queensland | cases | 503 | 2023-02-10 | 0.84 [0.81 - 0.87] |
Below the effective reproduction number for Australia over the last 90 days are plotted together with a plot since start of the pandemic.
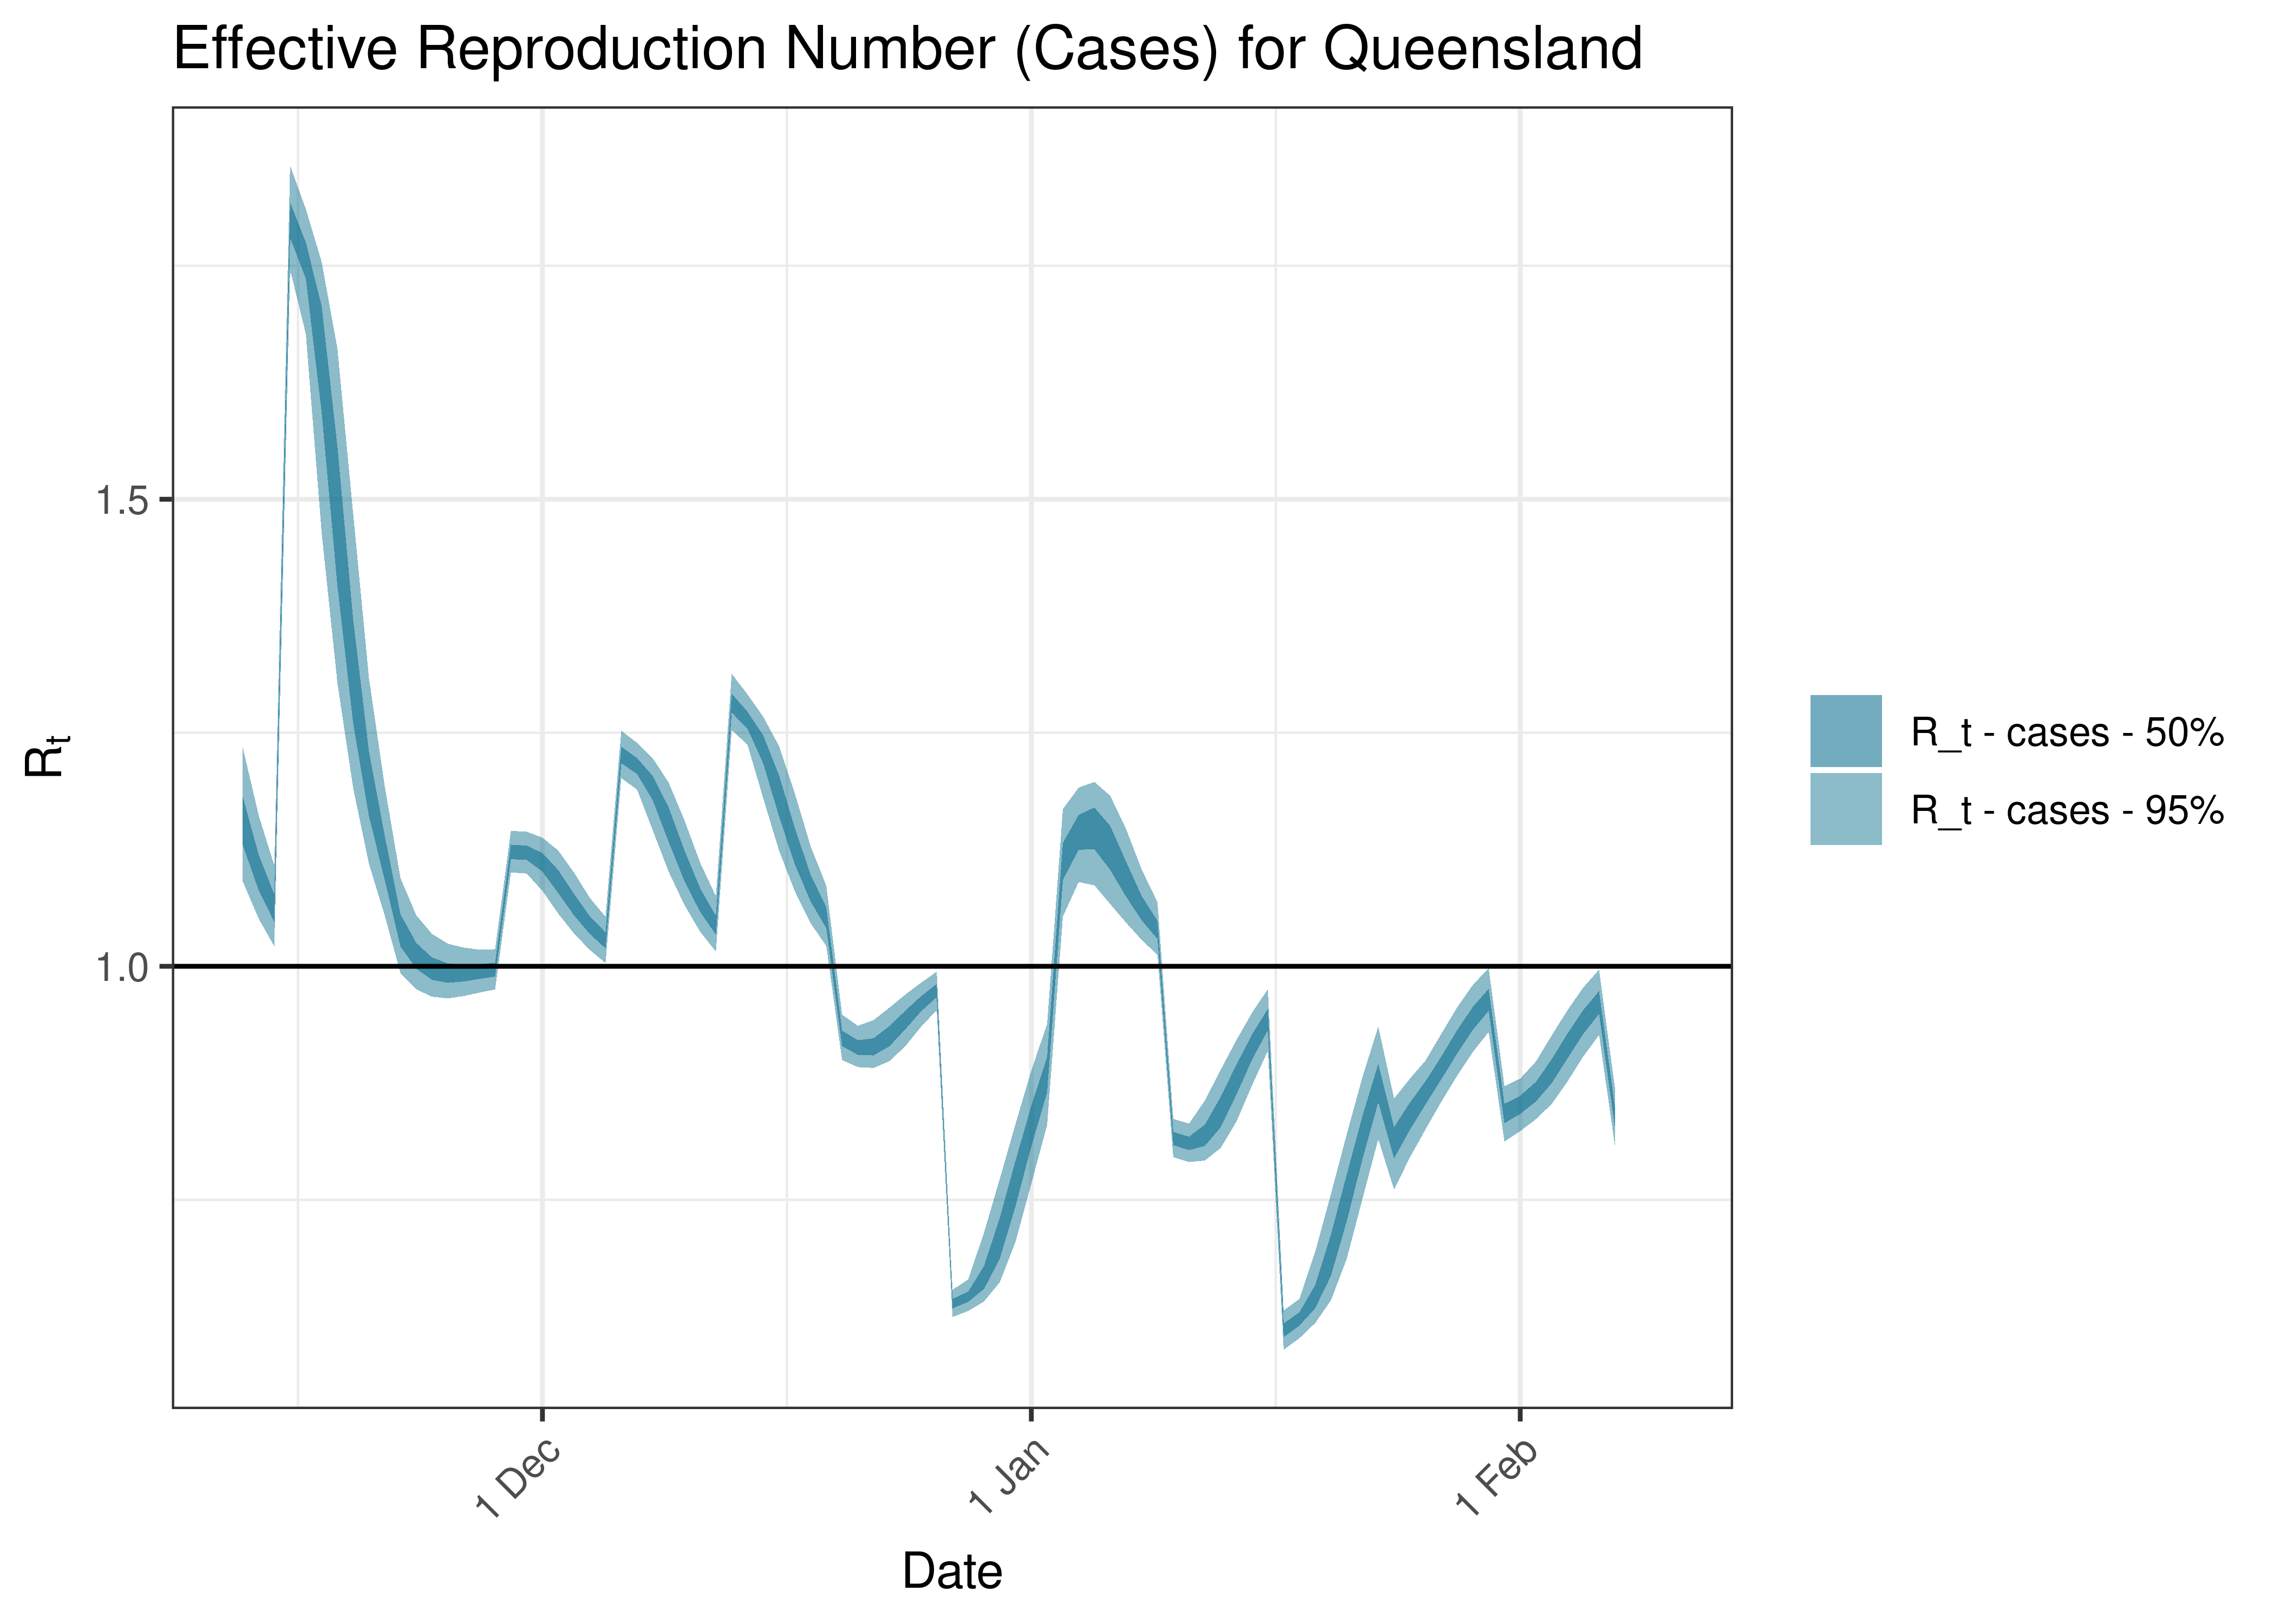
Estimated Effective Reproduction Number Based on Cases for Queensland over last 90 days
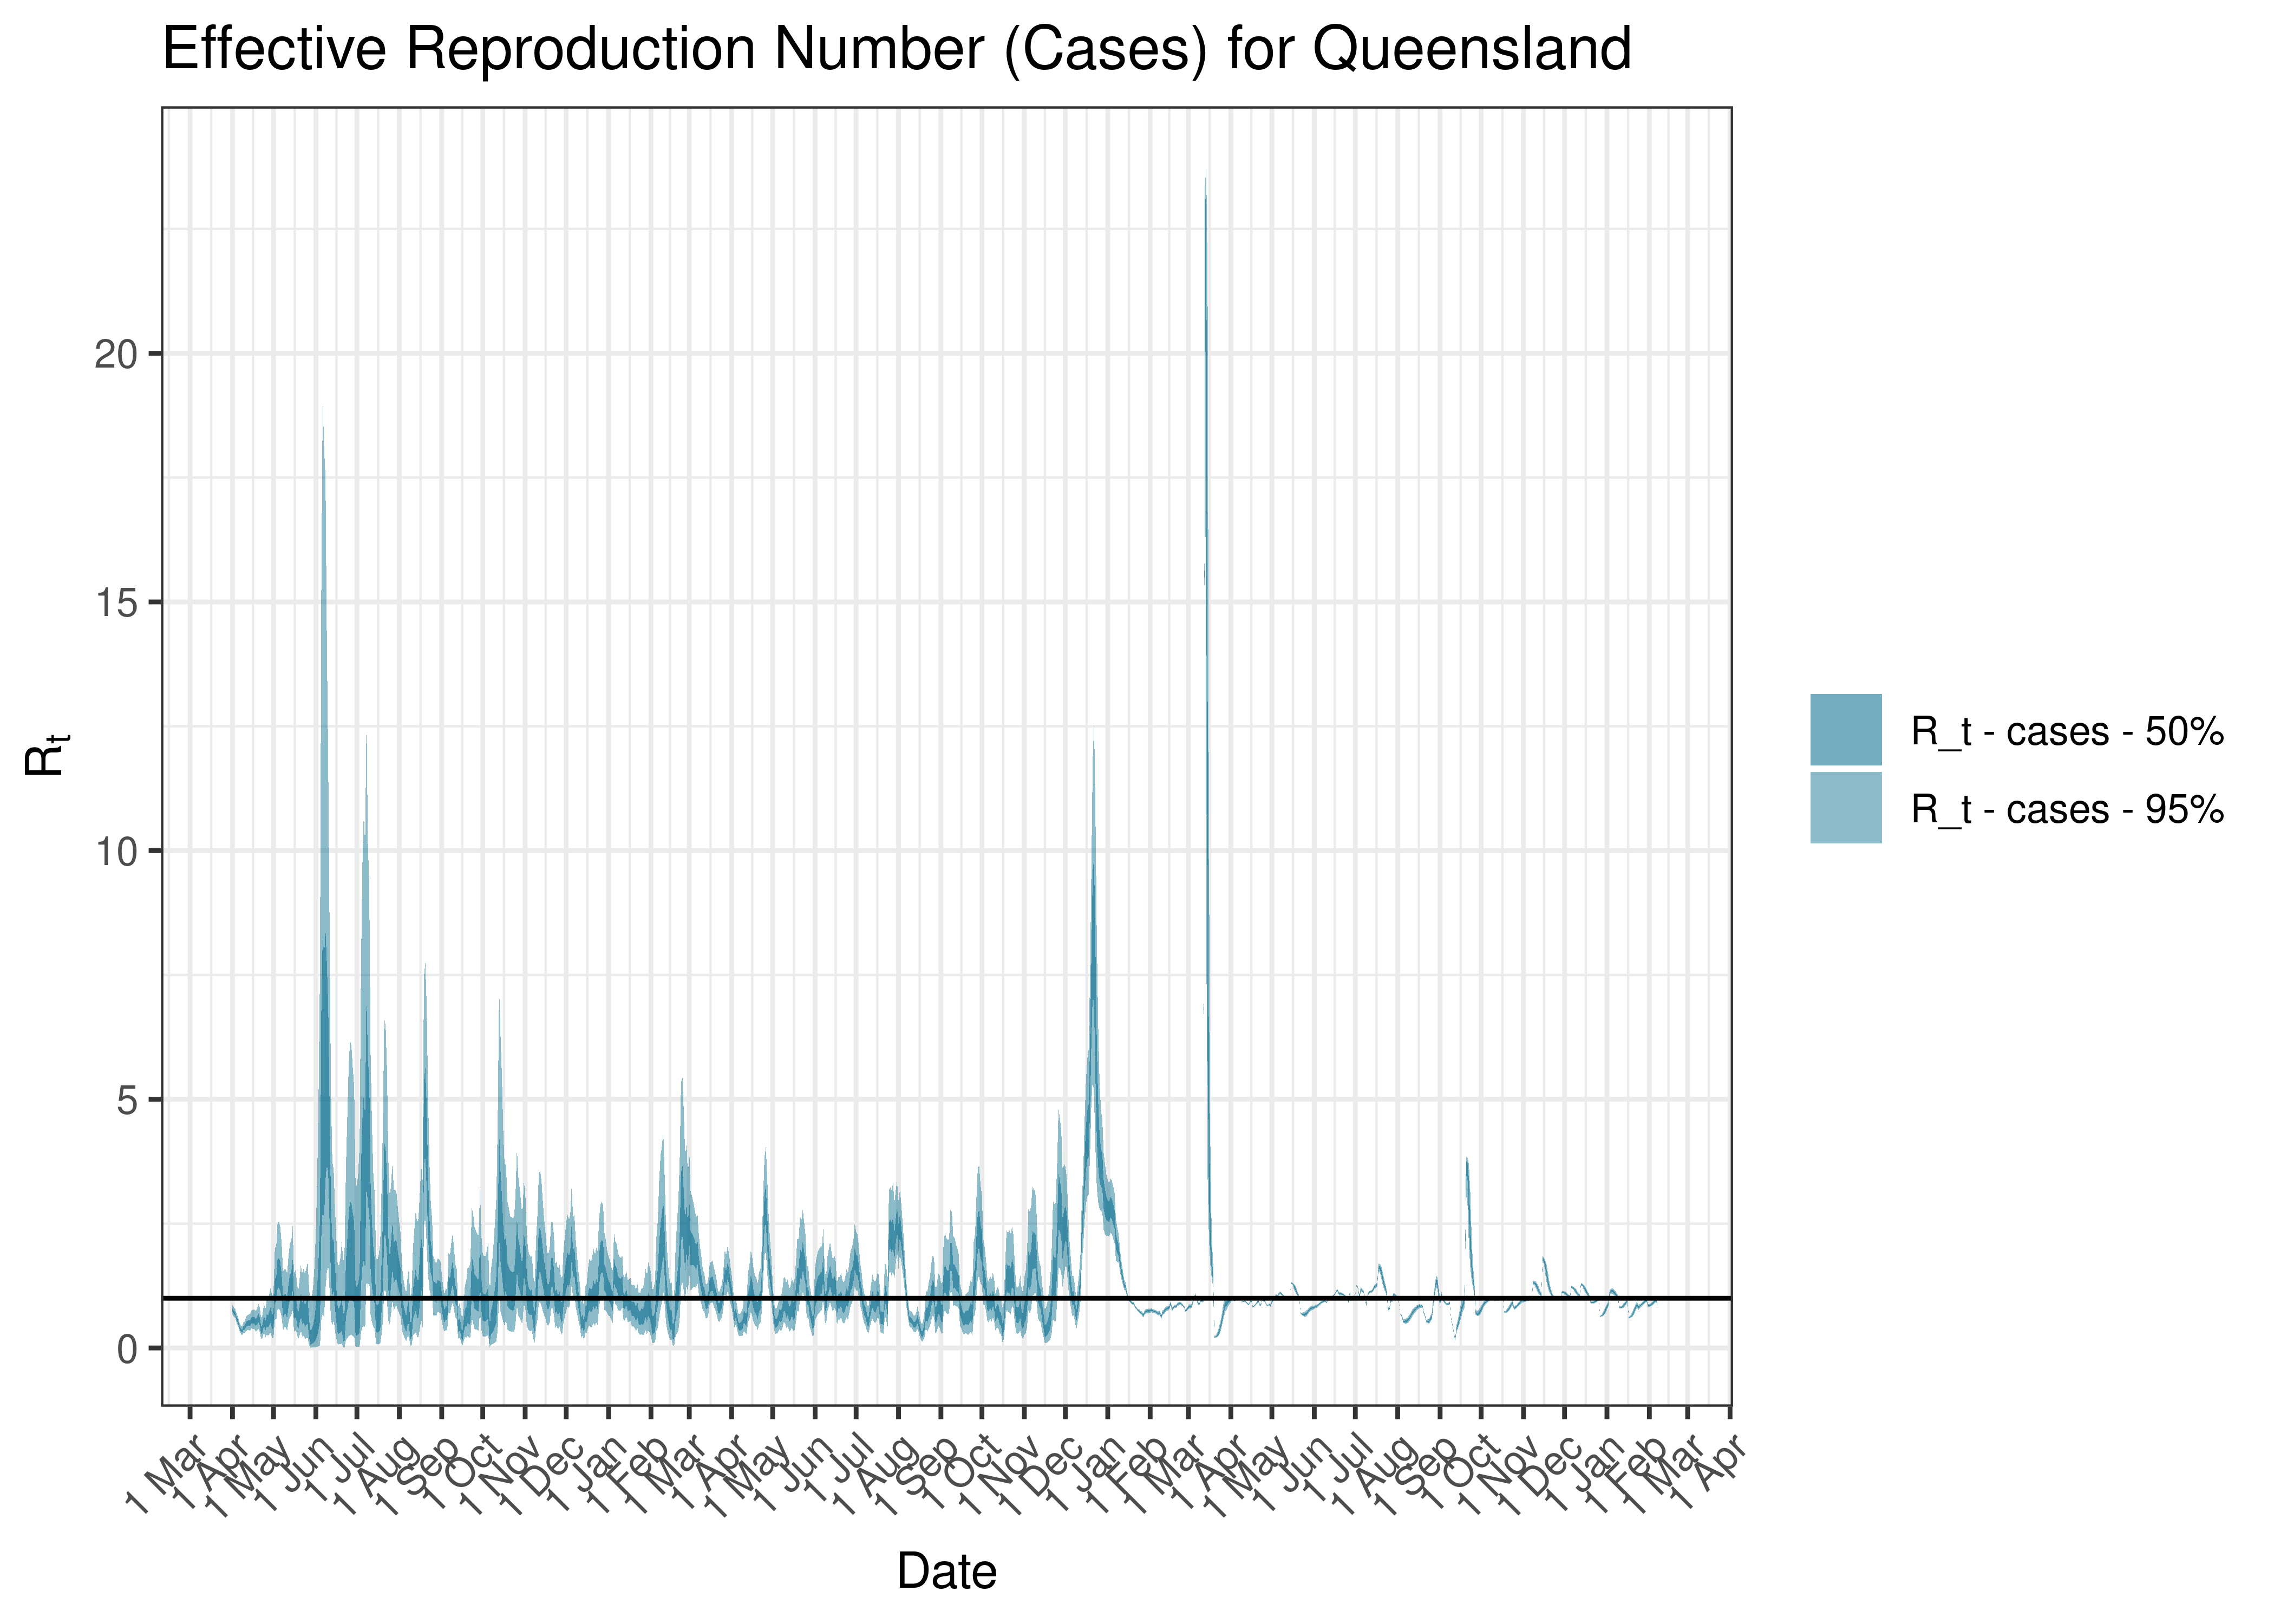
Estimated Effective Reproduction Number Based on Cases for Queensland since 1 April 2020
5.6 South Australia
5.6.1 Tests
Below raw numbers of test by date are plotted on a 7-day moving average from 1 April 2020.
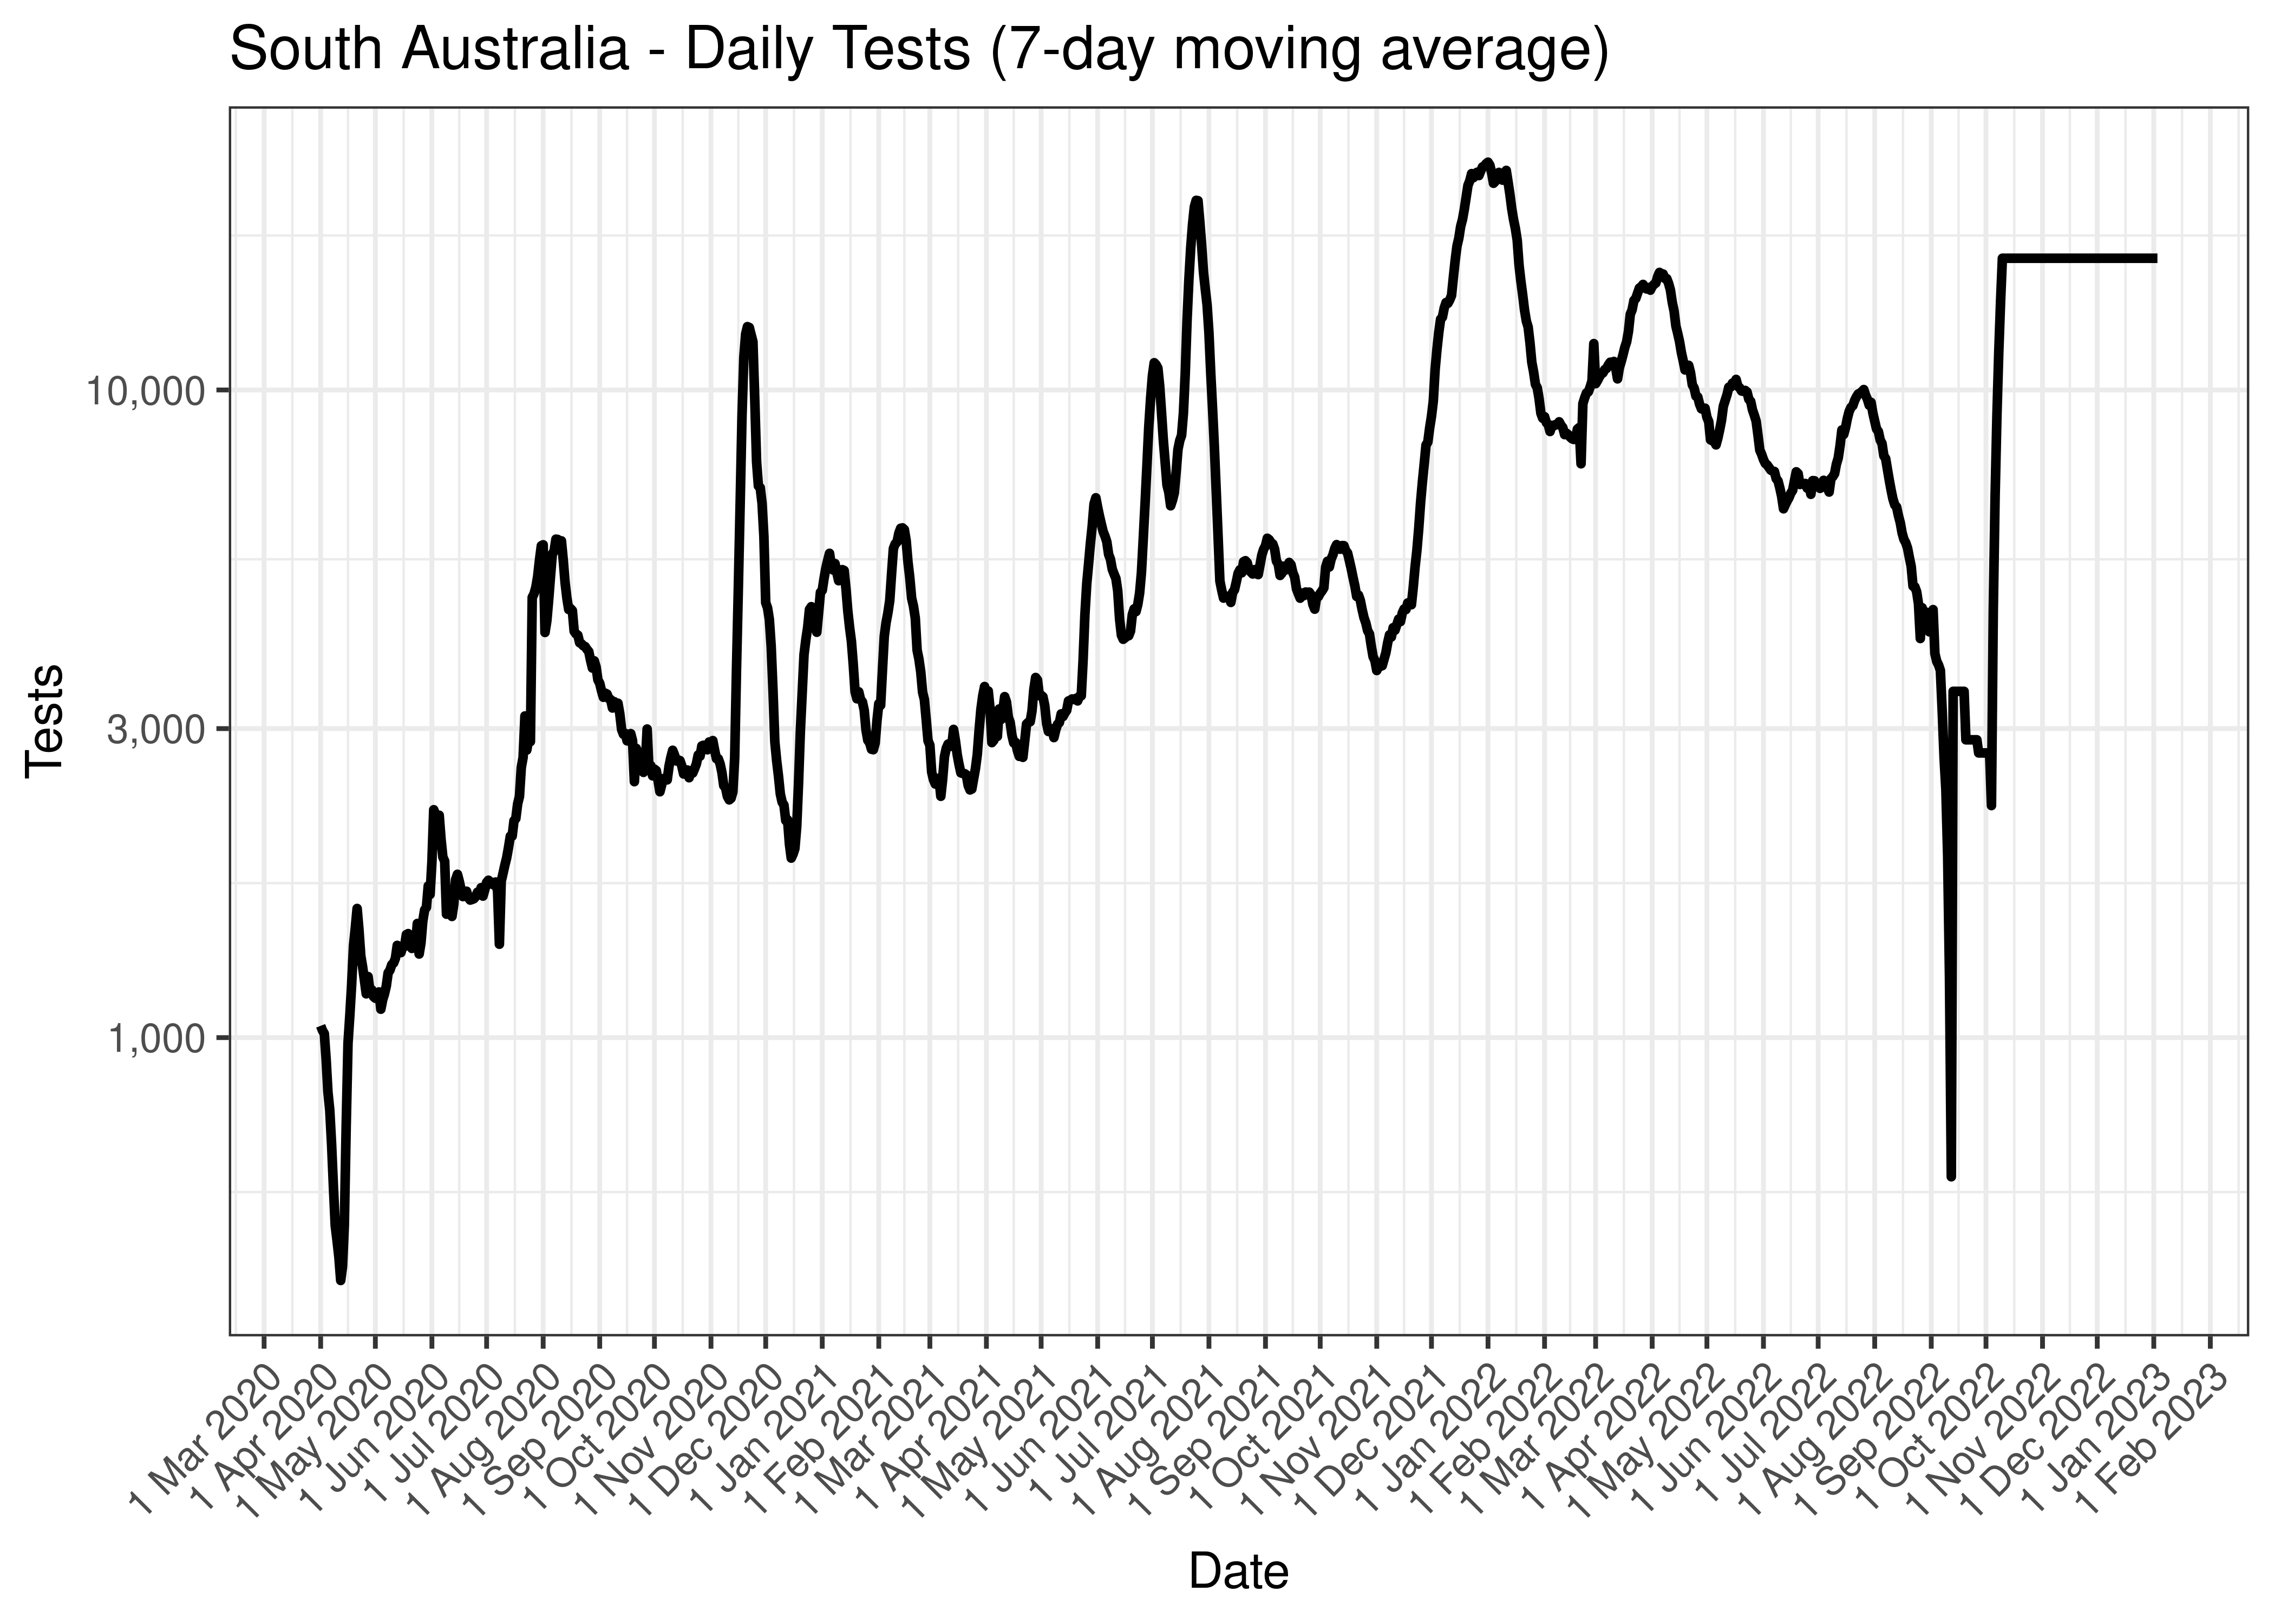
South Australia - Daily Tests (7-day moving average)
The above chart is repeated below covering the last 30 days only.
South Australia - Daily Tests for Last 30 Days (7-day moving average)
5.6.2 Cases
Cases are tabulated by specimen received date below. Cases include estimates for late reporting in recent days as well as adjustments for any public holidays. A centred 7-day moving average is also shown. The peak daily cases in previous waves (as measured by the moving average) is also shown.
| Date | Cases | 7-day Moving Average | Comment |
|---|---|---|---|
| 2020-03-25 | 27 | 31 | Wave 1 Peak |
| 2022-04-08 | 6,370 | 6,029 | Wave 4 Peak (to date) |
| 2023-02-03 | 1,357 | 194 | |
| 2023-02-04 | 0 | 194 | |
| 2023-02-05 | 0 | 194 | |
| 2023-02-06 | 0 | 194 | |
| 2023-02-07 | 0 | 223 | |
| 2023-02-08 | 0 | NA | |
| 2023-02-09 | 0 | NA | |
| 2023-02-10 | 1,558 | NA |
Below a 7-day moving average daily case count is plotted for South Australia on a log scale since start of the epidemic:
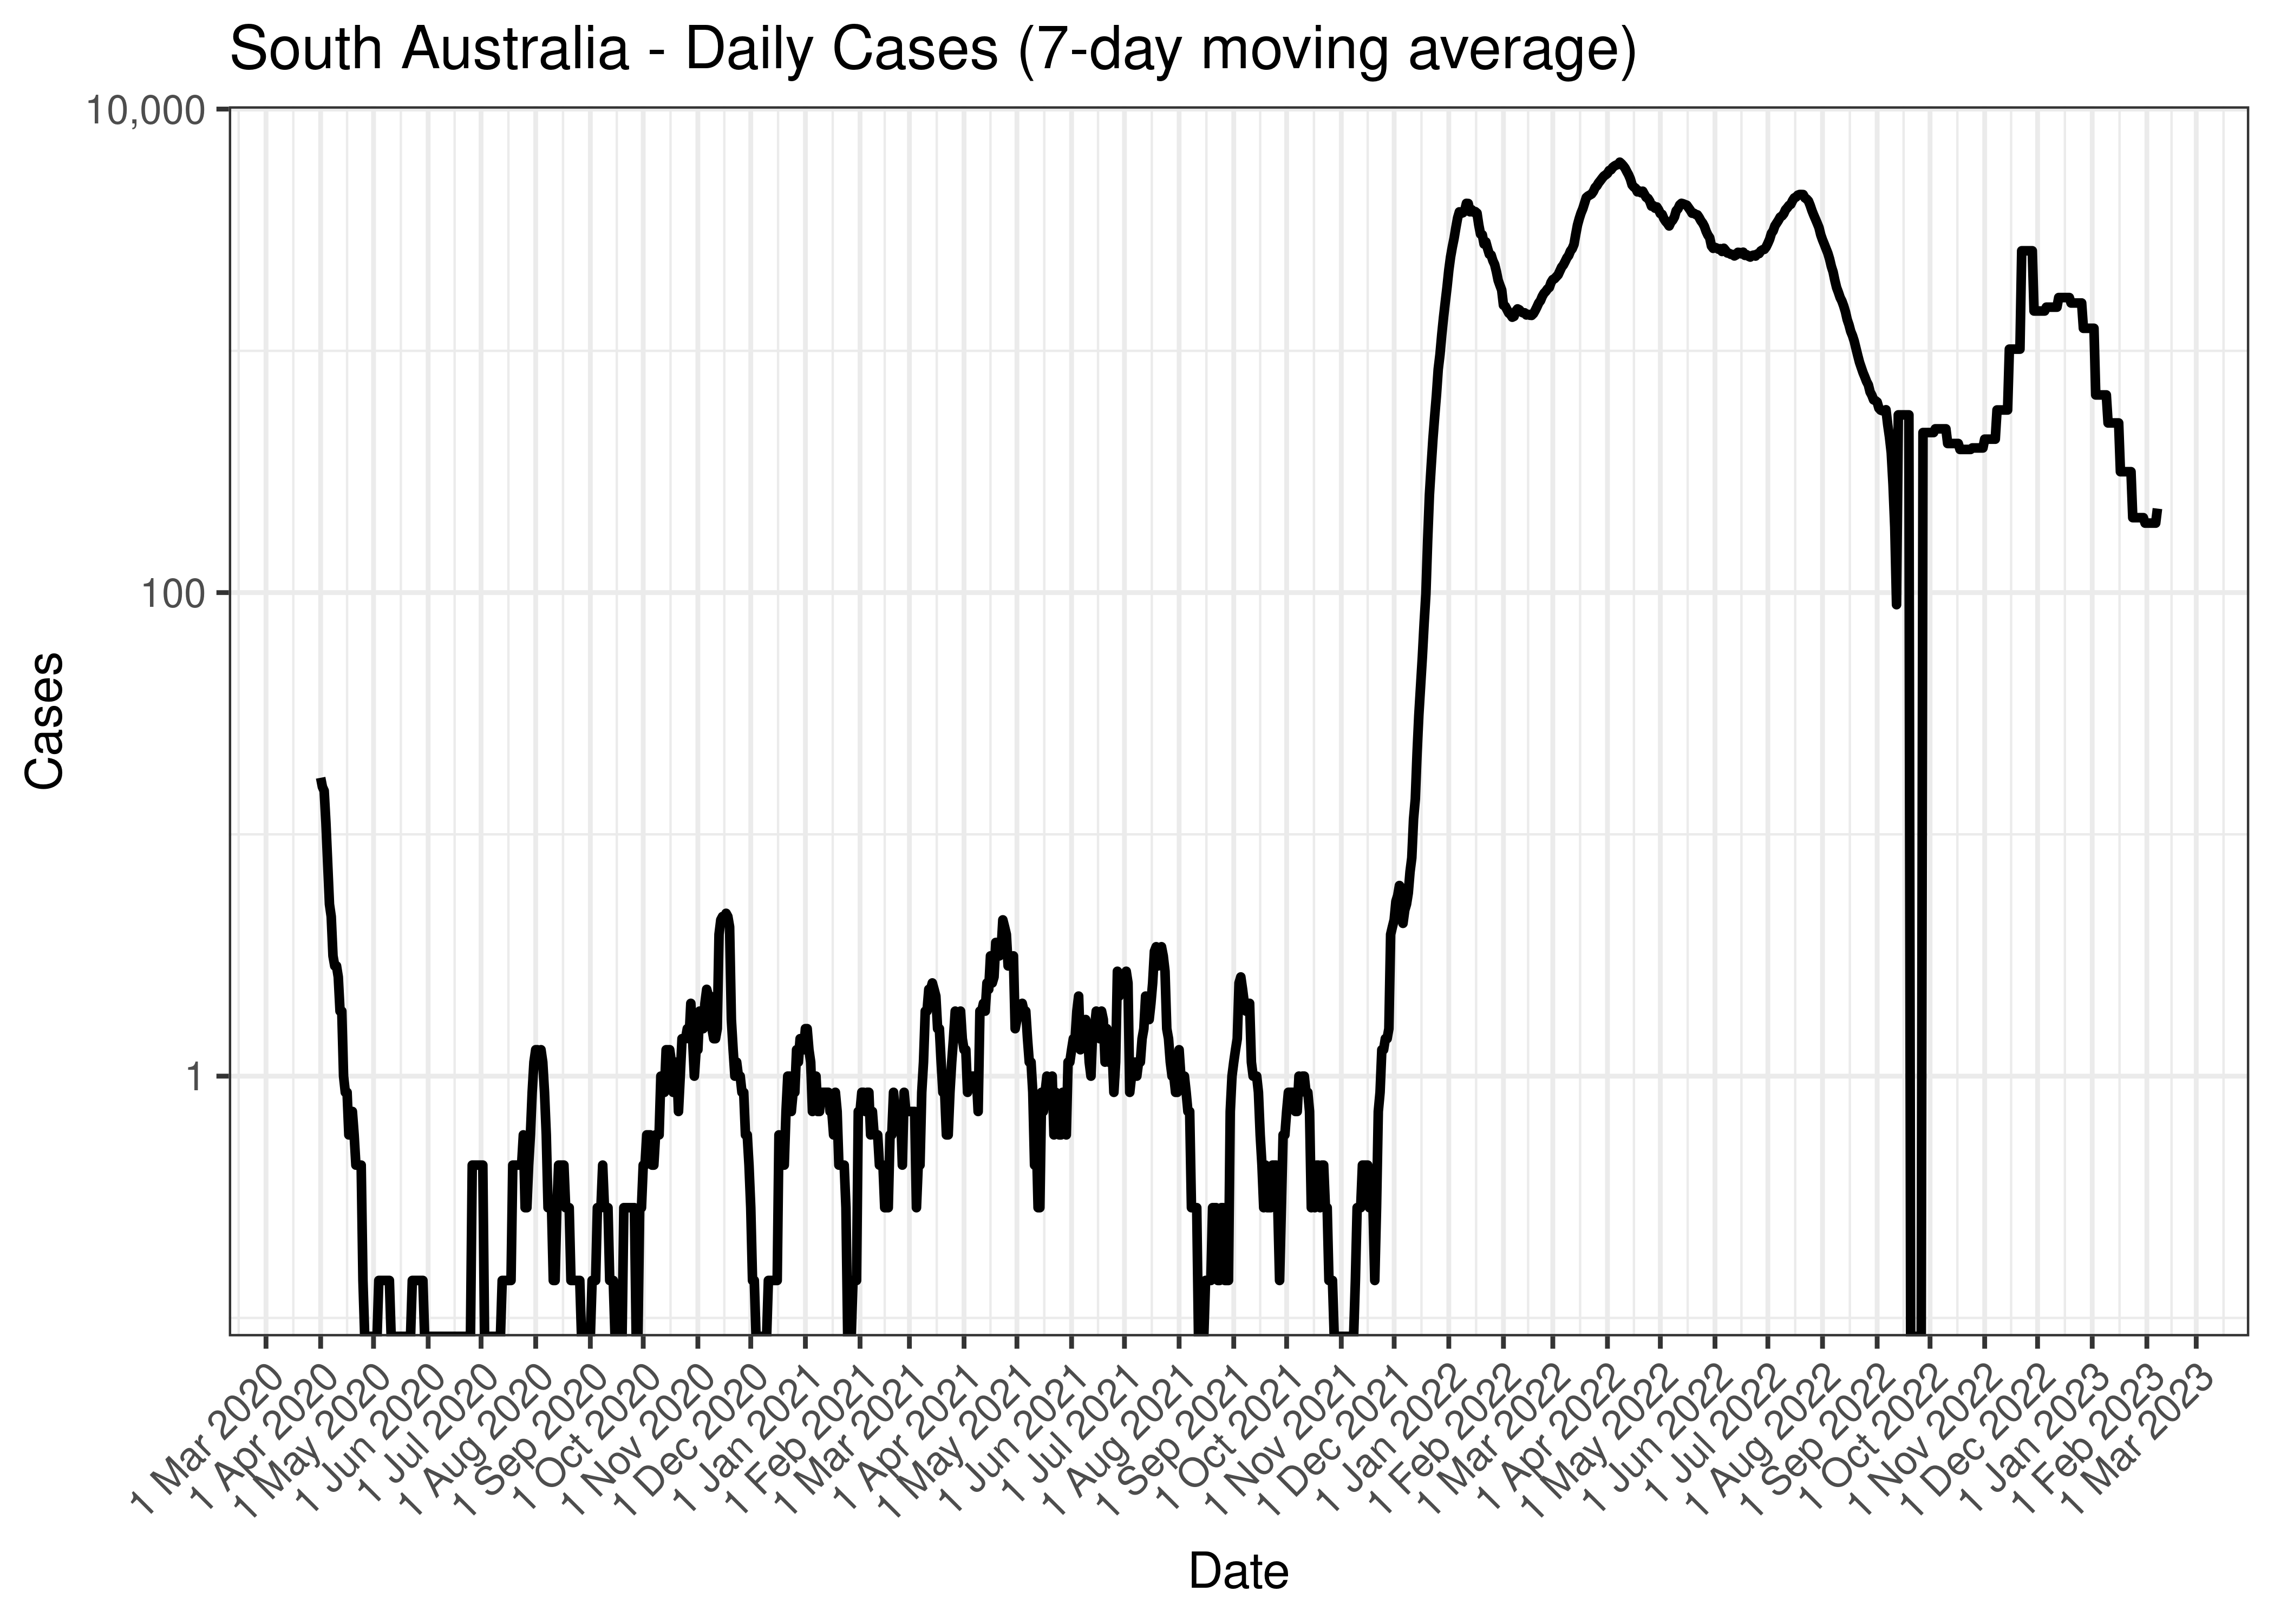
South Australia - Daily Cases (7-day moving average)
Below the above chart is repeated for the last 30-days:
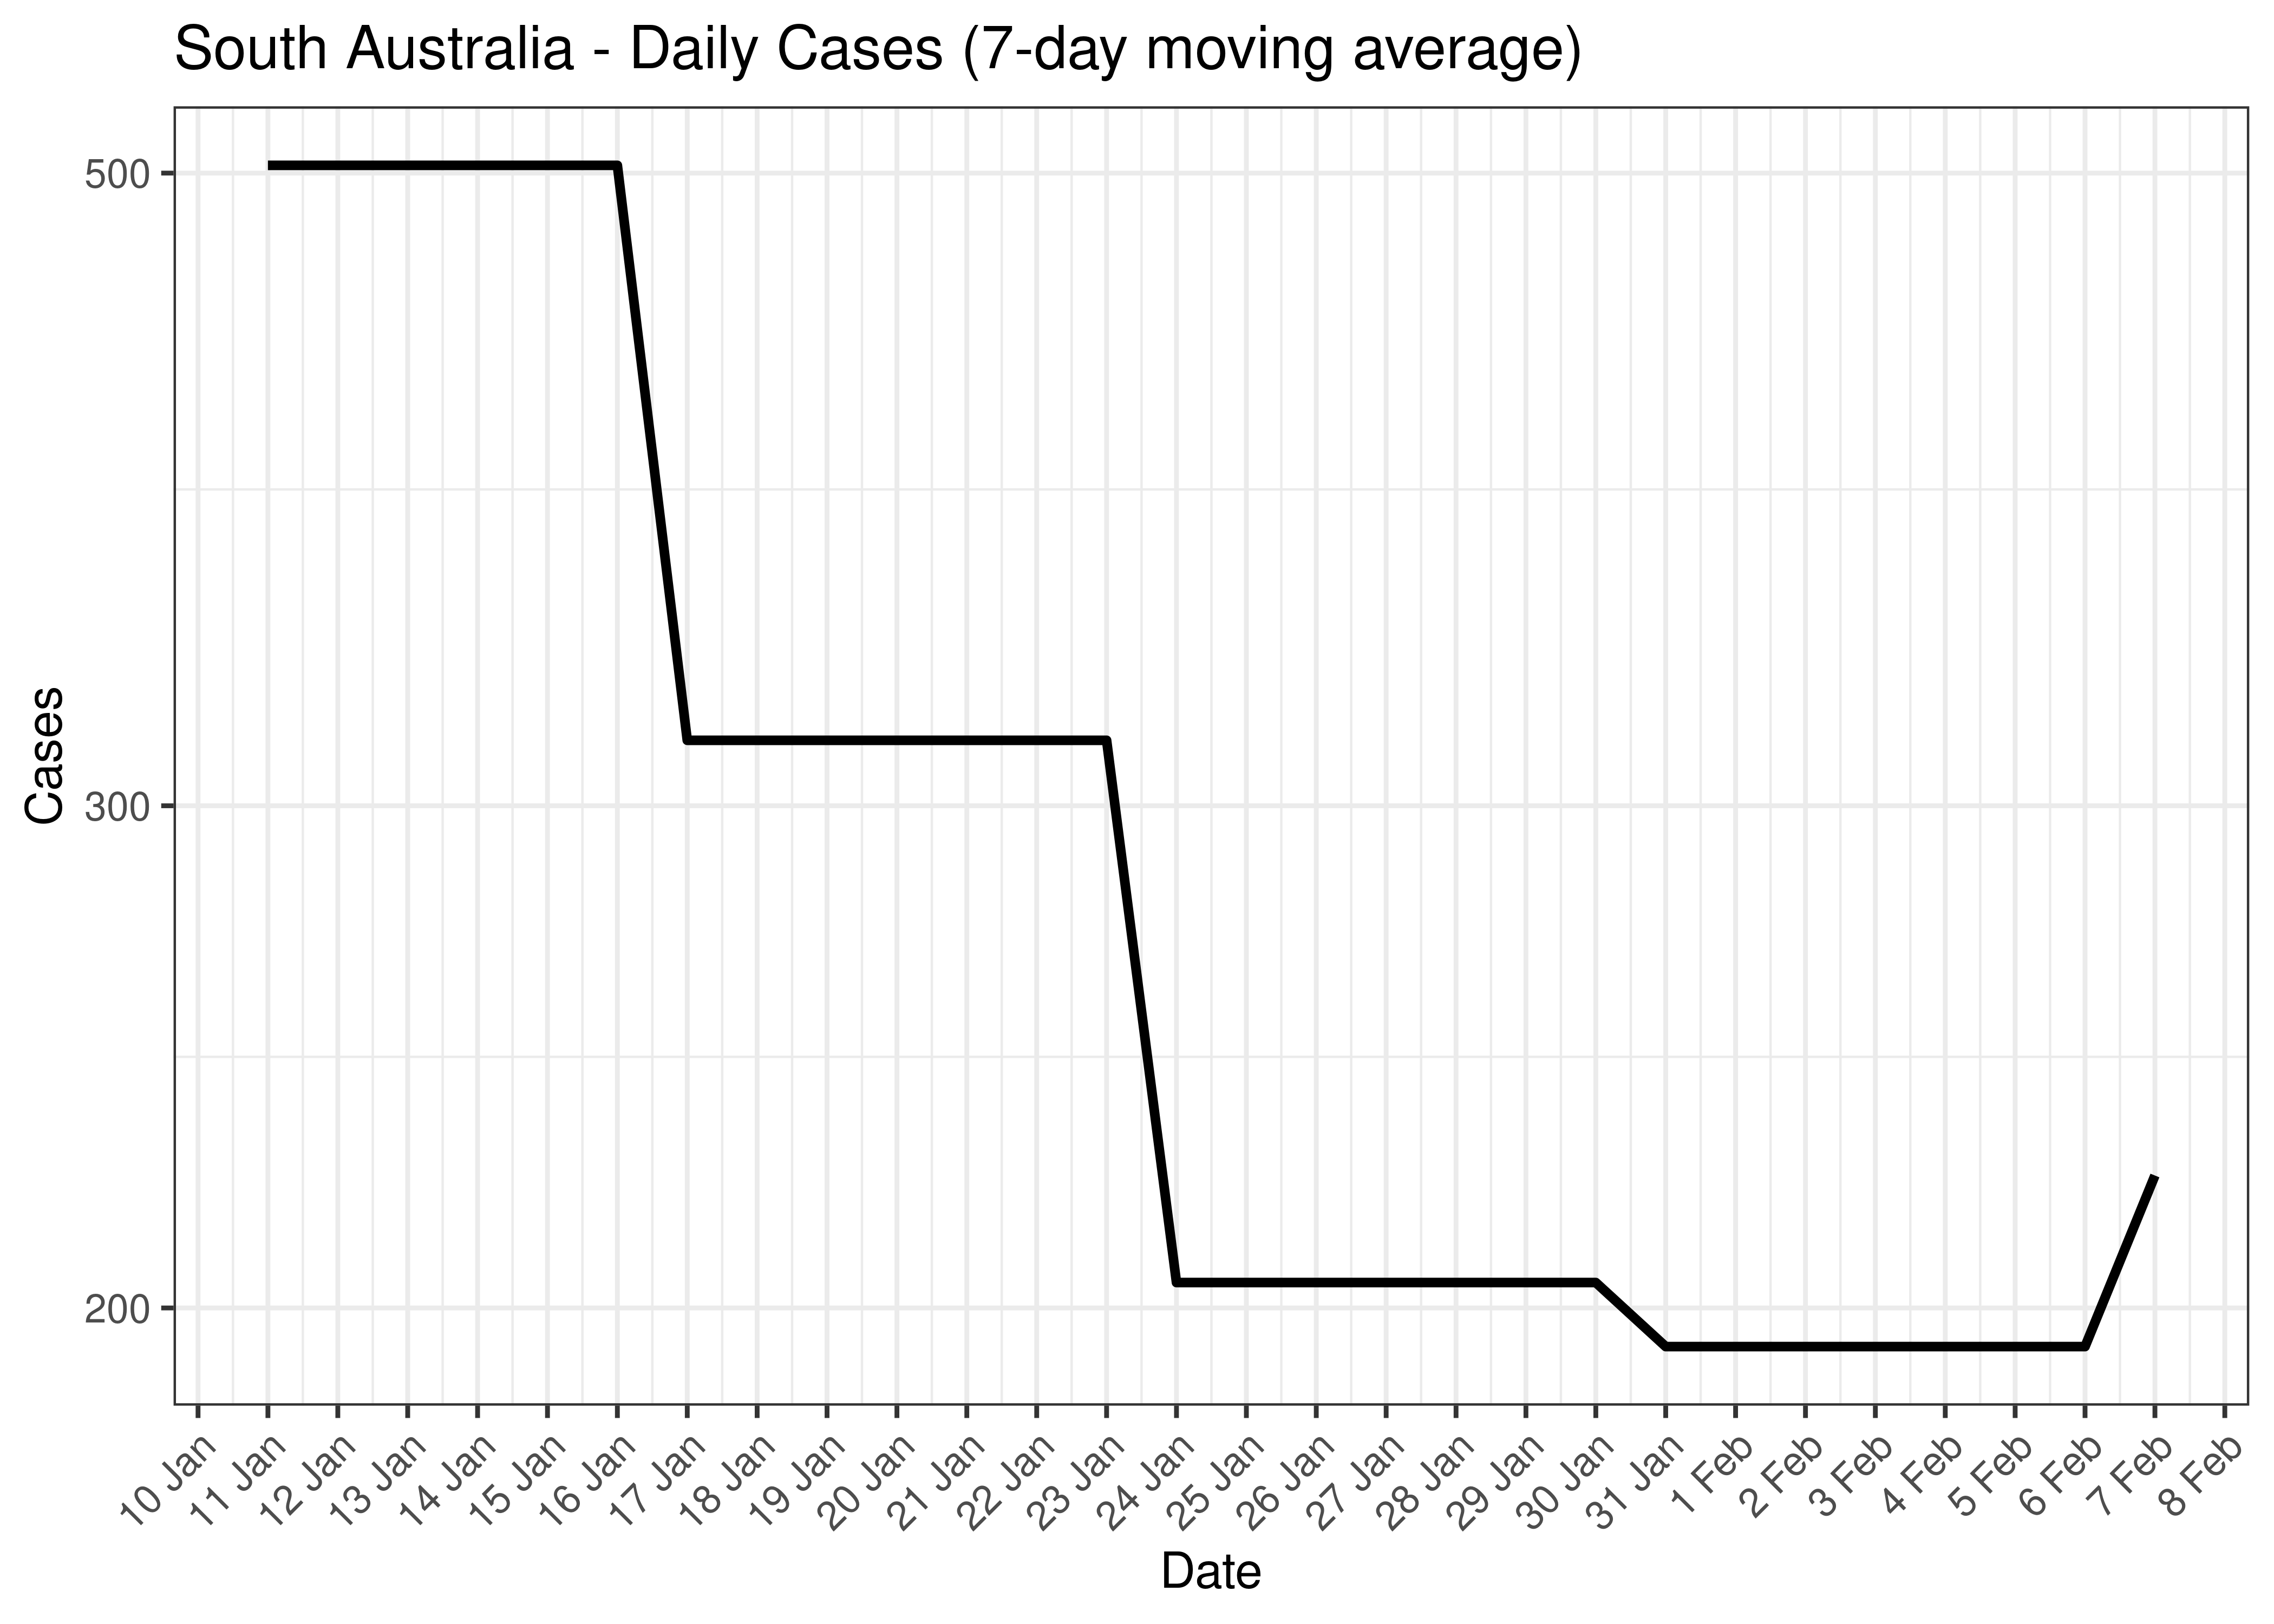
South Australia - Daily Cases for Last 30-days (7-day moving average)
5.6.3 Hospitlisation
Counts of those in hospital are tabulated by report date below. A centred 7-day moving average is also shown. The peak daily admissions in previous waves (as measured by the moving average) is also shown.
| Date | In Hospital | 7-day Moving Average | Comment |
|---|---|---|---|
| 2020-04-04 | 19 | 19 | Wave 1 Peak |
| 2022-07-24 | 374 | 367 | Wave 4 Peak (to date) |
| 2023-02-03 | 0 | 0 | |
| 2023-02-04 | 0 | 0 | |
| 2023-02-05 | 0 | 0 | |
| 2023-02-06 | 0 | 0 | |
| 2023-02-07 | 0 | NA | |
| 2023-02-08 | 0 | NA | |
| 2023-02-09 | 0 | NA | |
| 2023-02-10 | NA | NA |
The above are based on the following dates:
- Wave 1 started on 2020-01-01.
- Wave 2 started on 2020-06-01.
- Wave 3 started on 2021-06-01.
- Wave 4 started on 2021-12-01.
Below a 7-day moving average of daily hospital counts is plotted by on a log scale since start of the epidemic. Note admissions are plotted by date.
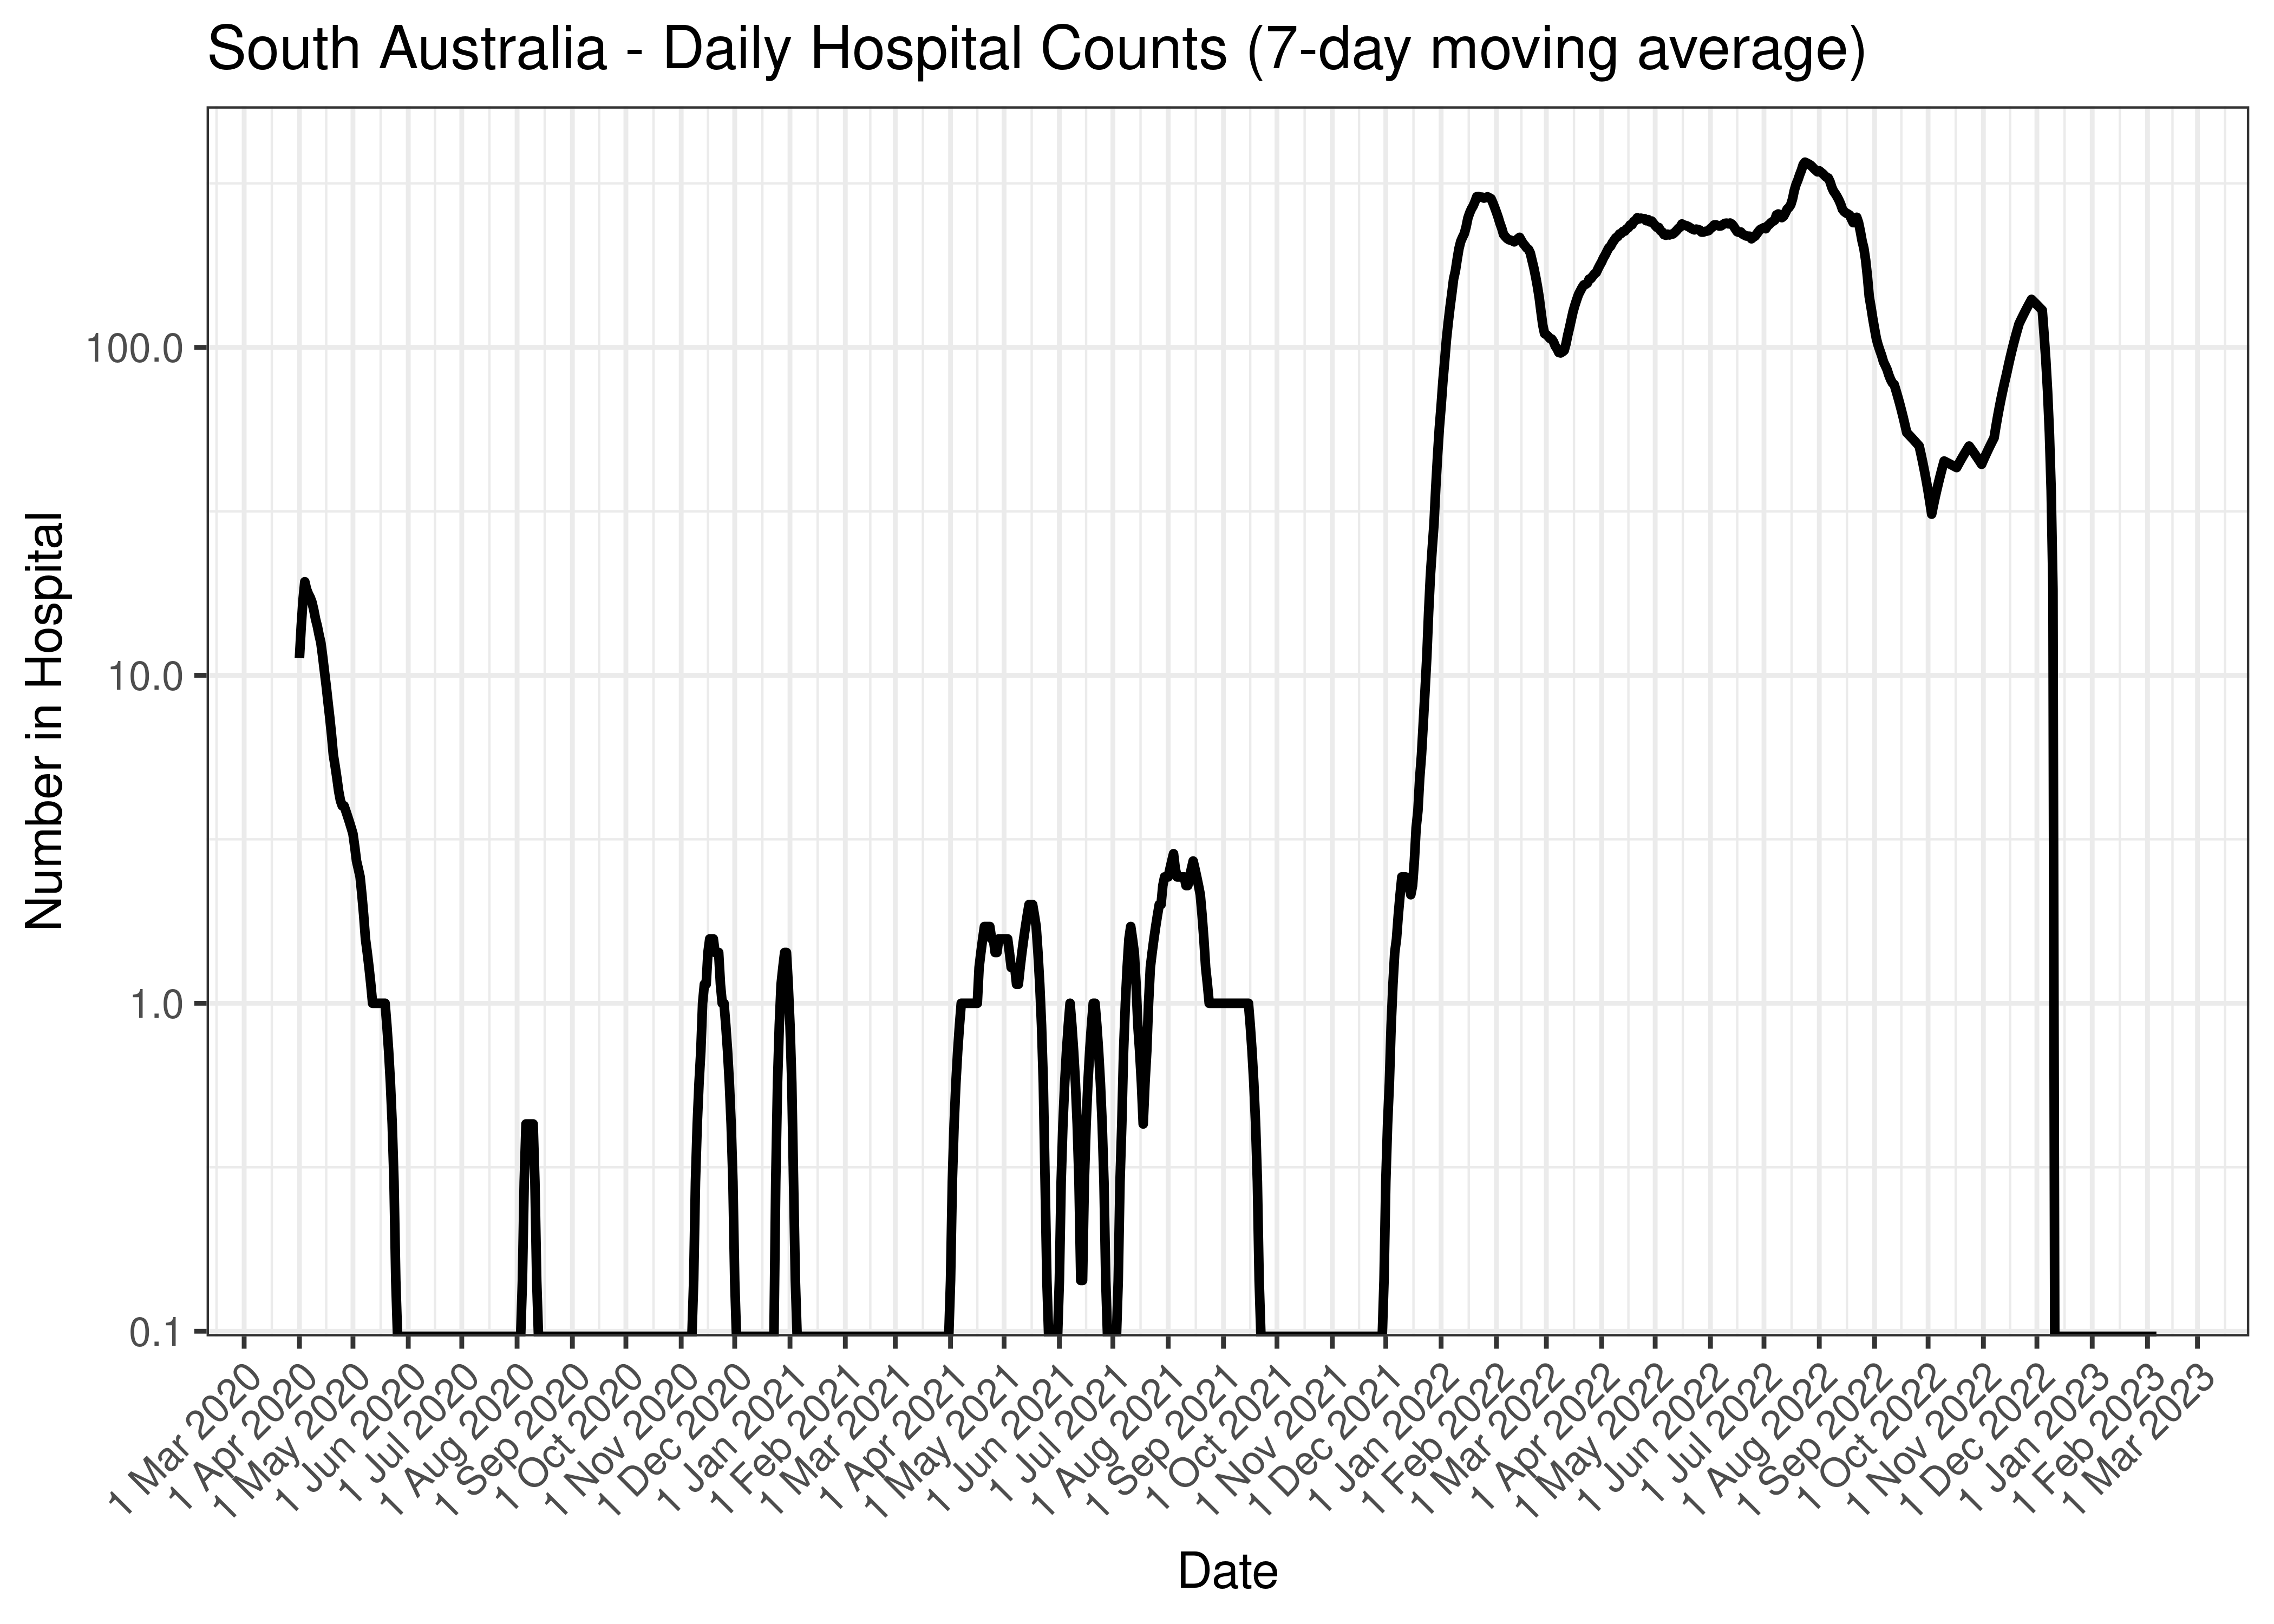
South Australia - Daily Hospital Counts (7-day moving average)
Below the above chart is repeated for the last 30-days:
South Australia - Daily Hospital Counts for Last 30-days (7-day moving average)
5.6.4 ICU
Counts of those in ICU are tabulated by report date below. A centred 7-day moving average is also shown. The peak daily admissions in previous waves (as measured by the moving average) is also shown.
| Date | In ICU | 7-day Moving Average | Comment |
|---|---|---|---|
| 2022-01-23 | 28 | 31 | Wave 4 Peak (to date) |
| 2023-02-03 | 0 | 0 | |
| 2023-02-04 | 0 | 0 | |
| 2023-02-05 | 0 | 0 | |
| 2023-02-06 | 0 | 0 | |
| 2023-02-07 | 0 | NA | |
| 2023-02-08 | 0 | NA | |
| 2023-02-09 | 0 | NA | |
| 2023-02-10 | NA | NA |
The above are based on the following dates:
- Wave 1 started on 2020-01-01.
- Wave 2 started on 2020-06-01.
- Wave 3 started on 2021-06-01.
- Wave 4 started on 2021-12-01.
Below a 7-day moving average of daily ICU counts is plotted by on a log scale since start of the epidemic. Note admissions are plotted by date.
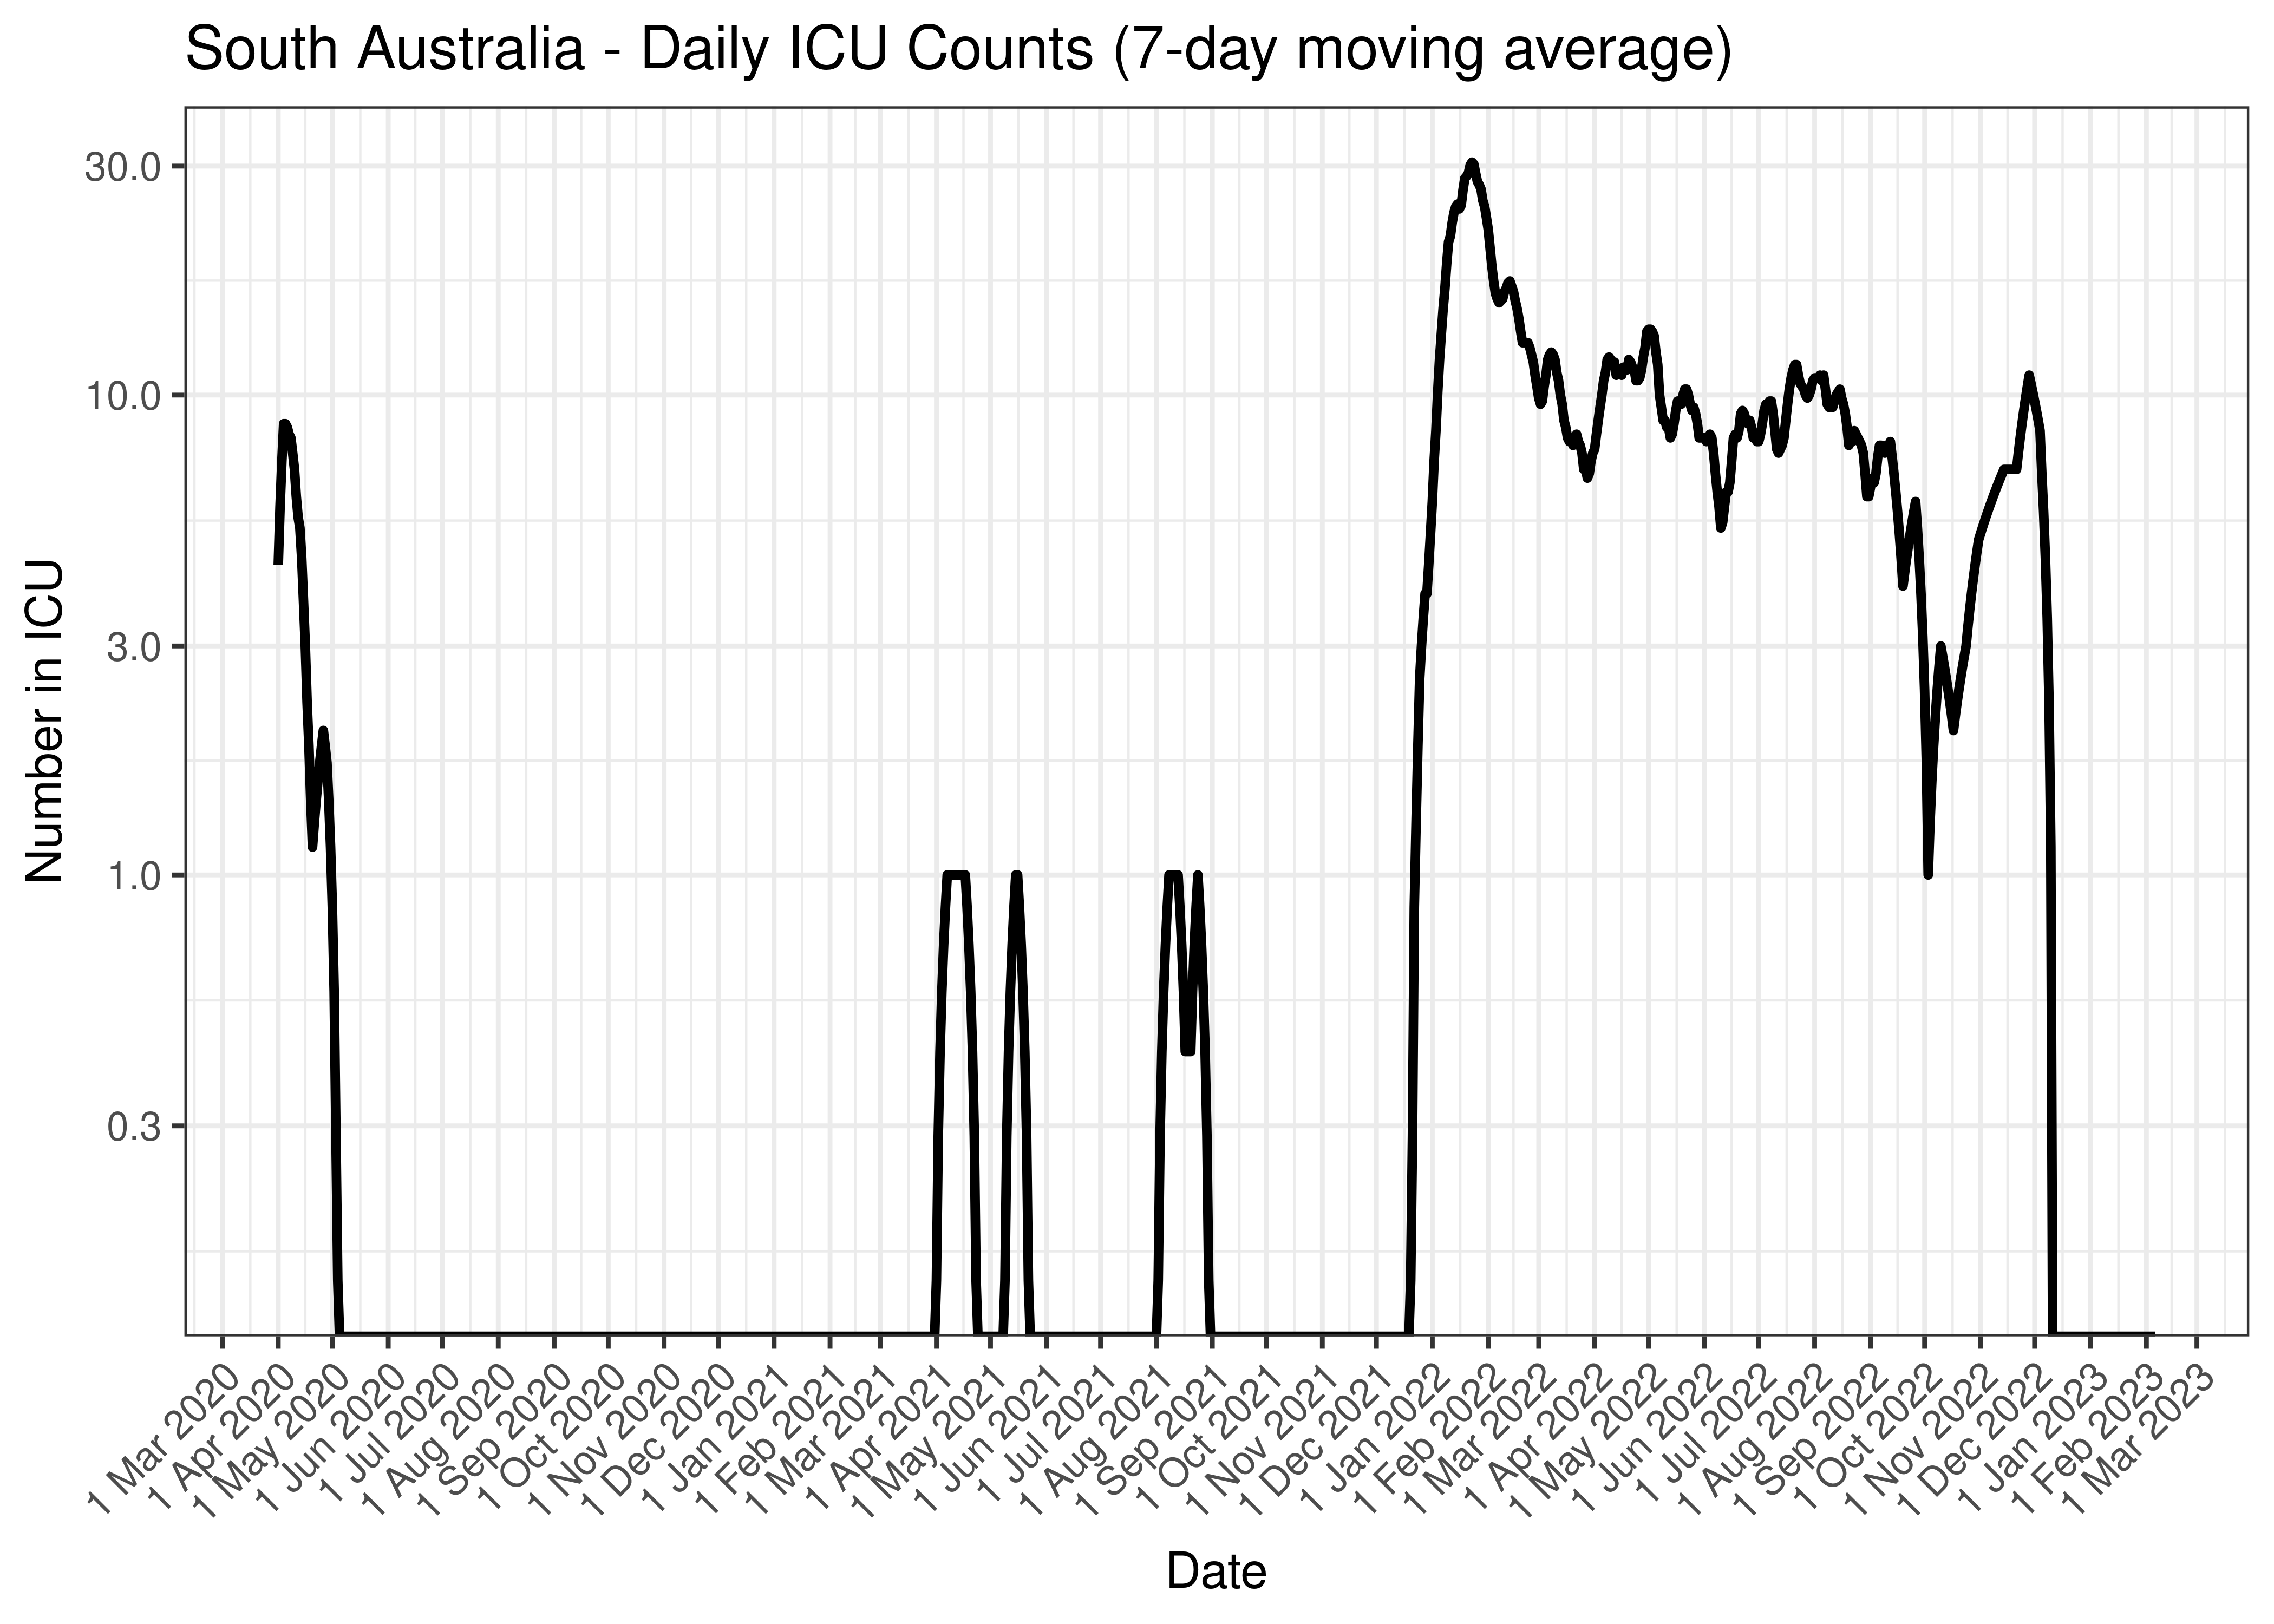
South Australia - Daily ICU Counts (7-day moving average)
Below the above chart is repeated for the last 30-days:
South Australia - Daily ICU Counts for Last 30-days (7-day moving average)
5.6.5 Ventilator
Counts of those on ventilators are tabulated by report date below. A centred 7-day moving average is also shown. The peak daily admissions in previous waves (as measured by the moving average) is also shown.
| Date | On Ventilators | 7-day Moving Average | Comment |
|---|---|---|---|
| 2023-02-03 | 0 | 0 | |
| 2023-02-04 | 0 | 0 | |
| 2023-02-05 | 0 | 0 | |
| 2023-02-06 | 0 | 0 | |
| 2023-02-07 | 0 | NA | |
| 2023-02-08 | 0 | NA | |
| 2023-02-09 | 0 | NA | |
| 2023-02-10 | NA | NA |
The above are based on the following dates:
- Wave 1 started on 2020-01-01.
- Wave 2 started on 2020-06-01.
- Wave 3 started on 2021-06-01.
- Wave 4 started on 2021-12-01.
Below a 7-day moving average of daily ventilator counts is plotted by on a log scale since start of the epidemic. Note admissions are plotted by date.
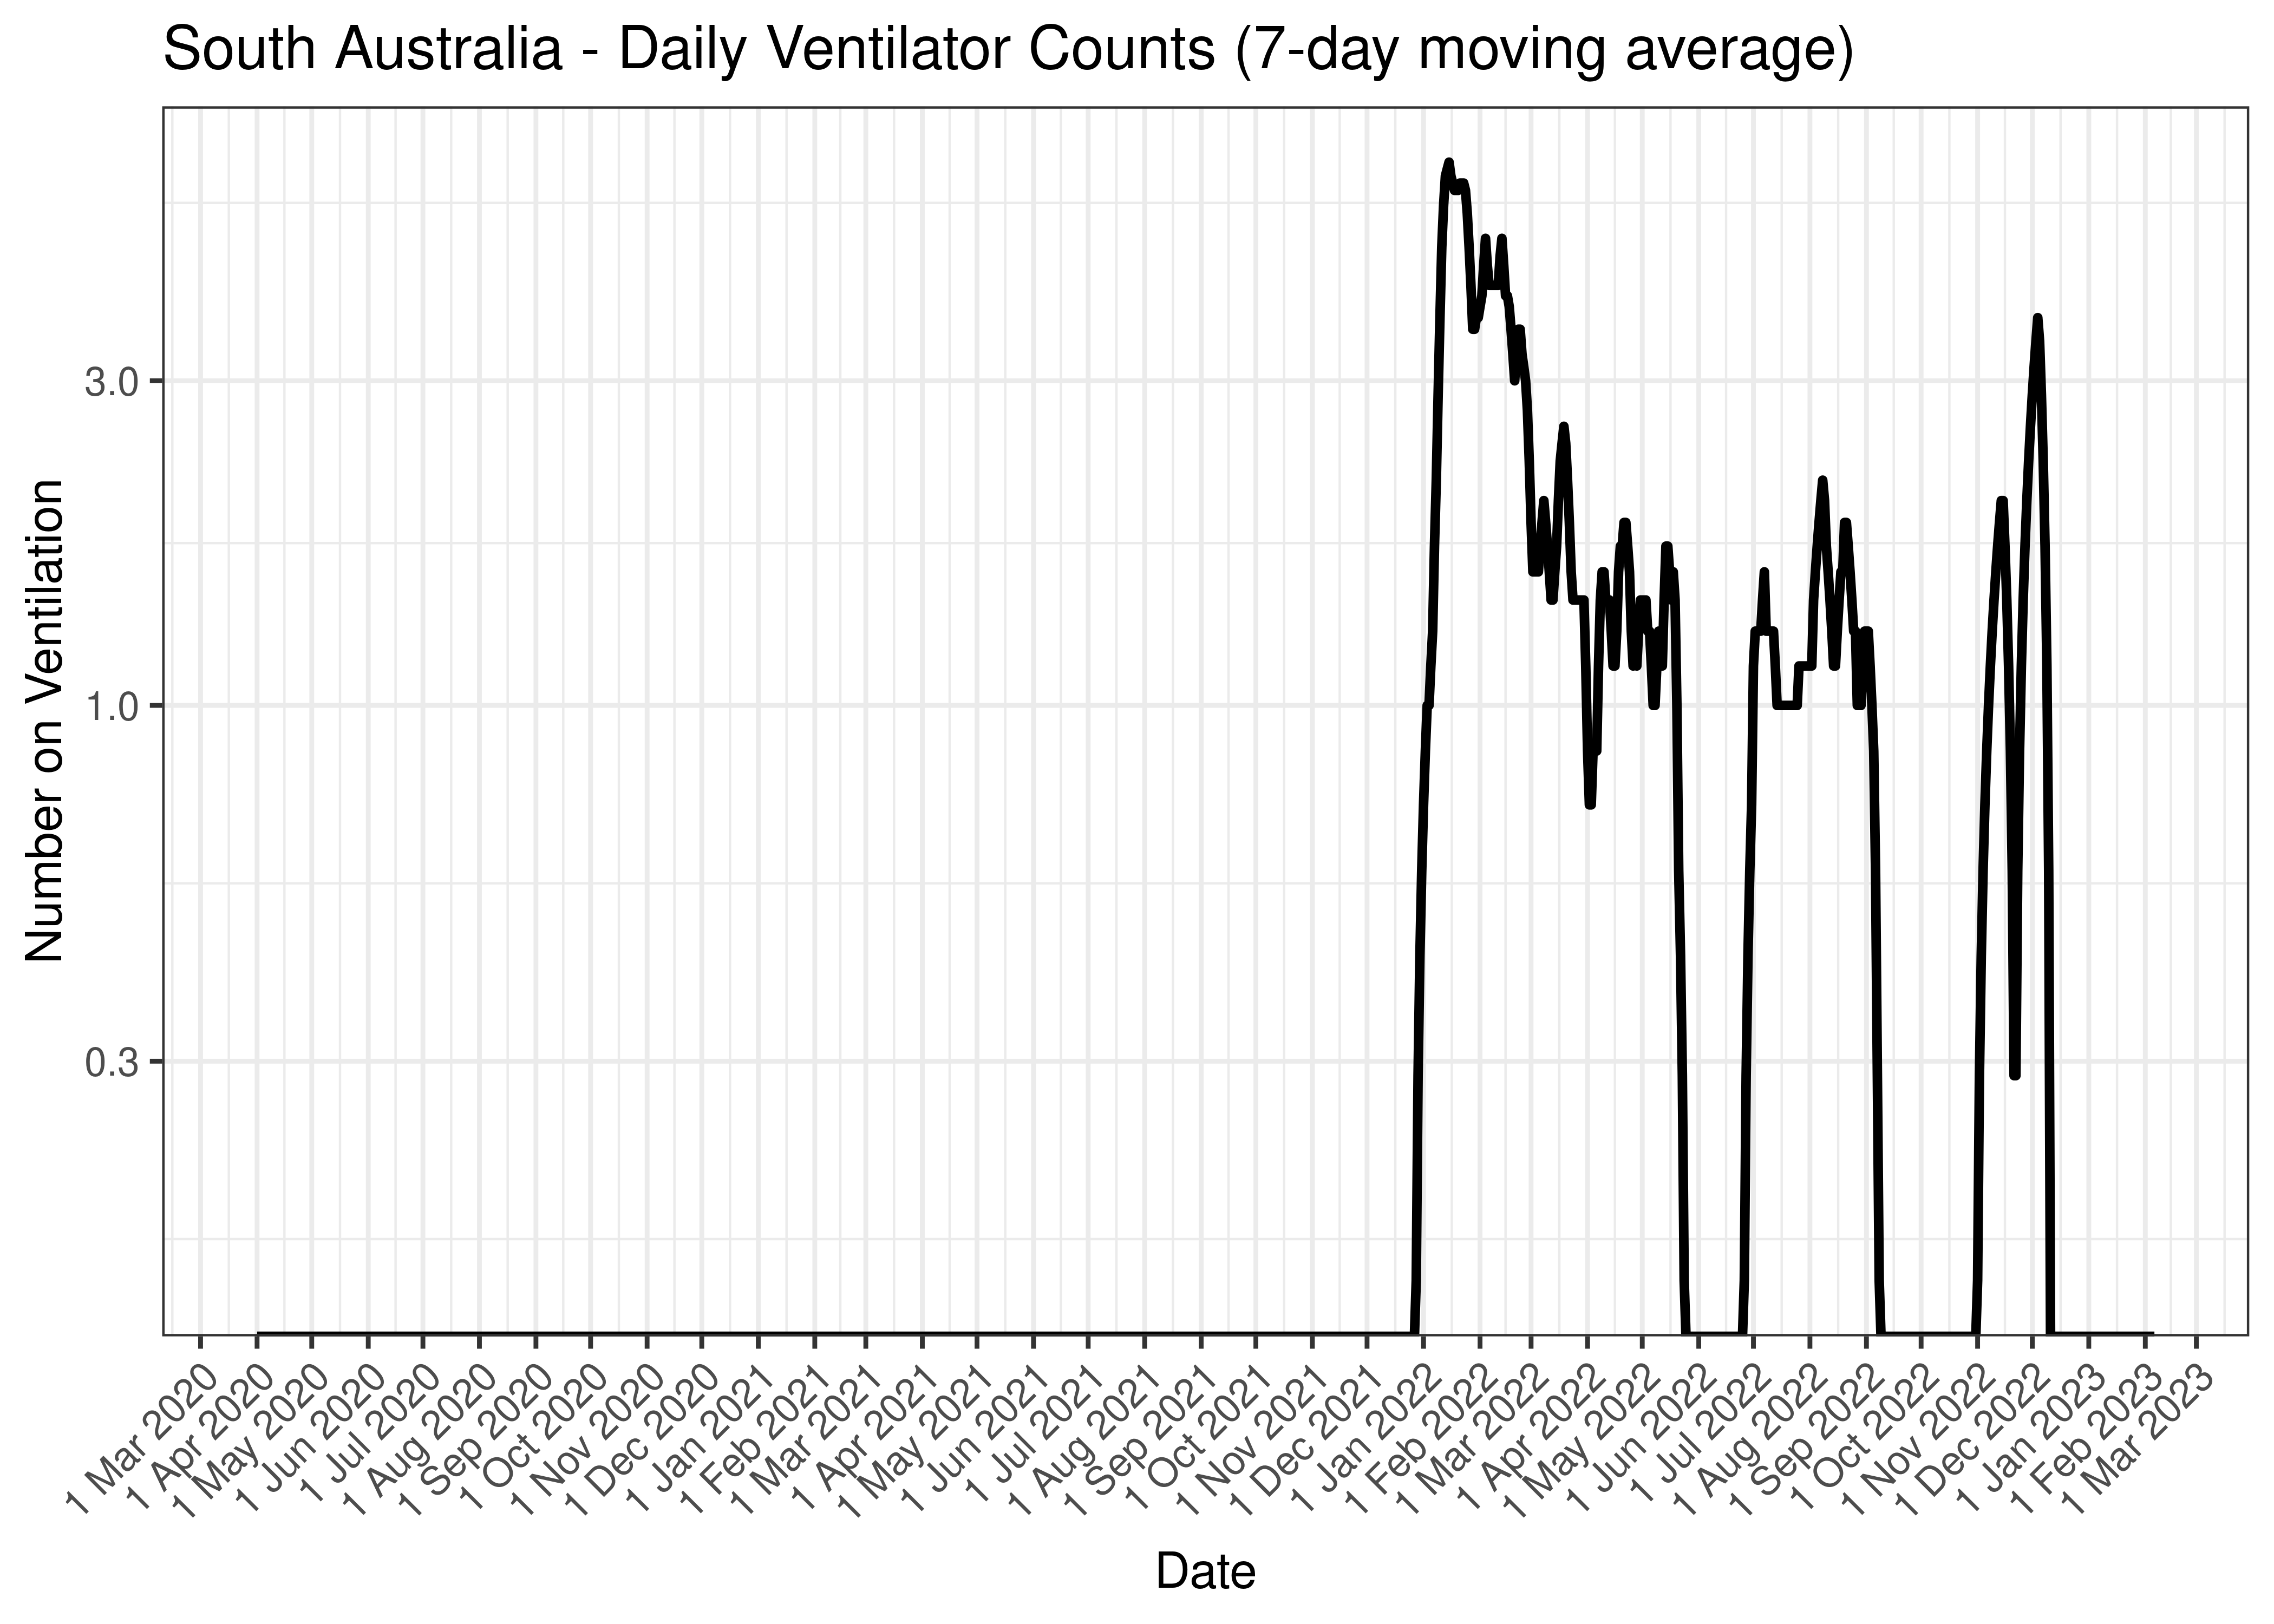
South Australia - Daily Ventilator Counts (7-day moving average)
Below the above chart is repeated for the last 30-days:
South Australia - Daily Ventilator Counts for Last 30-days (7-day moving average)
5.6.6 Deaths
Deaths are tabulated by report date below. A centred 7-day moving average is also shown. The peak daily deaths in previous waves (as measured by the moving average) is also shown.
| Date | Deaths | 7-day Moving Average | Comment |
|---|---|---|---|
| 2023-02-03 | 14 | 2 | |
| 2023-02-04 | 0 | 2 | |
| 2023-02-05 | 0 | 2 | |
| 2023-02-06 | 0 | 2 | |
| 2023-02-07 | 0 | 13 | Wave 4 Peak (to date) |
| 2023-02-08 | 0 | NA | |
| 2023-02-09 | 0 | NA | |
| 2023-02-10 | 94 | NA |
The above are based on the following dates:
- Wave 1 started on 2020-01-01.
- Wave 2 started on 2020-06-01.
- Wave 3 started on 2021-06-01.
- Wave 4 started on 2021-12-01.
Below a 7-day moving average of daily deaths is plotted by on a log scale since start of the epidemic.
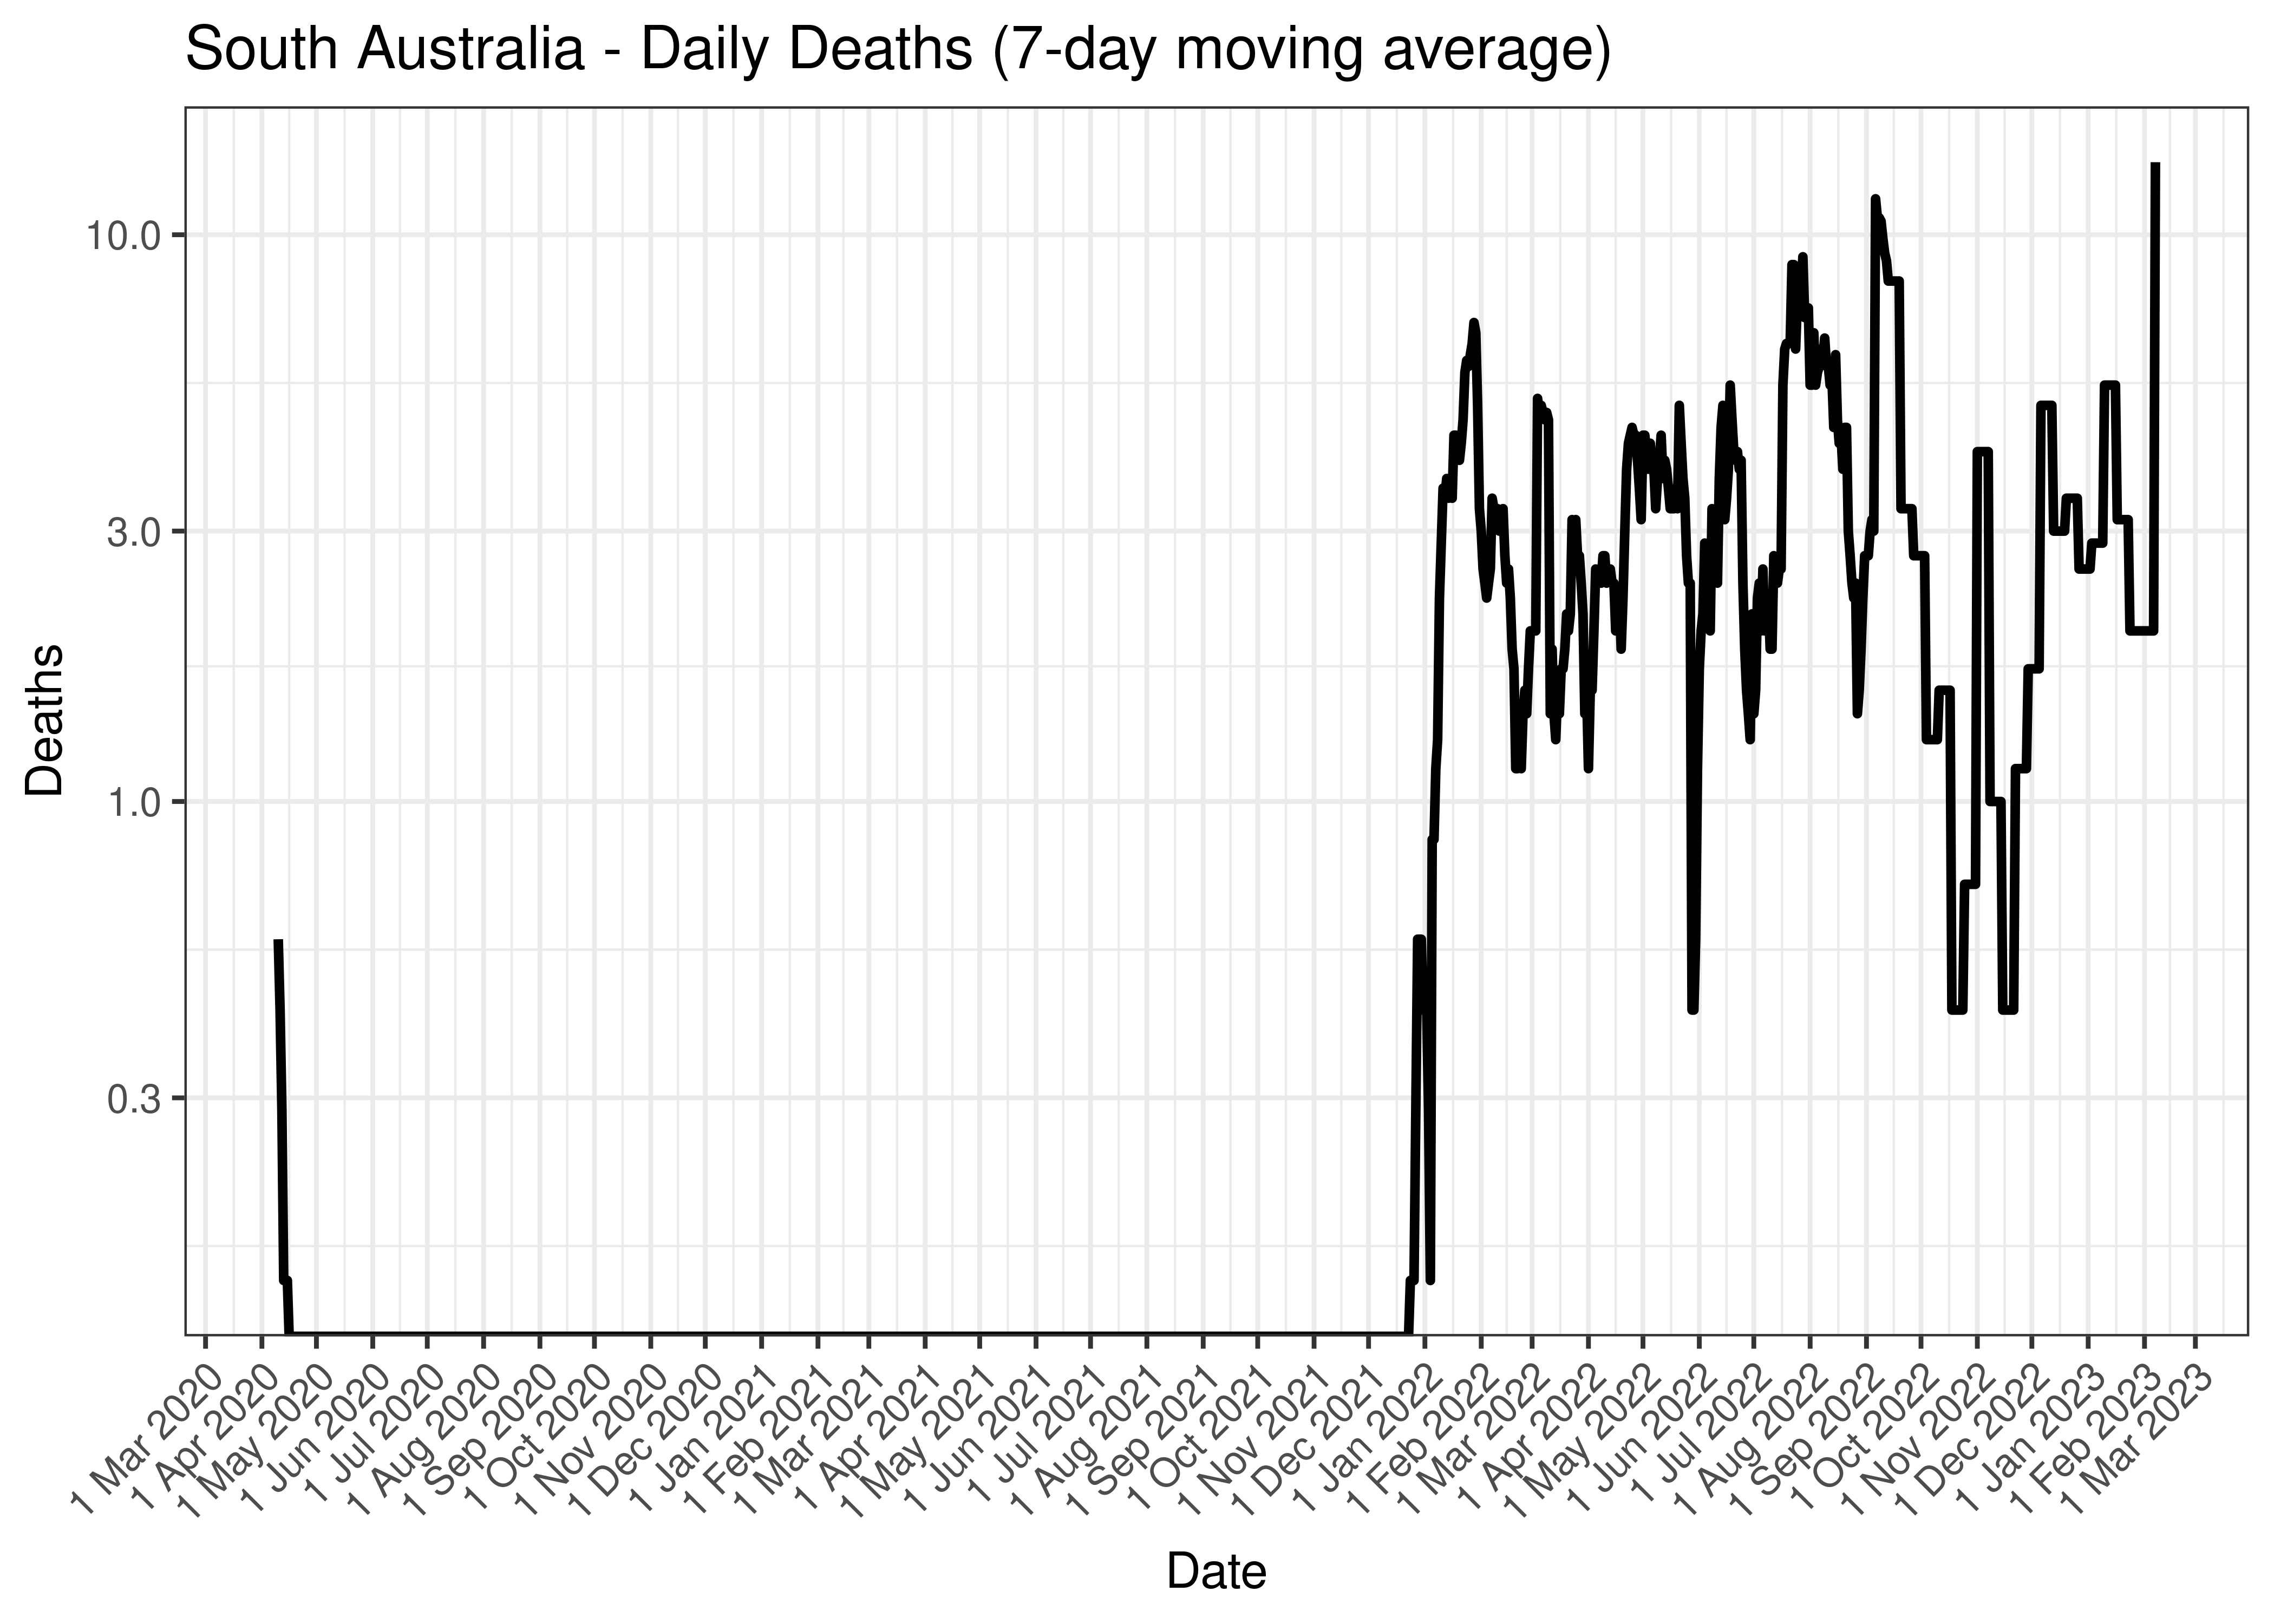
South Australia - Daily Deaths (7-day moving average)
Below the above chart is repeated for the last 30-days:
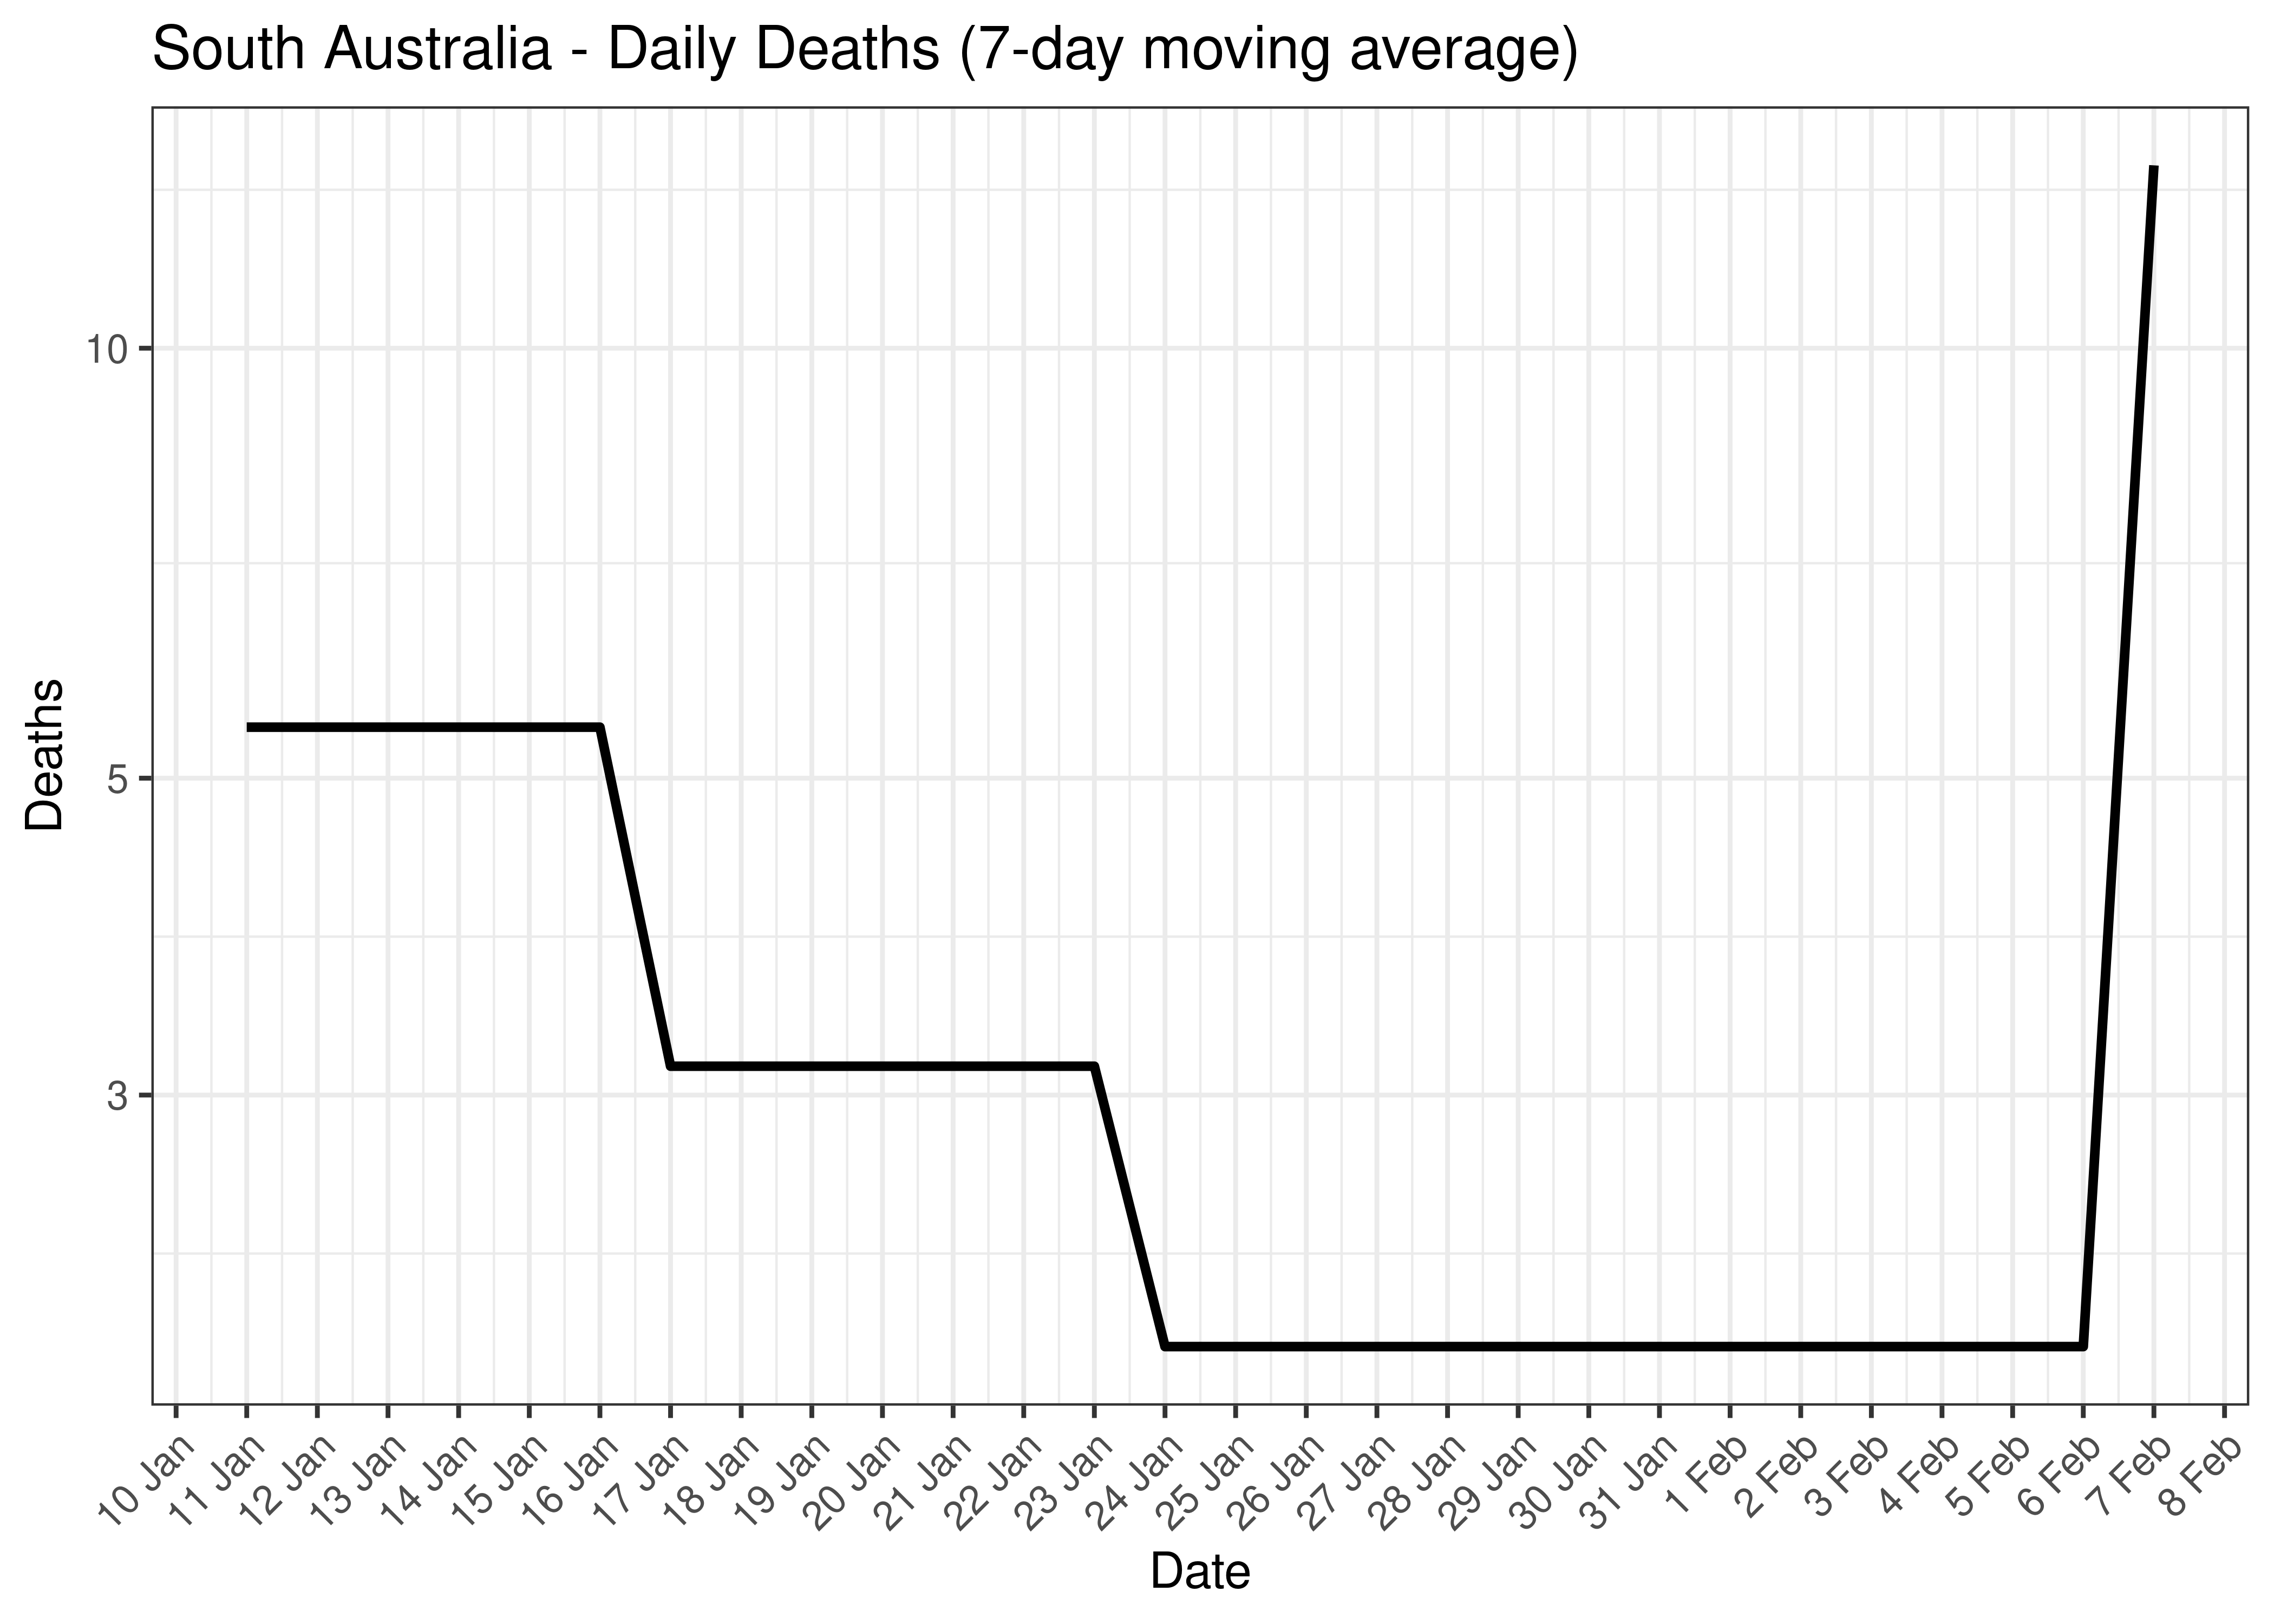
South Australia - Daily Deaths for Last 30-days (7-day moving average)
5.6.7 Cases, Hospital Counts and Deaths Combined
Below a 7-day moving average daily case, hospital counts and deaths are plotted by state on a log scale since start of the epidemic. Note admissions and excess deaths are plotted by date, whereas cases are plotted by specimen received date.
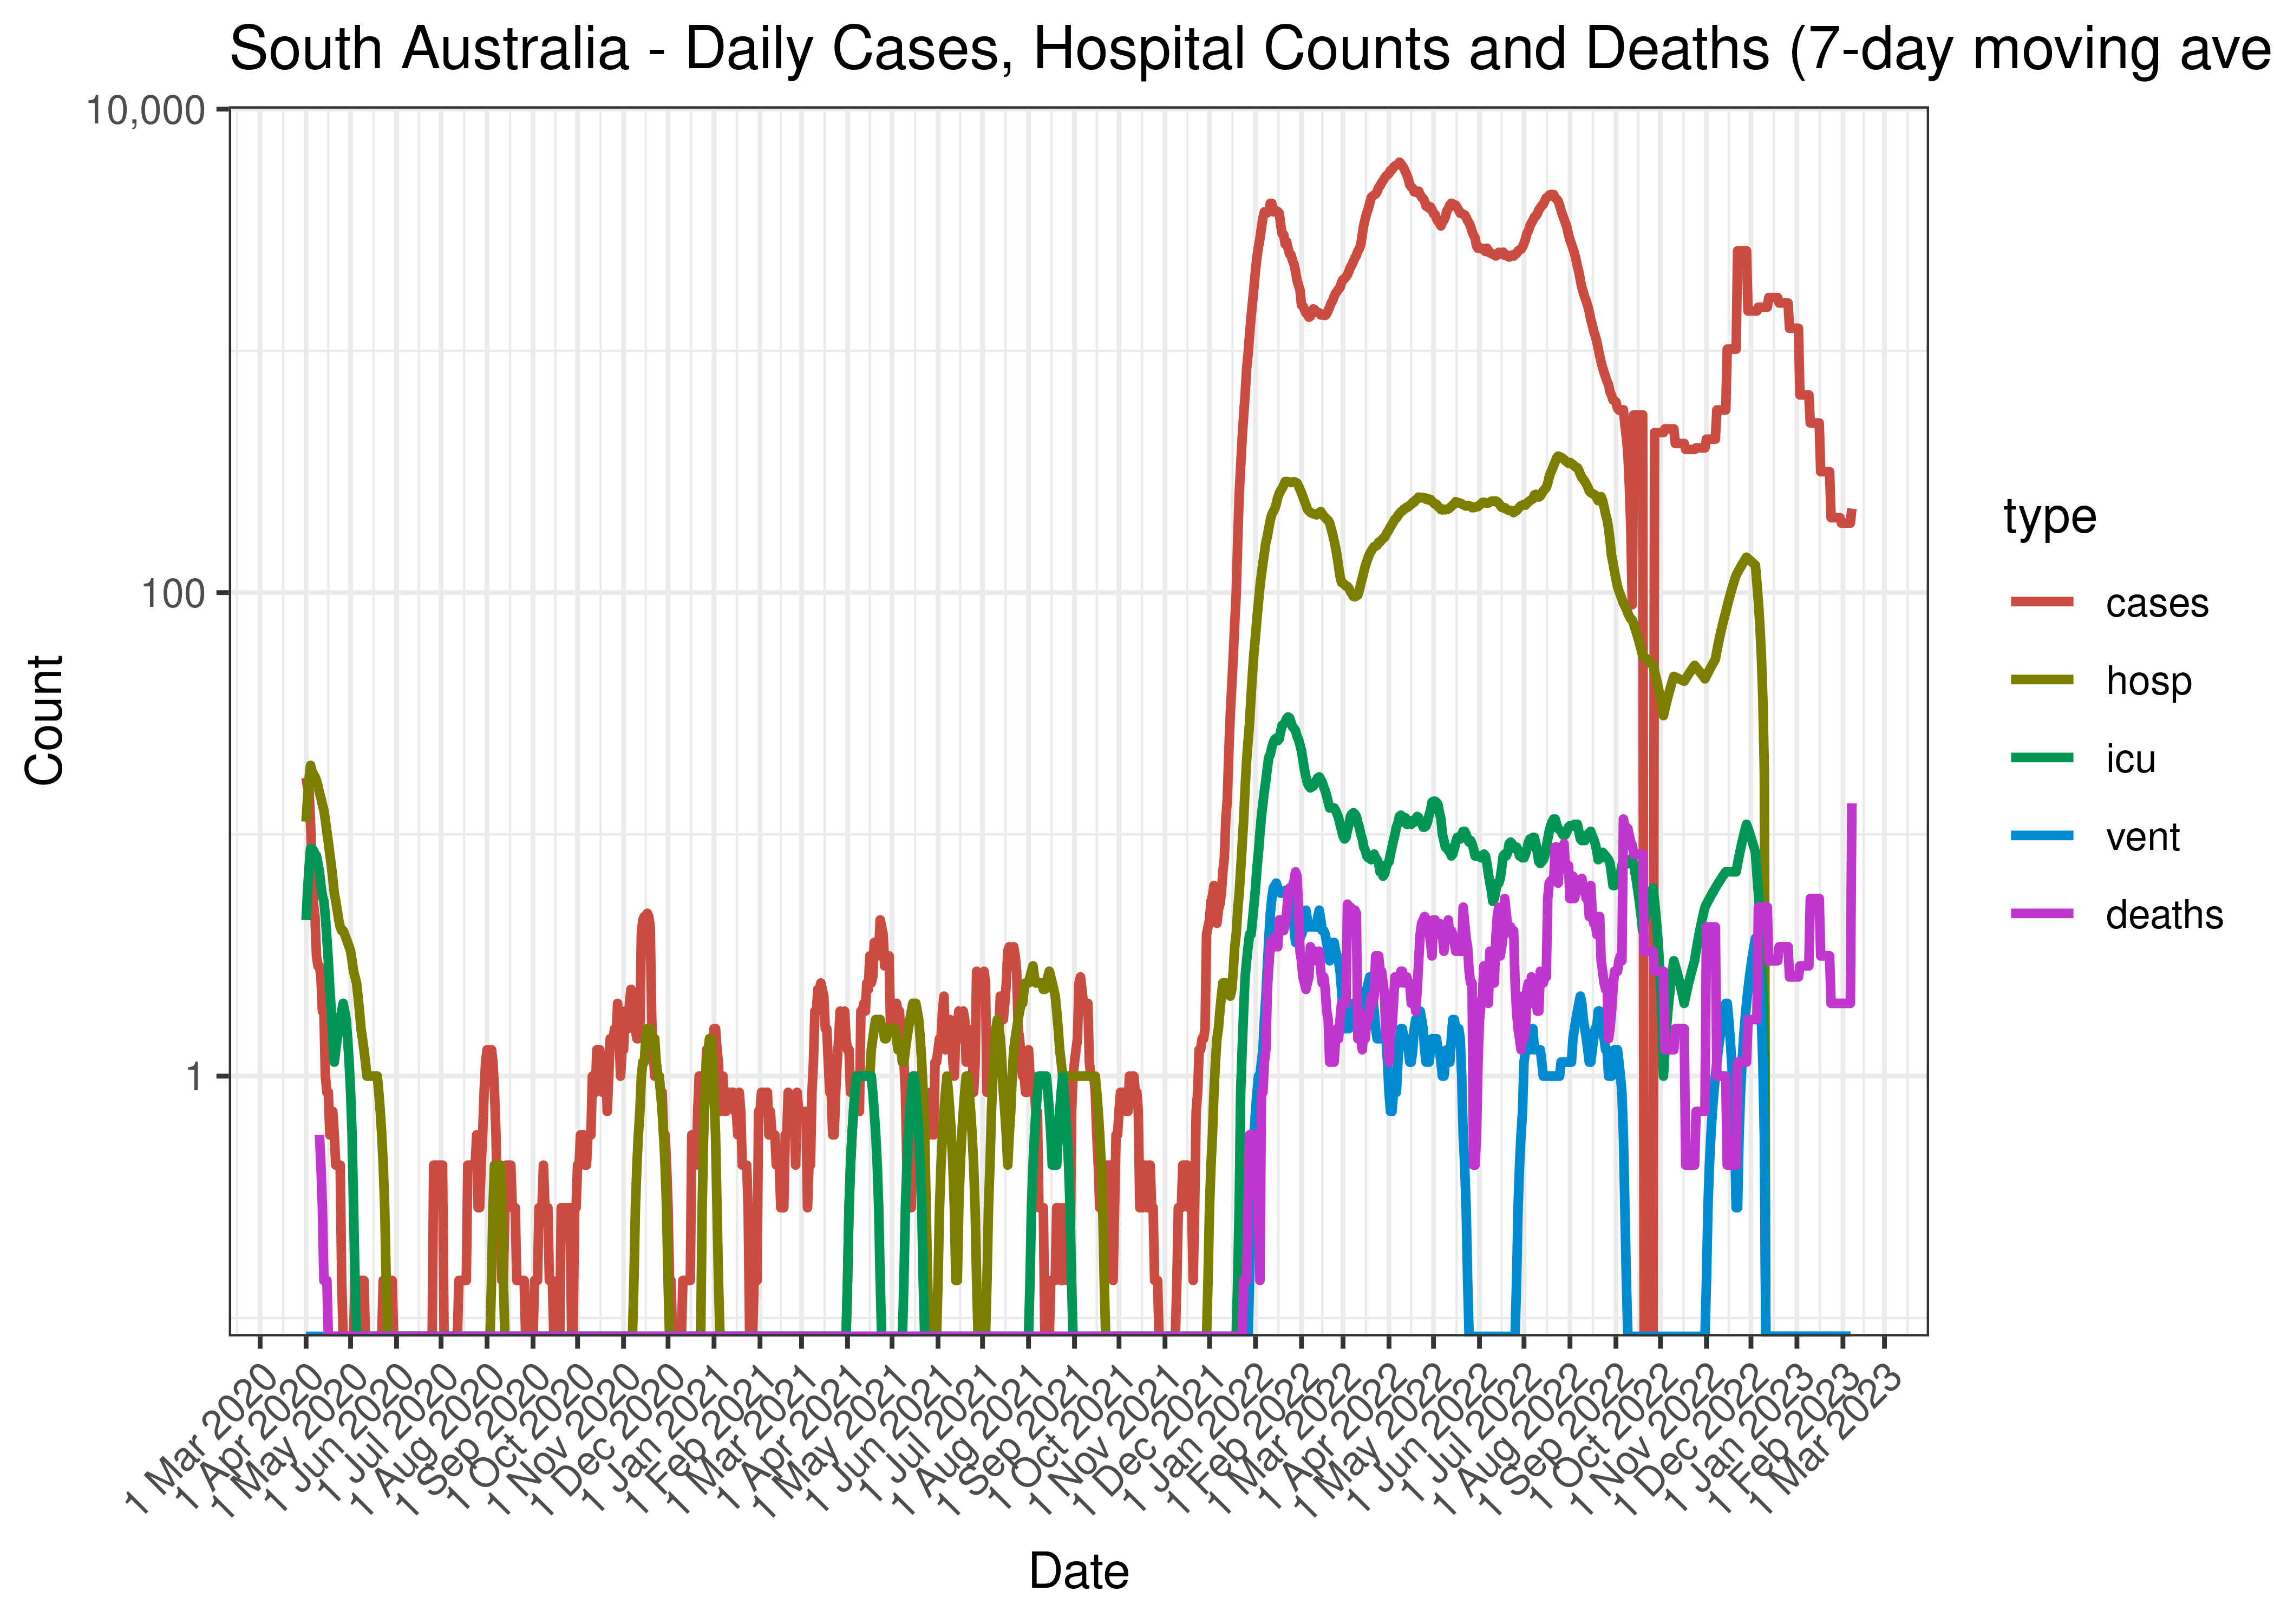
South Australia - Daily Cases, Hospital Counts and Deaths (7-day moving average)
Below the above chart is repeated for the last 30-days:
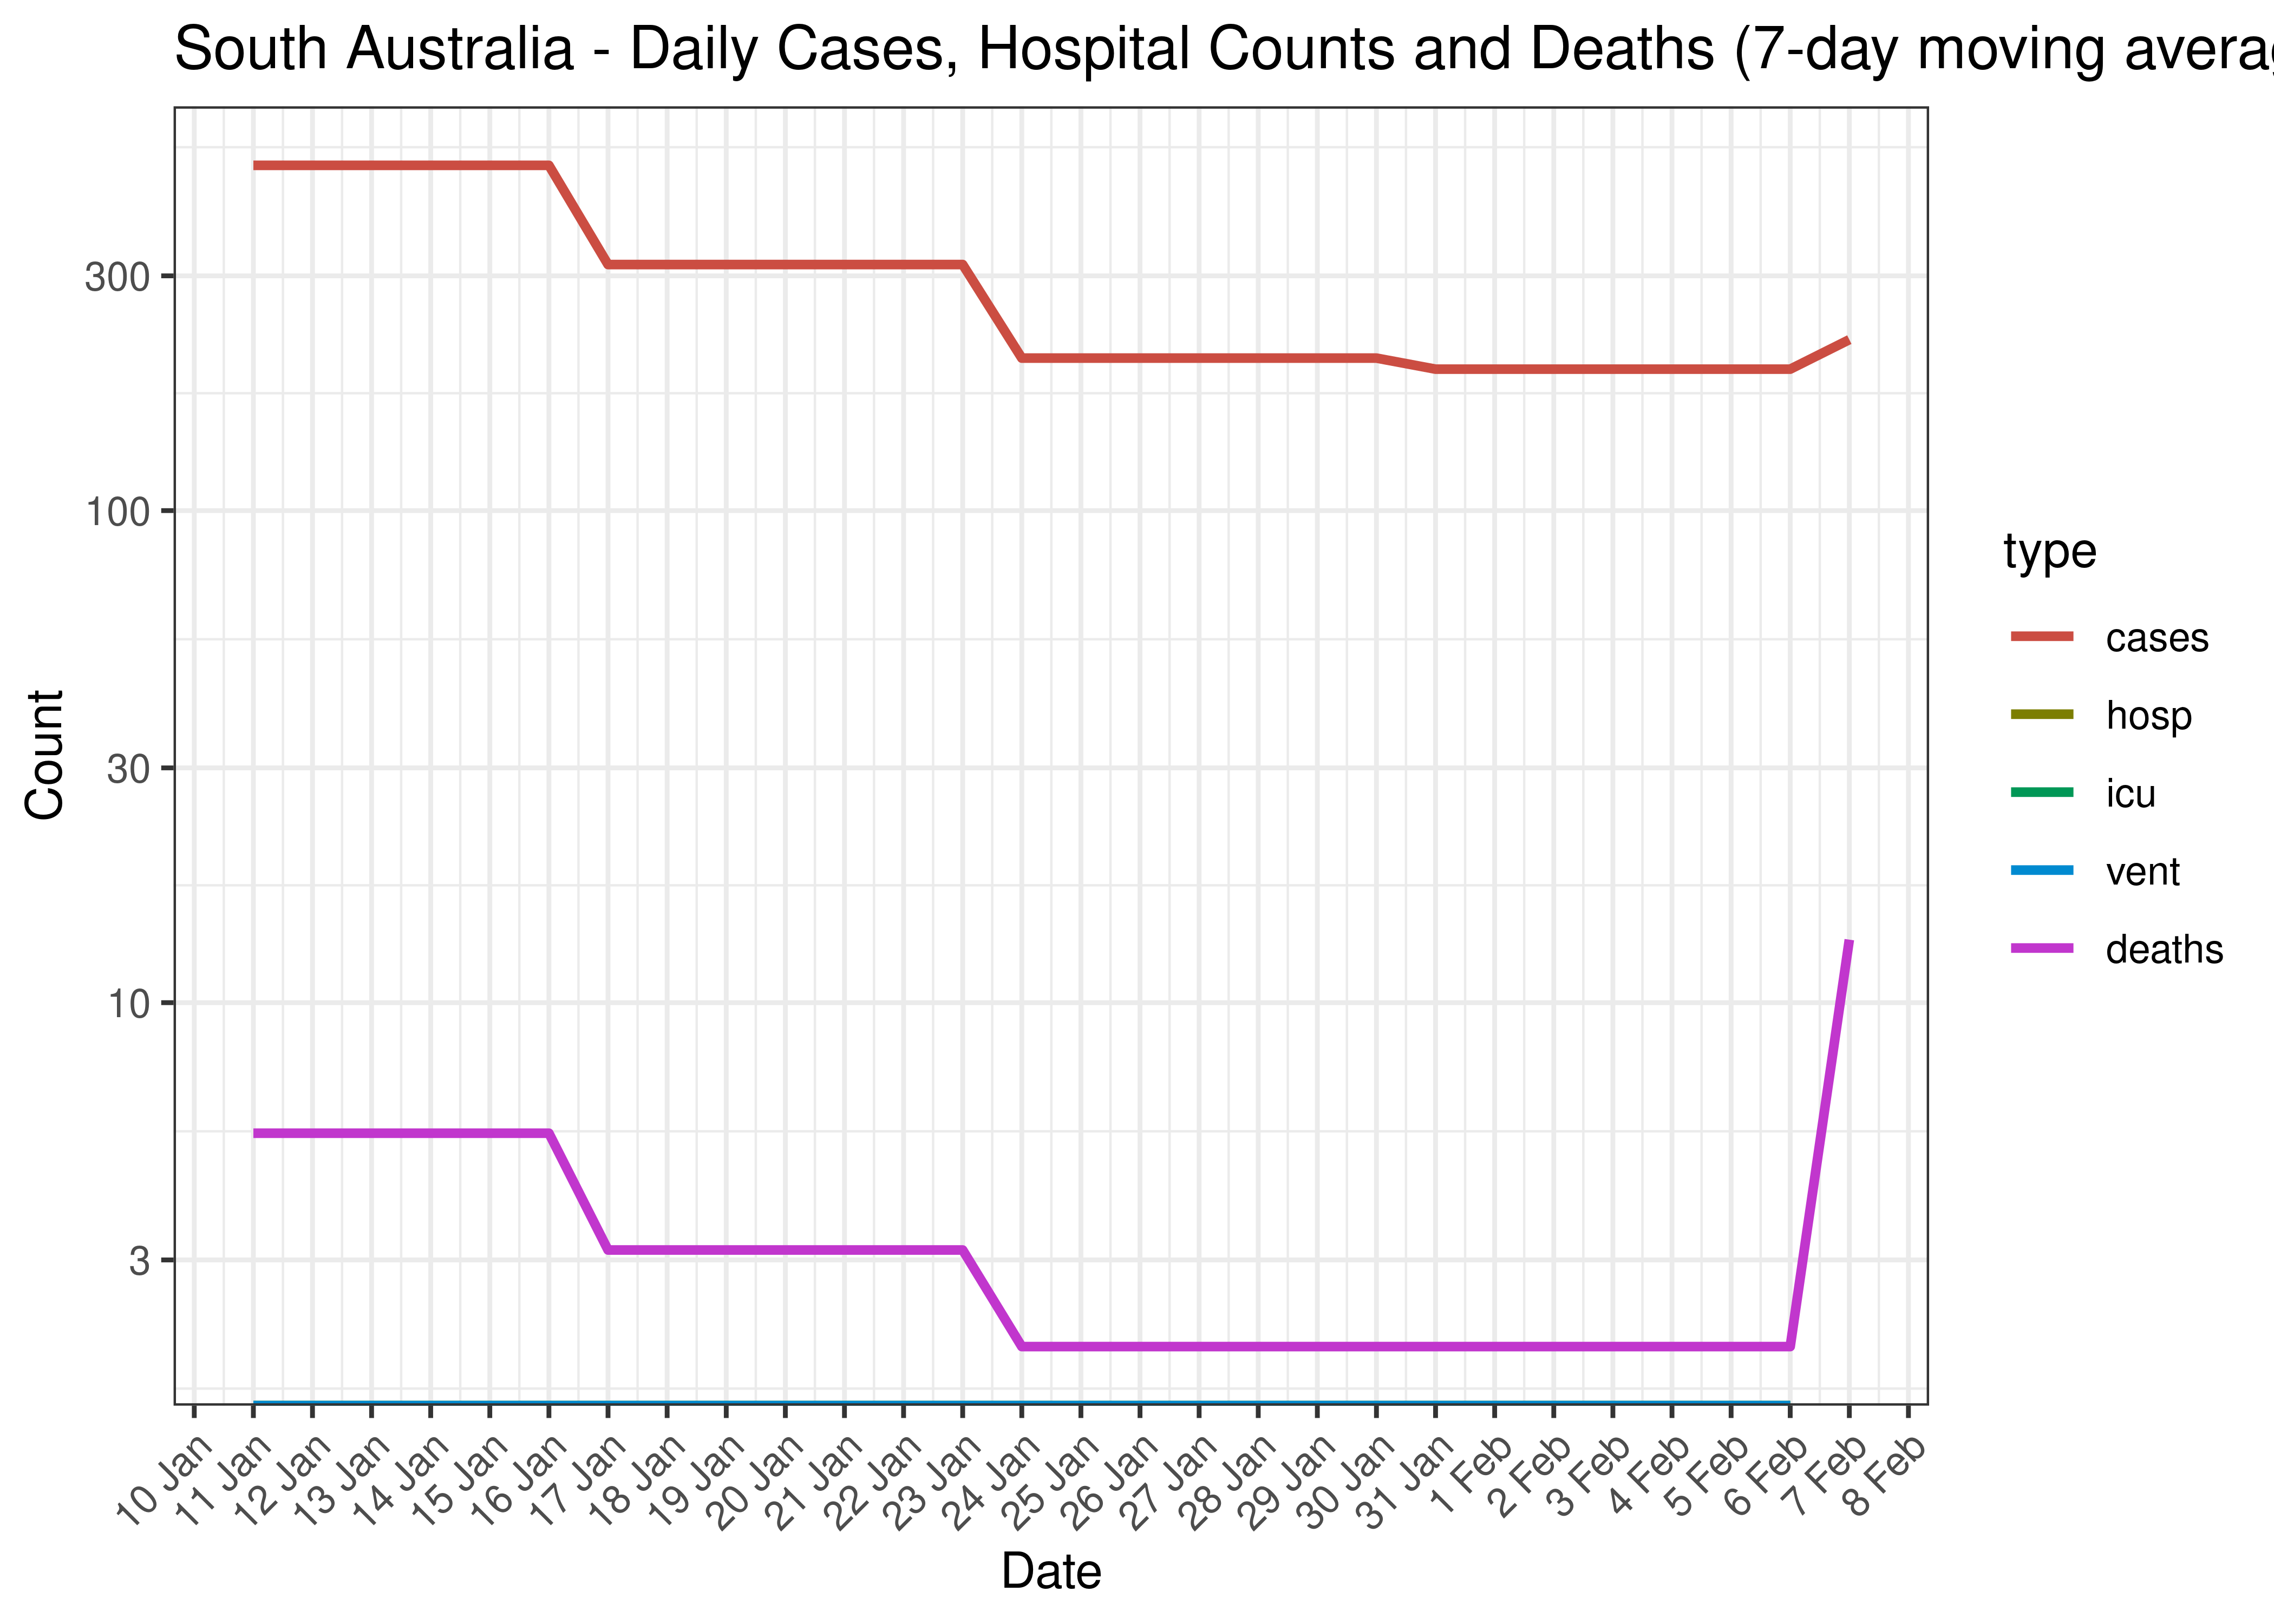
South Australia - Daily Cases, Admissions and Deaths for Last 30-days (7-day moving average)
5.6.8 Crude Ratios per Wave
Below crude rations are calculated between the waves. It’s based on the following starting dates:
- Wave 1 started on 2020-01-01.
- Wave 2 started on 2020-06-01.
- Wave 3 started on 2021-06-01.
- Wave 4 started on 2021-12-01.
Below crude ratios are tabulated and plotted. These ratios are:
- ICU ratio calculated as person days in ICU divided by person days in hospital.
- Ventilator ratio calculated as person days on ventilators divided by person days in hospital.
- Death ratio calculated as deaths divided by person days in hospital.
- Case fatality ratio is calcualted as deaths divided by cases.
| Wave | ICU Ratio | Ventilator Ratio | Death Ratio | Case Fatality Ratio | |
|---|---|---|---|---|---|
| South Australia | Wave 1 | 37.7% | 0.0% | 1.1% | 0.91% |
| South Australia | Wave 2 | 24.0% | 0.0% | 0.0% | 0.00% |
| South Australia | Wave 3 | 14.7% | 0.0% | 0.0% | 0.00% |
| South Australia | Wave 4 | 5.6% | 0.8% | 1.9% | 0.14% |
5.6.9 Reproduction Number
Below current (last weekly) effective reproduction number estimates are tabulated for Australia and by state.
| Type | Count (Per Day) | Week Ending | Reproduction Number [95% Confidence Interval] | |
|---|---|---|---|---|
| South Australia | cases | 223 | 2023-02-10 | 1.14 [1.08 - 1.20] |
Below the effective reproduction number for Australia over the last 90 days are plotted together with a plot since start of the pandemic.
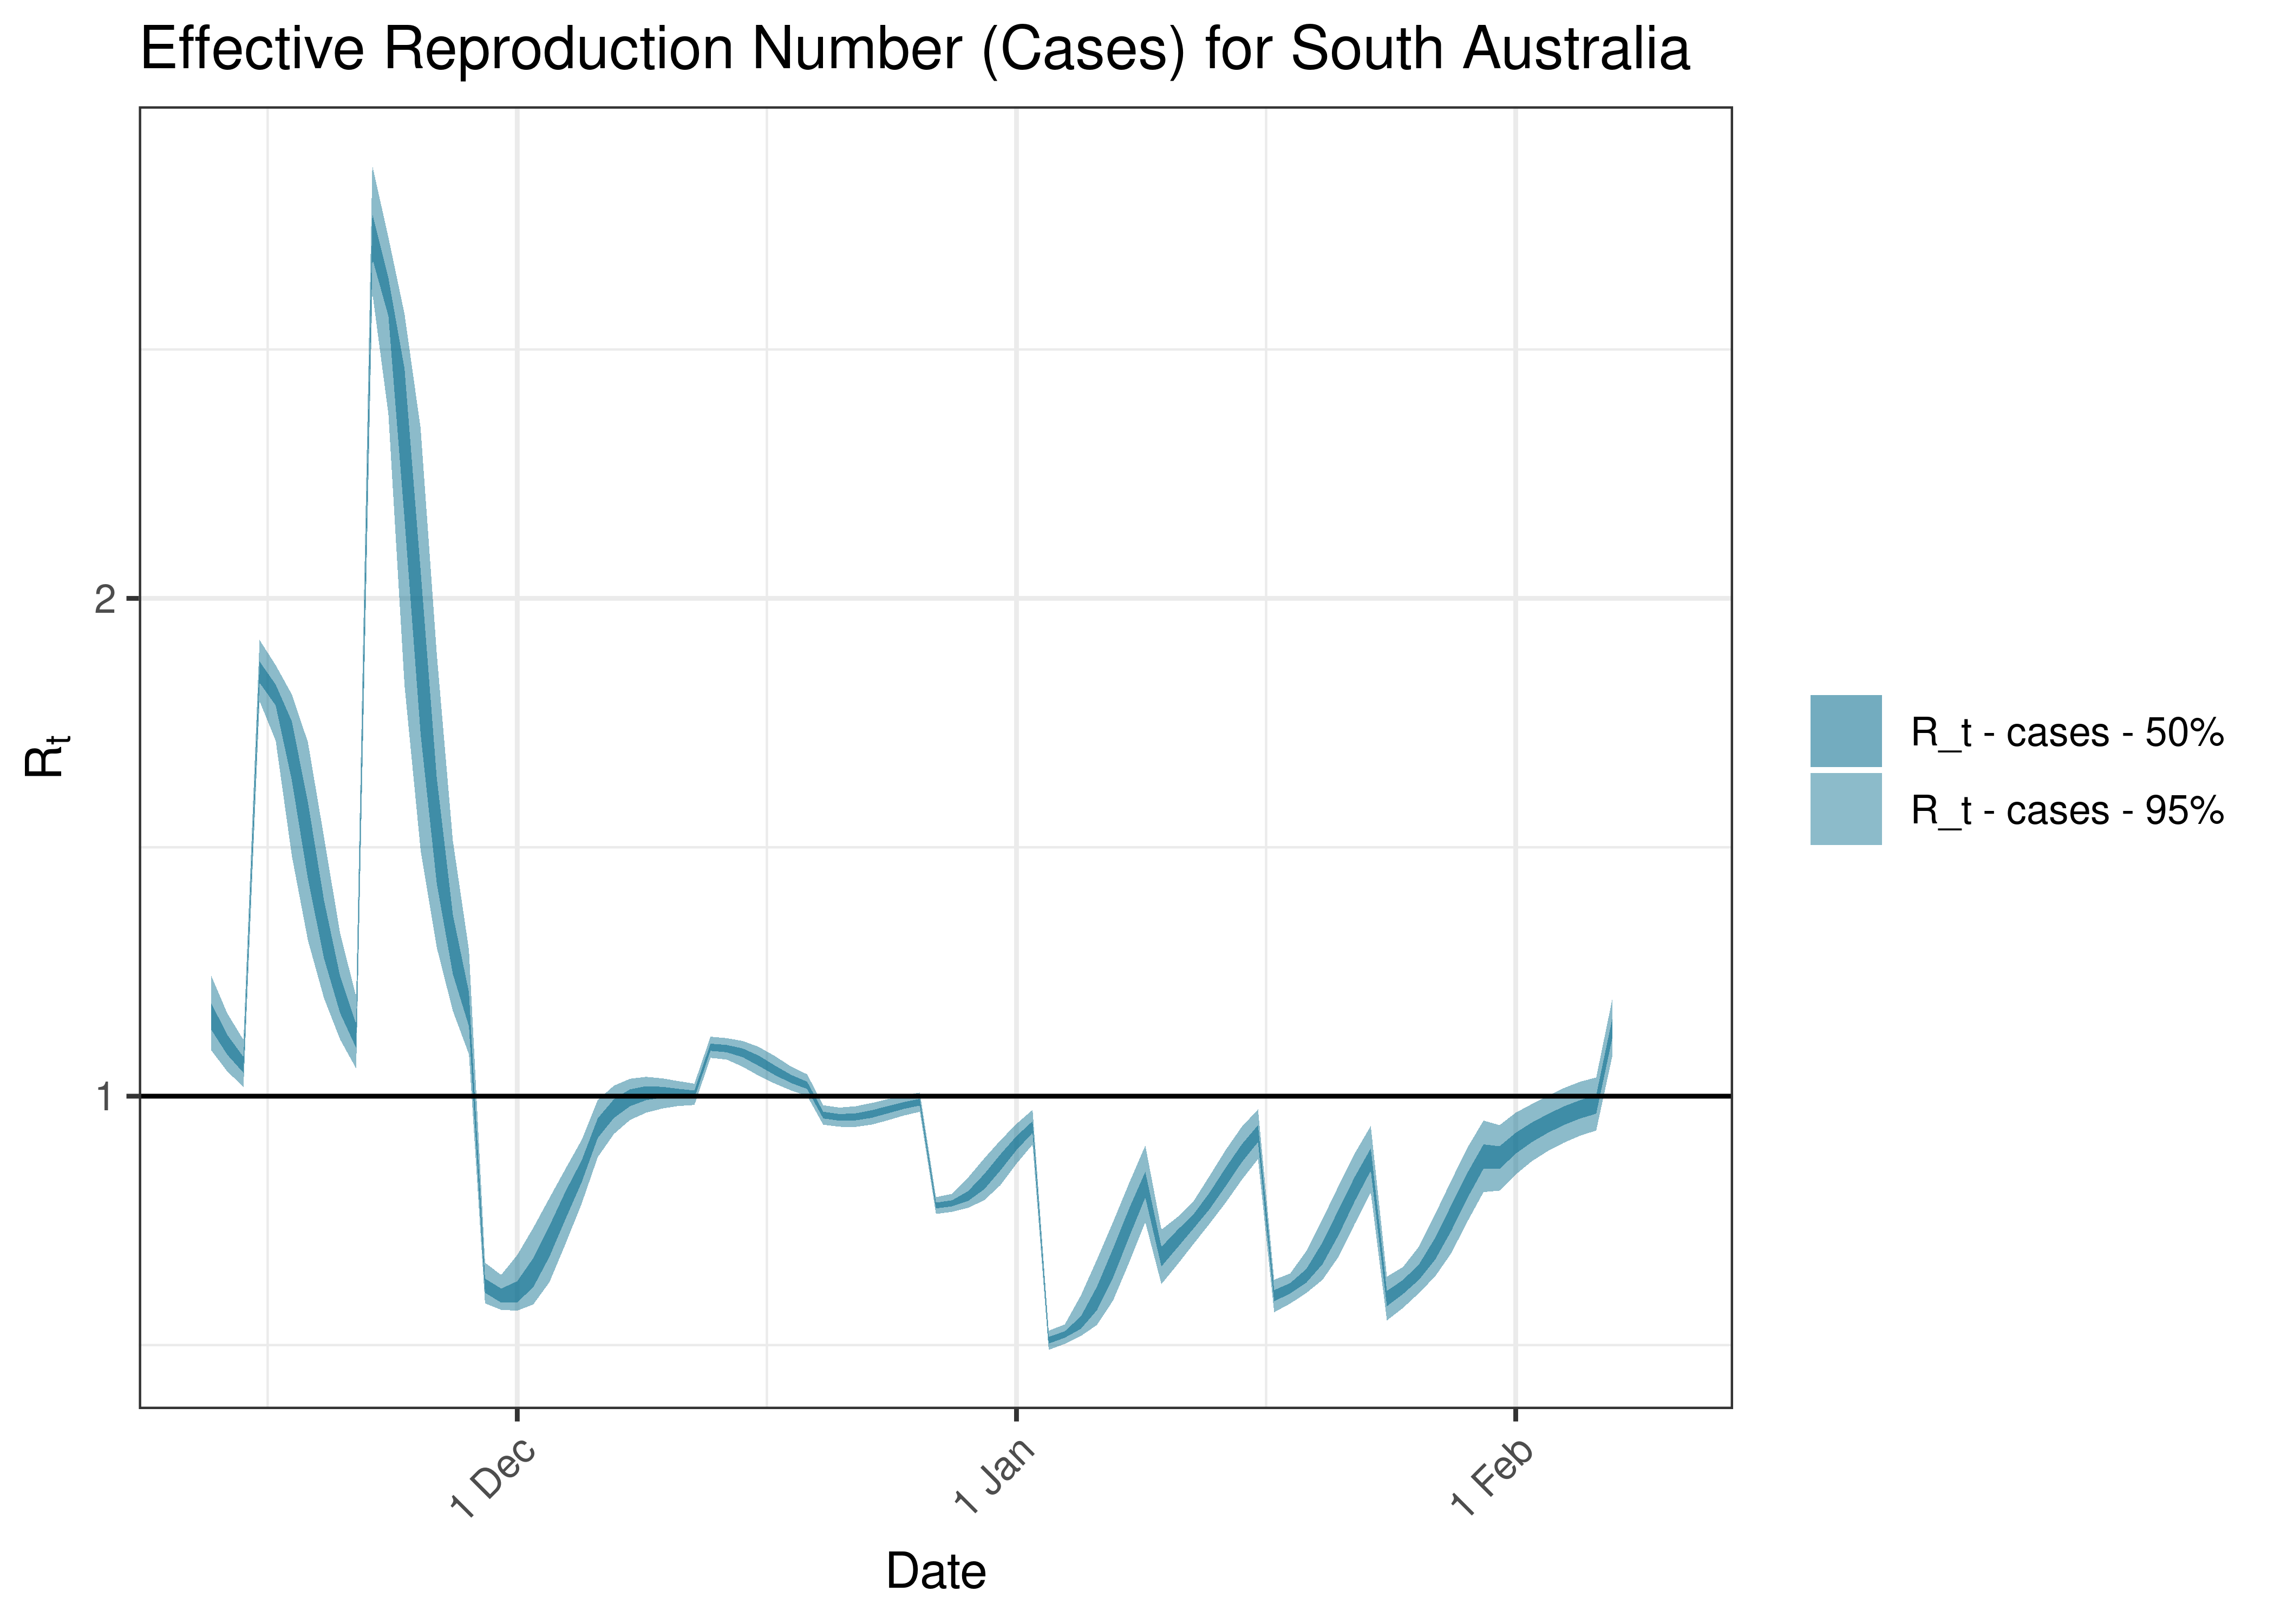
Estimated Effective Reproduction Number Based on Cases for South Australia over last 90 days
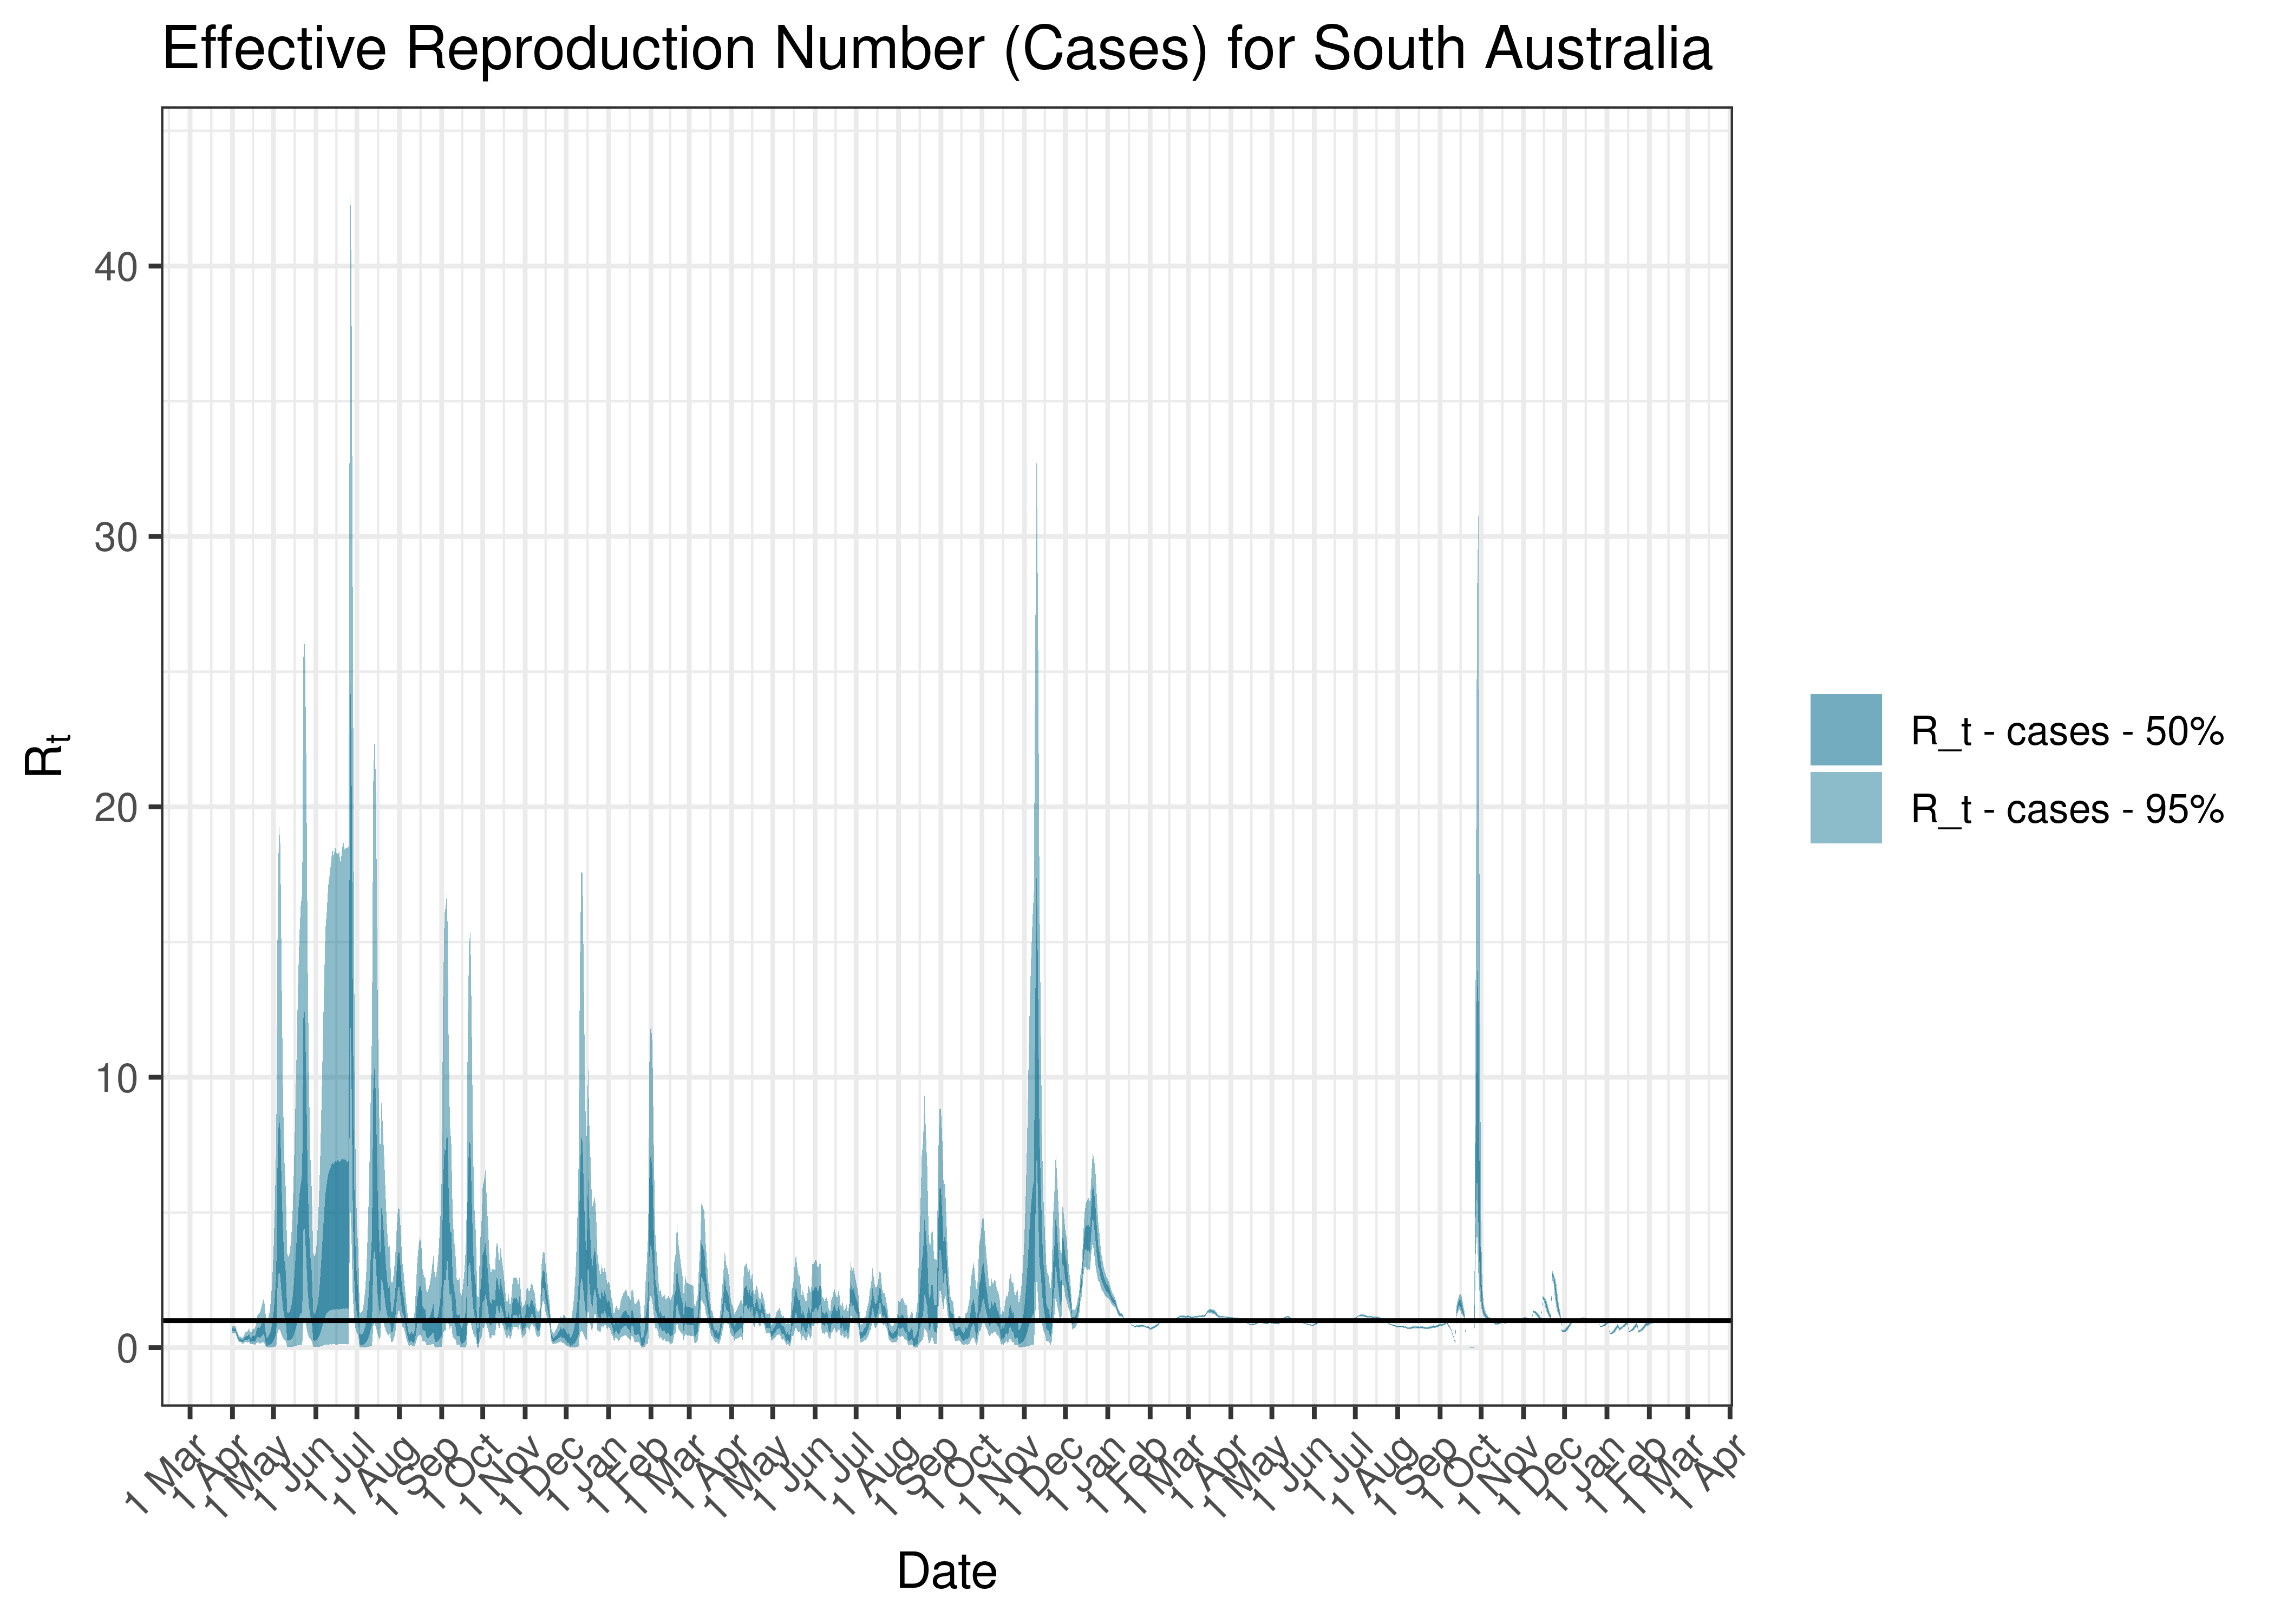
Estimated Effective Reproduction Number Based on Cases for South Australia since 1 April 2020
5.7 Tasmania
5.7.1 Tests
Below raw numbers of test by date are plotted on a 7-day moving average from 1 April 2020.
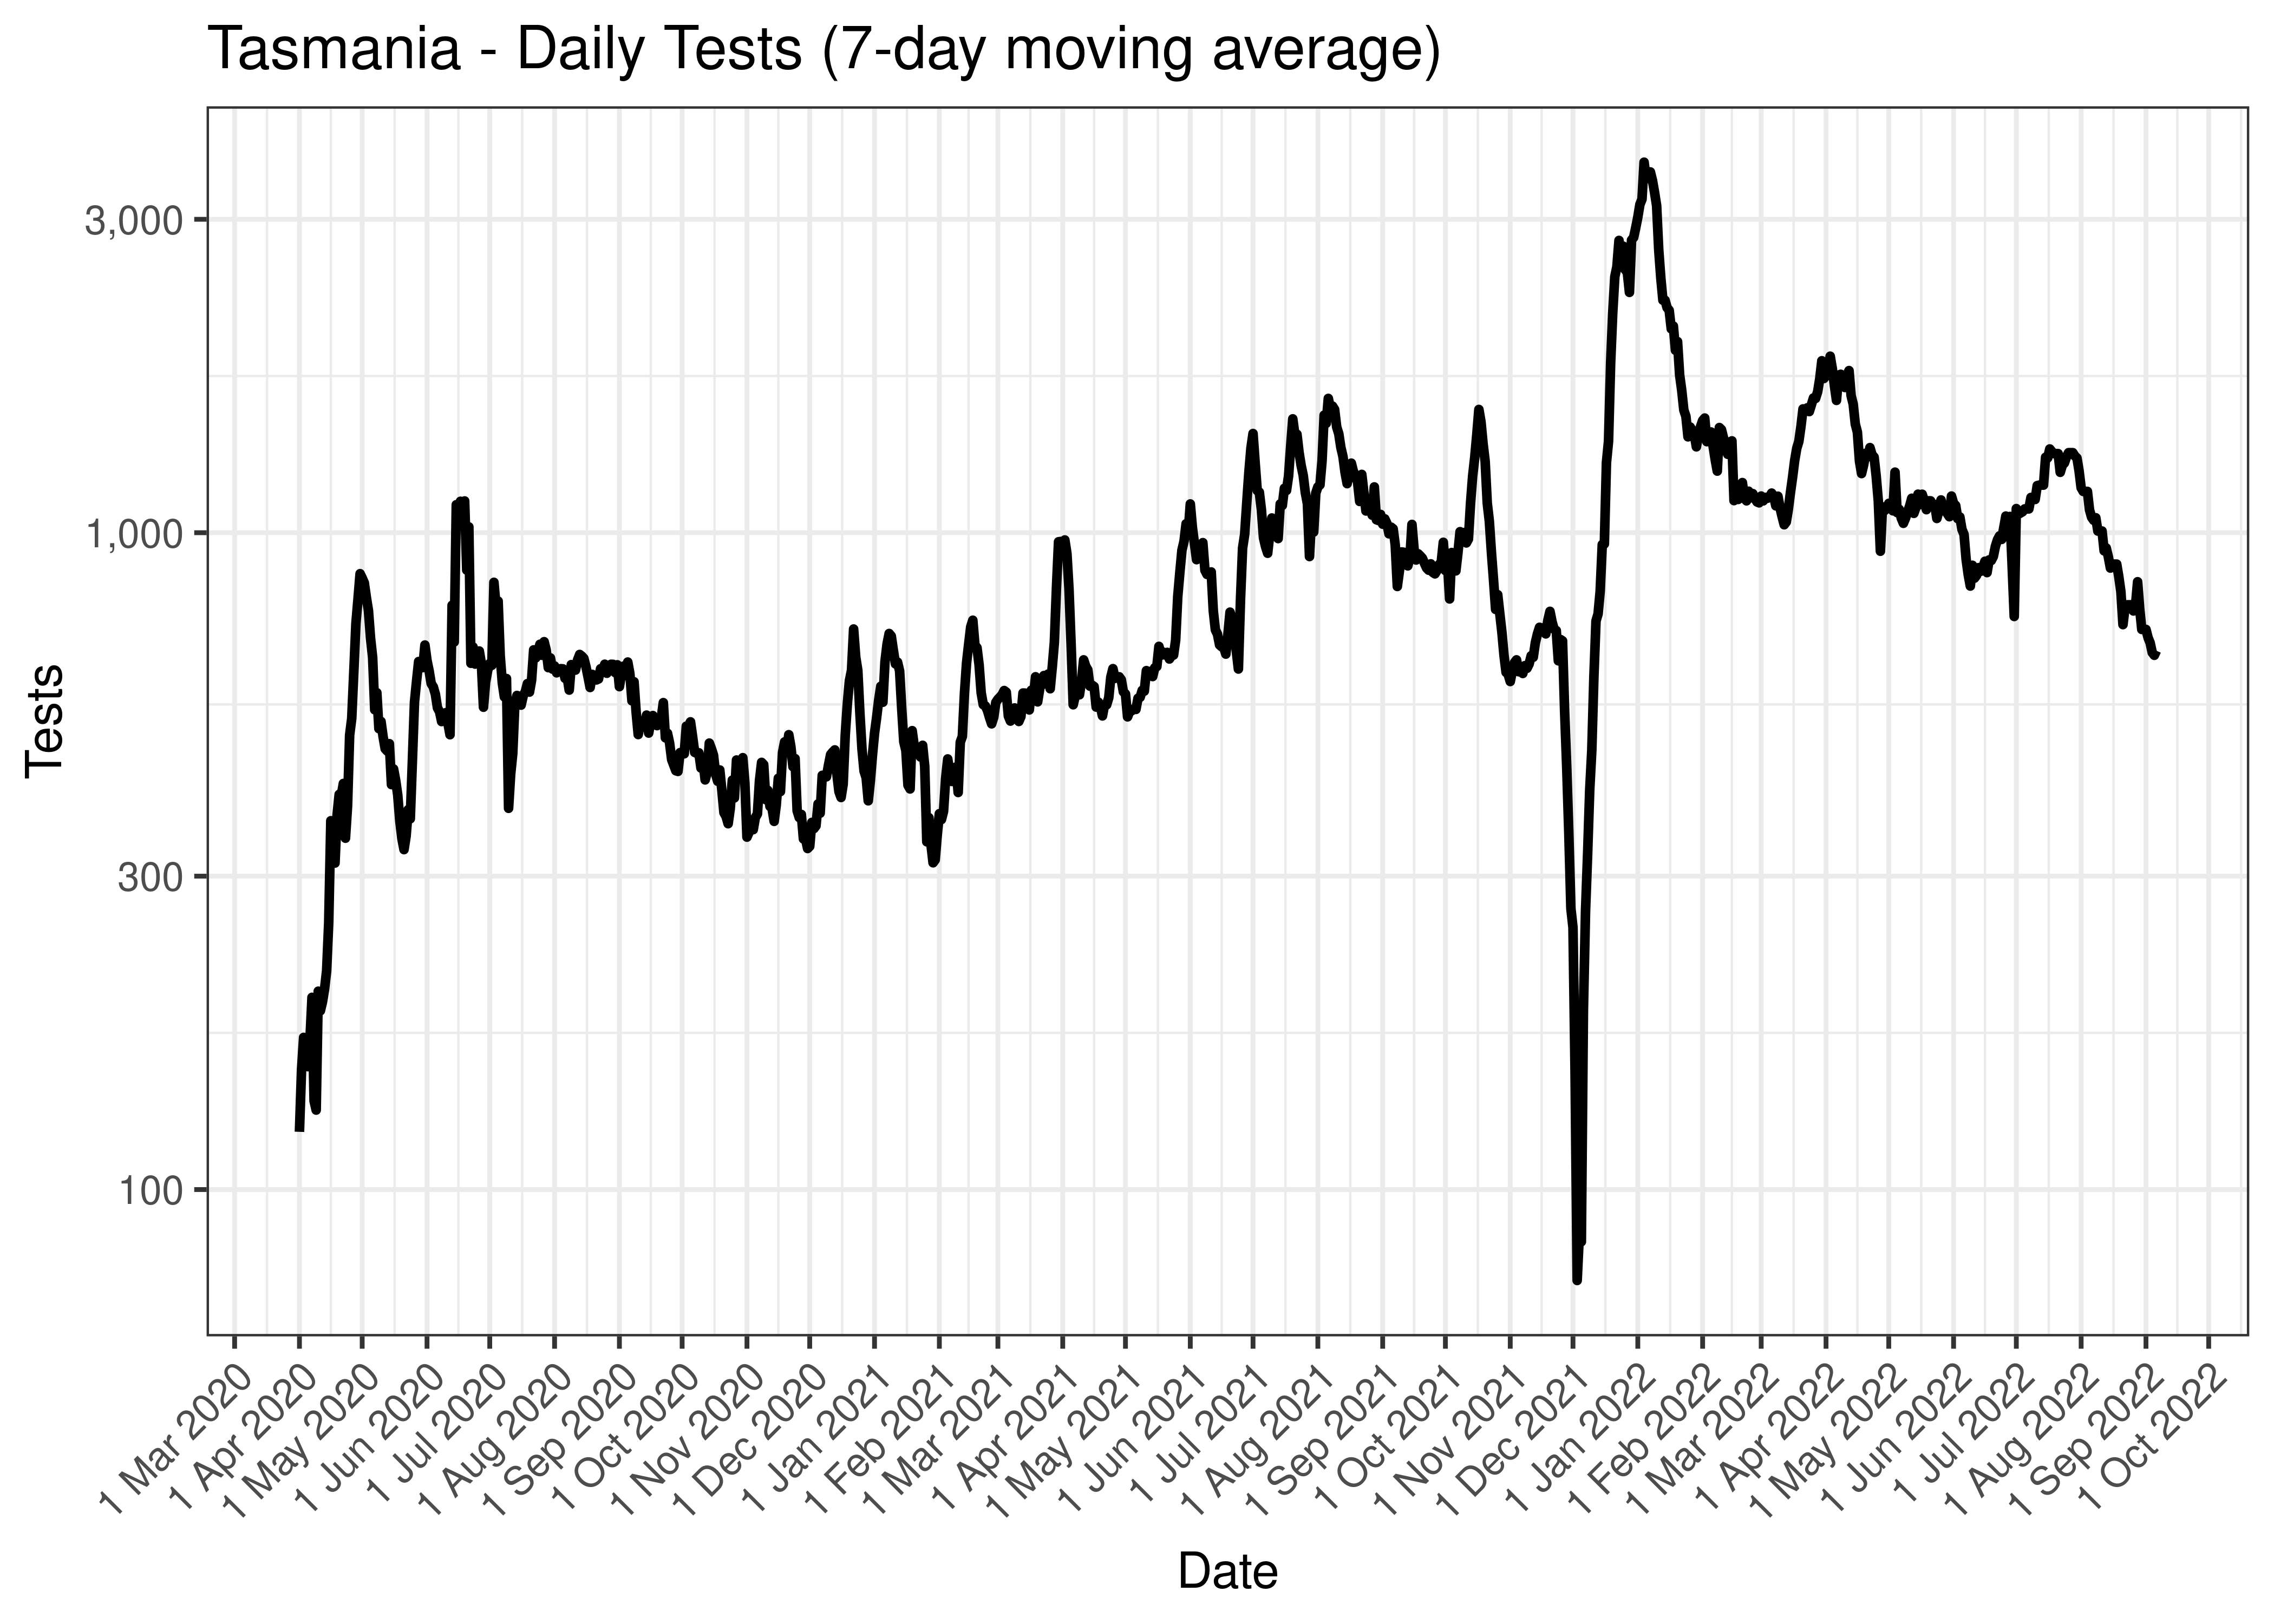
Tasmania - Daily Tests (7-day moving average)
The above chart is repeated below covering the last 30 days only.
Tasmania - Daily Tests for Last 30 Days (7-day moving average)
5.7.2 Cases
Cases are tabulated by specimen received date below. Cases include estimates for late reporting in recent days as well as adjustments for any public holidays. A centred 7-day moving average is also shown. The peak daily cases in previous waves (as measured by the moving average) is also shown.
| Date | Cases | 7-day Moving Average | Comment |
|---|---|---|---|
| 2022-02-18 | 628 | 3,340 | Wave 4 Peak (to date) |
| 2023-02-03 | 317 | 45 | |
| 2023-02-04 | 0 | 45 | |
| 2023-02-05 | 0 | 45 | |
| 2023-02-06 | 0 | 45 | |
| 2023-02-07 | 0 | 51 | |
| 2023-02-08 | 0 | NA | |
| 2023-02-09 | 0 | NA | |
| 2023-02-10 | 359 | NA |
Below a 7-day moving average daily case count is plotted for Tasmania on a log scale since start of the epidemic:
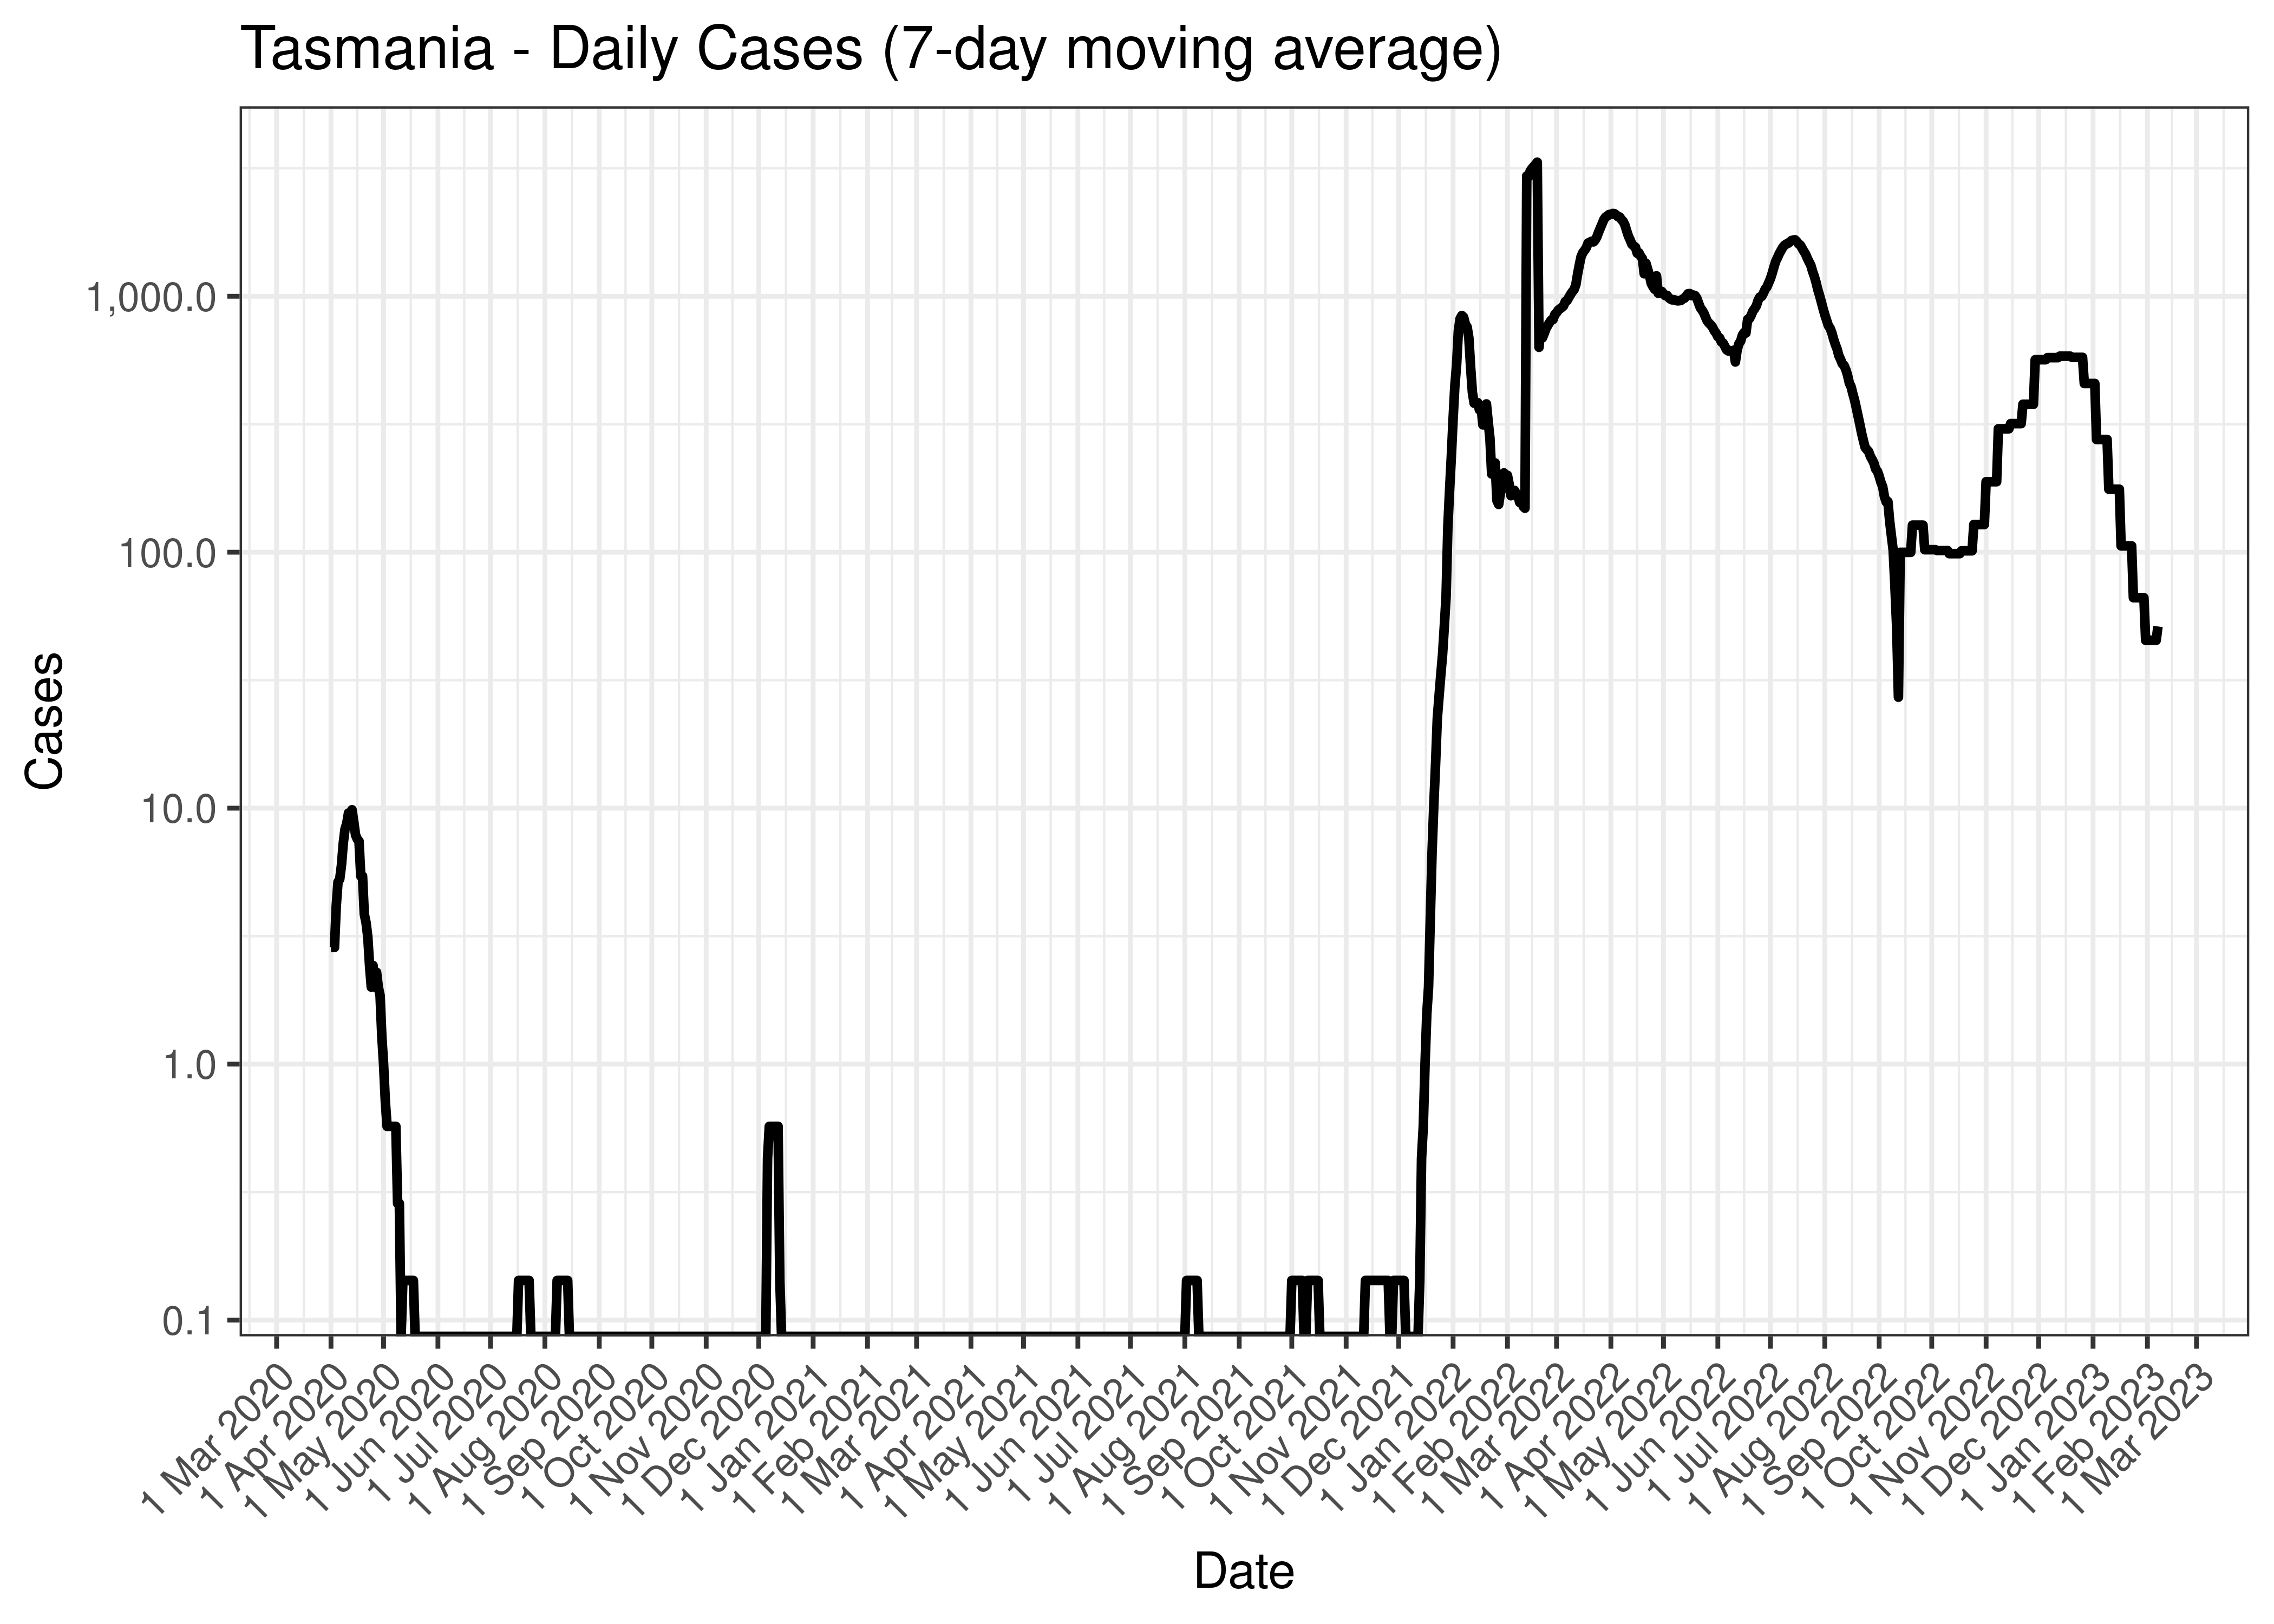
Tasmania - Daily Cases (7-day moving average)
Below the above chart is repeated for the last 30-days:
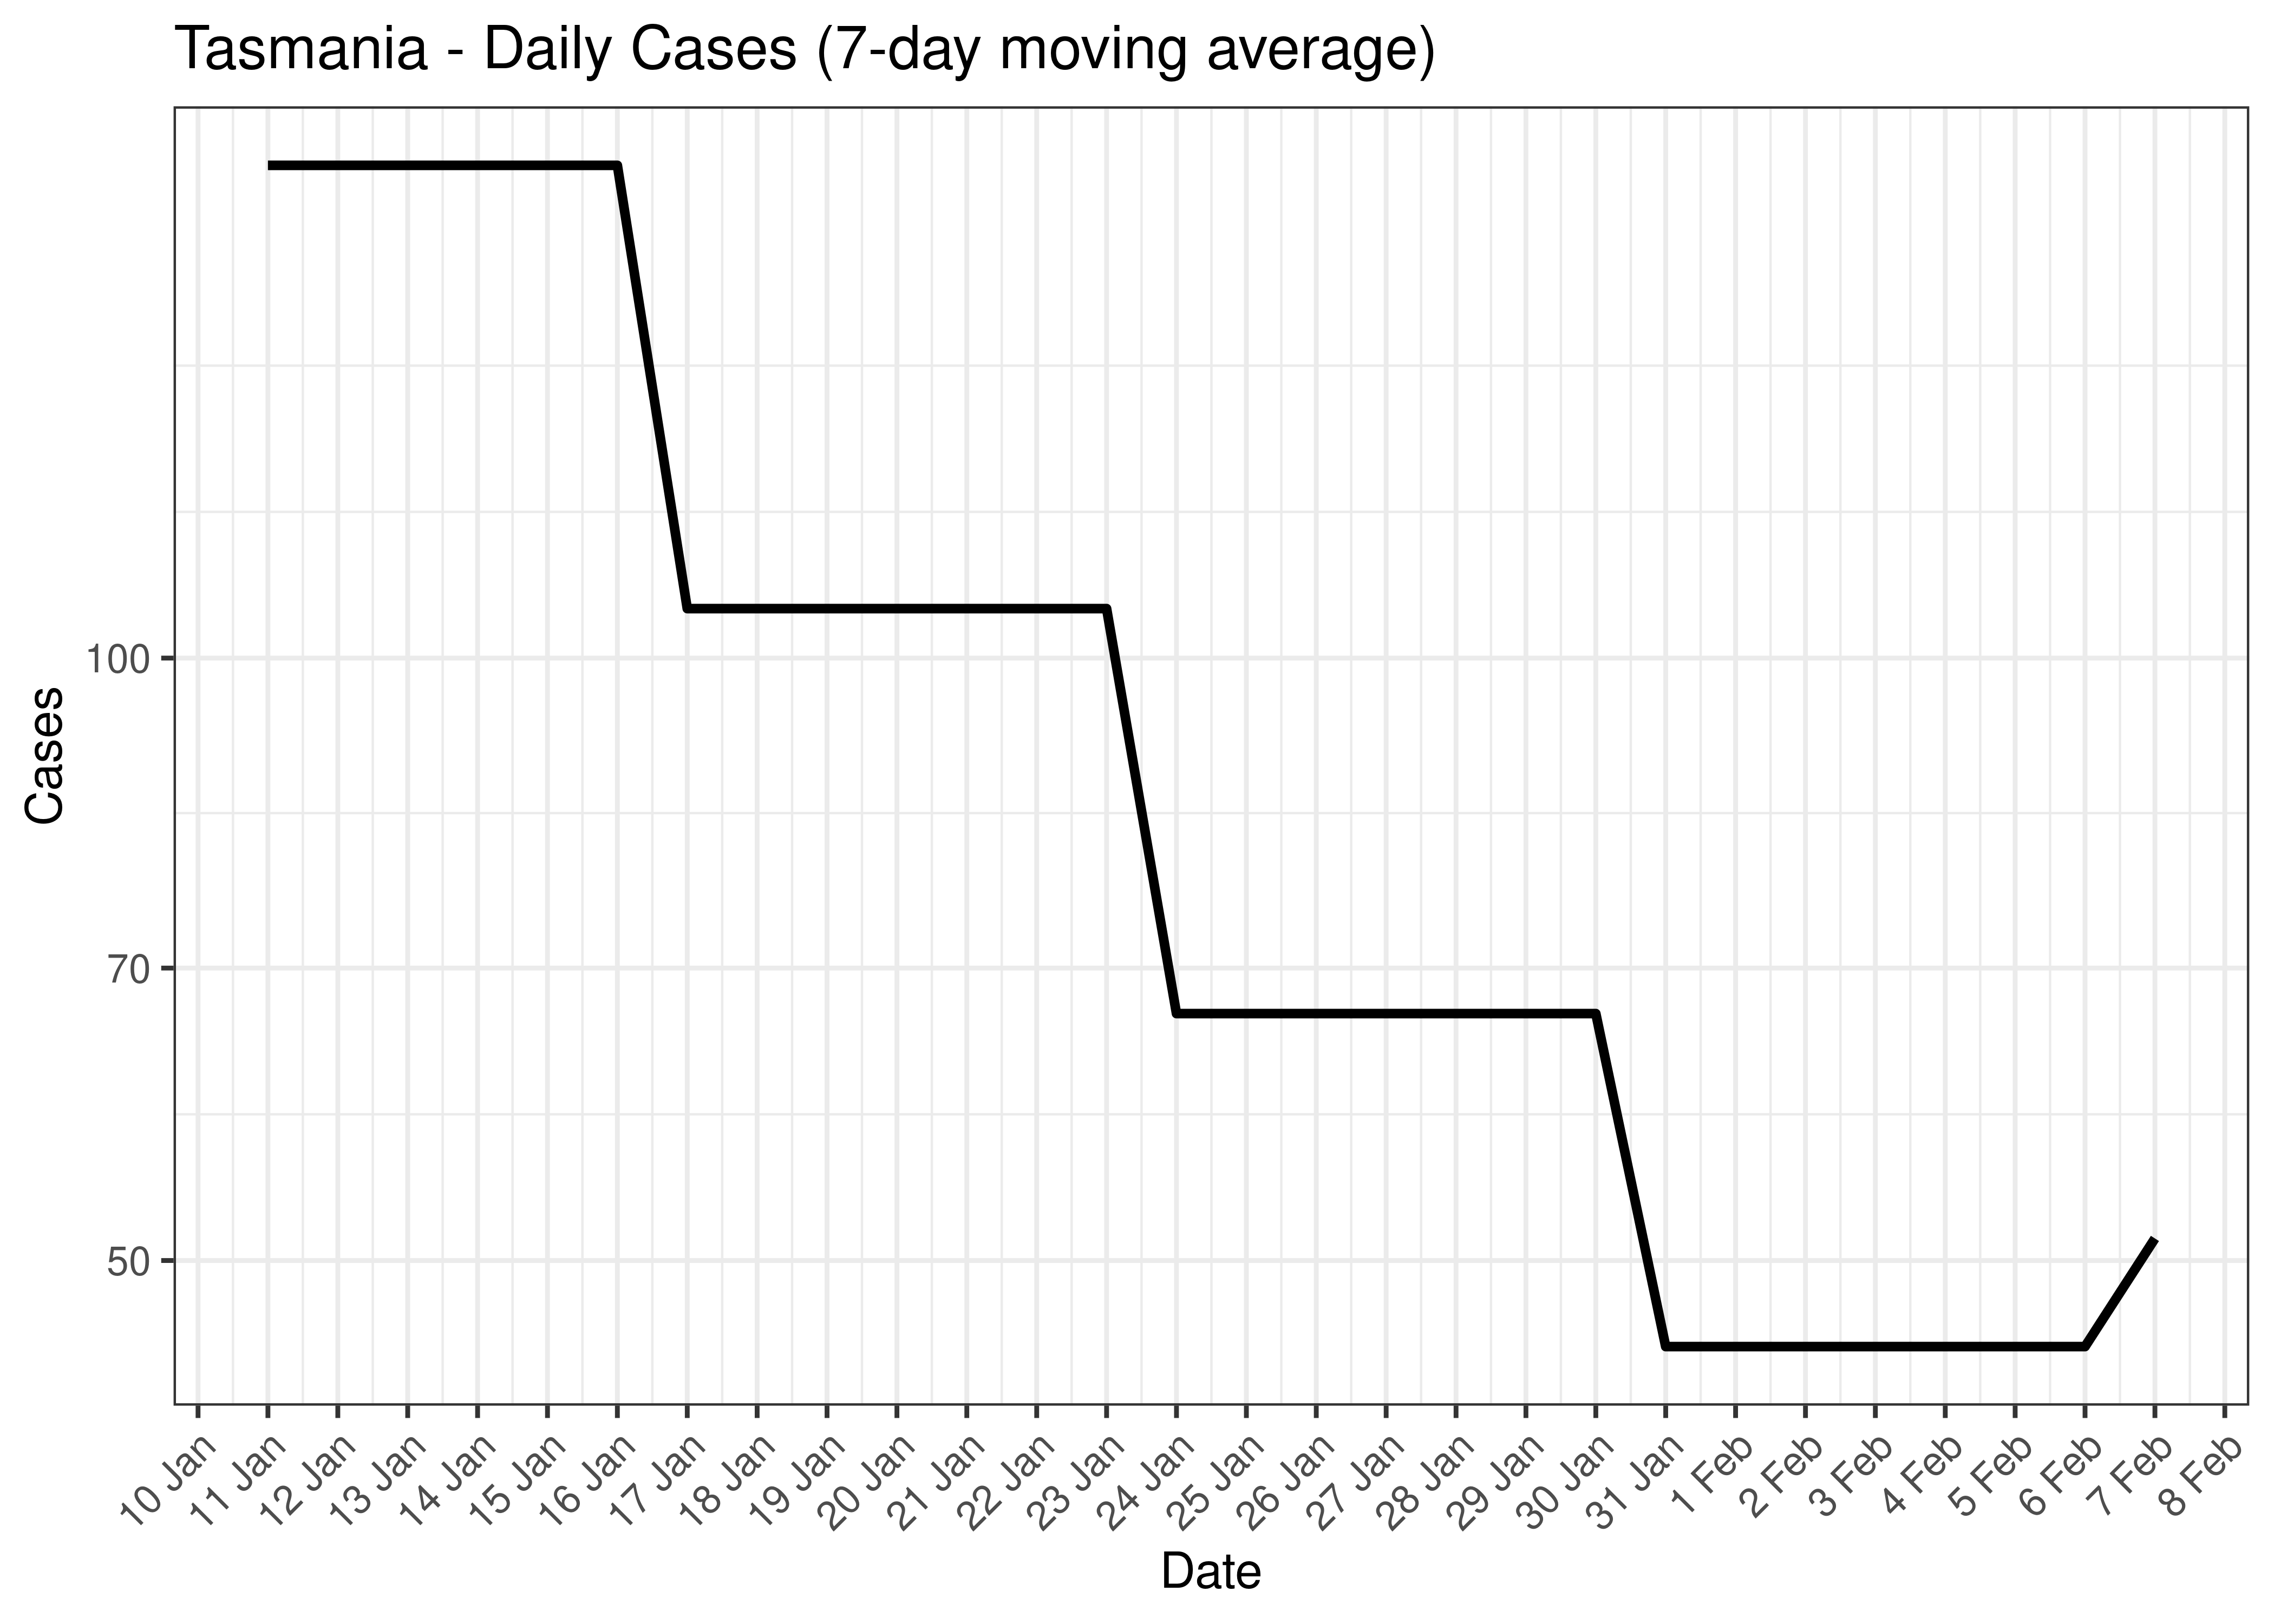
Tasmania - Daily Cases for Last 30-days (7-day moving average)
5.7.3 Hospitlisation
Counts of those in hospital are tabulated by report date below. A centred 7-day moving average is also shown. The peak daily admissions in previous waves (as measured by the moving average) is also shown.
| Date | In Hospital | 7-day Moving Average | Comment |
|---|---|---|---|
| 2020-04-20 | 19 | 17 | Wave 1 Peak |
| 2020-04-21 | 17 | 17 | Wave 1 Peak |
| 2022-07-22 | 172 | 179 | Wave 4 Peak (to date) |
| 2023-02-03 | 0 | 0 | |
| 2023-02-04 | 0 | 0 | |
| 2023-02-05 | 0 | 0 | |
| 2023-02-06 | 0 | 0 | |
| 2023-02-07 | 0 | NA | |
| 2023-02-08 | 0 | NA | |
| 2023-02-09 | 0 | NA | |
| 2023-02-10 | NA | NA |
The above are based on the following dates:
- Wave 1 started on 2020-01-01.
- Wave 2 started on 2020-06-01.
- Wave 3 started on 2021-06-01.
- Wave 4 started on 2021-12-01.
Below a 7-day moving average of daily hospital counts is plotted by on a log scale since start of the epidemic. Note admissions are plotted by date.
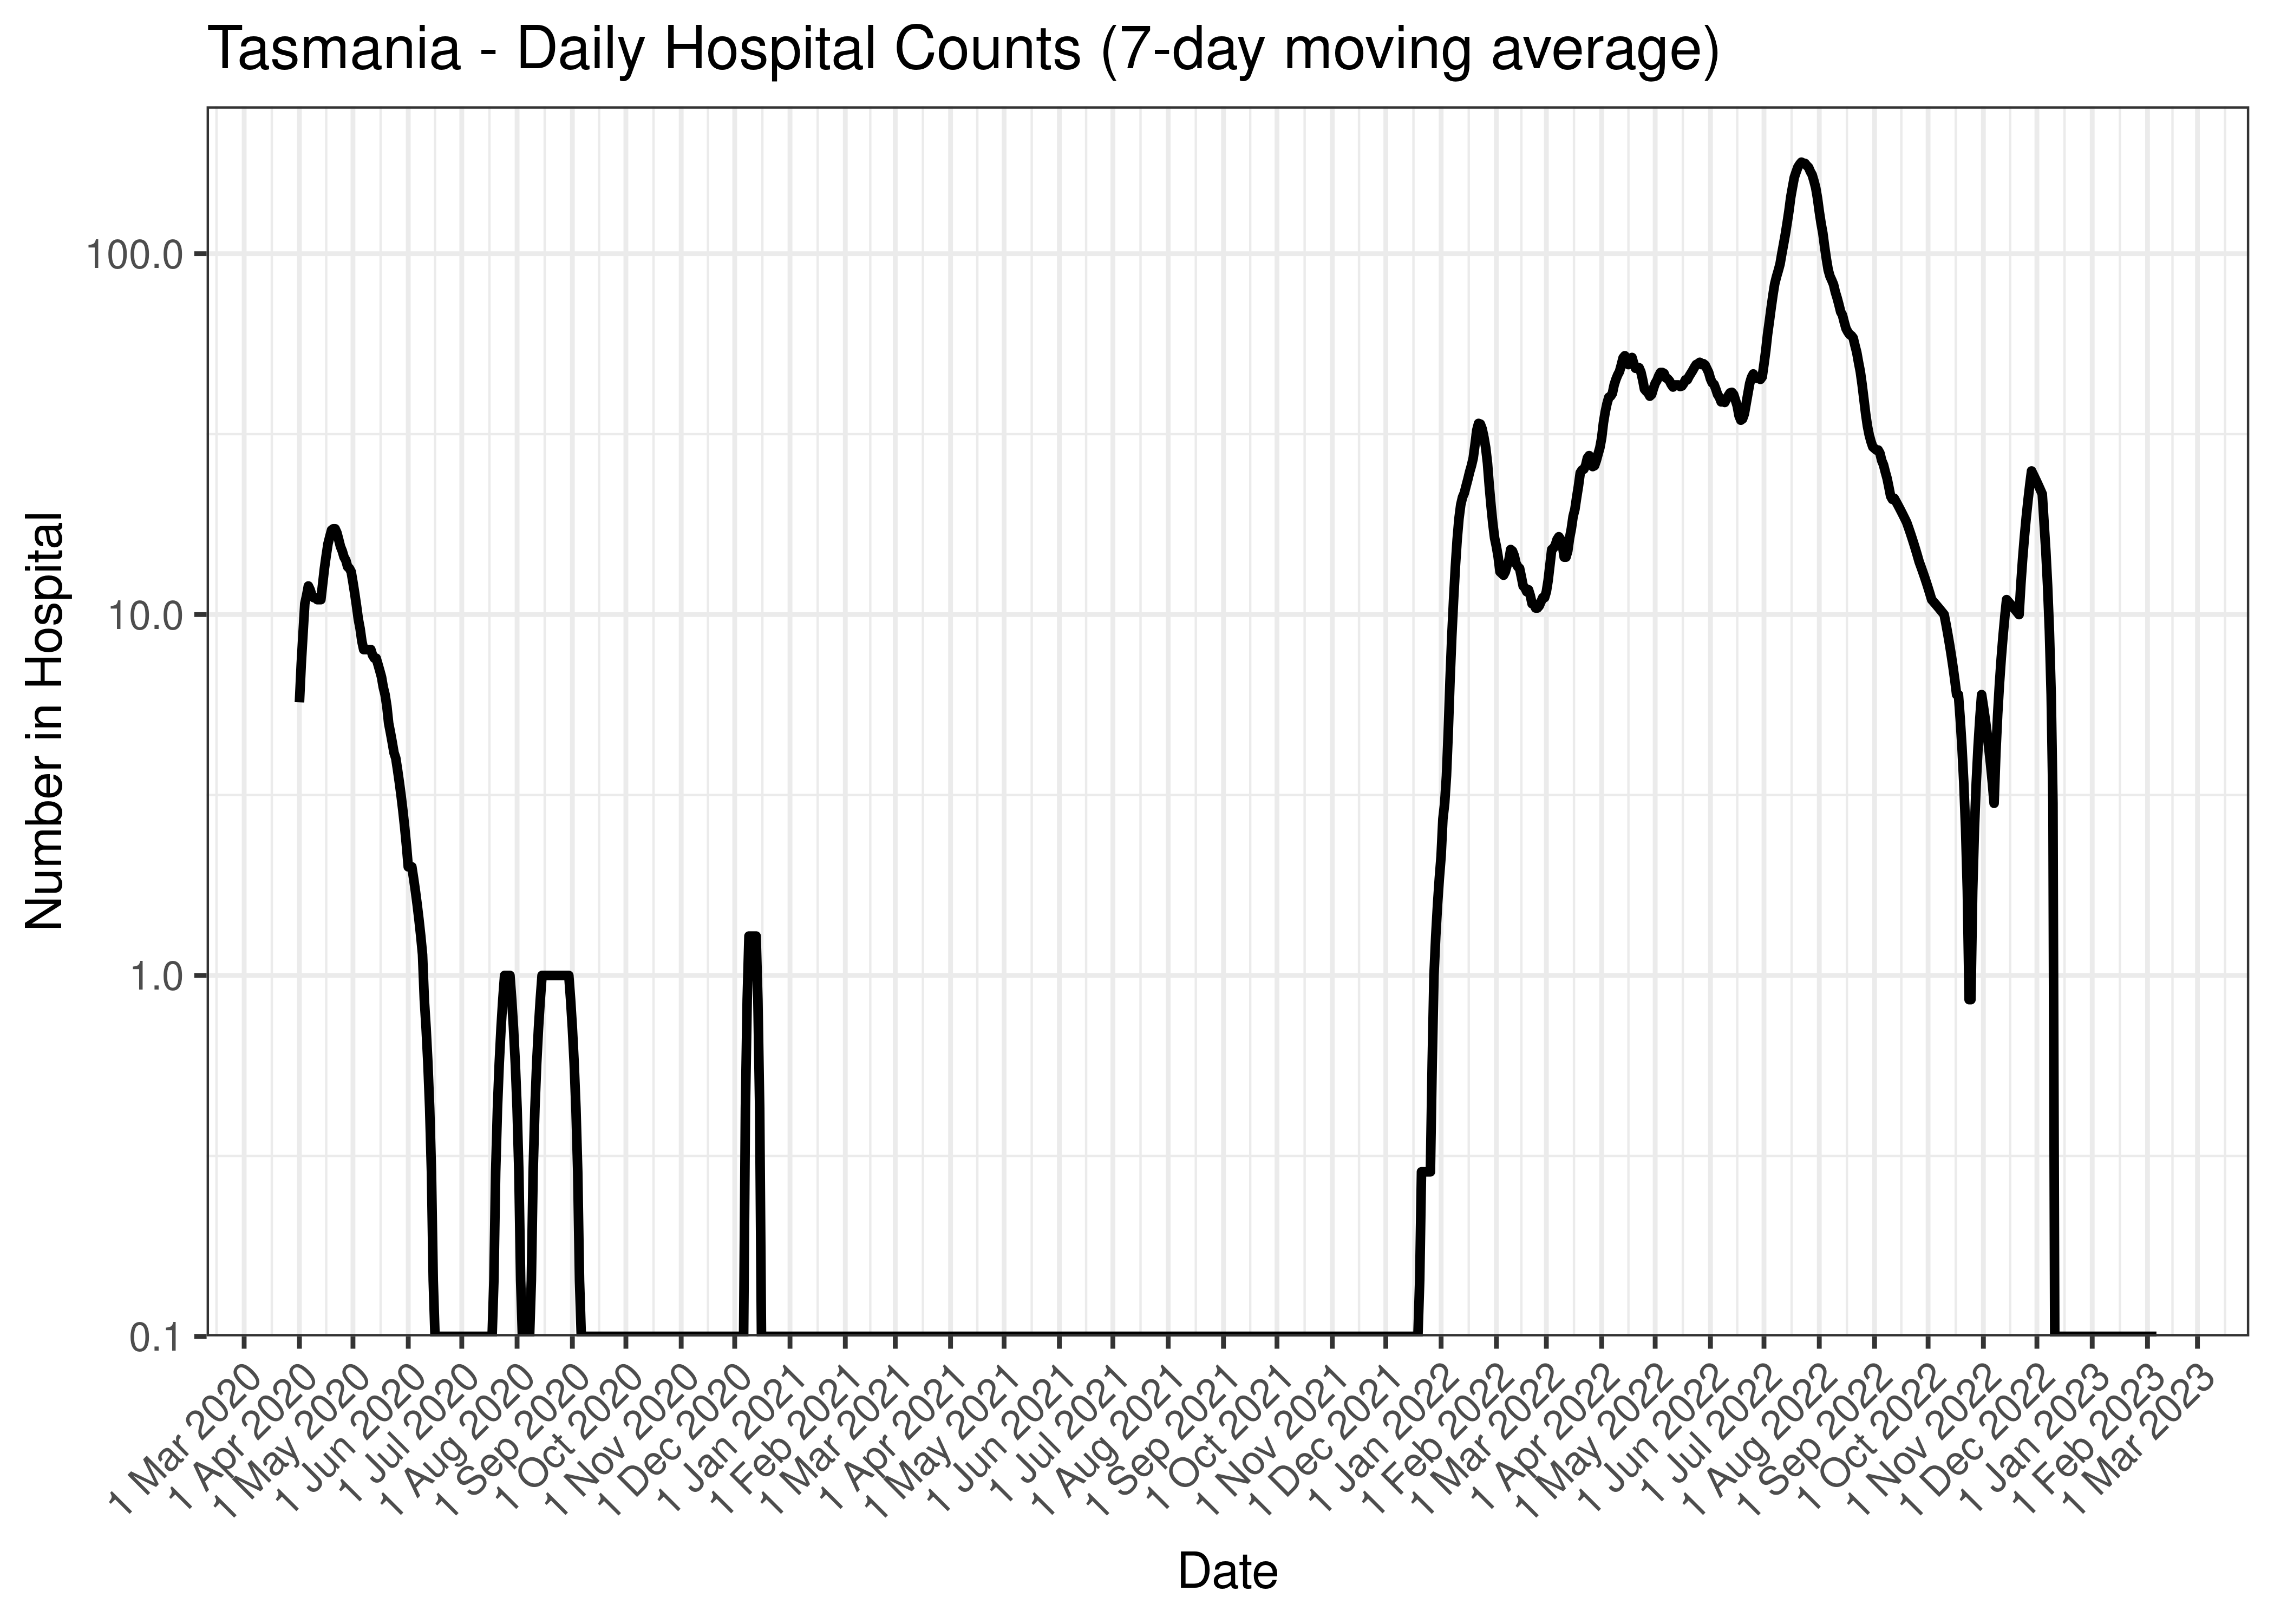
Tasmania - Daily Hospital Counts (7-day moving average)
Below the above chart is repeated for the last 30-days:
Tasmania - Daily Hospital Counts for Last 30-days (7-day moving average)
5.7.4 ICU
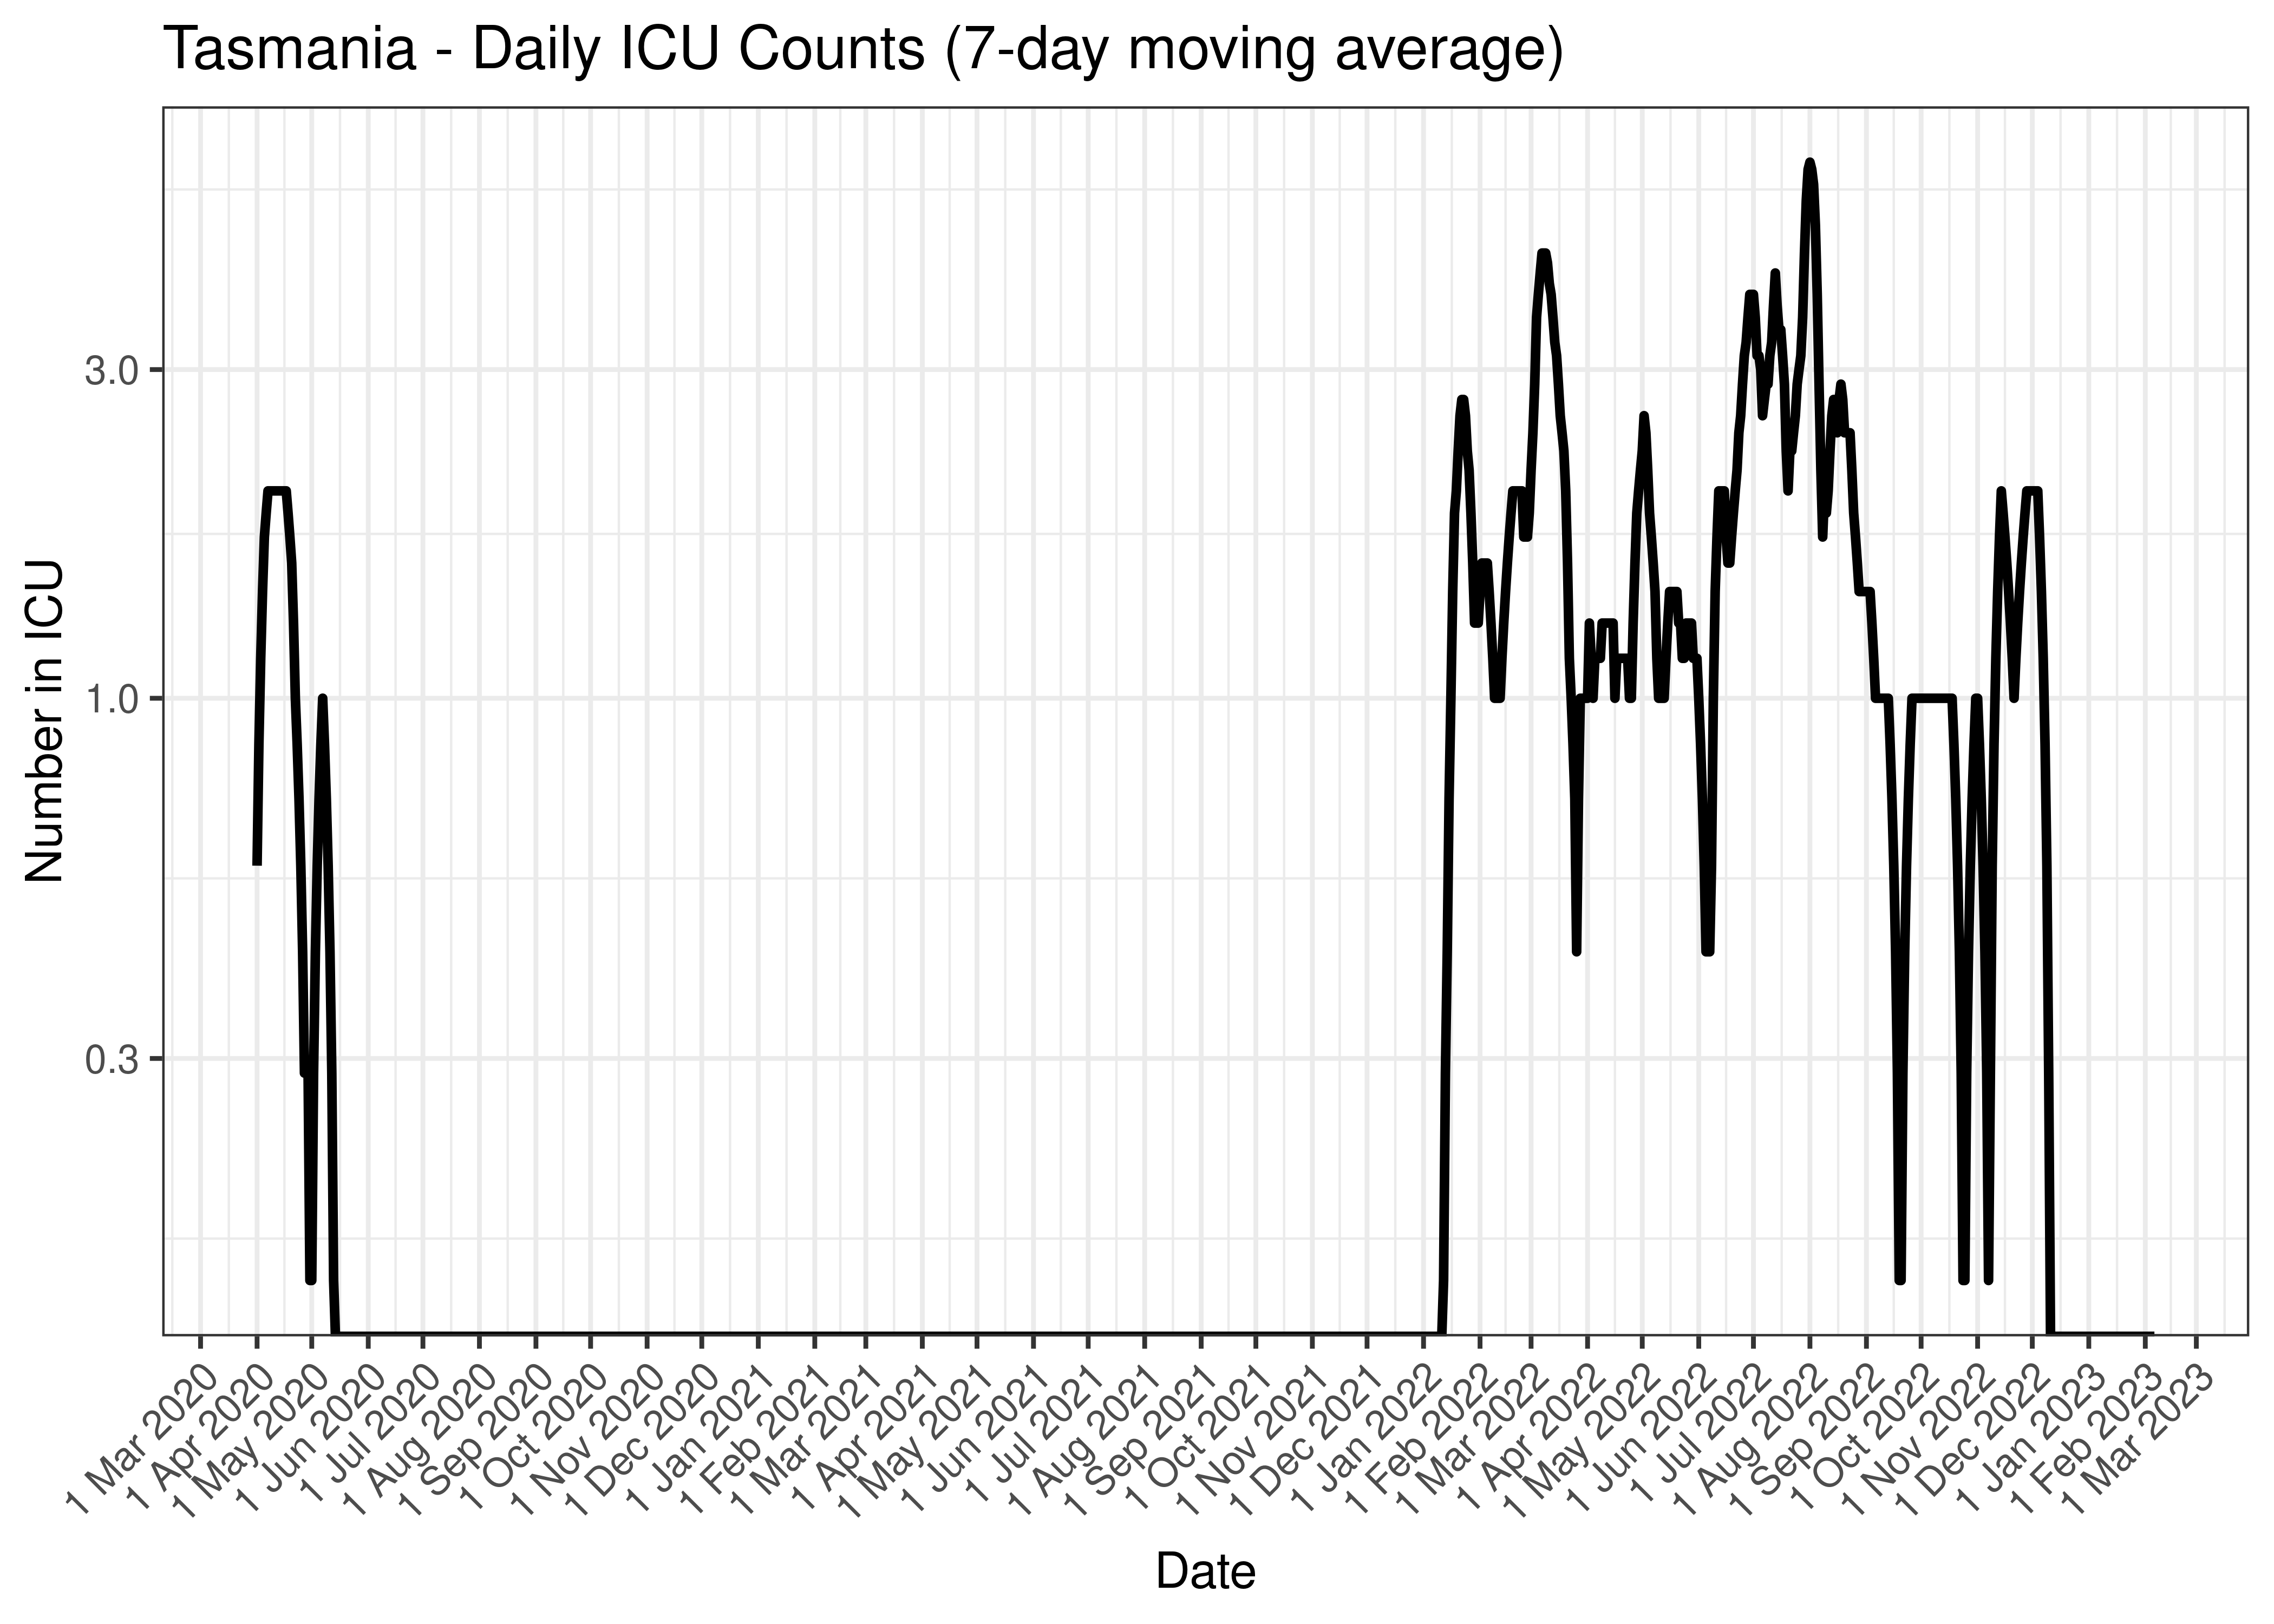
Counts of those in ICU are tabulated by report date below. A centred 7-day moving average is also shown. The peak daily admissions in previous waves (as measured by the moving average) is also shown.
| Date | In ICU | 7-day Moving Average | Comment |
|---|---|---|---|
| 2023-02-03 | 0 | 0 | |
| 2023-02-04 | 0 | 0 | |
| 2023-02-05 | 0 | 0 | |
| 2023-02-06 | 0 | 0 | |
| 2023-02-07 | 0 | NA | |
| 2023-02-08 | 0 | NA | |
| 2023-02-09 | 0 | NA | |
| 2023-02-10 | NA | NA |
The above are based on the following dates:
- Wave 1 started on 2020-01-01.
- Wave 2 started on 2020-06-01.
- Wave 3 started on 2021-06-01.
- Wave 4 started on 2021-12-01.
Below a 7-day moving average of daily ICU counts is plotted by on a log scale since start of the epidemic. Note admissions are plotted by date.
Tasmania - Daily ICU Counts (7-day moving average)
Below the above chart is repeated for the last 30-days:
Tasmania - Daily ICU Counts for Last 30-days (7-day moving average)
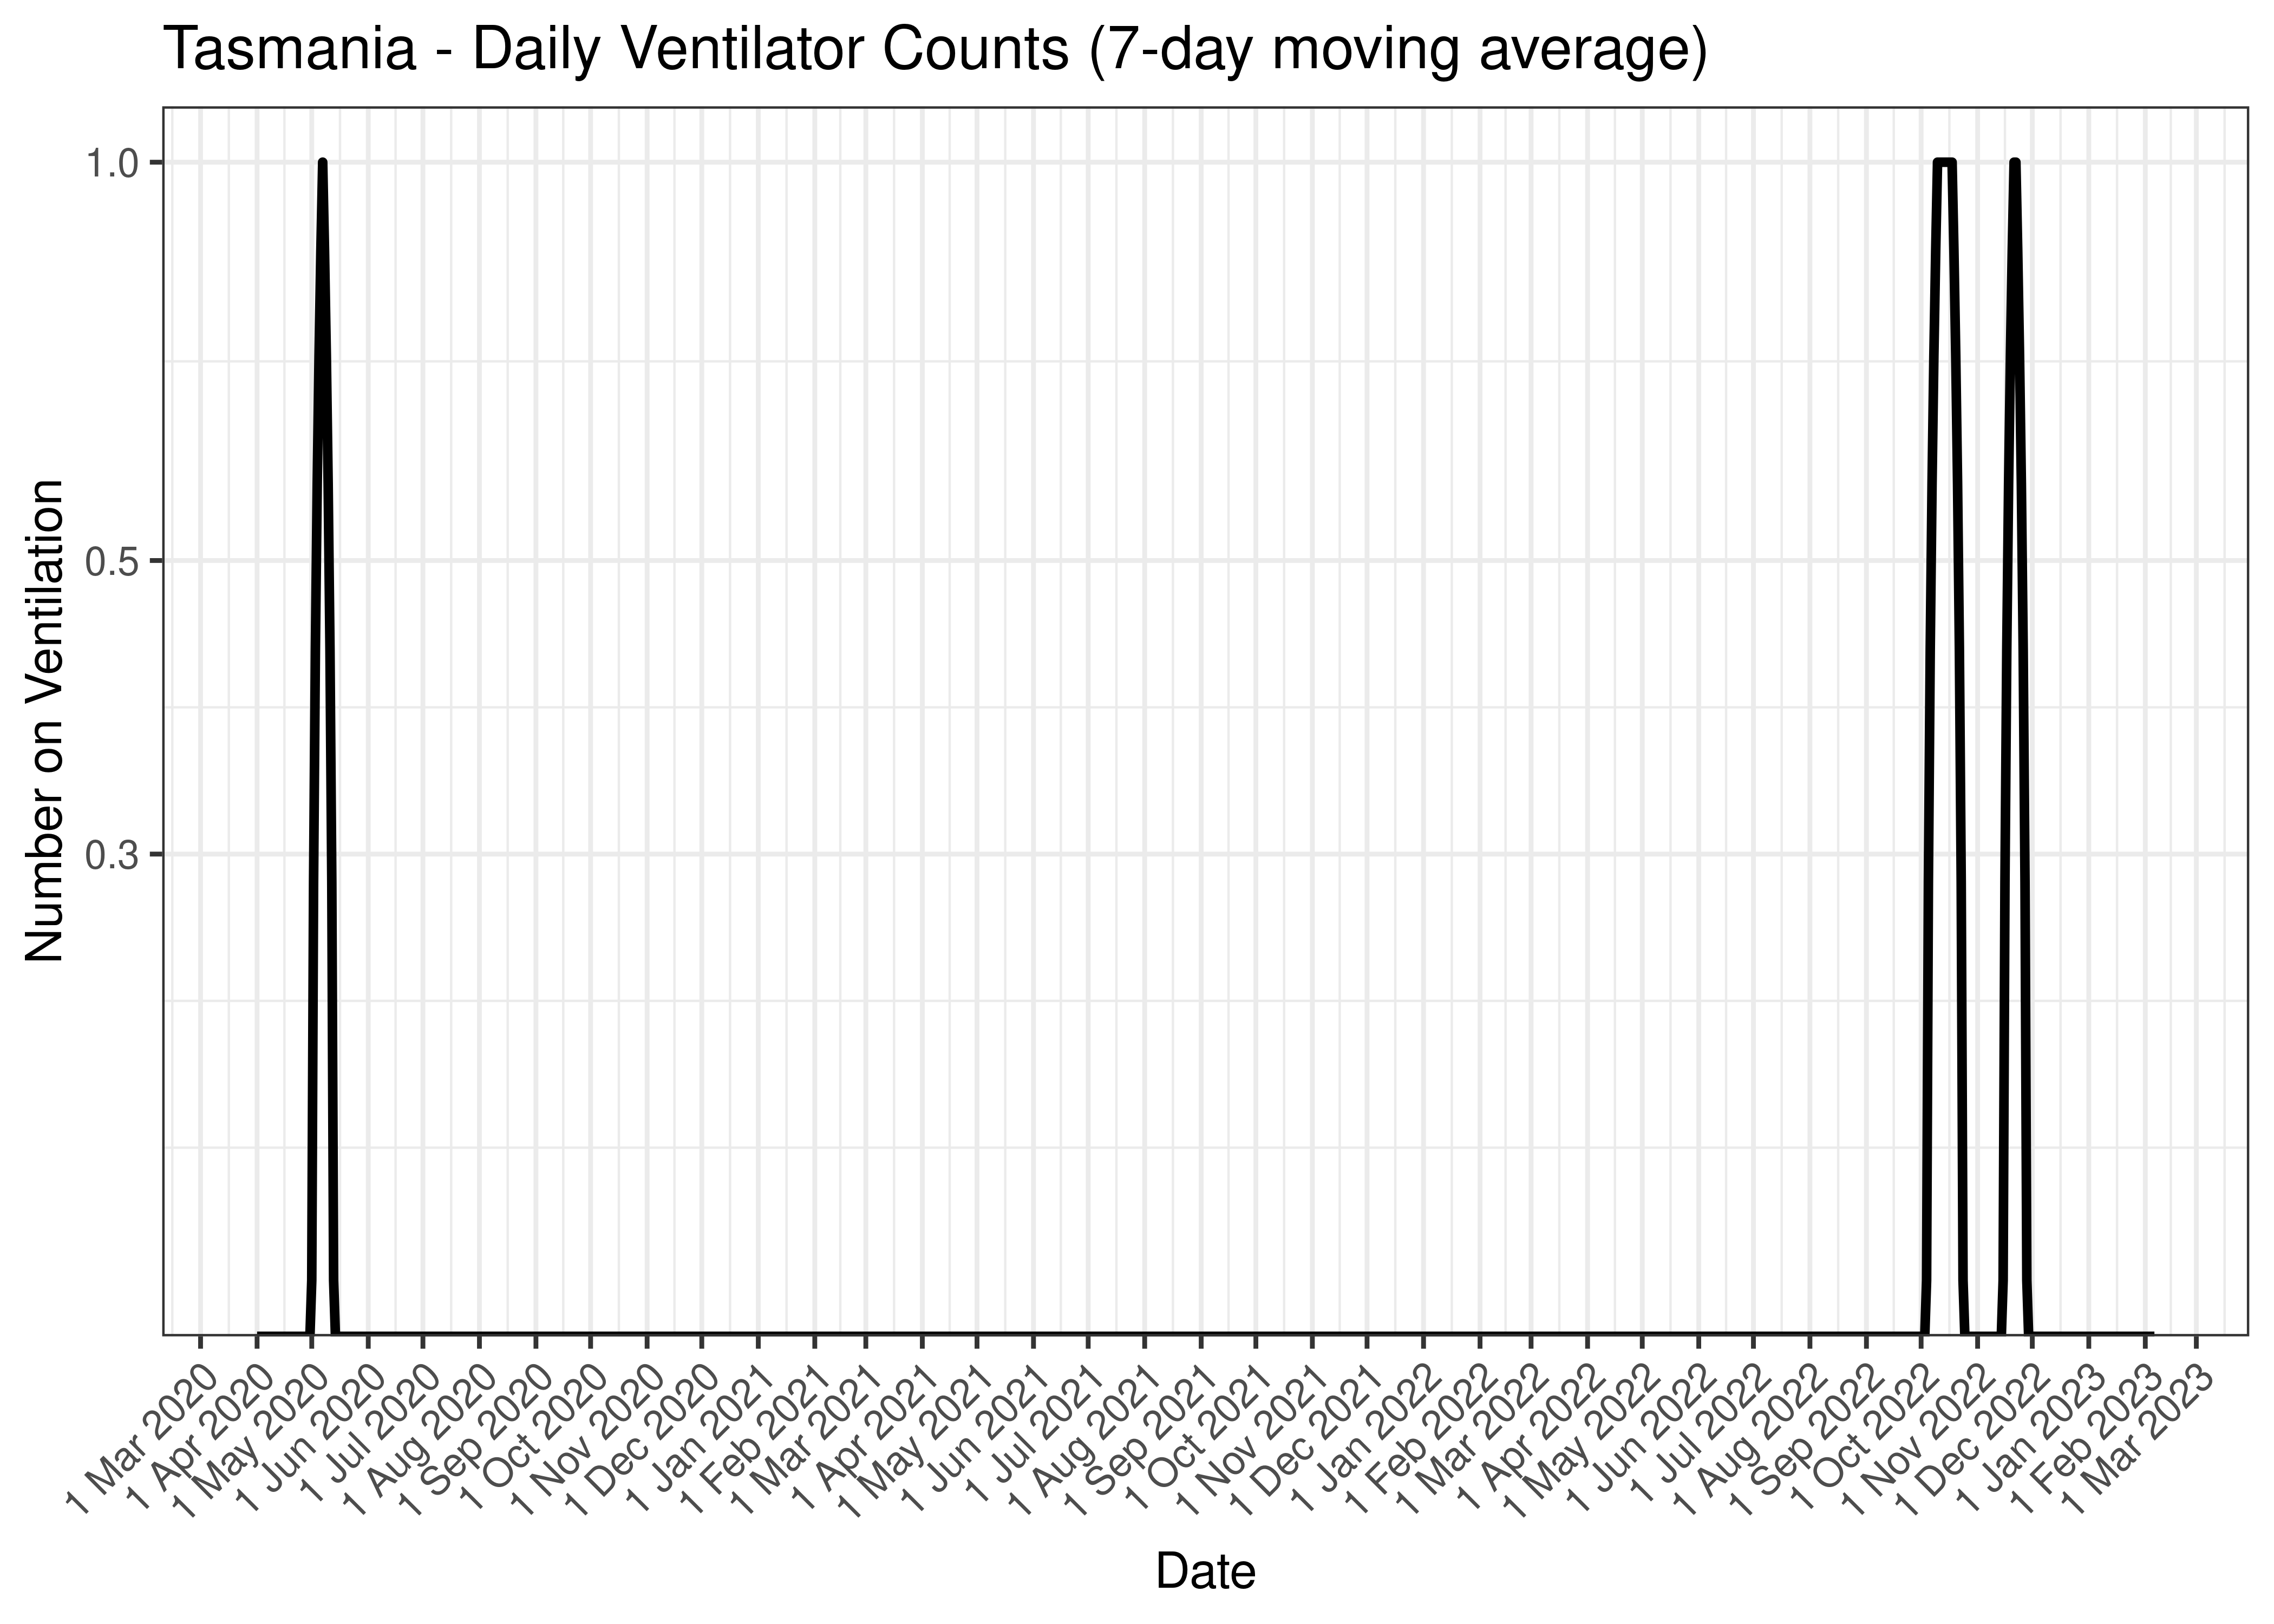
5.7.5 Ventilator
Counts of those on ventilators are tabulated by report date below. A centred 7-day moving average is also shown. The peak daily admissions in previous waves (as measured by the moving average) is also shown.
| Date | On Ventilators | 7-day Moving Average | Comment |
|---|---|---|---|
| 2023-02-03 | 0 | 0 | |
| 2023-02-04 | 0 | 0 | |
| 2023-02-05 | 0 | 0 | |
| 2023-02-06 | 0 | 0 | |
| 2023-02-07 | 0 | NA | |
| 2023-02-08 | 0 | NA | |
| 2023-02-09 | 0 | NA | |
| 2023-02-10 | NA | NA |
The above are based on the following dates:
- Wave 1 started on 2020-01-01.
- Wave 2 started on 2020-06-01.
- Wave 3 started on 2021-06-01.
- Wave 4 started on 2021-12-01.
Below a 7-day moving average of daily ventilator counts is plotted by on a log scale since start of the epidemic. Note admissions are plotted by date.
Tasmania - Daily Ventilator Counts (7-day moving average)
Below the above chart is repeated for the last 30-days:
Tasmania - Daily Ventilator Counts for Last 30-days (7-day moving average)
5.7.6 Deaths
Deaths are tabulated by report date below. A centred 7-day moving average is also shown. The peak daily deaths in previous waves (as measured by the moving average) is also shown.
| Date | Deaths | 7-day Moving Average | Comment |
|---|---|---|---|
| 2023-02-03 | 3 | 0 | |
| 2023-02-04 | 0 | 0 | |
| 2023-02-05 | 0 | 0 | |
| 2023-02-06 | 0 | 0 | |
| 2023-02-07 | 0 | 0 | |
| 2023-02-08 | 0 | NA | |
| 2023-02-09 | 0 | NA | |
| 2023-02-10 | 0 | NA |
The above are based on the following dates:
- Wave 1 started on 2020-01-01.
- Wave 2 started on 2020-06-01.
- Wave 3 started on 2021-06-01.
- Wave 4 started on 2021-12-01.
Below a 7-day moving average of daily deaths is plotted by on a log scale since start of the epidemic.
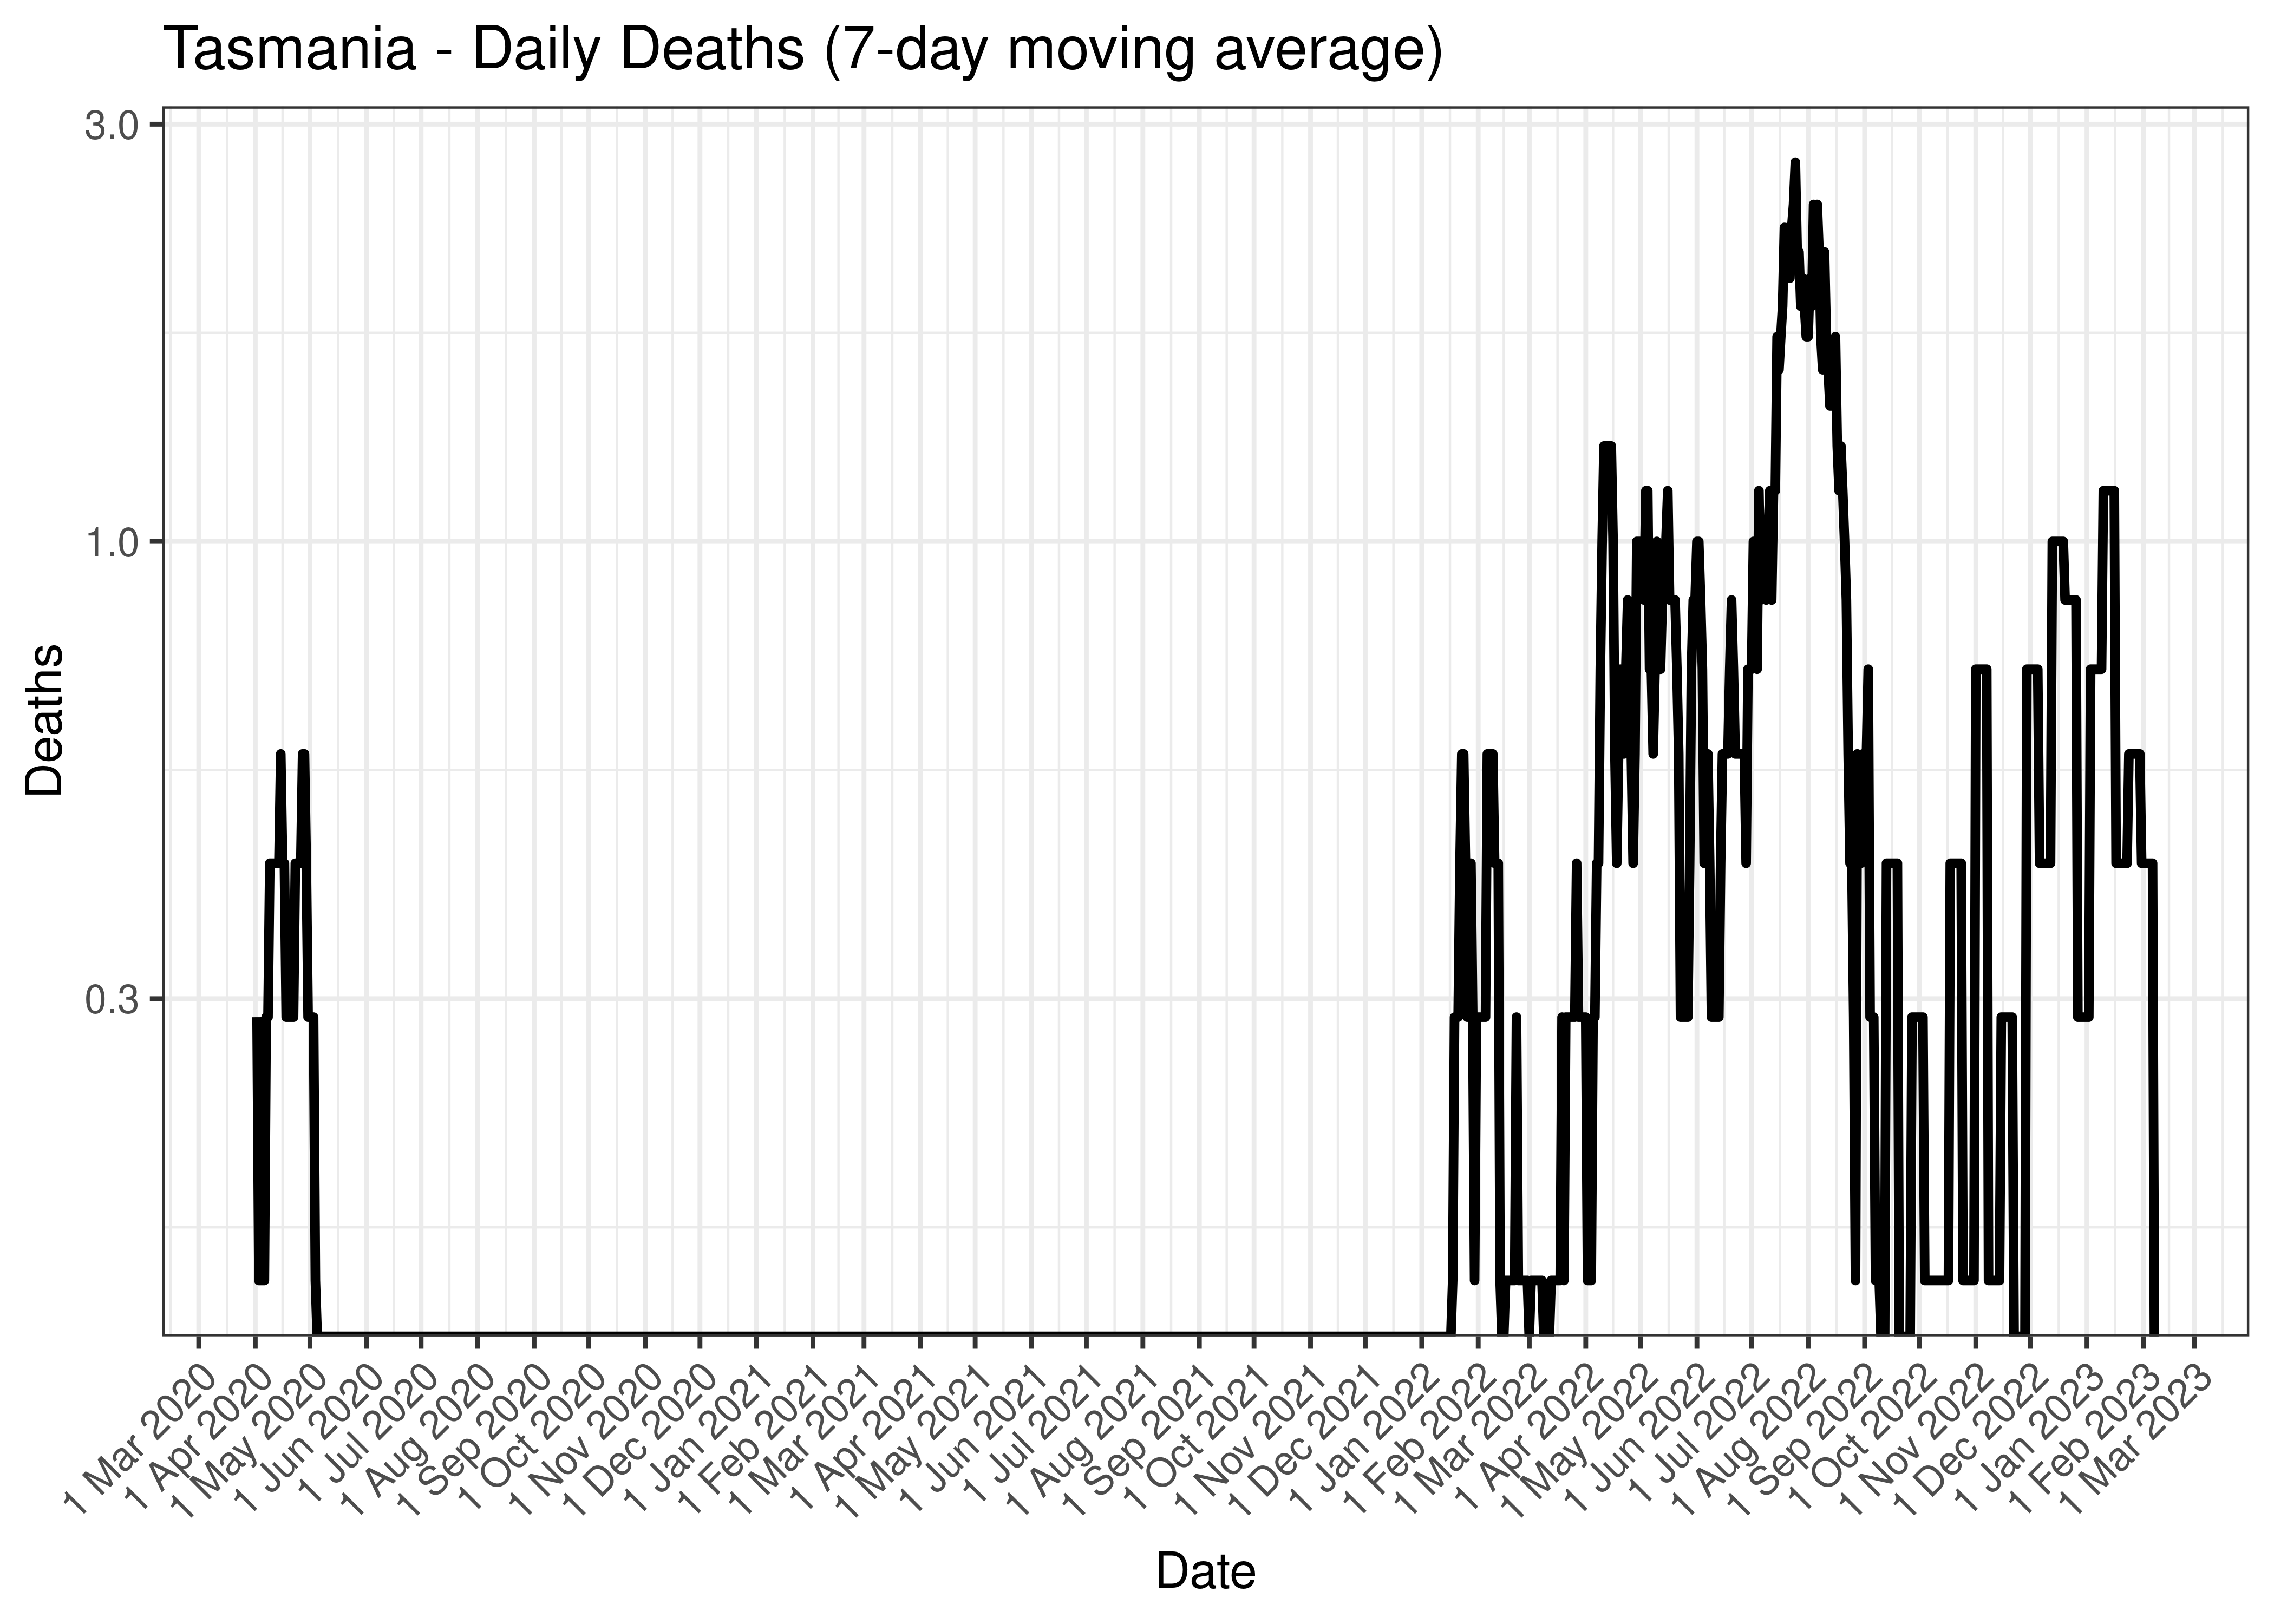
Tasmania - Daily Deaths (7-day moving average)
Below the above chart is repeated for the last 30-days:
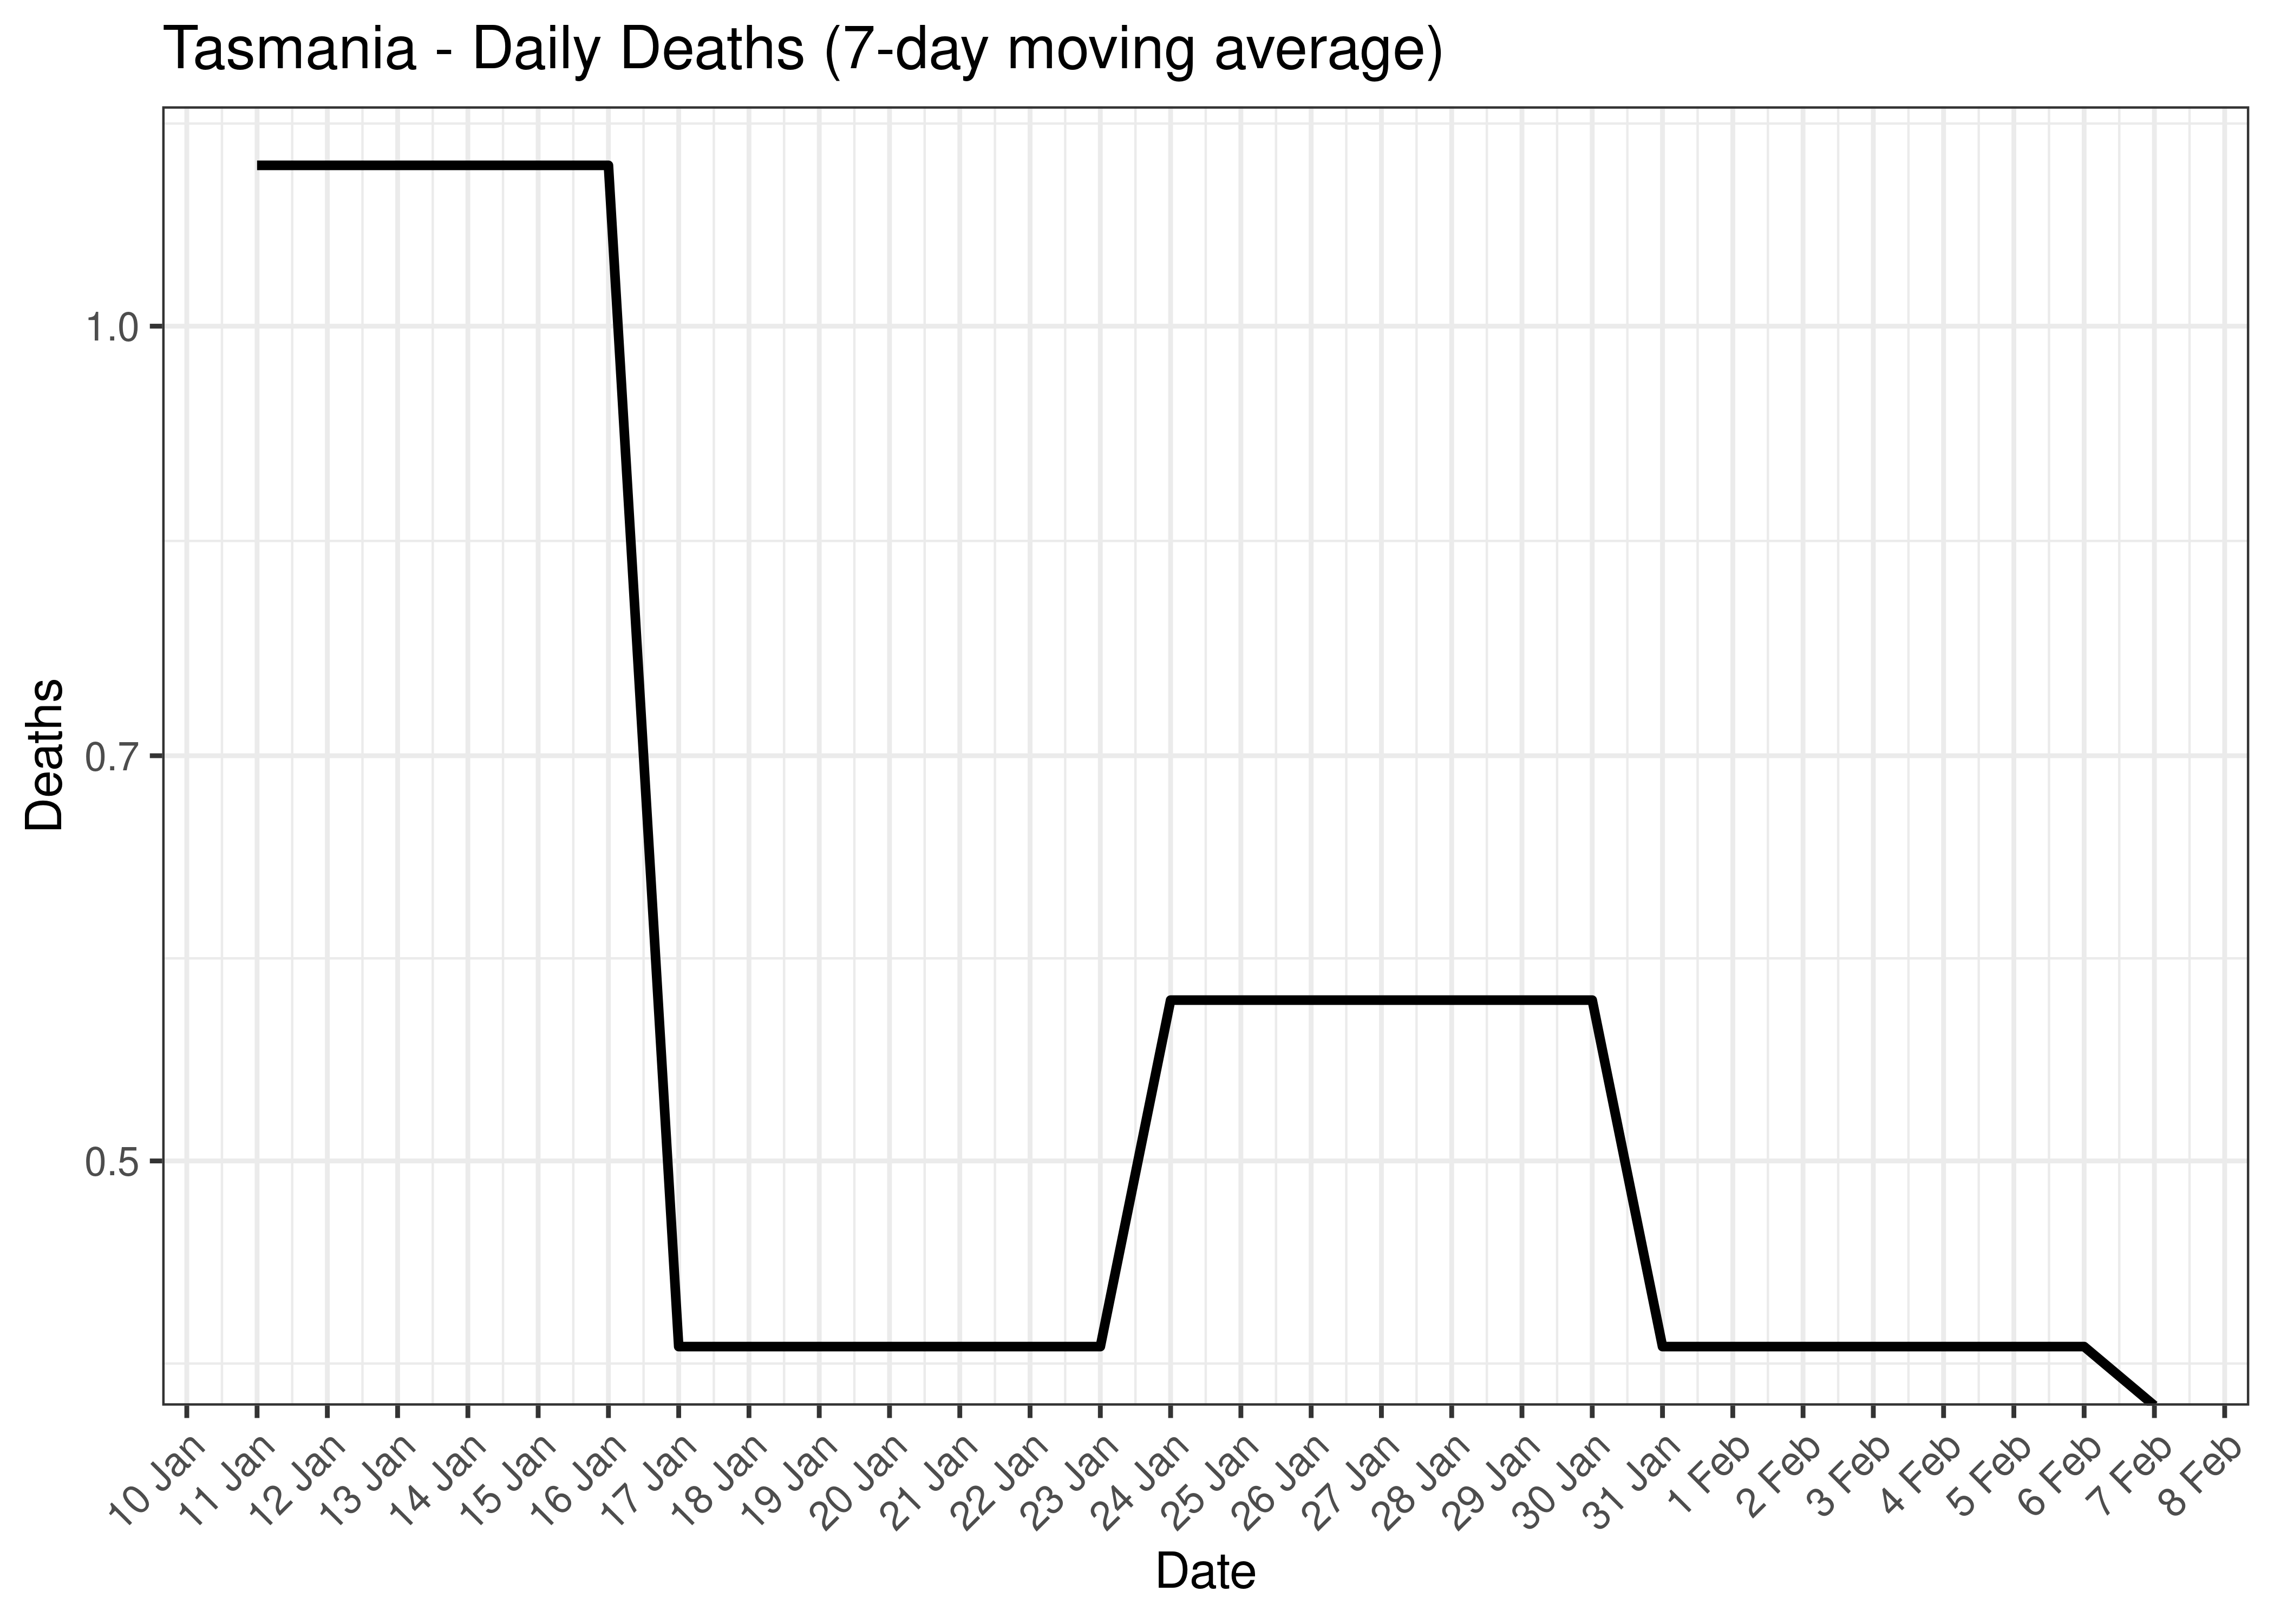
Tasmania - Daily Deaths for Last 30-days (7-day moving average)
5.7.7 Cases, Hospital Counts and Deaths Combined
Below a 7-day moving average daily case, hospital counts and deaths are plotted by state on a log scale since start of the epidemic. Note admissions and excess deaths are plotted by date, whereas cases are plotted by specimen received date.
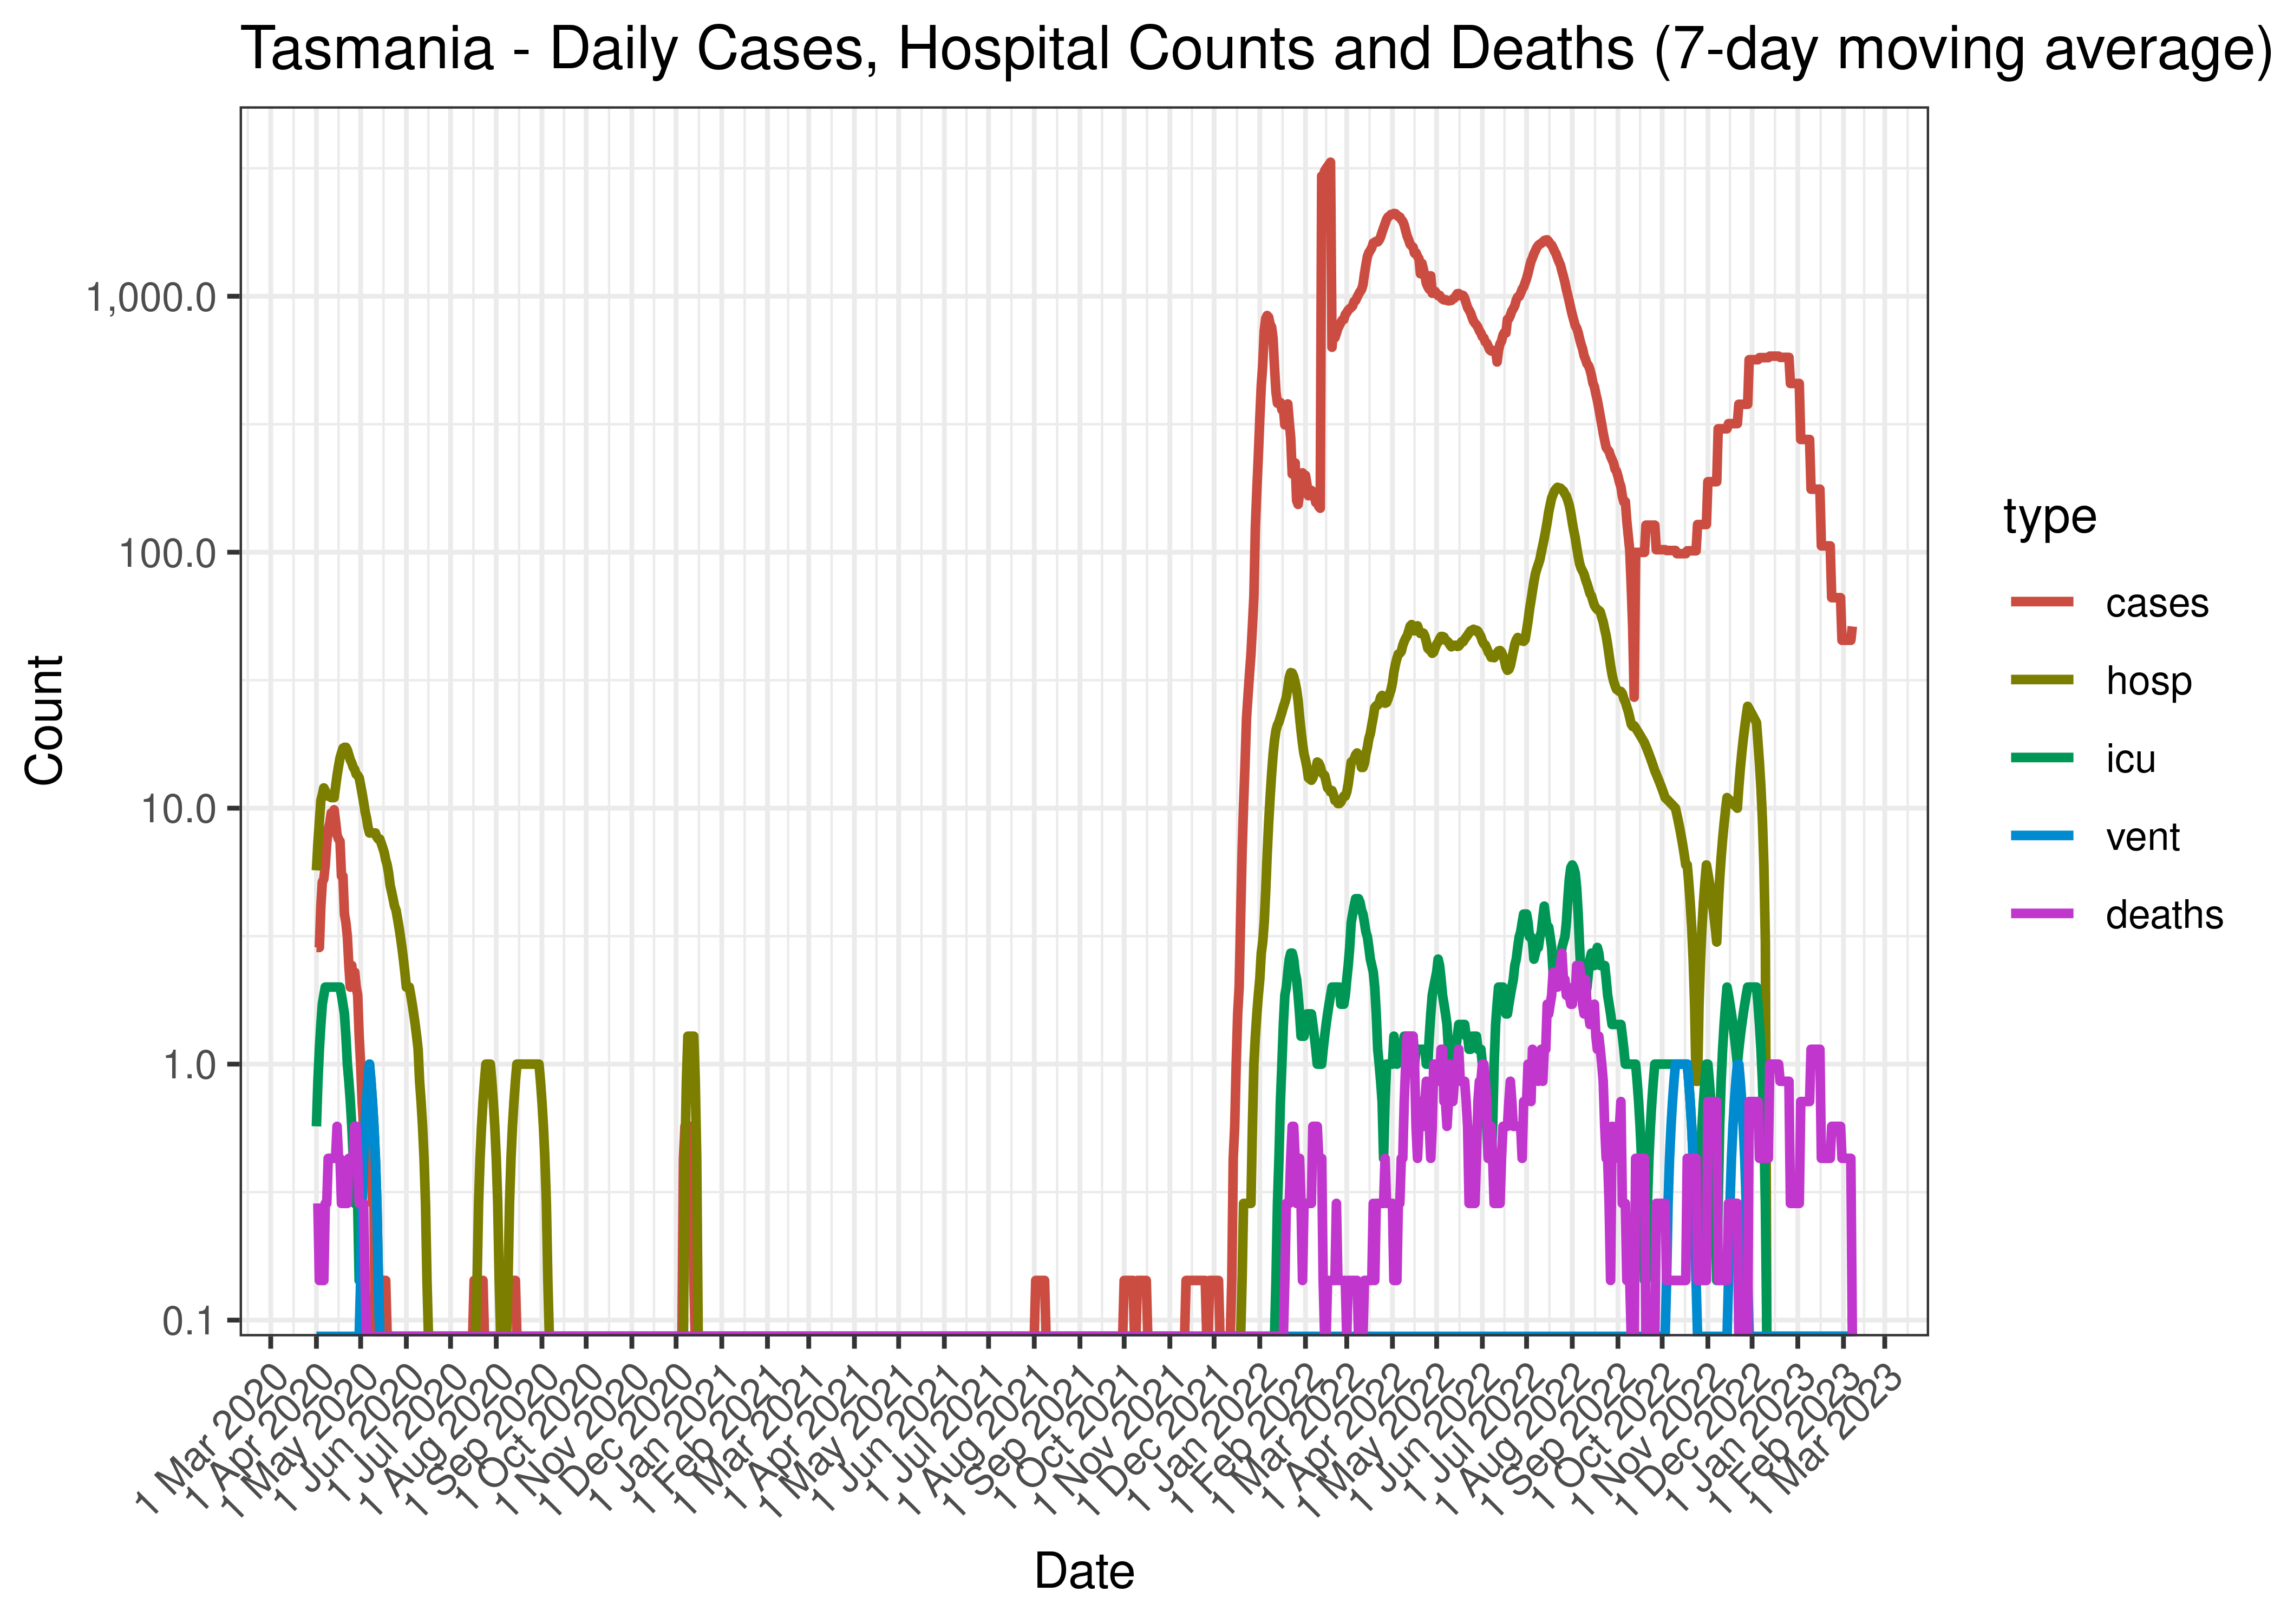
Tasmania - Daily Cases, Hospital Counts and Deaths (7-day moving average)
Below the above chart is repeated for the last 30-days:
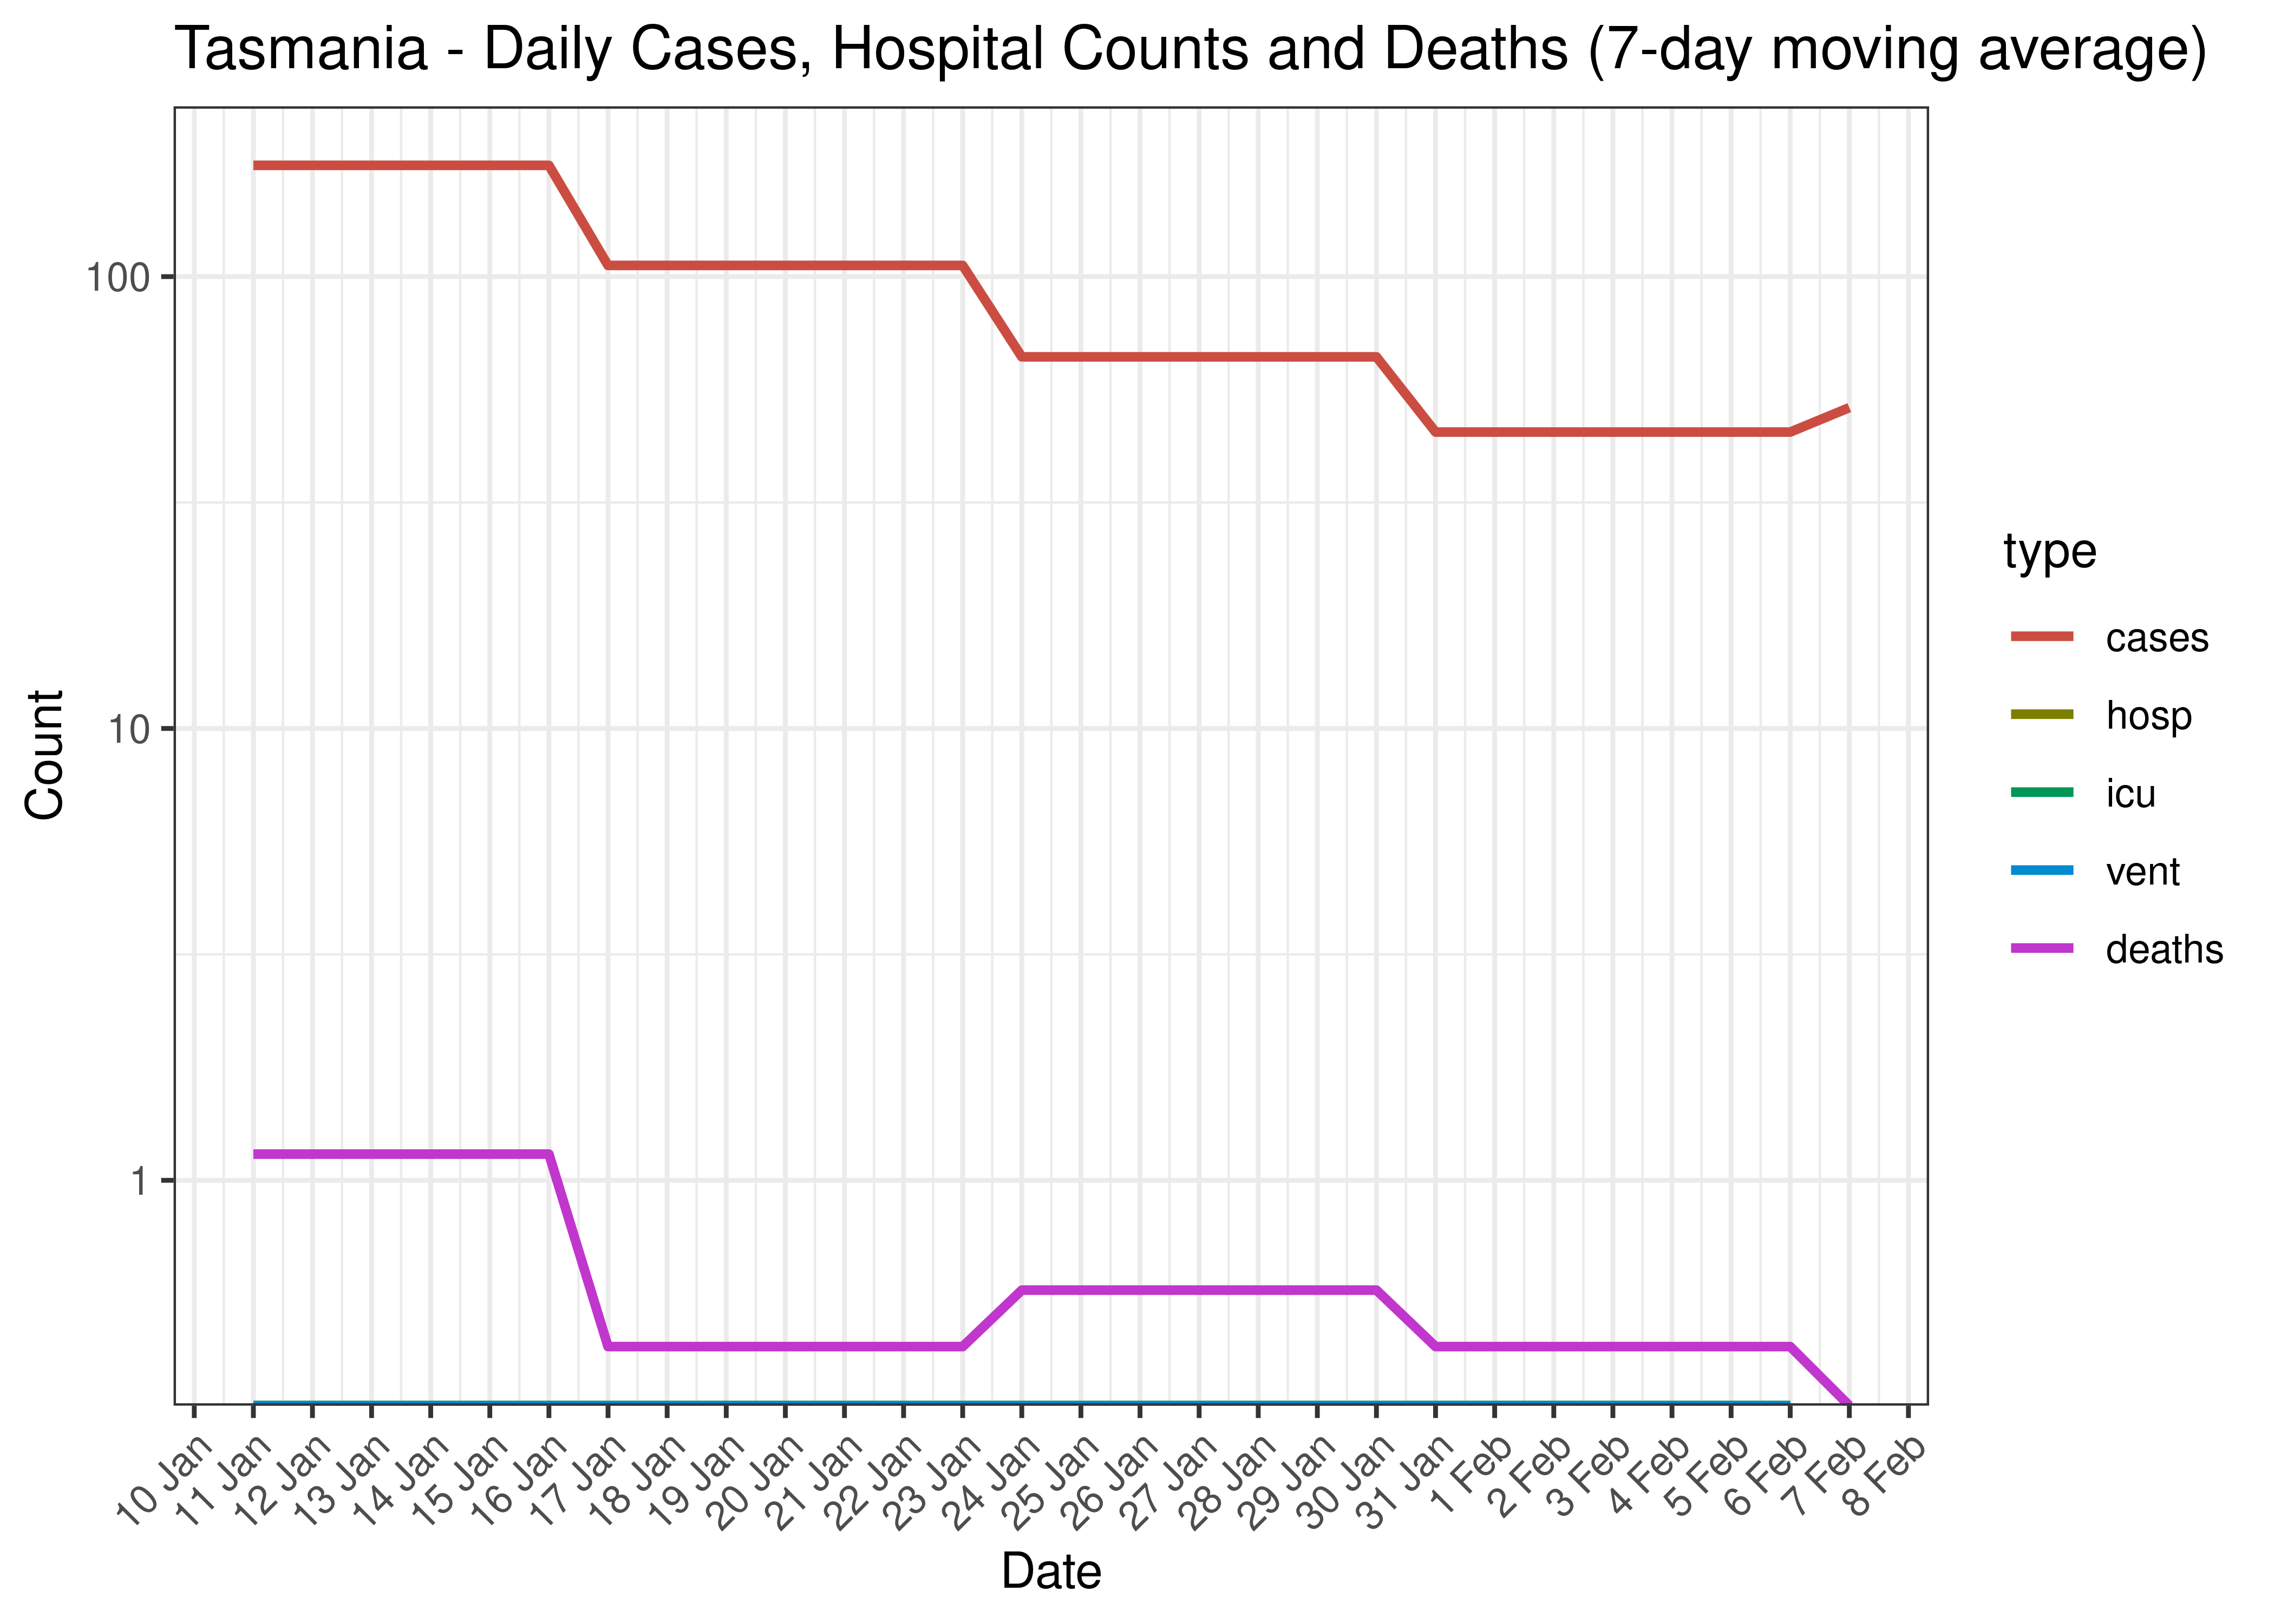
Tasmania - Daily Cases, Admissions and Deaths for Last 30-days (7-day moving average)
5.7.8 Crude Ratios per Wave
Below crude rations are calculated between the waves. It’s based on the following starting dates:
- Wave 1 started on 2020-01-01.
- Wave 2 started on 2020-06-01.
- Wave 3 started on 2021-06-01.
- Wave 4 started on 2021-12-01.
Below crude ratios are tabulated and plotted. These ratios are:
- ICU ratio calculated as person days in ICU divided by person days in hospital.
- Ventilator ratio calculated as person days on ventilators divided by person days in hospital.
- Death ratio calculated as deaths divided by person days in hospital.
- Case fatality ratio is calcualted as deaths divided by cases.
| Wave | ICU Ratio | Ventilator Ratio | Death Ratio | Case Fatality Ratio | |
|---|---|---|---|---|---|
| Tasmania | Wave 1 | 8.0% | 1.2% | 2.2% | 5.70% |
| Tasmania | Wave 2 | 0.0% | 0.0% | 0.0% | 0.00% |
| Tasmania | Wave 3 | NA | NA | NA | 0.00% |
| Tasmania | Wave 4 | 4.5% | 0.2% | 1.6% | 0.08% |
5.7.9 Reproduction Number
Below current (last weekly) effective reproduction number estimates are tabulated for Australia and by state.
| Type | Count (Per Day) | Week Ending | Reproduction Number [95% Confidence Interval] | |
|---|---|---|---|---|
| Tasmania | cases | 51 | 2023-02-10 | 1.06 [0.94 - 1.18] |
Below the effective reproduction number for Australia over the last 90 days are plotted together with a plot since start of the pandemic.
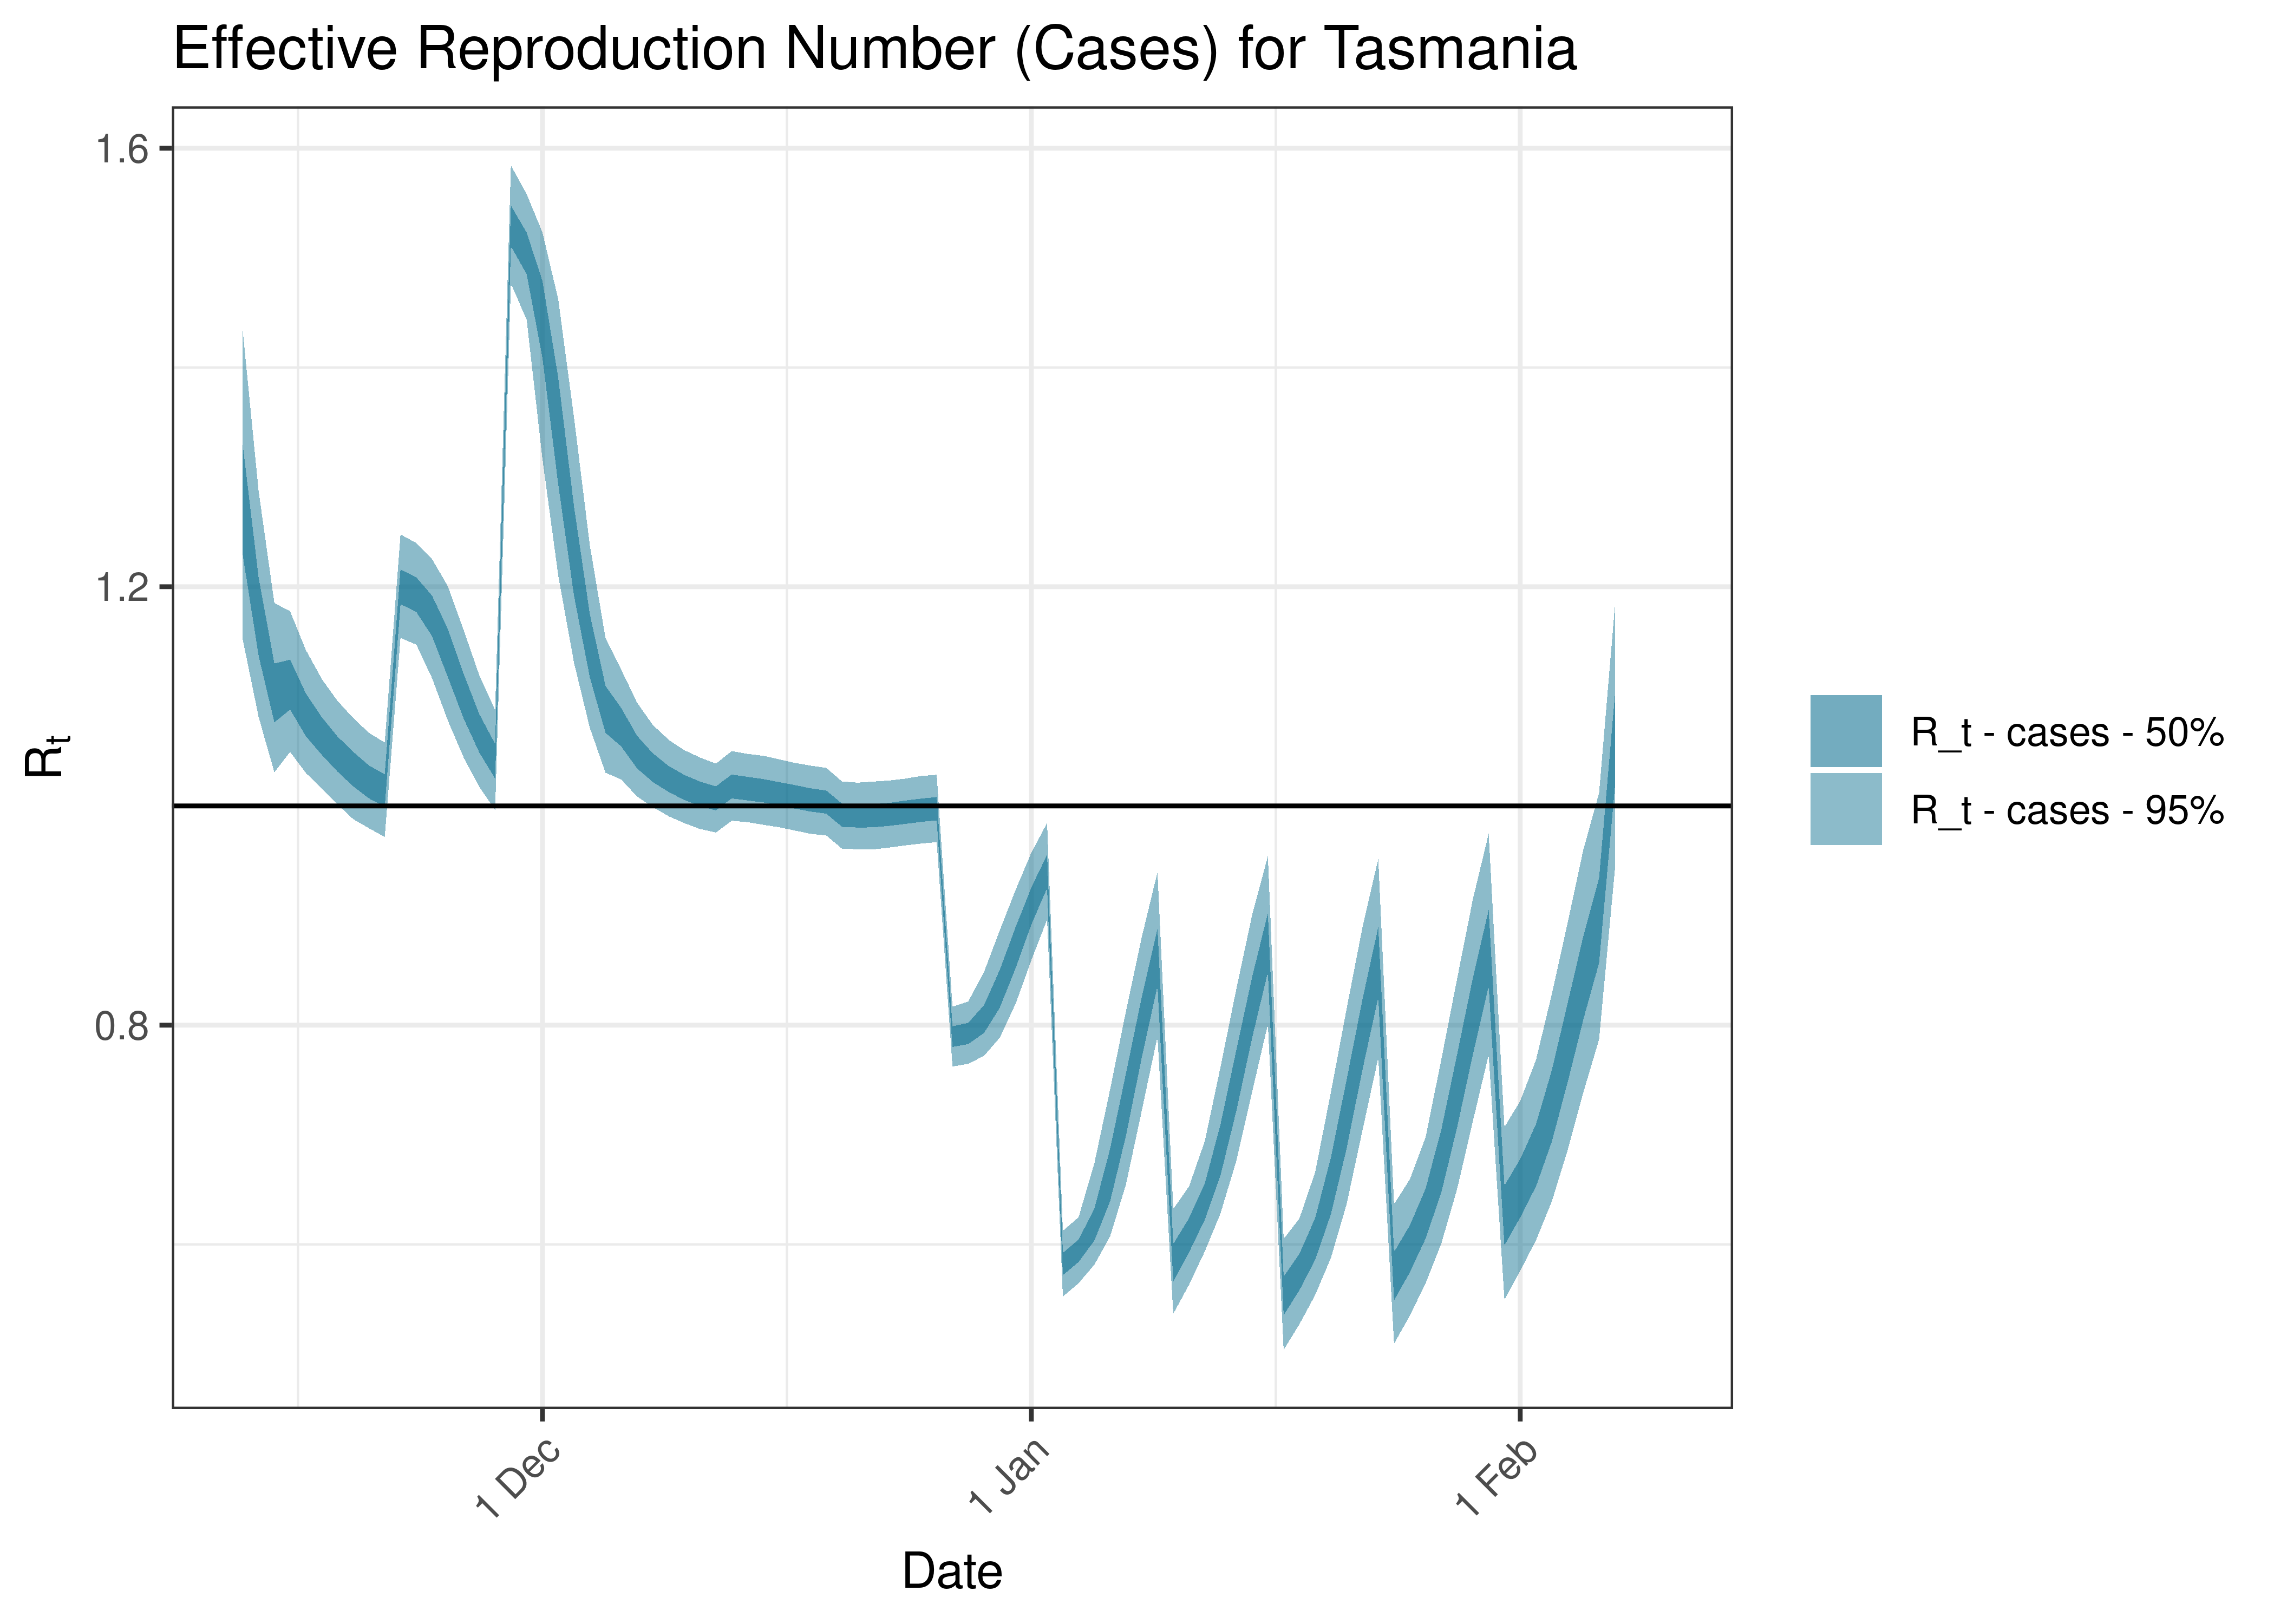
Estimated Effective Reproduction Number Based on Cases for Tasmania over last 90 days
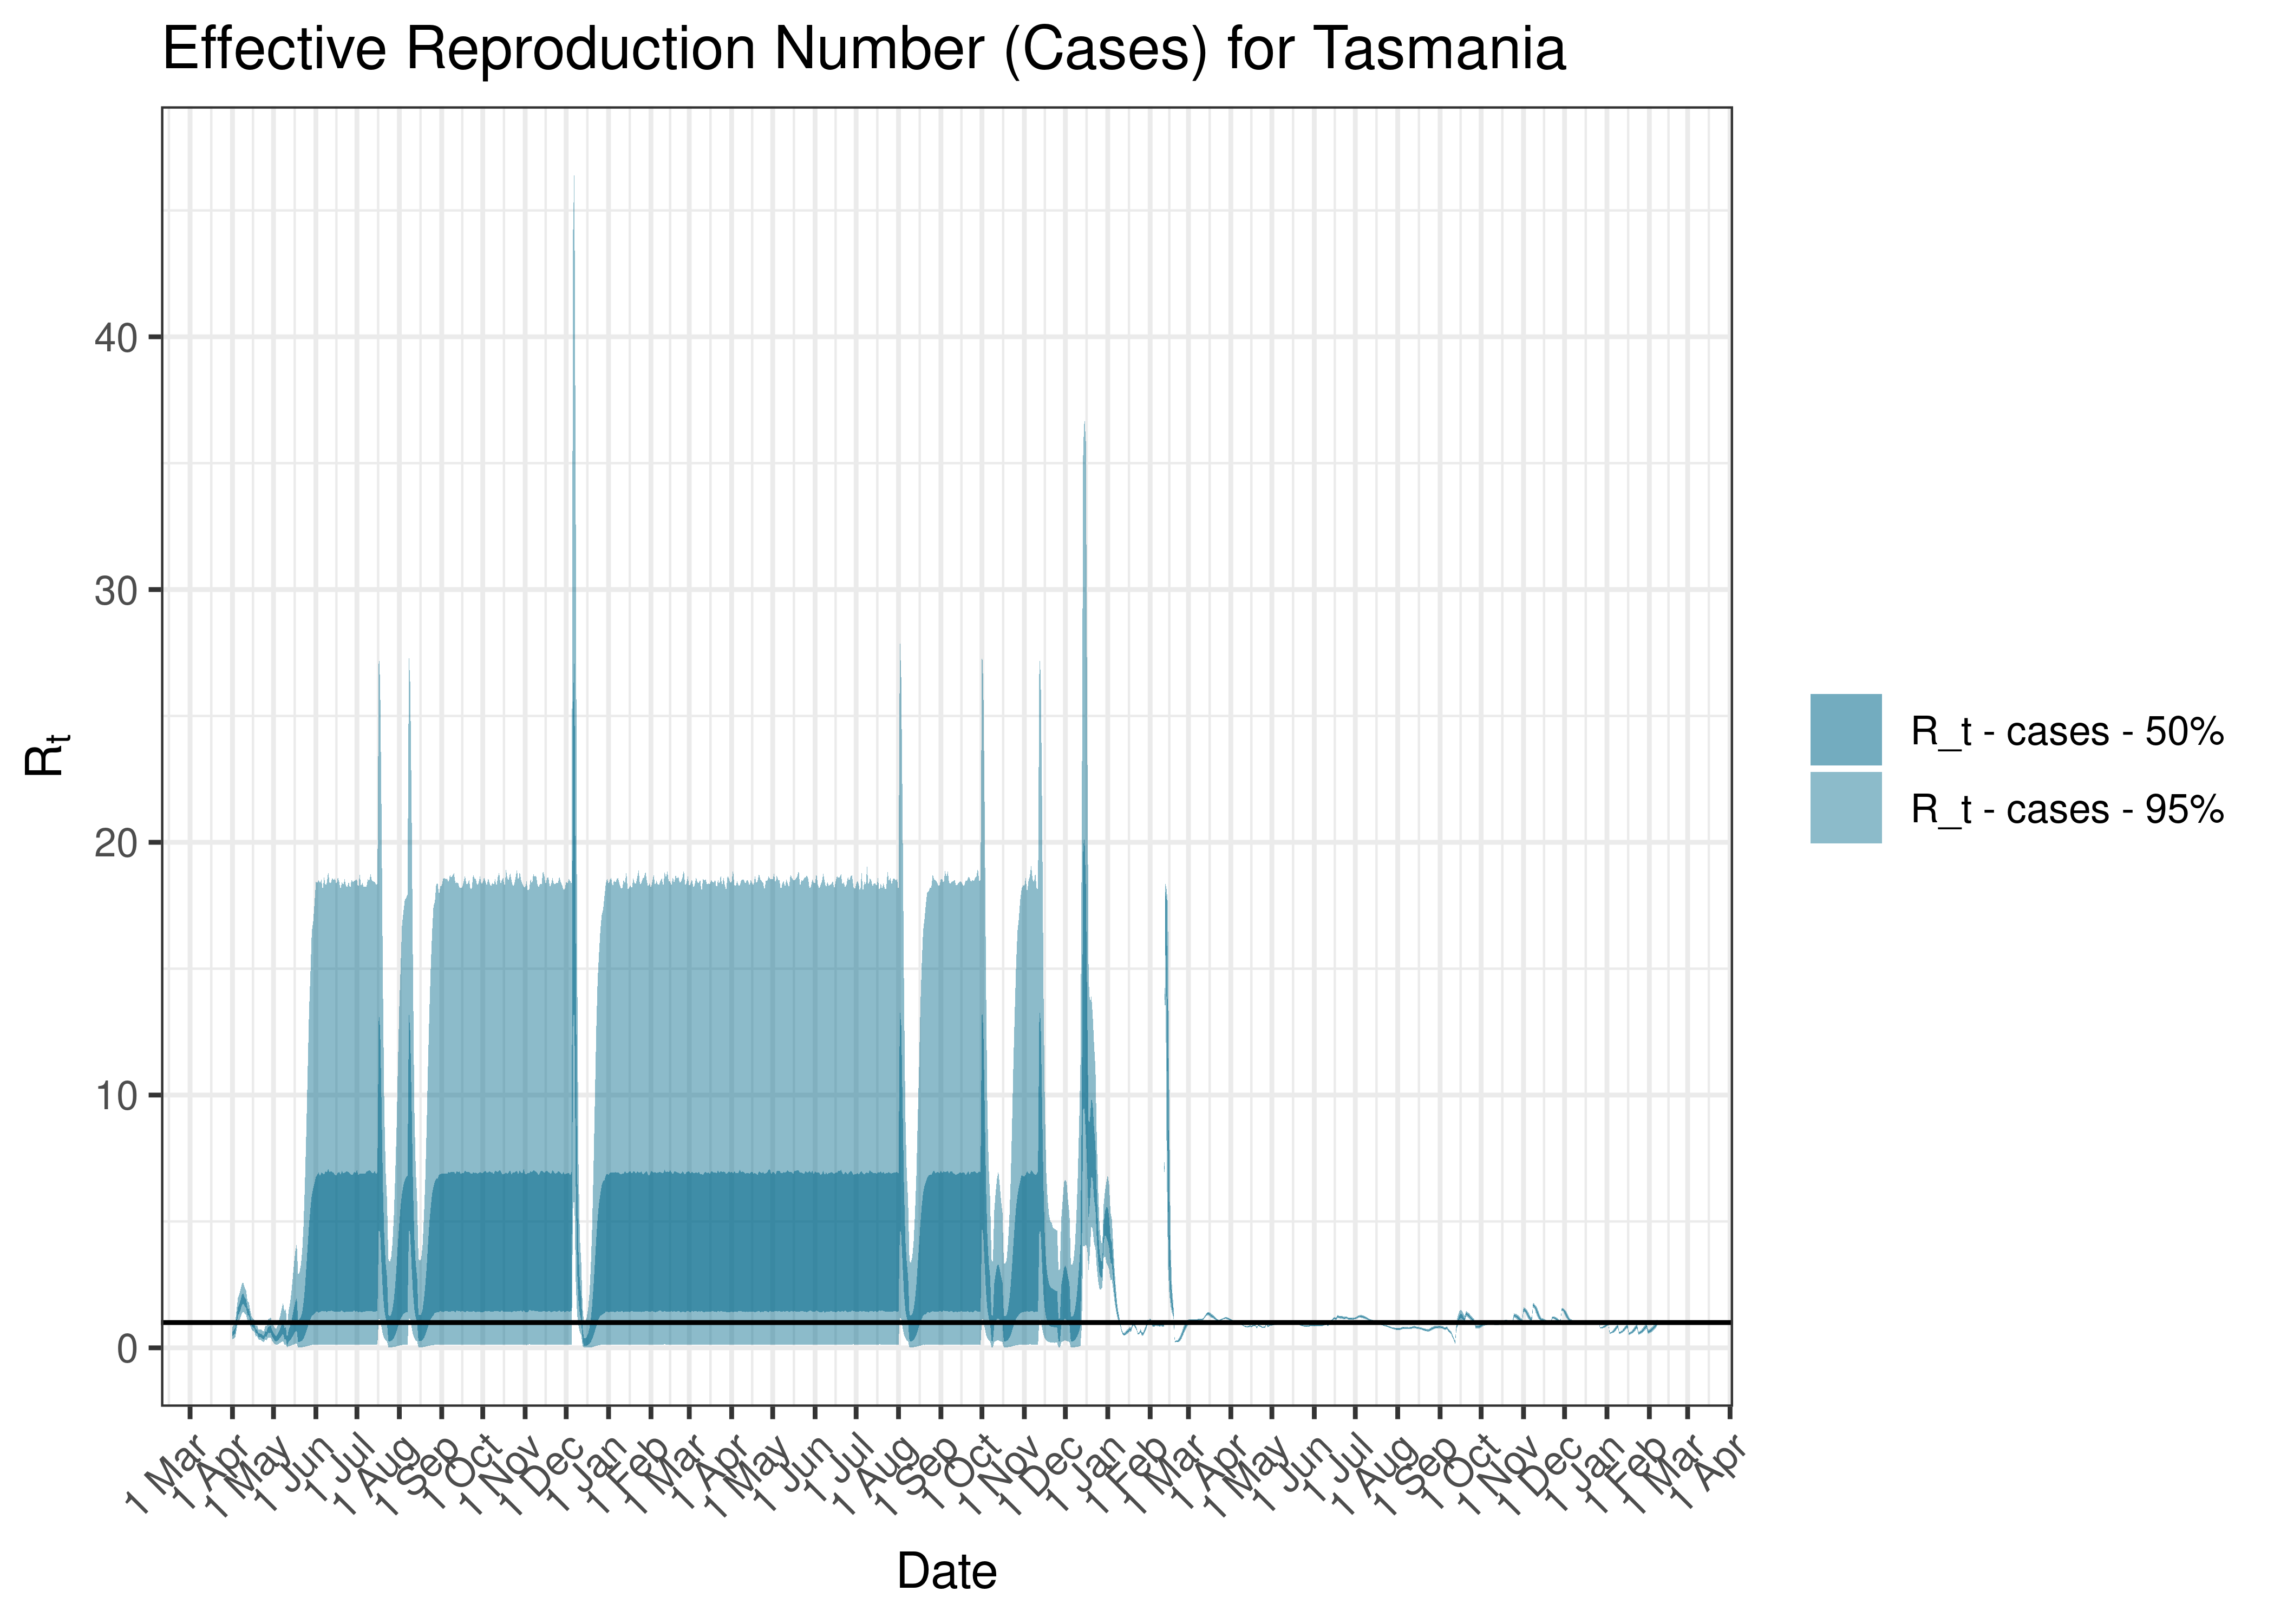
Estimated Effective Reproduction Number Based on Cases for Tasmania since 1 April 2020
5.8 Victoria
5.8.1 Tests
Below raw numbers of test by date are plotted on a 7-day moving average from 1 April 2020.
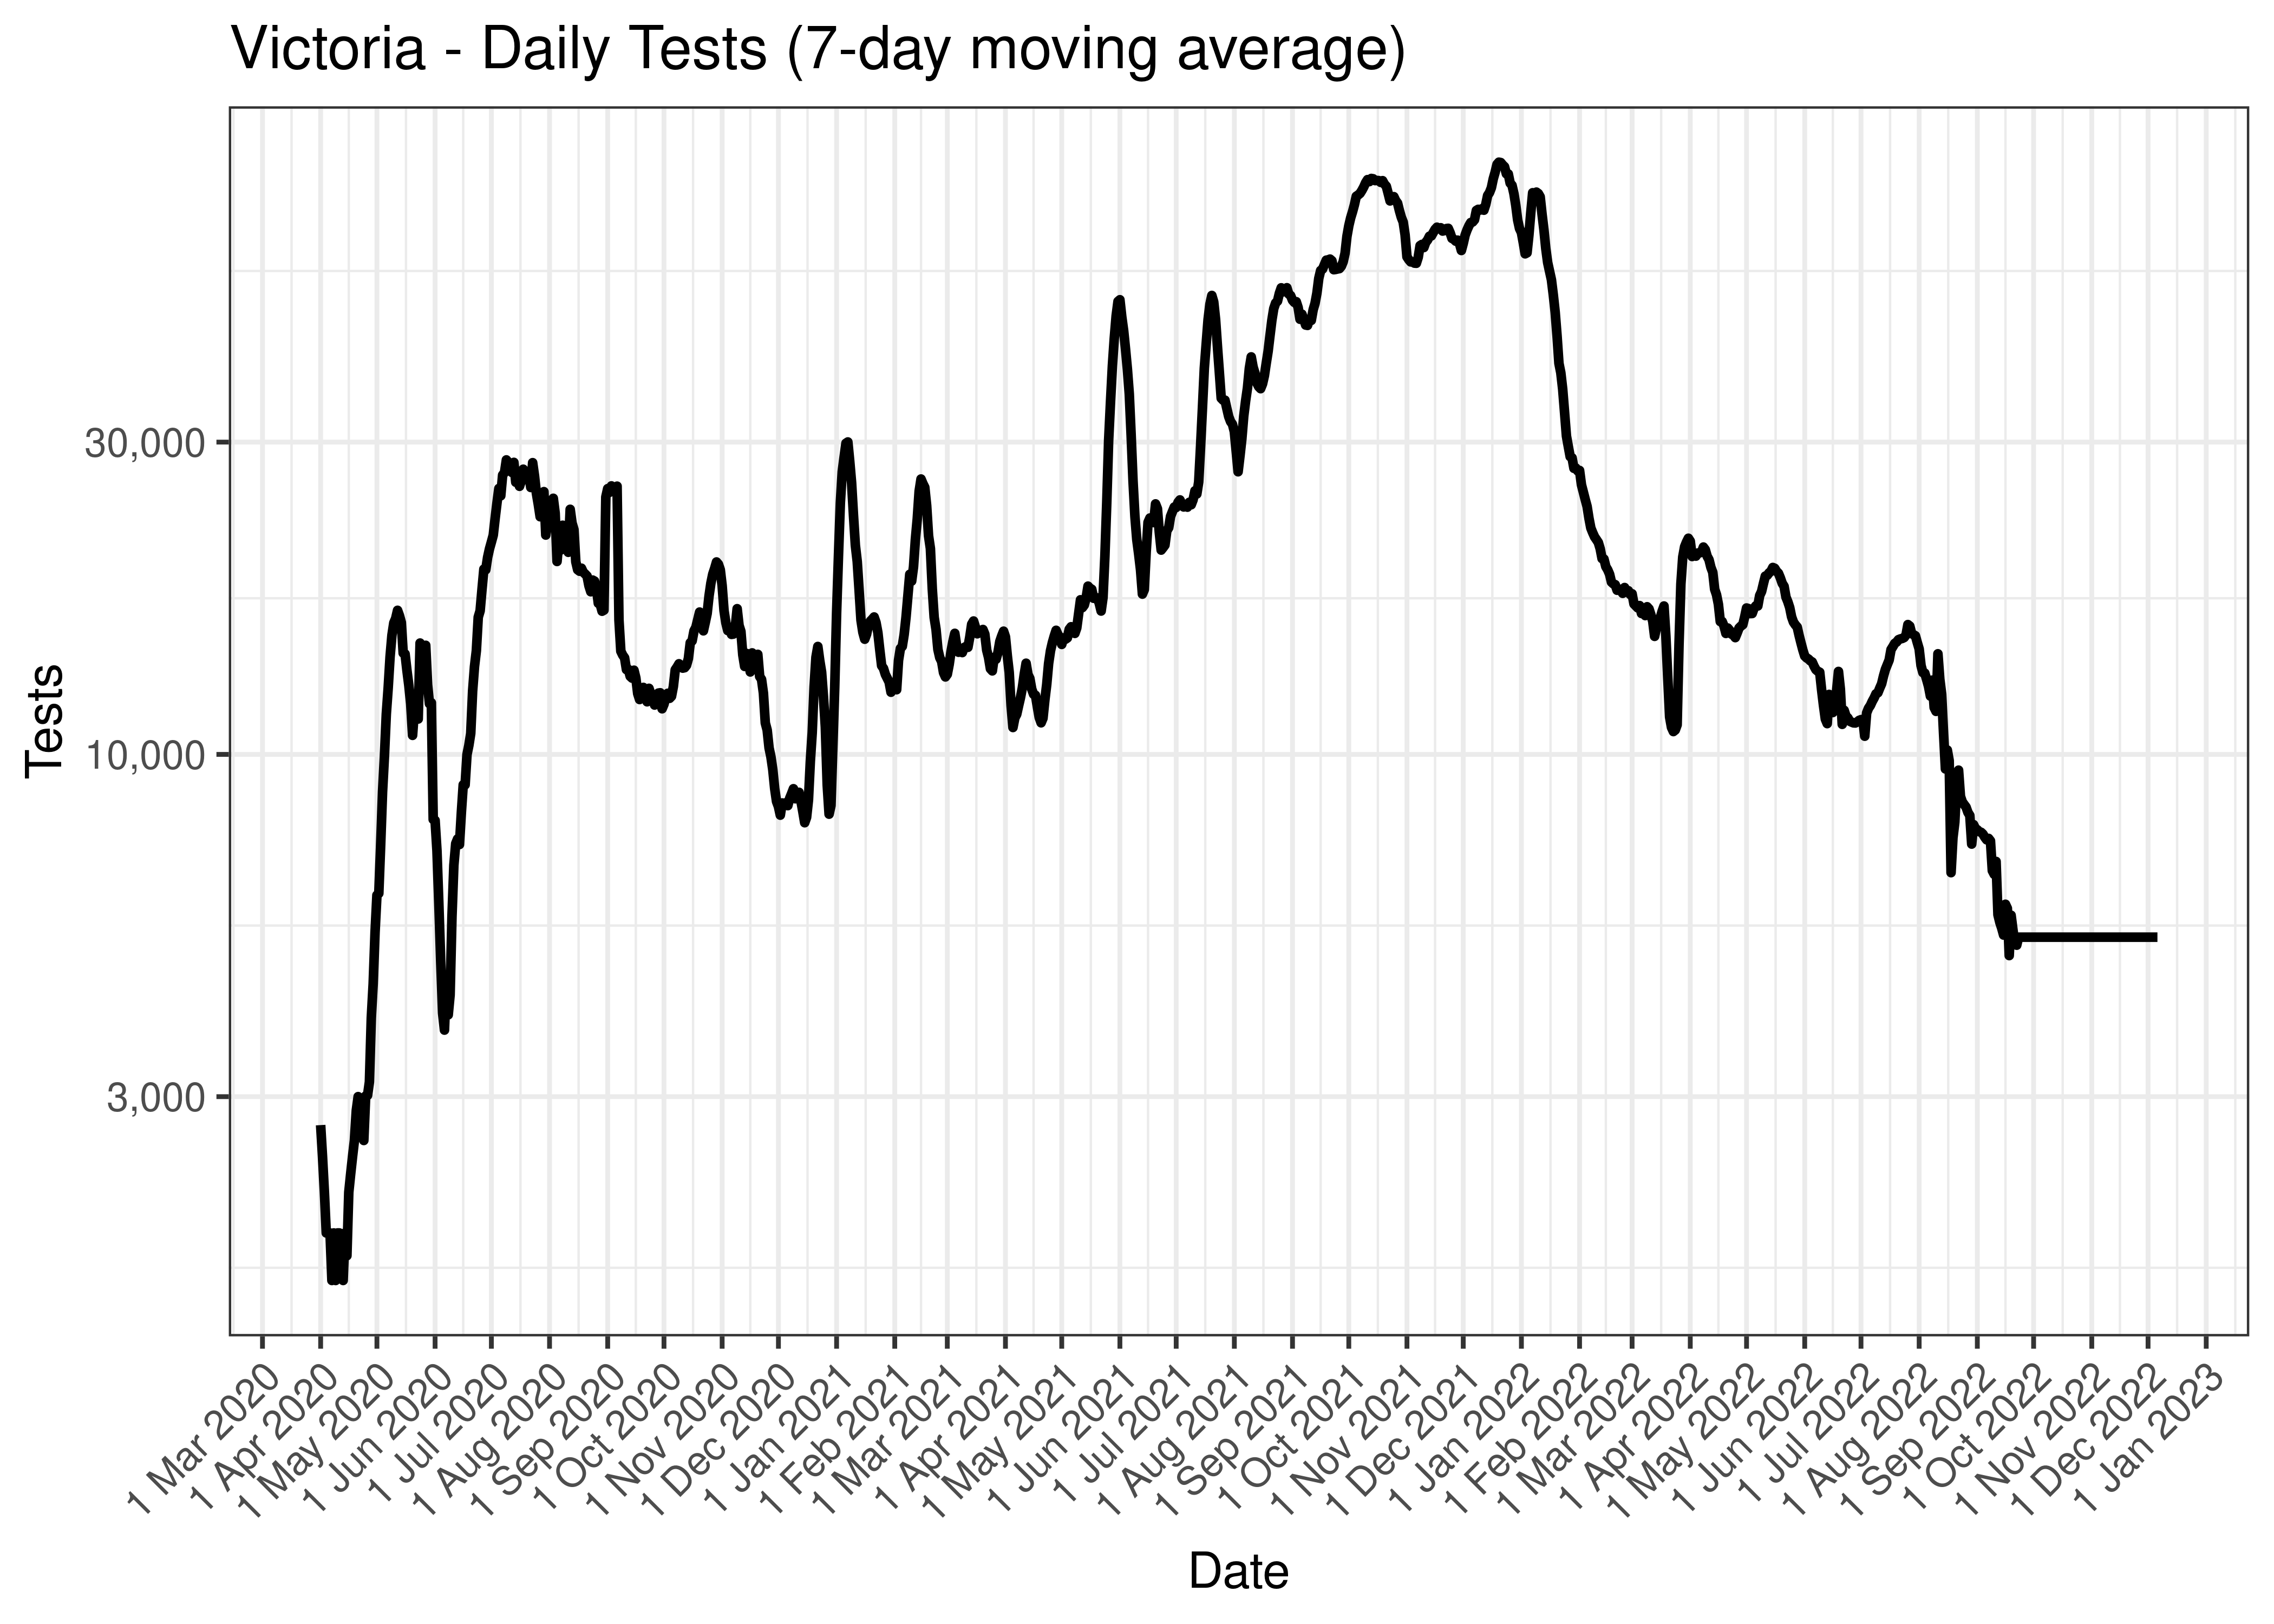
Victoria - Daily Tests (7-day moving average)
The above chart is repeated below covering the last 30 days only.
Victoria - Daily Tests for Last 30 Days (7-day moving average)
5.8.2 Cases
Cases are tabulated by specimen received date below. Cases include estimates for late reporting in recent days as well as adjustments for any public holidays. A centred 7-day moving average is also shown. The peak daily cases in previous waves (as measured by the moving average) is also shown.
| Date | Cases | 7-day Moving Average | Comment |
|---|---|---|---|
| 2020-03-30 | 52 | 74 | Wave 1 Peak |
| 2020-08-02 | 626 | 533 | Wave 2 Peak |
| 2021-10-17 | 1,769 | 1,932 | Wave 3 Peak |
| 2022-02-02 | 14,328 | 44,815 | Wave 4 Peak (to date) |
| 2023-02-03 | 2,985 | 426 | |
| 2023-02-04 | 0 | 426 | |
| 2023-02-05 | 0 | 426 | |
| 2023-02-06 | 0 | 426 | |
| 2023-02-07 | 0 | 410 | |
| 2023-02-08 | 0 | NA | |
| 2023-02-09 | 0 | NA | |
| 2023-02-10 | 2,873 | NA |
Below a 7-day moving average daily case count is plotted for Victoria on a log scale since start of the epidemic:
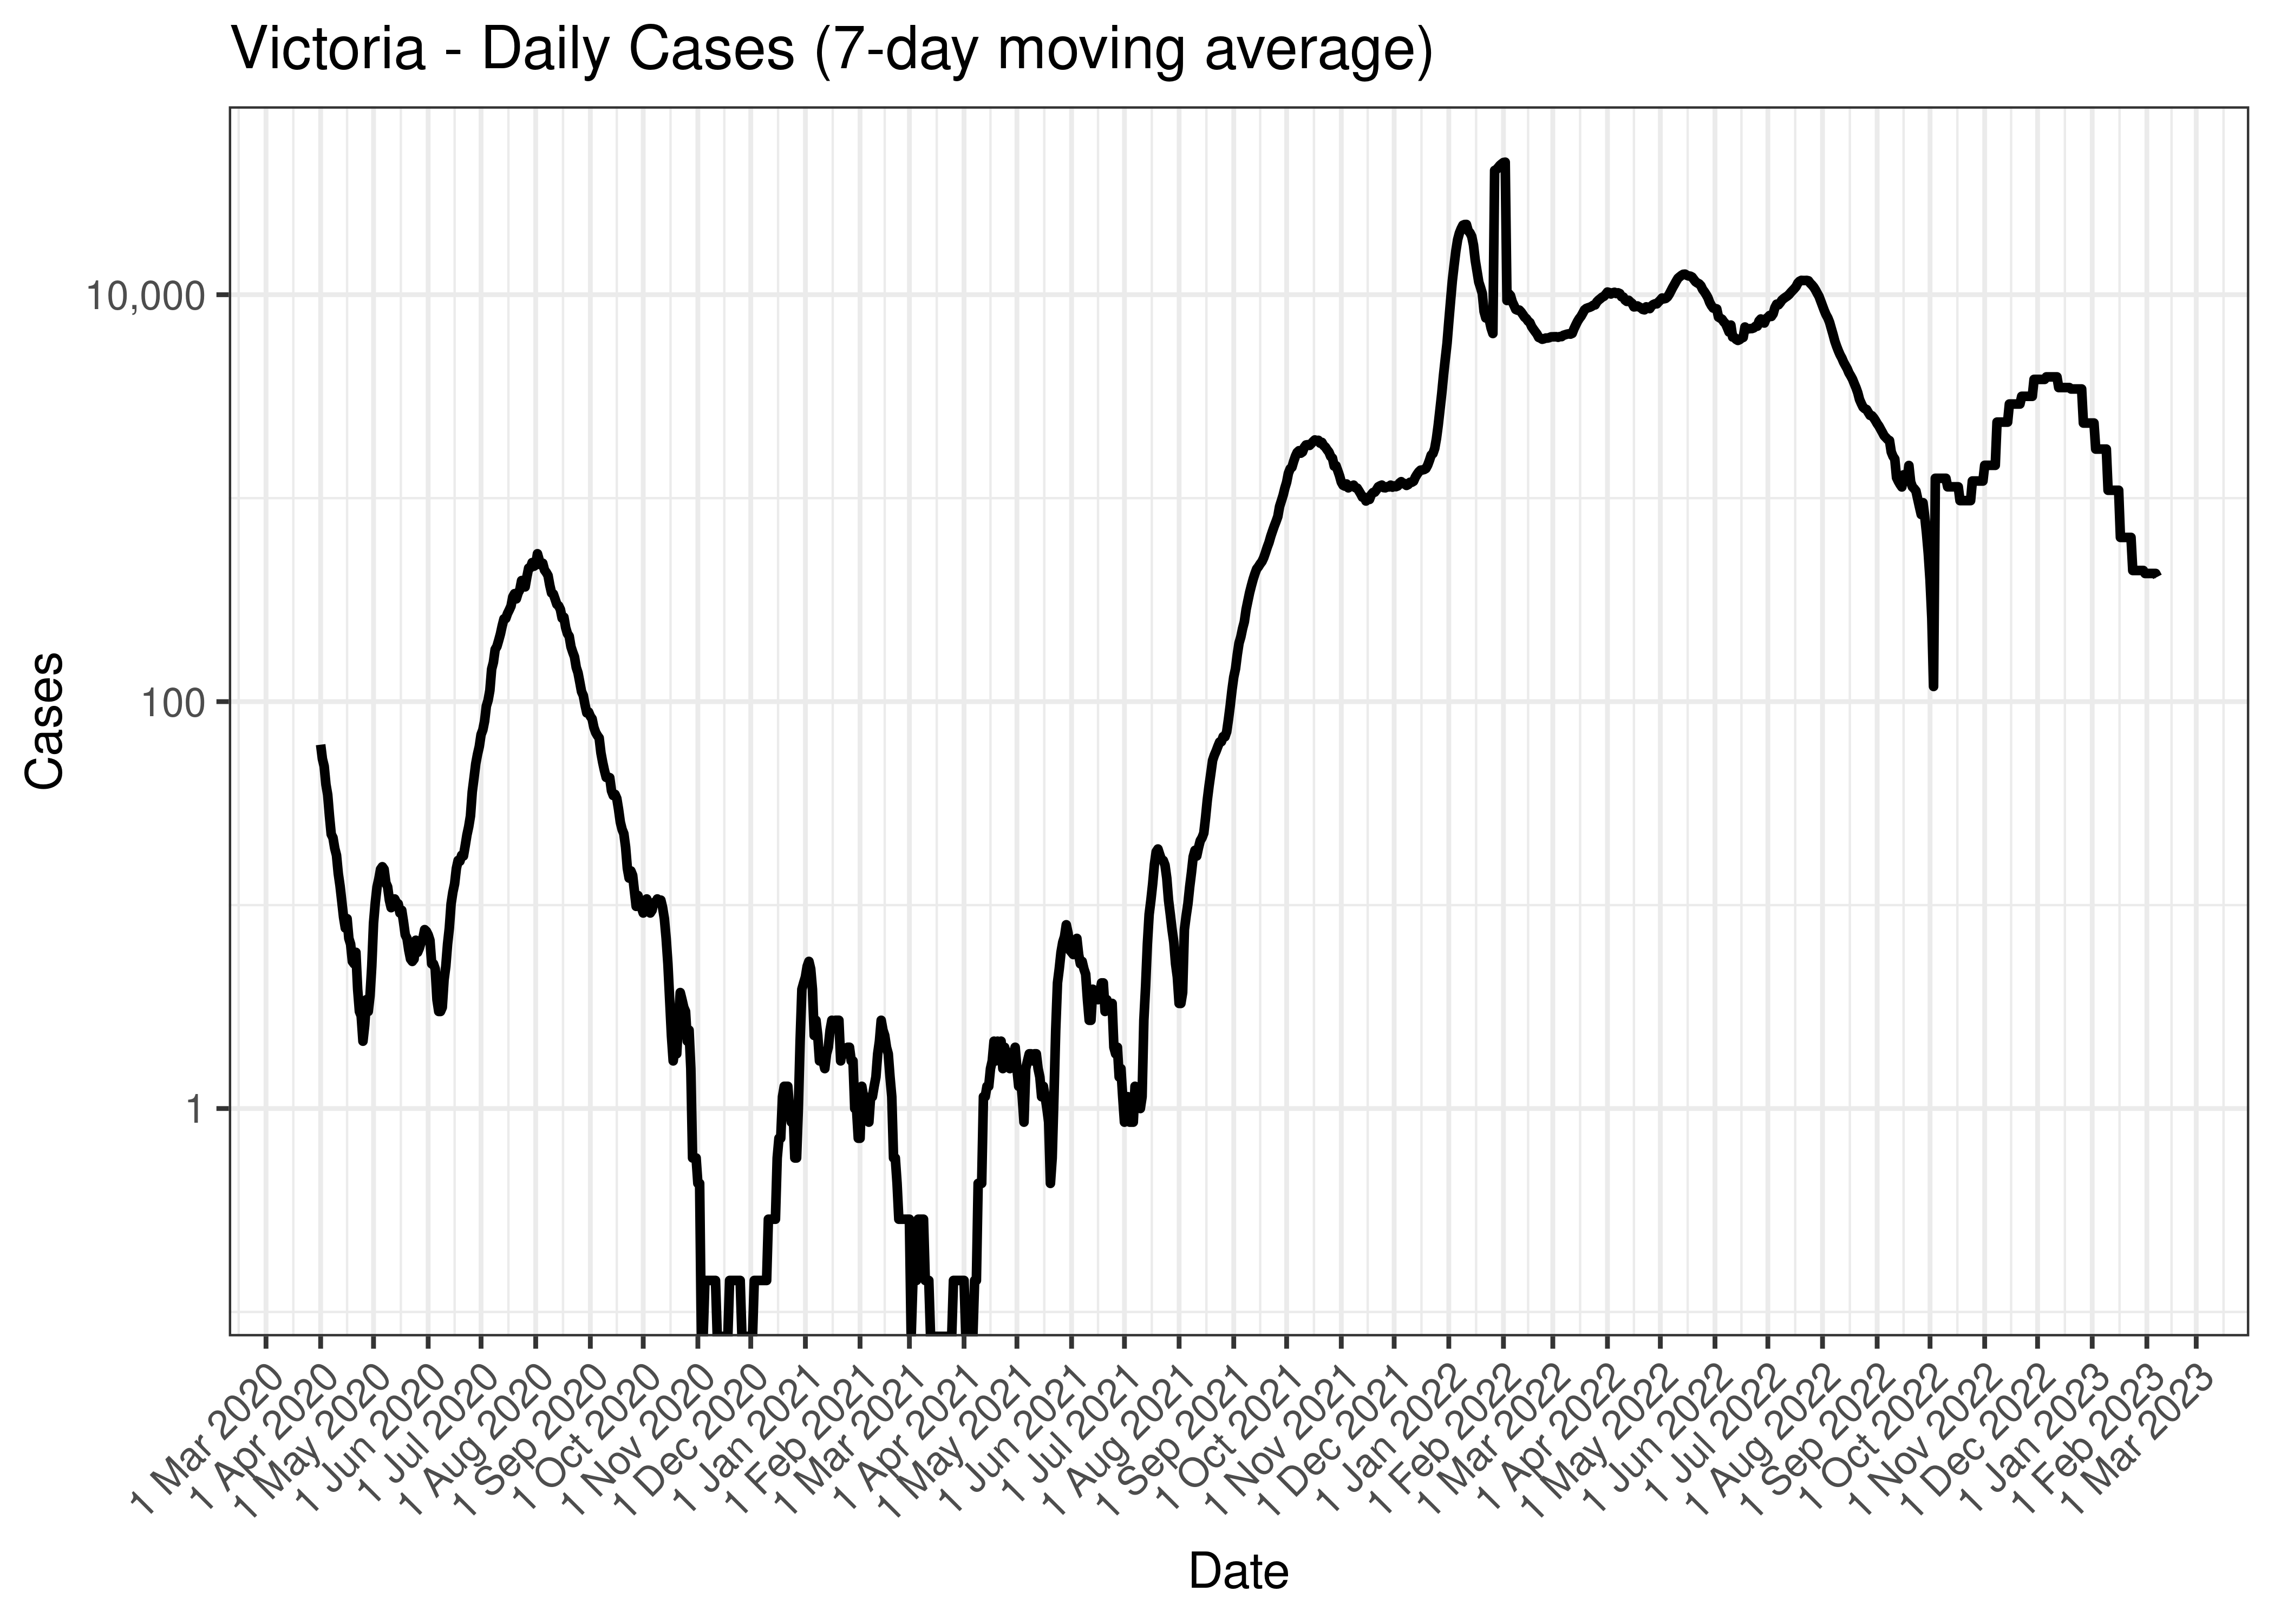
Victoria - Daily Cases (7-day moving average)
Below the above chart is repeated for the last 30-days:
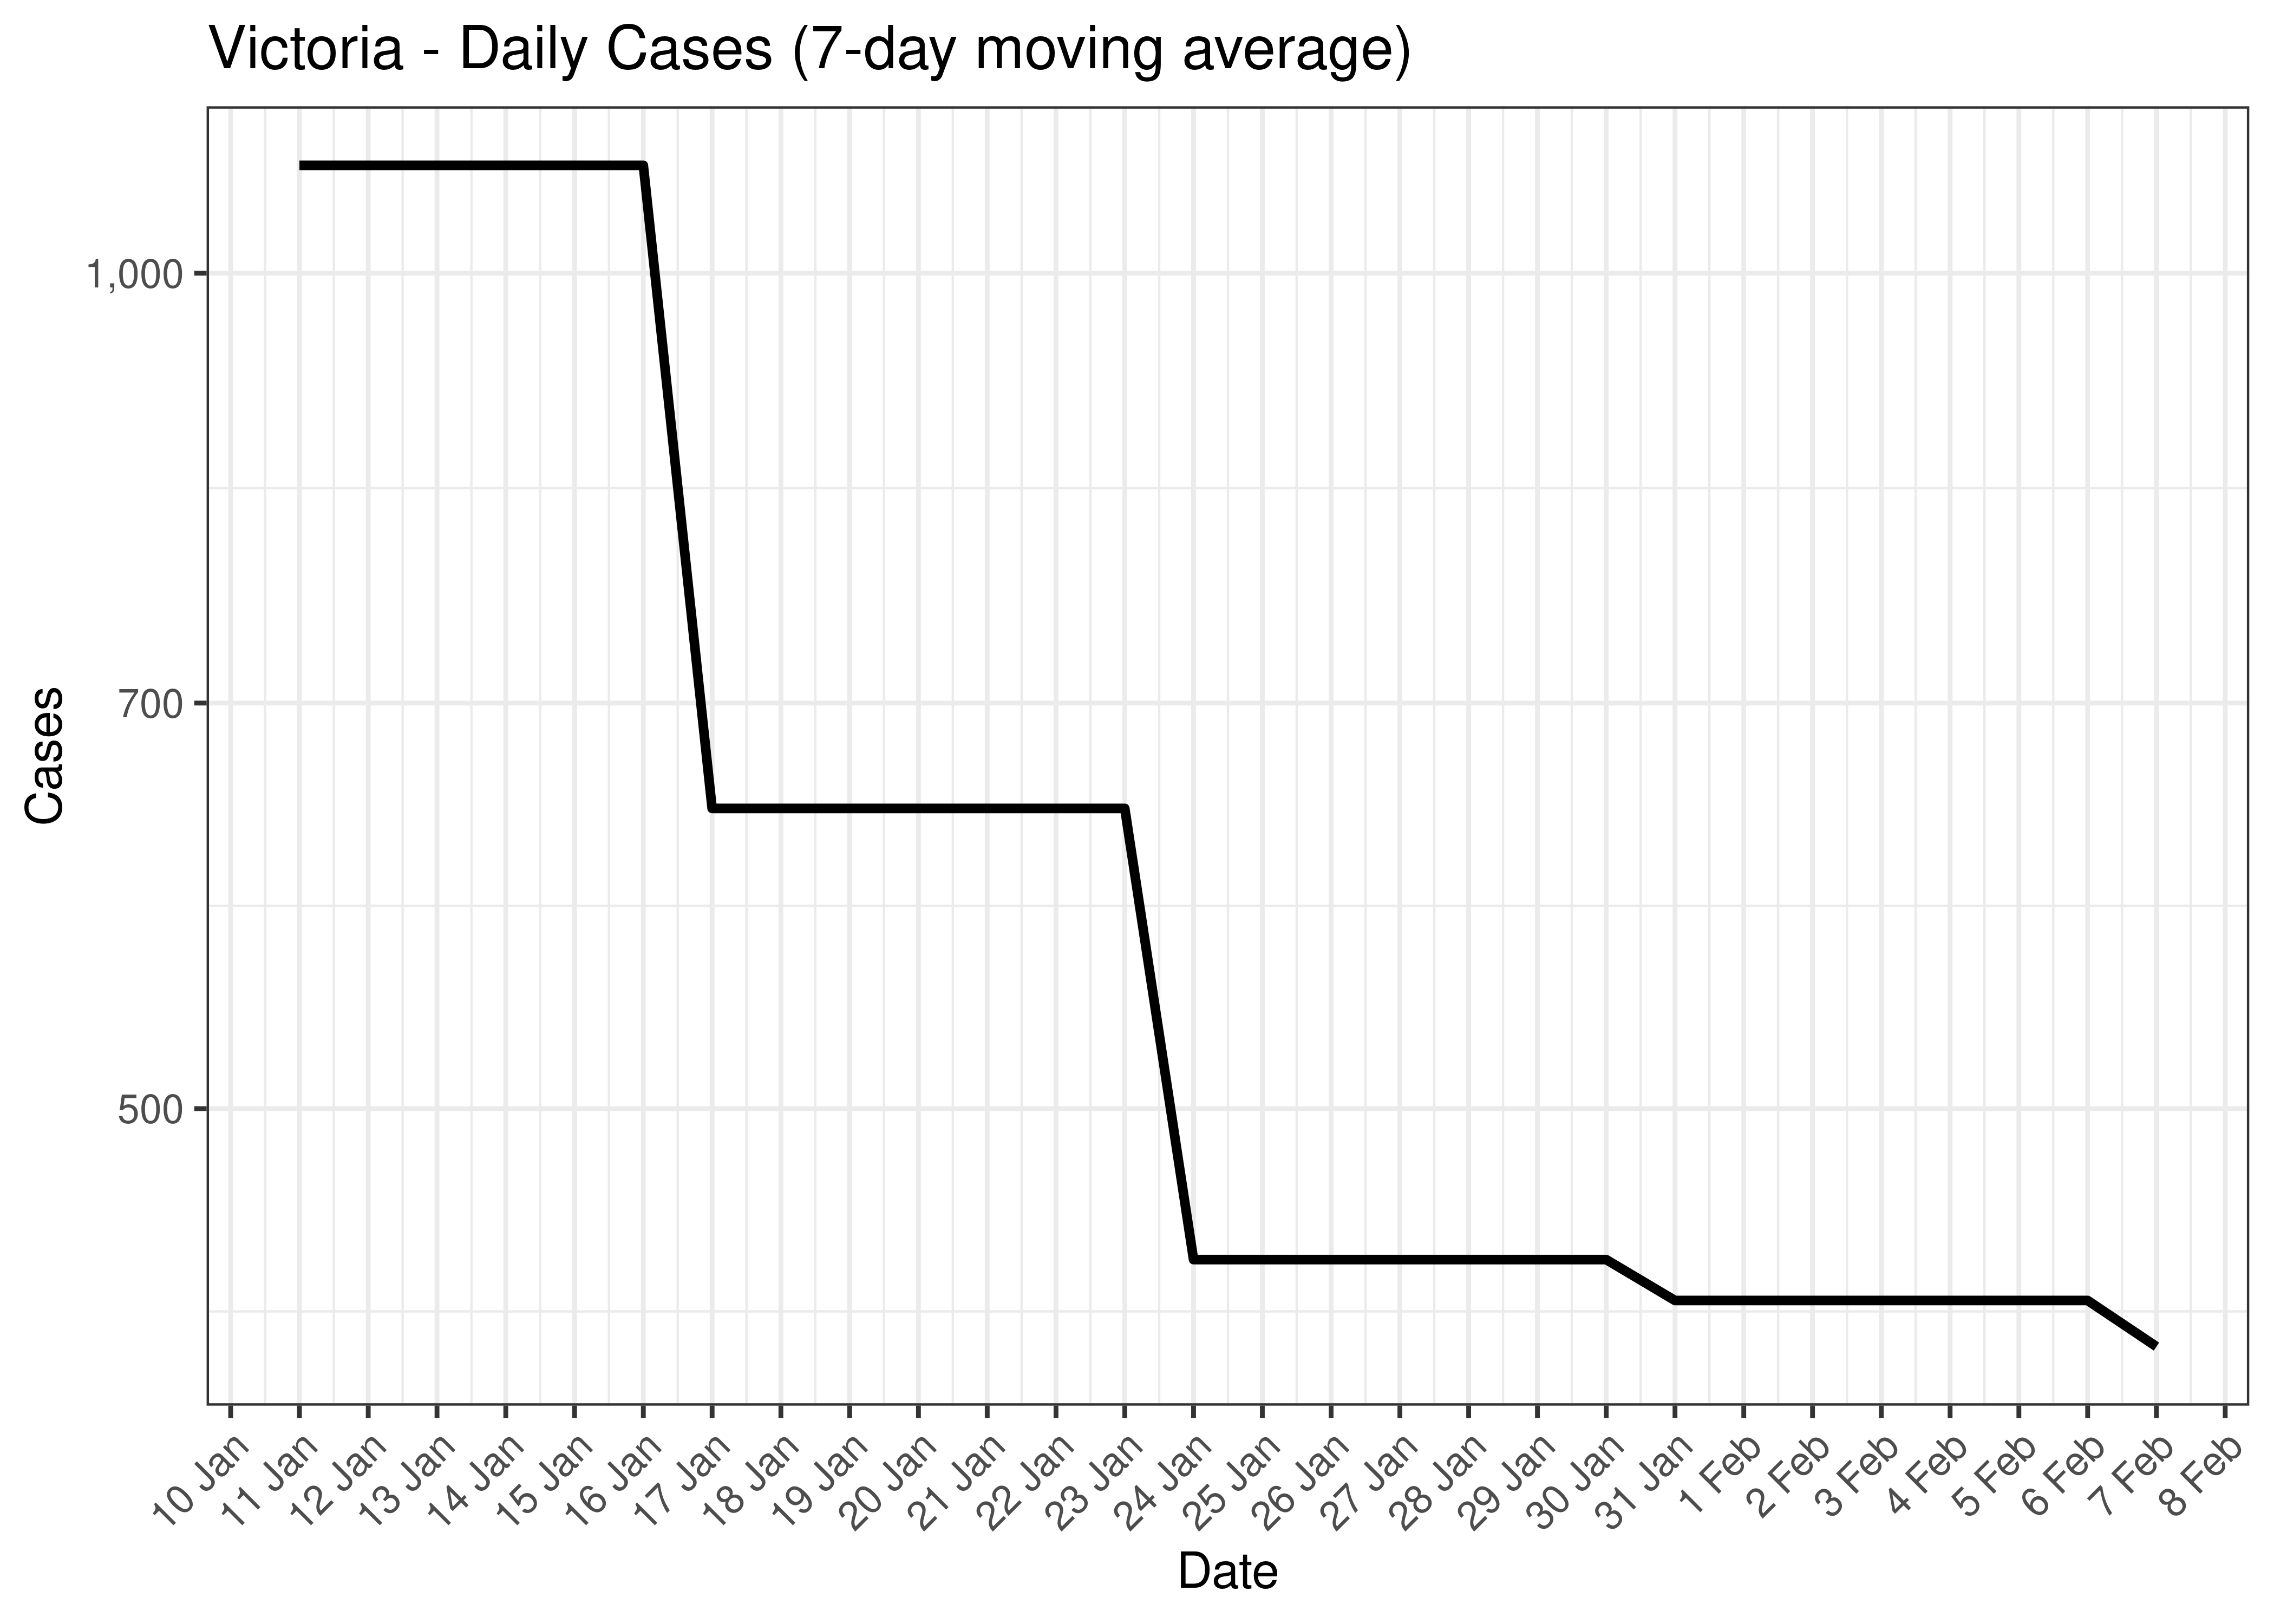
Victoria - Daily Cases for Last 30-days (7-day moving average)
5.8.3 Hospitlisation
Counts of those in hospital are tabulated by report date below. A centred 7-day moving average is also shown. The peak daily admissions in previous waves (as measured by the moving average) is also shown.
| Date | In Hospital | 7-day Moving Average | Comment |
|---|---|---|---|
| 2020-04-08 | 45 | 46 | Wave 1 Peak |
| 2020-08-16 | 662 | 663 | Wave 2 Peak |
| 2021-10-19 | 784 | 794 | Wave 3 Peak |
| 2022-01-18 | 1,152 | 1,146 | Wave 4 Peak (to date) |
| 2023-02-03 | 0 | 0 | |
| 2023-02-04 | 0 | 0 | |
| 2023-02-05 | 0 | 0 | |
| 2023-02-06 | 0 | 0 | |
| 2023-02-07 | 0 | NA | |
| 2023-02-08 | 0 | NA | |
| 2023-02-09 | 0 | NA | |
| 2023-02-10 | NA | NA |
The above are based on the following dates:
- Wave 1 started on 2020-01-01.
- Wave 2 started on 2020-06-01.
- Wave 3 started on 2021-06-01.
- Wave 4 started on 2021-12-01.
Below a 7-day moving average of daily hospital counts is plotted by on a log scale since start of the epidemic. Note admissions are plotted by date.
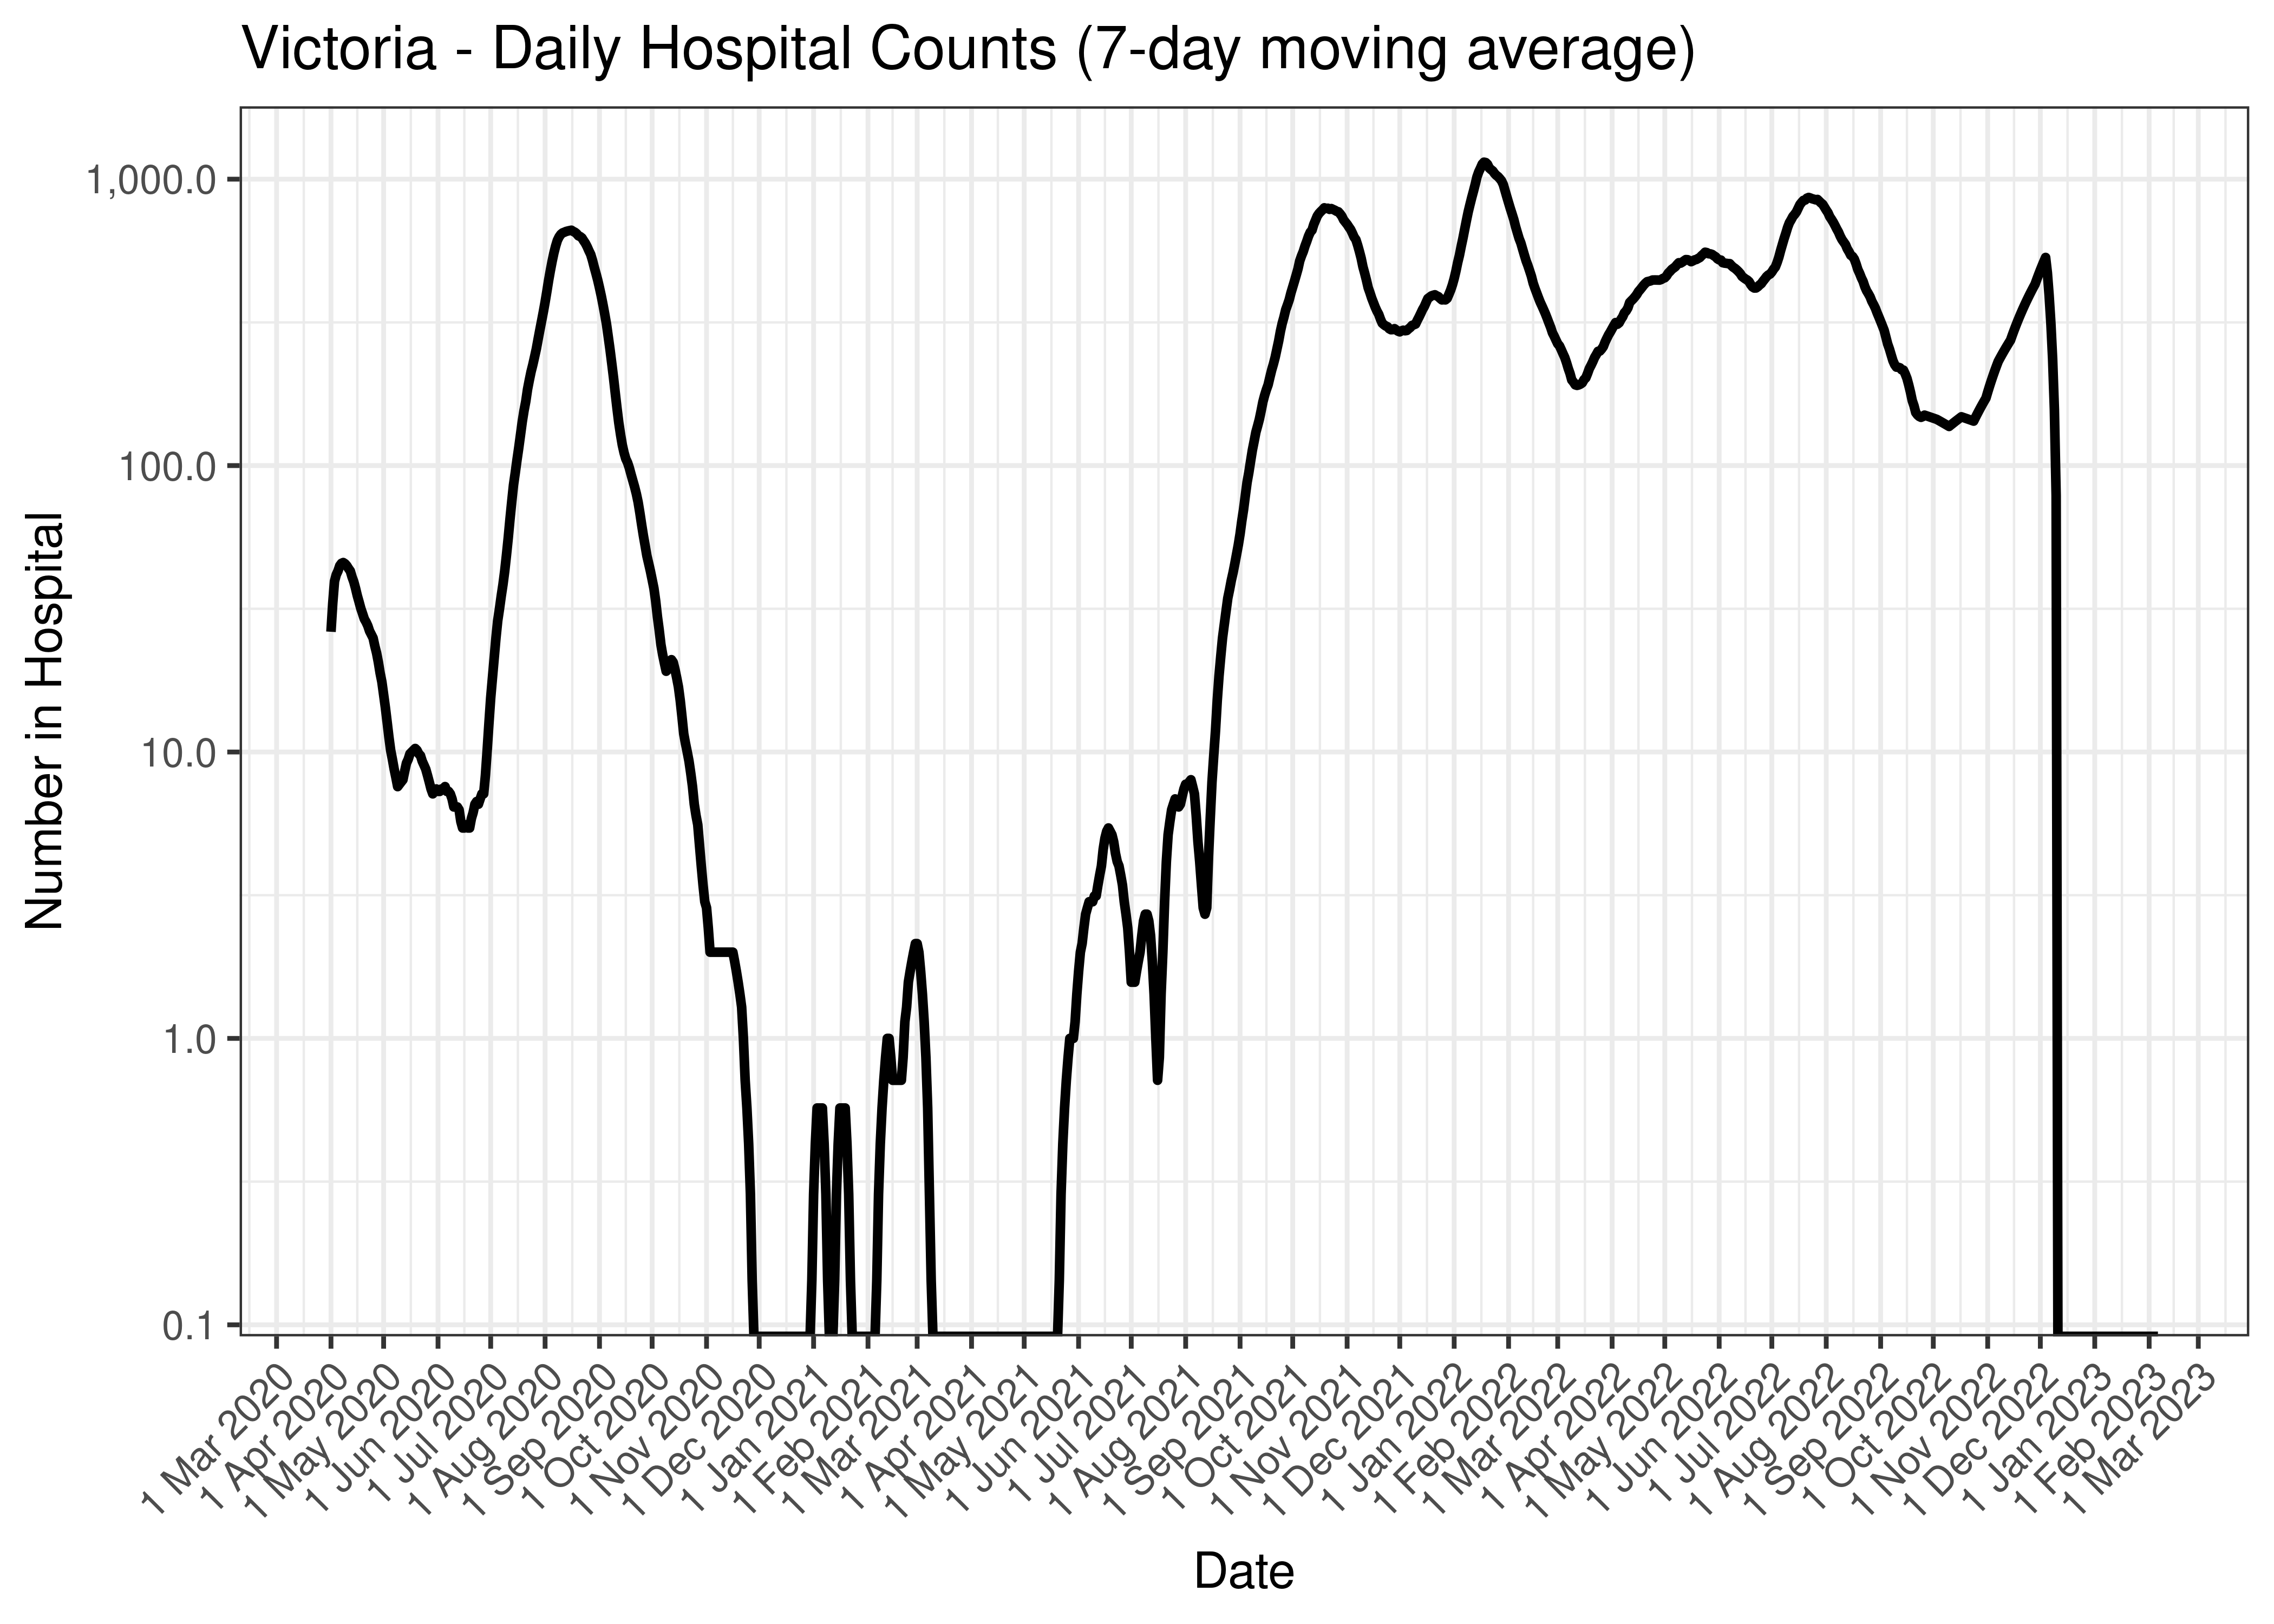
Victoria - Daily Hospital Counts (7-day moving average)
Below the above chart is repeated for the last 30-days:
Victoria - Daily Hospital Counts for Last 30-days (7-day moving average)
5.8.4 ICU
Counts of those in ICU are tabulated by report date below. A centred 7-day moving average is also shown. The peak daily admissions in previous waves (as measured by the moving average) is also shown.
| Date | In ICU | 7-day Moving Average | Comment |
|---|---|---|---|
| 2020-04-13 | 14 | 15 | Wave 1 Peak |
| 2020-04-14 | 15 | 15 | Wave 1 Peak |
| 2020-08-09 | 43 | 44 | Wave 2 Peak |
| 2021-10-17 | 151 | 153 | Wave 3 Peak |
| 2022-01-19 | 125 | 124 | Wave 4 Peak (to date) |
| 2023-02-03 | 0 | 0 | |
| 2023-02-04 | 0 | 0 | |
| 2023-02-05 | 0 | 0 | |
| 2023-02-06 | 0 | 0 | |
| 2023-02-07 | 0 | NA | |
| 2023-02-08 | 0 | NA | |
| 2023-02-09 | 0 | NA | |
| 2023-02-10 | NA | NA |
The above are based on the following dates:
- Wave 1 started on 2020-01-01.
- Wave 2 started on 2020-06-01.
- Wave 3 started on 2021-06-01.
- Wave 4 started on 2021-12-01.
Below a 7-day moving average of daily ICU counts is plotted by on a log scale since start of the epidemic. Note admissions are plotted by date.
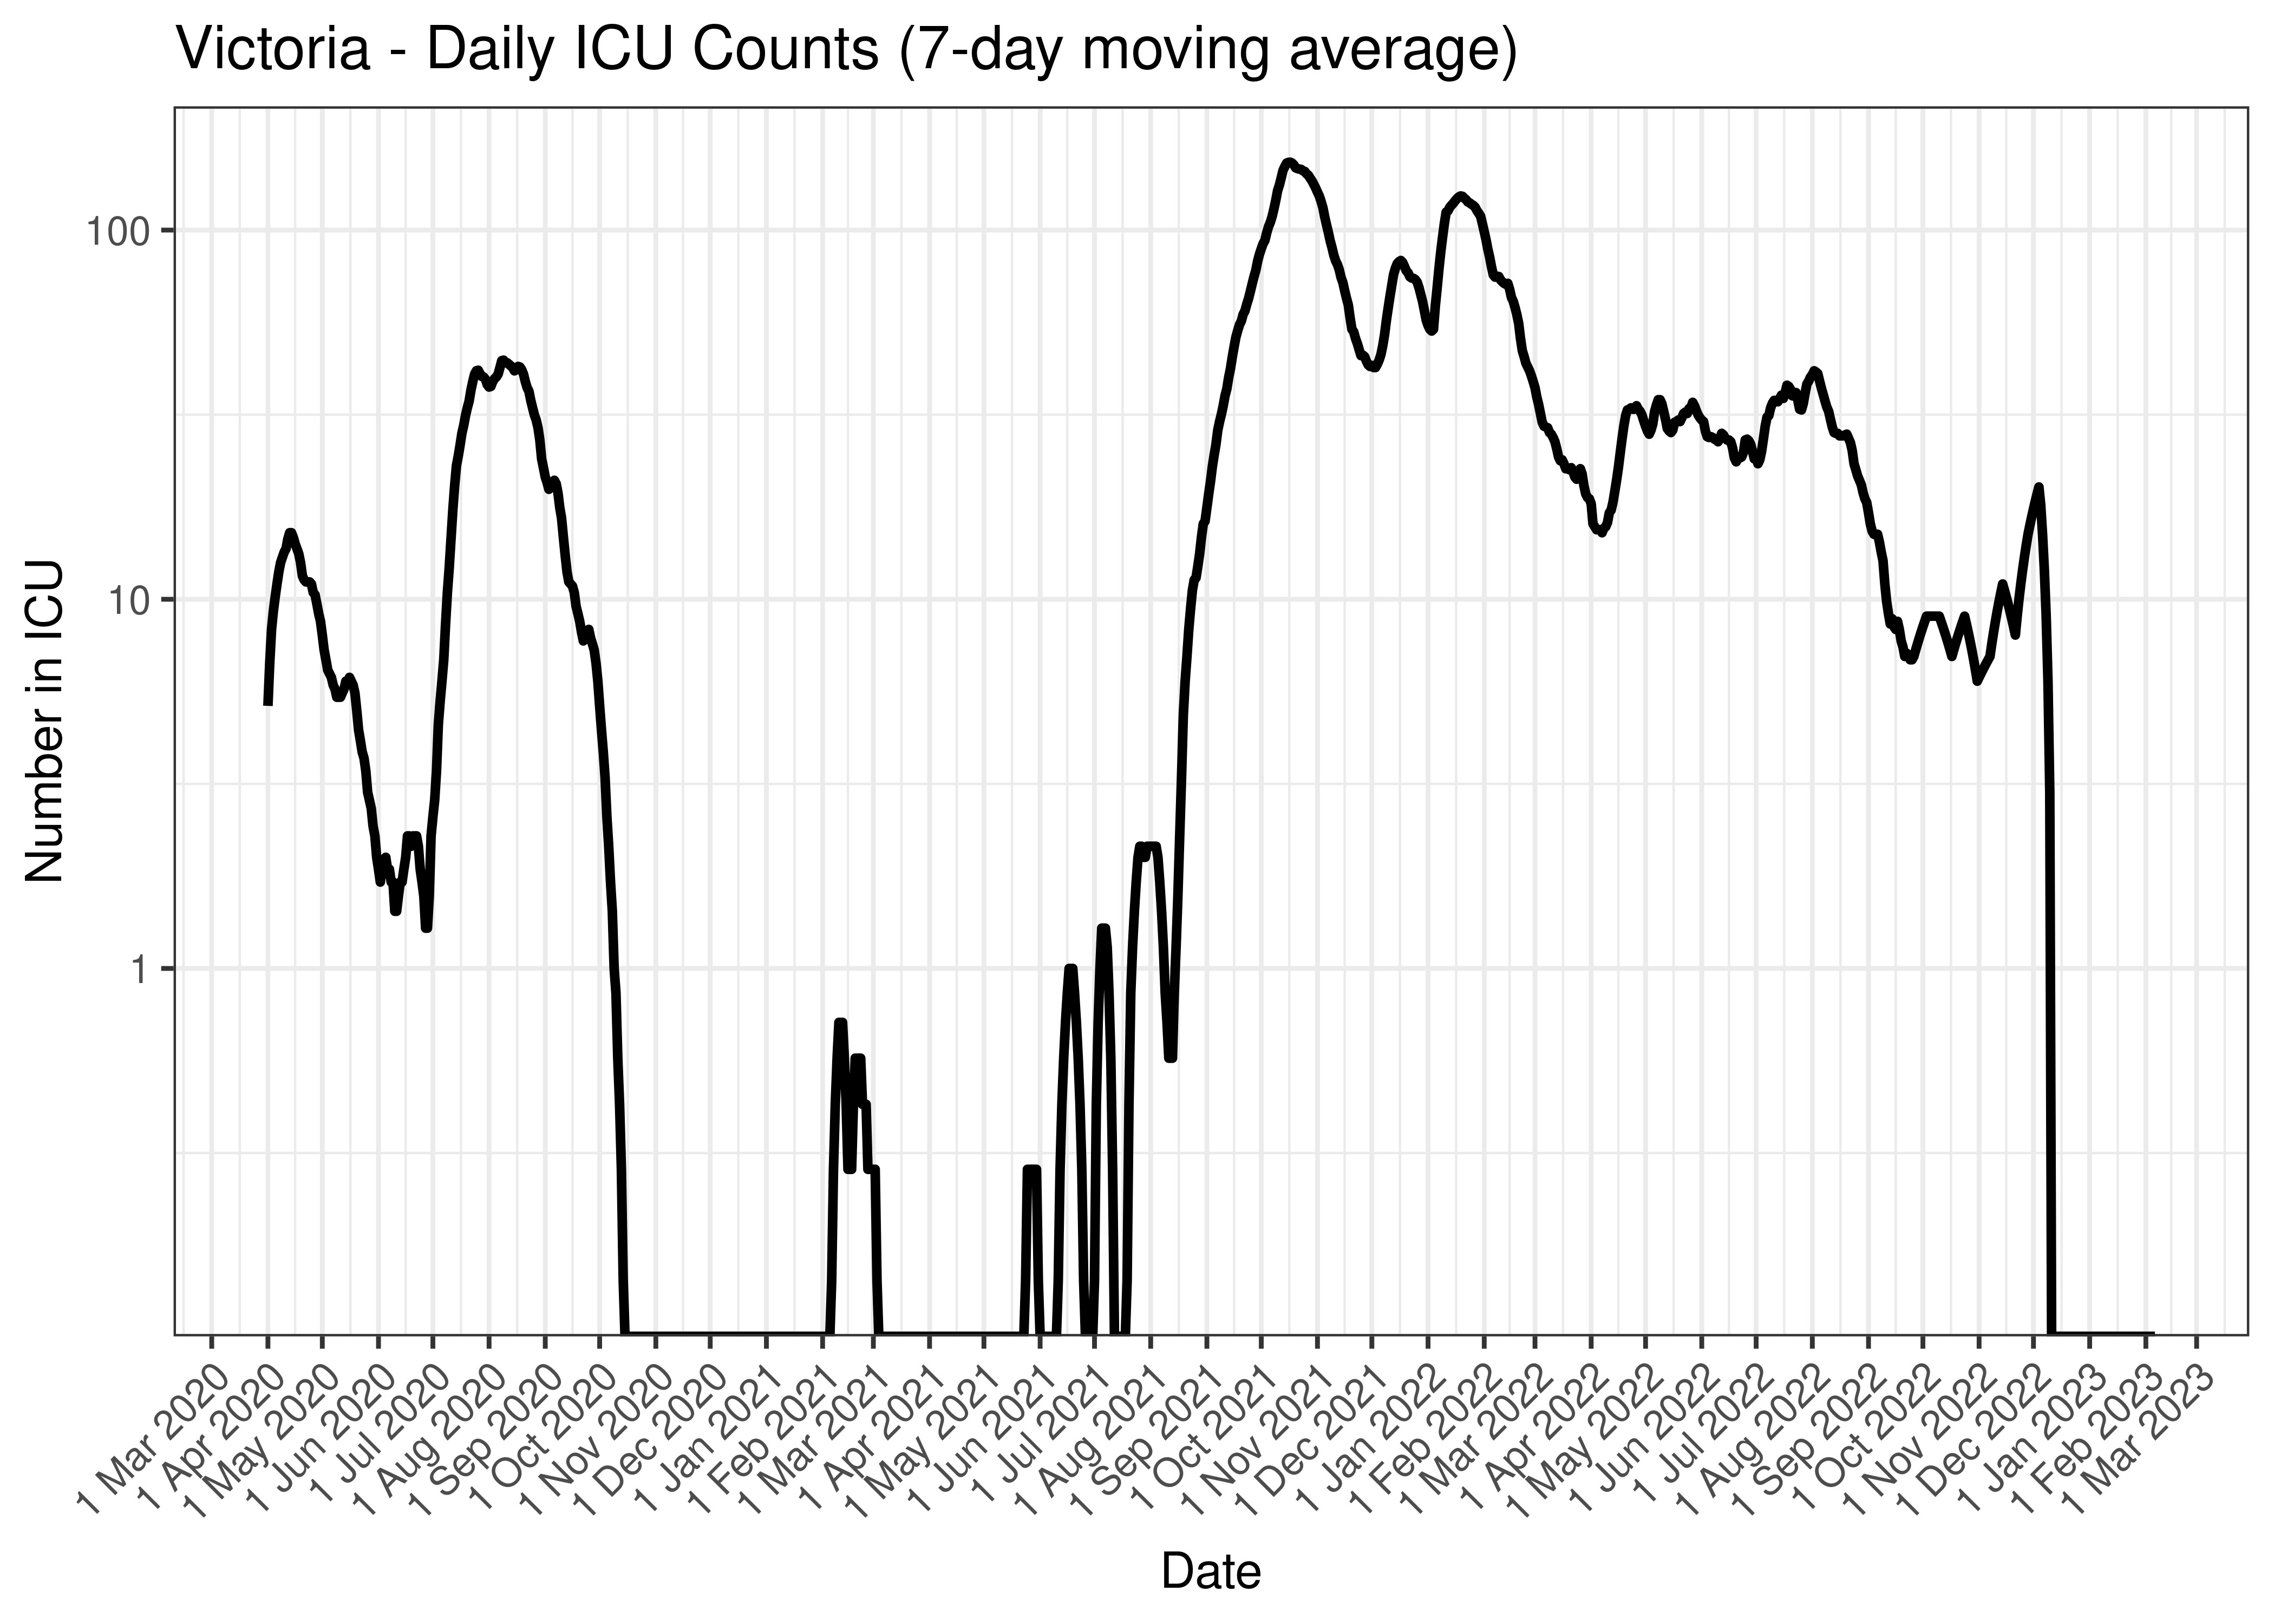
Victoria - Daily ICU Counts (7-day moving average)
Below the above chart is repeated for the last 30-days:
Victoria - Daily ICU Counts for Last 30-days (7-day moving average)
5.8.5 Ventilator
Counts of those on ventilators are tabulated by report date below. A centred 7-day moving average is also shown. The peak daily admissions in previous waves (as measured by the moving average) is also shown.
| Date | On Ventilators | 7-day Moving Average | Comment |
|---|---|---|---|
| 2020-08-17 | 32 | 29 | Wave 2 Peak |
| 2021-10-19 | 100 | 99 | Wave 3 Peak |
| 2021-12-17 | 43 | 44 | Wave 4 Peak (to date) |
| 2023-02-03 | 0 | 0 | |
| 2023-02-04 | 0 | 0 | |
| 2023-02-05 | 0 | 0 | |
| 2023-02-06 | 0 | 0 | |
| 2023-02-07 | 0 | NA | |
| 2023-02-08 | 0 | NA | |
| 2023-02-09 | 0 | NA | |
| 2023-02-10 | NA | NA |
The above are based on the following dates:
- Wave 1 started on 2020-01-01.
- Wave 2 started on 2020-06-01.
- Wave 3 started on 2021-06-01.
- Wave 4 started on 2021-12-01.
Below a 7-day moving average of daily ventilator counts is plotted by on a log scale since start of the epidemic. Note admissions are plotted by date.
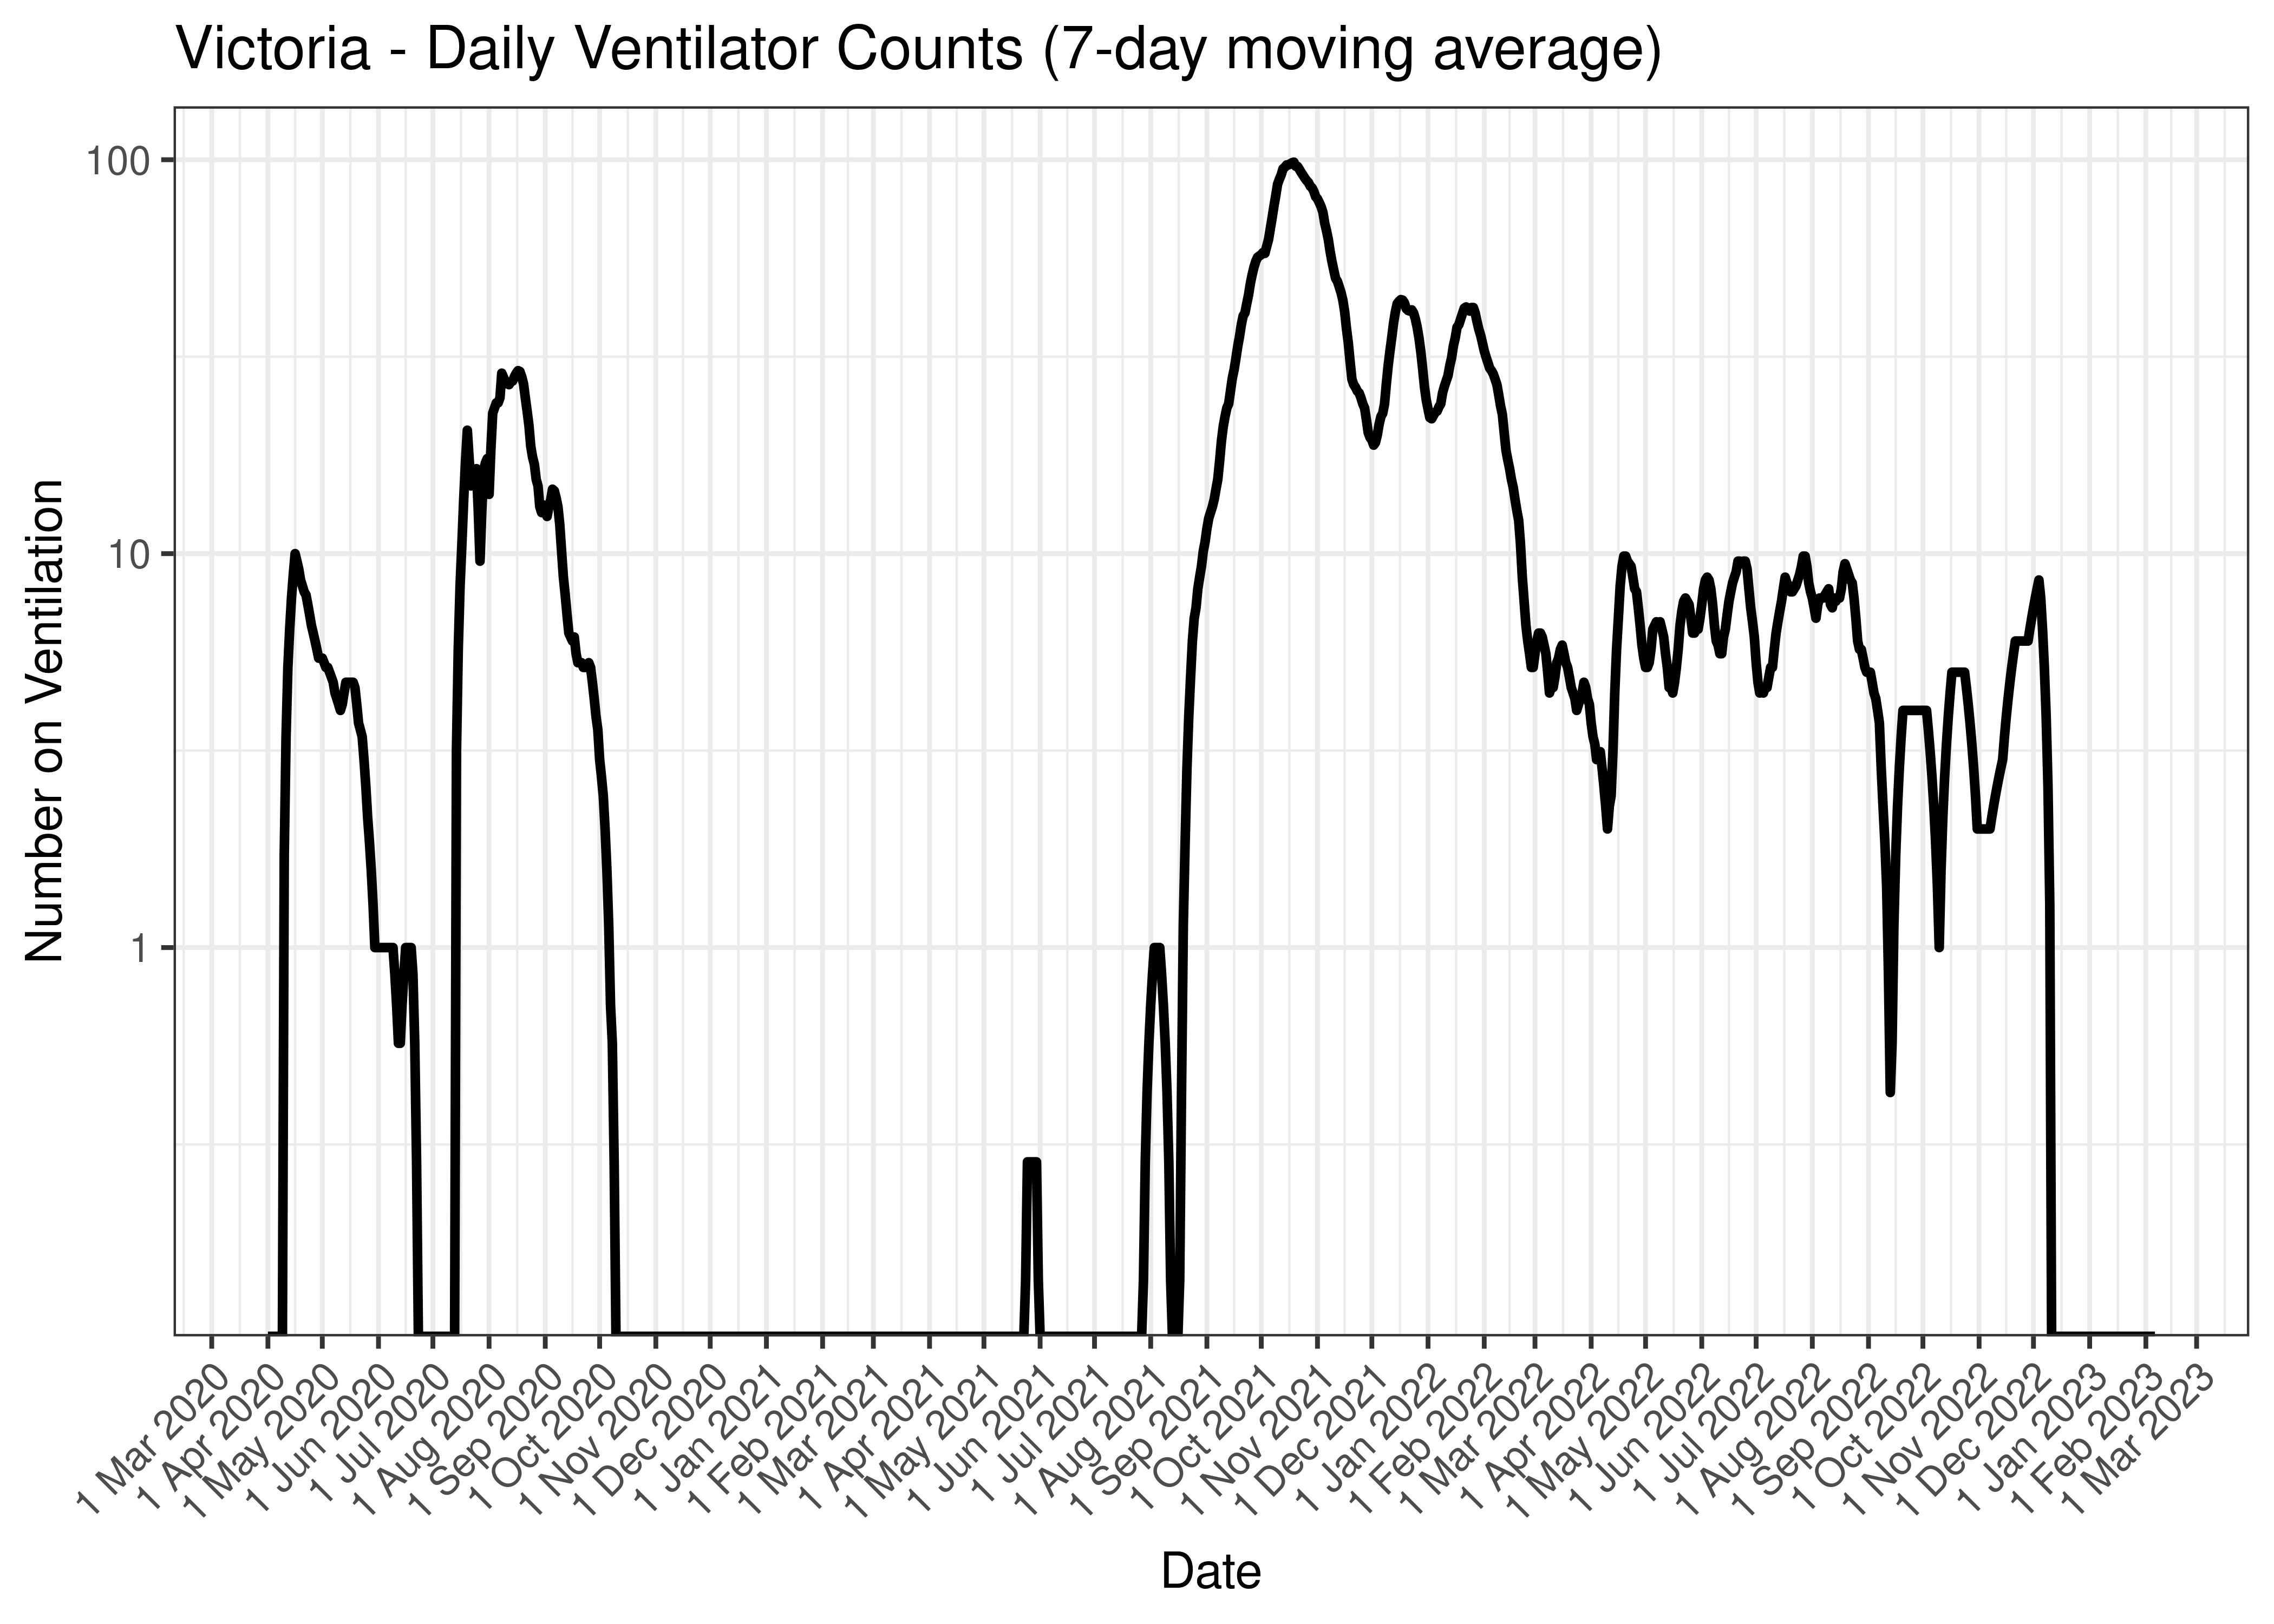
Victoria - Daily Ventilator Counts (7-day moving average)
Below the above chart is repeated for the last 30-days:
Victoria - Daily Ventilator Counts for Last 30-days (7-day moving average)
5.8.6 Deaths
Deaths are tabulated by report date below. A centred 7-day moving average is also shown. The peak daily deaths in previous waves (as measured by the moving average) is also shown.
| Date | Deaths | 7-day Moving Average | Comment |
|---|---|---|---|
| 2020-09-01 | 5 | 22 | Wave 2 Peak |
| 2021-10-25 | 7 | 12 | Wave 3 Peak |
| 2022-07-29 | 107 | 43 | Wave 4 Peak (to date) |
| 2023-02-03 | 70 | 10 | |
| 2023-02-04 | 0 | 10 | |
| 2023-02-05 | 0 | 10 | |
| 2023-02-06 | 0 | 10 | |
| 2023-02-07 | 0 | 7 | |
| 2023-02-08 | 0 | NA | |
| 2023-02-09 | 0 | NA | |
| 2023-02-10 | 52 | NA |
The above are based on the following dates:
- Wave 1 started on 2020-01-01.
- Wave 2 started on 2020-06-01.
- Wave 3 started on 2021-06-01.
- Wave 4 started on 2021-12-01.
Below a 7-day moving average of daily deaths is plotted by on a log scale since start of the epidemic.
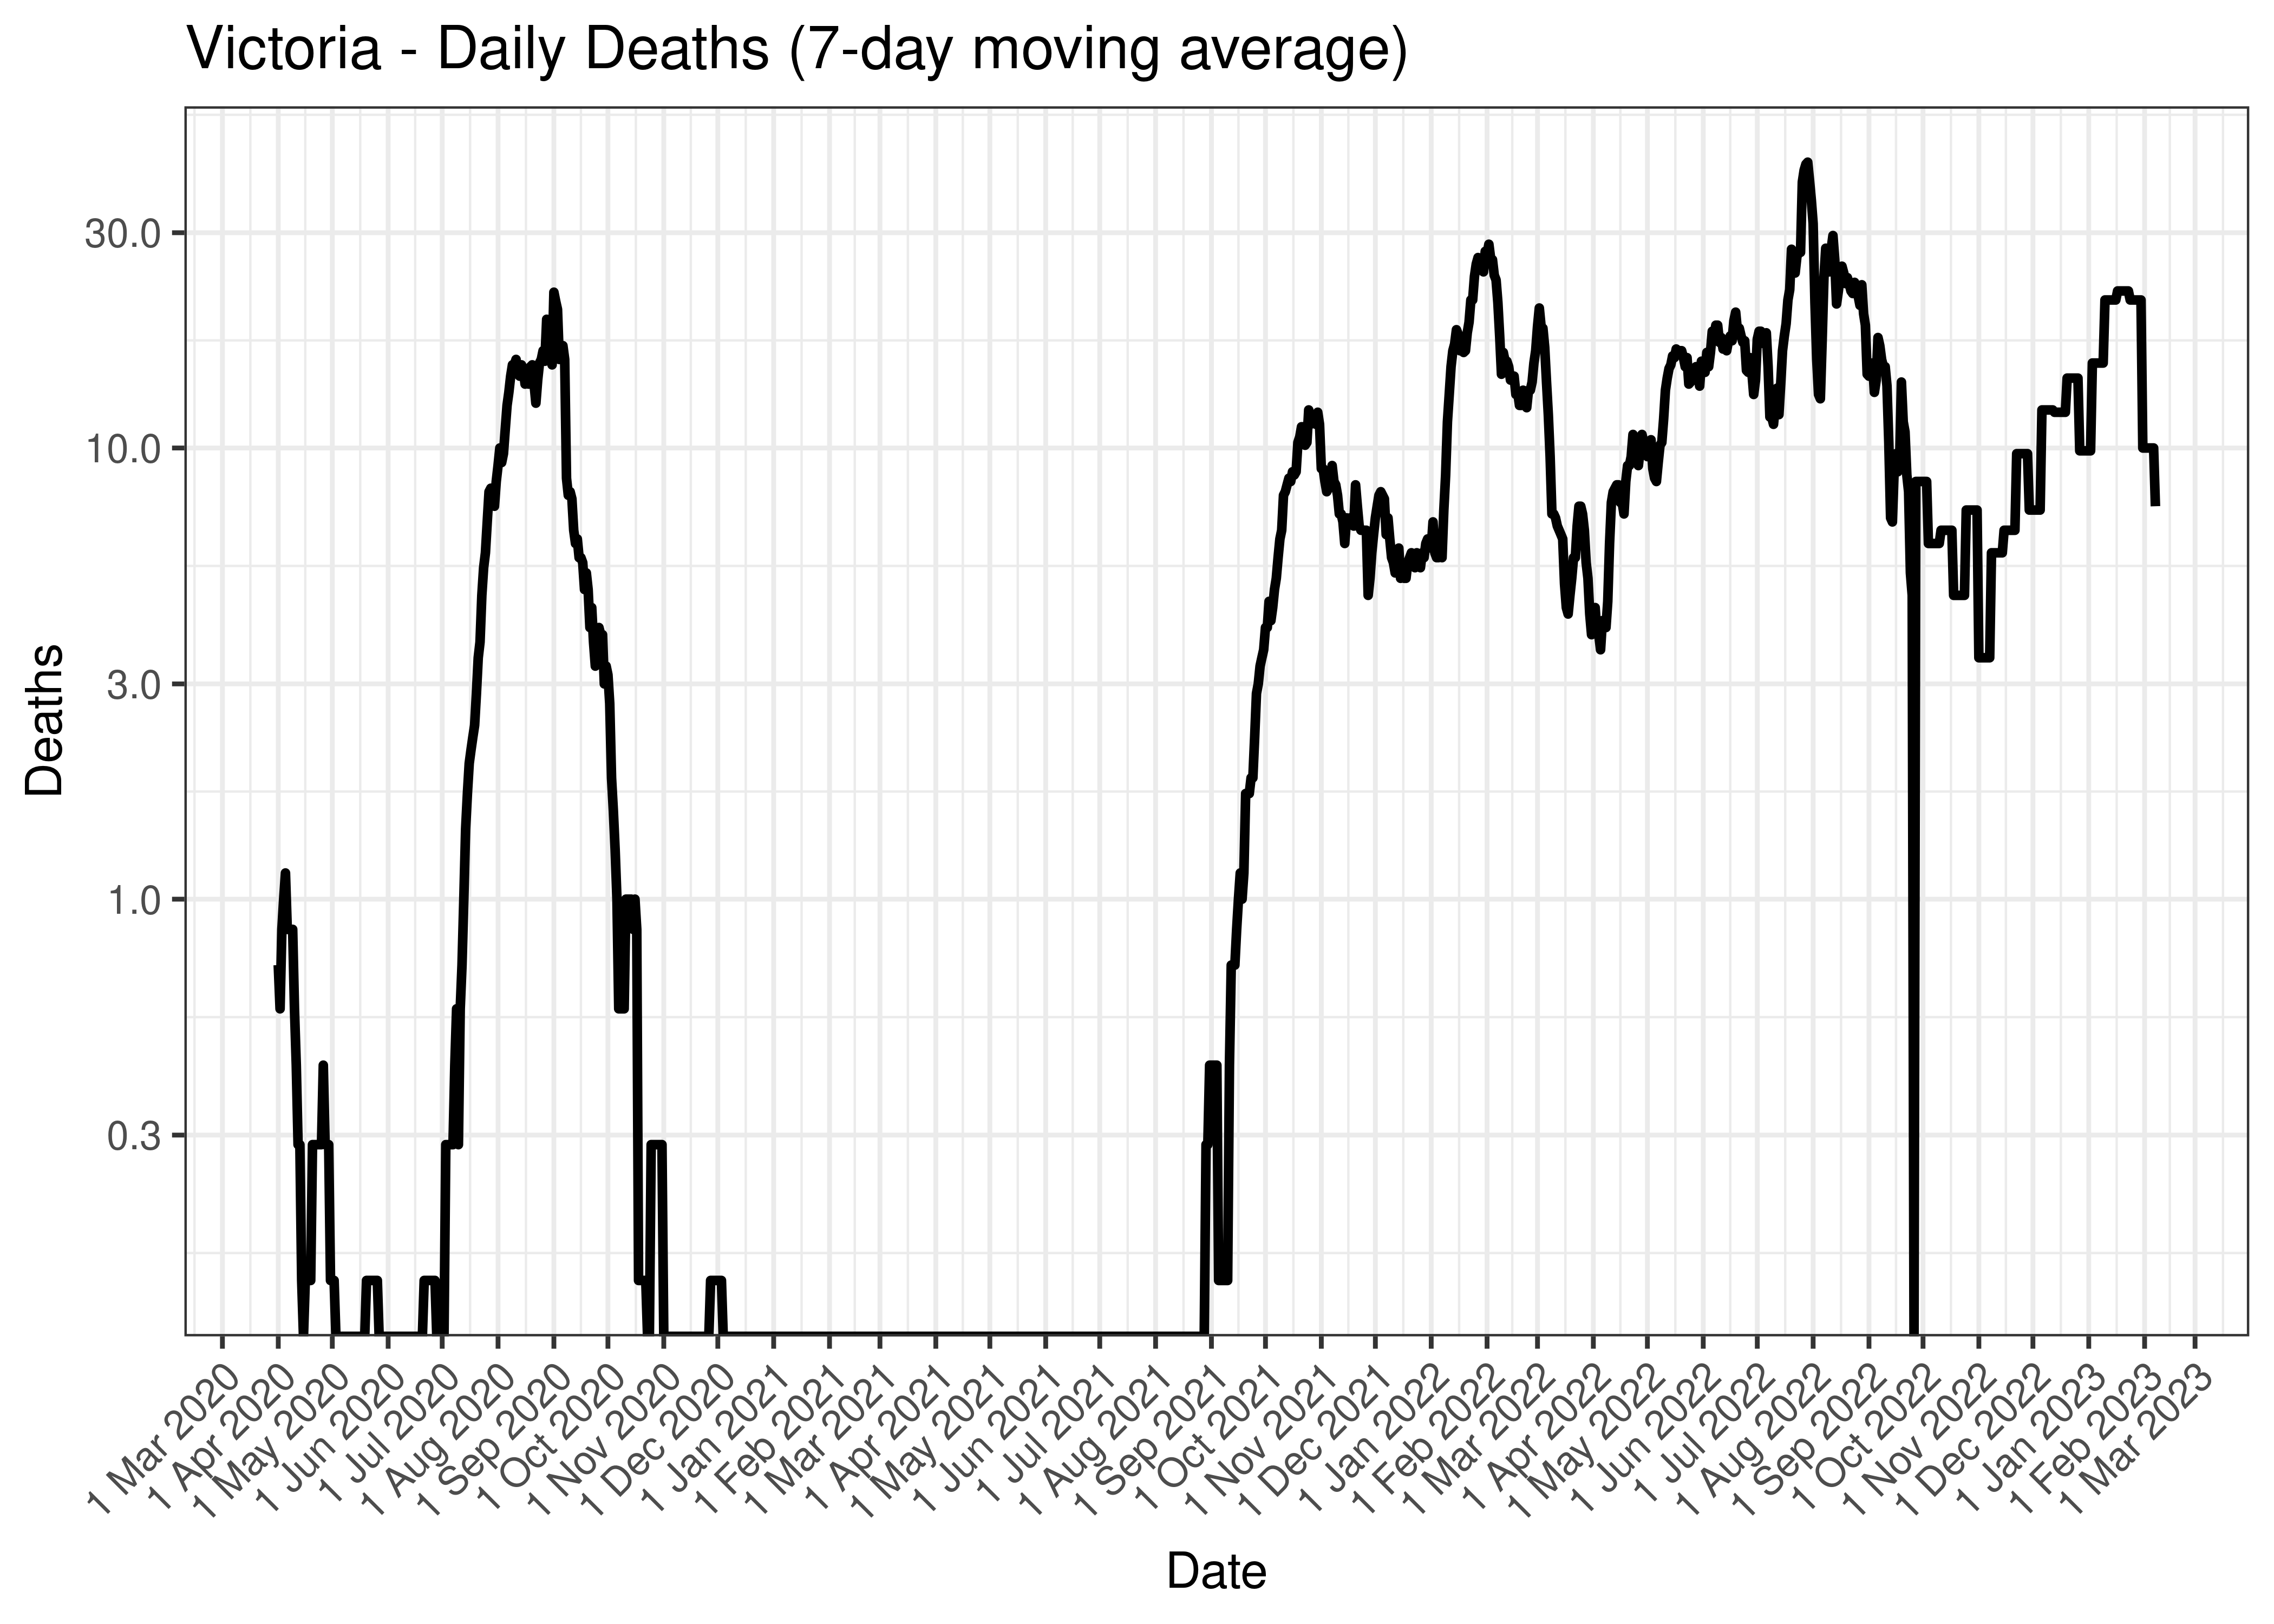
Victoria - Daily Deaths (7-day moving average)
Below the above chart is repeated for the last 30-days:
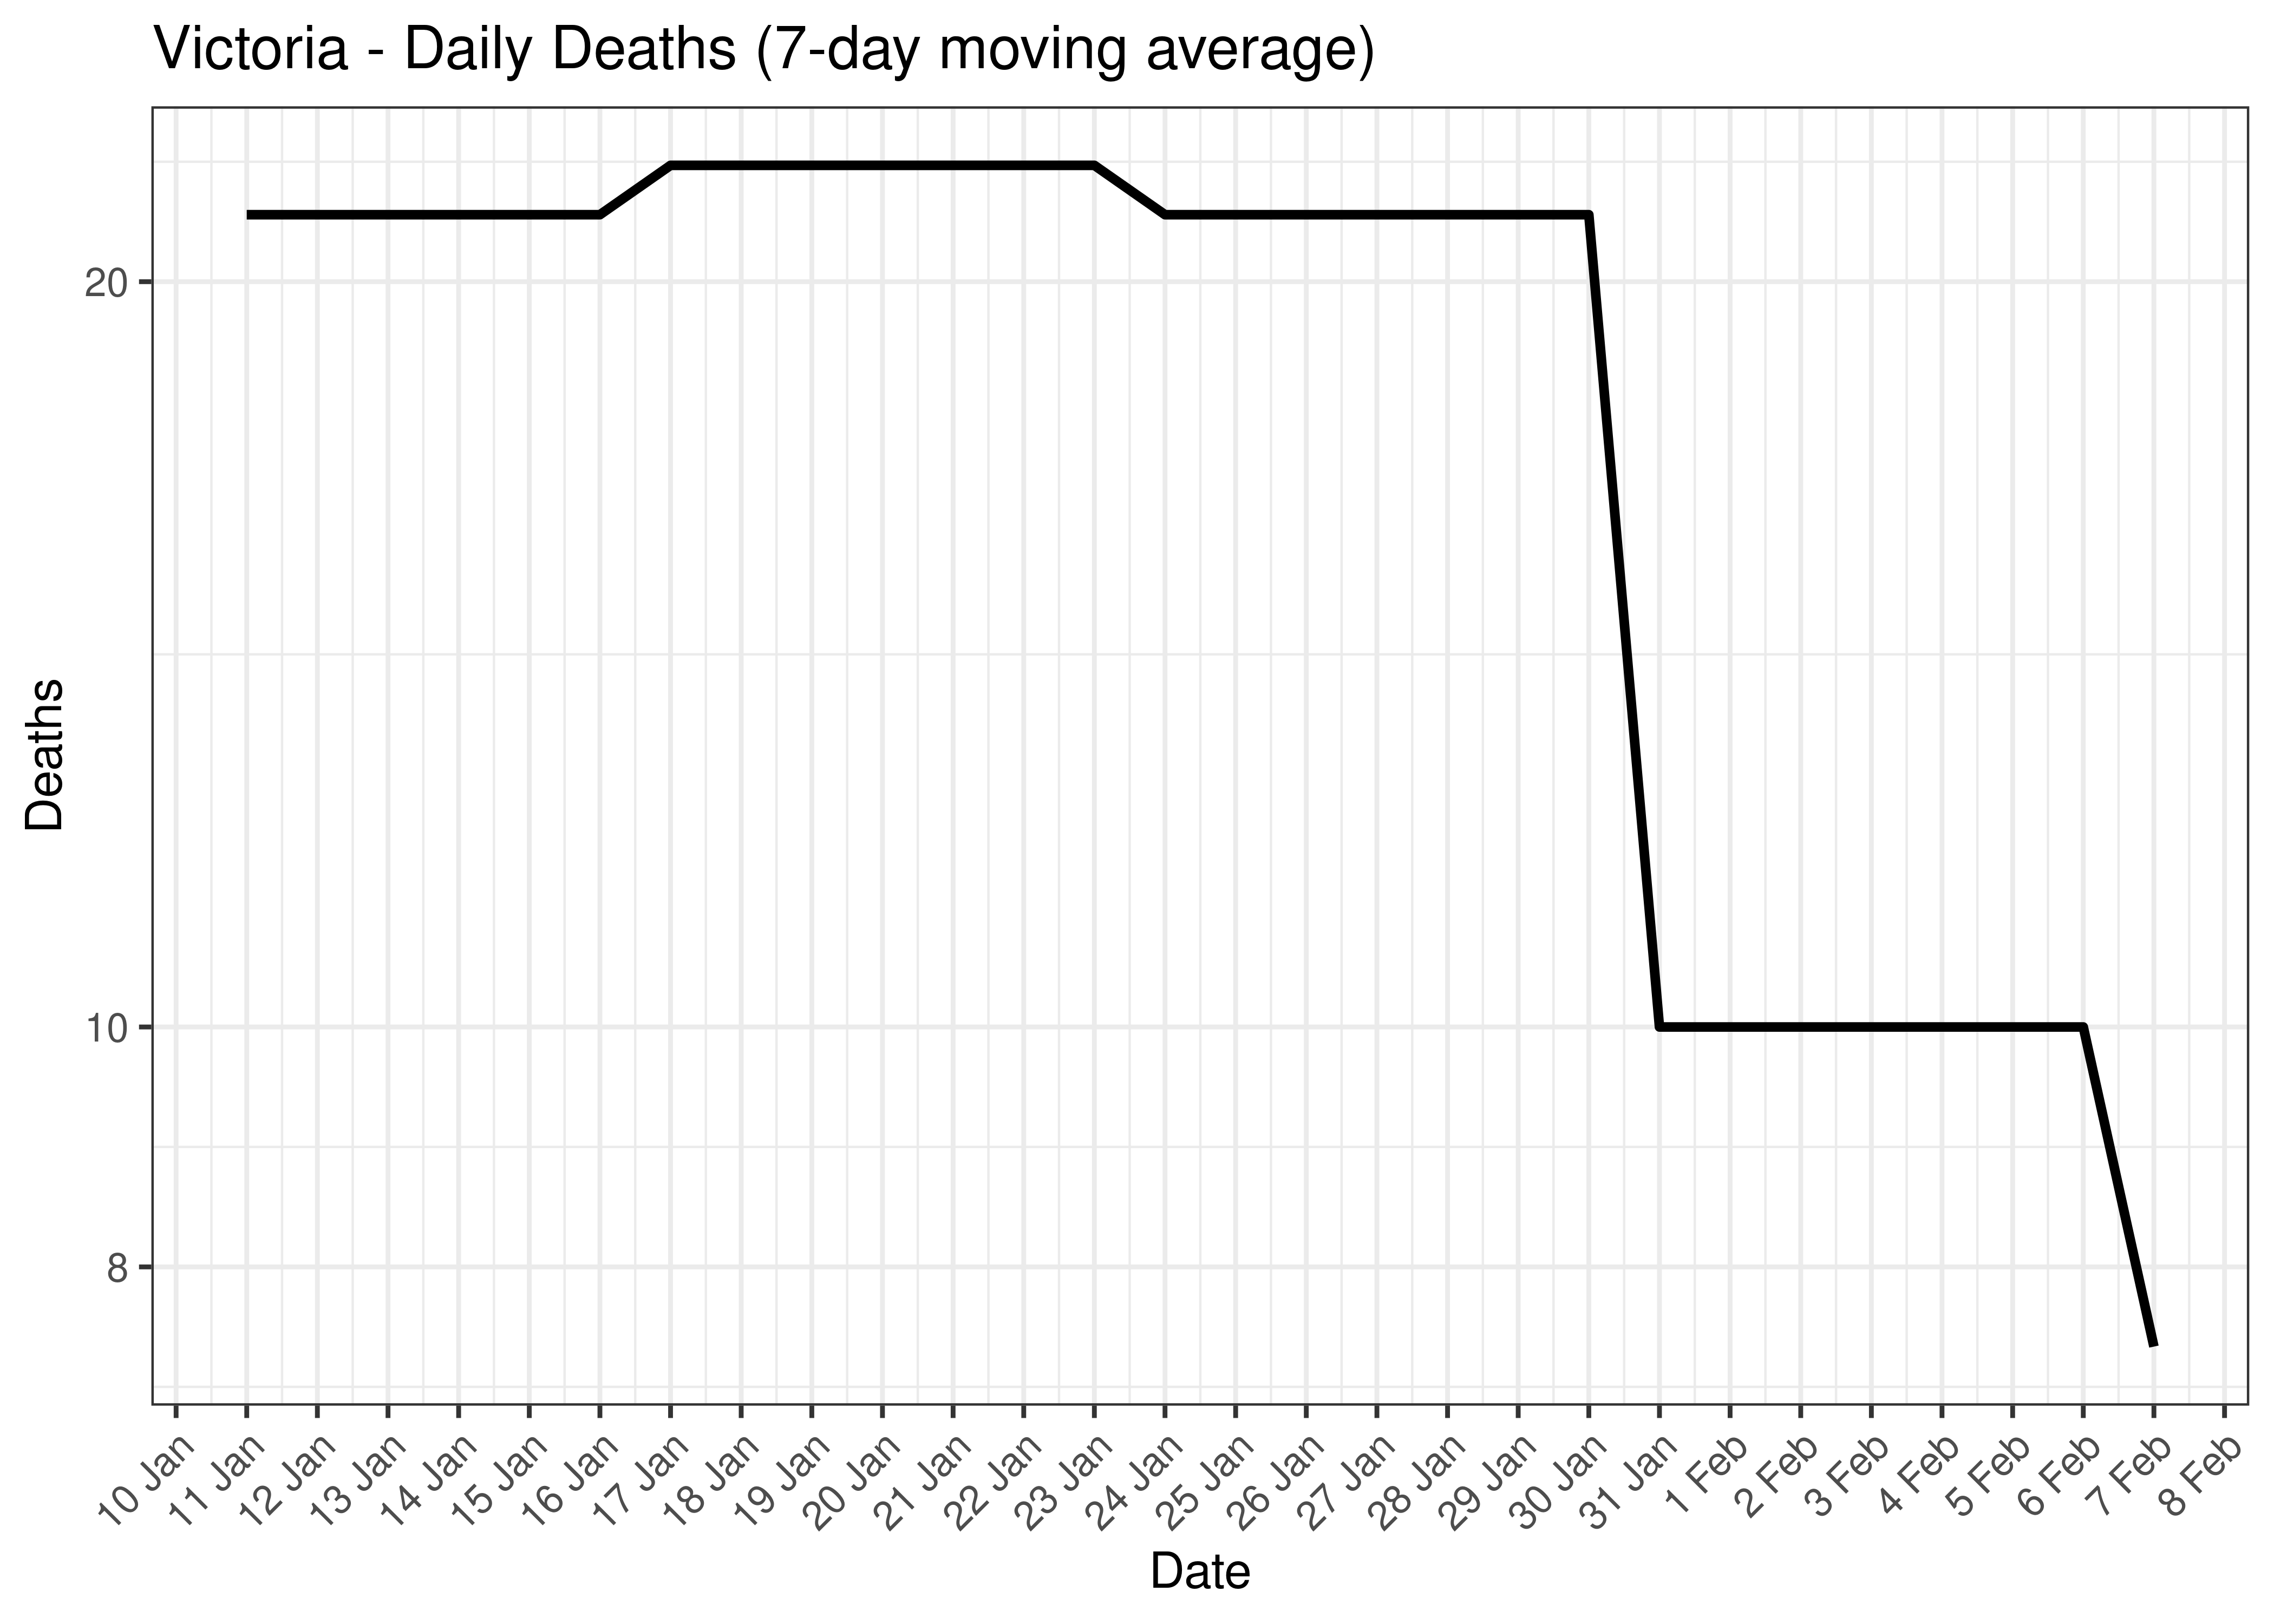
Victoria - Daily Deaths for Last 30-days (7-day moving average)
5.8.7 Cases, Hospital Counts and Deaths Combined
Below a 7-day moving average daily case, hospital counts and deaths are plotted by state on a log scale since start of the epidemic. Note admissions and excess deaths are plotted by date, whereas cases are plotted by specimen received date.
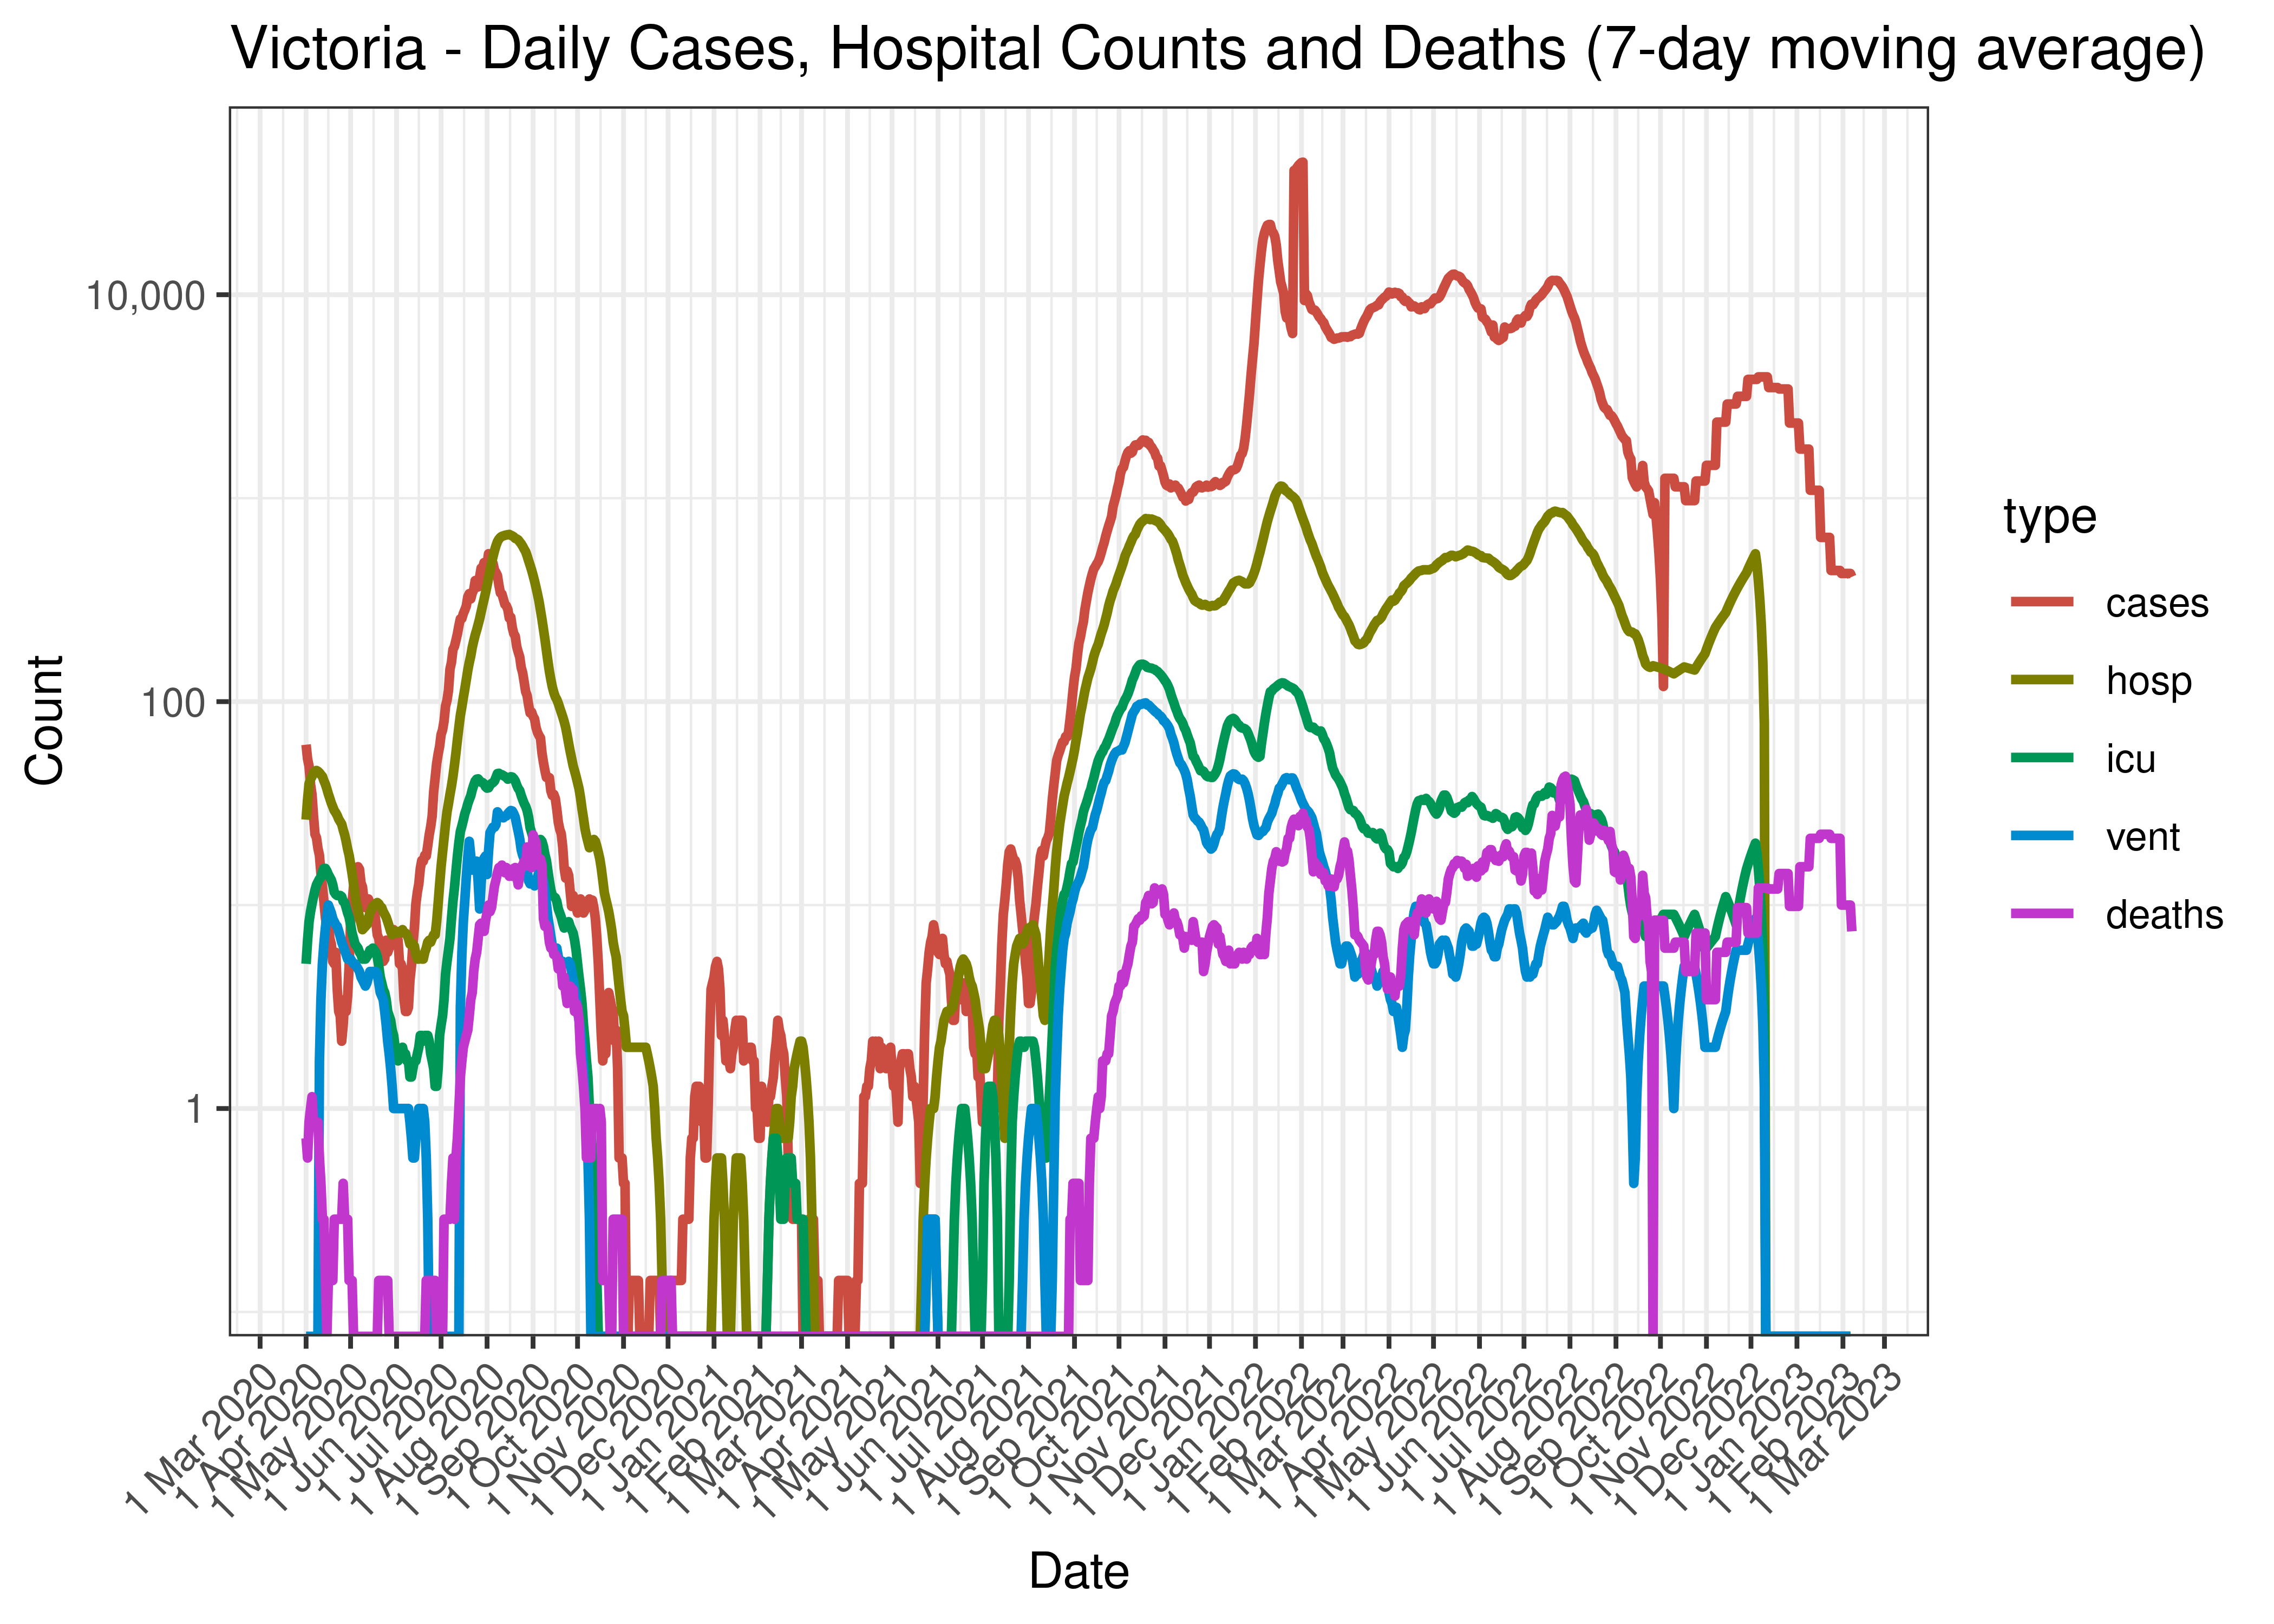
Victoria - Daily Cases, Hospital Counts and Deaths (7-day moving average)
Below the above chart is repeated for the last 30-days:
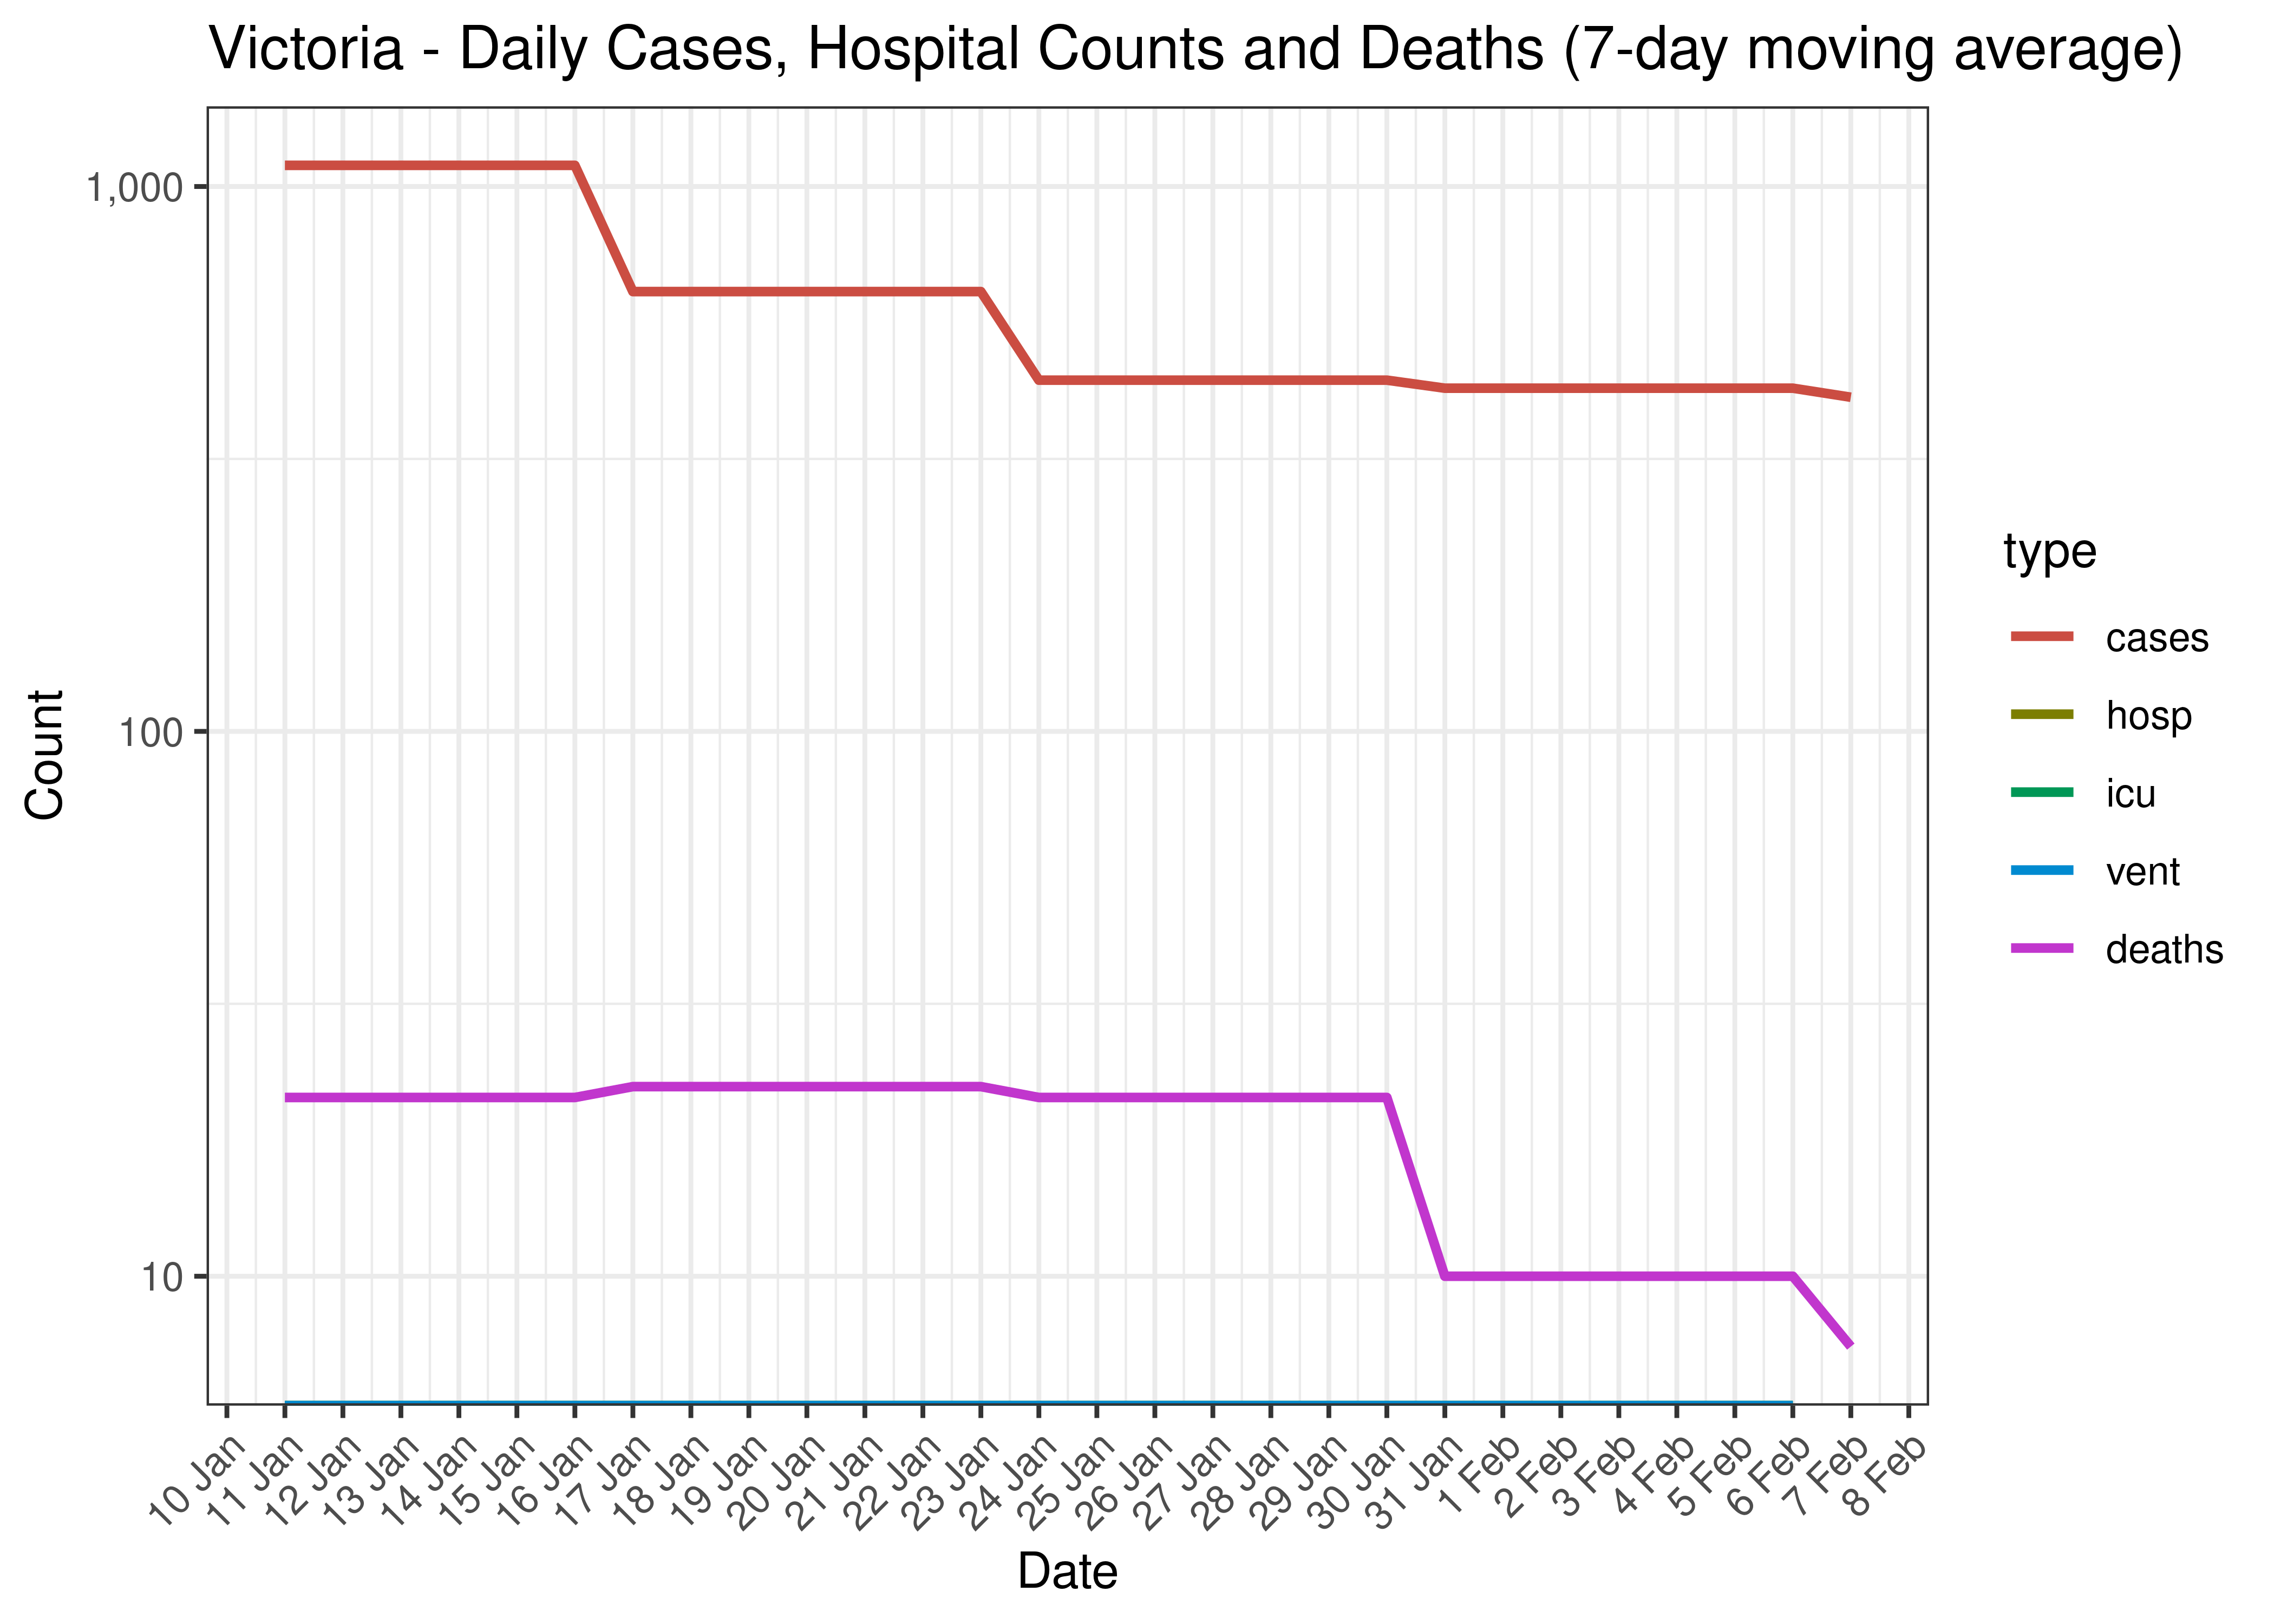
Victoria - Daily Cases, Admissions and Deaths for Last 30-days (7-day moving average)
5.8.8 Crude Ratios per Wave
Below crude rations are calculated between the waves. It’s based on the following starting dates:
- Wave 1 started on 2020-01-01.
- Wave 2 started on 2020-06-01.
- Wave 3 started on 2021-06-01.
- Wave 4 started on 2021-12-01.
Below crude ratios are tabulated and plotted. These ratios are:
- ICU ratio calculated as person days in ICU divided by person days in hospital.
- Ventilator ratio calculated as person days on ventilators divided by person days in hospital.
- Death ratio calculated as deaths divided by person days in hospital.
- Case fatality ratio is calcualted as deaths divided by cases.
| Wave | ICU Ratio | Ventilator Ratio | Death Ratio | Case Fatality Ratio | |
|---|---|---|---|---|---|
| Victoria | Wave 1 | 37.7% | 19.5% | 1.4% | 1.15% |
| Victoria | Wave 2 | 8.8% | 4.5% | 2.9% | 4.24% |
| Victoria | Wave 3 | 19.5% | 12.2% | 1.3% | 0.51% |
| Victoria | Wave 4 | 8.1% | 2.5% | 3.1% | 0.19% |
5.8.9 Reproduction Number
Below current (last weekly) effective reproduction number estimates are tabulated for Australia and by state.
| Type | Count (Per Day) | Week Ending | Reproduction Number [95% Confidence Interval] | |
|---|---|---|---|---|
| Victoria | cases | 410 | 2023-02-10 | 0.96 [0.92 - 0.99] |
Below the effective reproduction number for Australia over the last 90 days are plotted together with a plot since start of the pandemic.
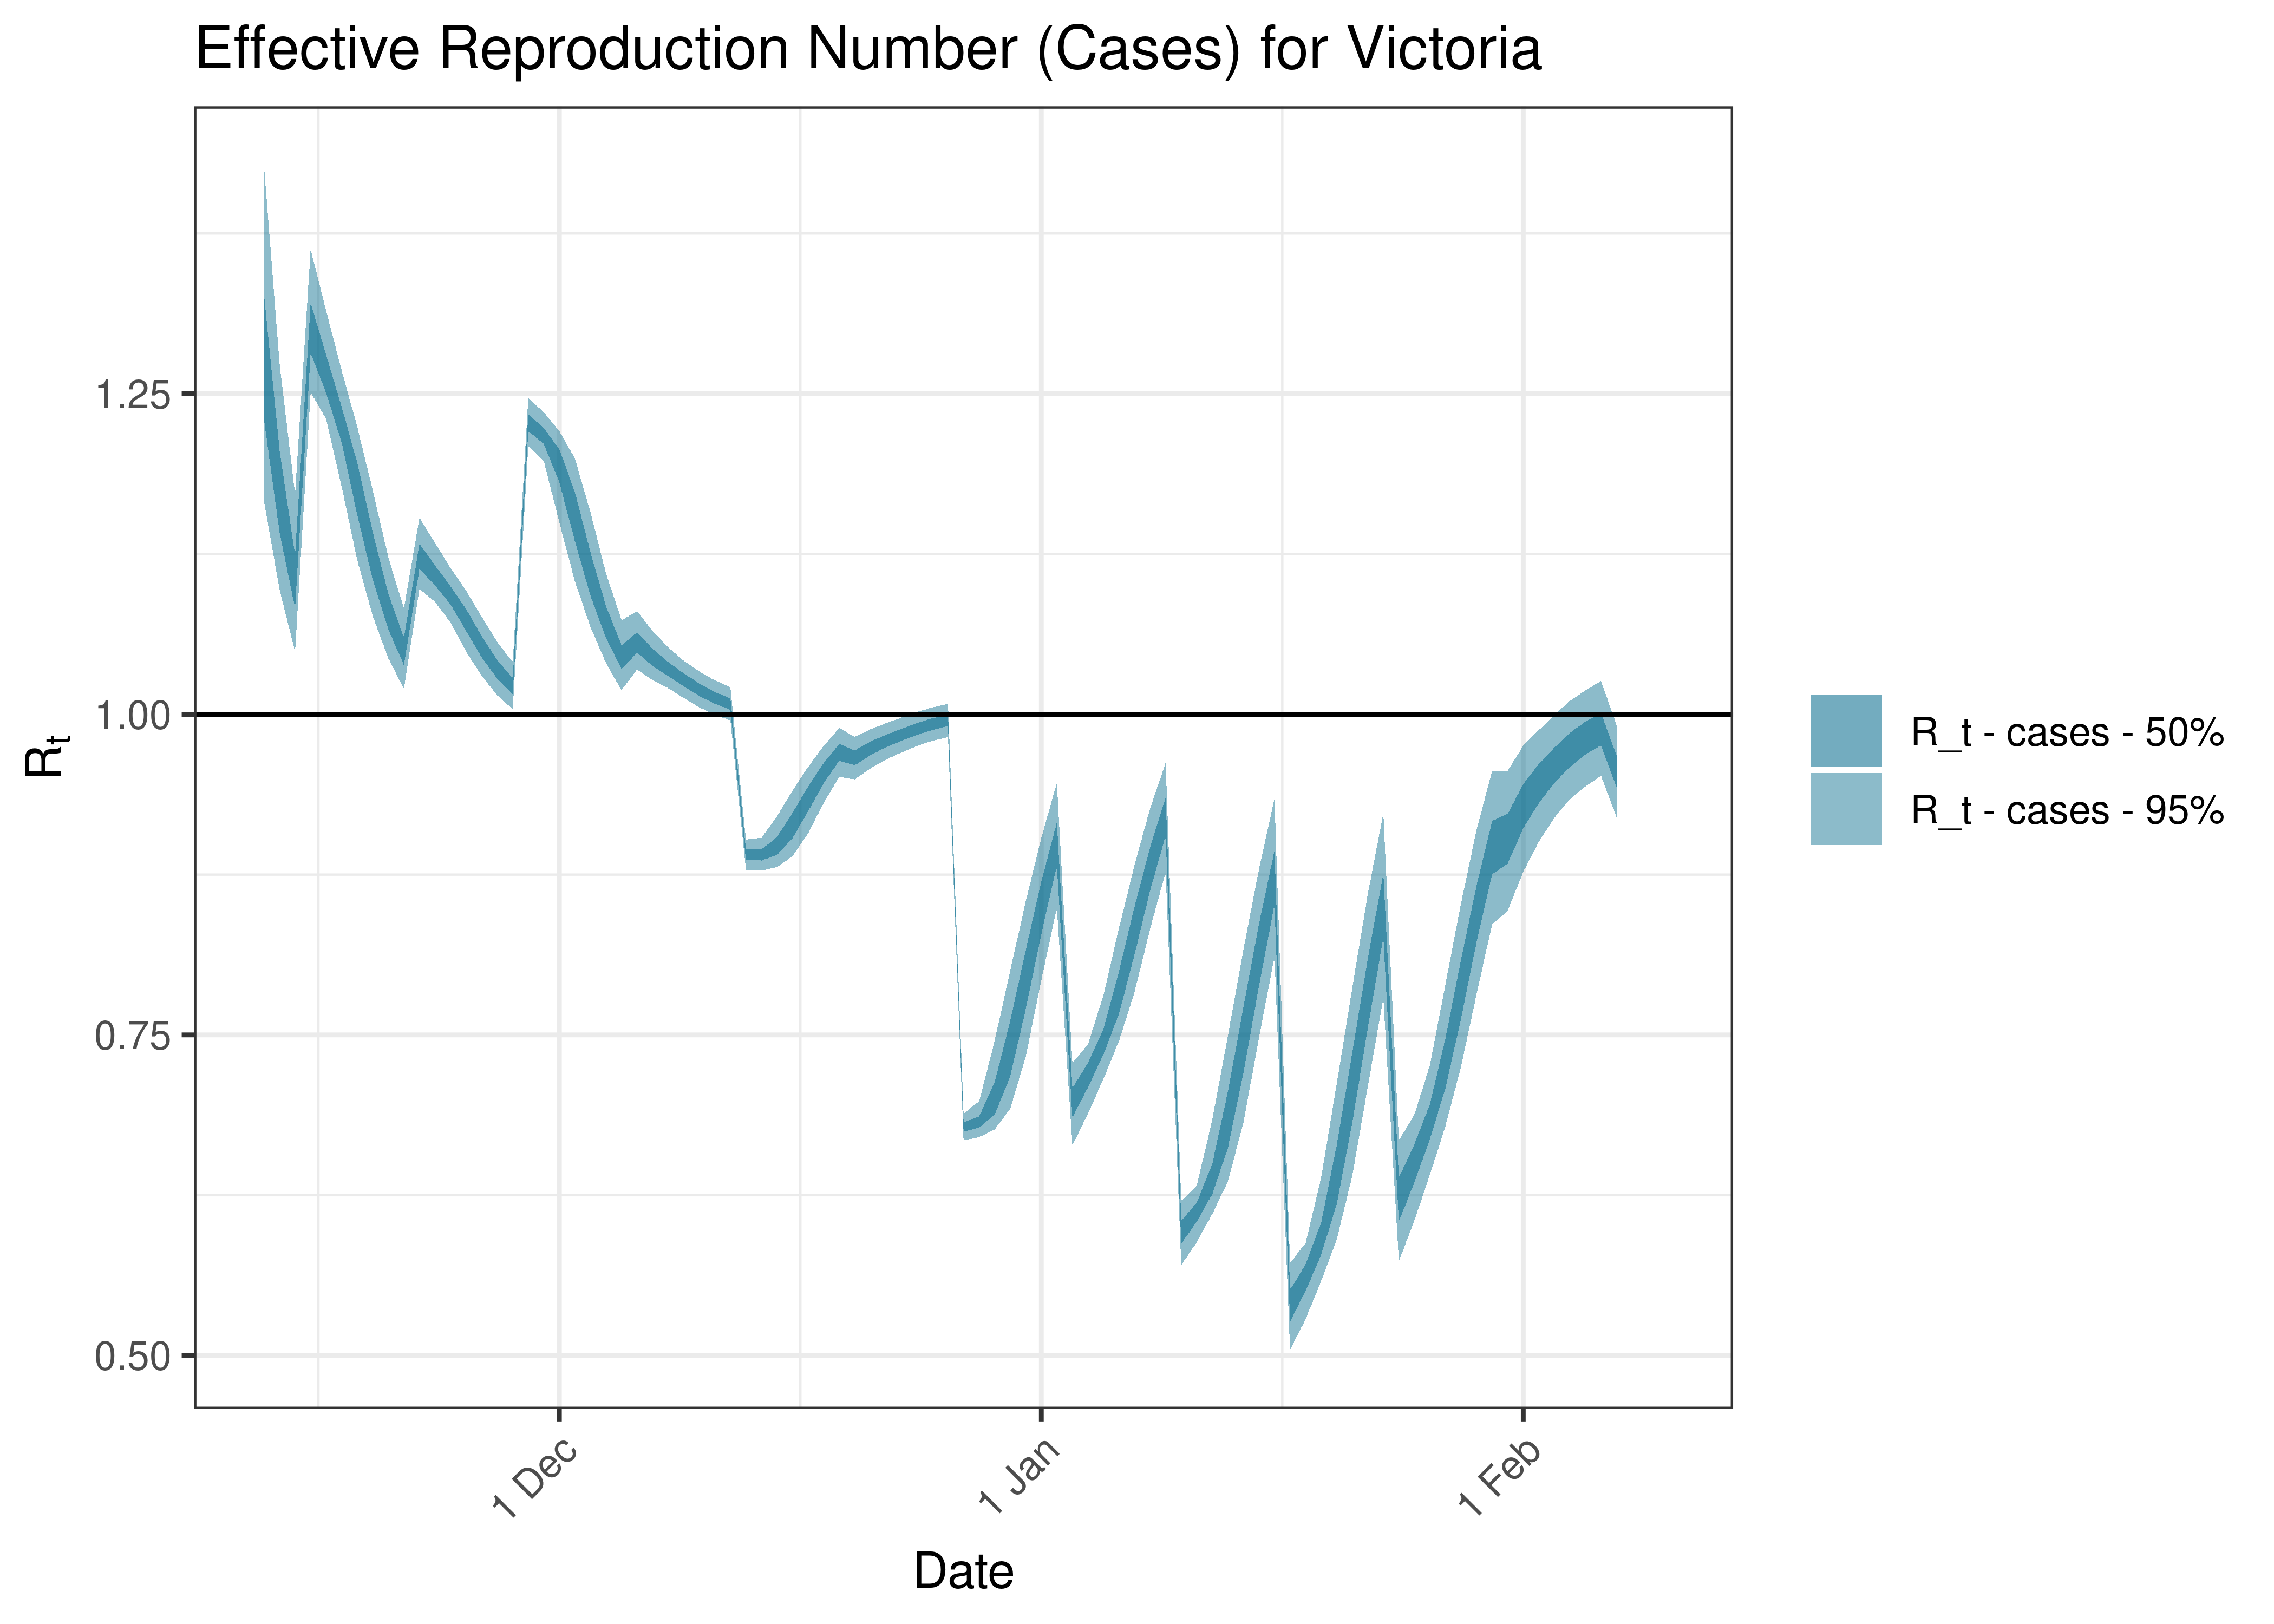
Estimated Effective Reproduction Number Based on Cases for Victoria over last 90 days
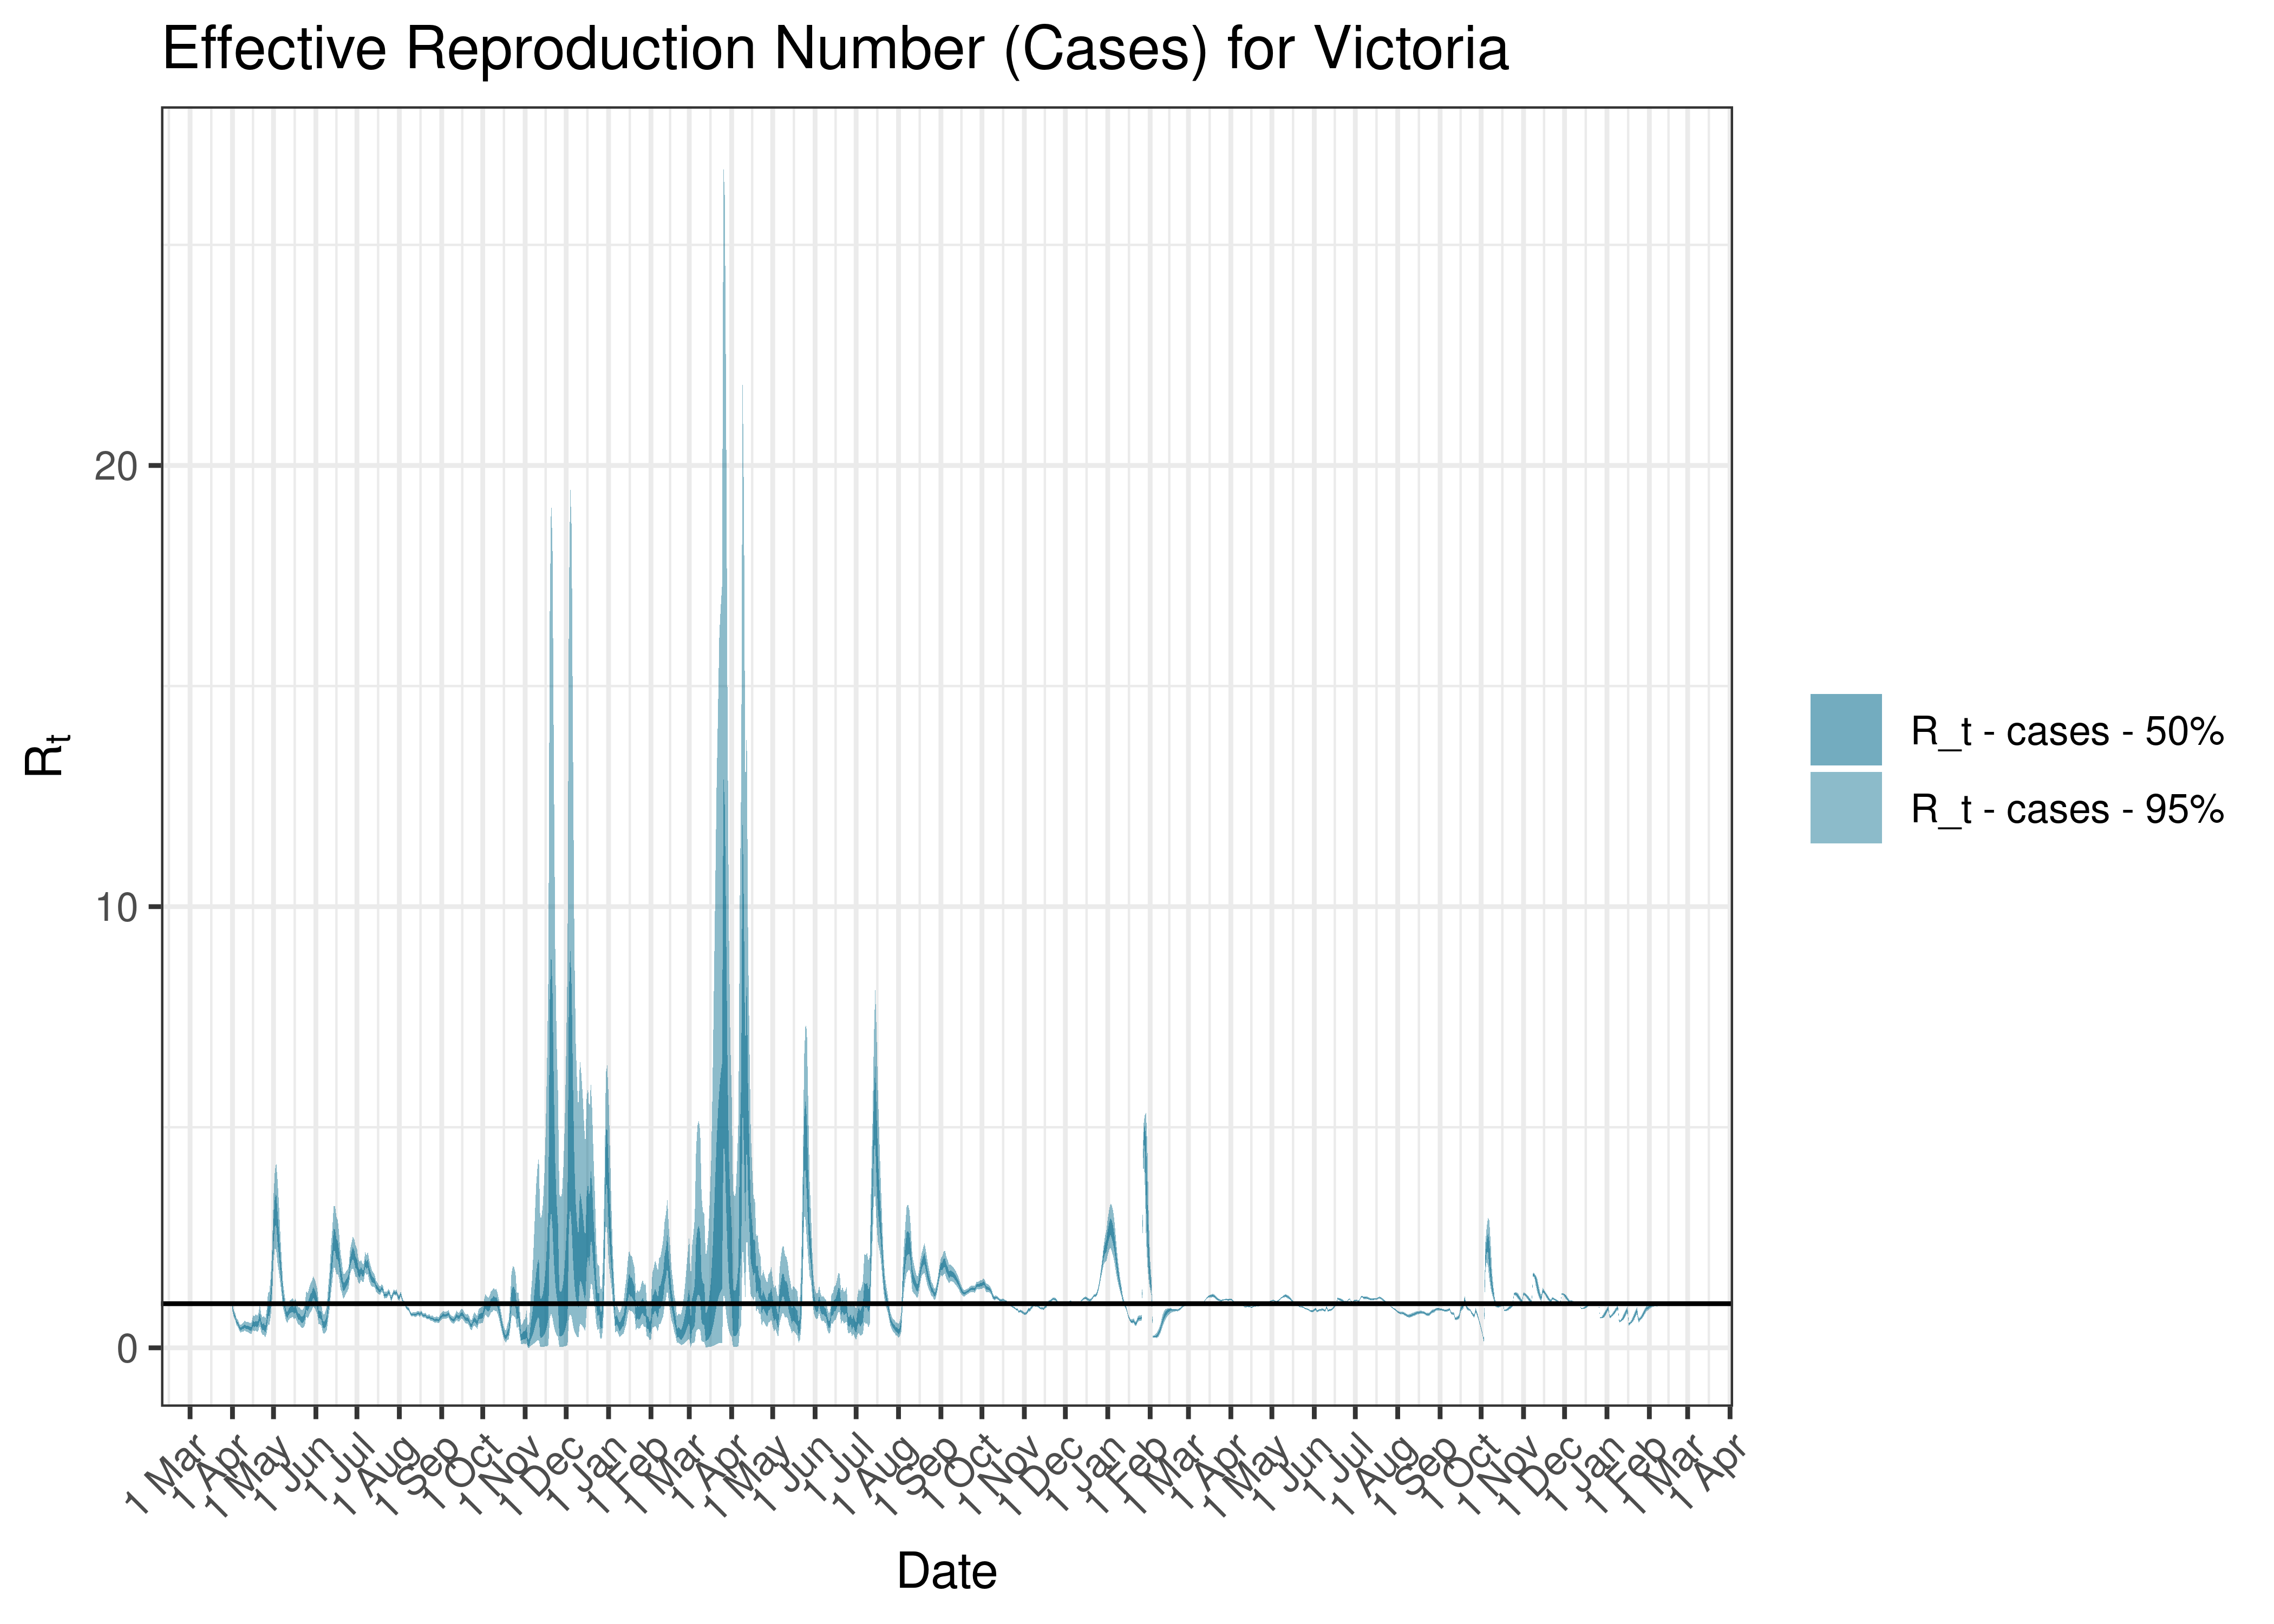
Estimated Effective Reproduction Number Based on Cases for Victoria since 1 April 2020
5.9 Western Australia
5.9.1 Tests
Below raw numbers of test by date are plotted on a 7-day moving average from 1 April 2020.
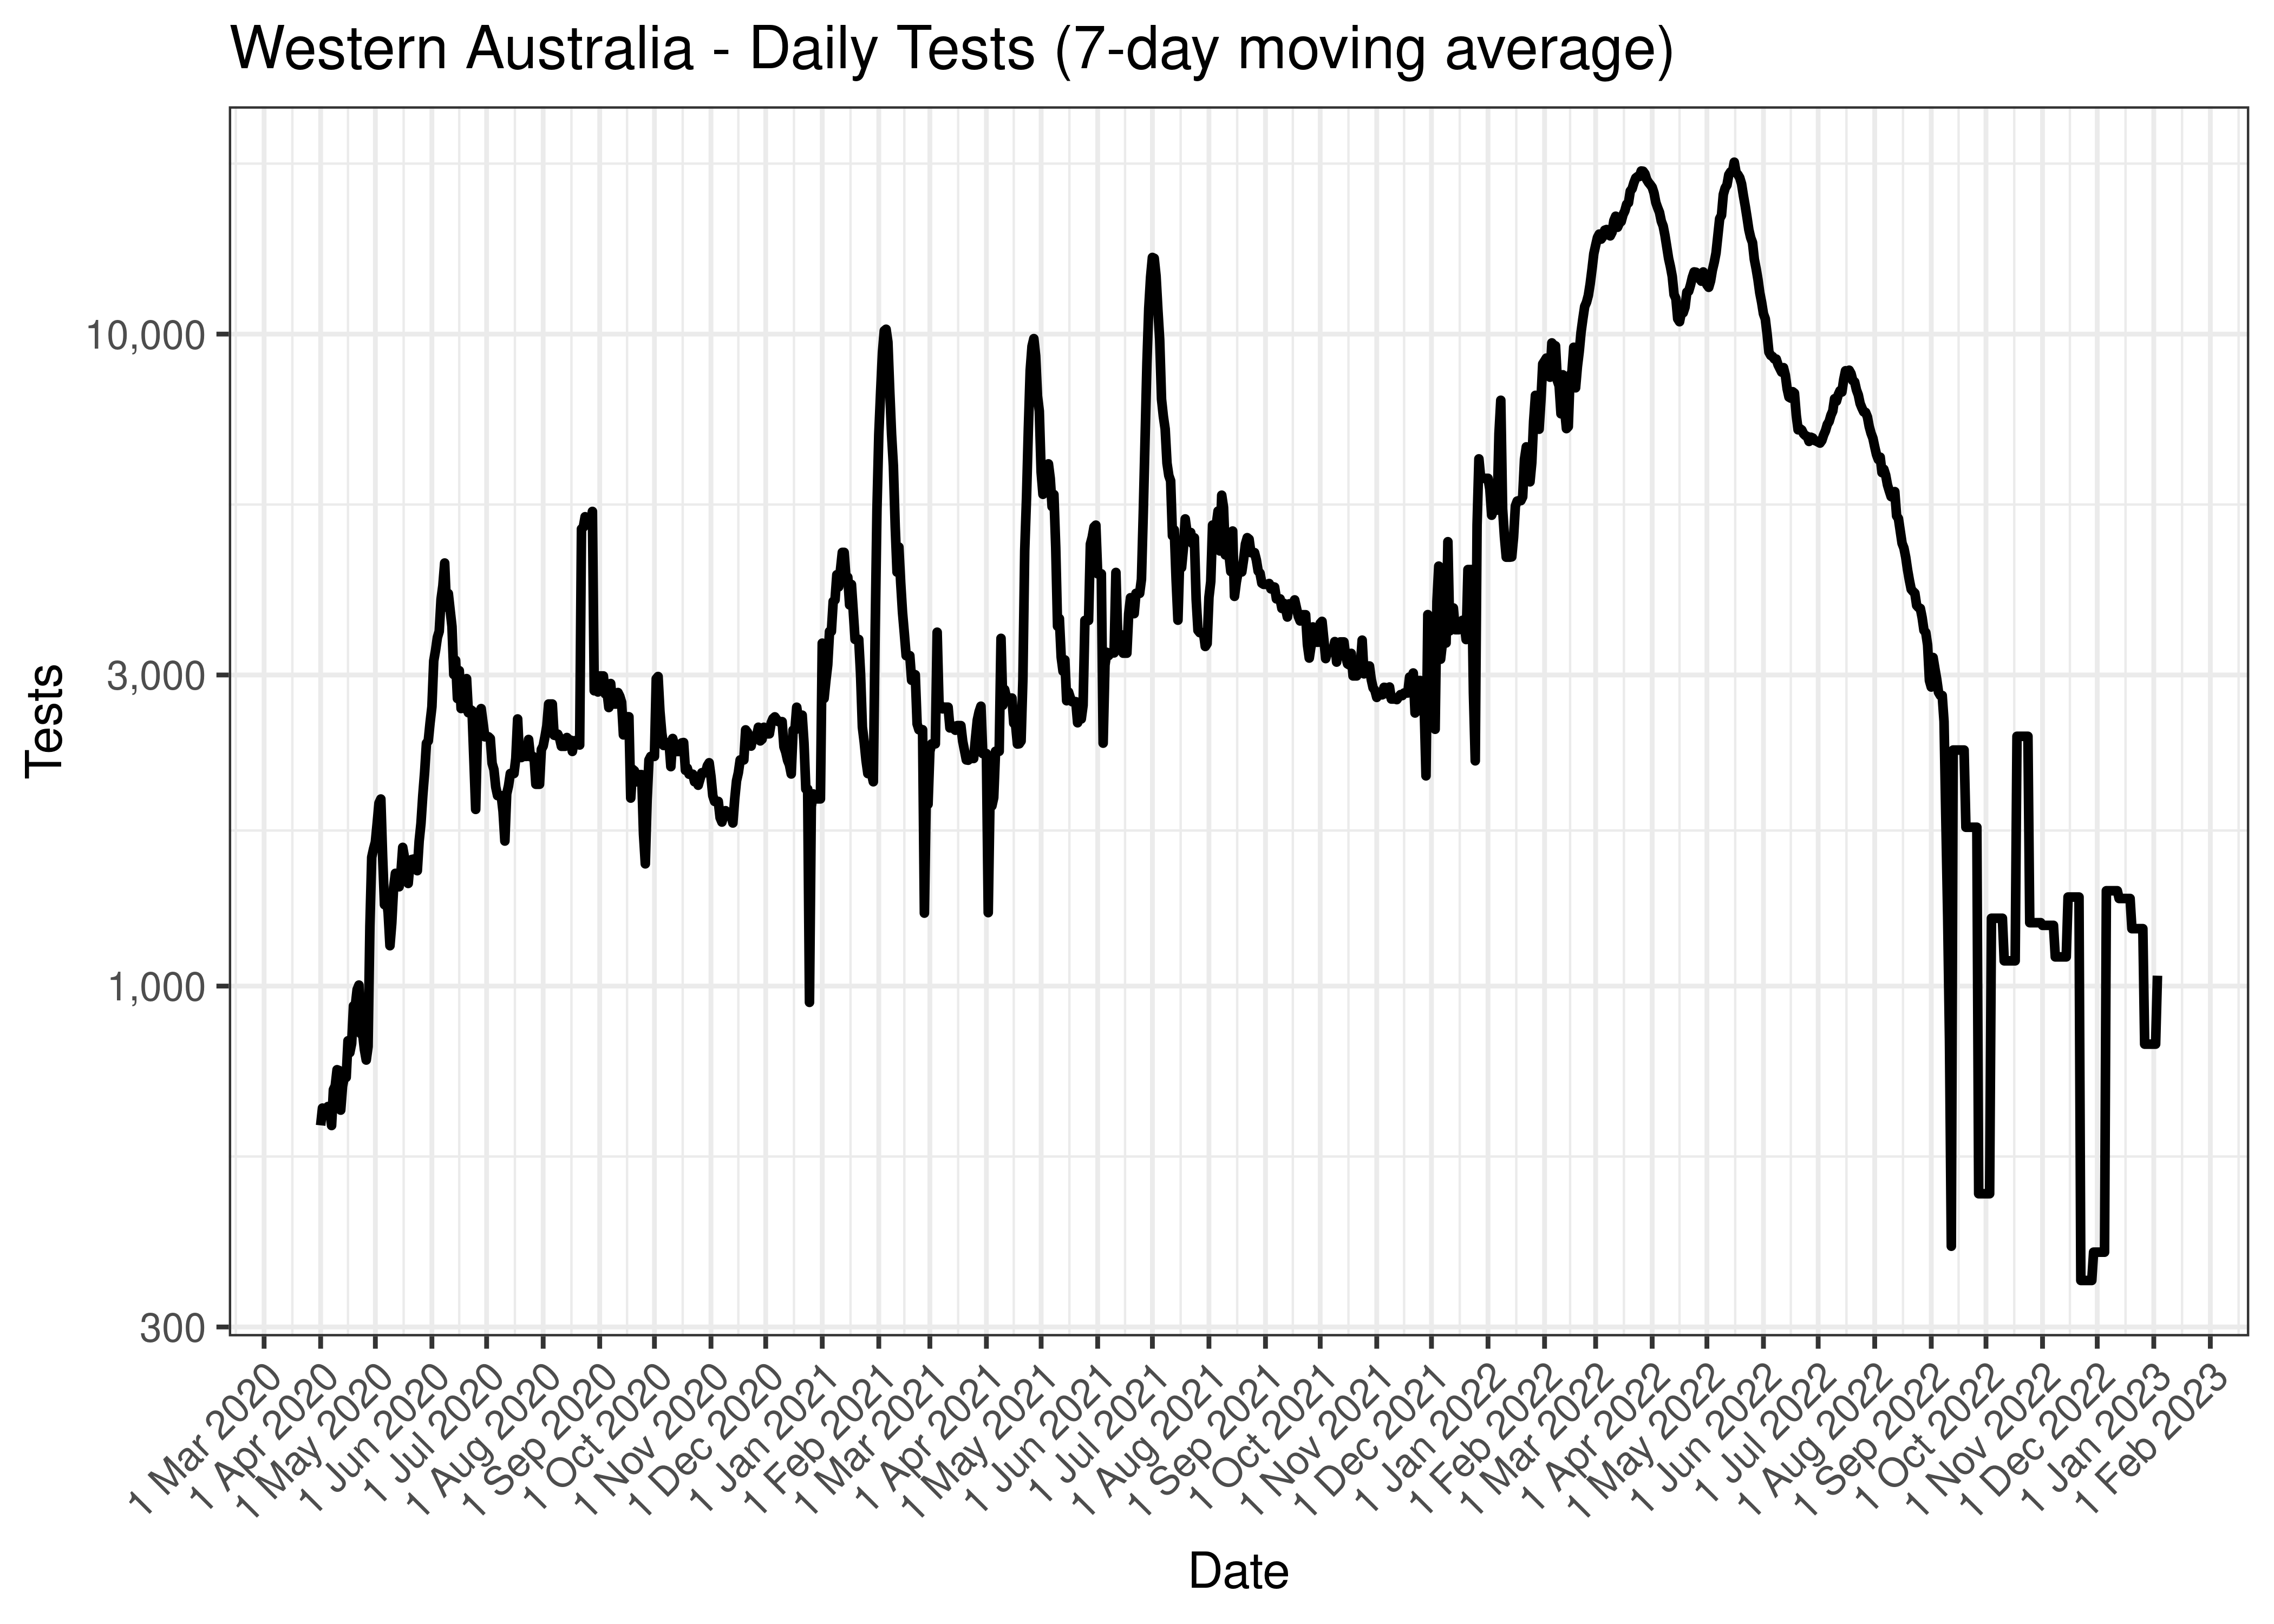
Western Australia - Daily Tests (7-day moving average)
The above chart is repeated below covering the last 30 days only.
Western Australia - Daily Tests for Last 30 Days (7-day moving average)
5.9.2 Cases
Cases are tabulated by specimen received date below. Cases include estimates for late reporting in recent days as well as adjustments for any public holidays. A centred 7-day moving average is also shown. The peak daily cases in previous waves (as measured by the moving average) is also shown.
| Date | Cases | 7-day Moving Average | Comment |
|---|---|---|---|
| 2020-03-27 | 24 | 31 | Wave 1 Peak |
| 2022-05-18 | 16,226 | 14,686 | Wave 4 Peak (to date) |
| 2023-02-03 | 2,139 | 306 | |
| 2023-02-04 | 0 | 306 | |
| 2023-02-05 | 0 | 306 | |
| 2023-02-06 | 0 | 306 | |
| 2023-02-07 | 0 | 298 | |
| 2023-02-08 | 0 | NA | |
| 2023-02-09 | 0 | NA | |
| 2023-02-10 | 2,083 | NA |
Below a 7-day moving average daily case count is plotted for Western Australia on a log scale since start of the epidemic:
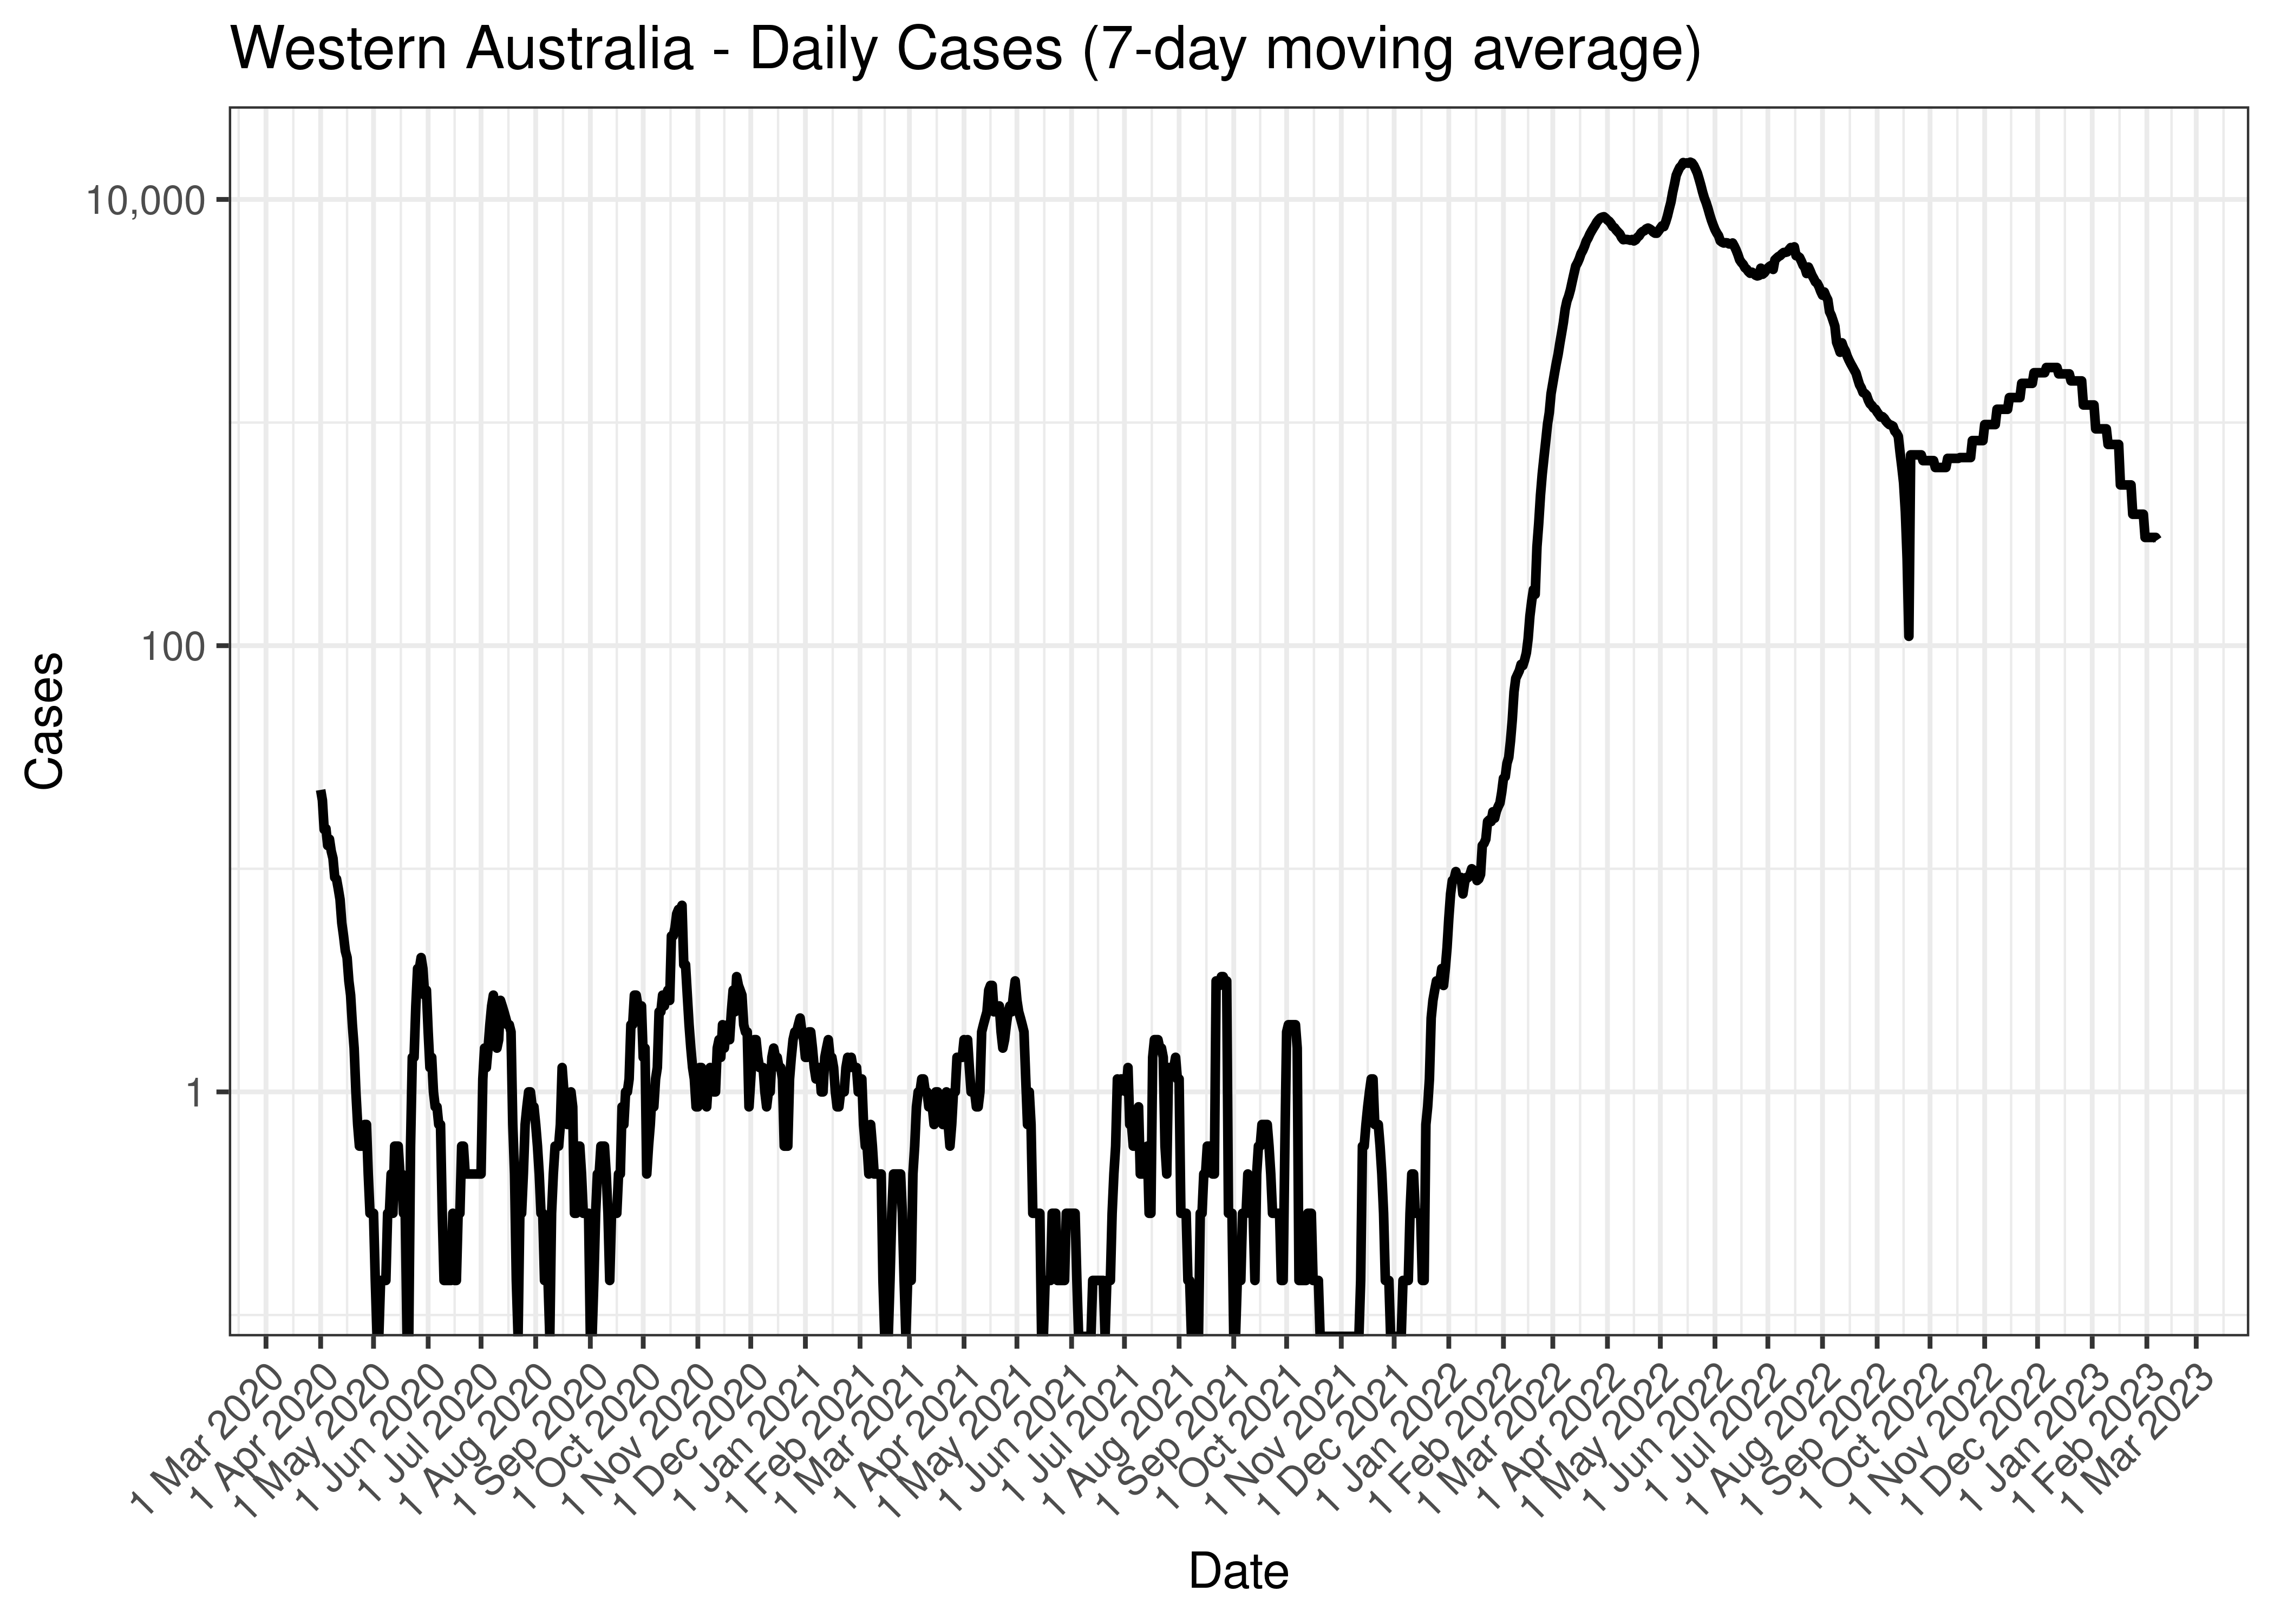
Western Australia - Daily Cases (7-day moving average)
Below the above chart is repeated for the last 30-days:
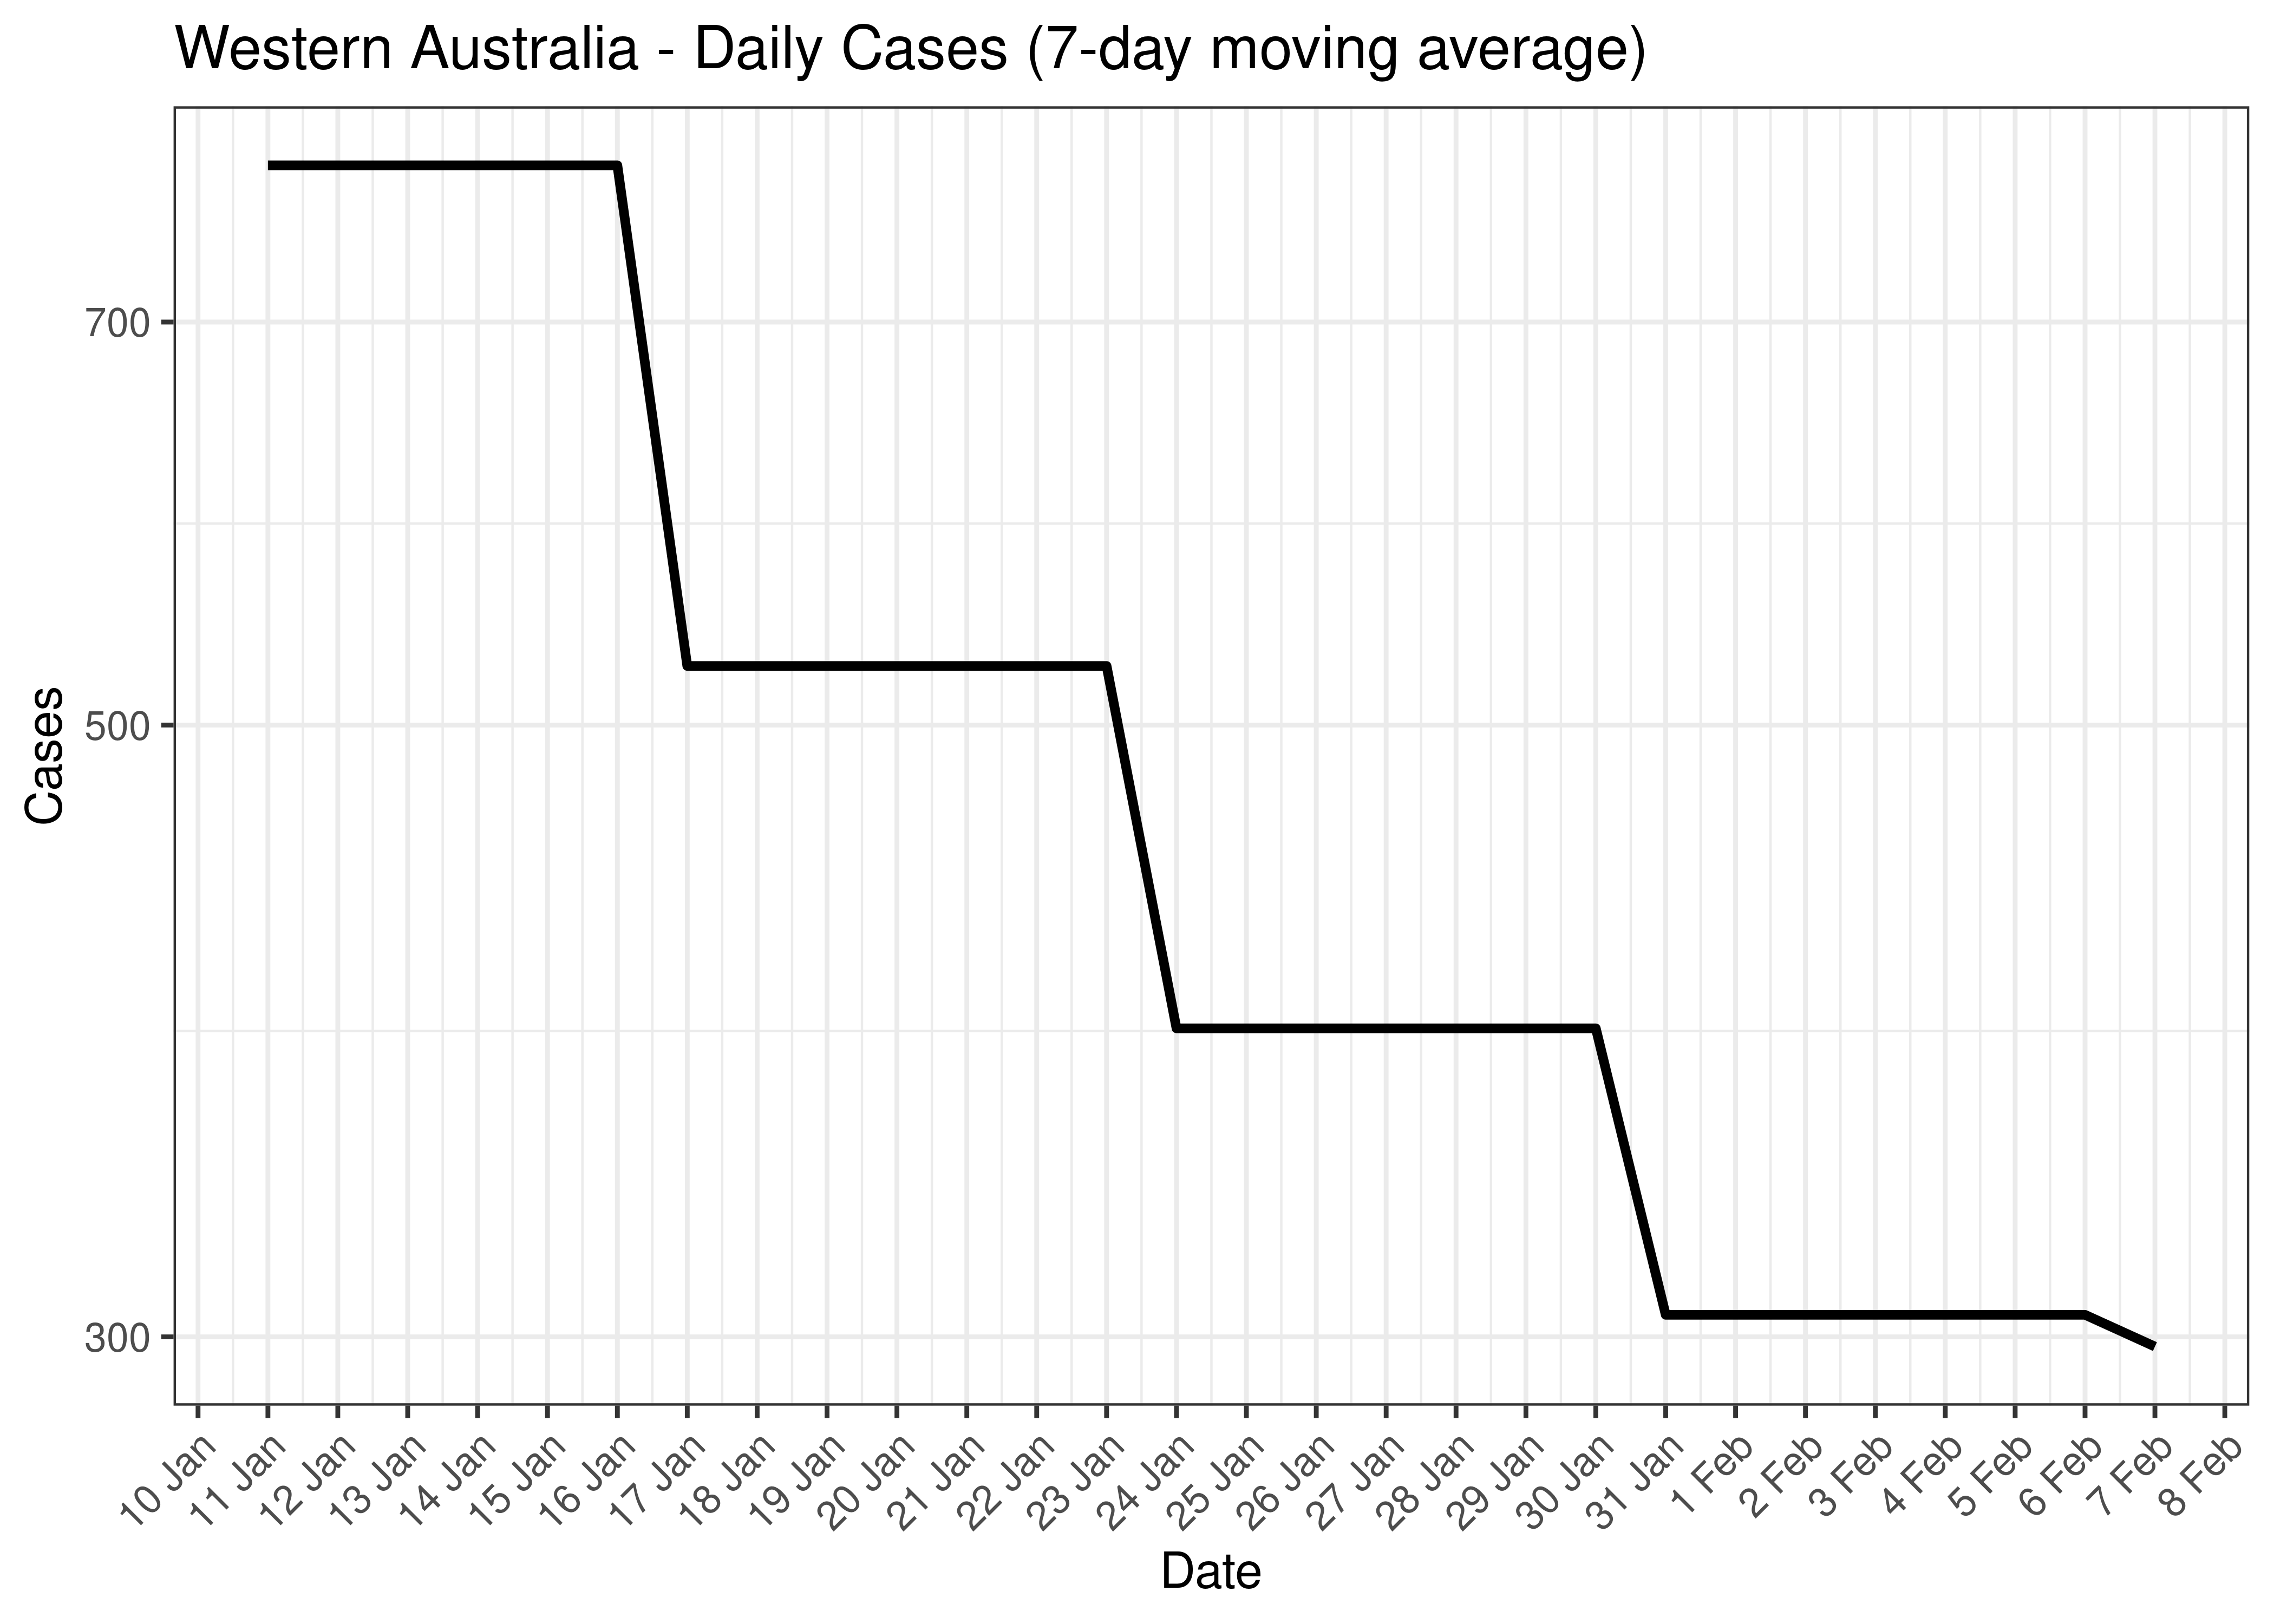
Western Australia - Daily Cases for Last 30-days (7-day moving average)
5.9.3 Hospitlisation
Counts of those in hospital are tabulated by report date below. A centred 7-day moving average is also shown. The peak daily admissions in previous waves (as measured by the moving average) is also shown.
| Date | In Hospital | 7-day Moving Average | Comment |
|---|---|---|---|
| 2020-04-06 | 58 | 47 | Wave 1 Peak |
| 2022-07-23 | 430 | 446 | Wave 4 Peak (to date) |
| 2023-02-03 | 0 | 0 | |
| 2023-02-04 | 0 | 0 | |
| 2023-02-05 | 0 | 0 | |
| 2023-02-06 | 0 | 0 | |
| 2023-02-07 | 0 | NA | |
| 2023-02-08 | 0 | NA | |
| 2023-02-09 | 0 | NA | |
| 2023-02-10 | NA | NA |
The above are based on the following dates:
- Wave 1 started on 2020-01-01.
- Wave 2 started on 2020-06-01.
- Wave 3 started on 2021-06-01.
- Wave 4 started on 2021-12-01.
Below a 7-day moving average of daily hospital counts is plotted by on a log scale since start of the epidemic. Note admissions are plotted by date.
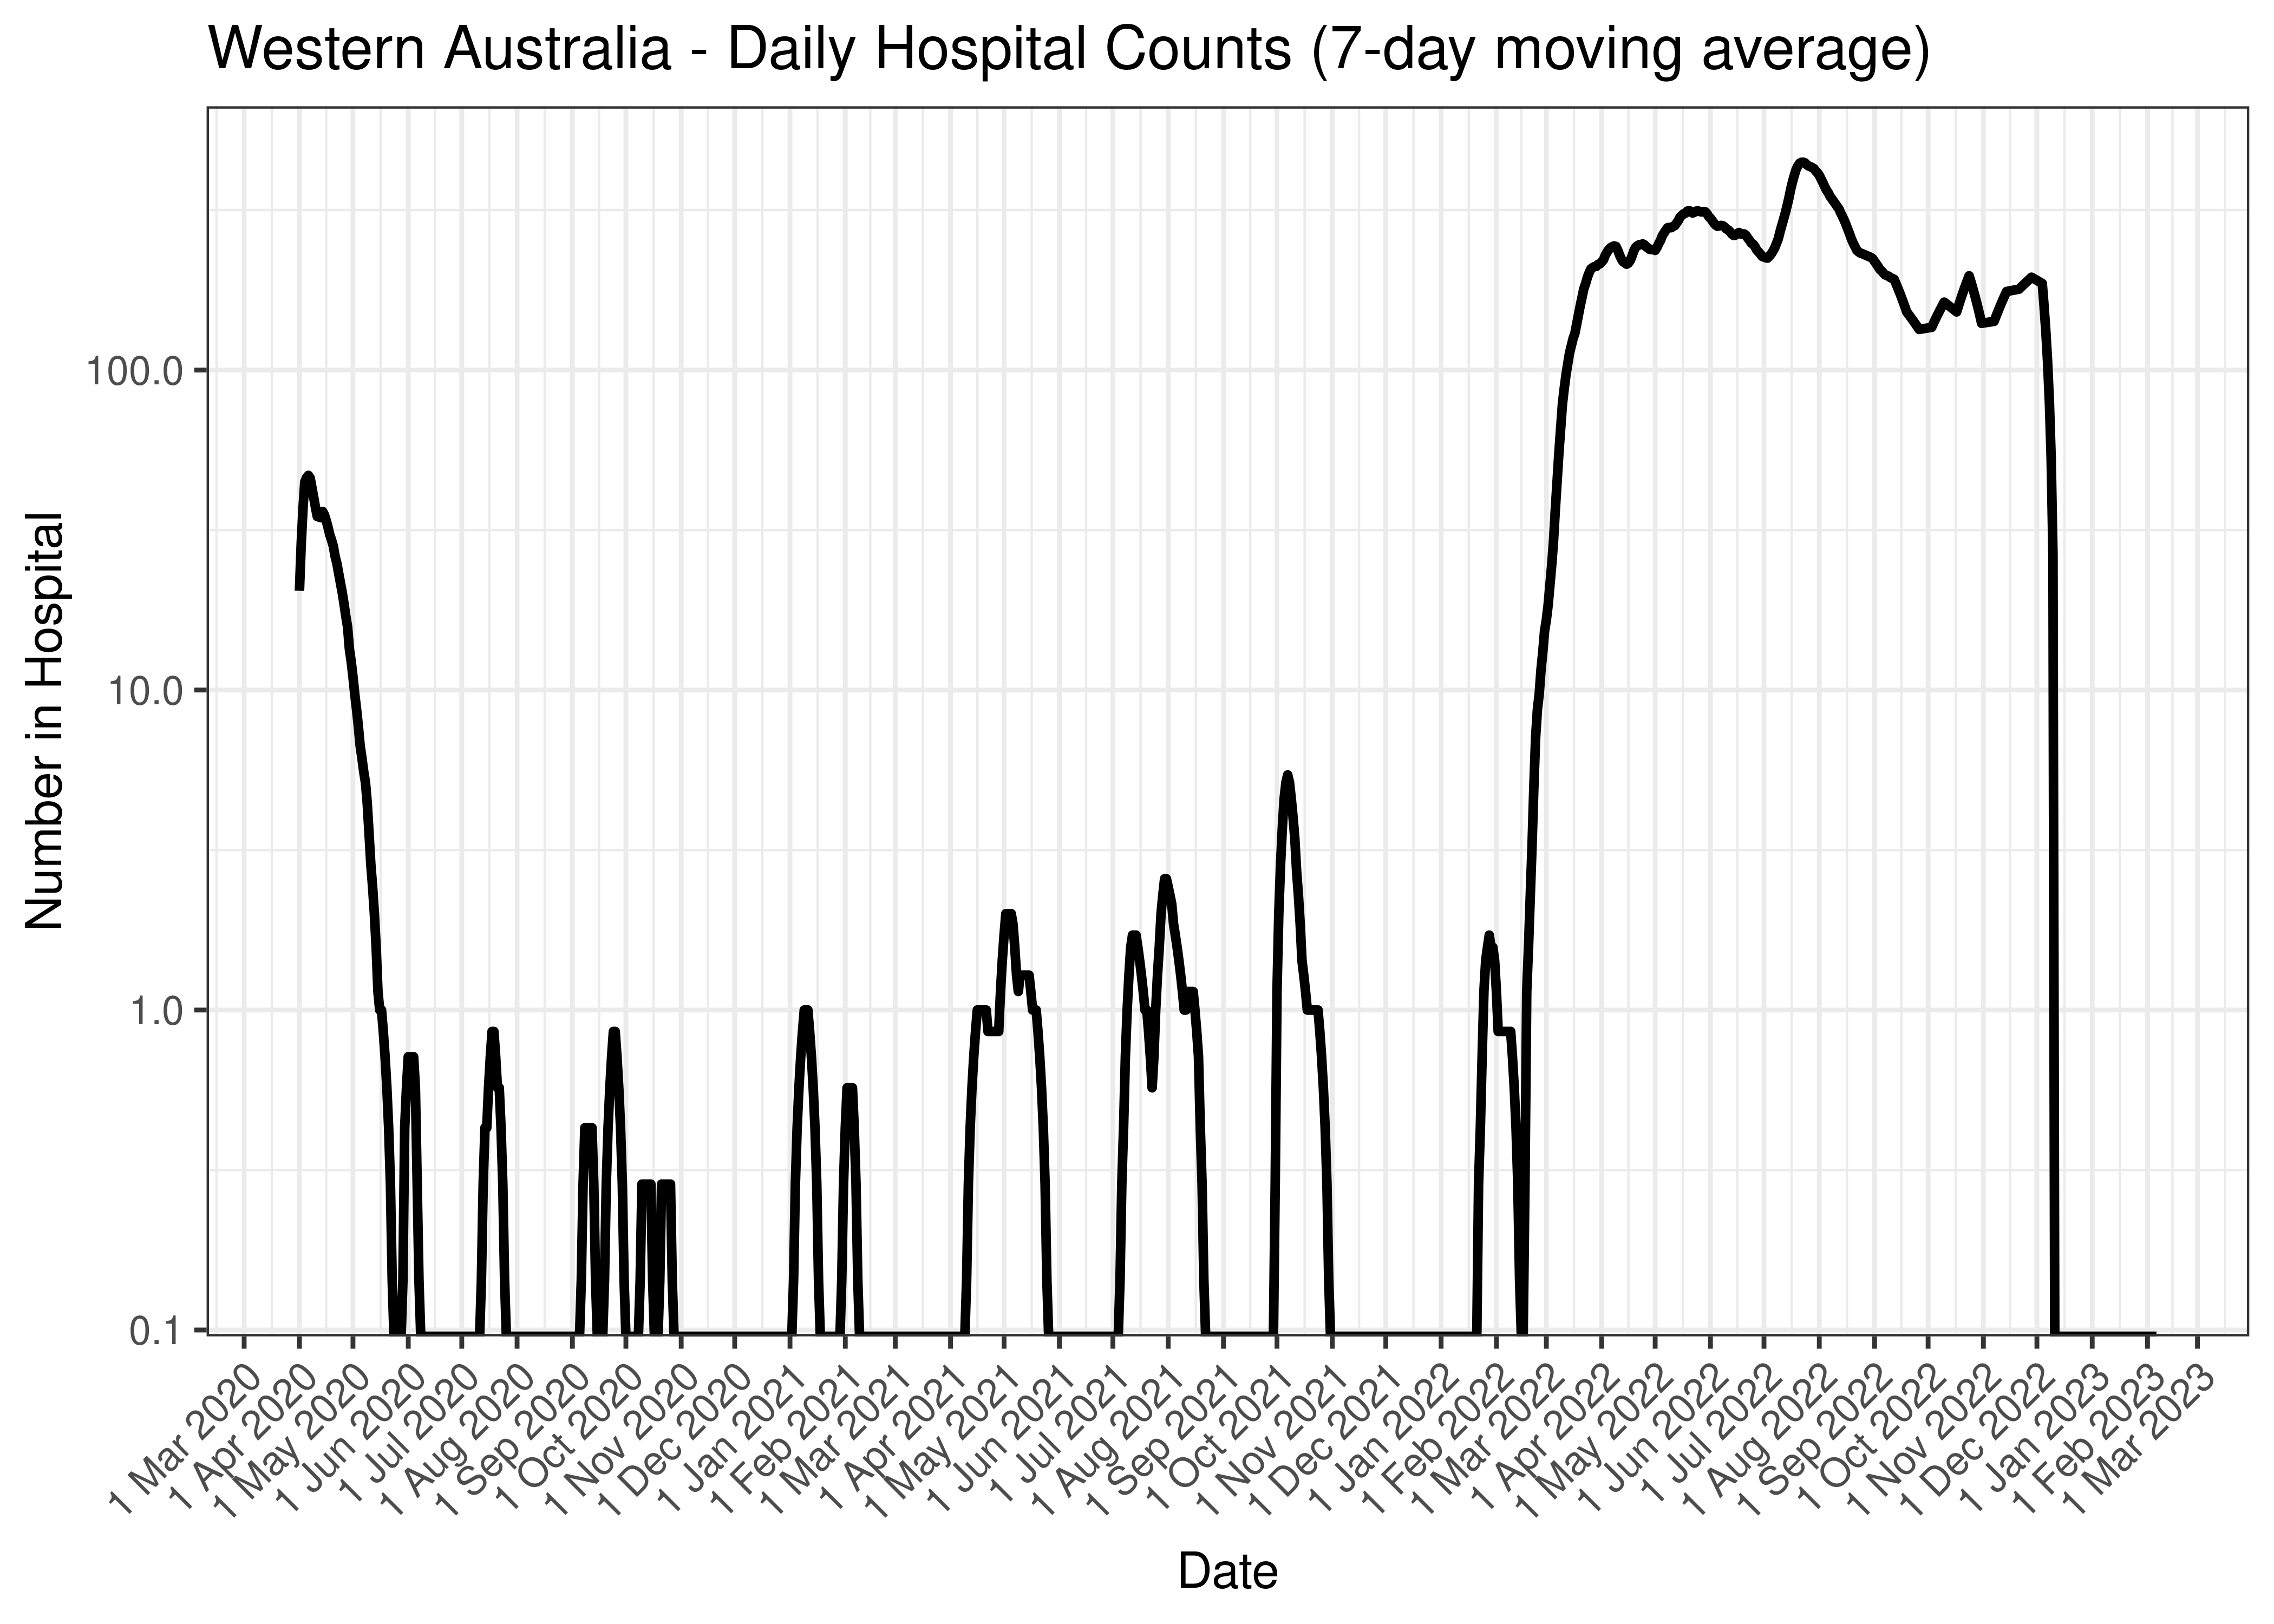
Western Australia - Daily Hospital Counts (7-day moving average)
Below the above chart is repeated for the last 30-days:

Western Australia - Daily Hospital Counts for Last 30-days (7-day moving average)
5.9.4 ICU
Counts of those in ICU are tabulated by report date below. A centred 7-day moving average is also shown. The peak daily admissions in previous waves (as measured by the moving average) is also shown.
| Date | In ICU | 7-day Moving Average | Comment |
|---|---|---|---|
| 2020-04-07 | 15 | 15 | Wave 1 Peak |
| 2022-07-22 | 24 | 22 | Wave 4 Peak (to date) |
| 2023-02-03 | 0 | 0 | |
| 2023-02-04 | 0 | 0 | |
| 2023-02-05 | 0 | 0 | |
| 2023-02-06 | 0 | 0 | |
| 2023-02-07 | 0 | NA | |
| 2023-02-08 | 0 | NA | |
| 2023-02-09 | 0 | NA | |
| 2023-02-10 | NA | NA |
The above are based on the following dates:
- Wave 1 started on 2020-01-01.
- Wave 2 started on 2020-06-01.
- Wave 3 started on 2021-06-01.
- Wave 4 started on 2021-12-01.
Below a 7-day moving average of daily ICU counts is plotted by on a log scale since start of the epidemic. Note admissions are plotted by date.
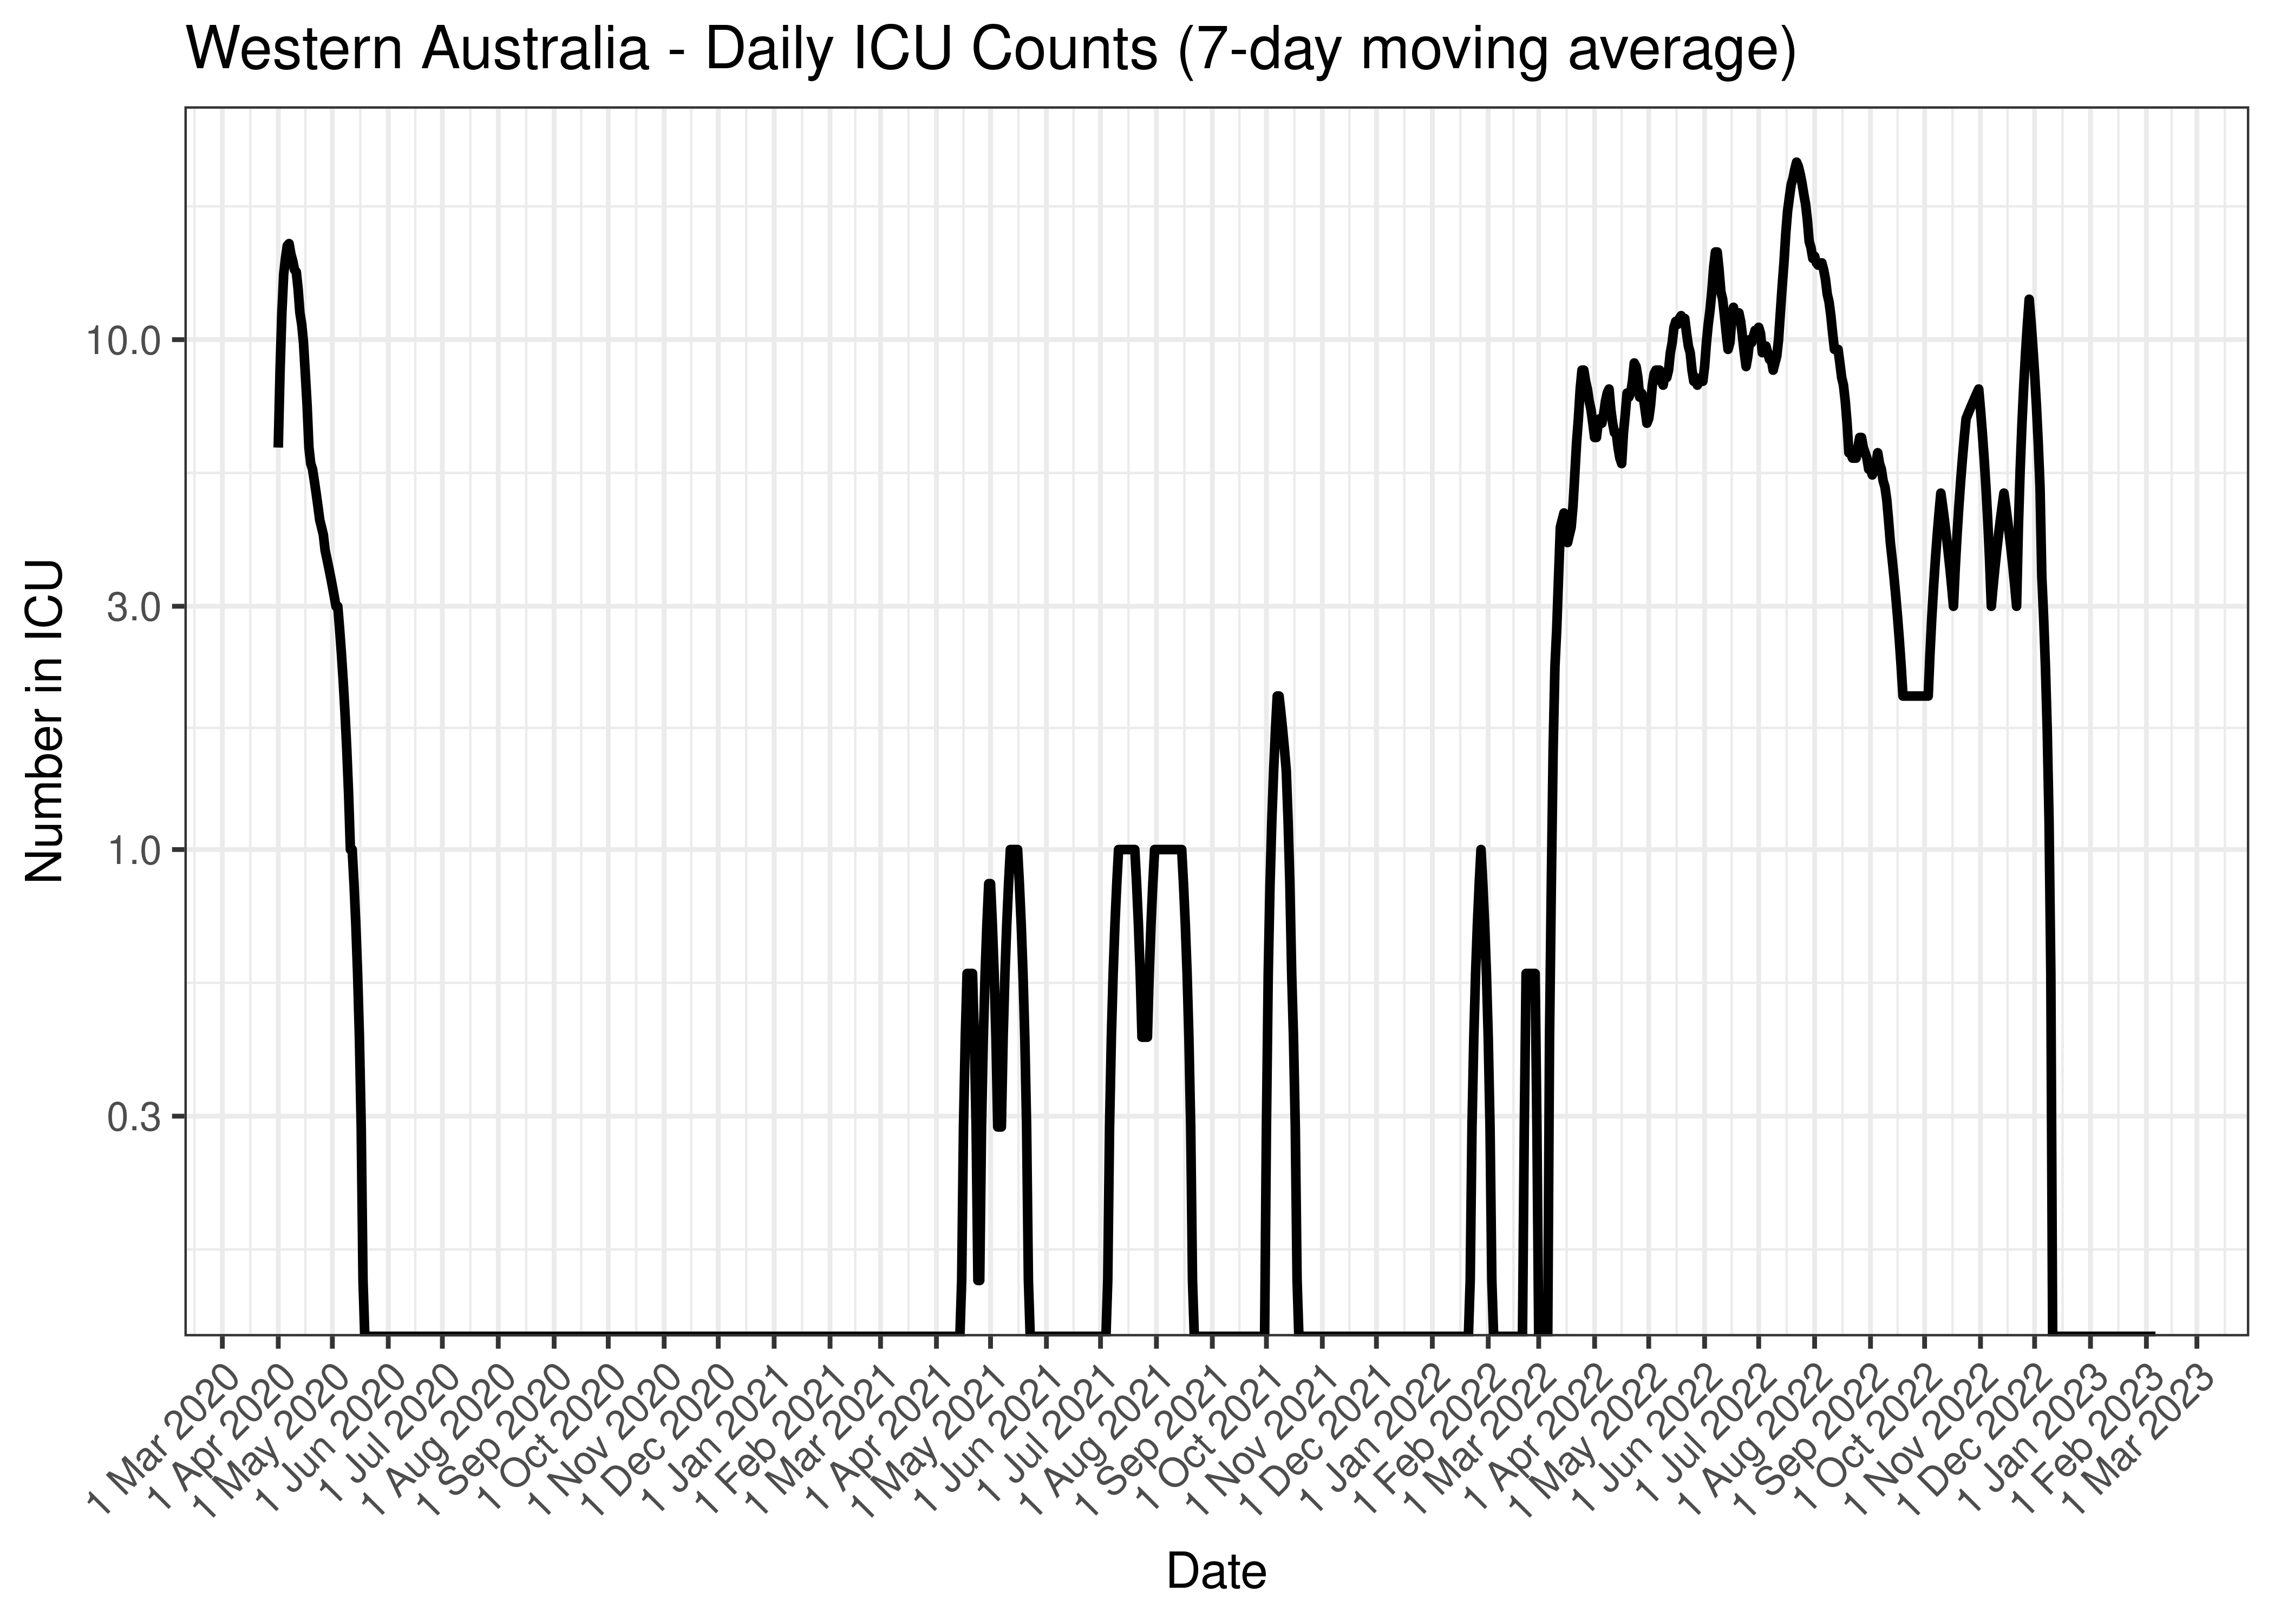
Western Australia - Daily ICU Counts (7-day moving average)
Below the above chart is repeated for the last 30-days:

Western Australia - Daily ICU Counts for Last 30-days (7-day moving average)
5.9.5 Ventilator
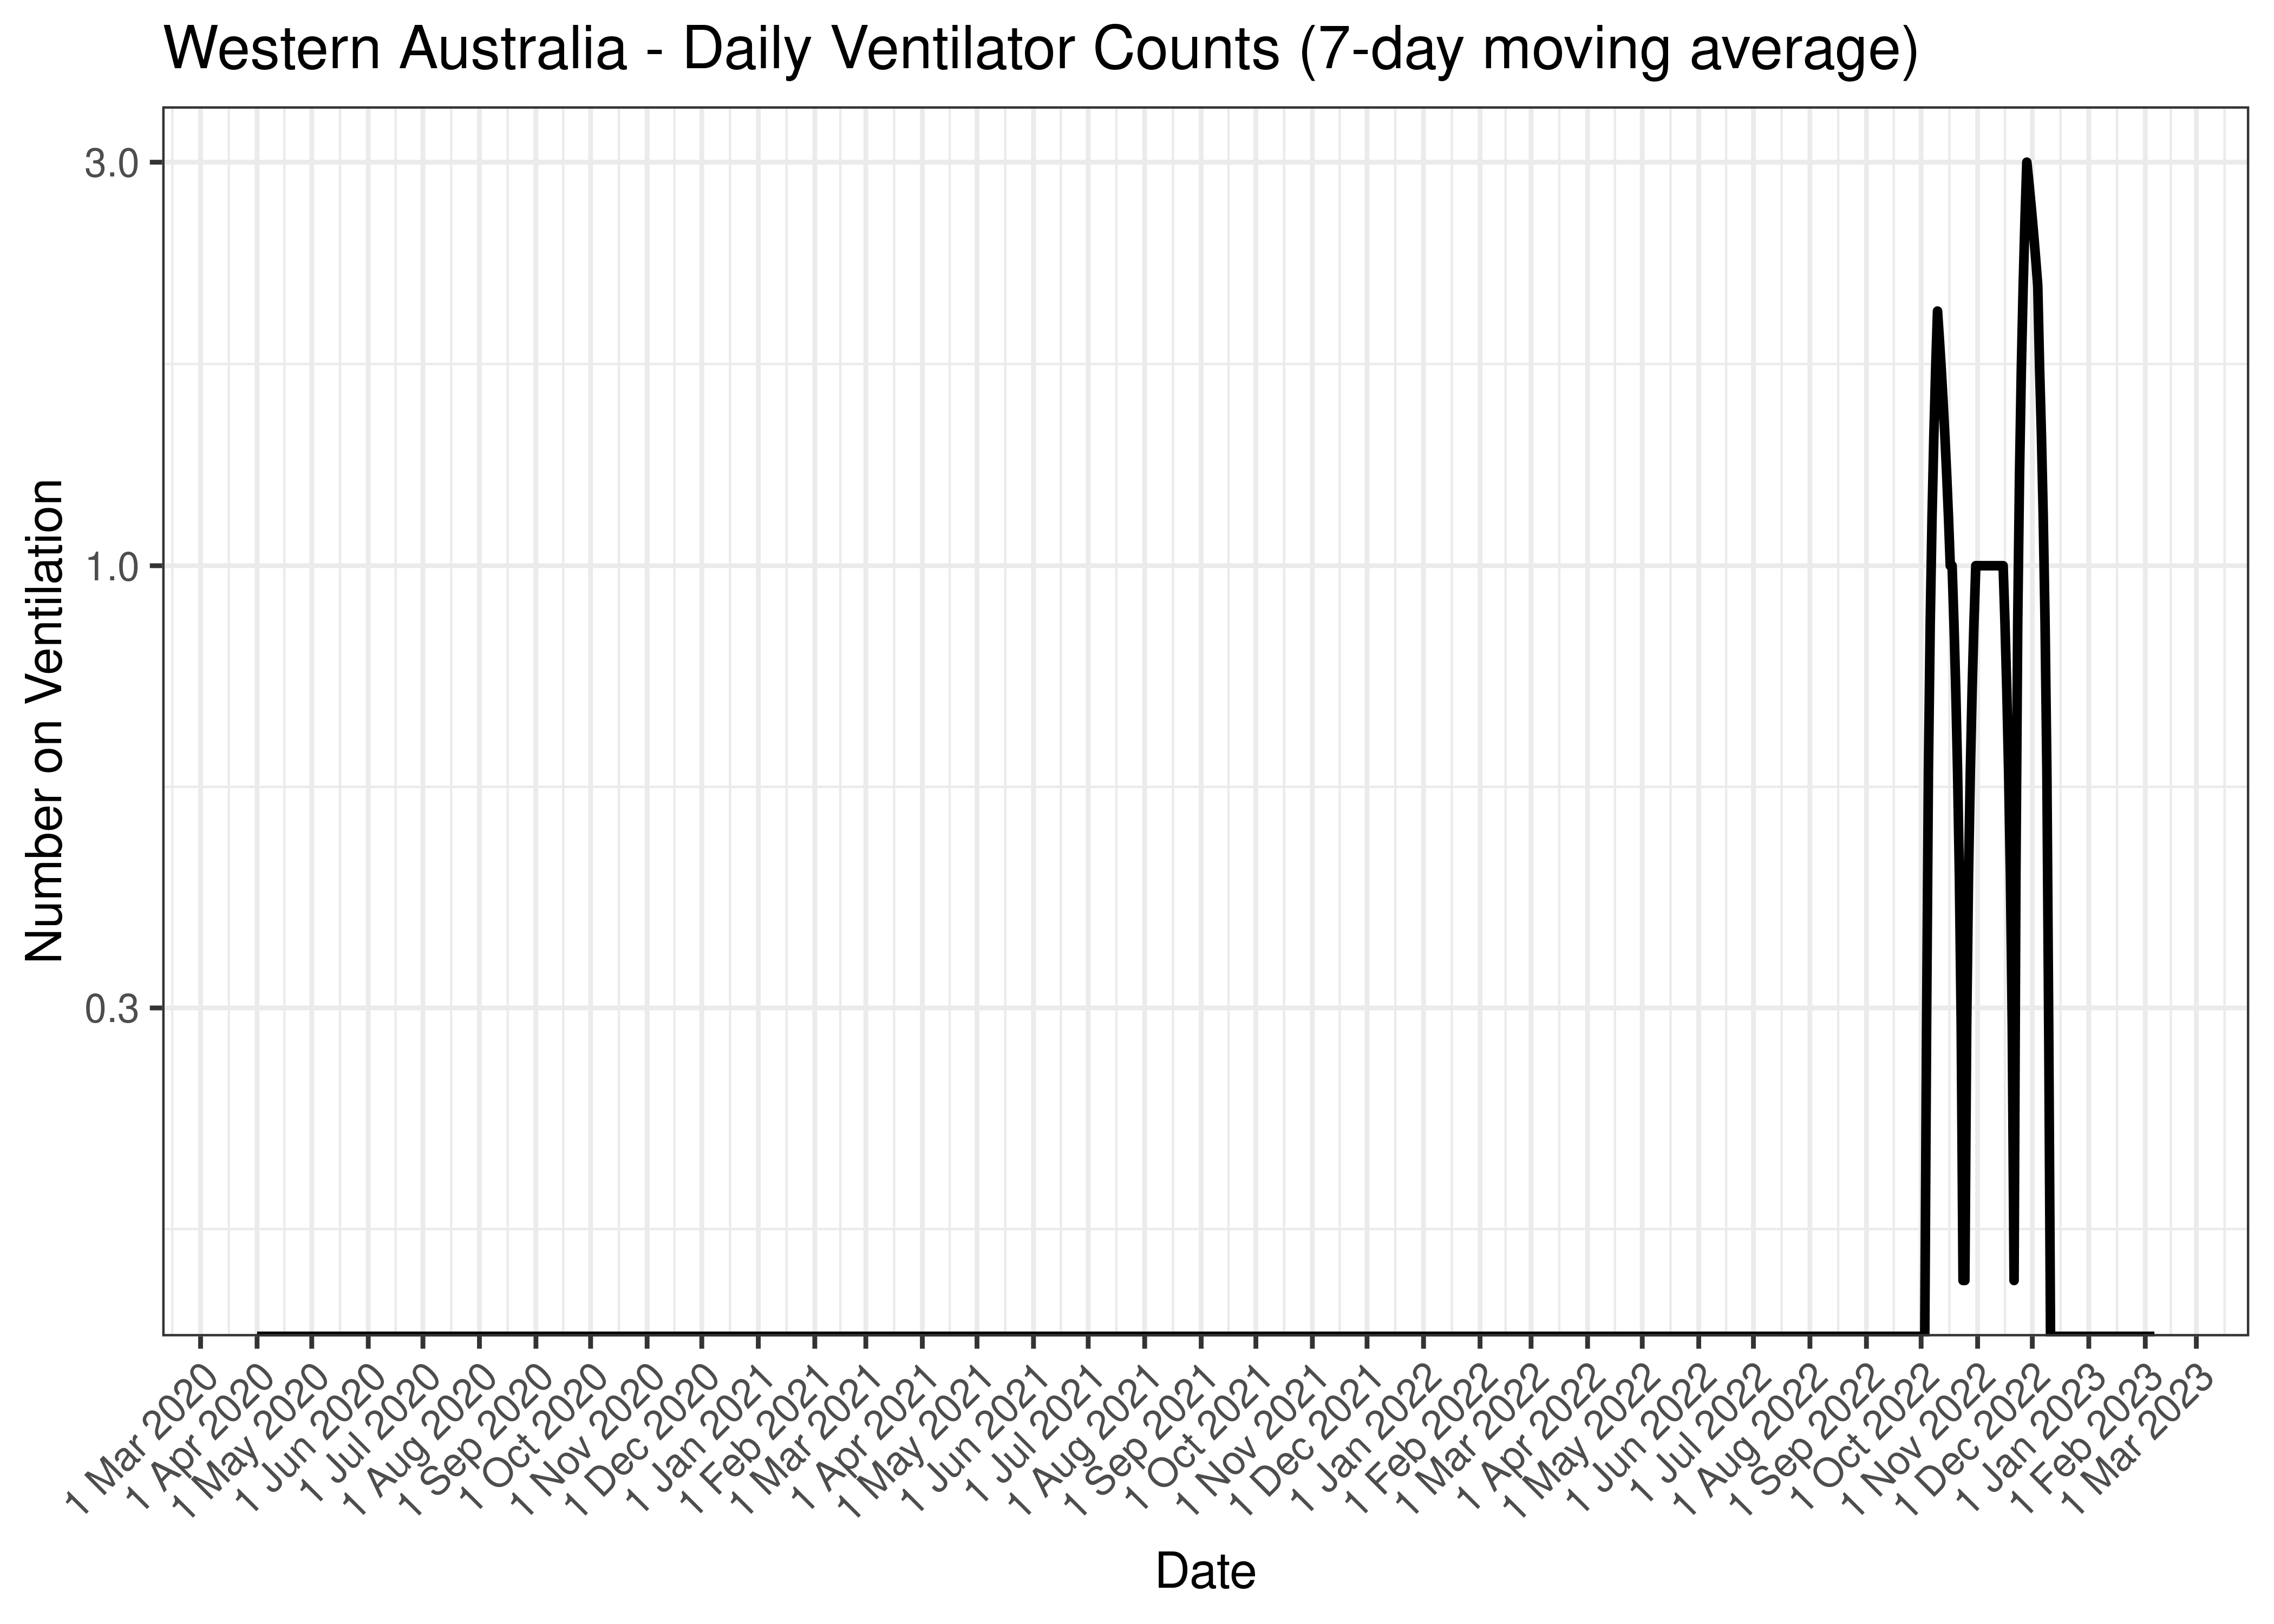
Counts of those on ventilators are tabulated by report date below. A centred 7-day moving average is also shown. The peak daily admissions in previous waves (as measured by the moving average) is also shown.
| Date | On Ventilators | 7-day Moving Average | Comment |
|---|---|---|---|
| 2023-02-03 | 0 | 0 | |
| 2023-02-04 | 0 | 0 | |
| 2023-02-05 | 0 | 0 | |
| 2023-02-06 | 0 | 0 | |
| 2023-02-07 | 0 | NA | |
| 2023-02-08 | 0 | NA | |
| 2023-02-09 | 0 | NA | |
| 2023-02-10 | NA | NA |
The above are based on the following dates:
- Wave 1 started on 2020-01-01.
- Wave 2 started on 2020-06-01.
- Wave 3 started on 2021-06-01.
- Wave 4 started on 2021-12-01.
Below a 7-day moving average of daily ventilator counts is plotted by on a log scale since start of the epidemic. Note admissions are plotted by date.
Western Australia - Daily Ventilator Counts (7-day moving average)
Below the above chart is repeated for the last 30-days:
Western Australia - Daily Ventilator Counts for Last 30-days (7-day moving average)
5.9.6 Deaths
Deaths are tabulated by report date below. A centred 7-day moving average is also shown. The peak daily deaths in previous waves (as measured by the moving average) is also shown.
| Date | Deaths | 7-day Moving Average | Comment |
|---|---|---|---|
| 2023-02-03 | 11 | 2 | |
| 2023-02-04 | 0 | 2 | |
| 2023-02-05 | 0 | 2 | |
| 2023-02-06 | 0 | 2 | |
| 2023-02-07 | 0 | 1 | |
| 2023-02-08 | 0 | NA | |
| 2023-02-09 | 0 | NA | |
| 2023-02-10 | 7 | NA |
The above are based on the following dates:
- Wave 1 started on 2020-01-01.
- Wave 2 started on 2020-06-01.
- Wave 3 started on 2021-06-01.
- Wave 4 started on 2021-12-01.
Below a 7-day moving average of daily deaths is plotted by on a log scale since start of the epidemic.
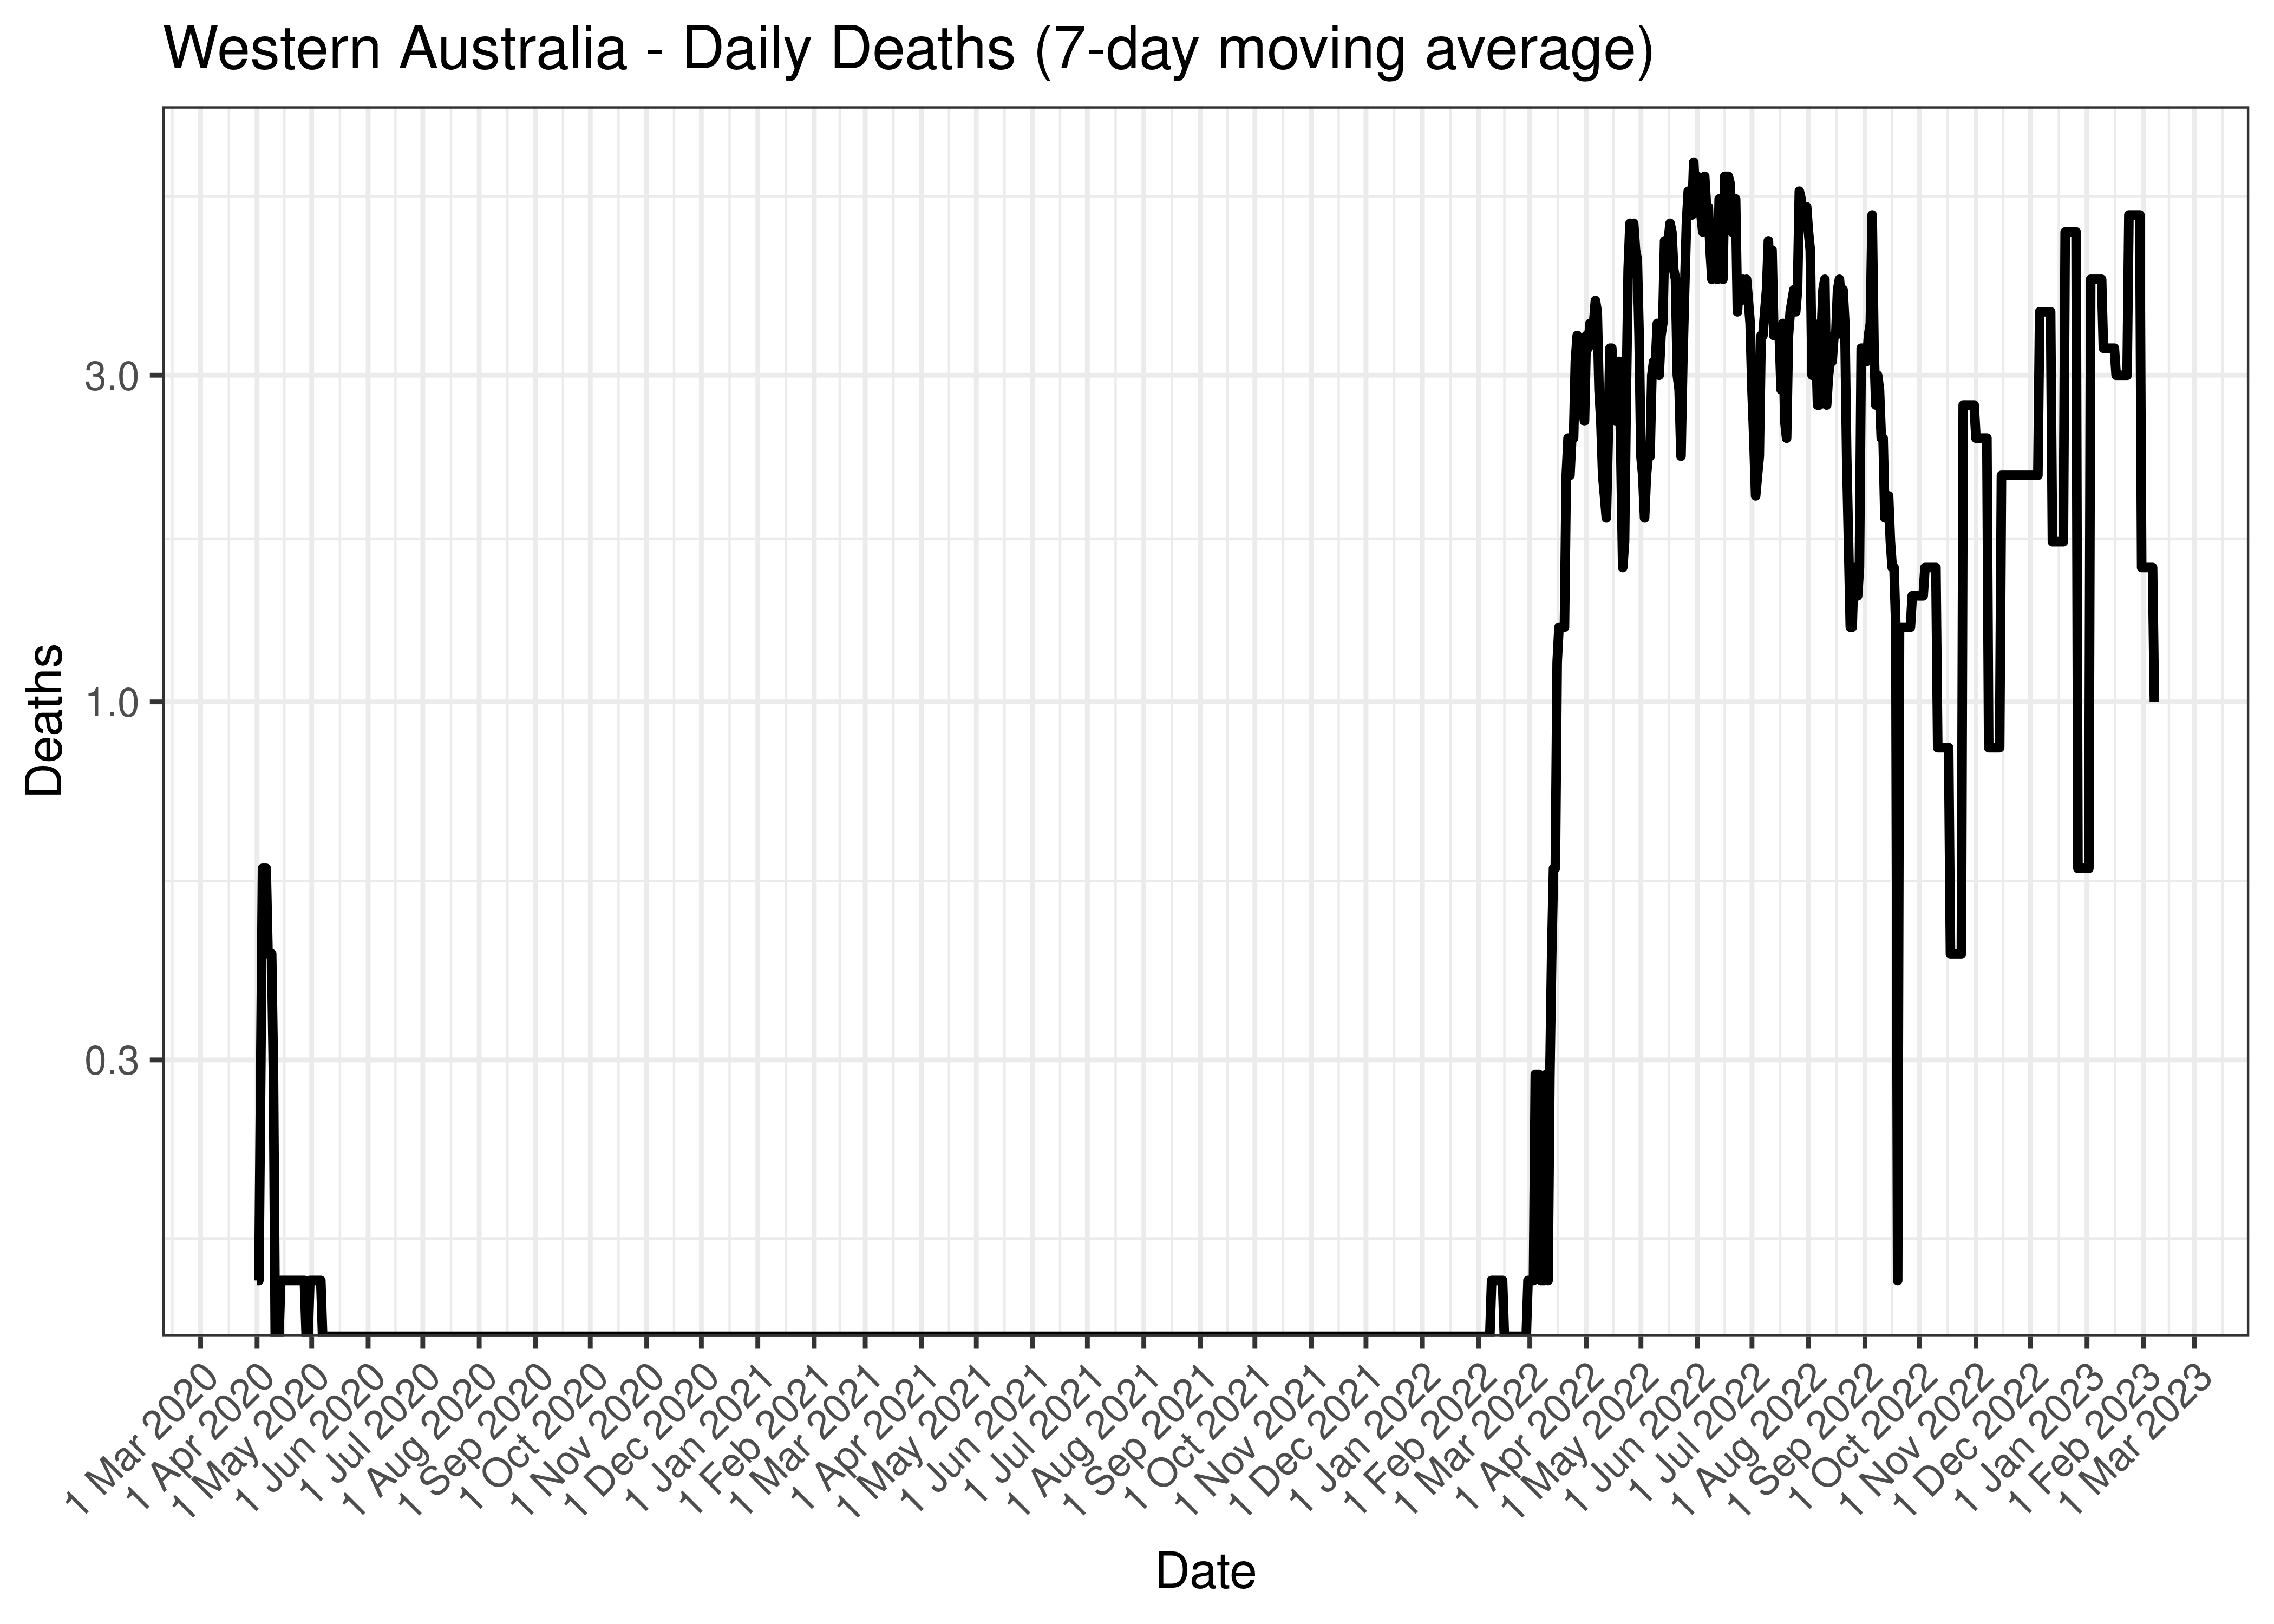
Western Australia - Daily Deaths (7-day moving average)
Below the above chart is repeated for the last 30-days:
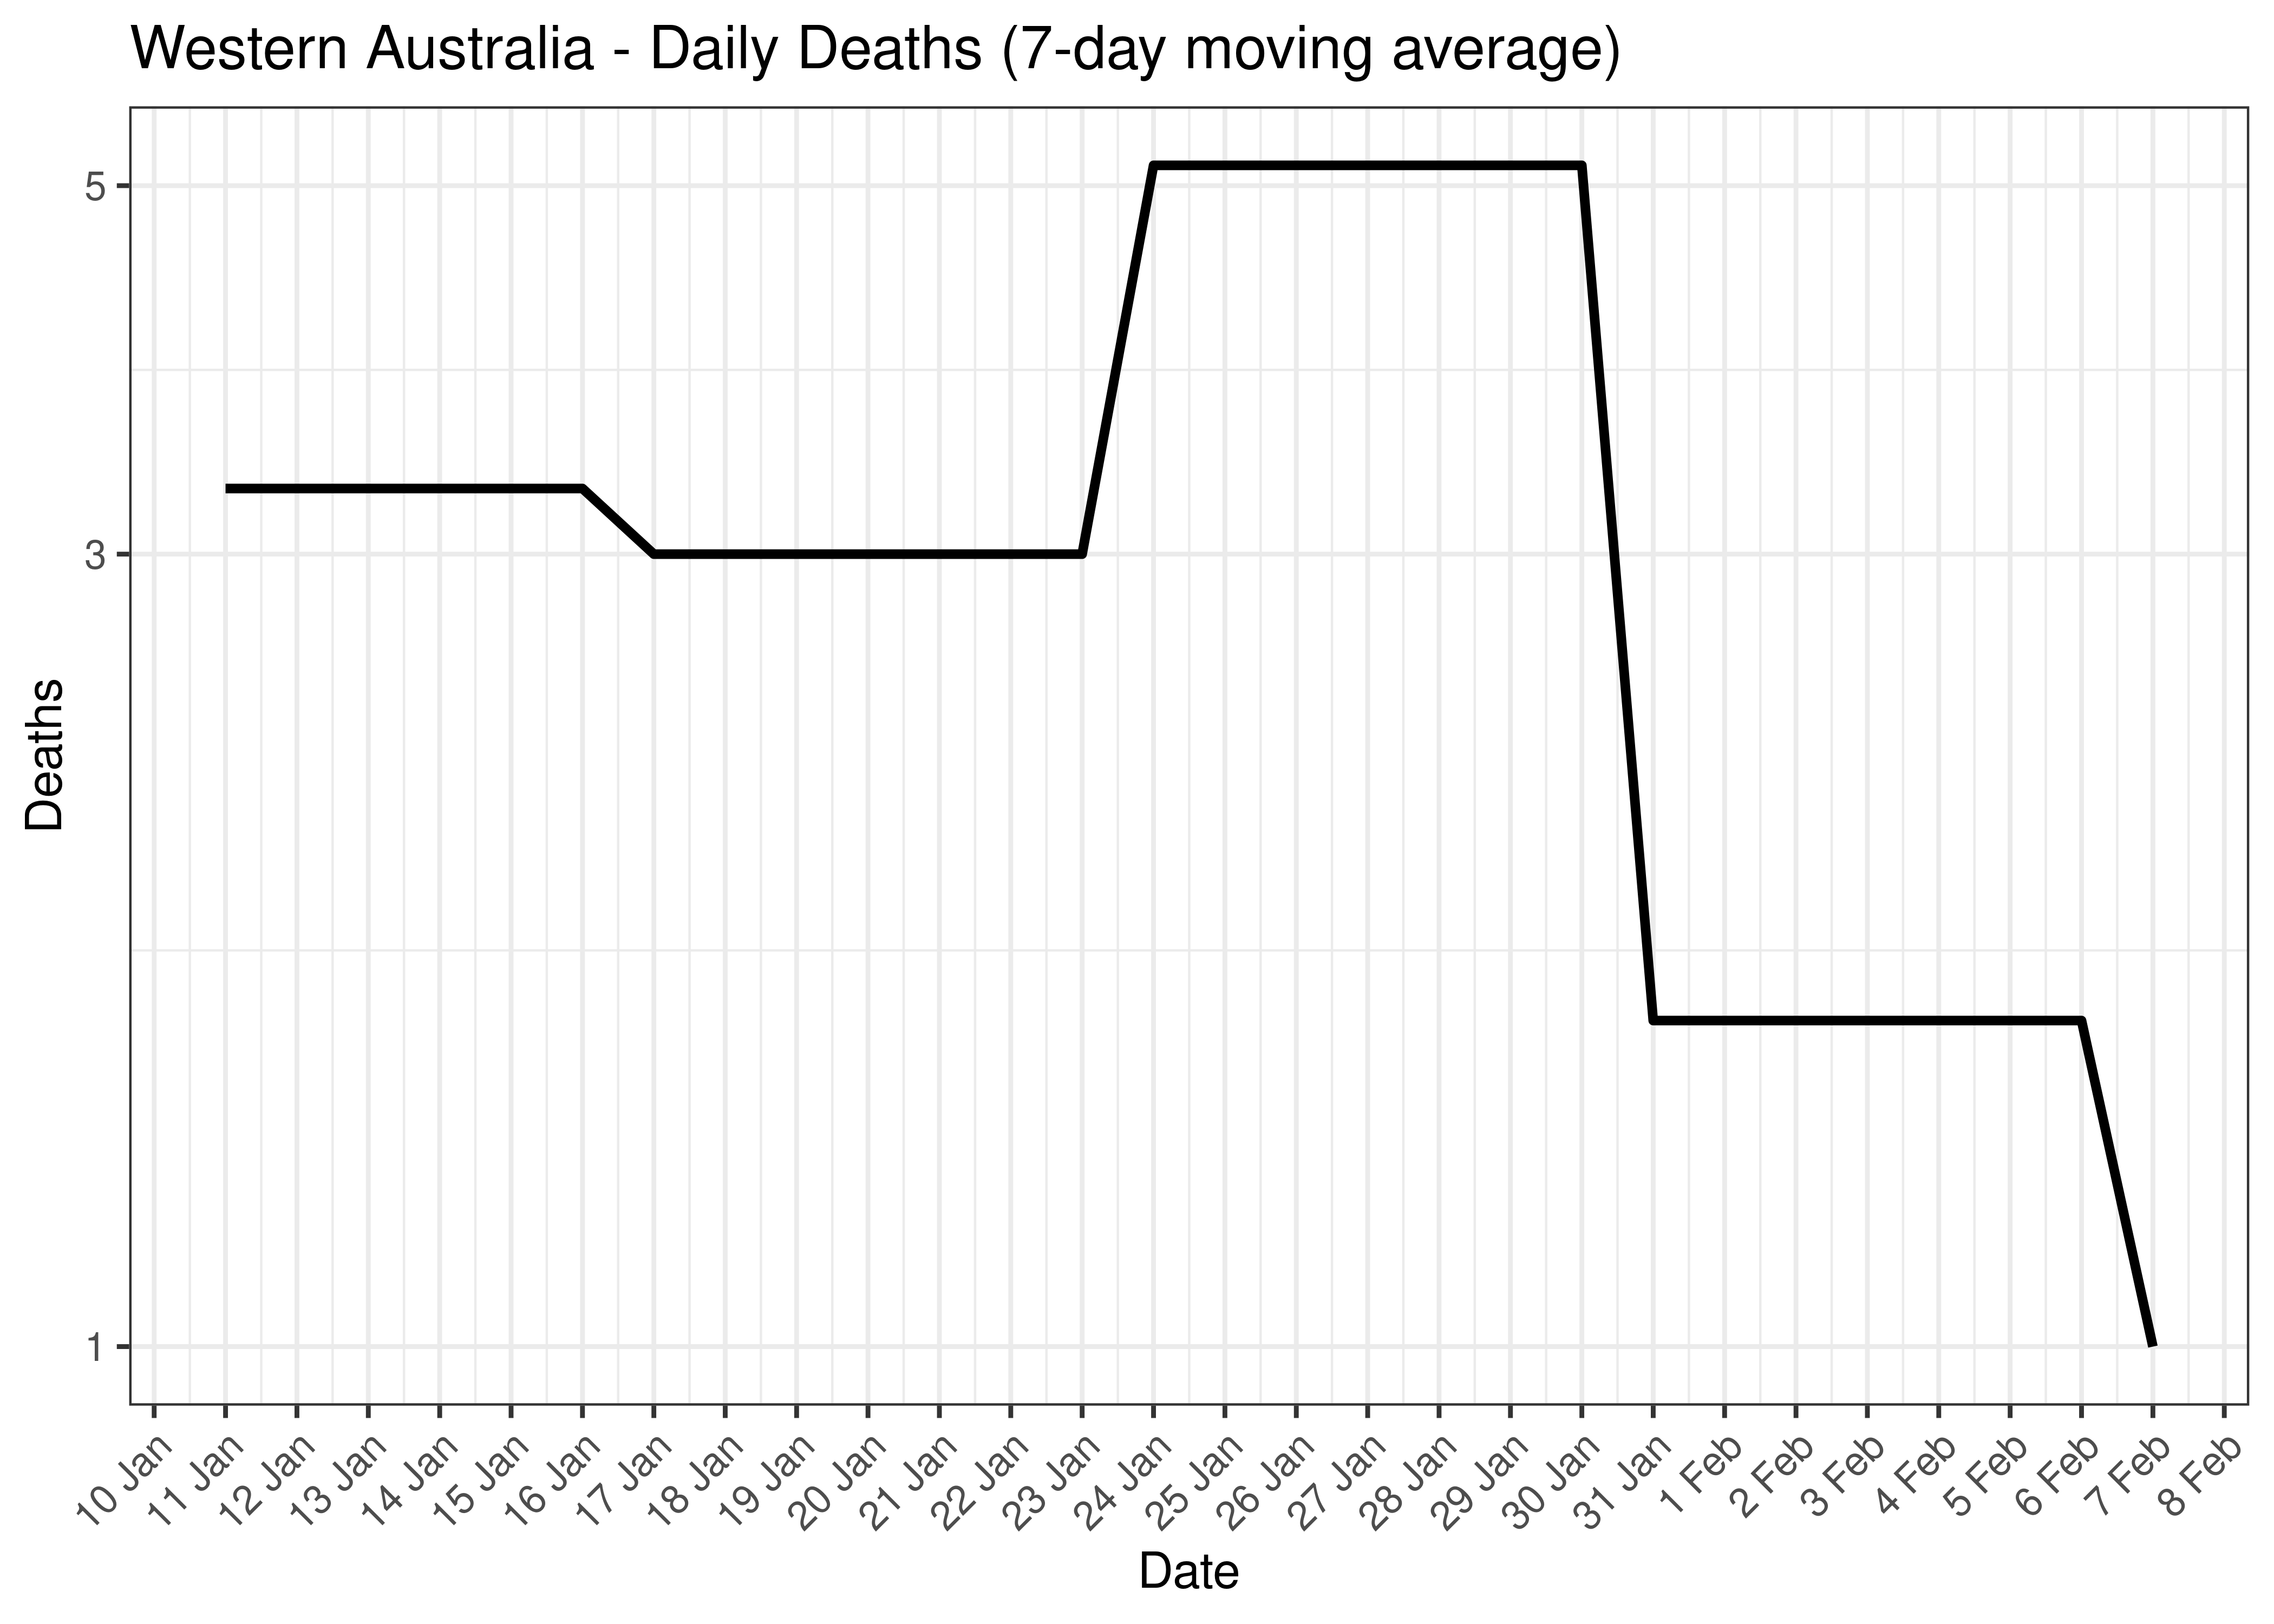
Western Australia - Daily Deaths for Last 30-days (7-day moving average)
5.9.7 Cases, Hospital Counts and Deaths Combined
Below a 7-day moving average daily case, hospital counts and deaths are plotted by state on a log scale since start of the epidemic. Note admissions and excess deaths are plotted by date, whereas cases are plotted by specimen received date.
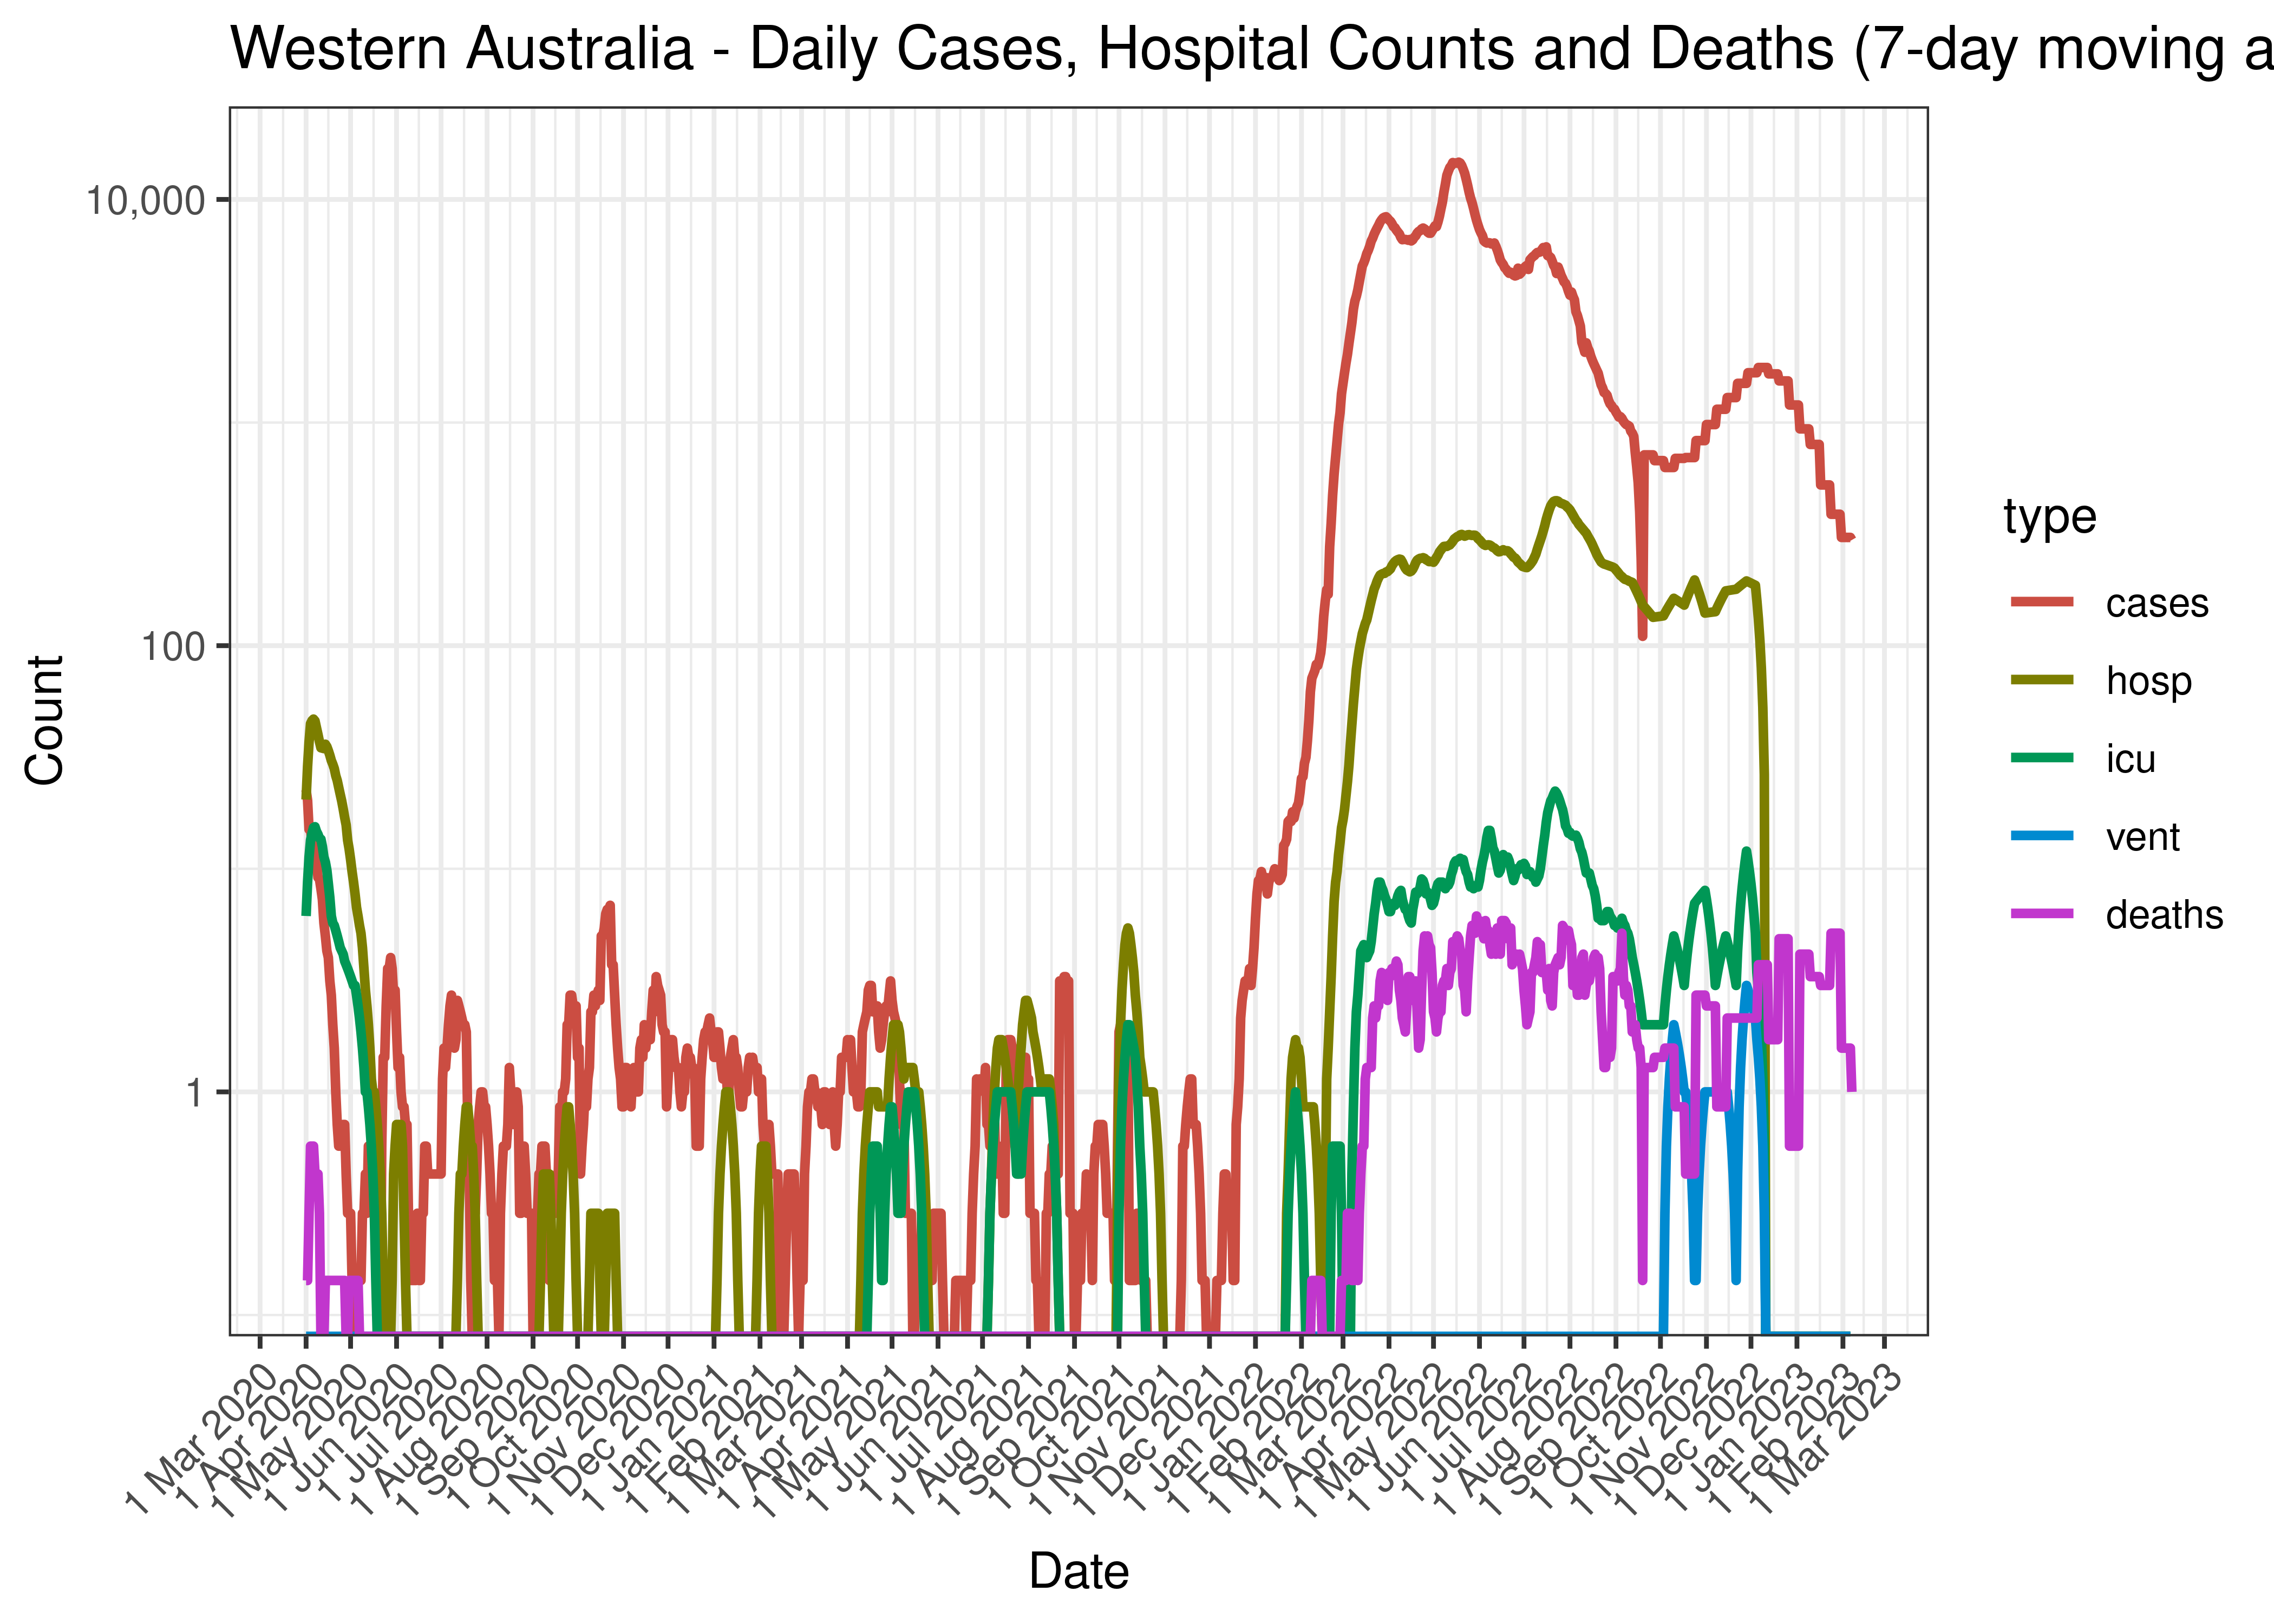
Western Australia - Daily Cases, Hospital Counts and Deaths (7-day moving average)
Below the above chart is repeated for the last 30-days:
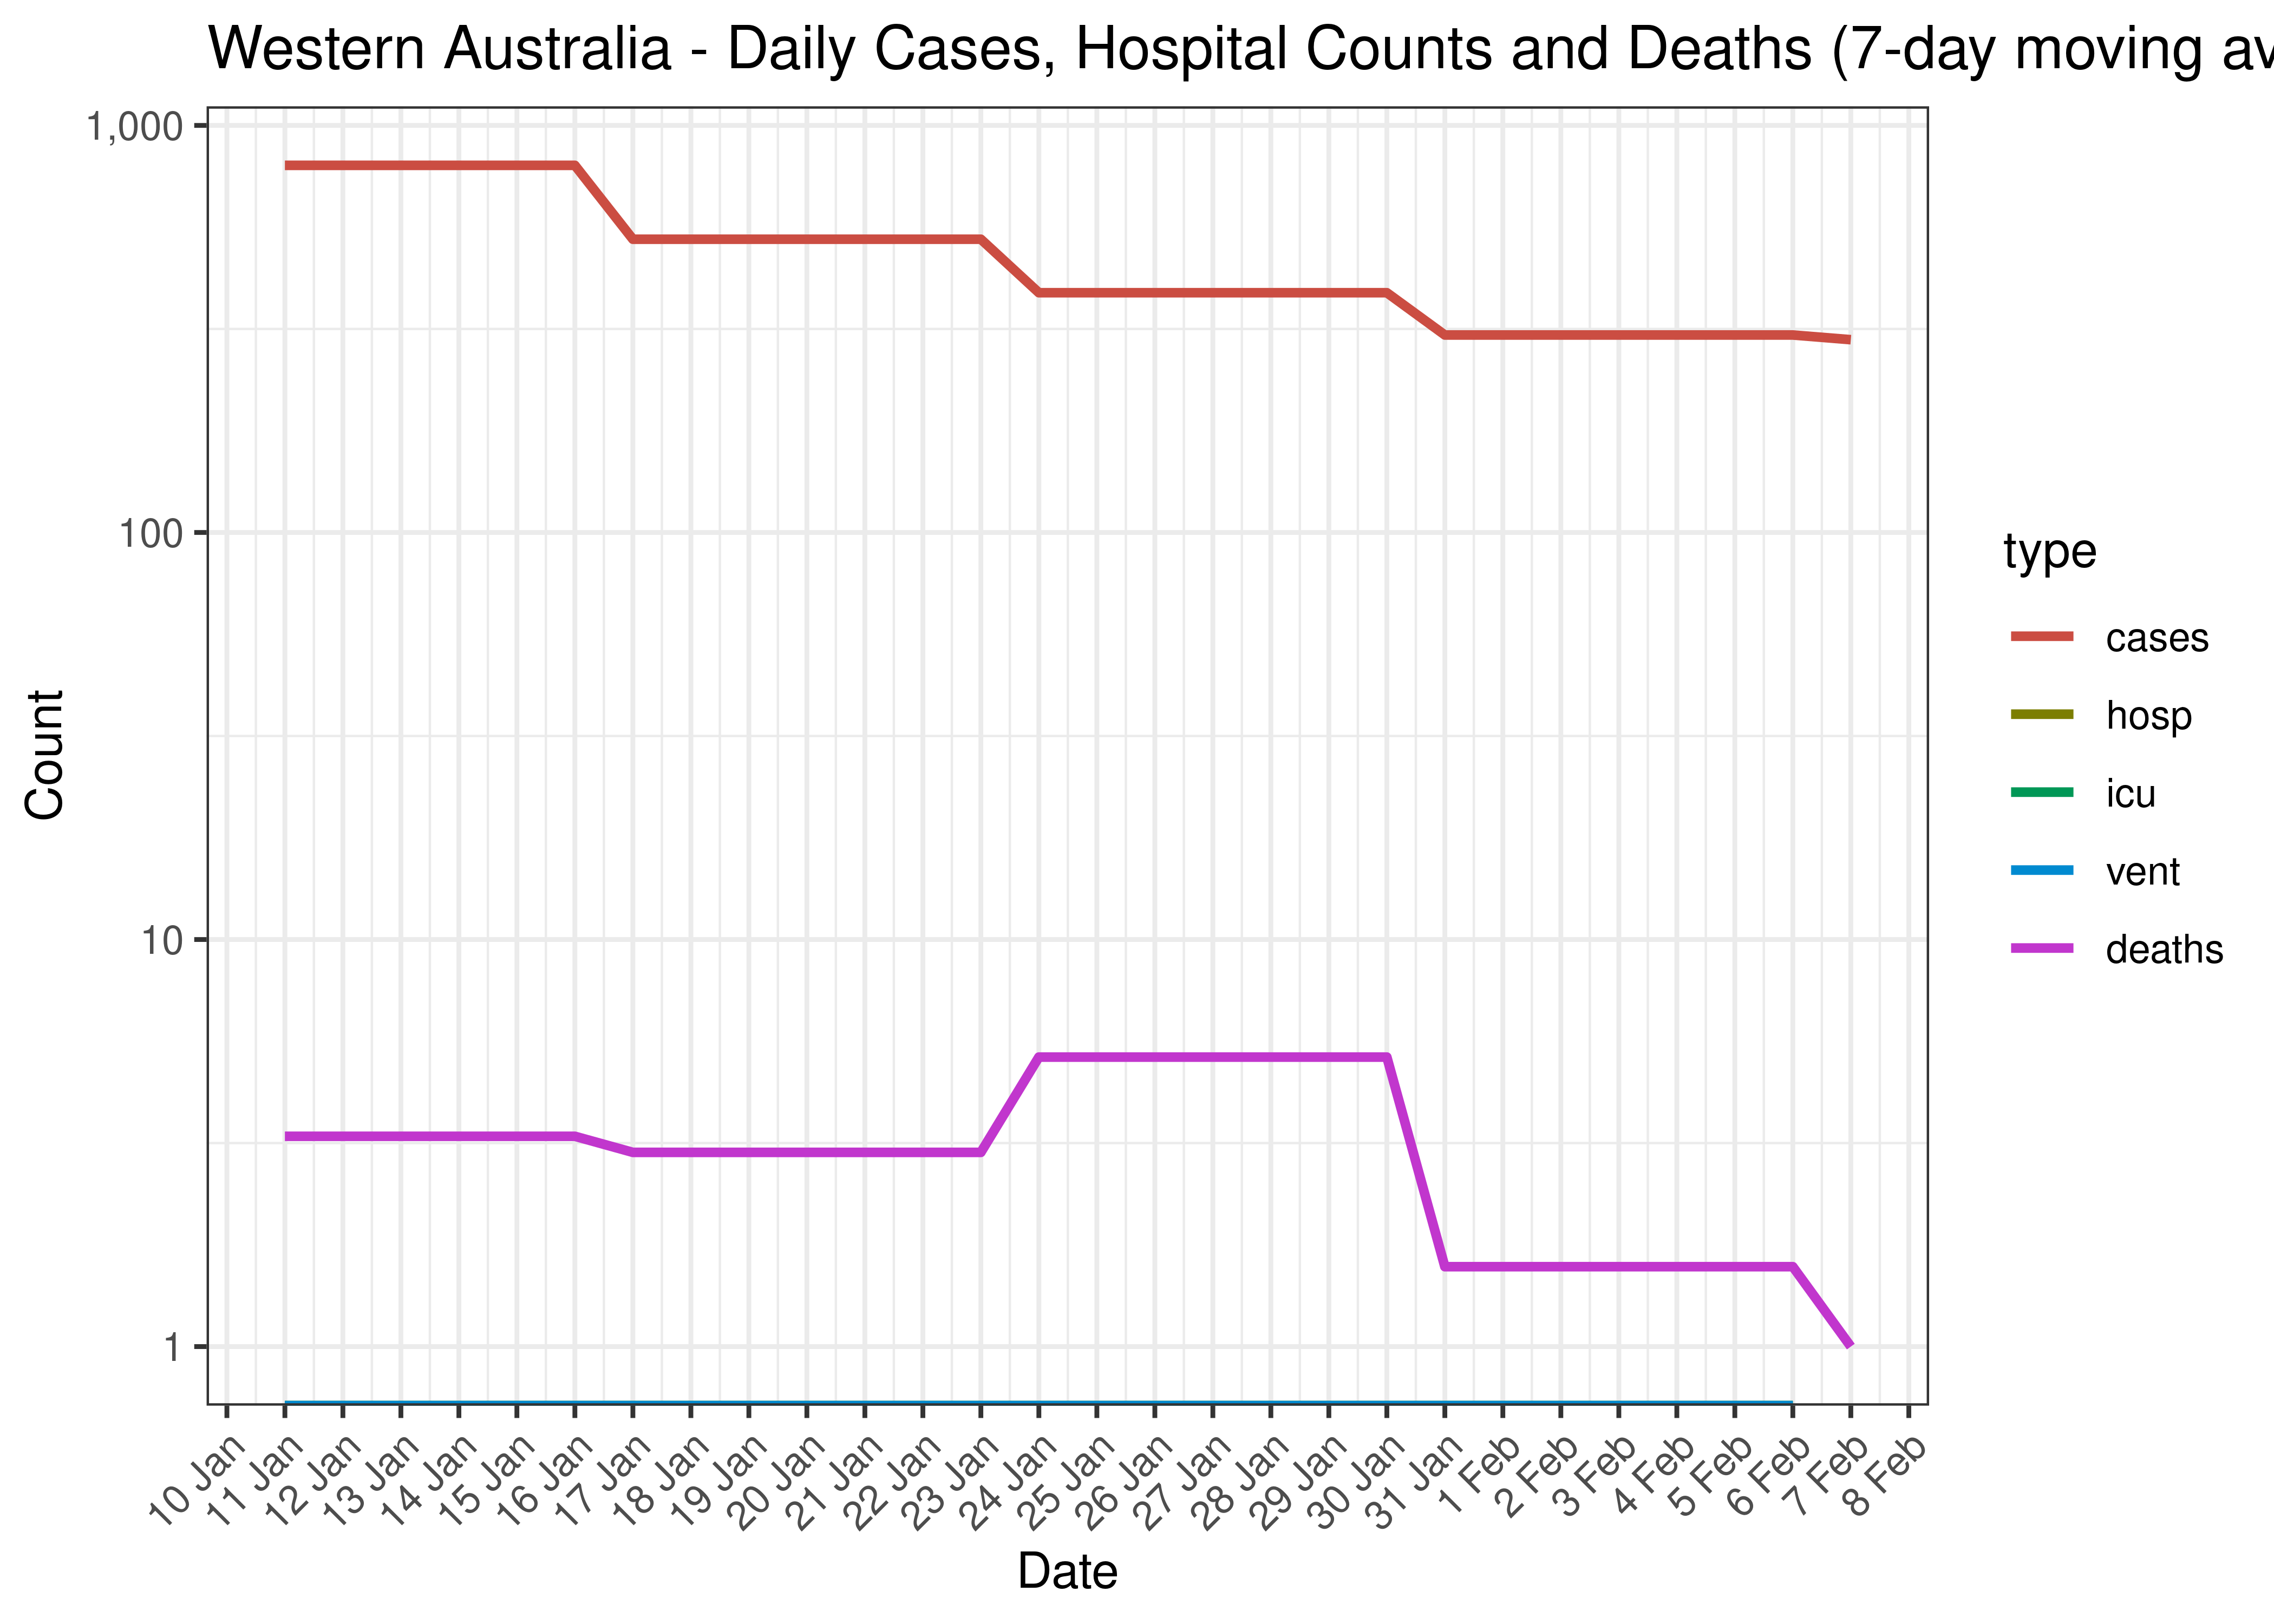
Western Australia - Daily Cases, Admissions and Deaths for Last 30-days (7-day moving average)
5.9.8 Crude Ratios per Wave
Below crude rations are calculated between the waves. It’s based on the following starting dates:
- Wave 1 started on 2020-01-01.
- Wave 2 started on 2020-06-01.
- Wave 3 started on 2021-06-01.
- Wave 4 started on 2021-12-01.
Below crude ratios are tabulated and plotted. These ratios are:
- ICU ratio calculated as person days in ICU divided by person days in hospital.
- Ventilator ratio calculated as person days on ventilators divided by person days in hospital.
- Death ratio calculated as deaths divided by person days in hospital.
- Case fatality ratio is calcualted as deaths divided by cases.
| Wave | ICU Ratio | Ventilator Ratio | Death Ratio | Case Fatality Ratio | |
|---|---|---|---|---|---|
| Western Australia | Wave 1 | 29.2% | 0.0% | 0.9% | 1.54% |
| Western Australia | Wave 2 | 24.4% | 0.0% | 0.0% | 0.00% |
| Western Australia | Wave 3 | 47.2% | 0.0% | 0.0% | 0.00% |
| Western Australia | Wave 4 | 3.4% | 0.1% | 1.3% | 0.07% |
5.9.9 Reproduction Number
Below current (last weekly) effective reproduction number estimates are tabulated for Australia and by state.
| Type | Count (Per Day) | Week Ending | Reproduction Number [95% Confidence Interval] | |
|---|---|---|---|---|
| Western Australia | cases | 298 | 2023-02-10 | 0.94 [0.89 - 0.98] |
Below the effective reproduction number for Australia over the last 90 days are plotted together with a plot since start of the pandemic.
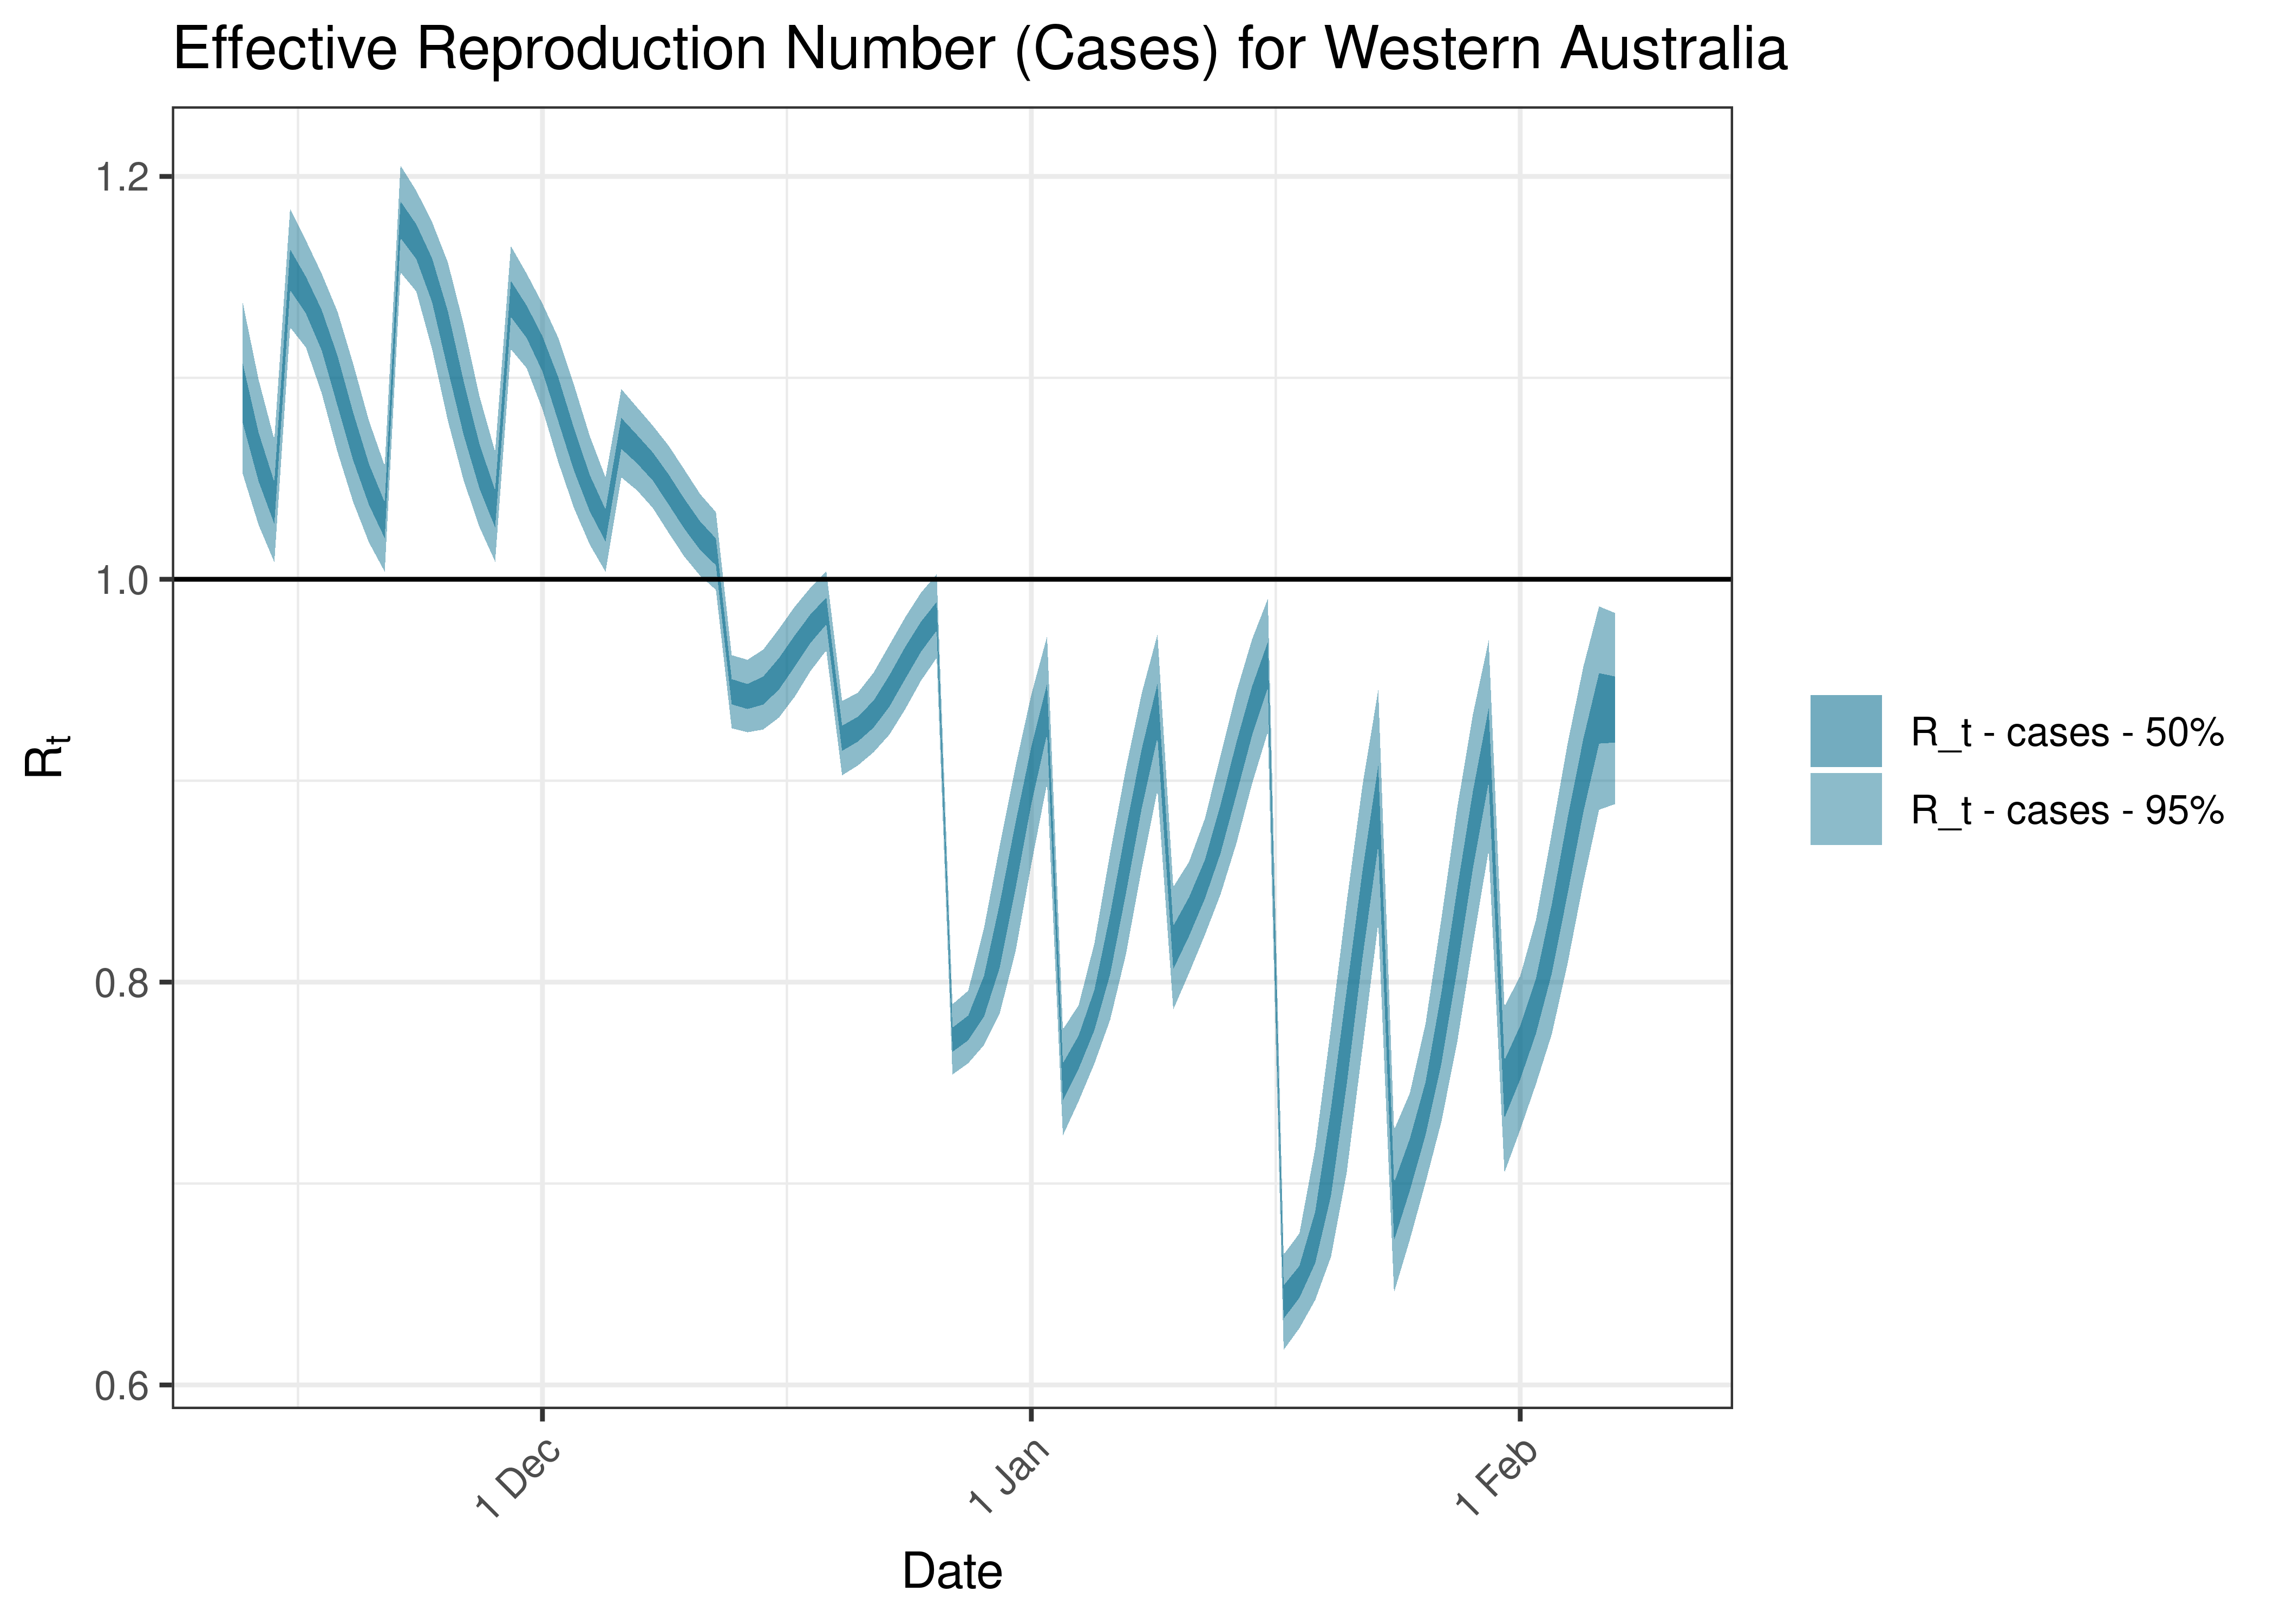
Estimated Effective Reproduction Number Based on Cases for Western Australia over last 90 days
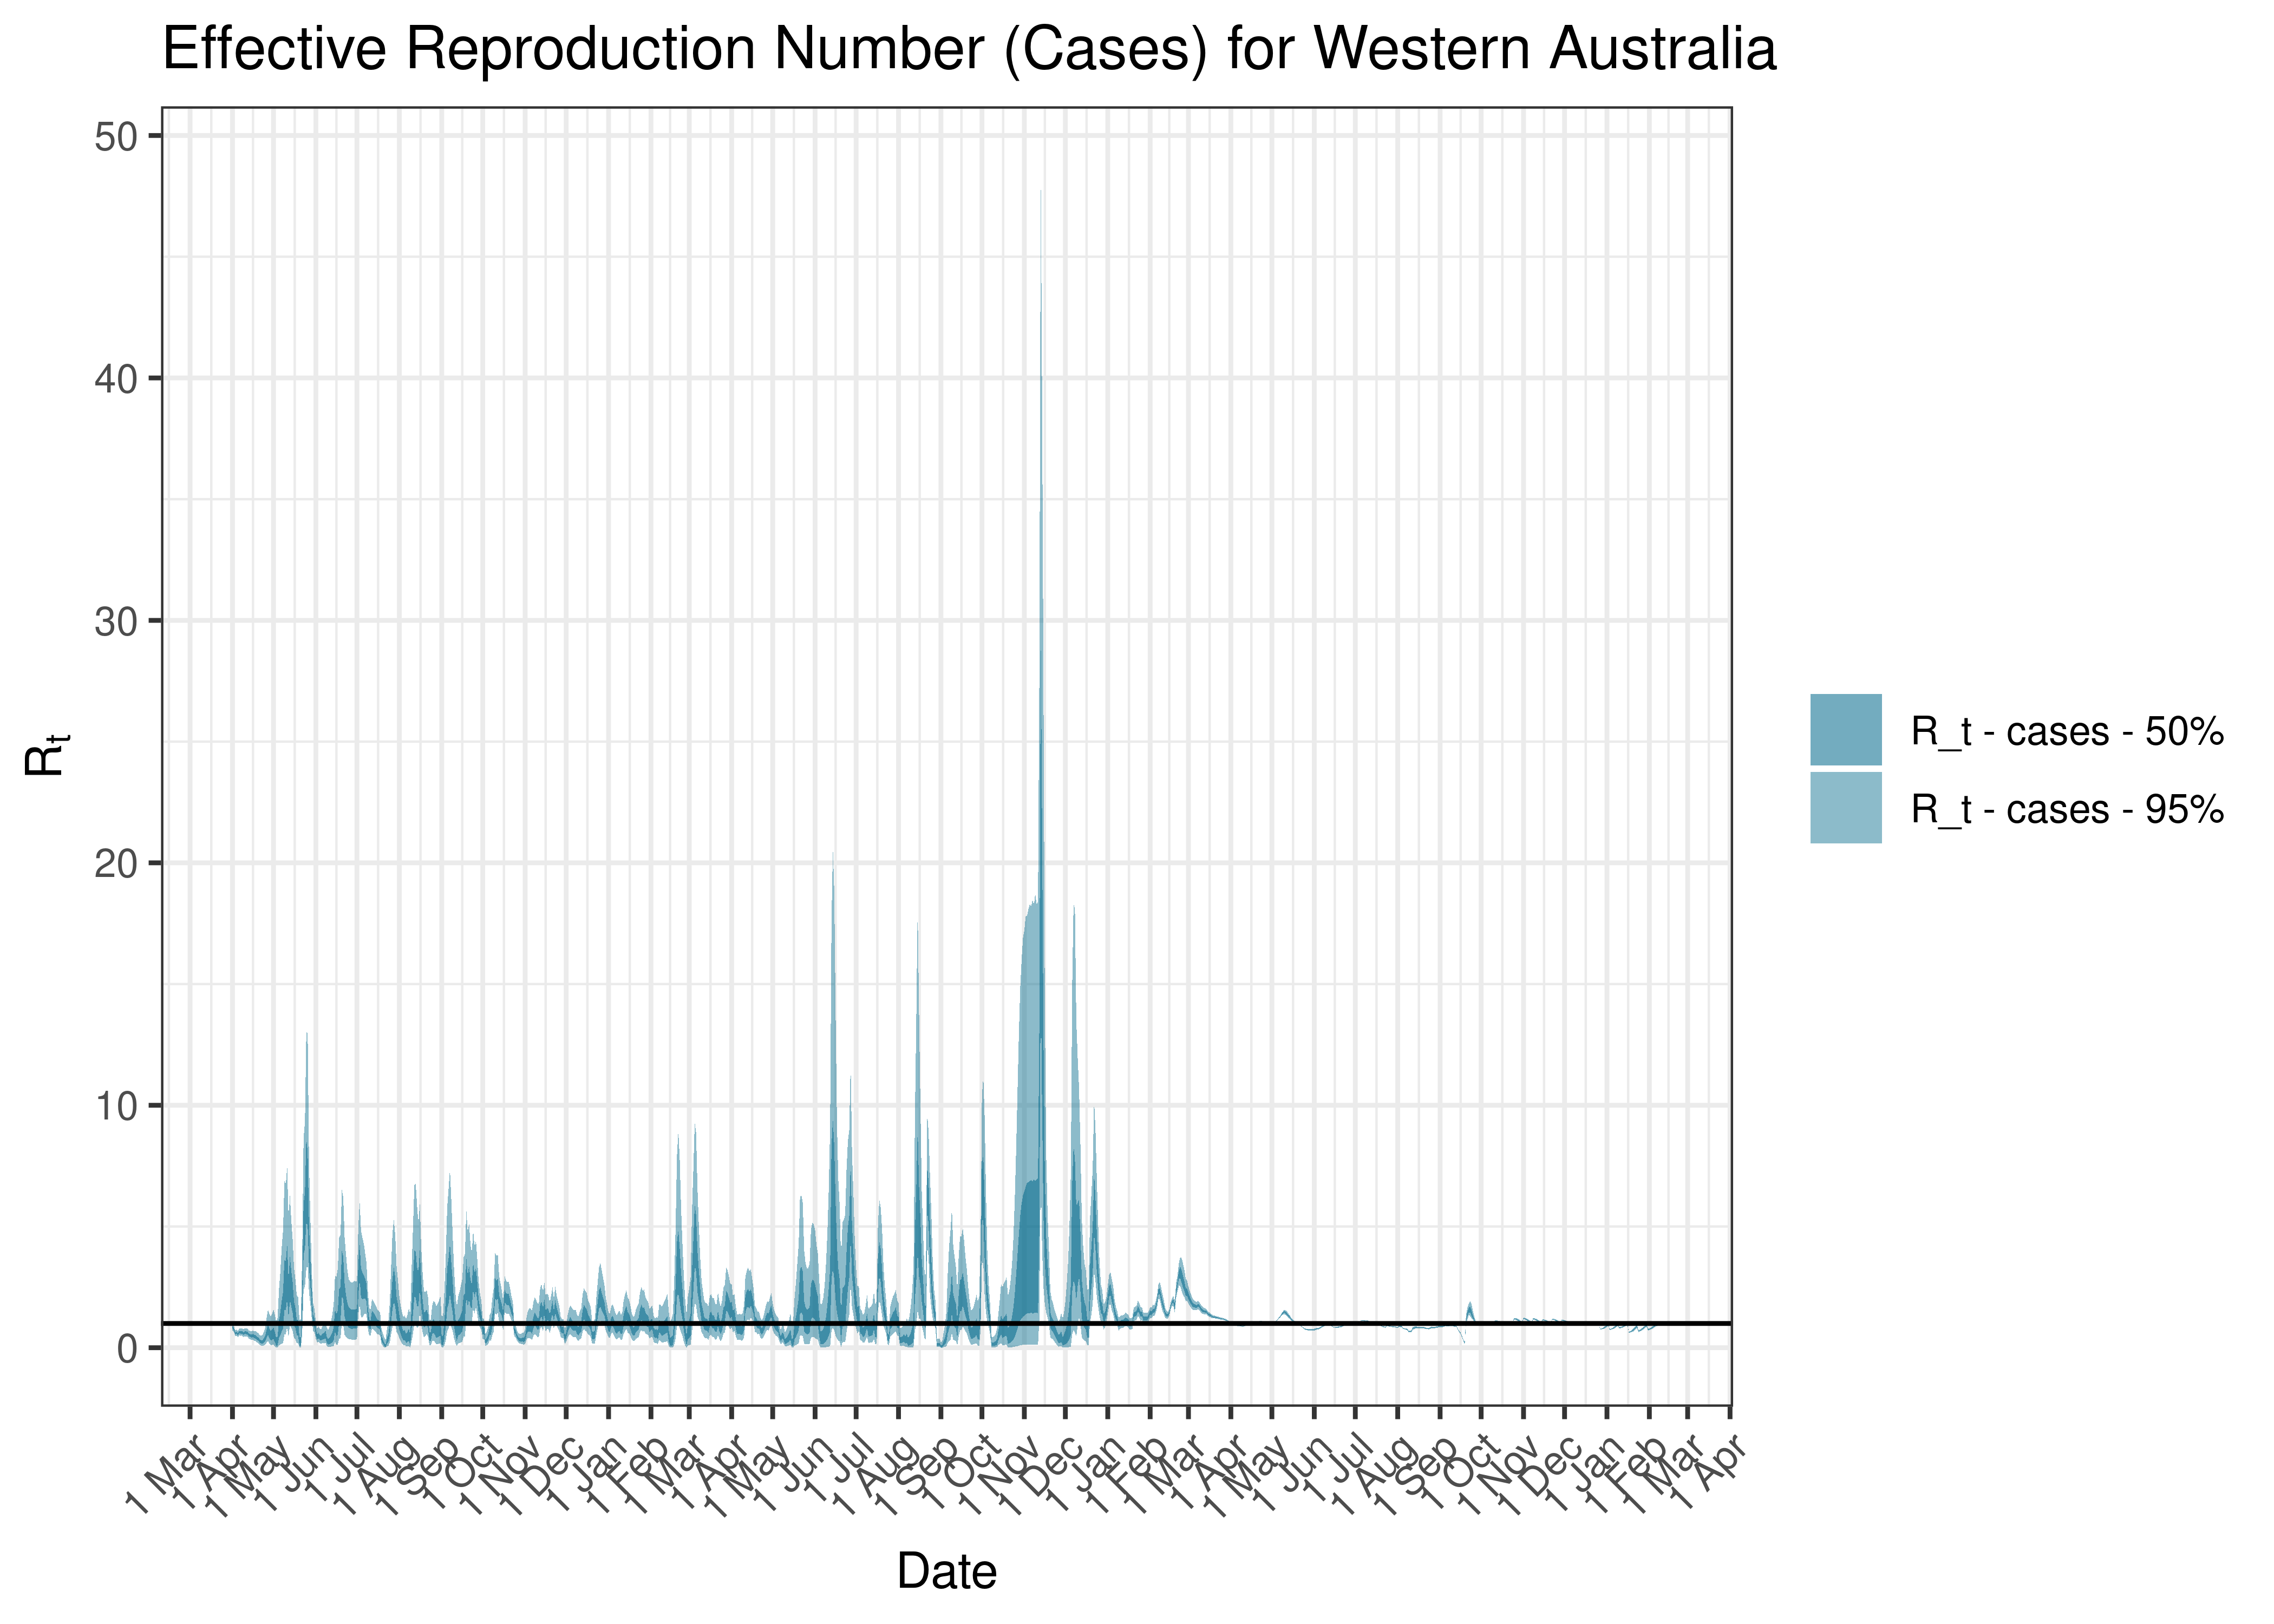
Estimated Effective Reproduction Number Based on Cases for Western Australia since 1 April 2020
5.10 Detailed Results
Detailed output for all states are saved to a comma-separated value file. The file can be found here.
6 Discussion
Limitation of this method to estimated reproduction number are noted in [1]:
- It’s sensitive to changes in transmissibility, changes in contact patterns, depletion of the susceptible population and control measures.
- It relies on an assumed generation interval assumptions.
- The size of the time window can affect the volatility of results.
- Results are time lagged with regards to true infection.
- It’s sensitive to changes in case detection.
- The generation interval may change over time.
- Crude ratios calculated do not account for timing accurately.
- It’s unclear what dates the data relate to.
- It’s unclear to what degree the data is subject to reporting delays.
Further to the above the estimates are made under assumption that the cases are detected at a similar ratio to the underlying infections over time. Should this change rapidly over an interval of a few weeks the above estimates of the effective reproduction numbers would be biased. For example a rapid expansion of case detection could result in an overestimating recent effective reproduction numbers.
A relatively simple allowance is made for public holidays so as to avoid volatile figures due to public holidays. This allowance could be refined further but should result in a more consistent estimate of the reproduction number over time. Care should still be taken when reviewing results during periods where testing could be impacted.
Estimates for the reproduction number here are plotted in time period in which the case was recorded. Ideally we would wish to capture the date the infection occurred. These figures have not been shifted back, even approximately, to the date of infection.
Many if the district municipalities may have limited cases at any particular point in time and hence reproduction numbers estimated for these may be wide. Care should be taken where confidence intervals are wide.
Despite these limitation it is believed that the ease of calculation of this method and the ability to use multiple sources makes it useful as a monitoring tool.