Estimating the Effective Reproduction Number of COVID-19 in United Kingdom
Louis Rossouw
2022-12-24 10:15:11 GMT
1 Introduction
This paper contains estimates for the effective reproduction number
\(R_{t,m}\) over time \(t\) in various nations and other regions
\(m\) of United Kingdom. This is done
using the methodology as described in [1].
These have been implemented in R using EpiEstim package
[2] which is what is used here. The
methodology and assumptions are described in more detail here.
This paper and it’s results should be updated roughly daily and is available online.
2 Updates
As this paper is updated over time this section will summarise significant changes. The code producing this paper is tracked using Git. The Git commit hash for this project at the time of generating this paper was f375c64277b7e5fd535c882031ceca88dc14db31.
The following updates have been made:
- On 27 May 2021 methodology was updated to use up to date cases but an allowance for late reporting was added.
- Further on 28 May 2021 plots and maps were updated to consistently not plot reproduction number estimates where the 95% confidence interval associated with that estimate is wider than 1.
- A further update on 29 May 2021 was made. All plots and maps were updated to consistently not plot reproduction number estimates where the 95% confidence interval associated with that estimate is wider than 1.
- On 9 January 2022 improvements to allowance for late reproted data was made.
3 Data
3.1 Source
Data is obtained [3]. This contains the daily cases, hospital admissions and deaths for United Kingdom by various geographies. Here the data is accessed by specimen date, admission date and date of death.
All data prior to 1 March 2020 are removed.
3.2 Allowance for late reporting
Based on a history of the data collected patterns of late reporting are developed. A maximum delay in reporting of 21 days is assumed and the last 28 days of reporting data is used to estimate the late reported cases, admissions and deaths.
4 Methodology
The methodology is described in detail here.
5 Results by Nation
5.1 Cases
Below a 7-day moving average of daily case count on a log scale by nation is plotted:
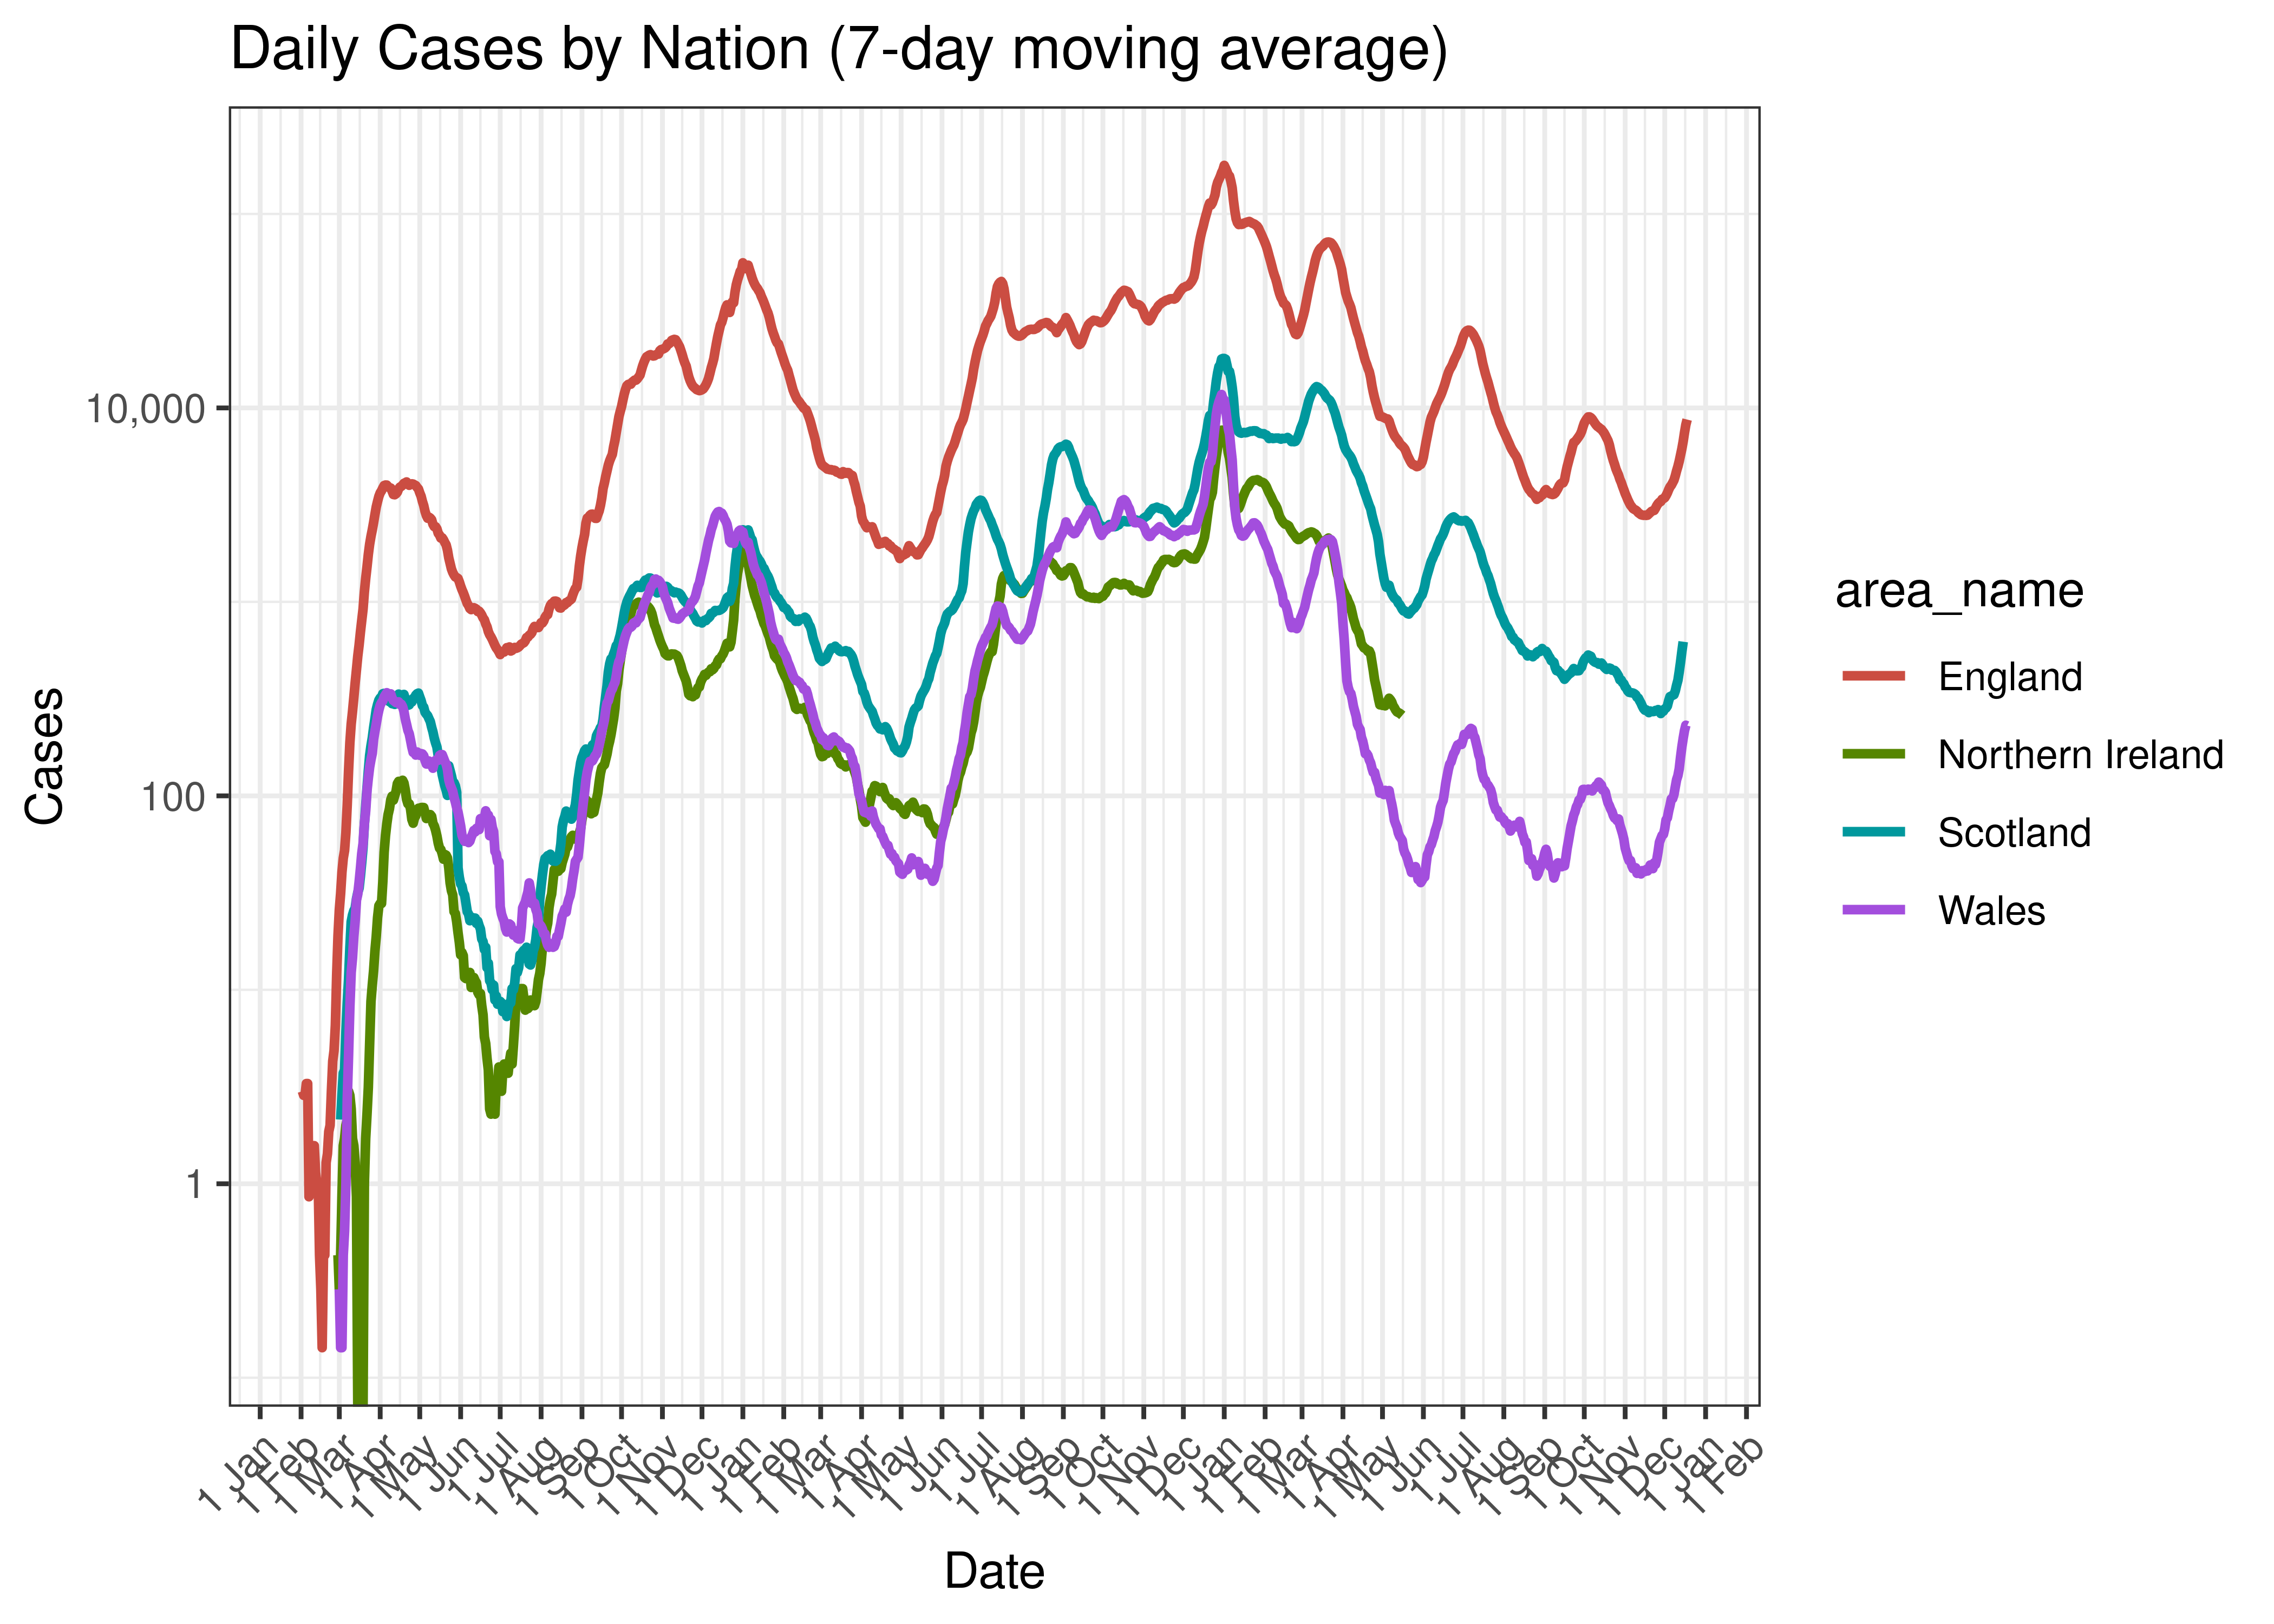
Daily Cases by Nation (7-day moving average)
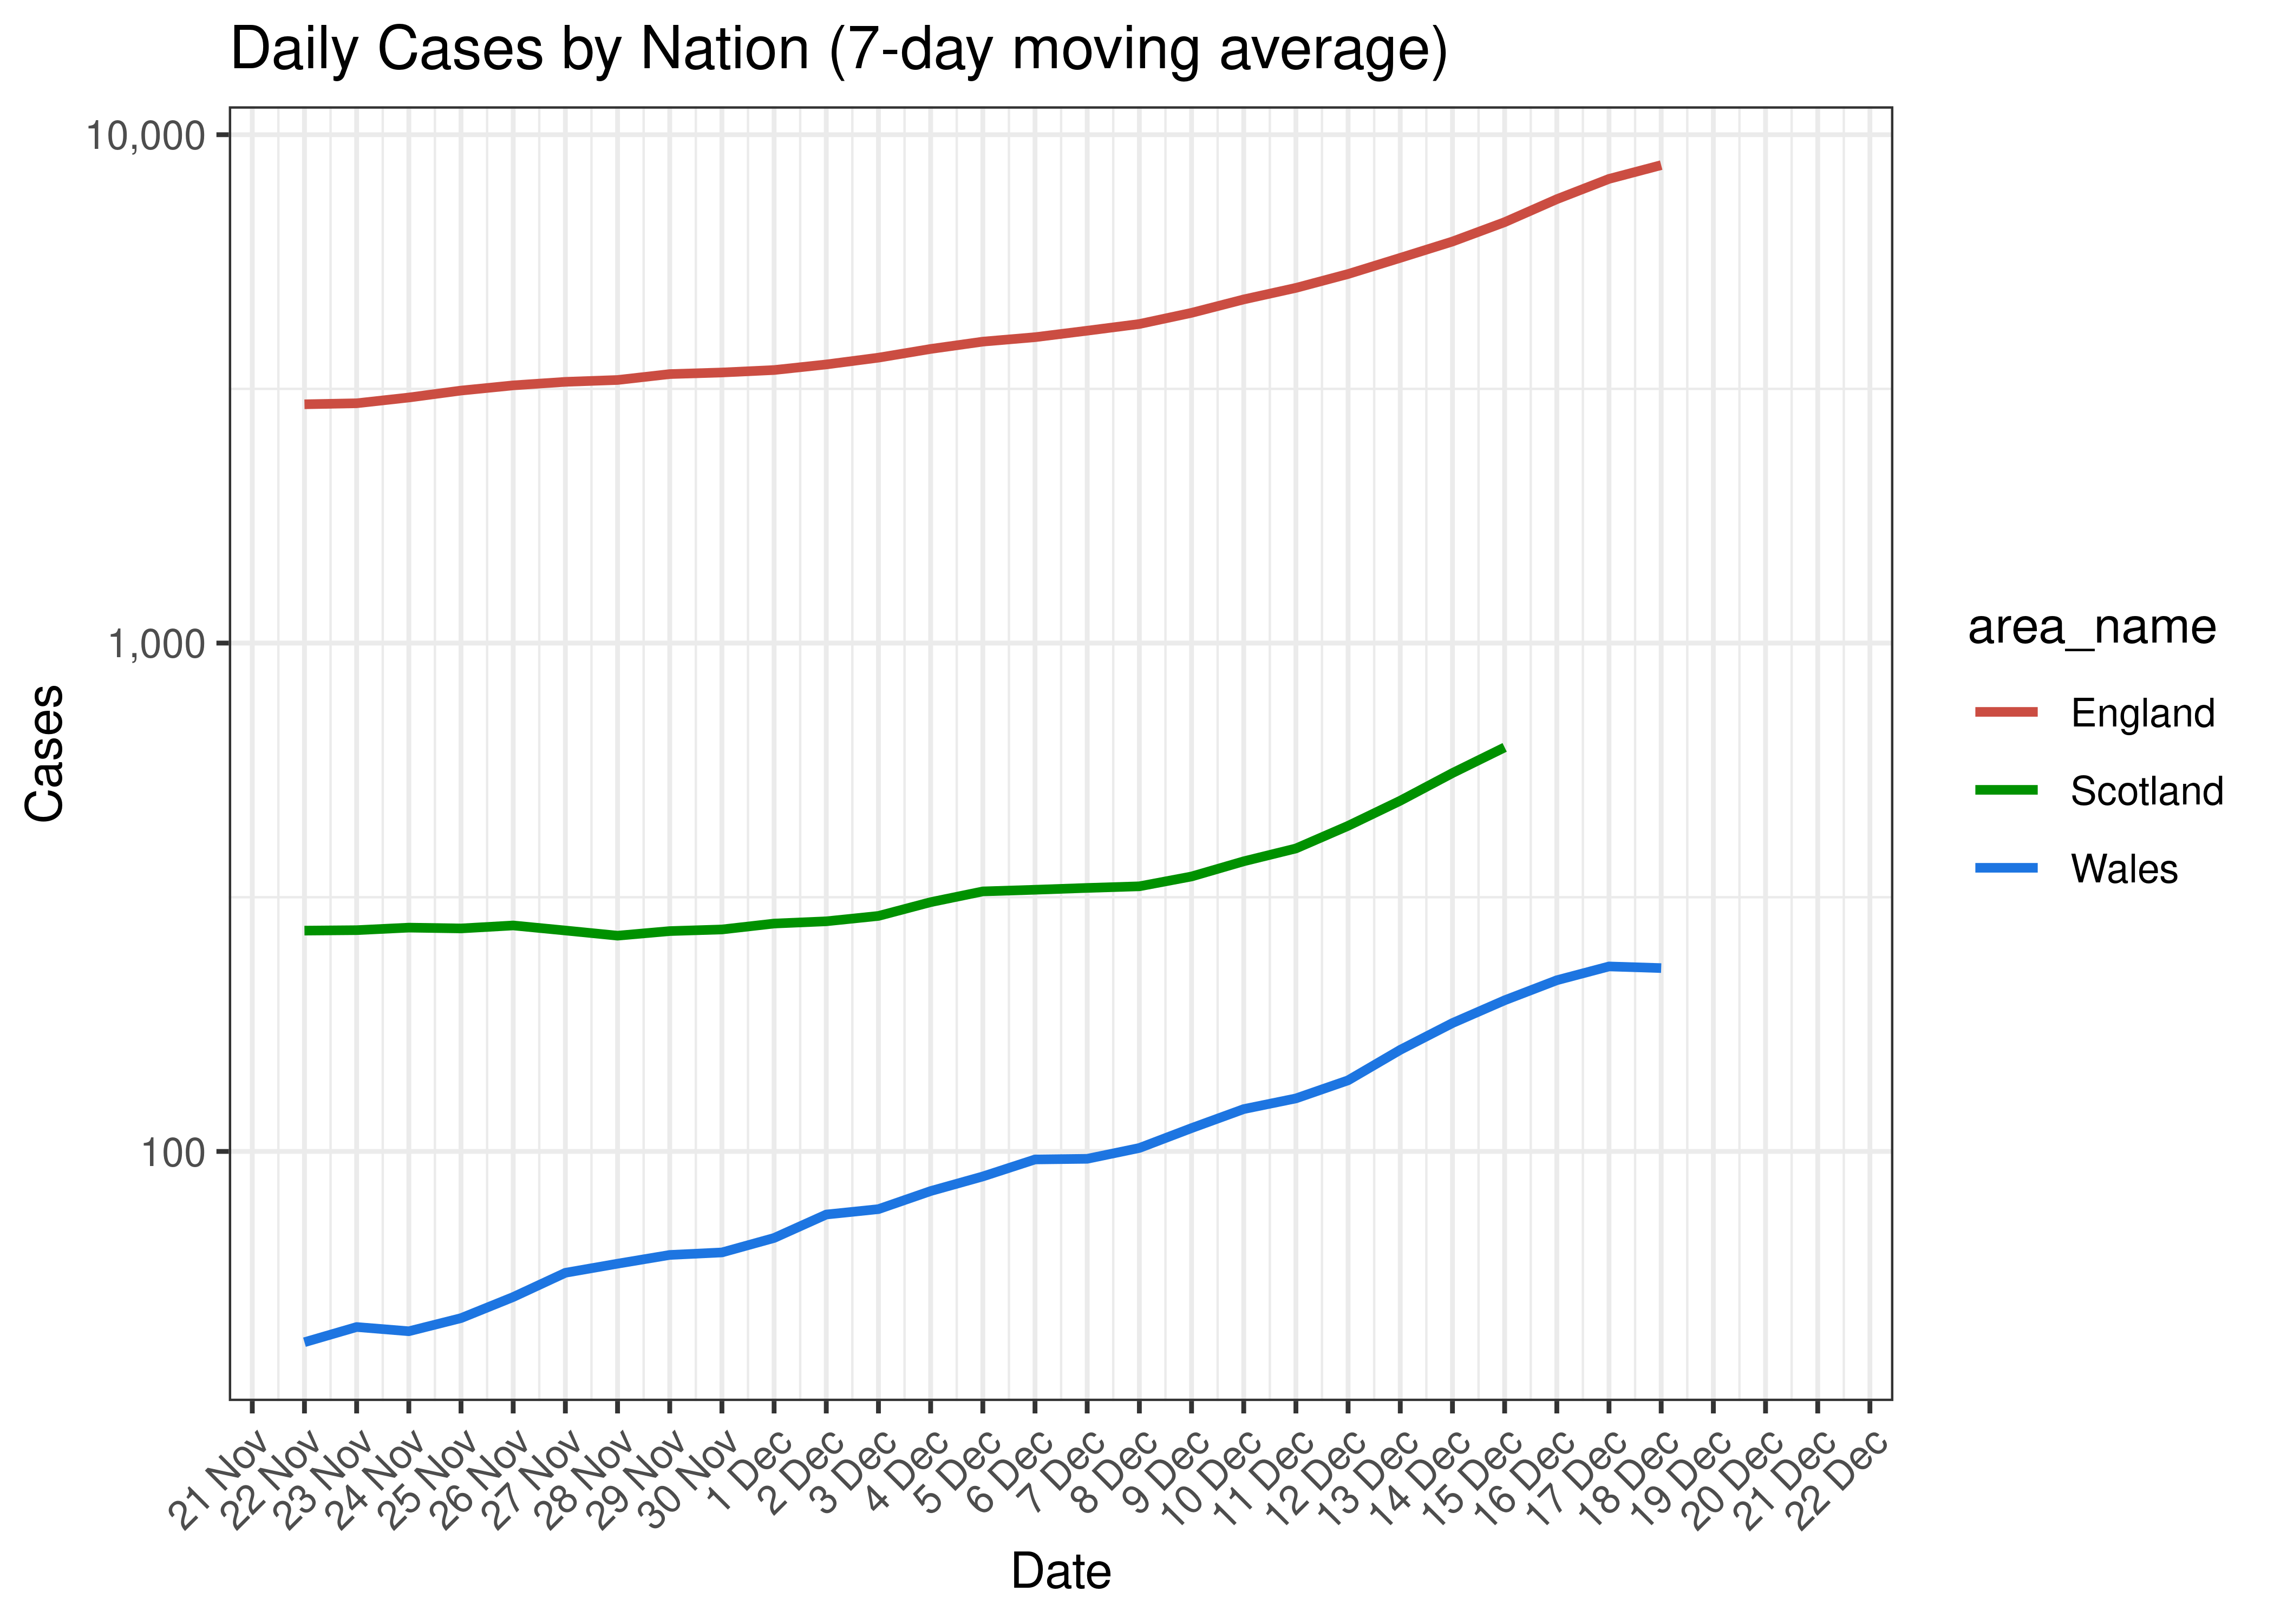
Daily Cases by Nation for Last 30-days (7-day moving average)
5.2 Admissions
Below we plot cumulative hospital admissions on a log scale.
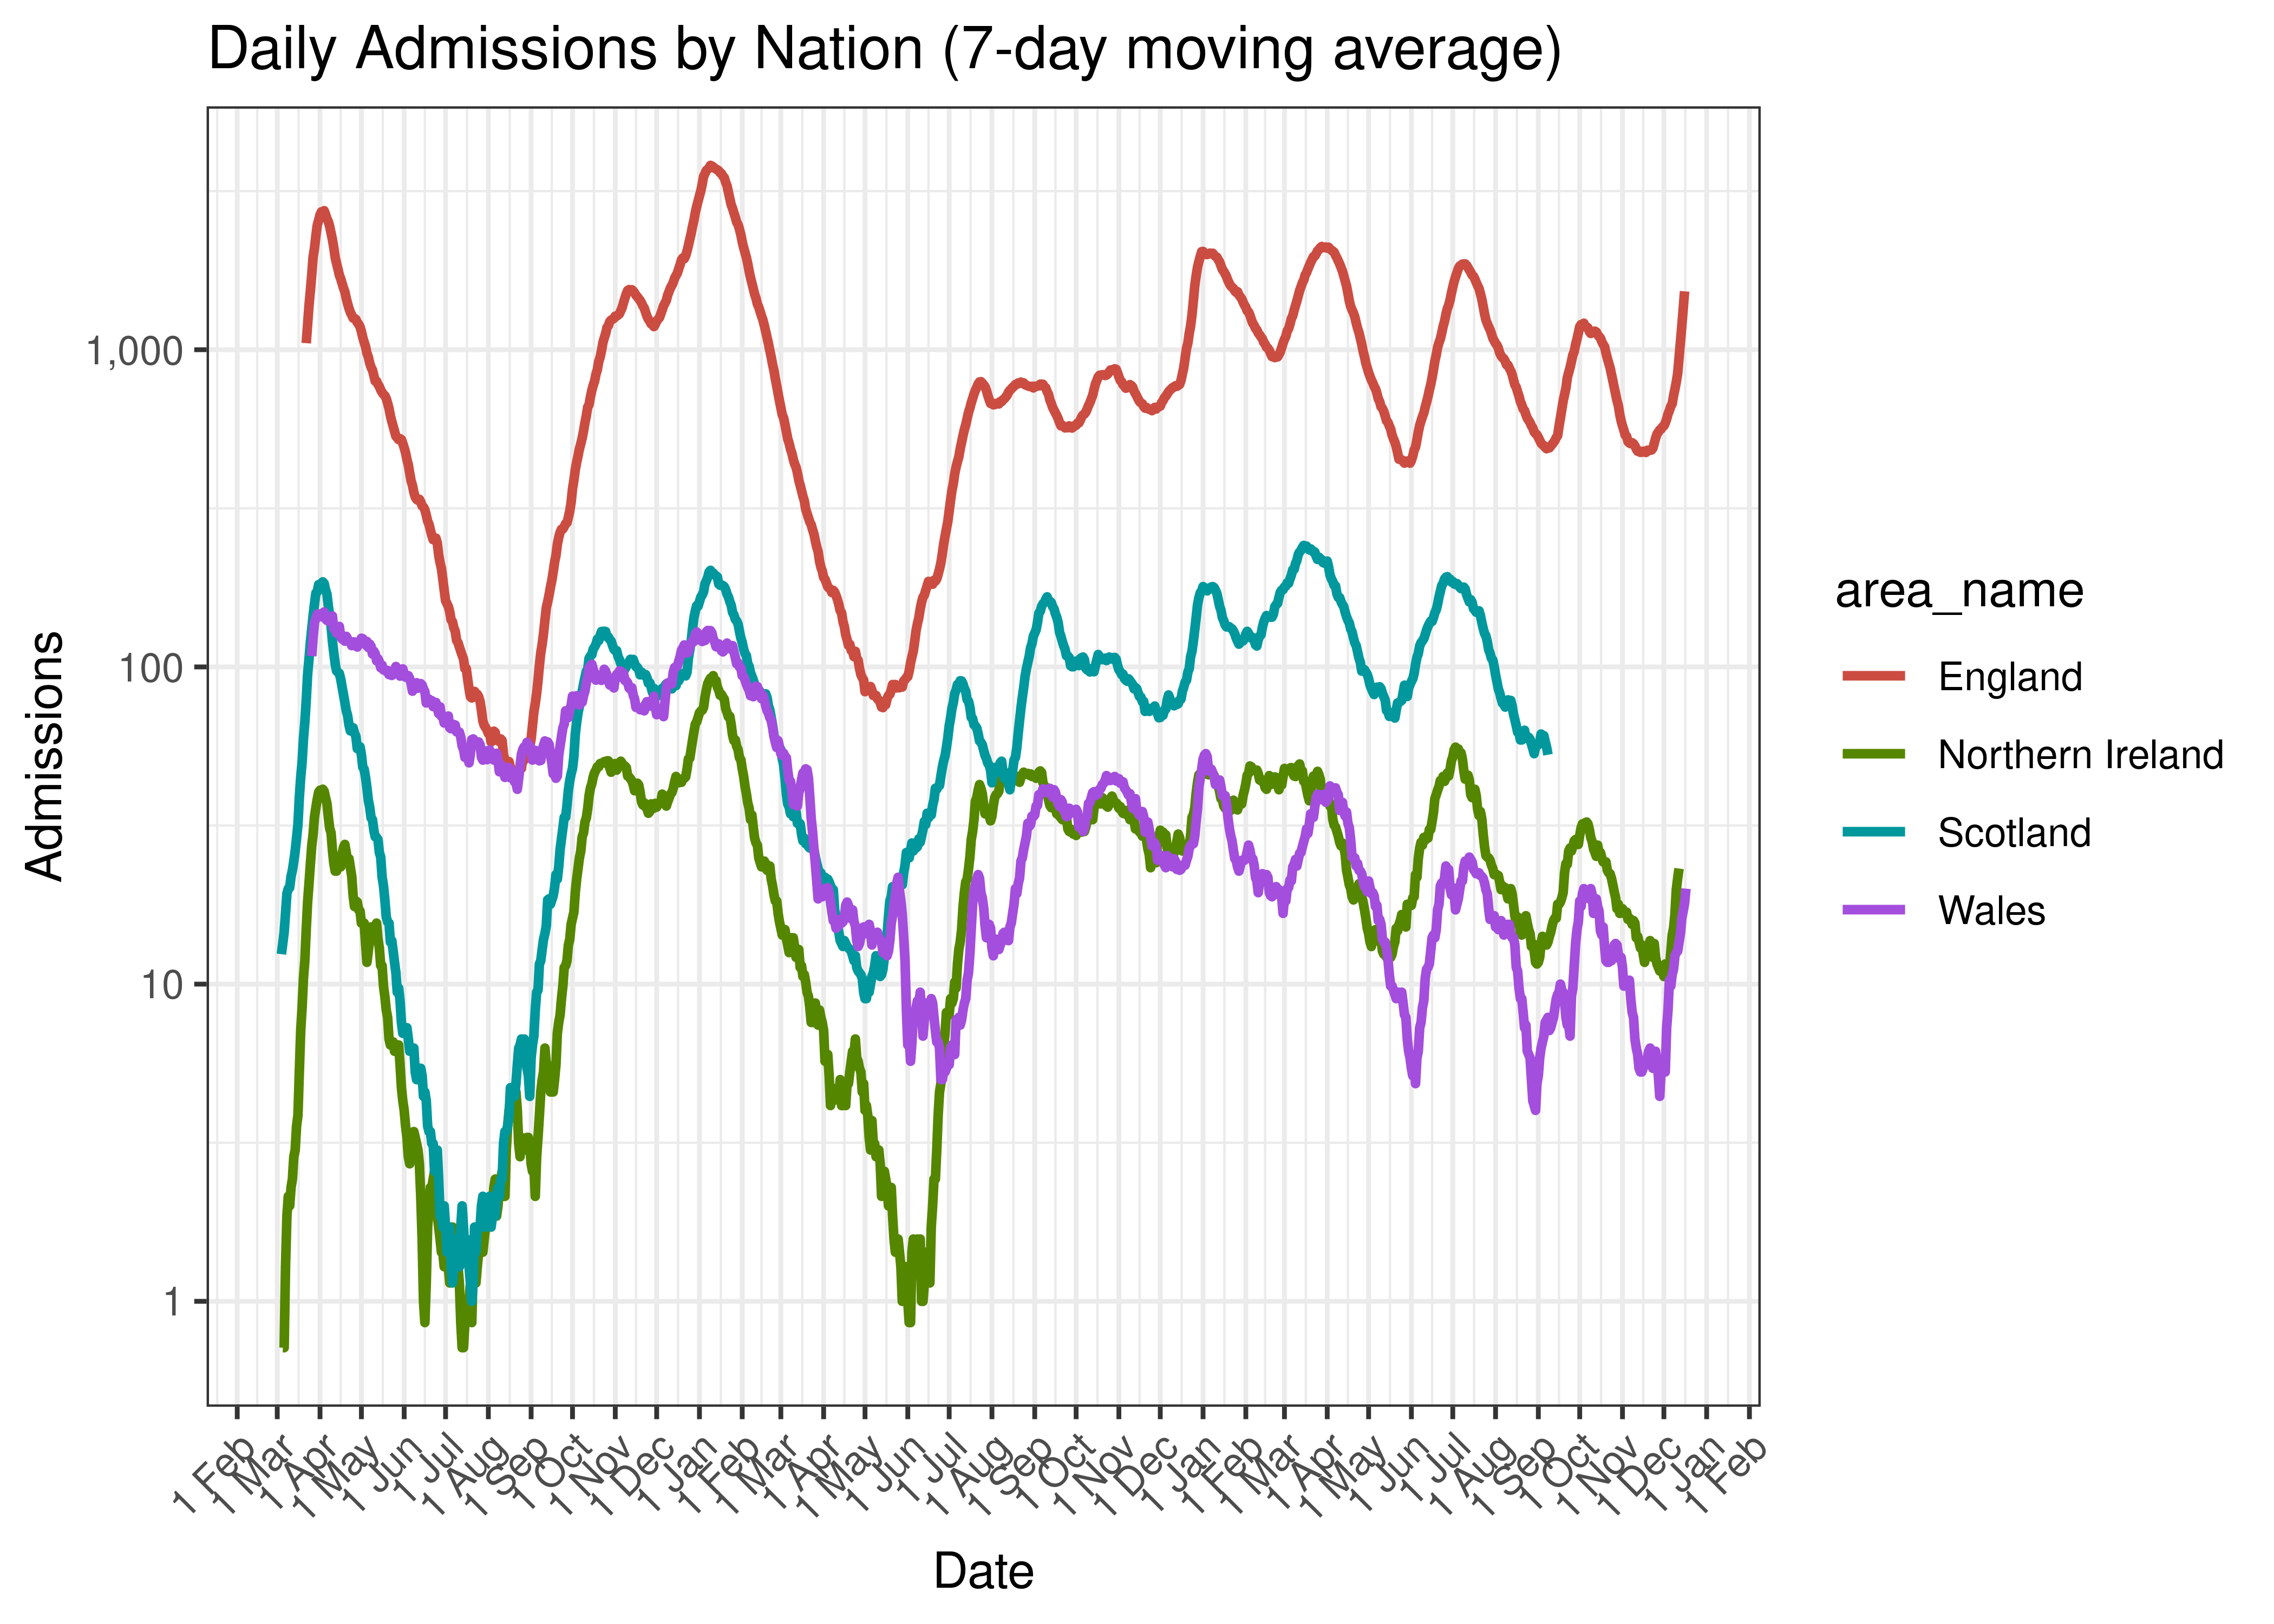
Daily Admissions by Nation (7-day moving average)
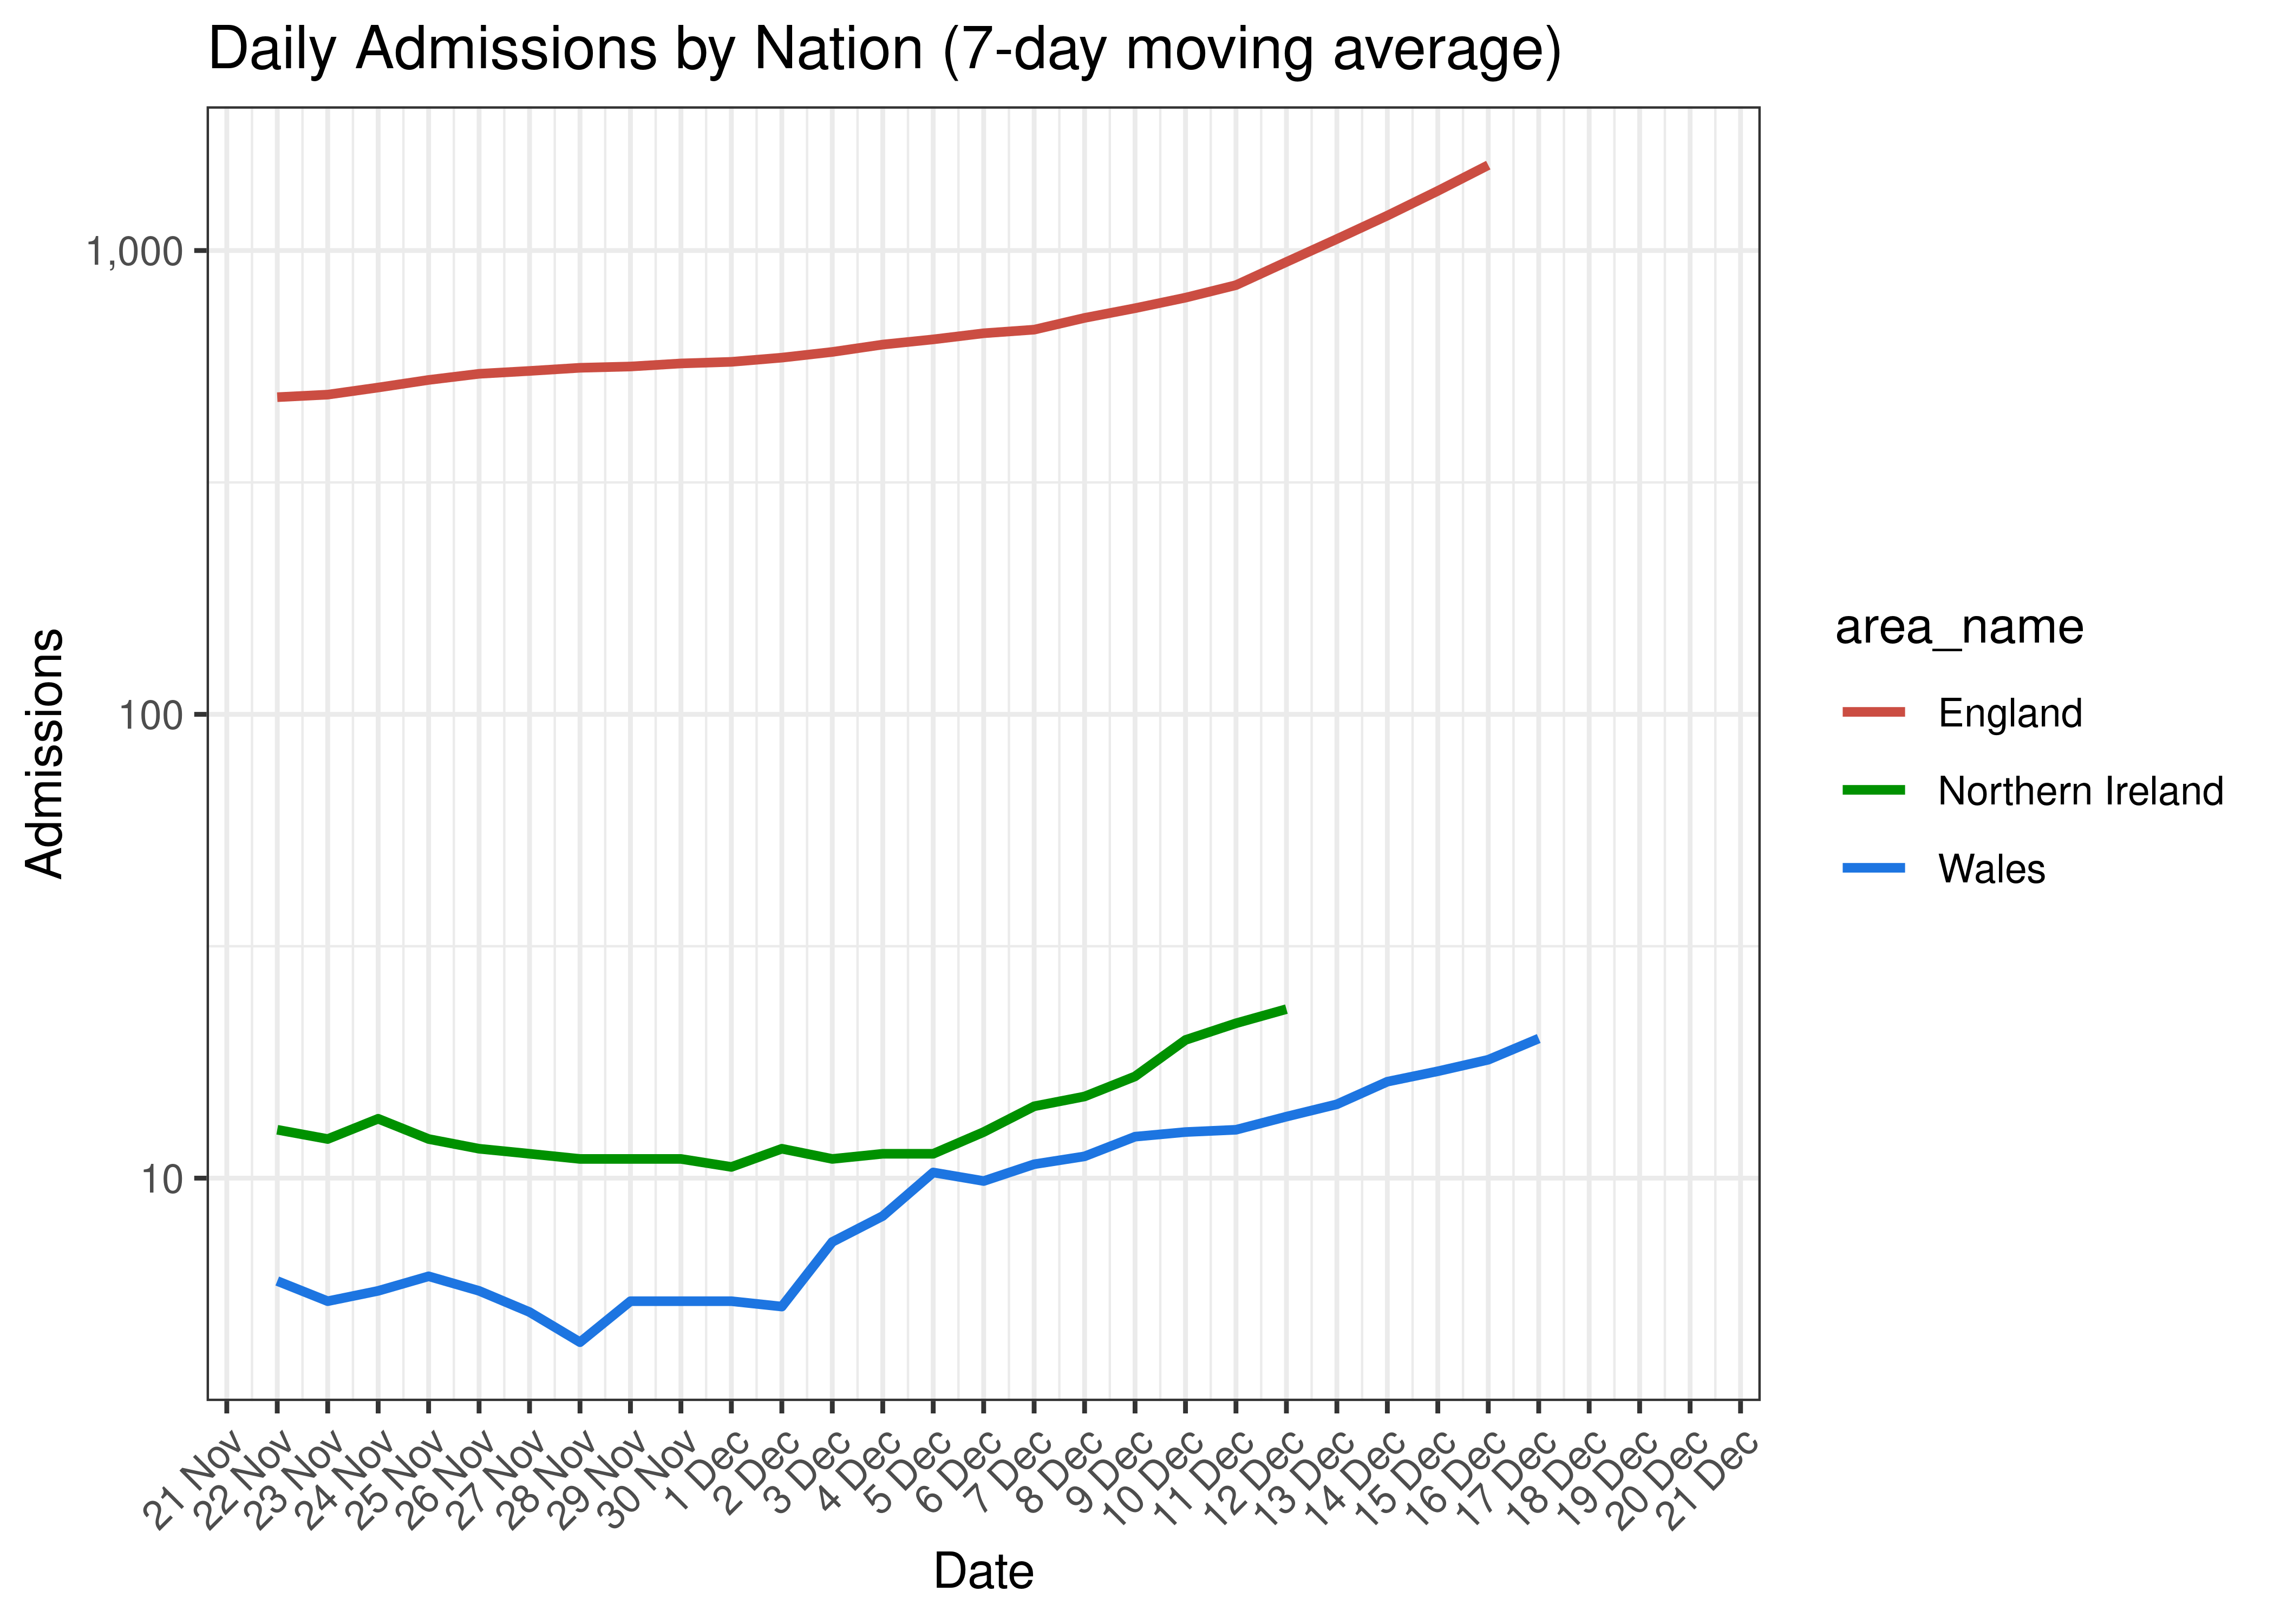
Daily Admissions by Nation for Last 30-days (7-day moving average)
5.3 Deaths
Below a 14-day moving average of daily deaths by nation on a log scale is plotted:
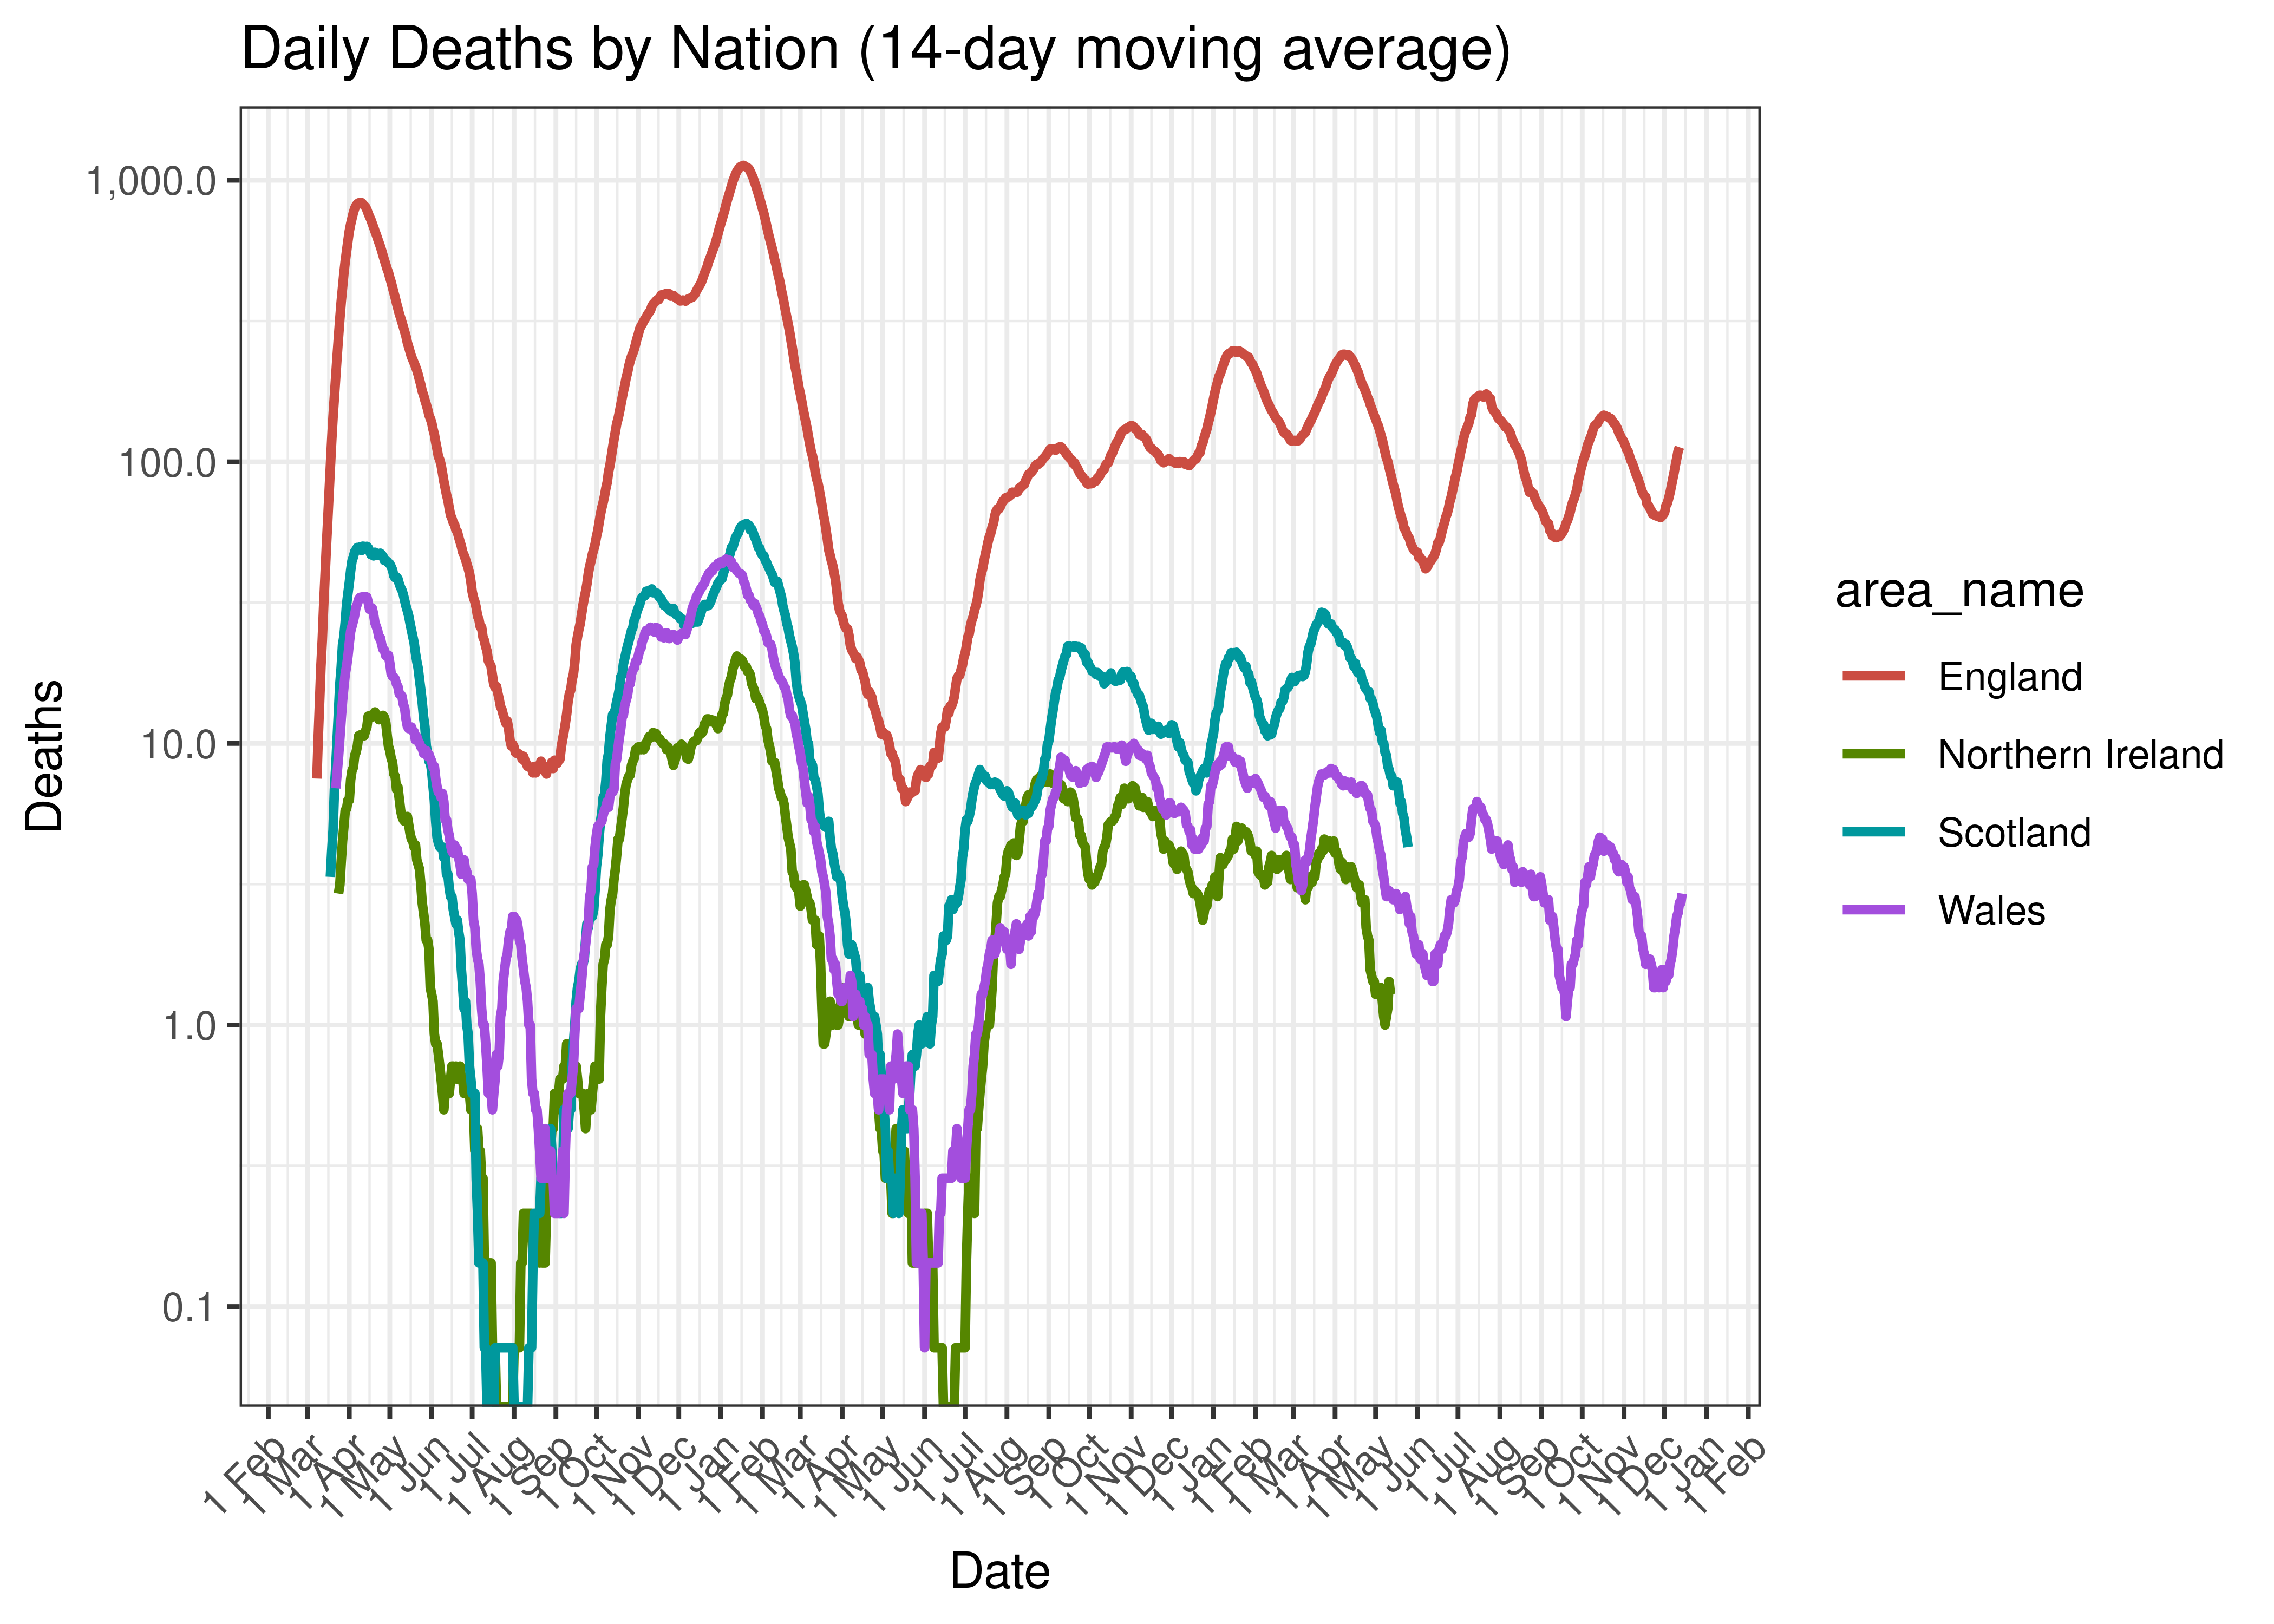
Daily Deaths by Nation (14-day moving average)
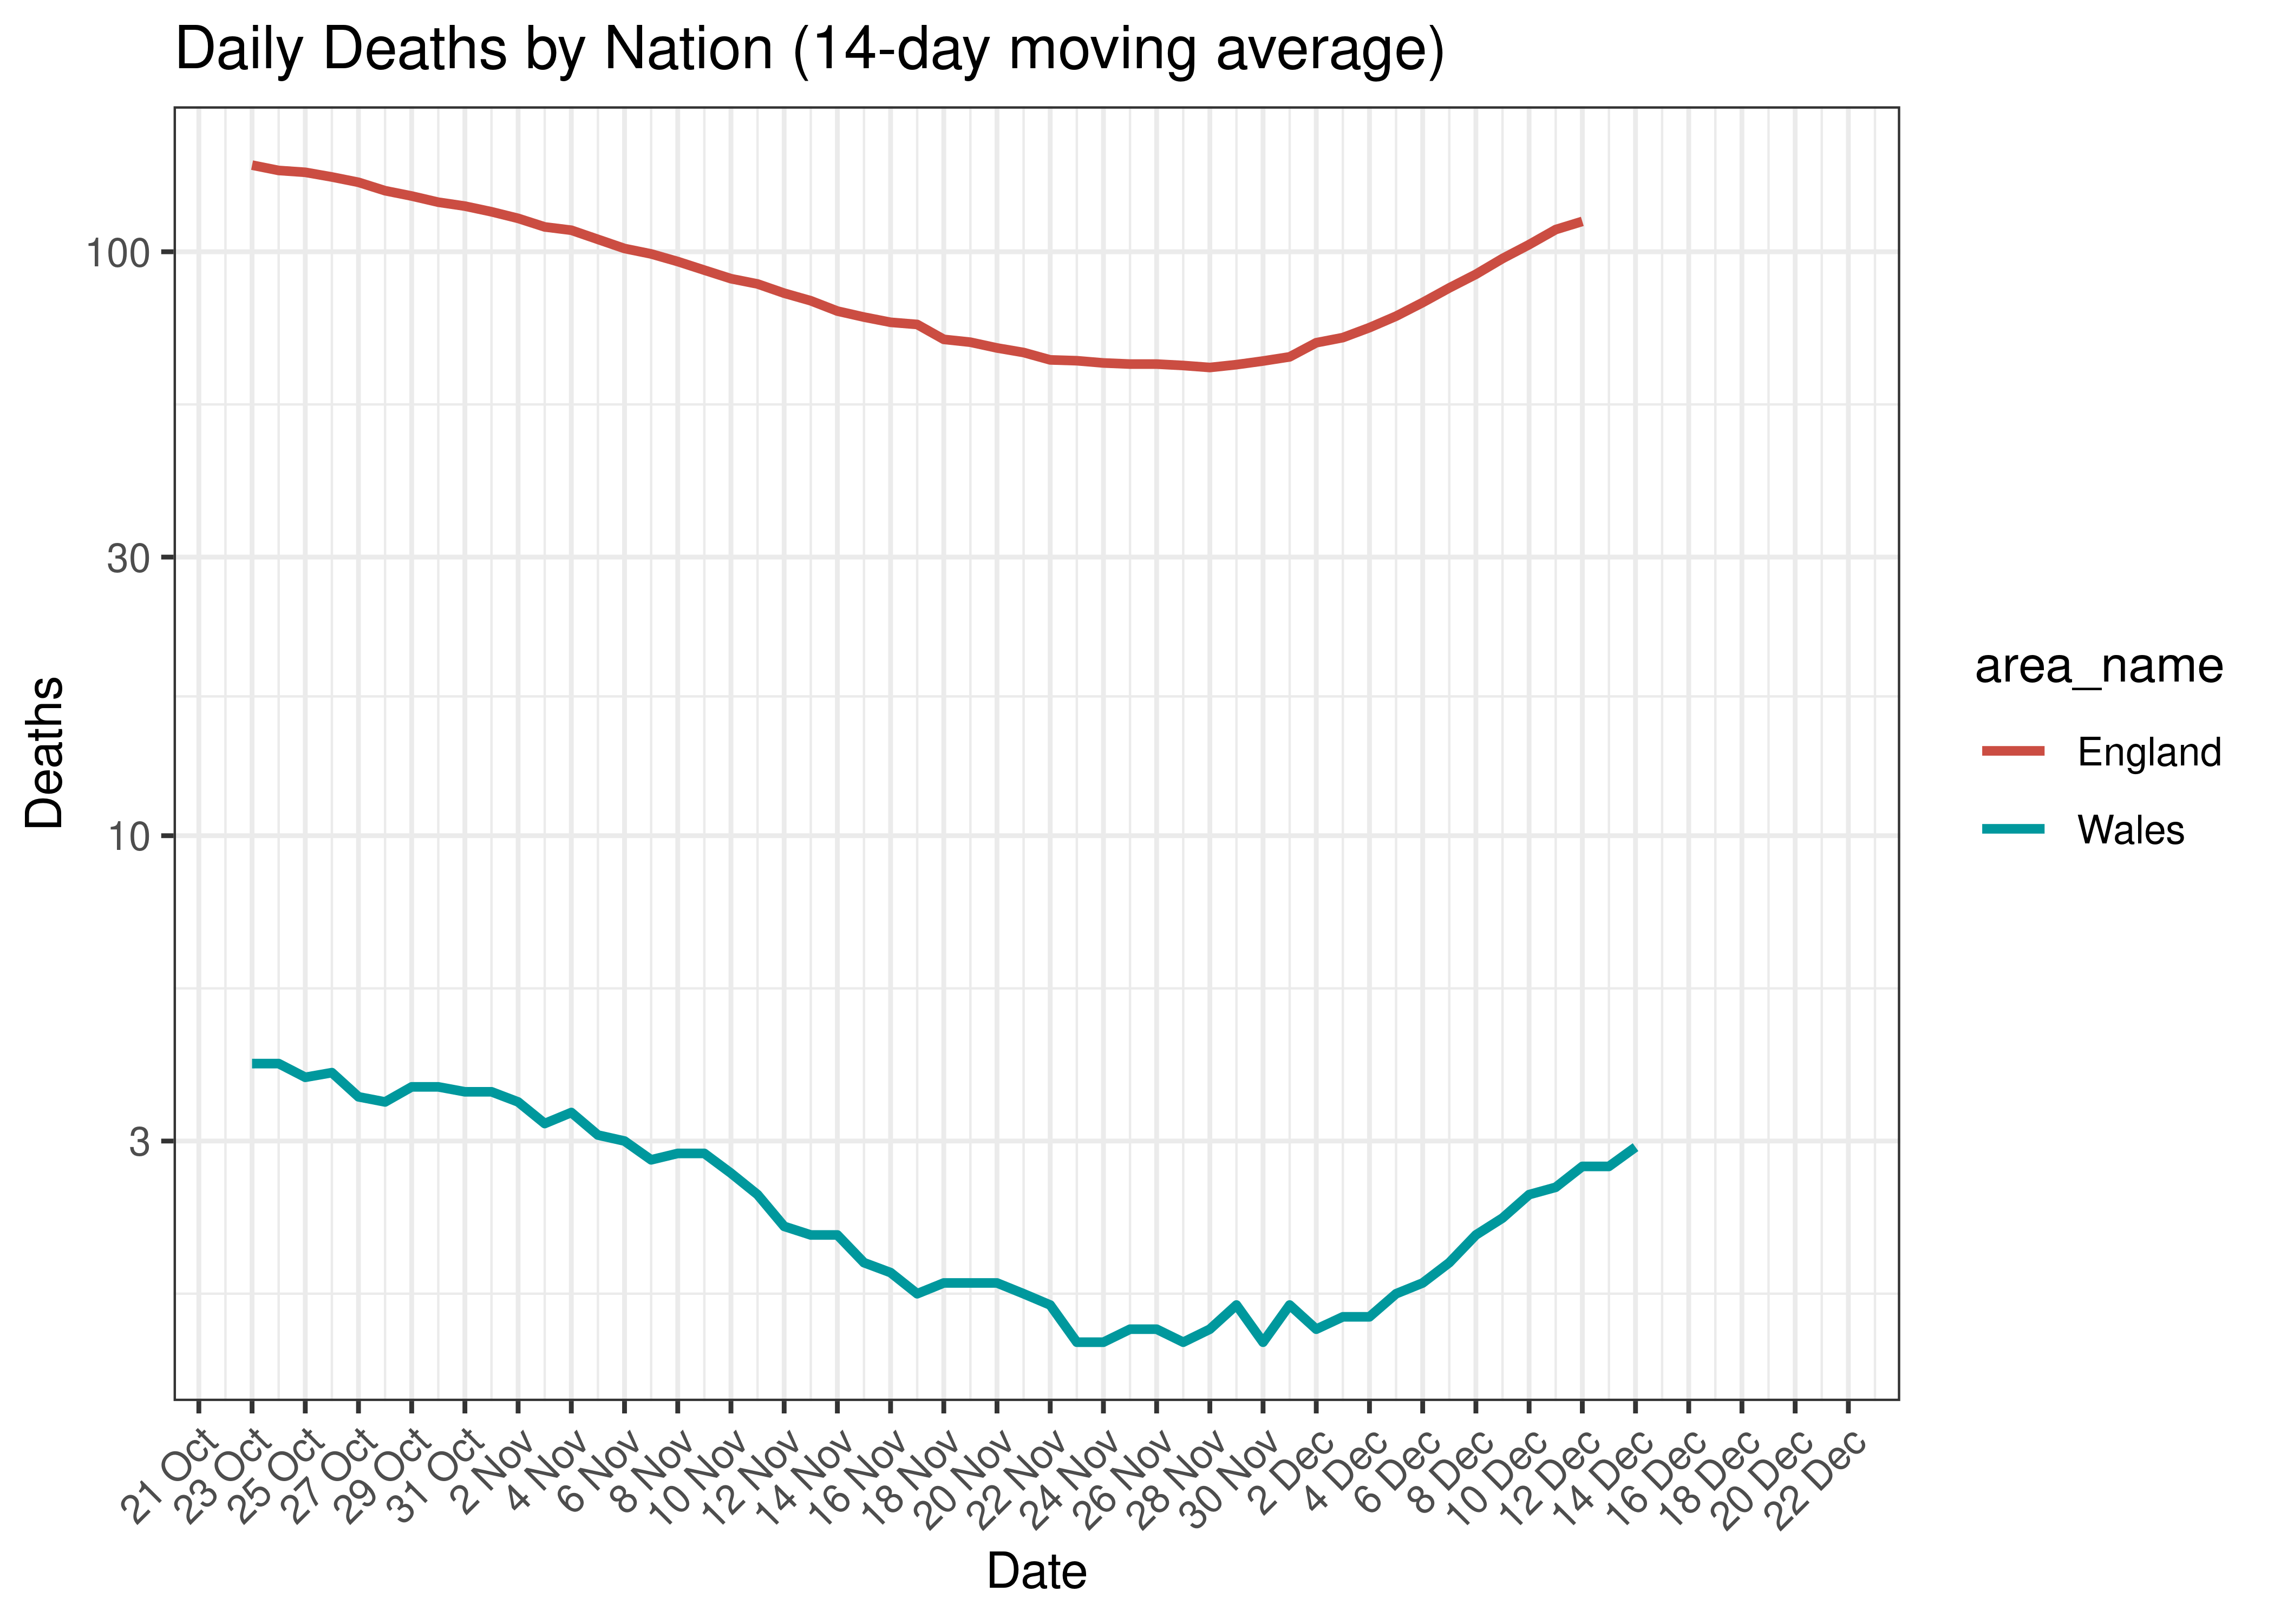
Daily Deaths by Nation for Last 60-days (14-day moving average)
5.4 Current Reproduction Number Estimates by Nation
Below current (last weekly) reproduction number estimates are tabulated by nation.
| Nation | Estimate Type | Daily Count (Last Week) | Week Ending | Reproduction Number [95% Confidence Interval] |
|---|---|---|---|---|
| England | cases | 8,712 | 2022-12-21 | 1.50 [1.39 - 1.60] |
| England | admissions | 1,528 | 2022-12-19 | 1.72 [1.57 - 1.87] |
| England | deaths | 132 | 2022-12-19 | 1.28 [1.17 - 1.39] |
| Northern Ireland | cases | 260 | 2022-05-19 | 0.93 [0.88 - 0.97] |
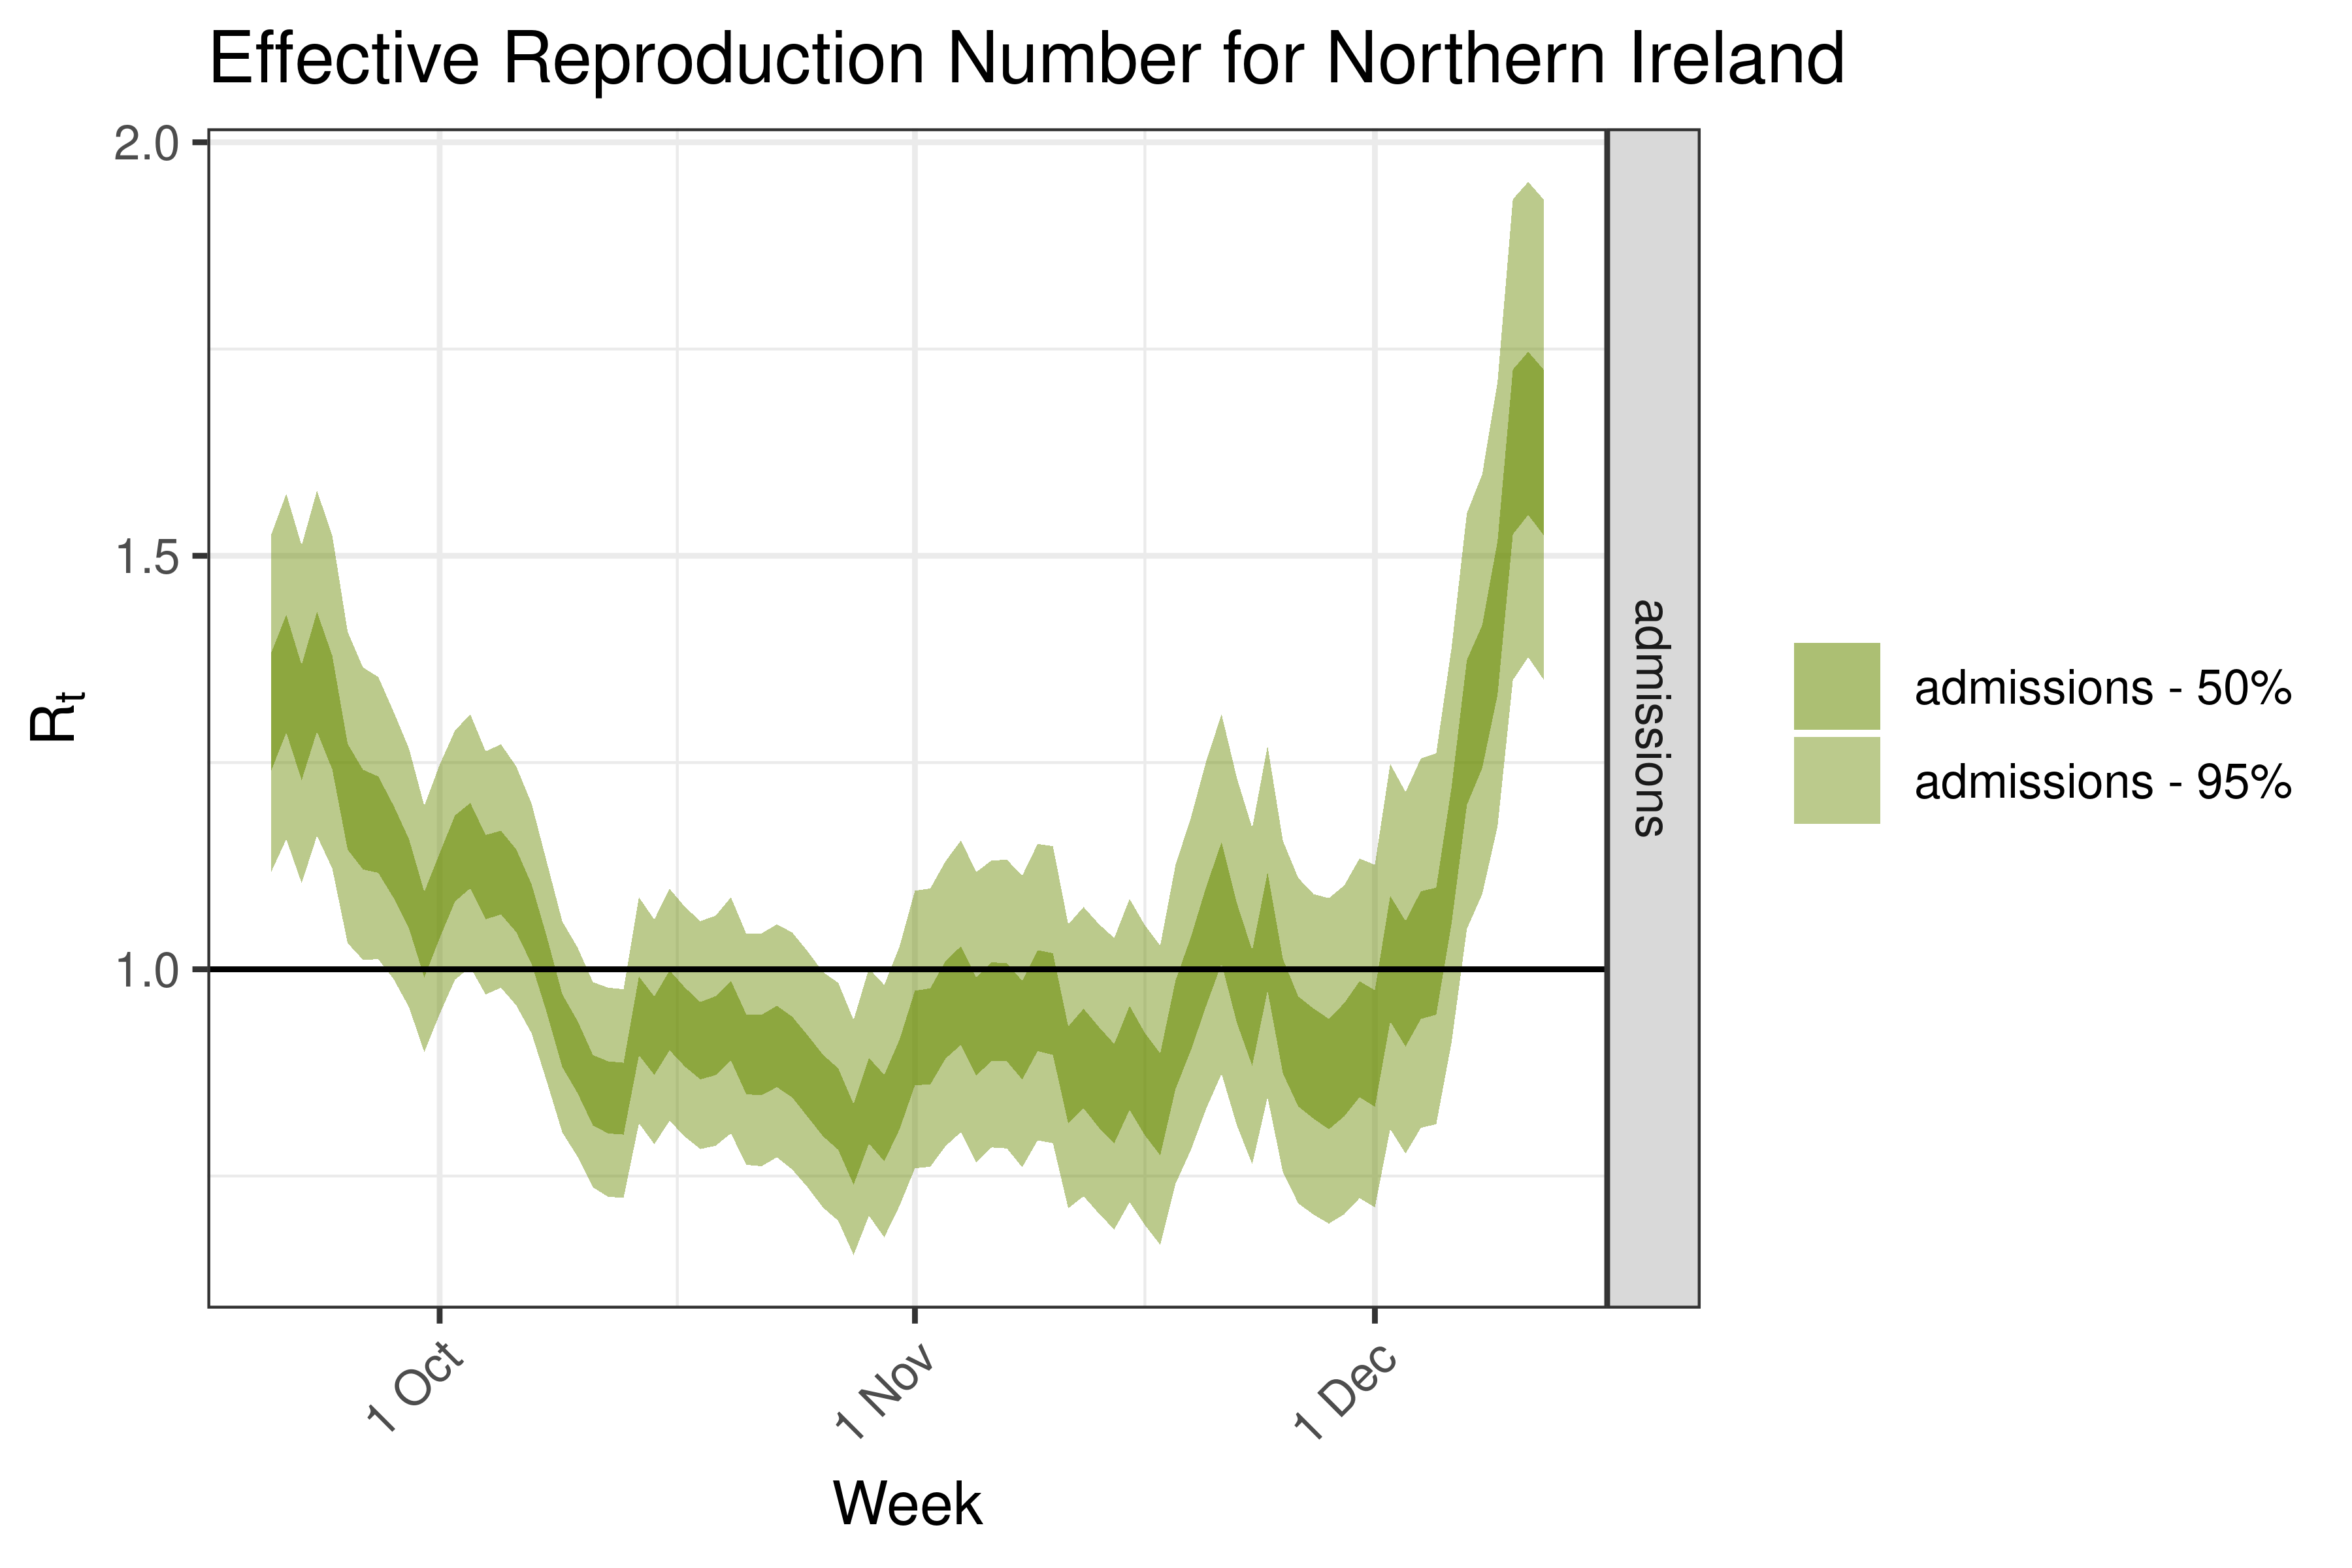
| Northern Ireland | admissions | 23 | 2022-12-15 | 1.63 [1.35 - 1.93] |
| Northern Ireland | deaths | 1 | 2022-05-19 | 0.99 [0.45 - 1.74] |
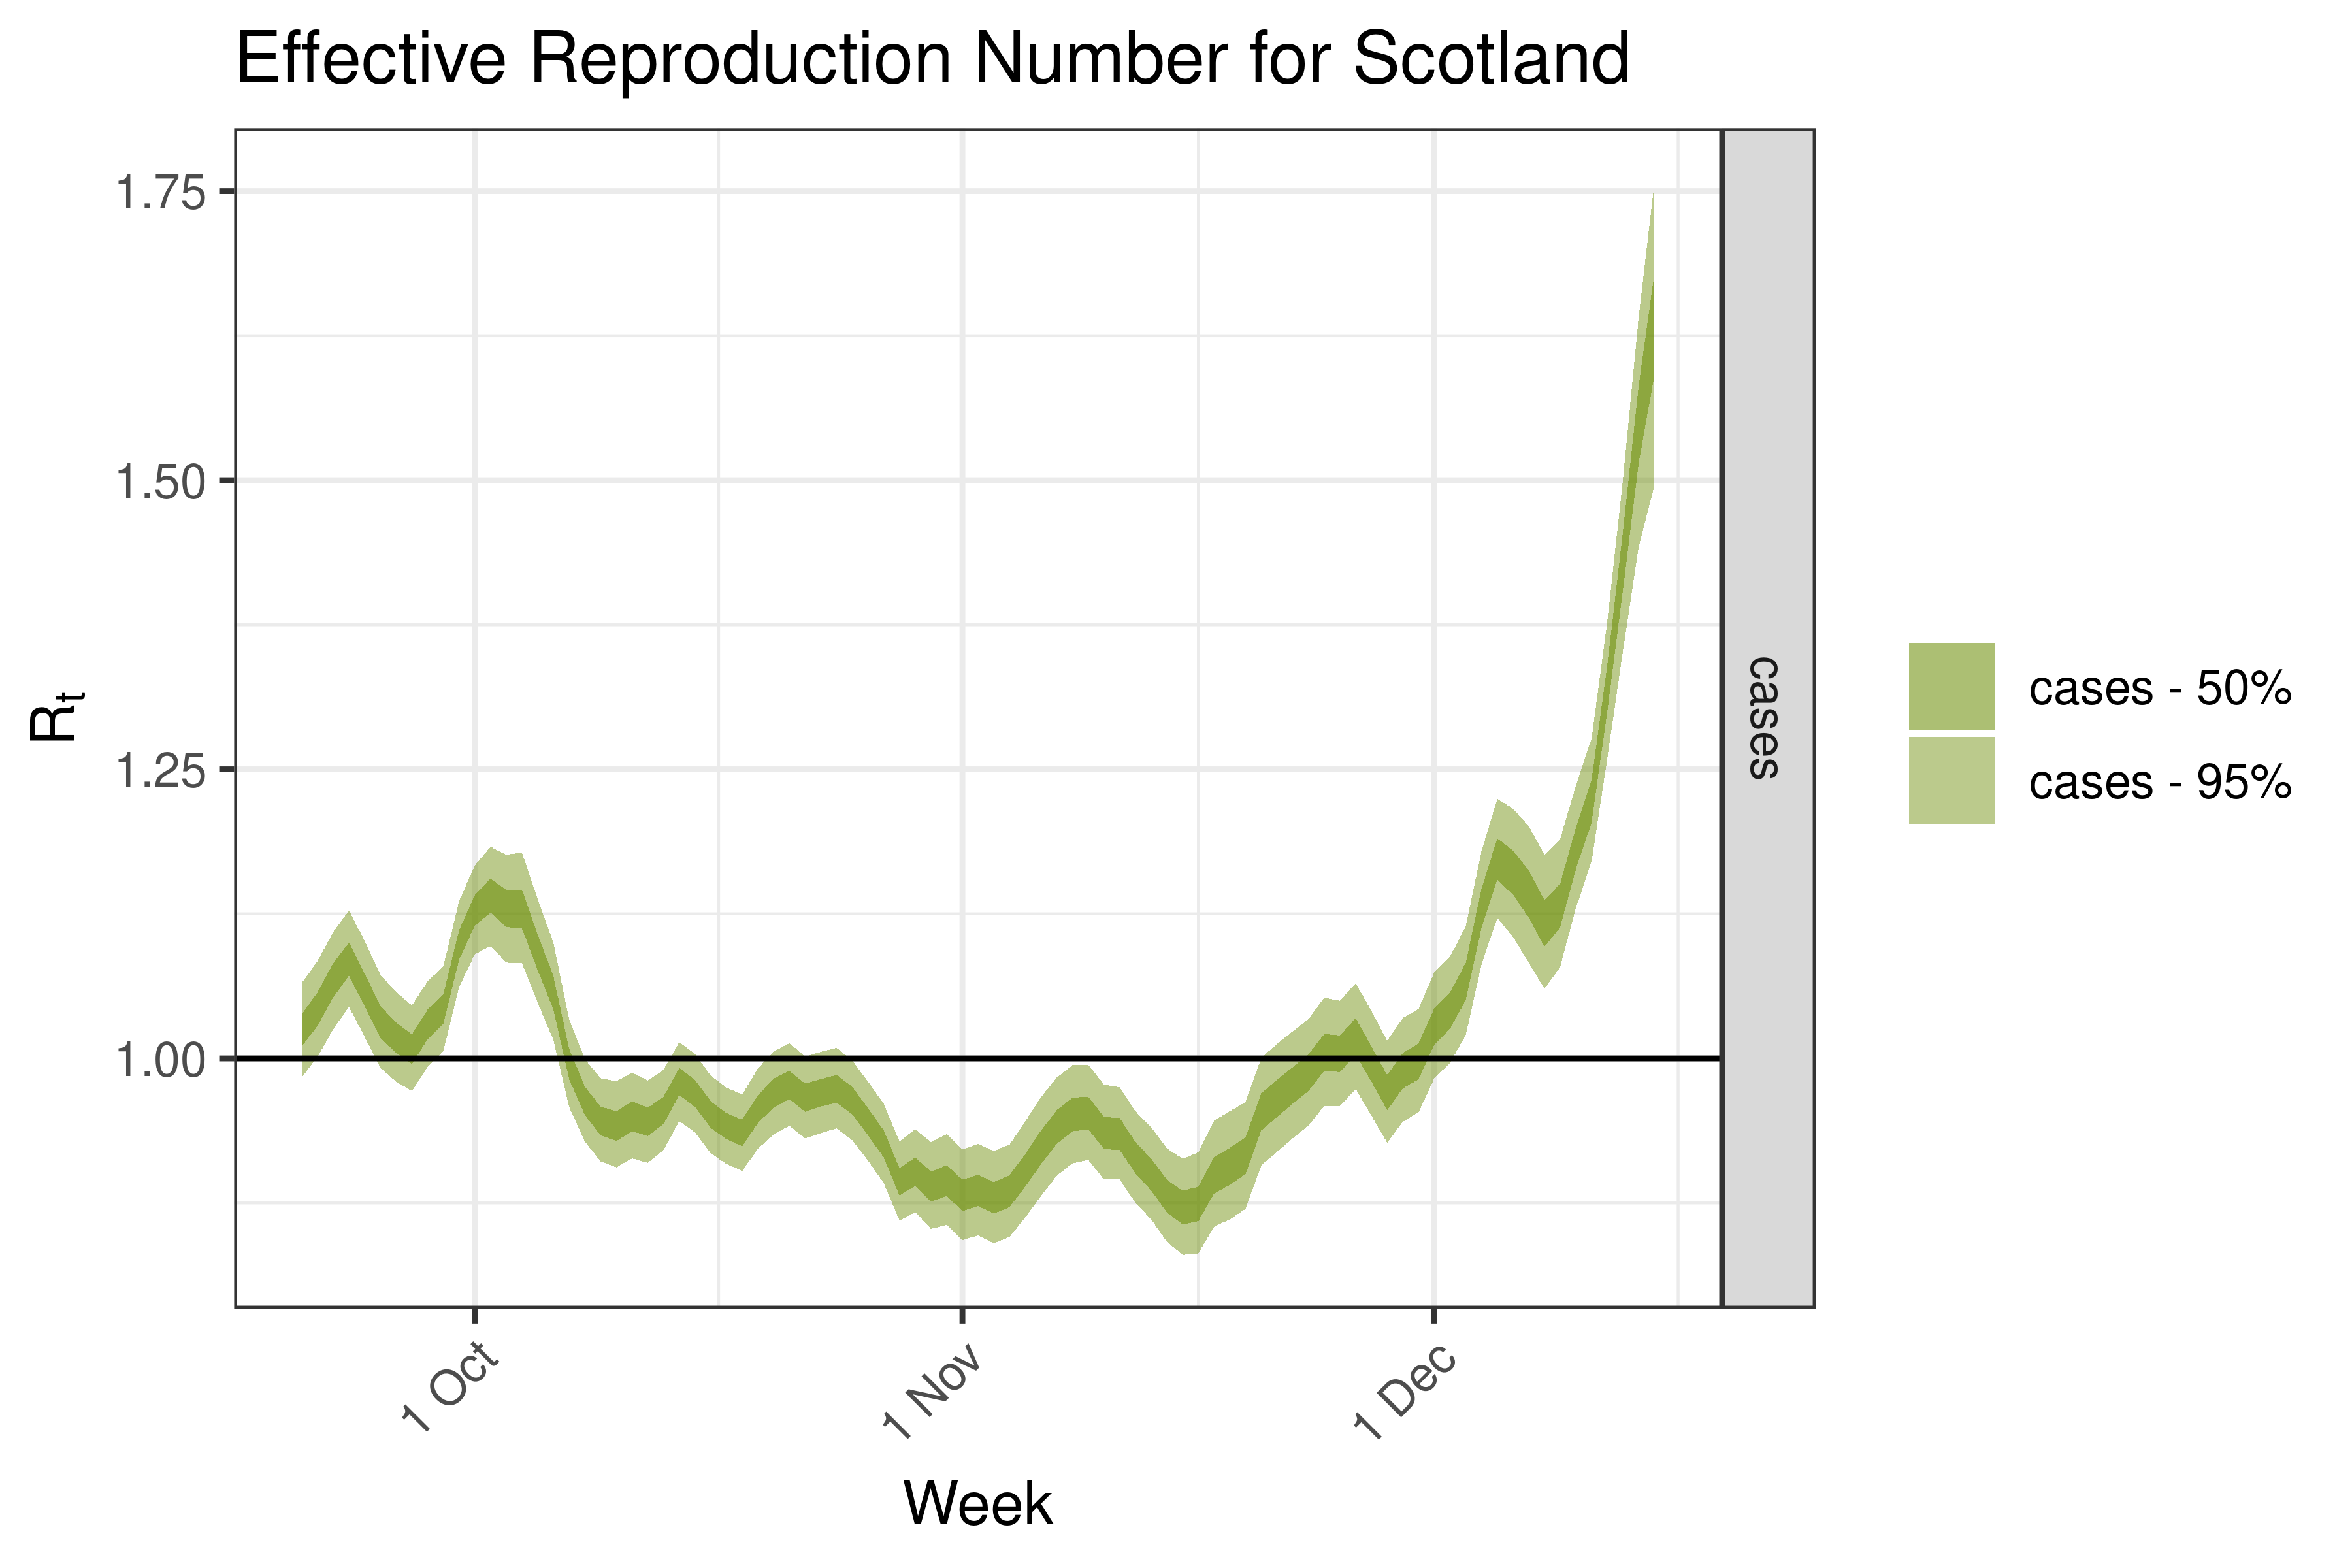
| Scotland | cases | 623 | 2022-12-18 | 1.63 [1.50 - 1.76] |
| Scotland | admissions | 53 | 2022-09-11 | 0.89 [0.81 - 0.99] |
| Scotland | deaths | 2 | 2022-06-01 | 0.44 [0.25 - 0.69] |
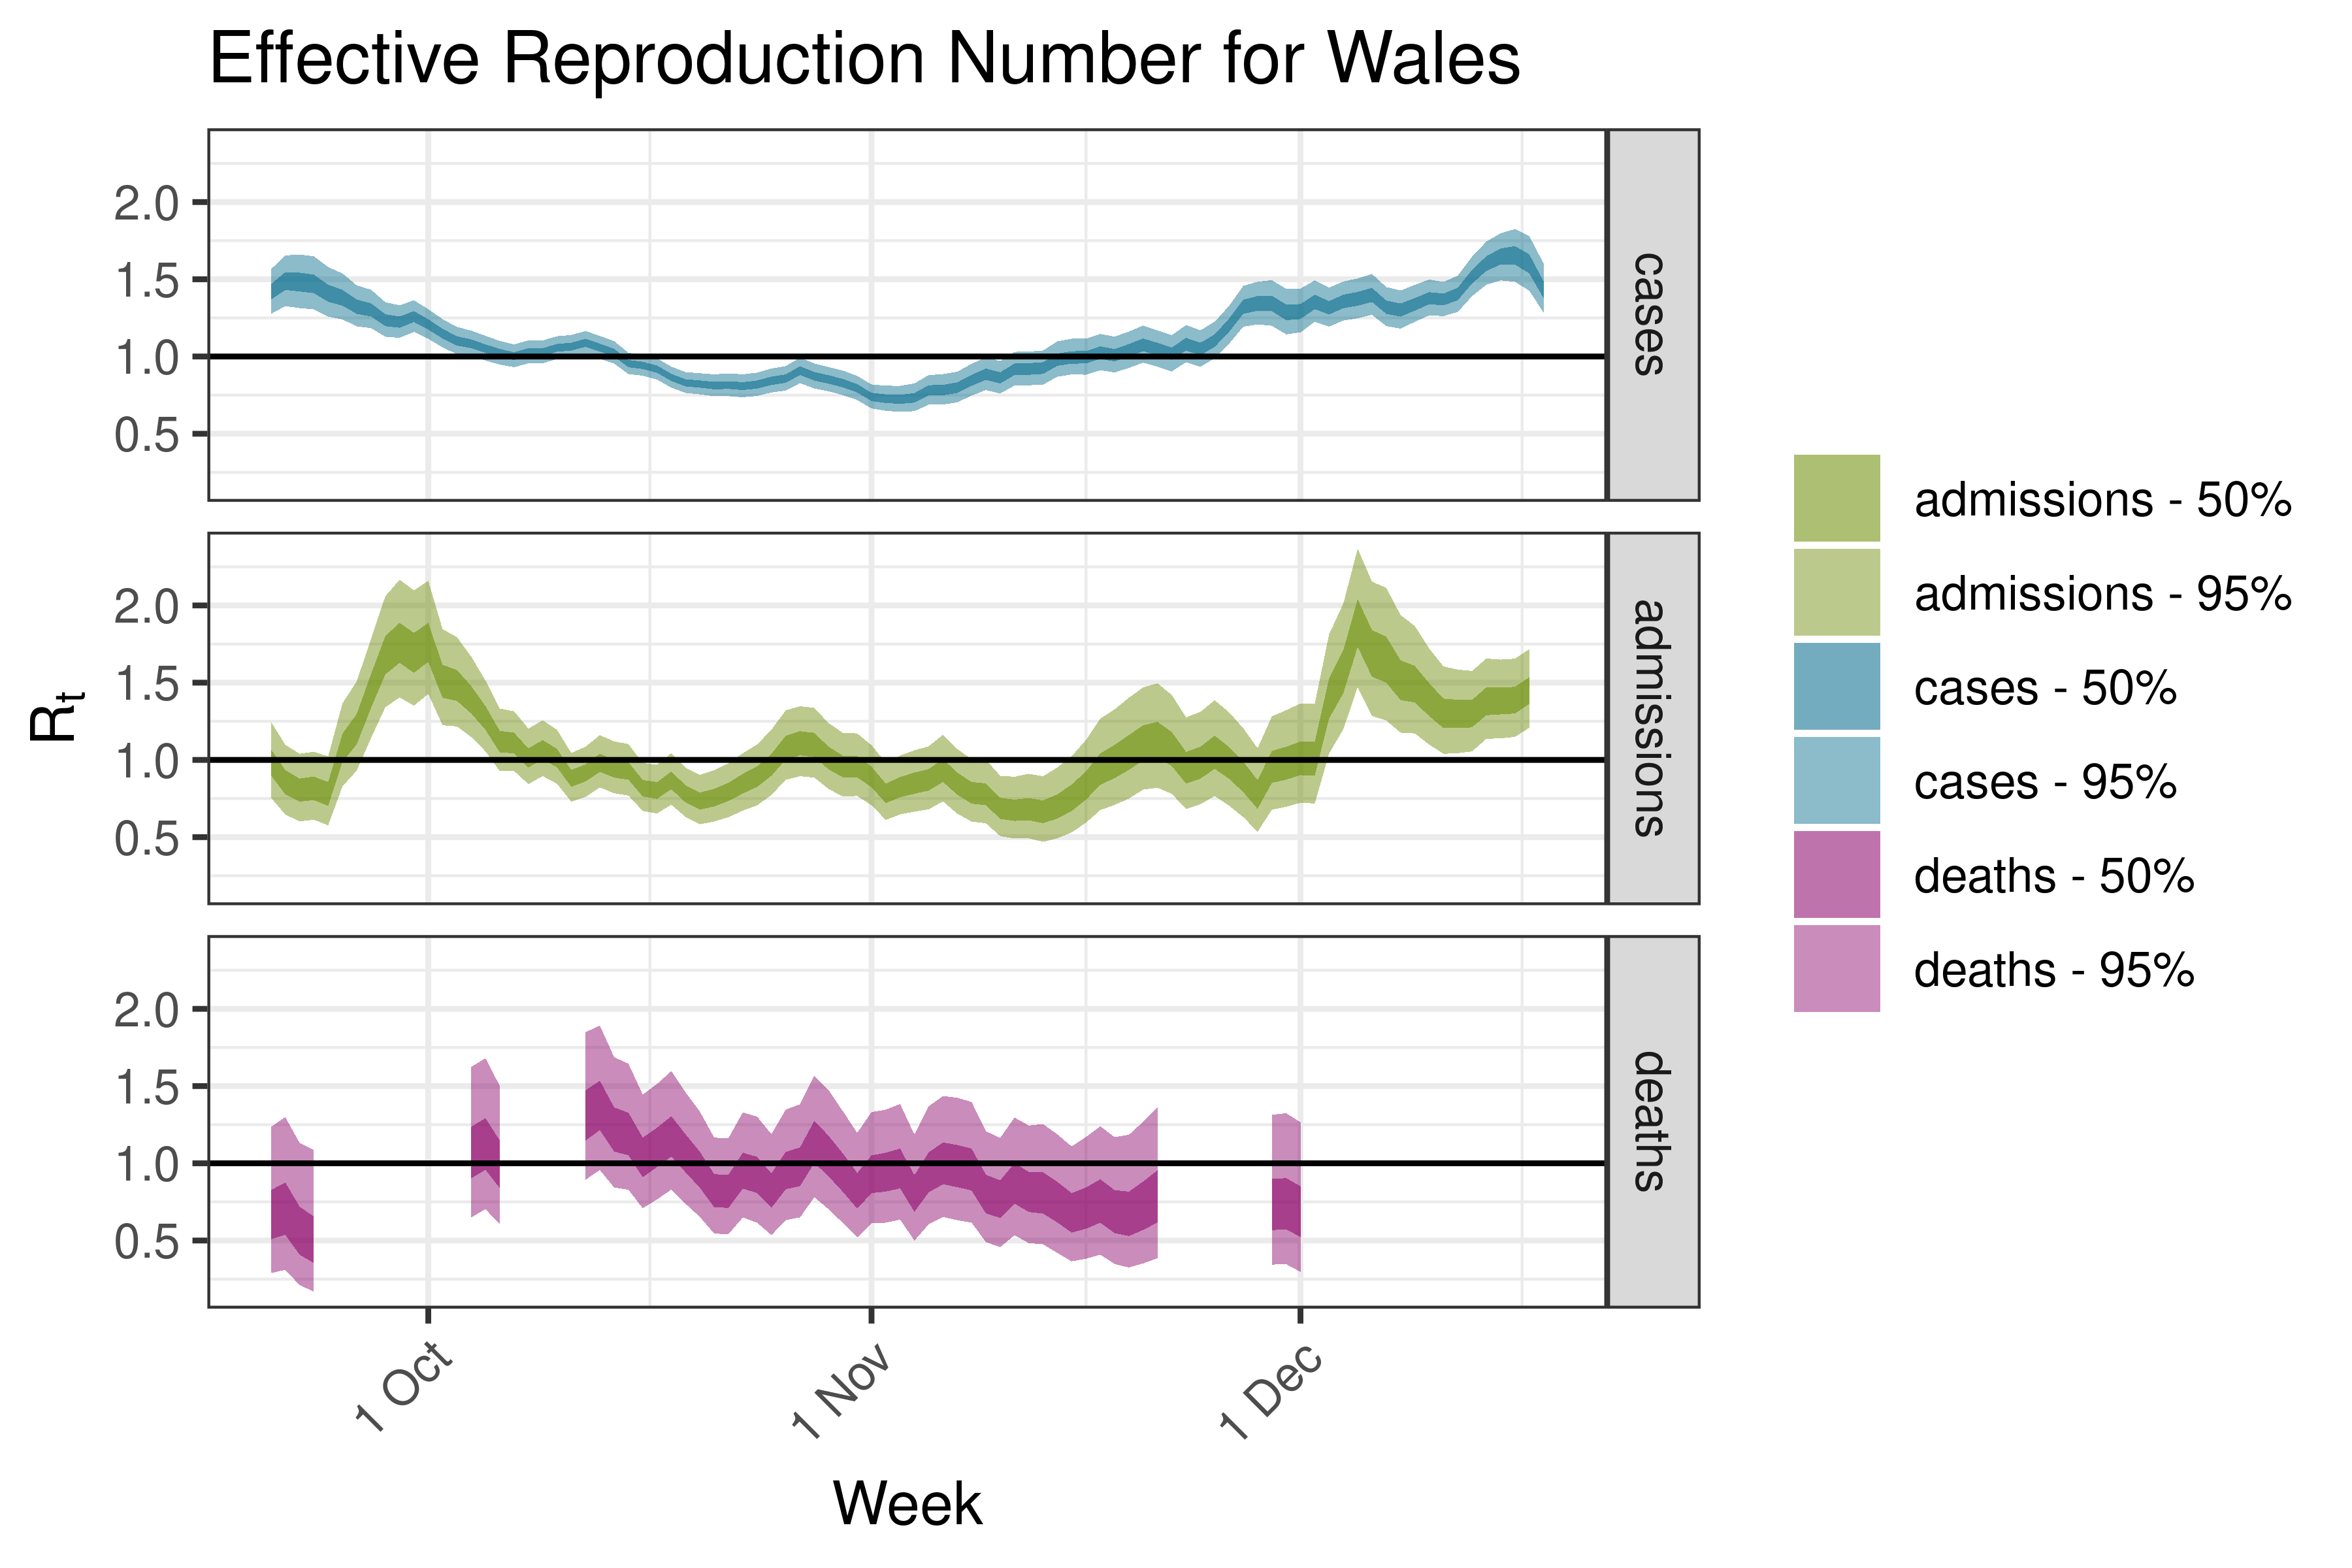
| Wales | cases | 229 | 2022-12-21 | 1.43 [1.28 - 1.60] |
| Wales | admissions | 20 | 2022-12-20 | 1.45 [1.21 - 1.72] |
| Wales | deaths | 3 | 2022-12-21 | 1.31 [0.85 - 1.89] |
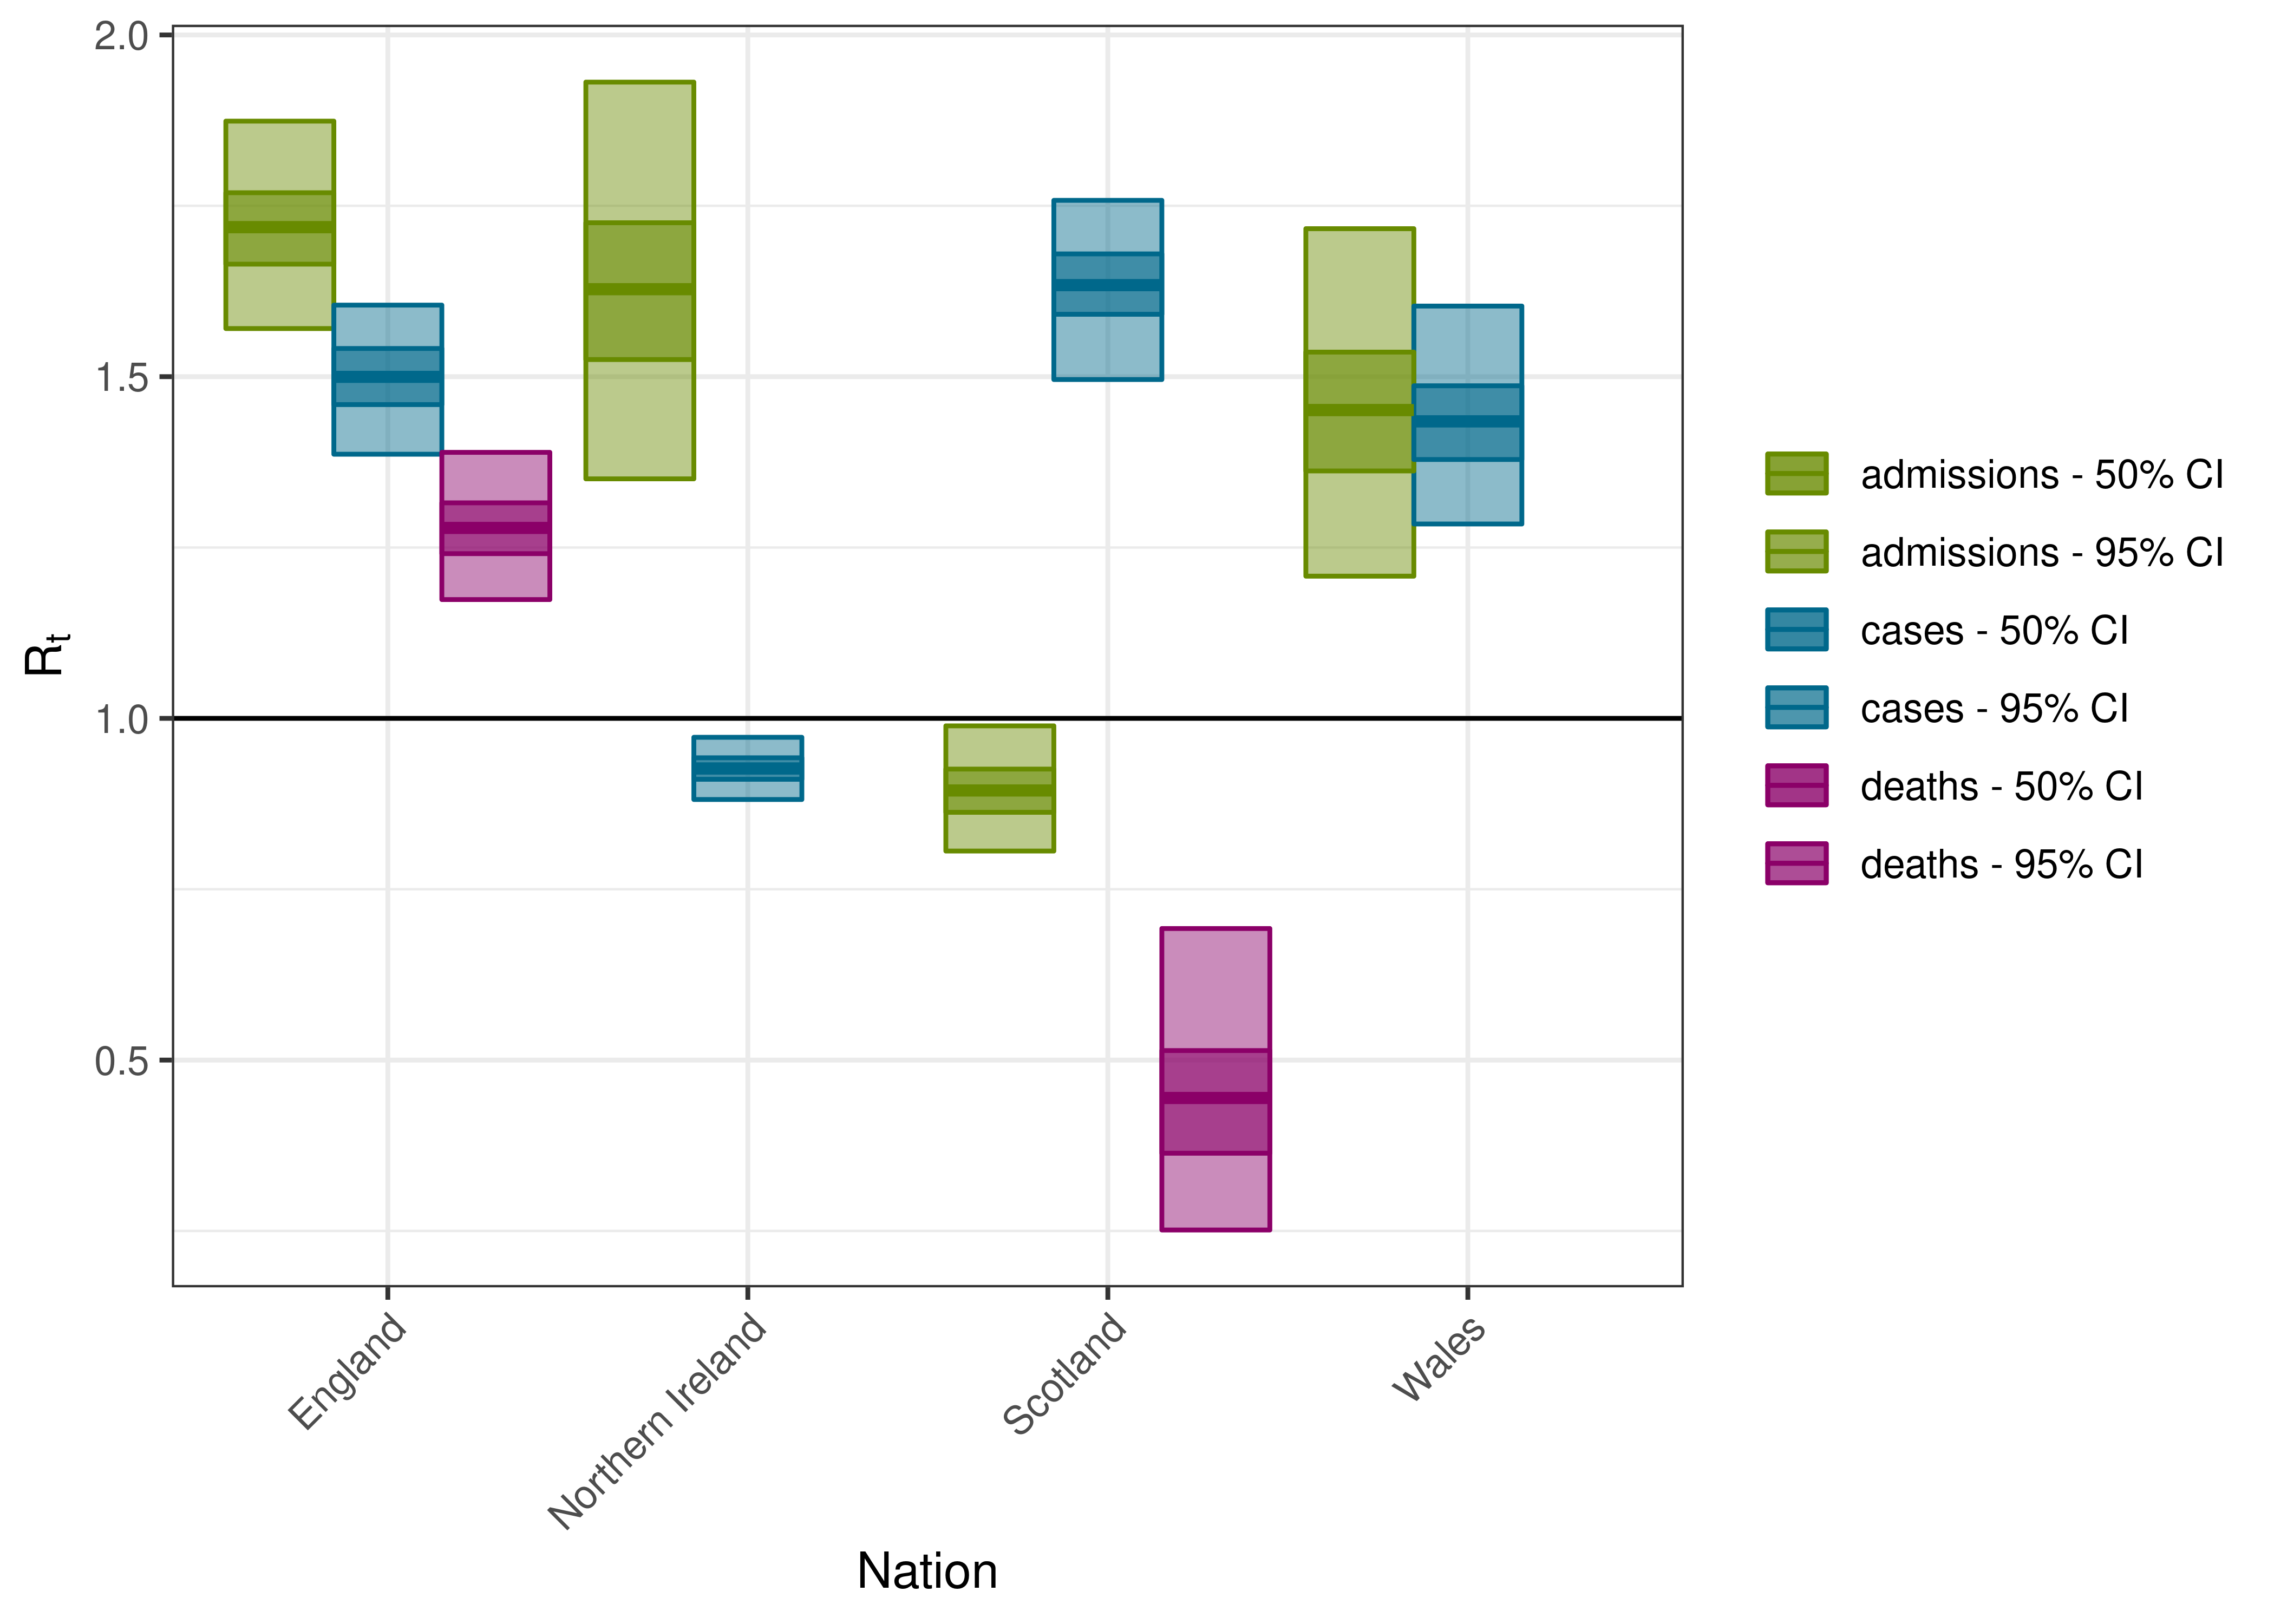
Estimated Effective Reproduction Number by Nation
5.5 Maps of Effective Reproduction Number
Below we plot the current effective reproduction number on maps with boundaries provided by [4]. Data where the confidence interval for the reproduction number is wider than 1 are excluded (shown as missing on the map).
5.5.1 Cases
5.5.2 Admissions
5.5.3 Deaths
5.6 Graphs over Time
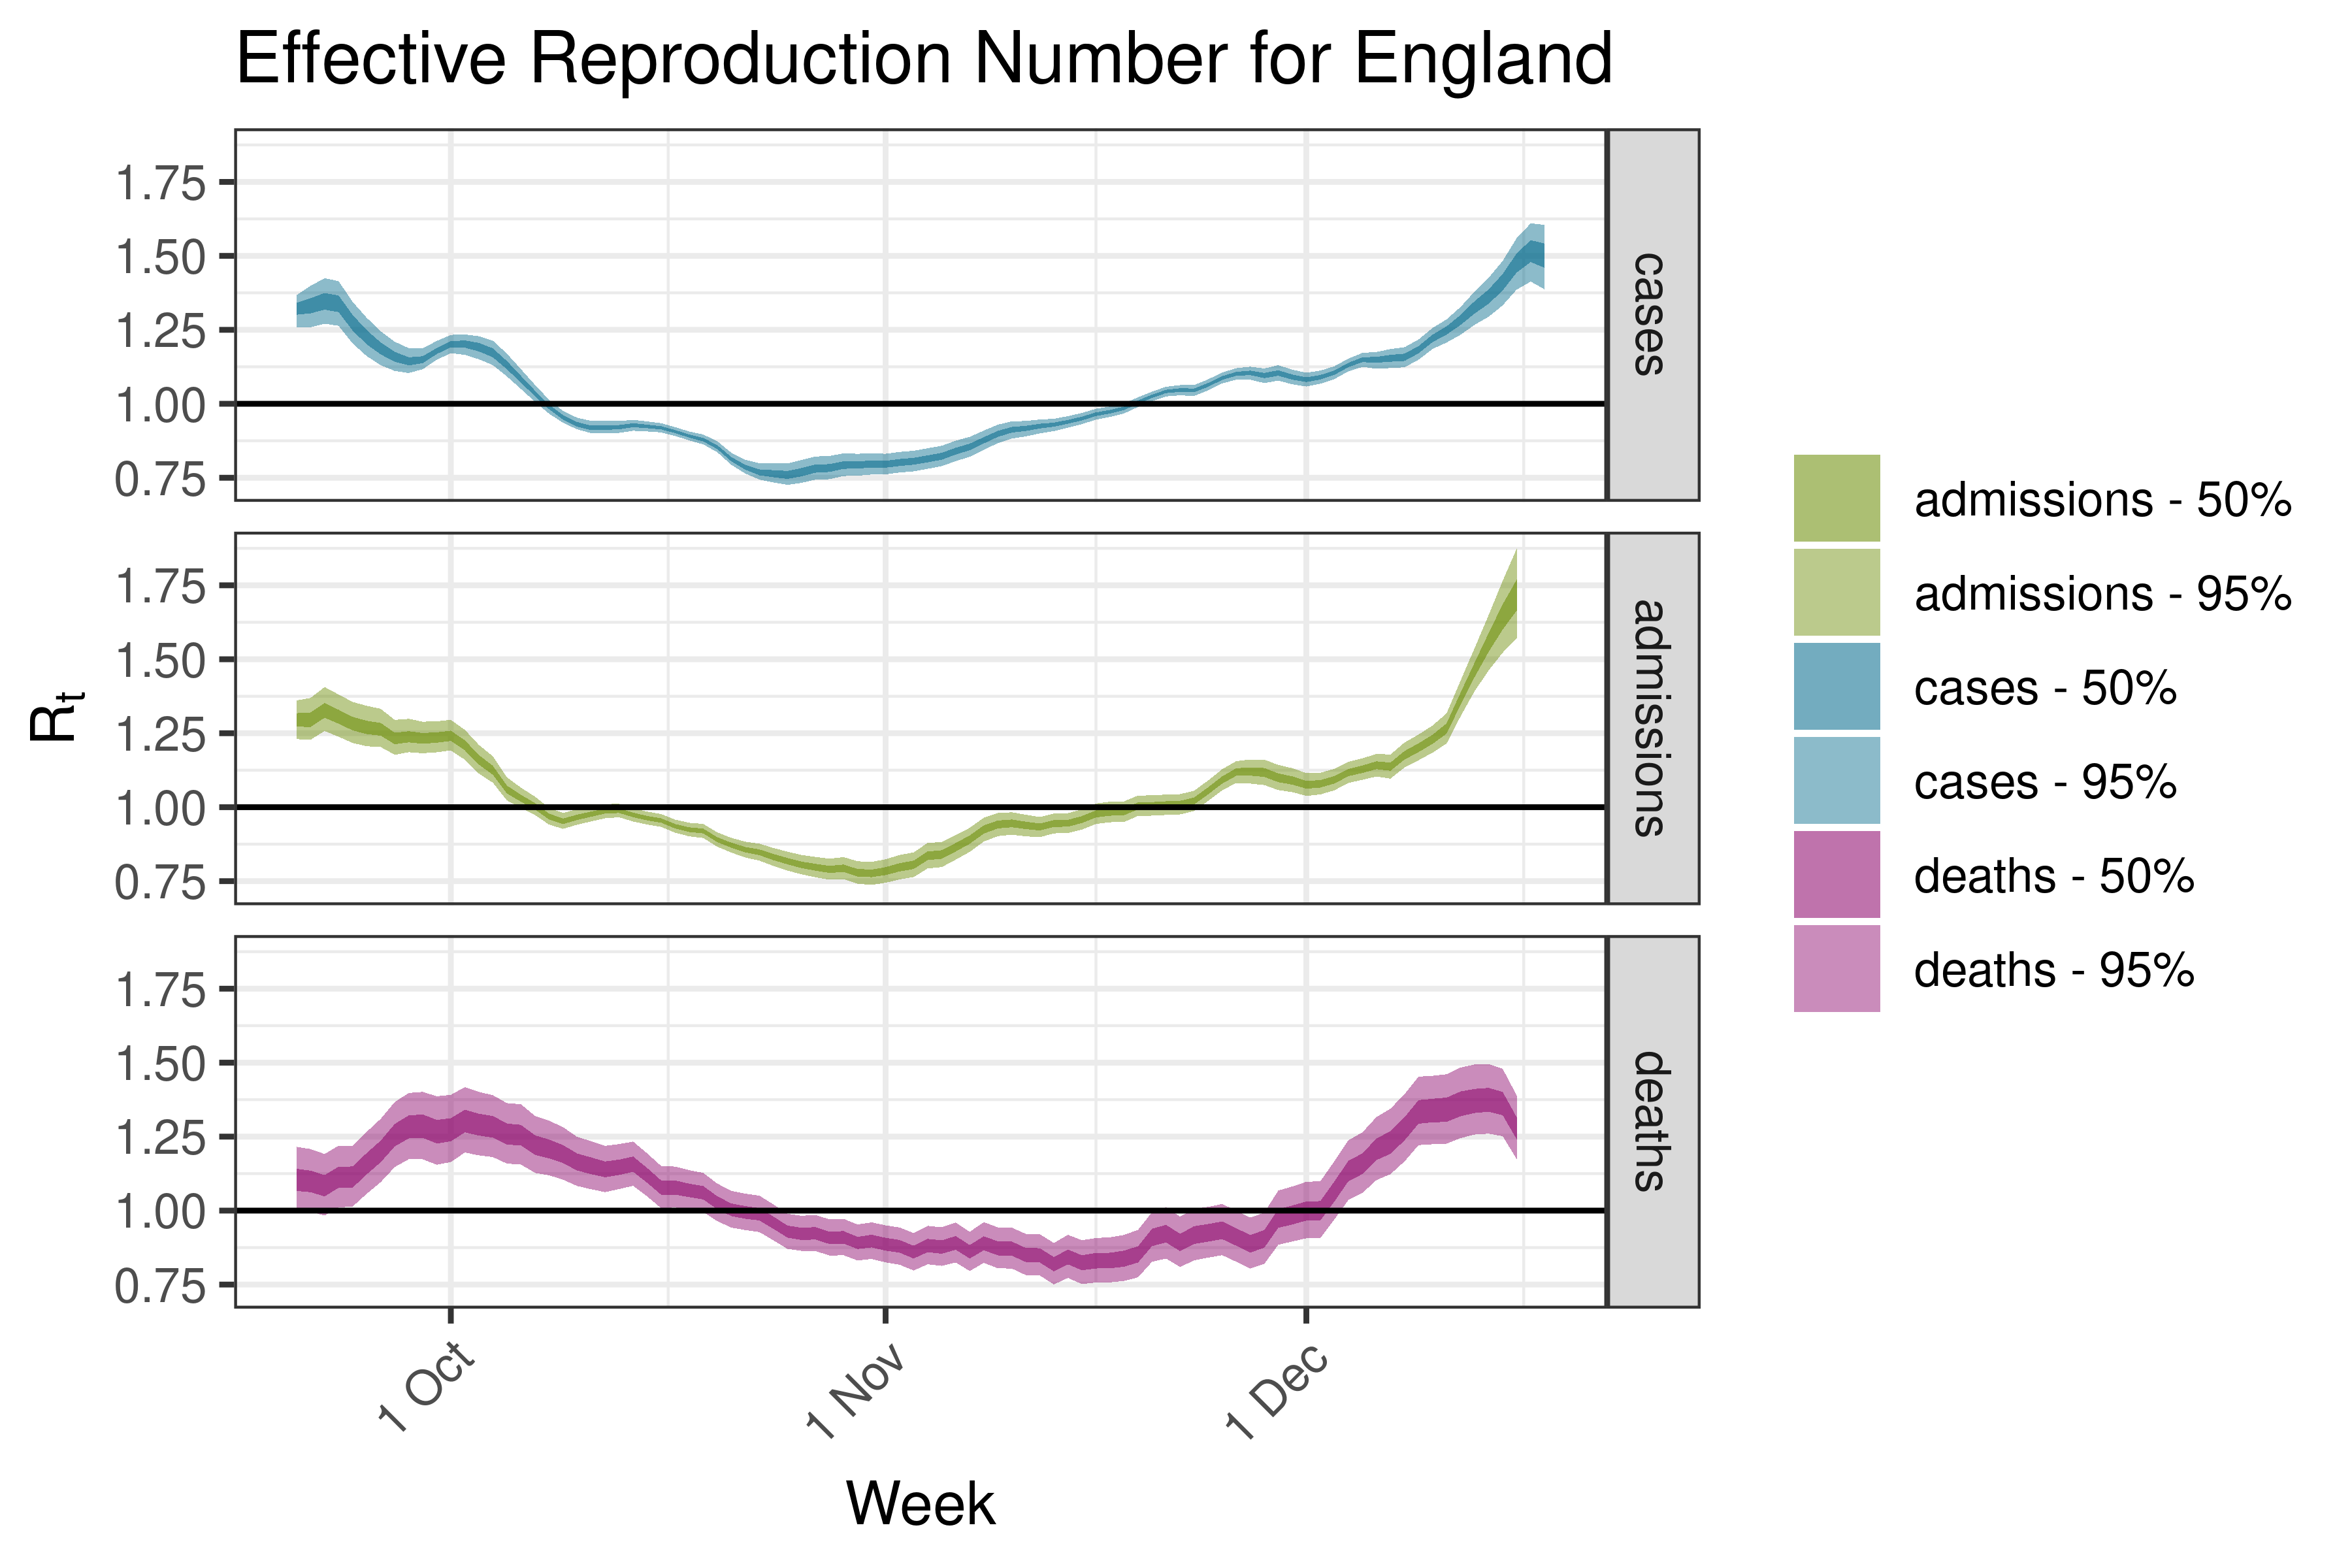
Below we plot results for each nation.
5.6.1 England
5.6.2 Northern Ireland

5.6.3 Scotland

5.6.4 Wales
6 Results by Region
6.1 Cases
Below we daily case count is plotted on a log scale by region:
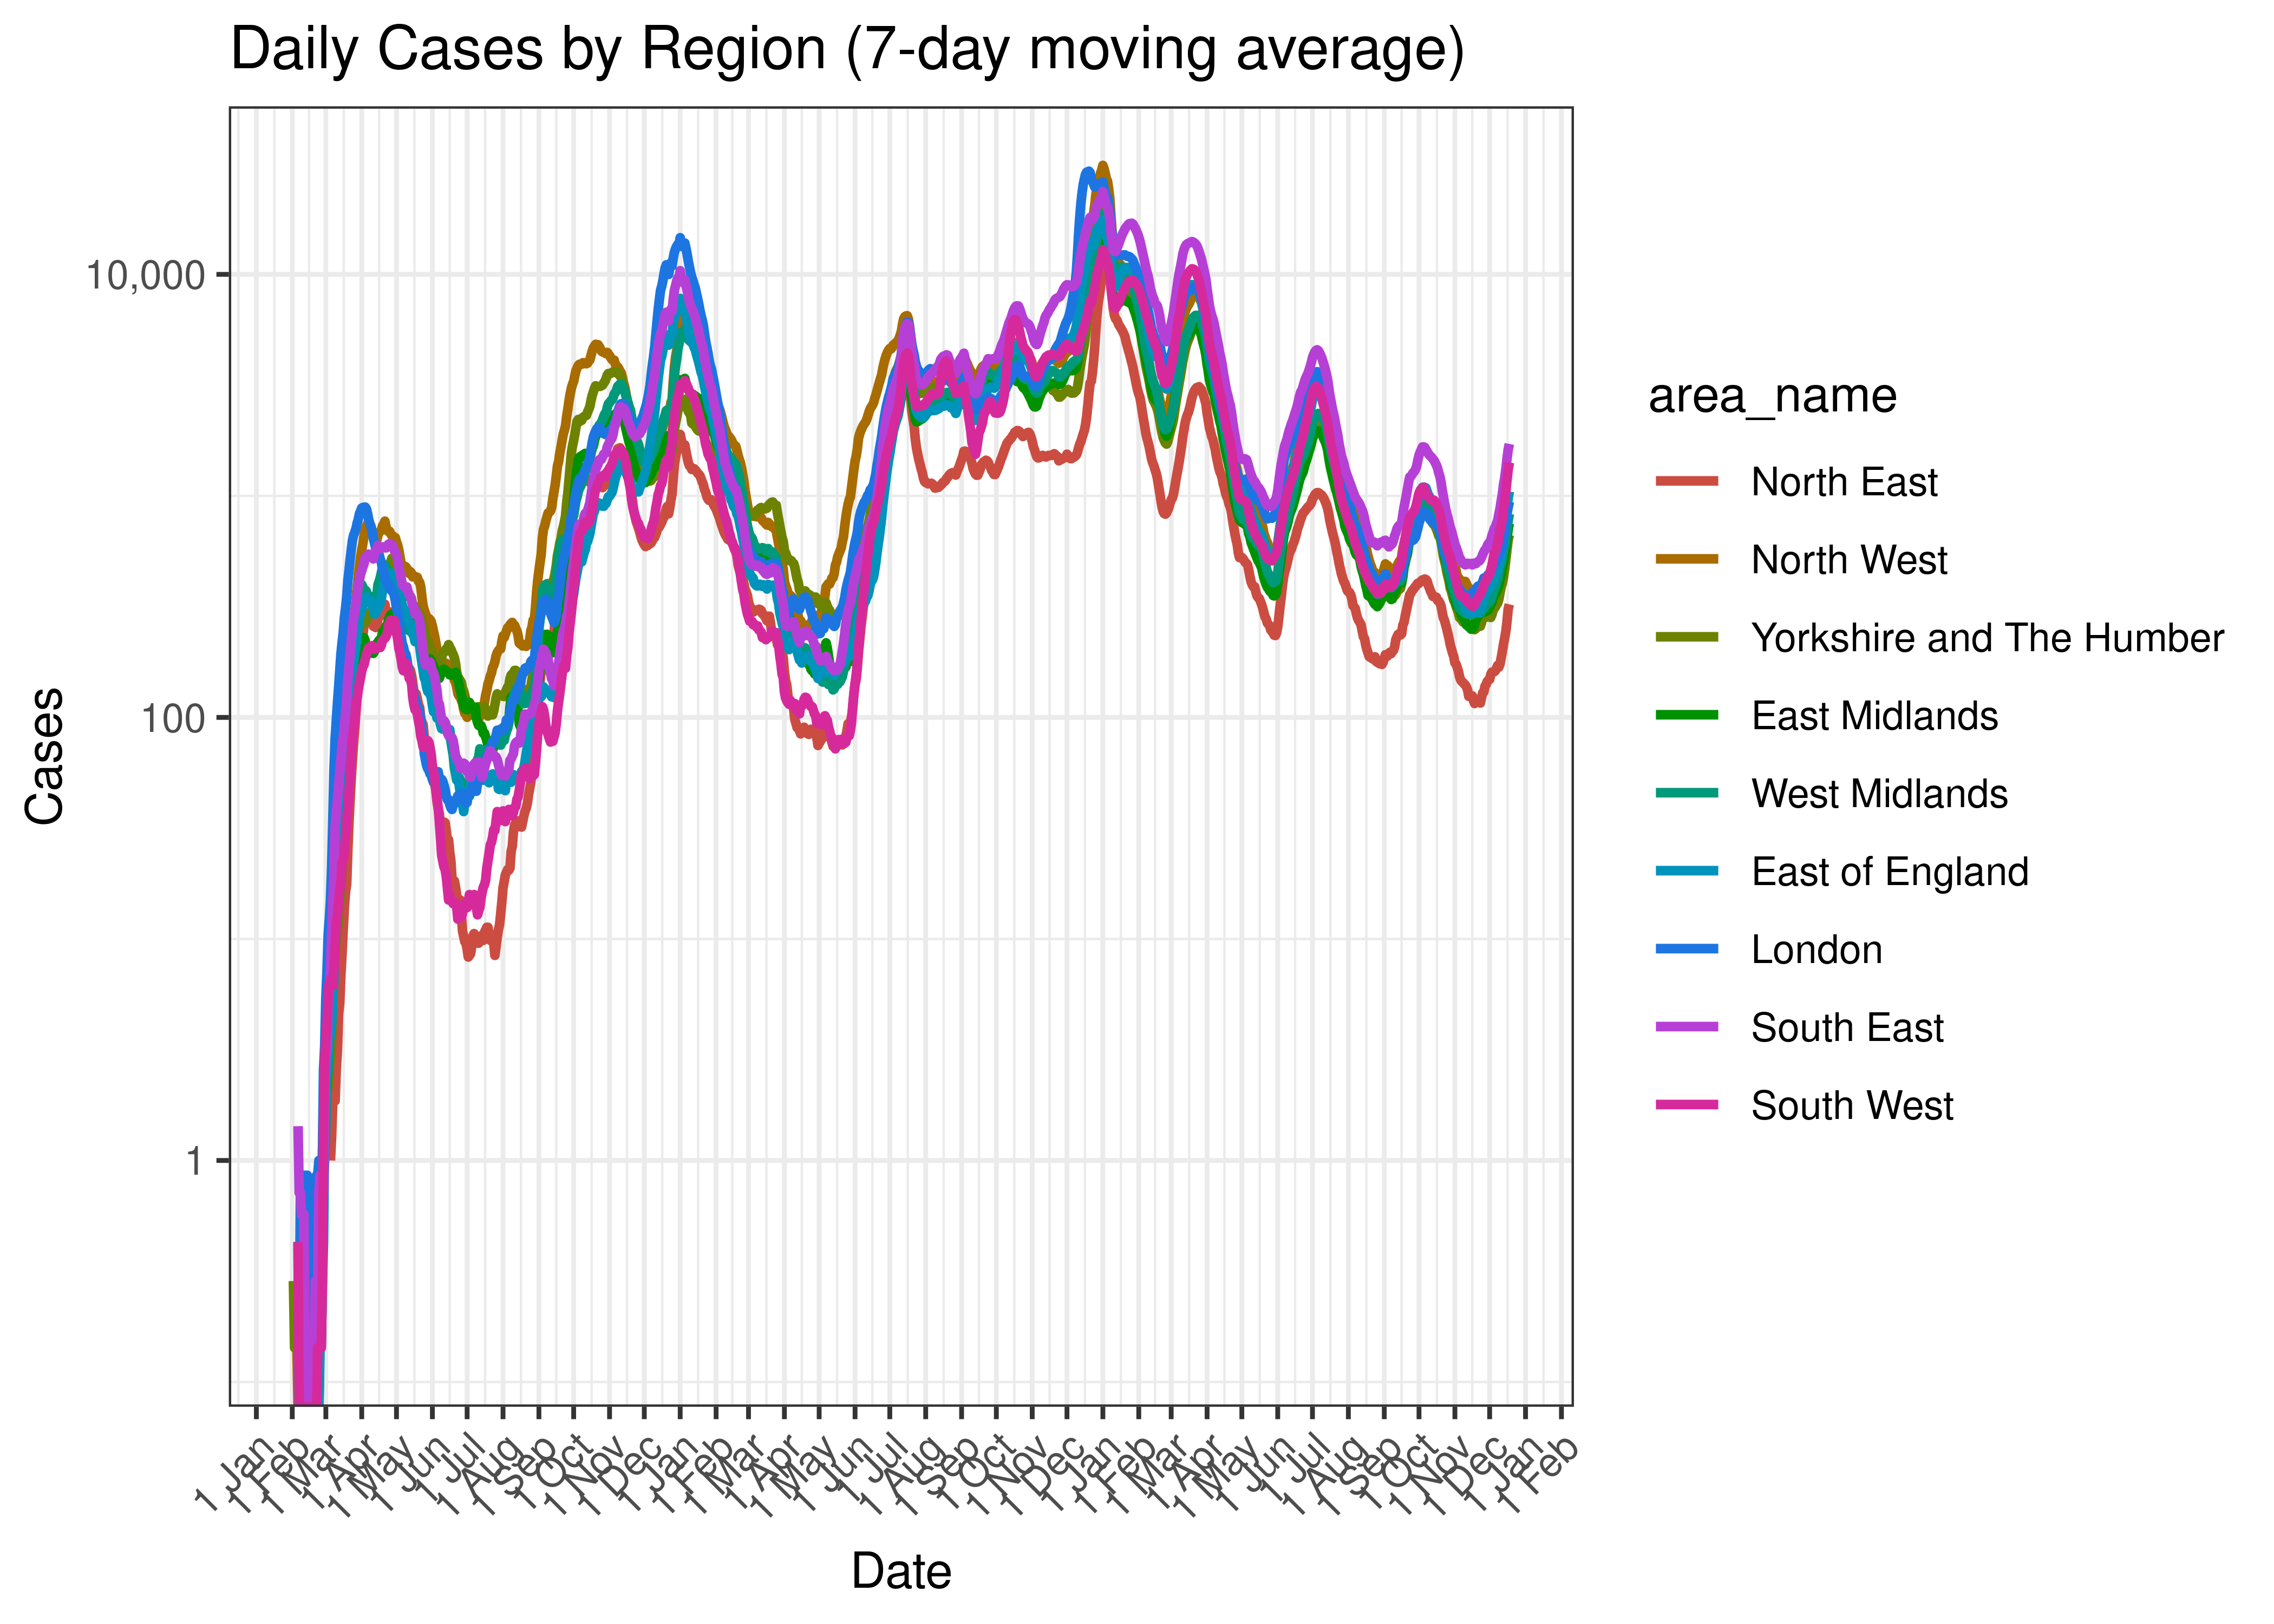
Daily Cases by Region (7-day moving average)
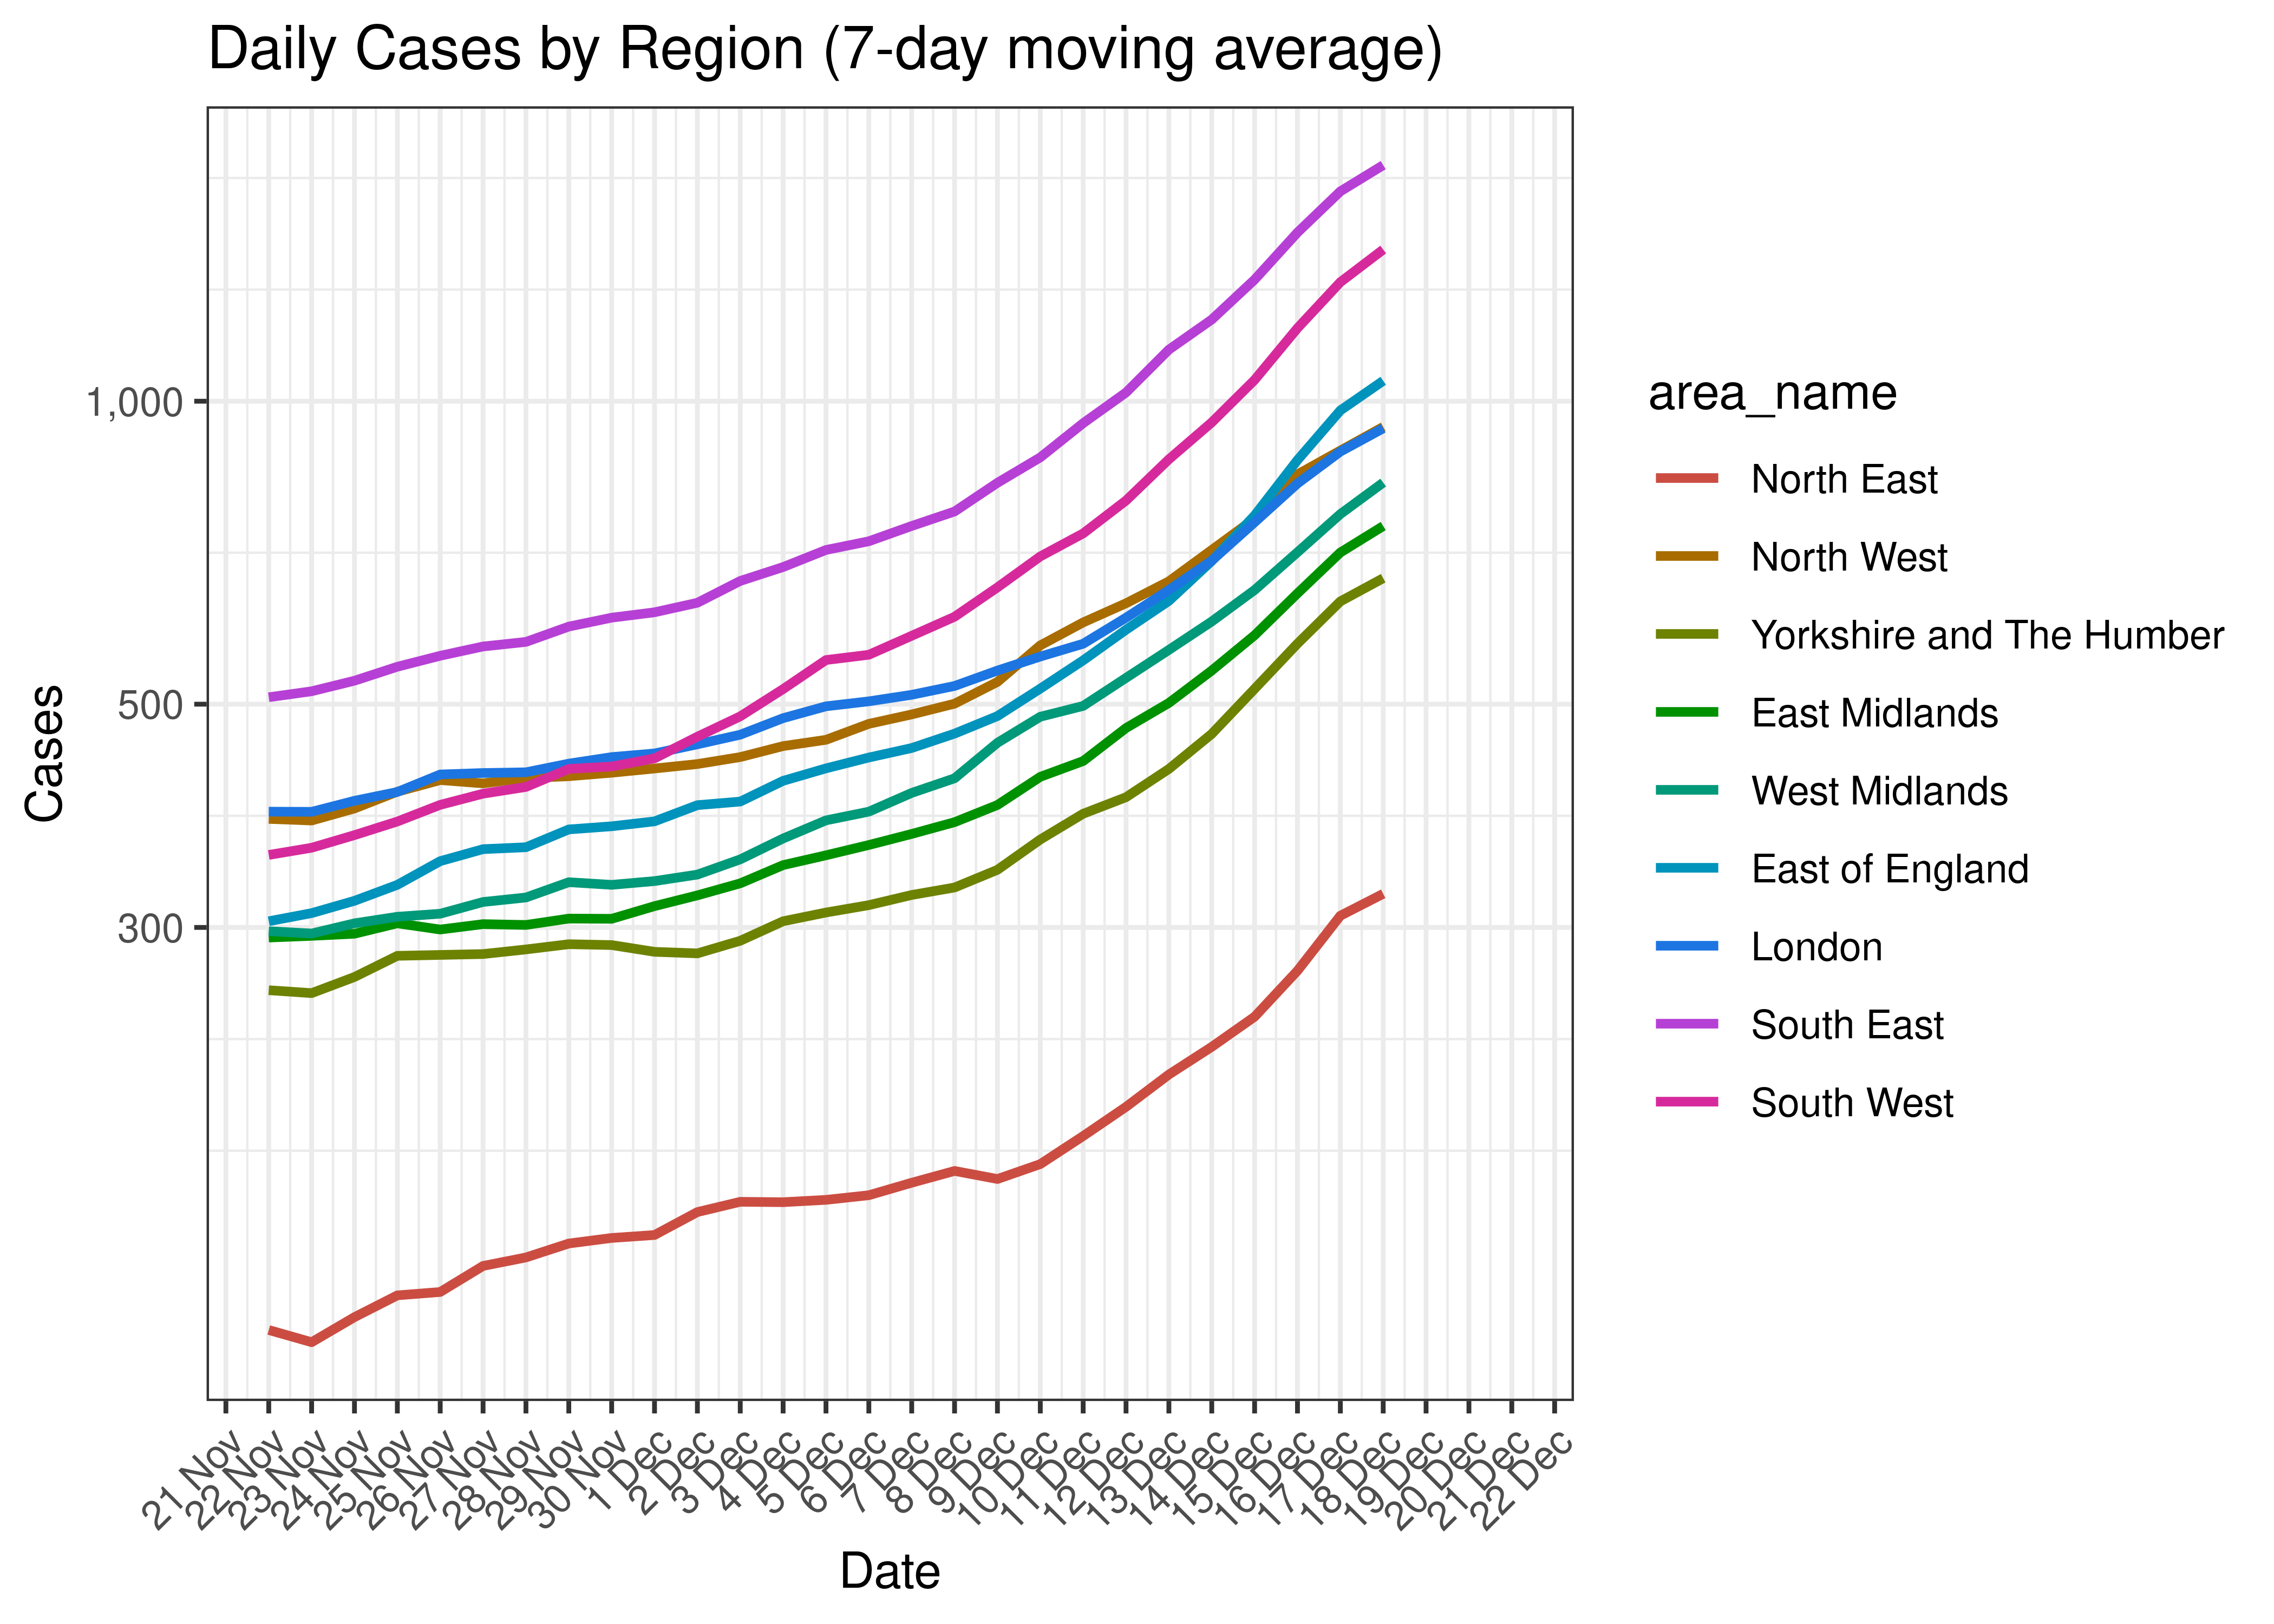
Daily Cases by Region for Last 30-days (7-day moving average)
6.2 Deaths
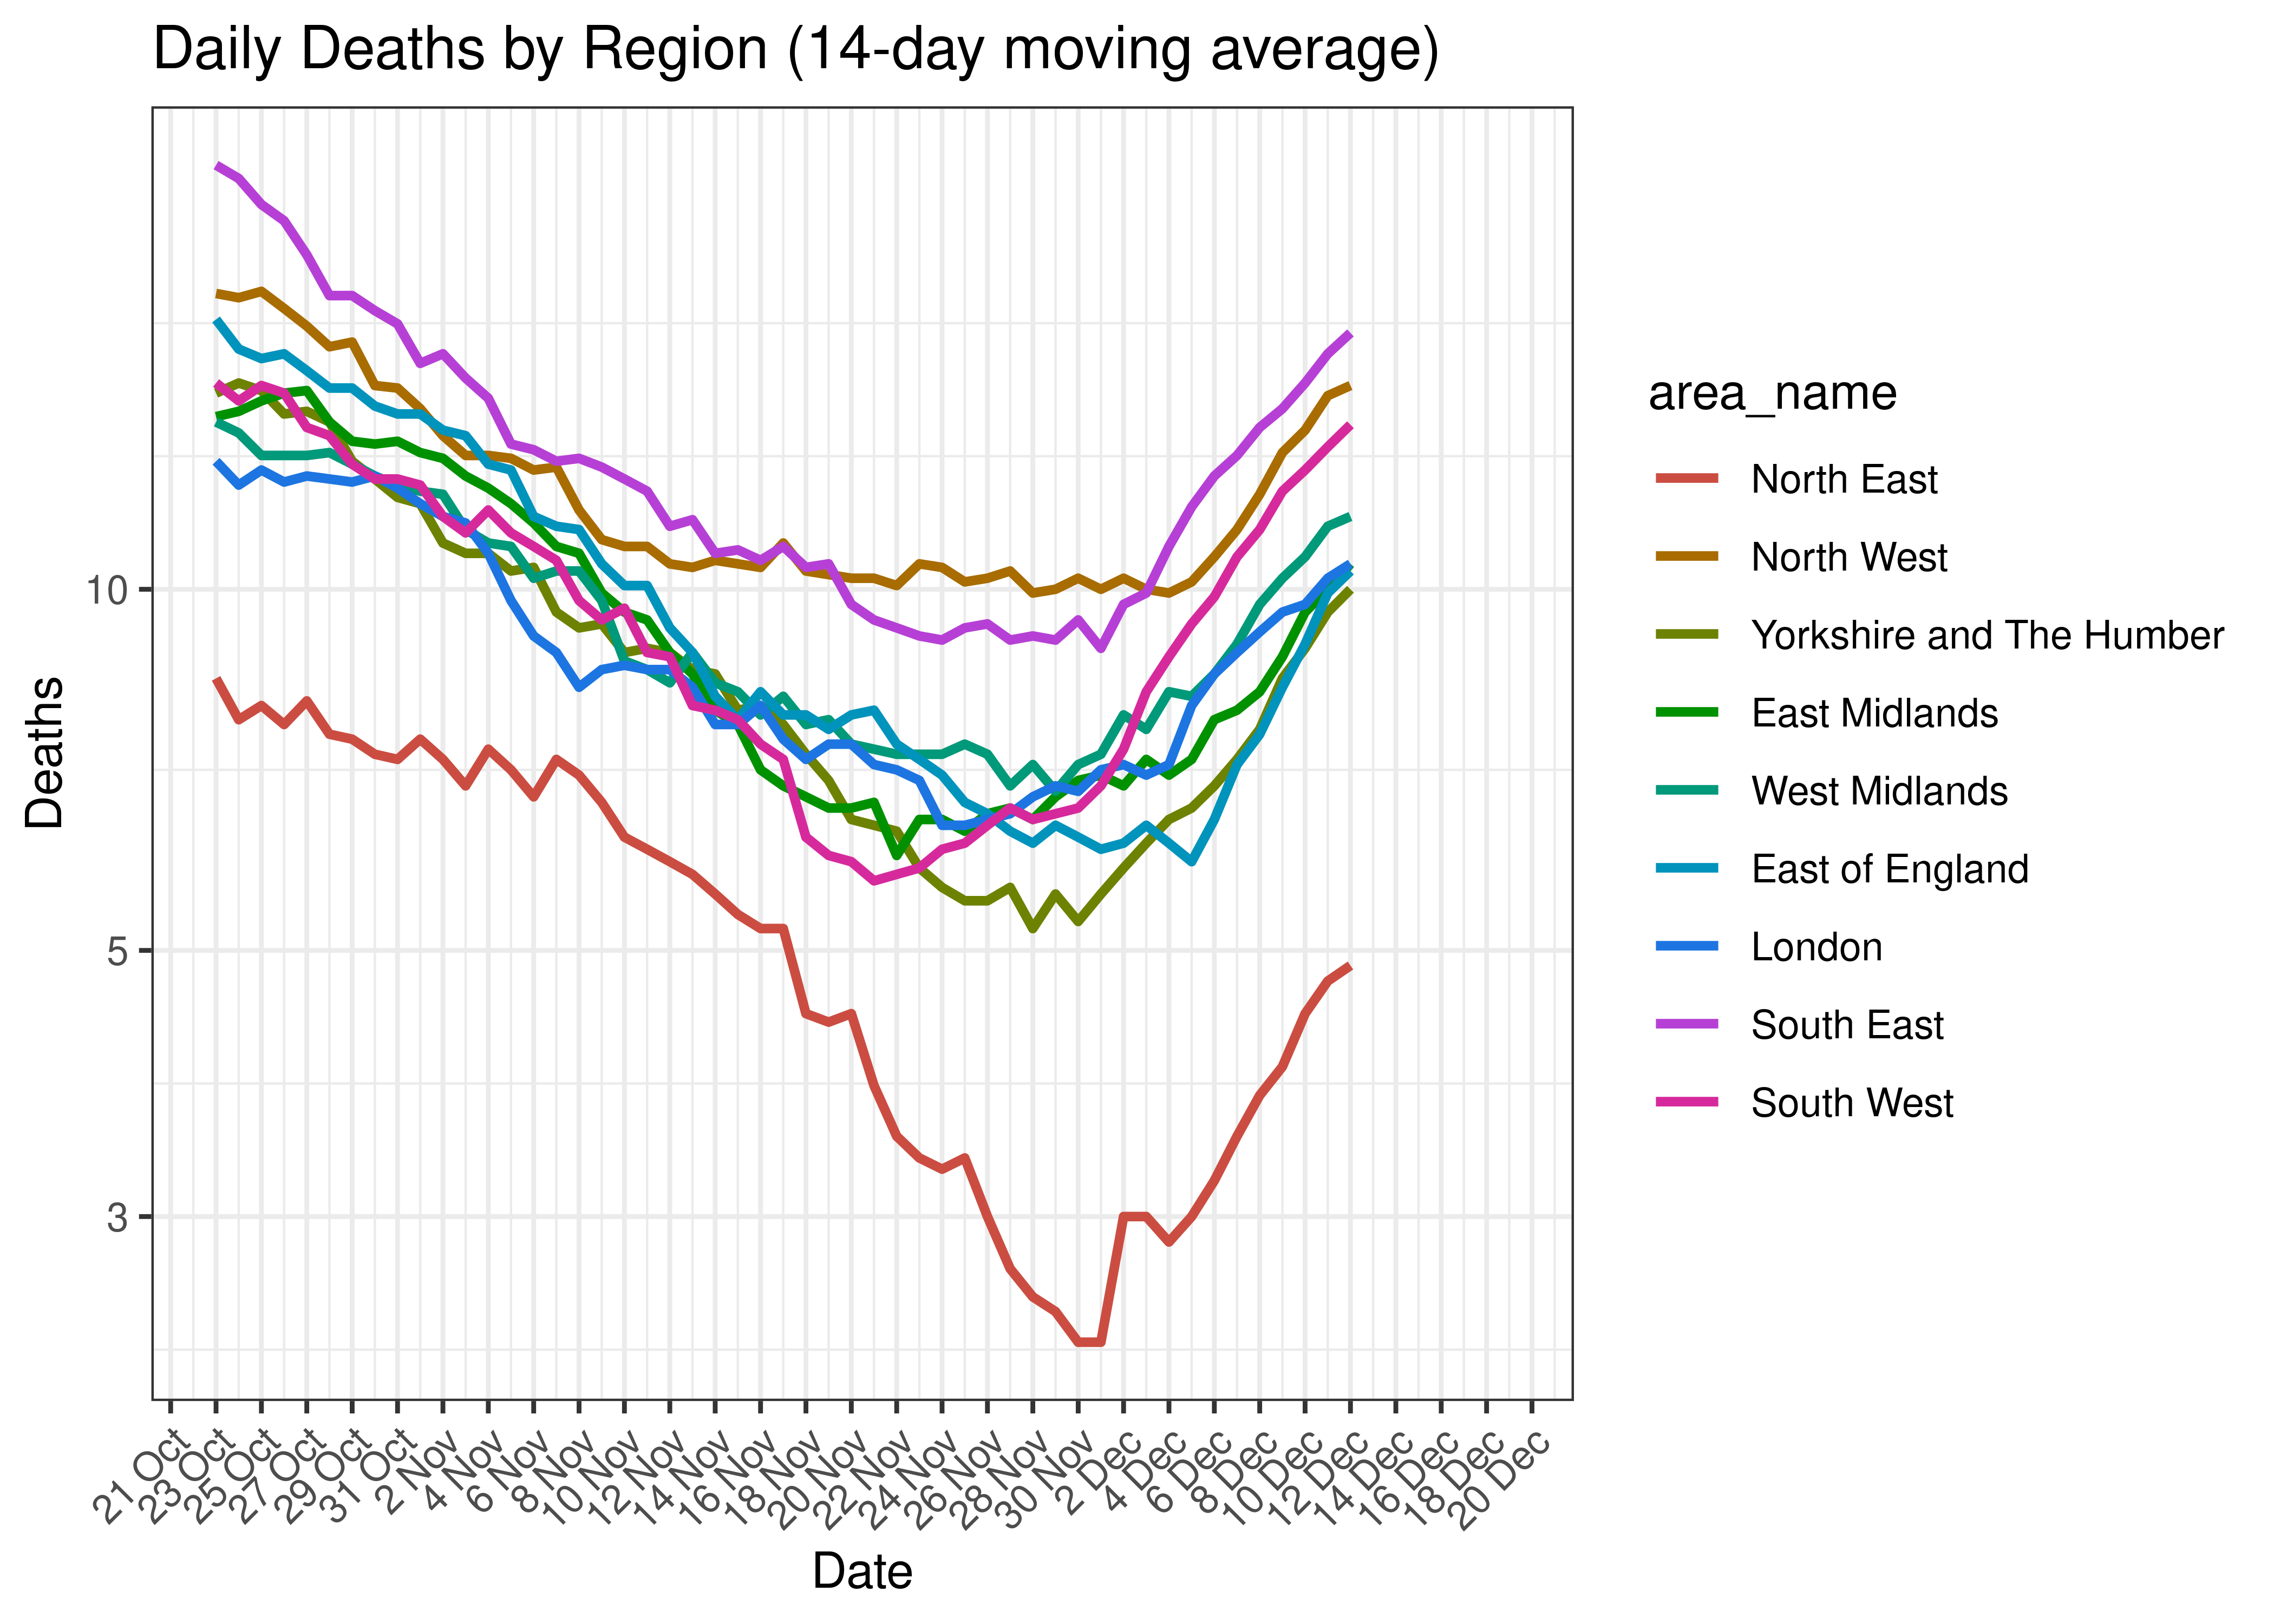
Below a 14-day moving average of daily deaths by region is plotted on a log scale:
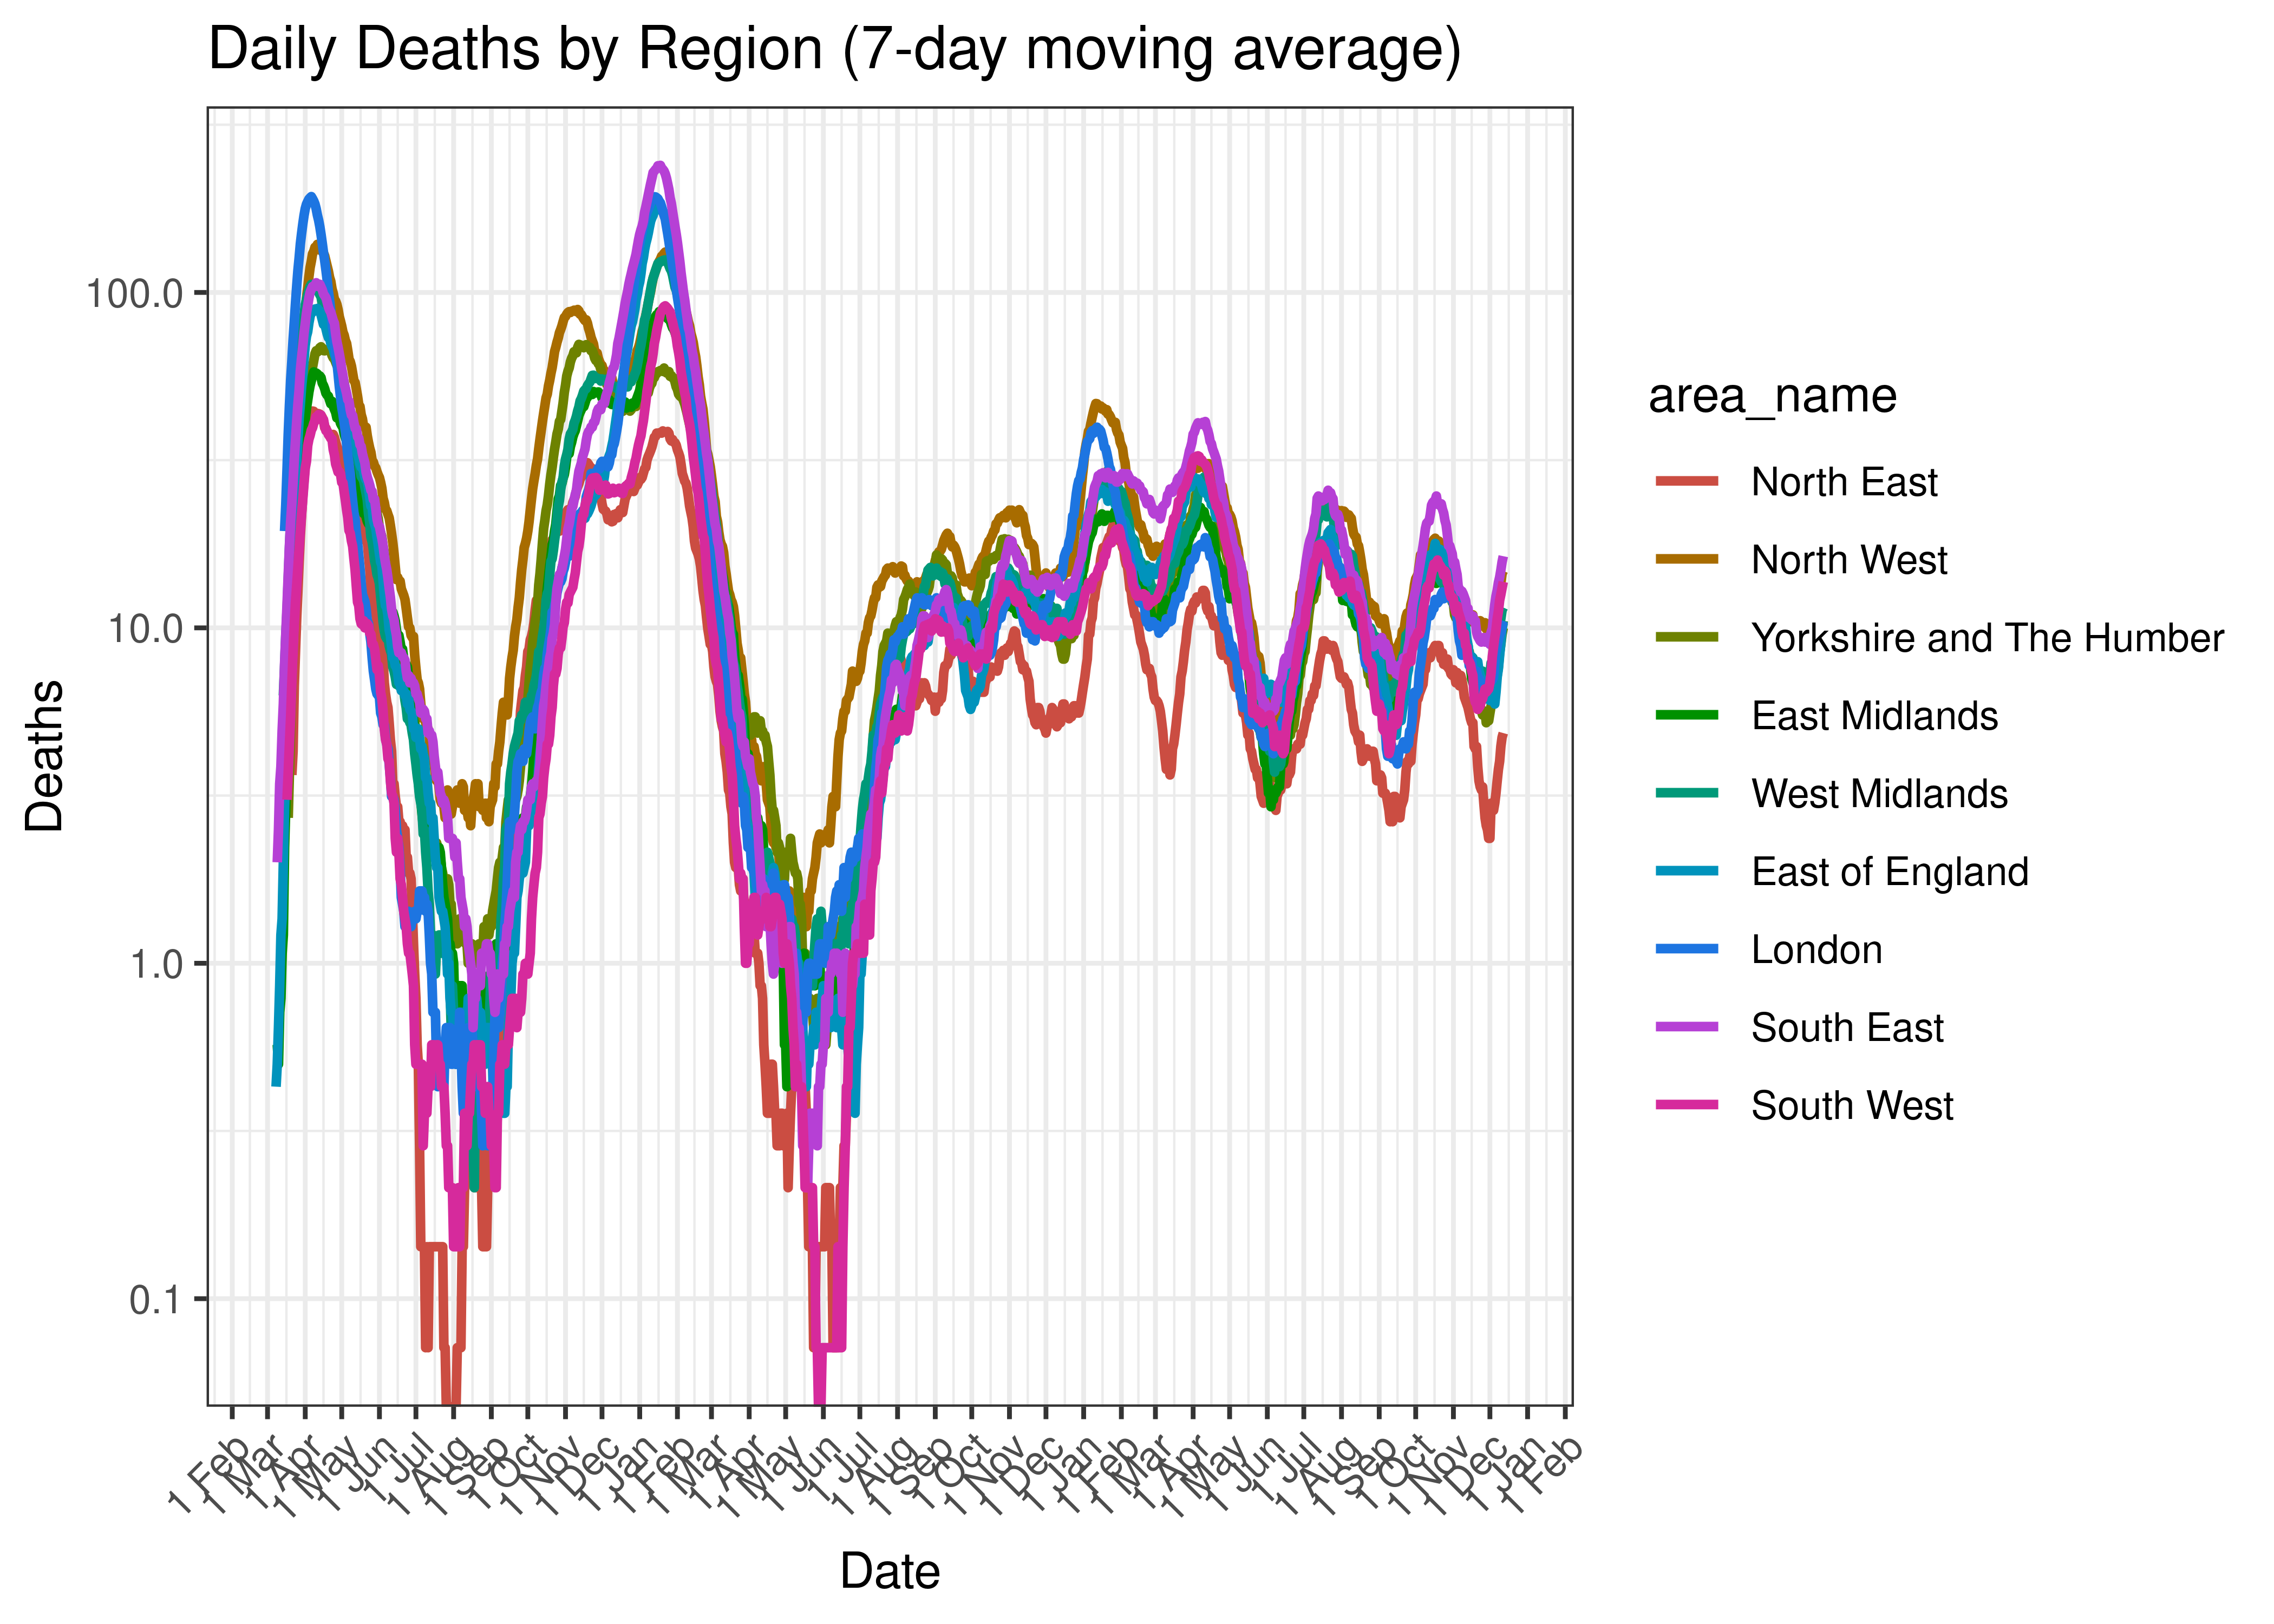
Daily Deaths by Region (14-day moving average)
Daily Deaths by Region for Last 60-days (14-day moving average)
6.3 Current Reproduction Number Estimates by Region
Below current (last weekly) reproduction number estimates are tabulated by region.
| Region | Estimate Type | Daily Count (Last Week) | Week Ending | Reproduction Number [95% Confidence Interval] |
|---|---|---|---|---|
| Northern Ireland | cases | 260 | 2022-05-19 | 0.93 [0.88 - 0.97] |
| Northern Ireland | deaths | 1 | 2022-05-19 | 0.99 [0.45 - 1.74] |
| Scotland | cases | 623 | 2022-12-18 | 1.63 [1.50 - 1.76] |
| Scotland | deaths | 2 | 2022-06-01 | 0.44 [0.25 - 0.69] |
| Wales | cases | 229 | 2022-12-21 | 1.43 [1.28 - 1.60] |
| Wales | deaths | 3 | 2022-12-21 | 1.31 [0.85 - 1.89] |
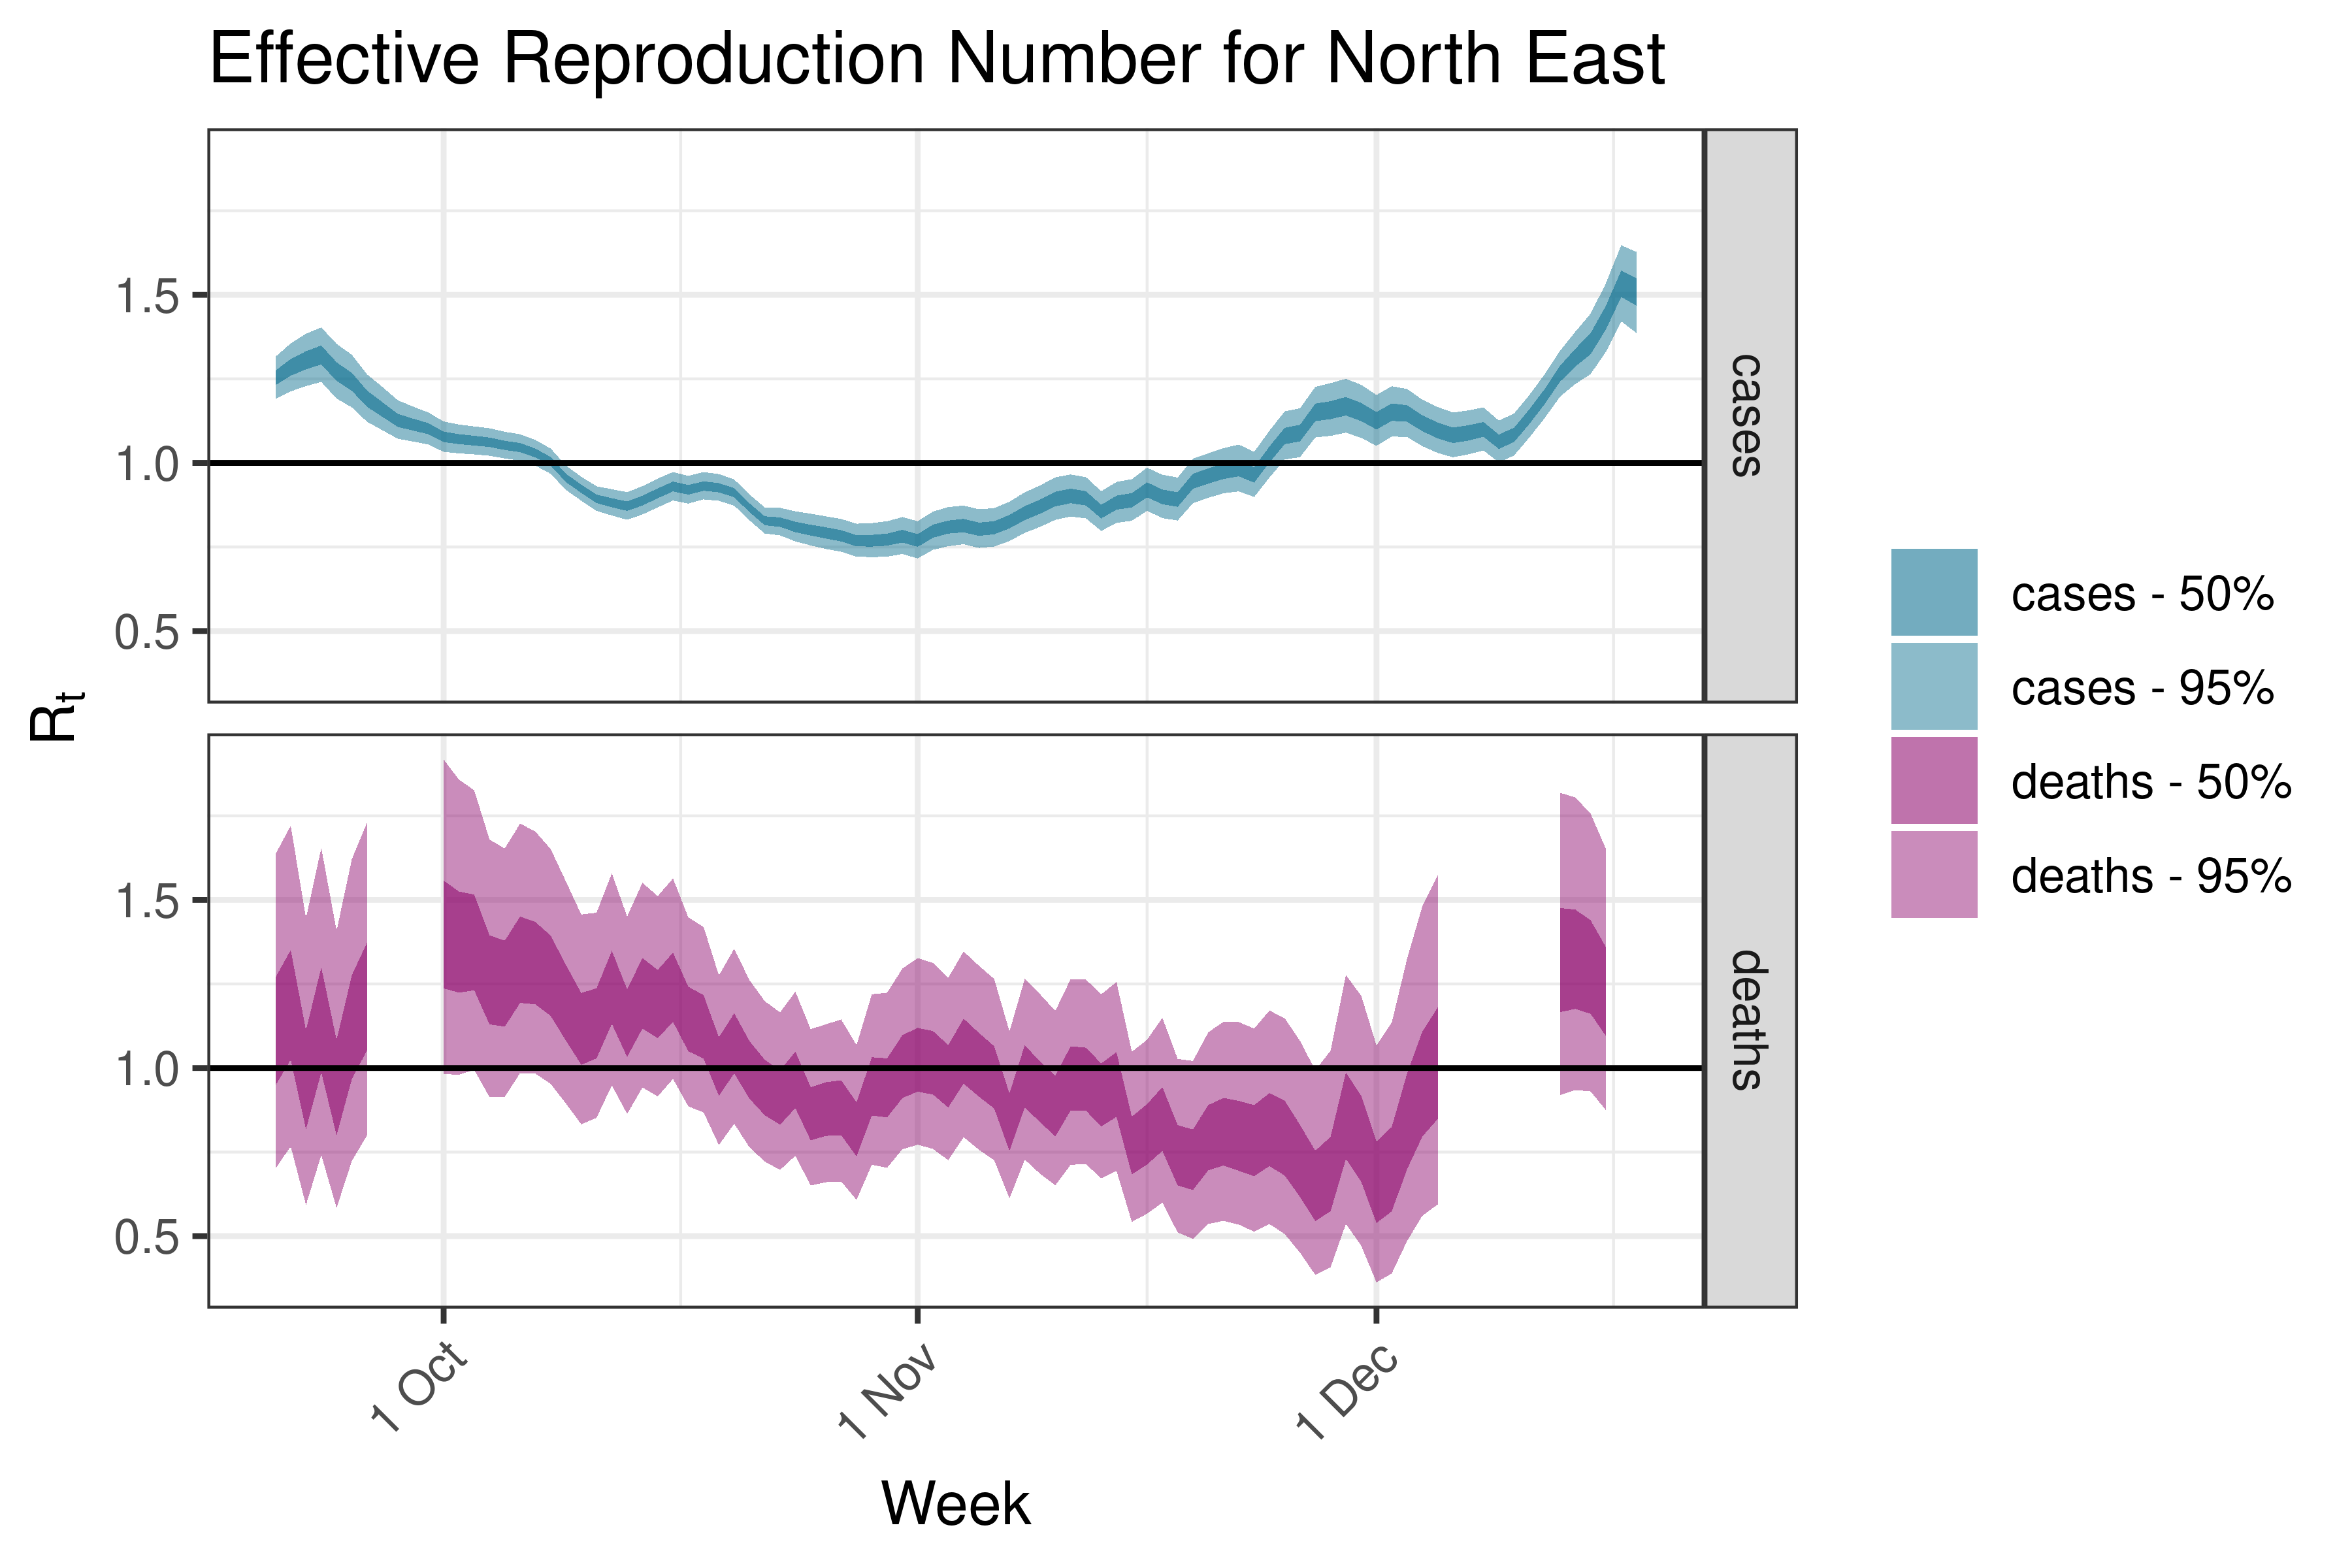
| North East | cases | 324 | 2022-12-21 | 1.51 [1.39 - 1.63] |
| North East | deaths | 6 | 2022-12-19 | 1.23 [0.87 - 1.65] |
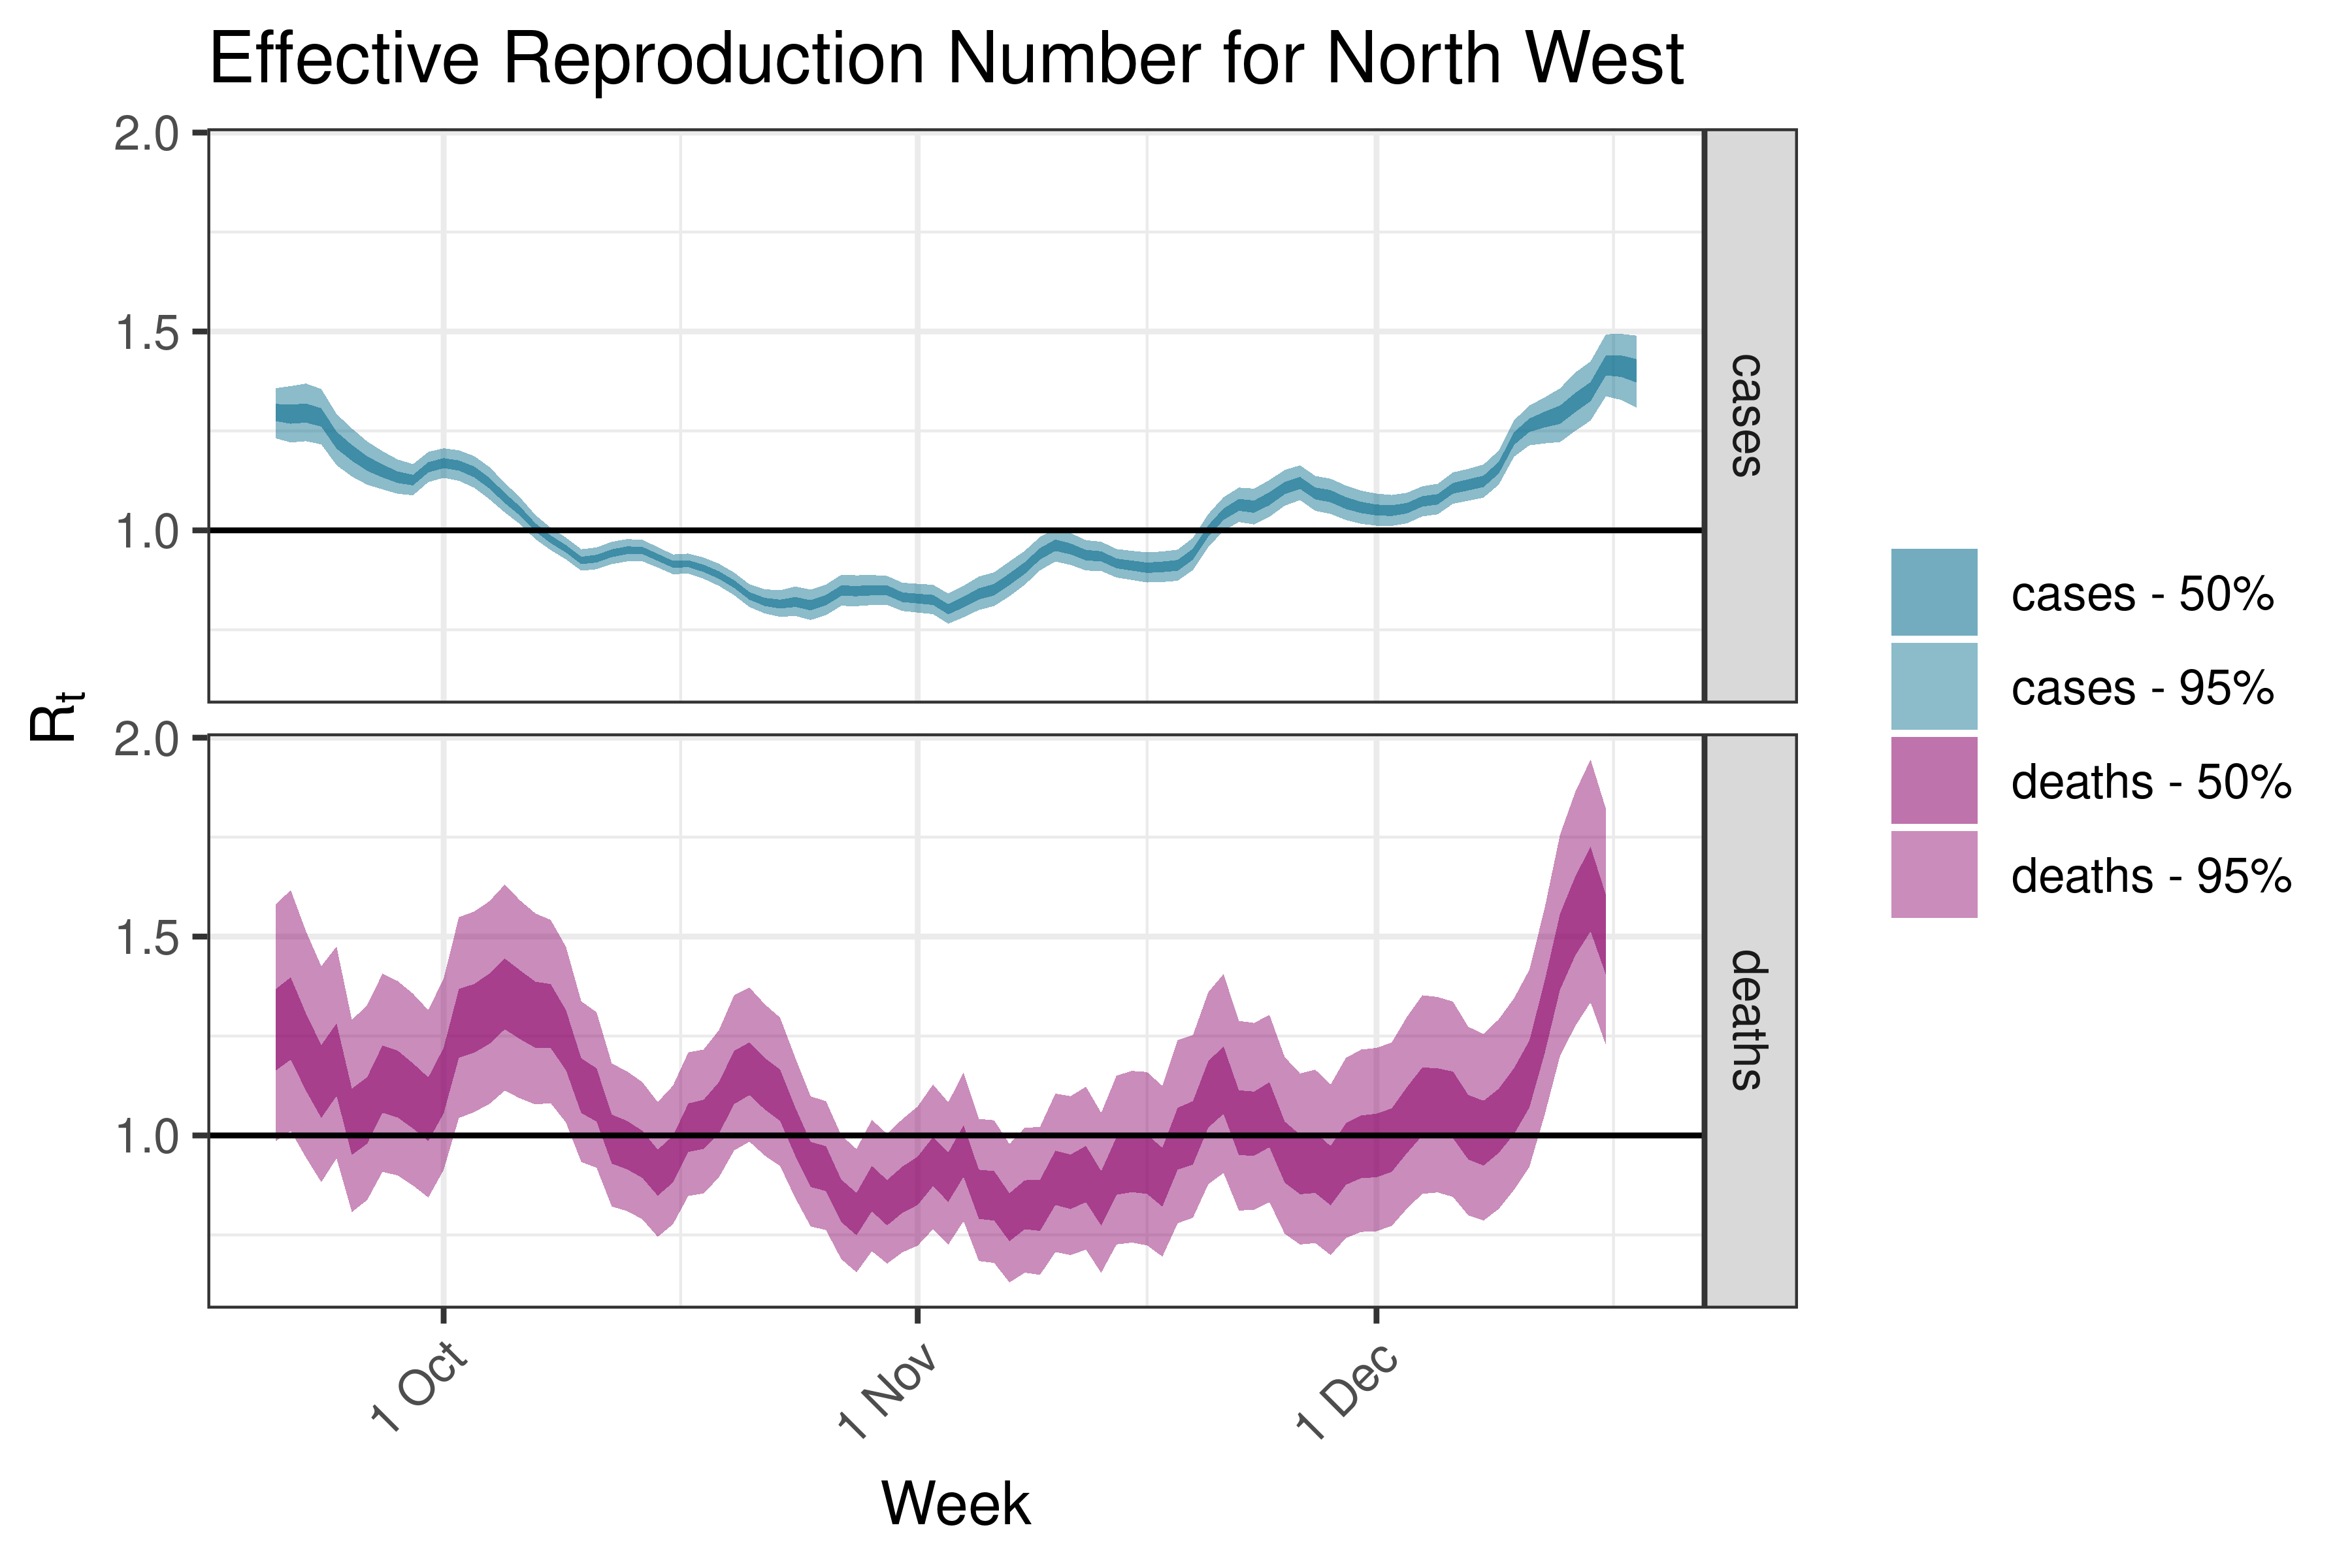
| North West | cases | 943 | 2022-12-21 | 1.40 [1.31 - 1.49] |
| North West | deaths | 19 | 2022-12-19 | 1.51 [1.23 - 1.82] |
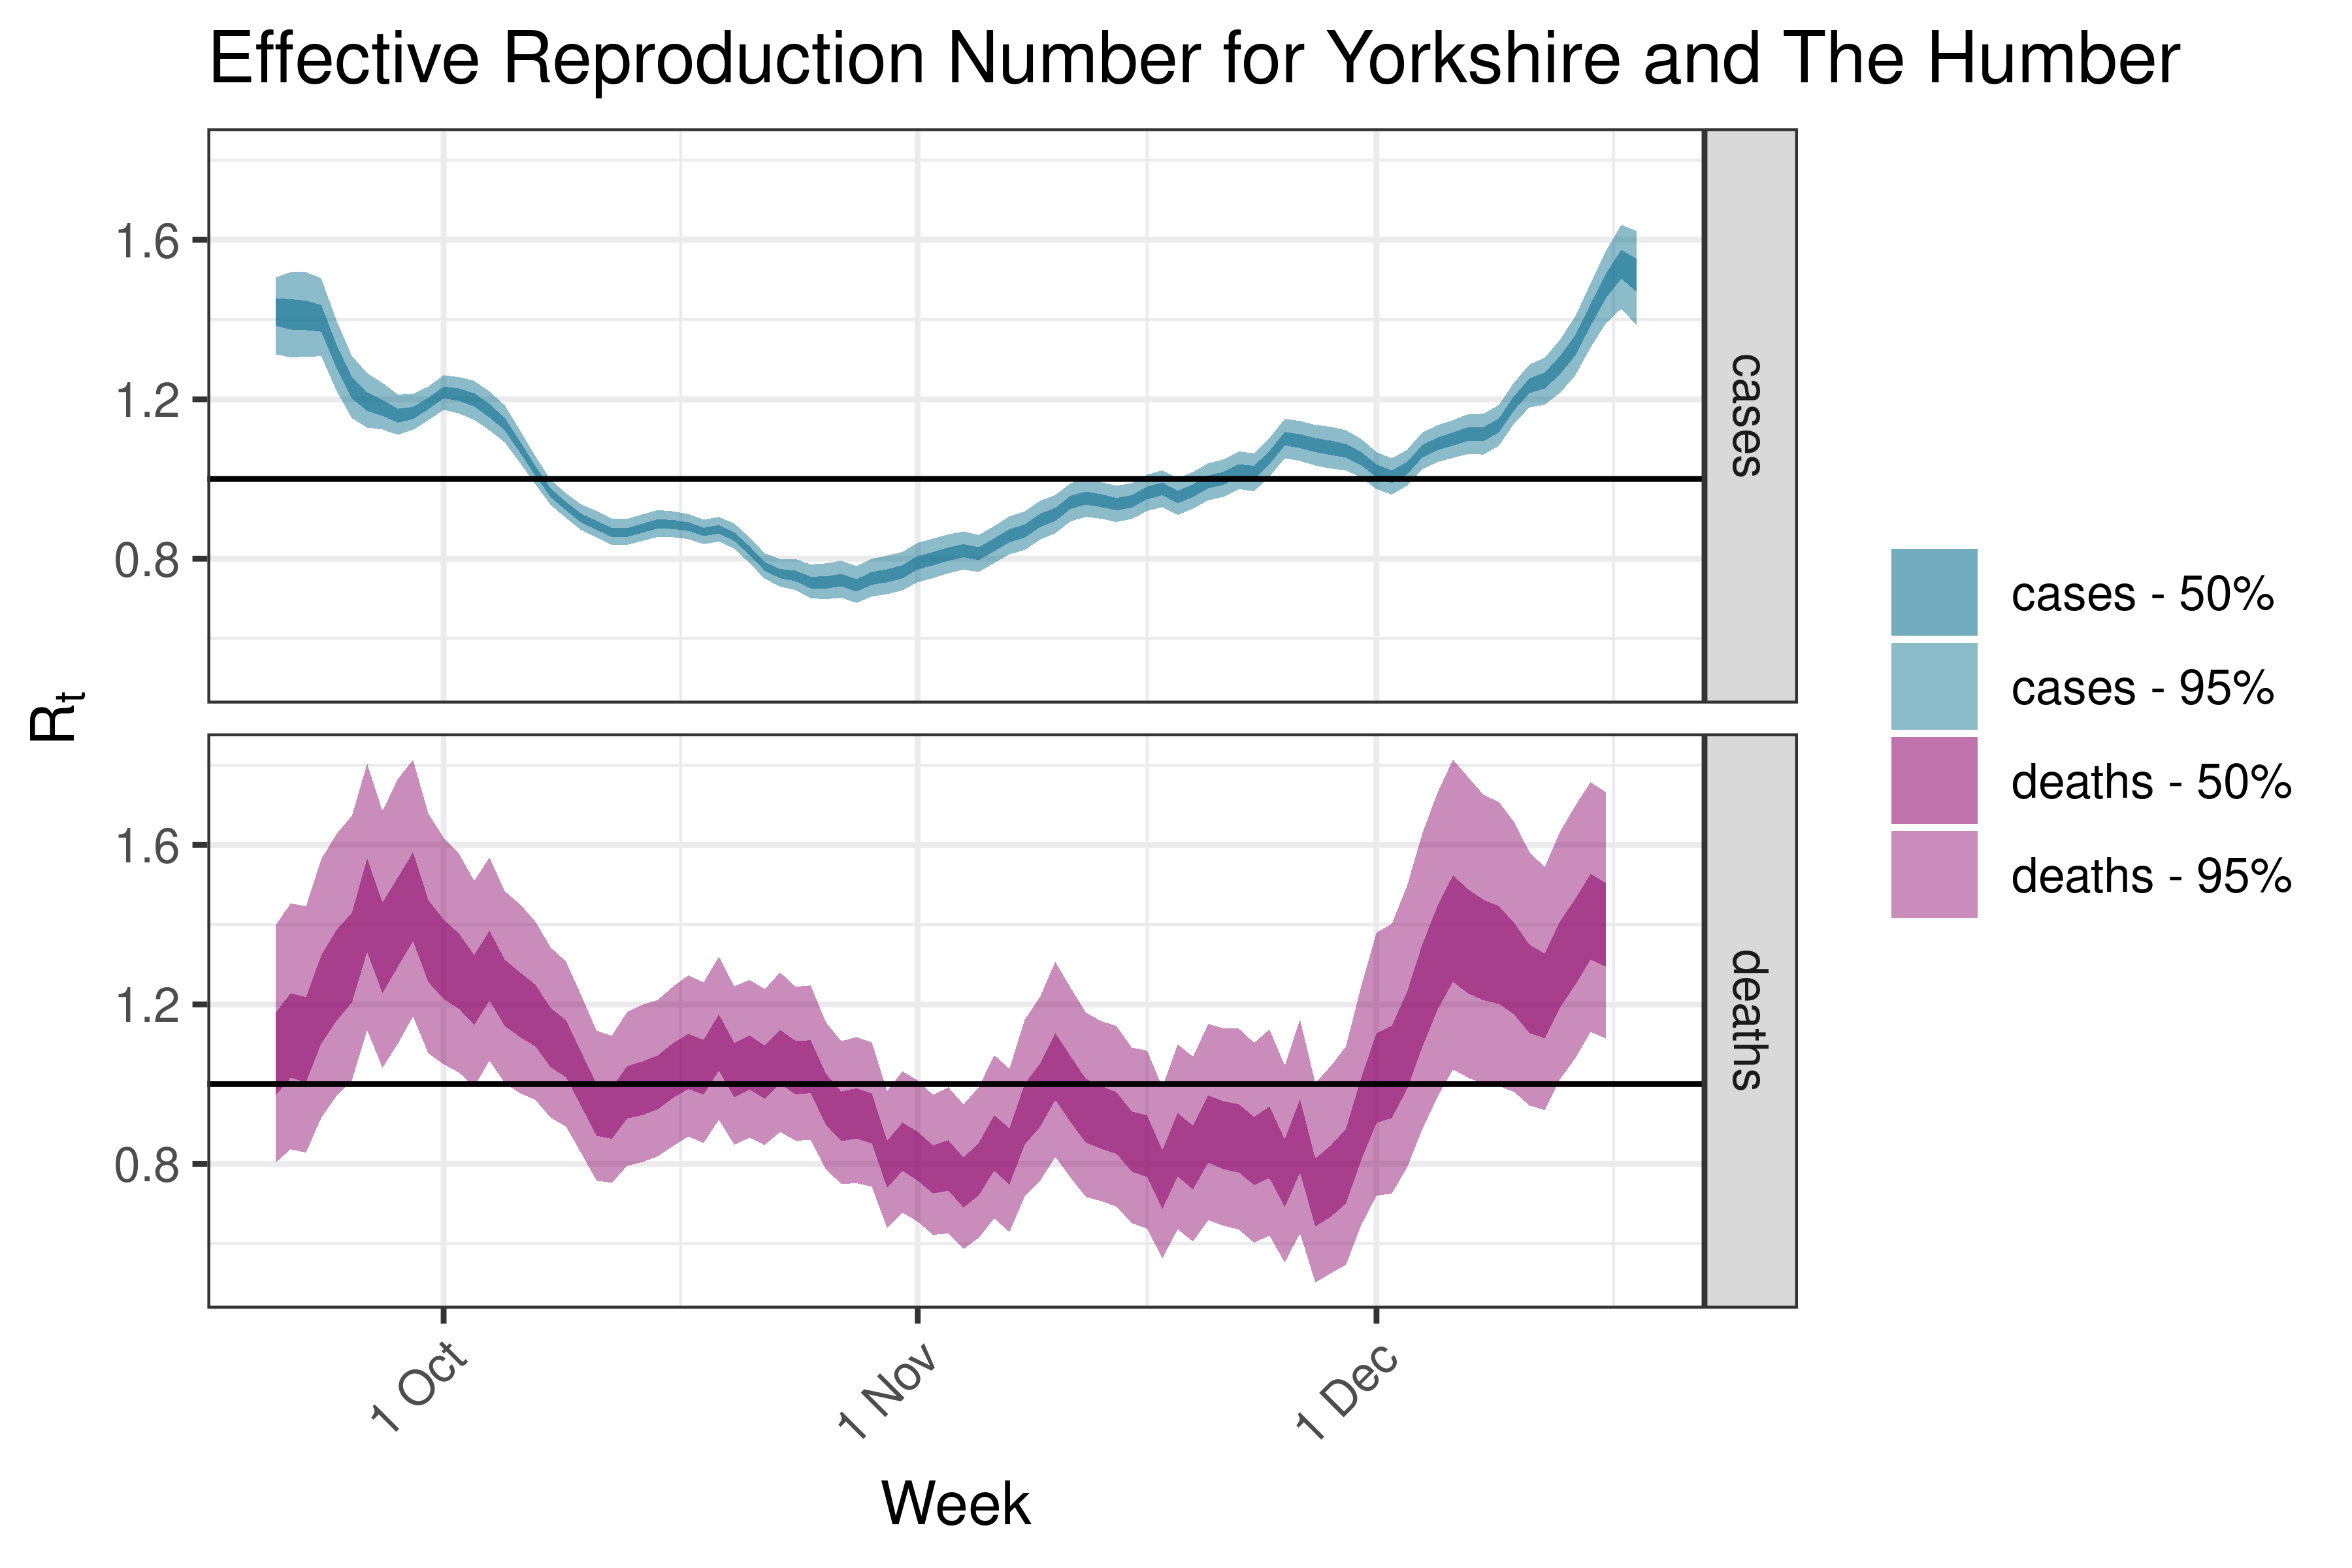
| Yorkshire and The Humber | cases | 667 | 2022-12-21 | 1.51 [1.39 - 1.62] |
| Yorkshire and The Humber | deaths | 12 | 2022-12-19 | 1.40 [1.11 - 1.73] |
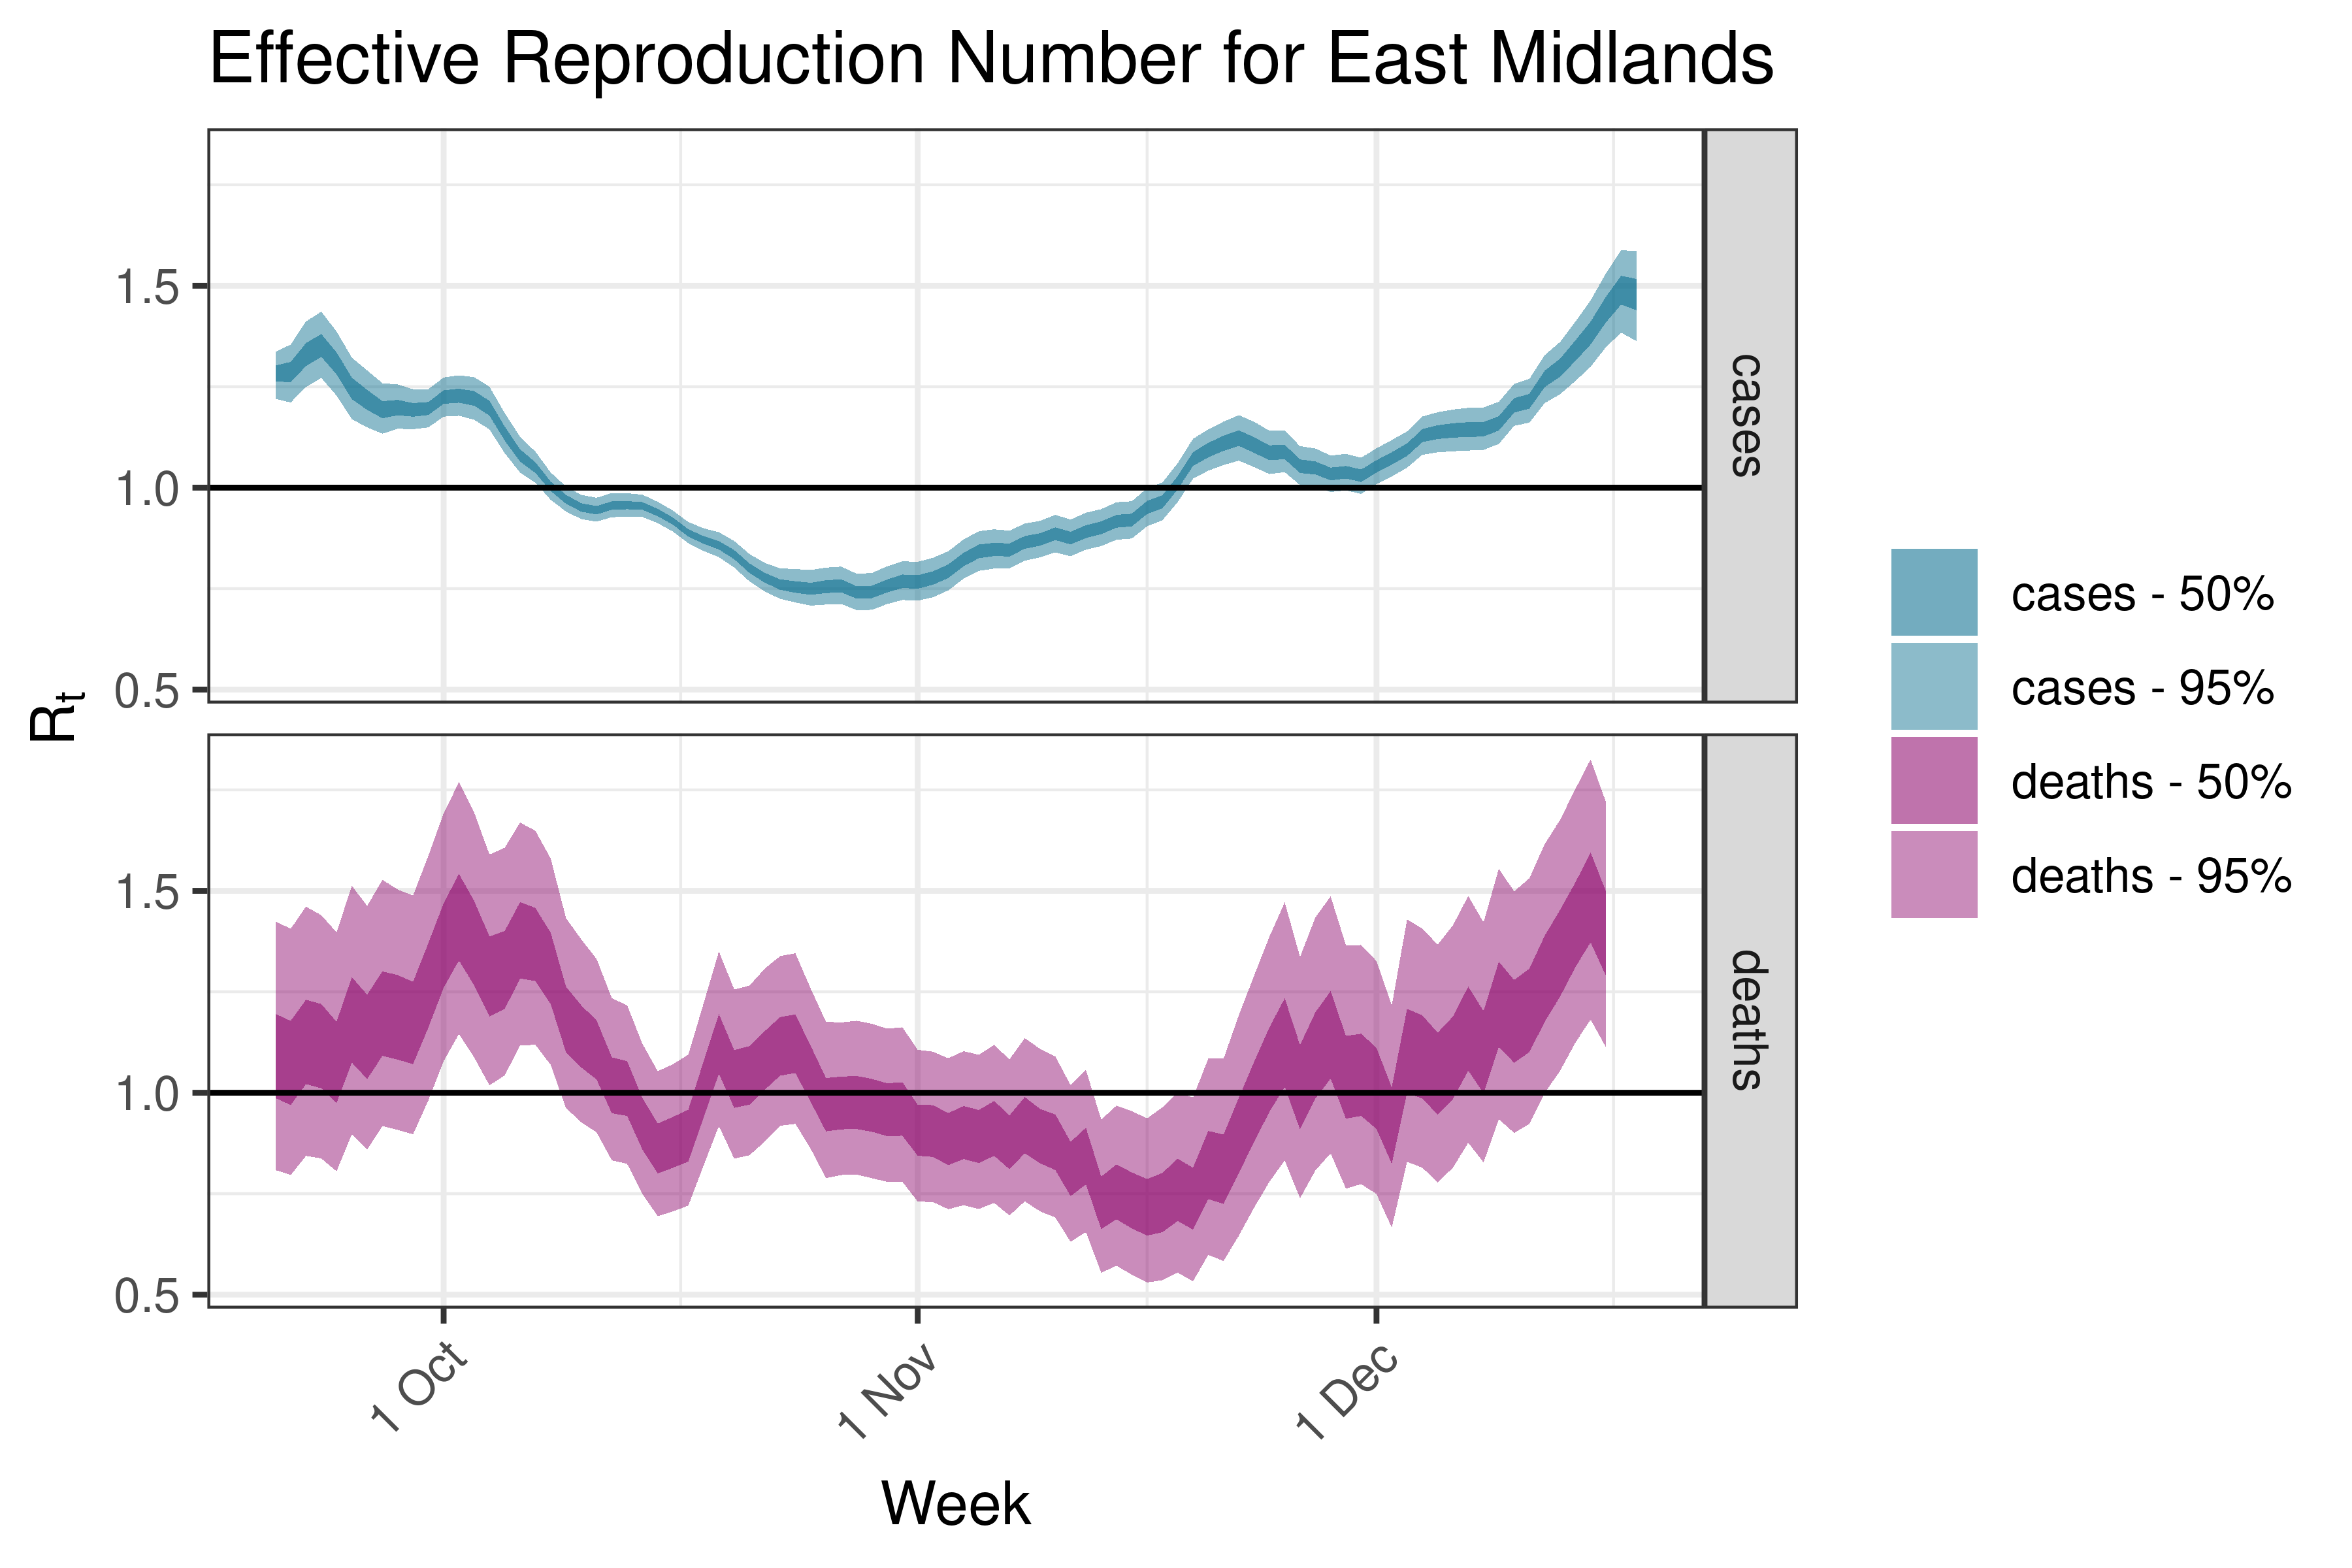
| East Midlands | cases | 752 | 2022-12-21 | 1.48 [1.36 - 1.59] |
| East Midlands | deaths | 13 | 2022-12-19 | 1.40 [1.11 - 1.72] |
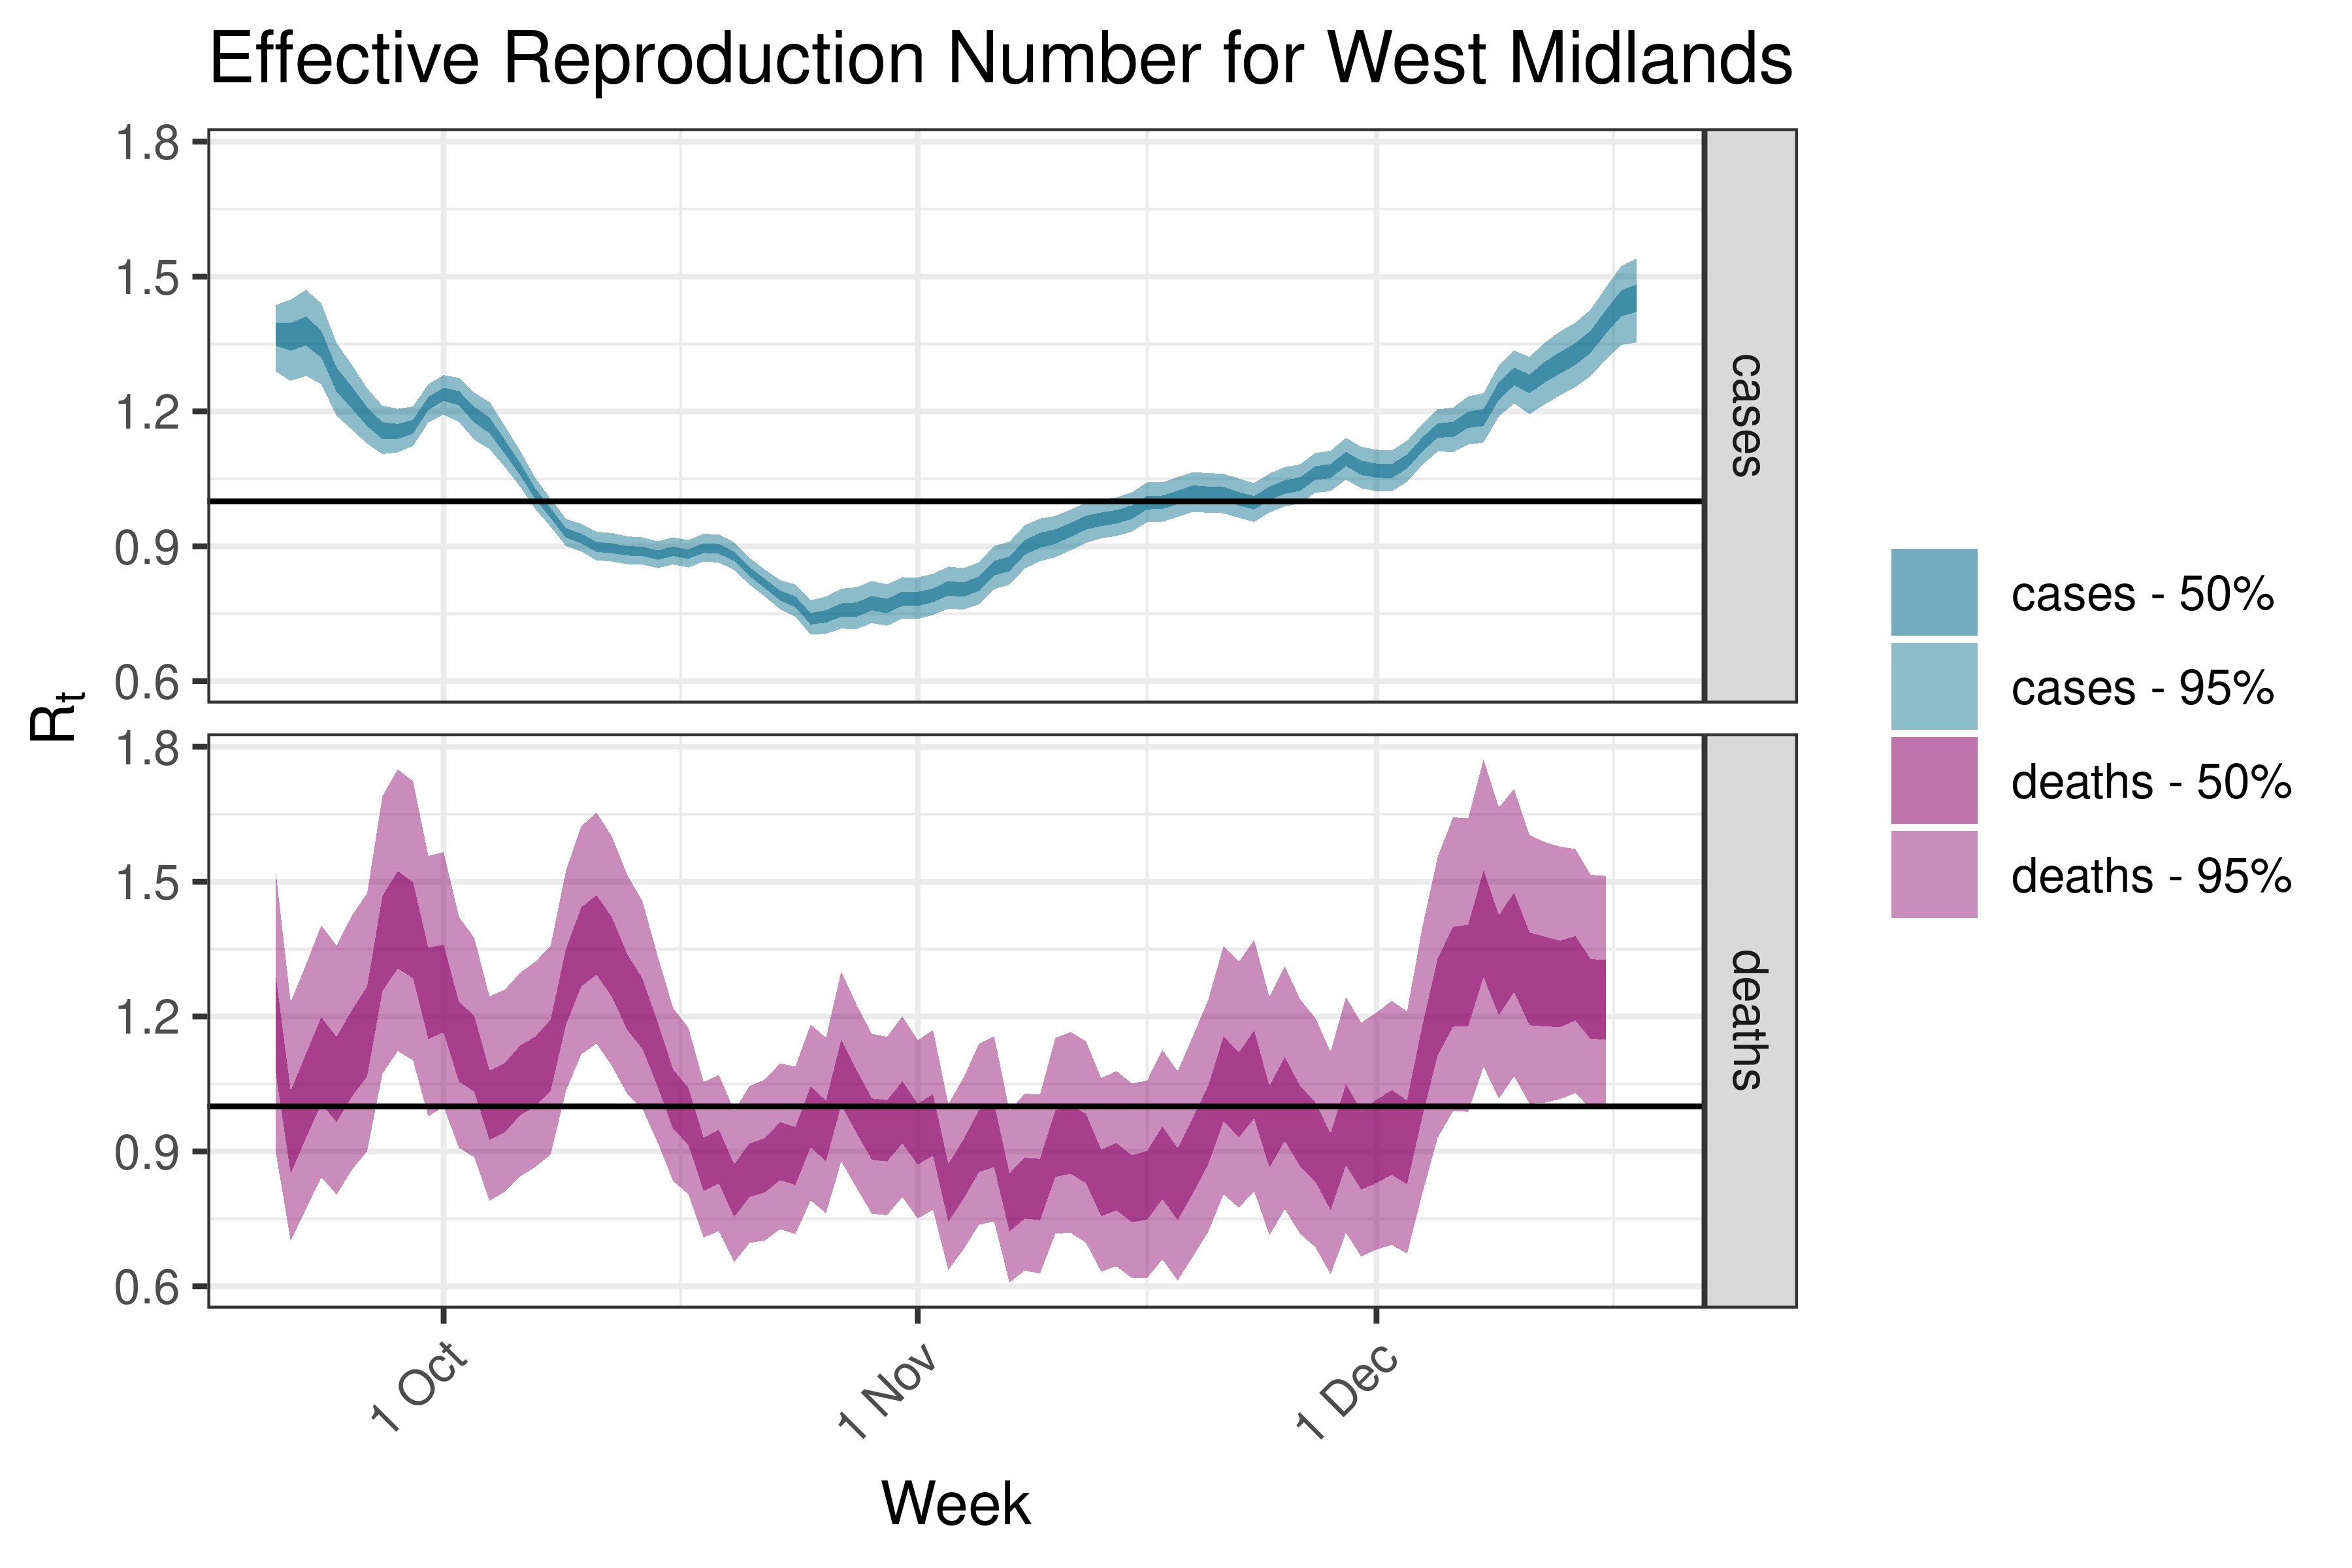
| West Midlands | cases | 830 | 2022-12-21 | 1.45 [1.35 - 1.54] |
| West Midlands | deaths | 13 | 2022-12-19 | 1.24 [1.00 - 1.51] |
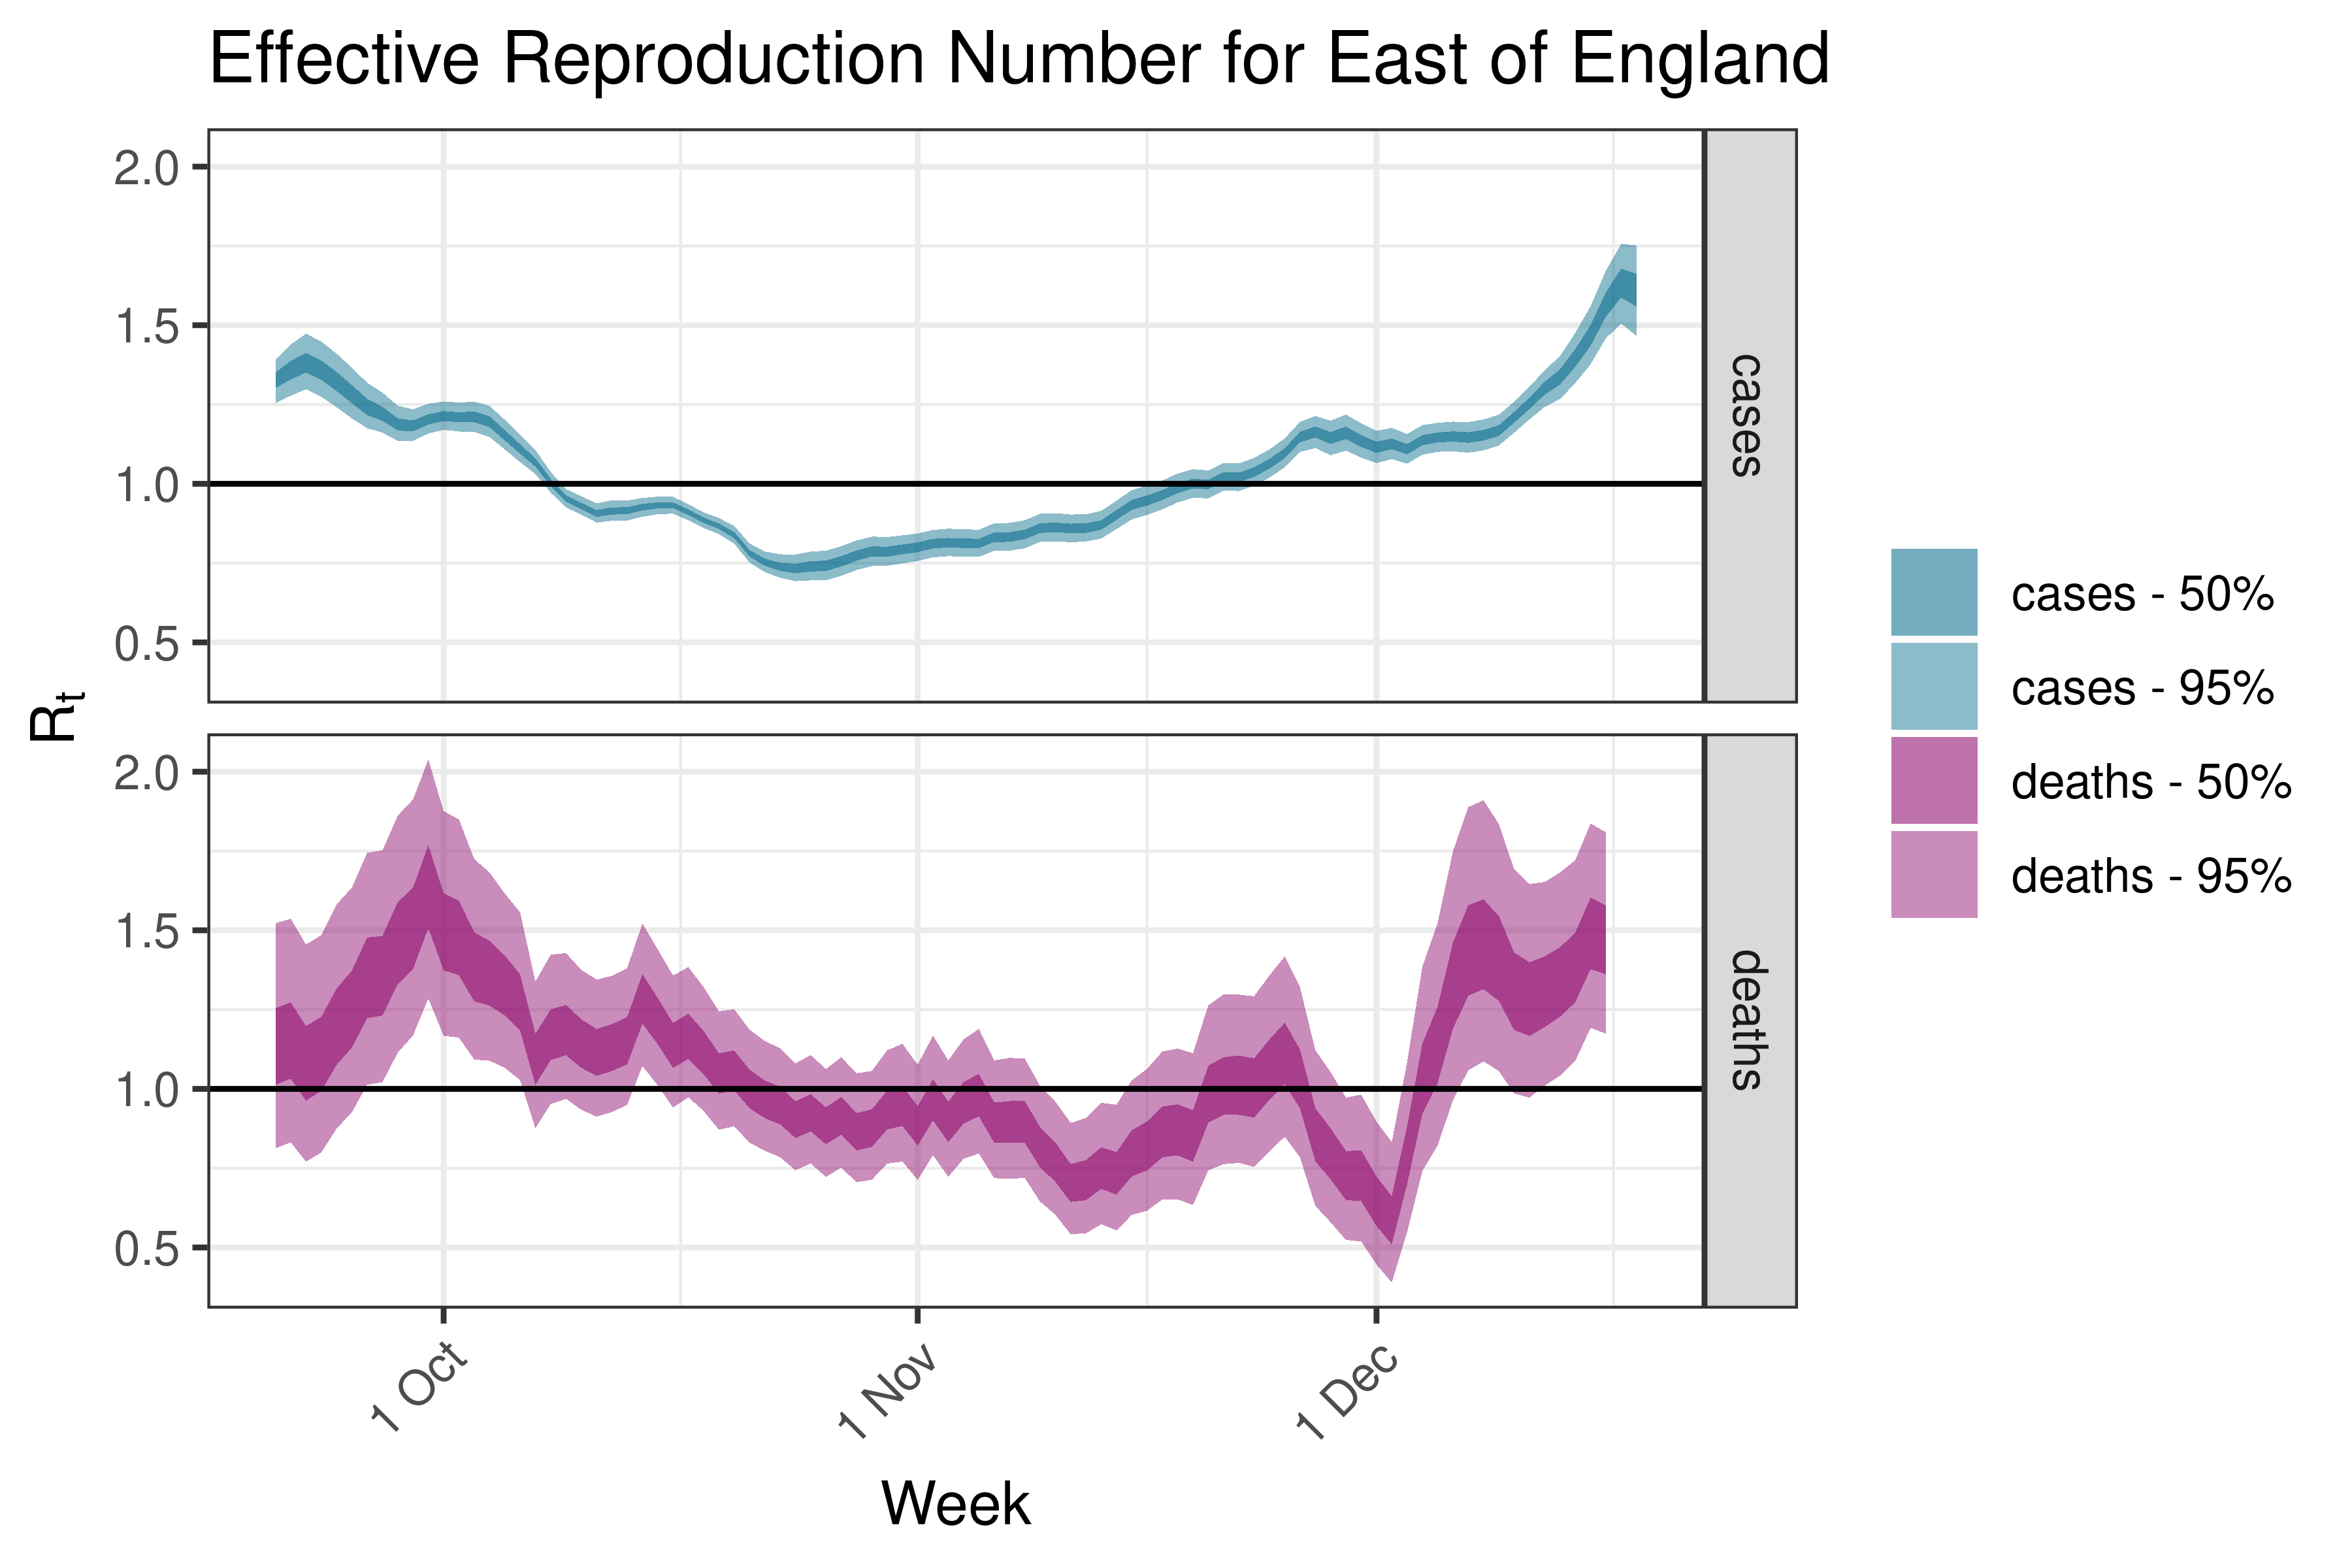
| East of England | cases | 1,048 | 2022-12-21 | 1.61 [1.47 - 1.75] |
| East of England | deaths | 13 | 2022-12-19 | 1.47 [1.17 - 1.81] |
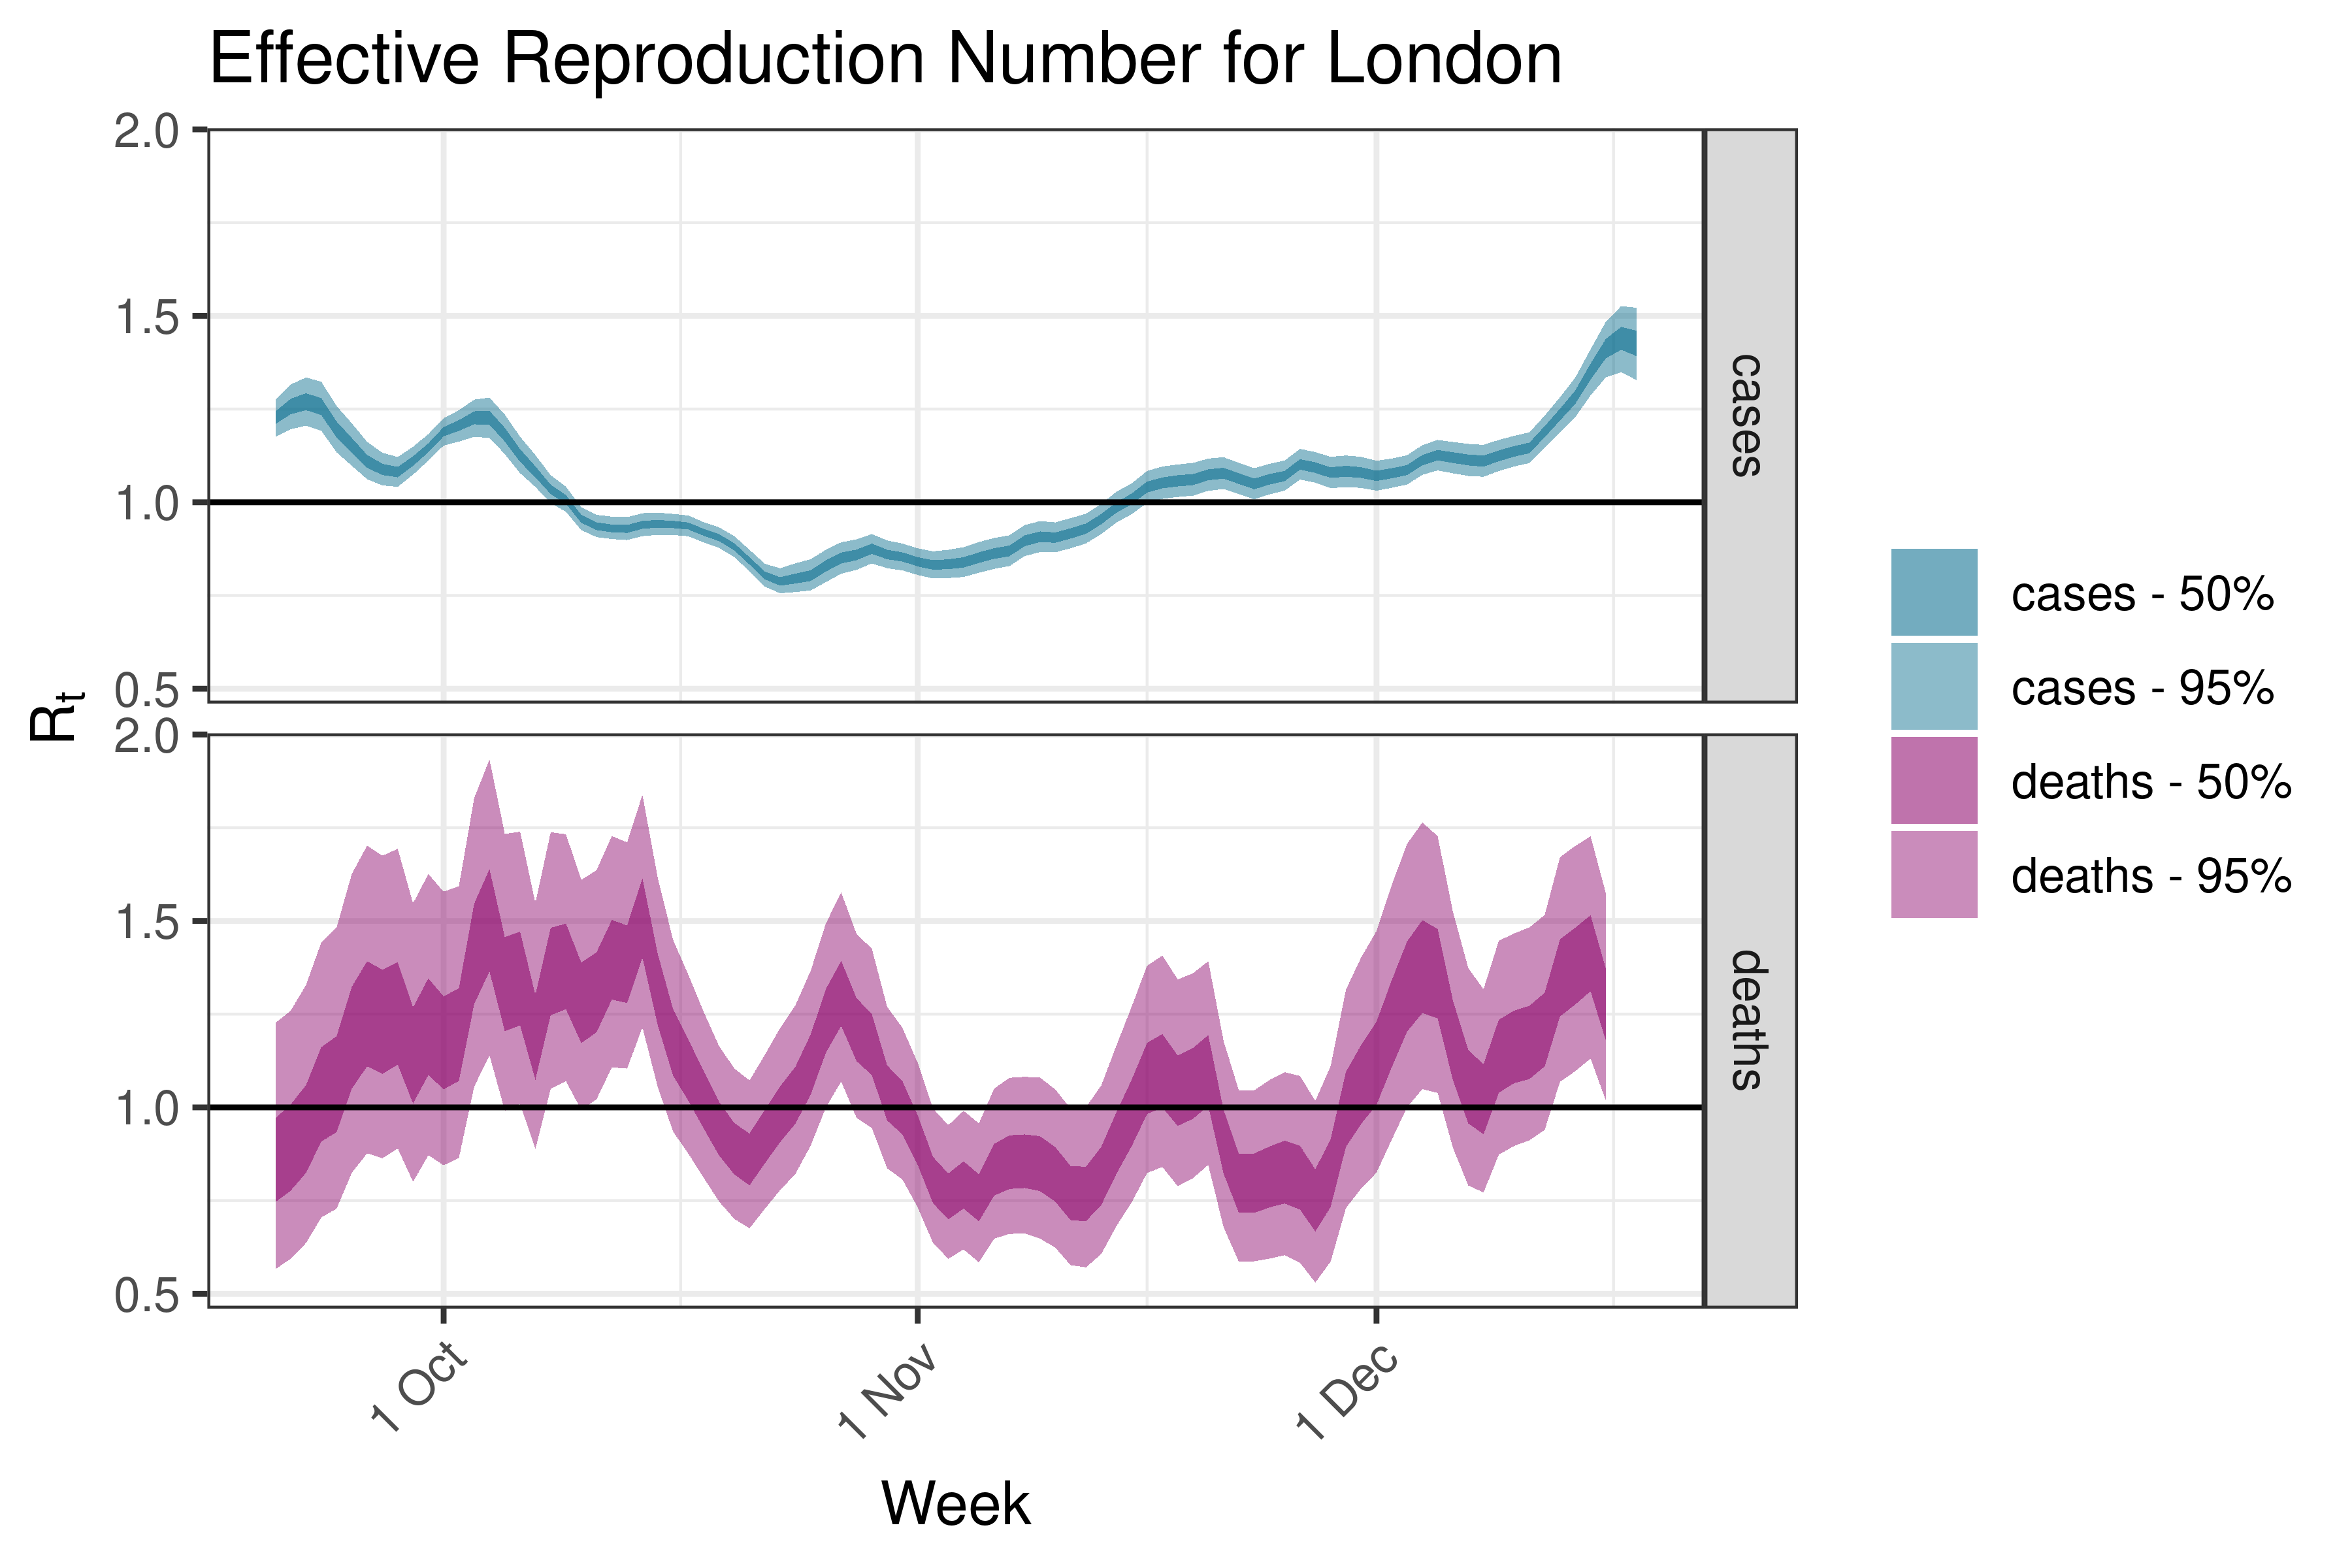
| London | cases | 940 | 2022-12-21 | 1.43 [1.33 - 1.52] |
| London | deaths | 12 | 2022-12-19 | 1.28 [1.02 - 1.57] |
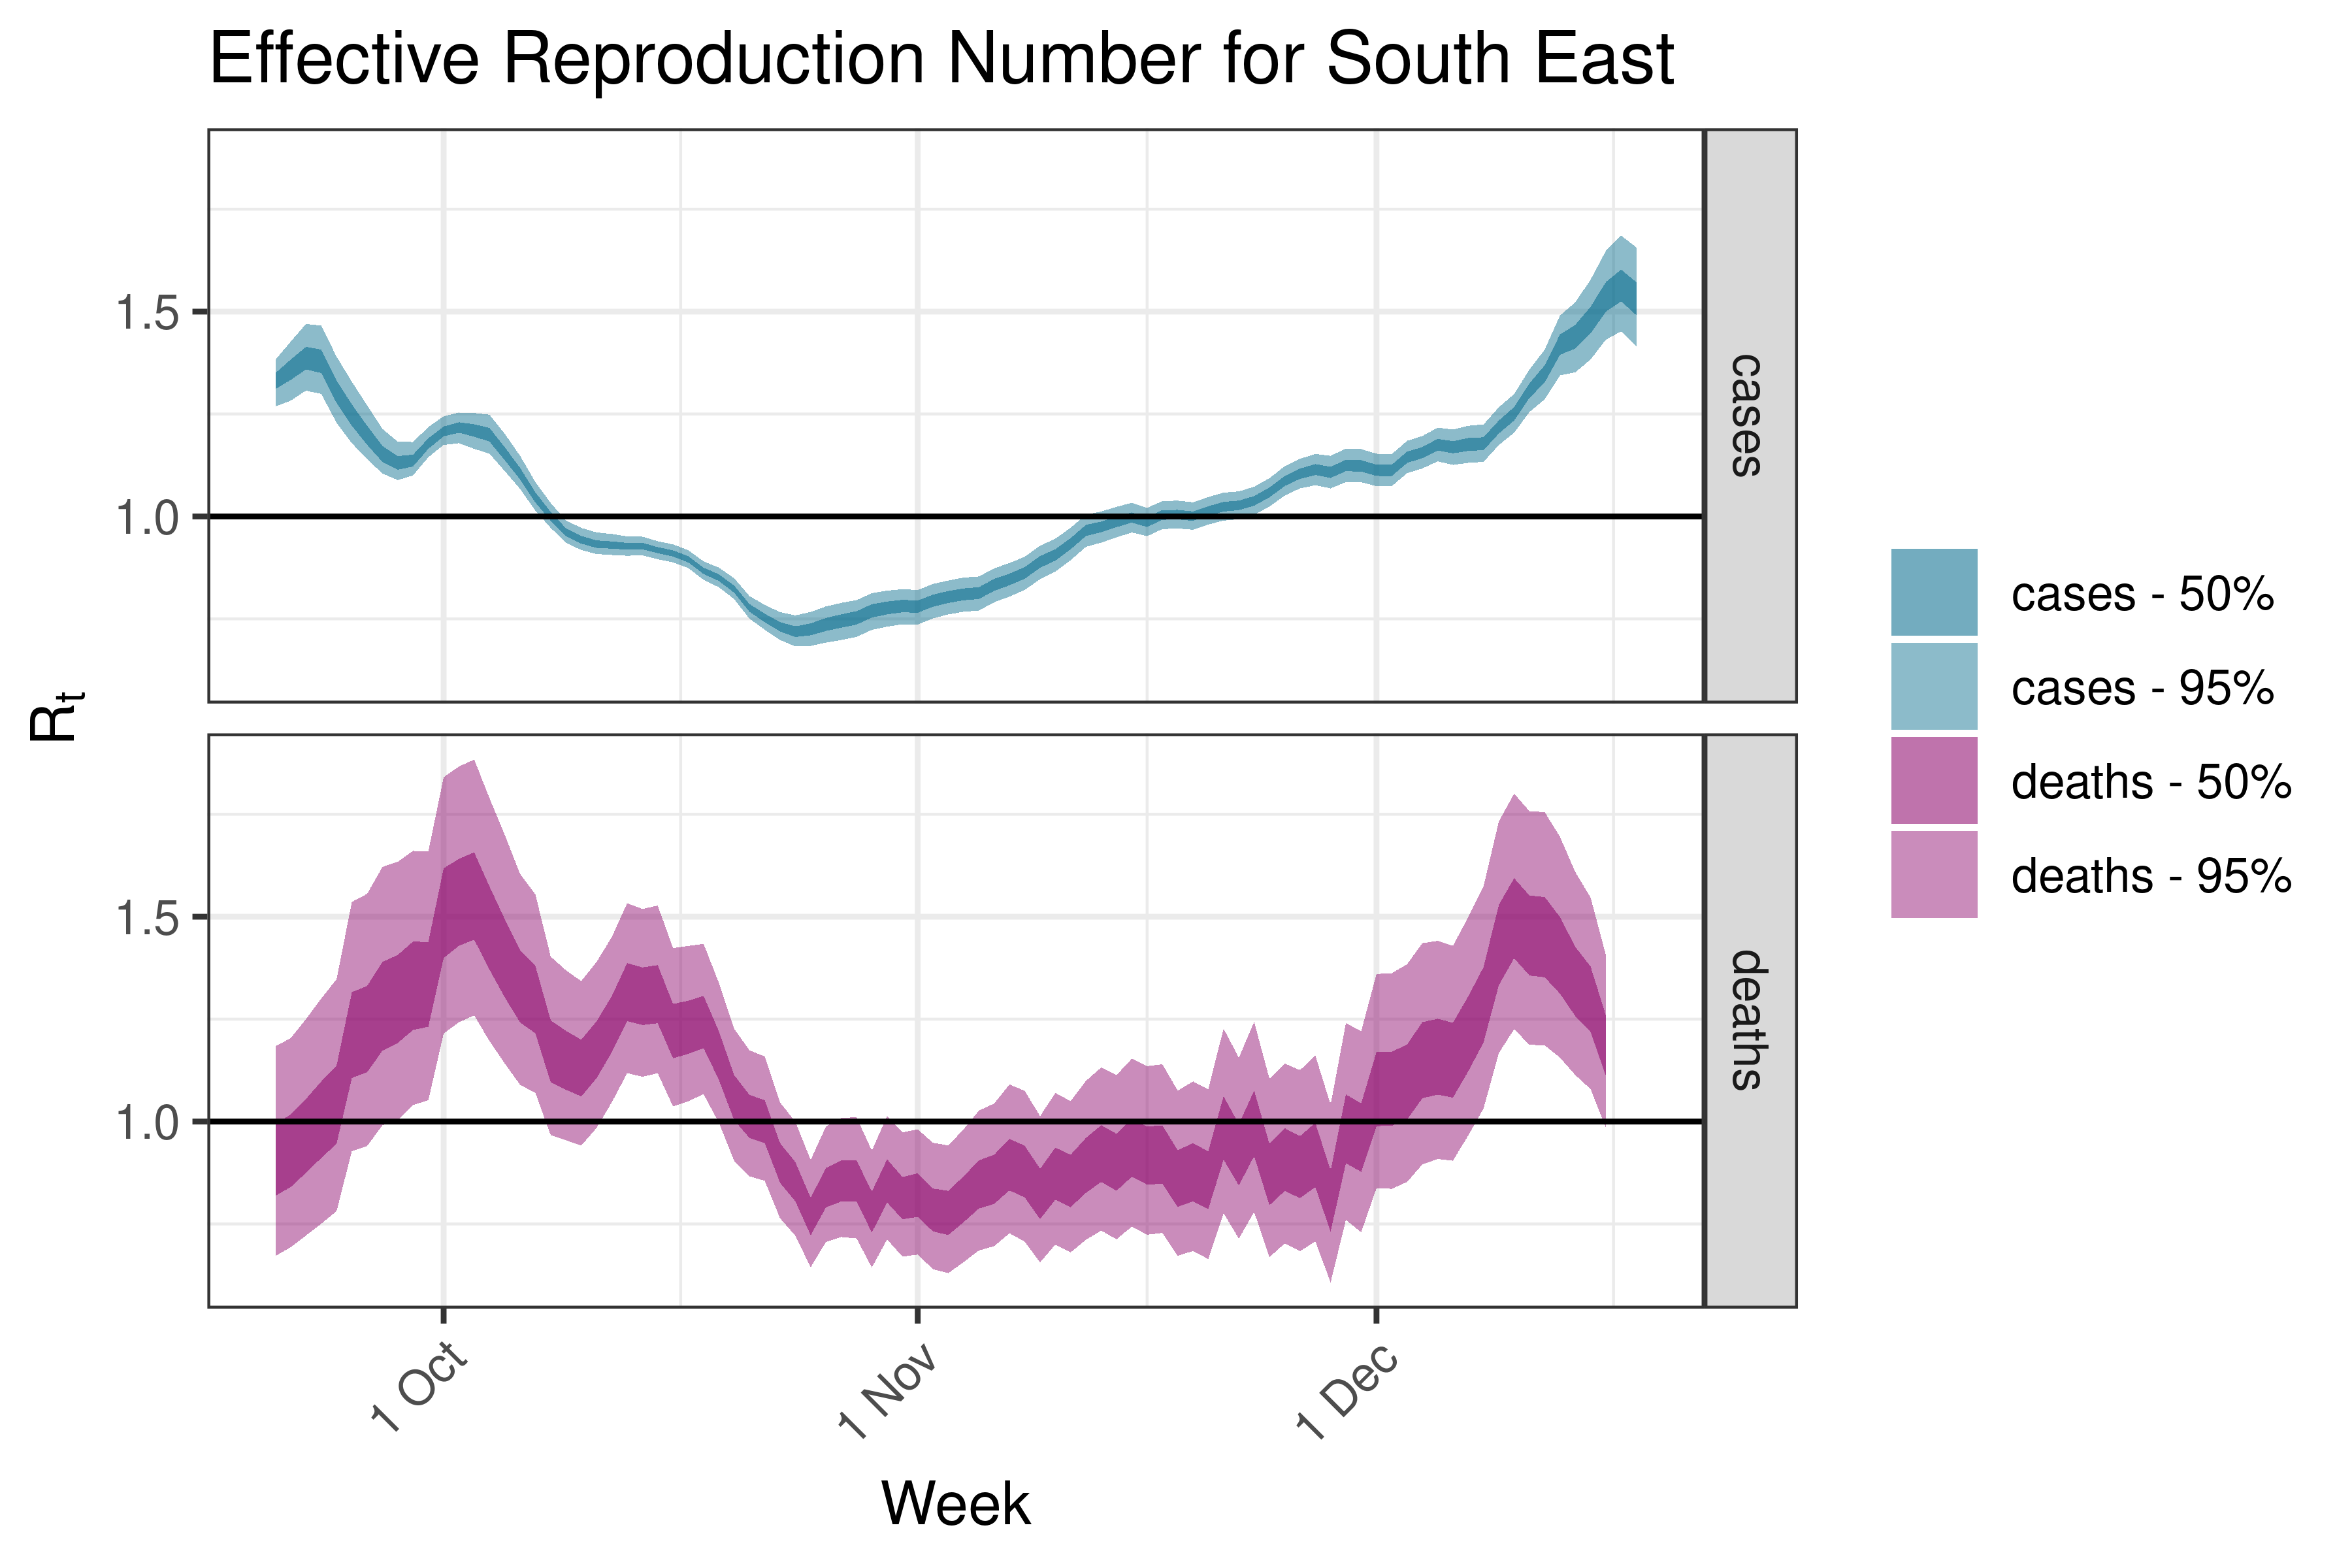
| South East | cases | 1,716 | 2022-12-21 | 1.53 [1.42 - 1.66] |
| South East | deaths | 19 | 2022-12-19 | 1.19 [0.98 - 1.41] |
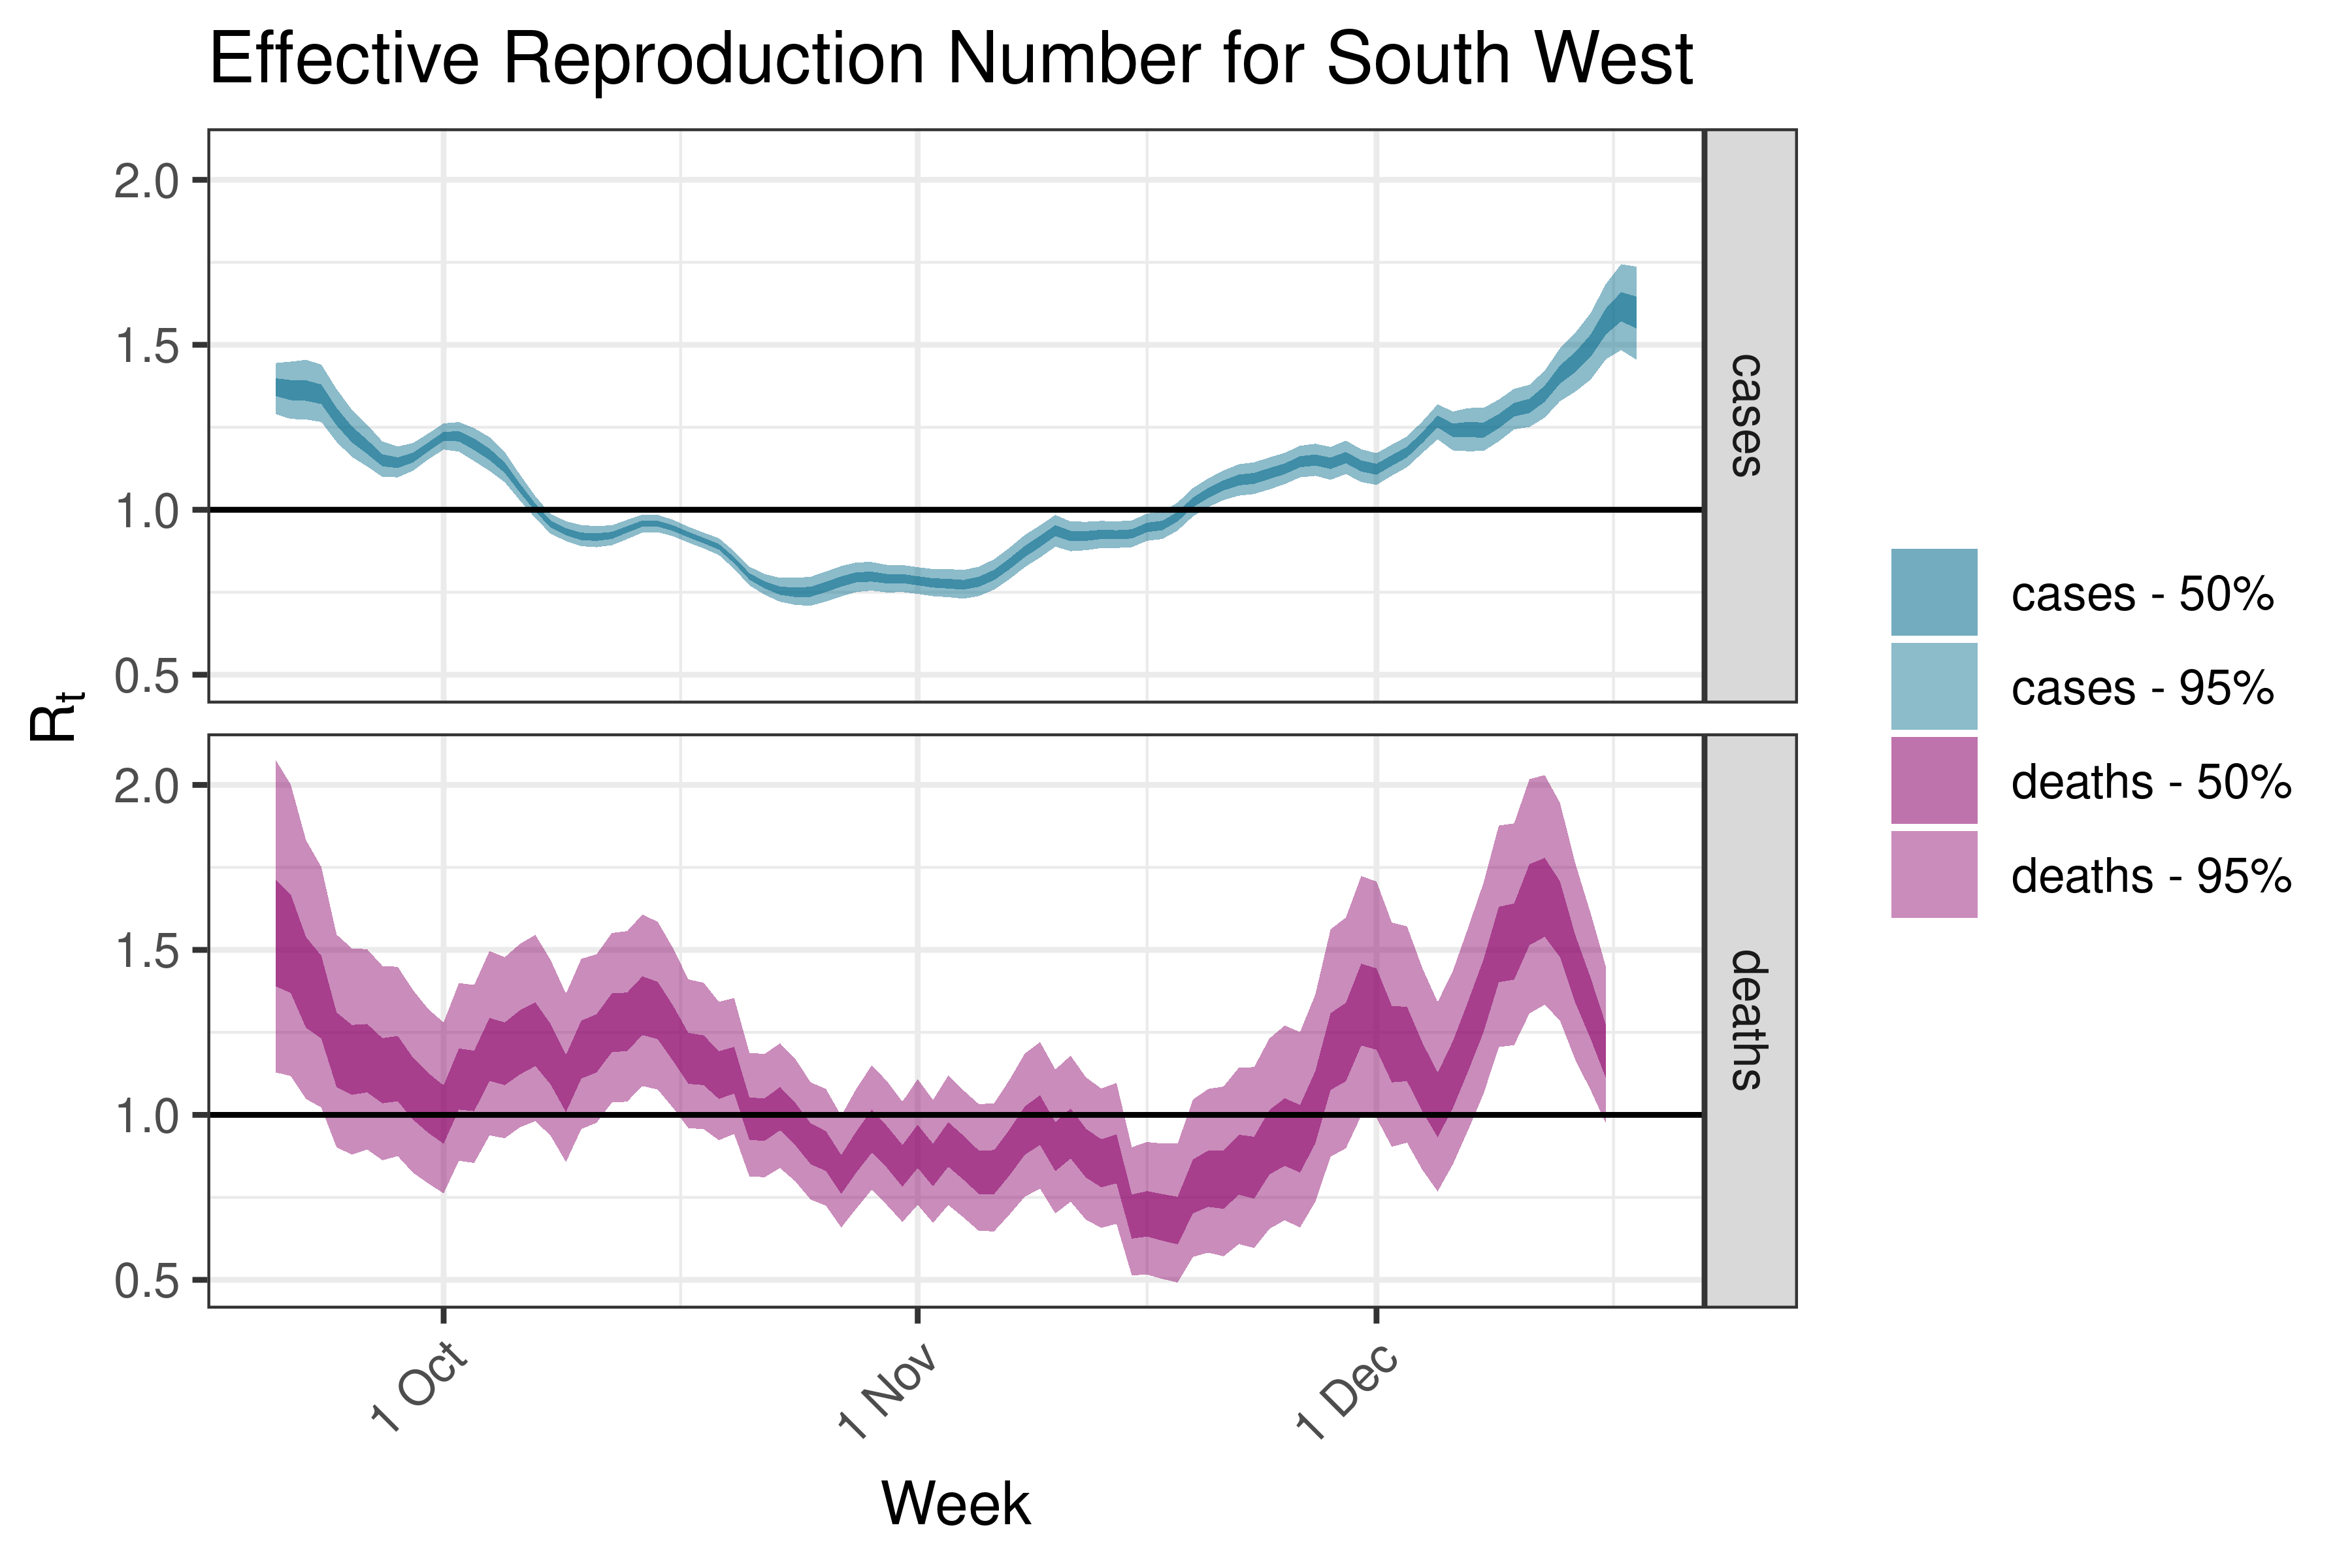
| South West | cases | 1,415 | 2022-12-21 | 1.60 [1.45 - 1.74] |
| South West | deaths | 16 | 2022-12-19 | 1.20 [0.97 - 1.45] |
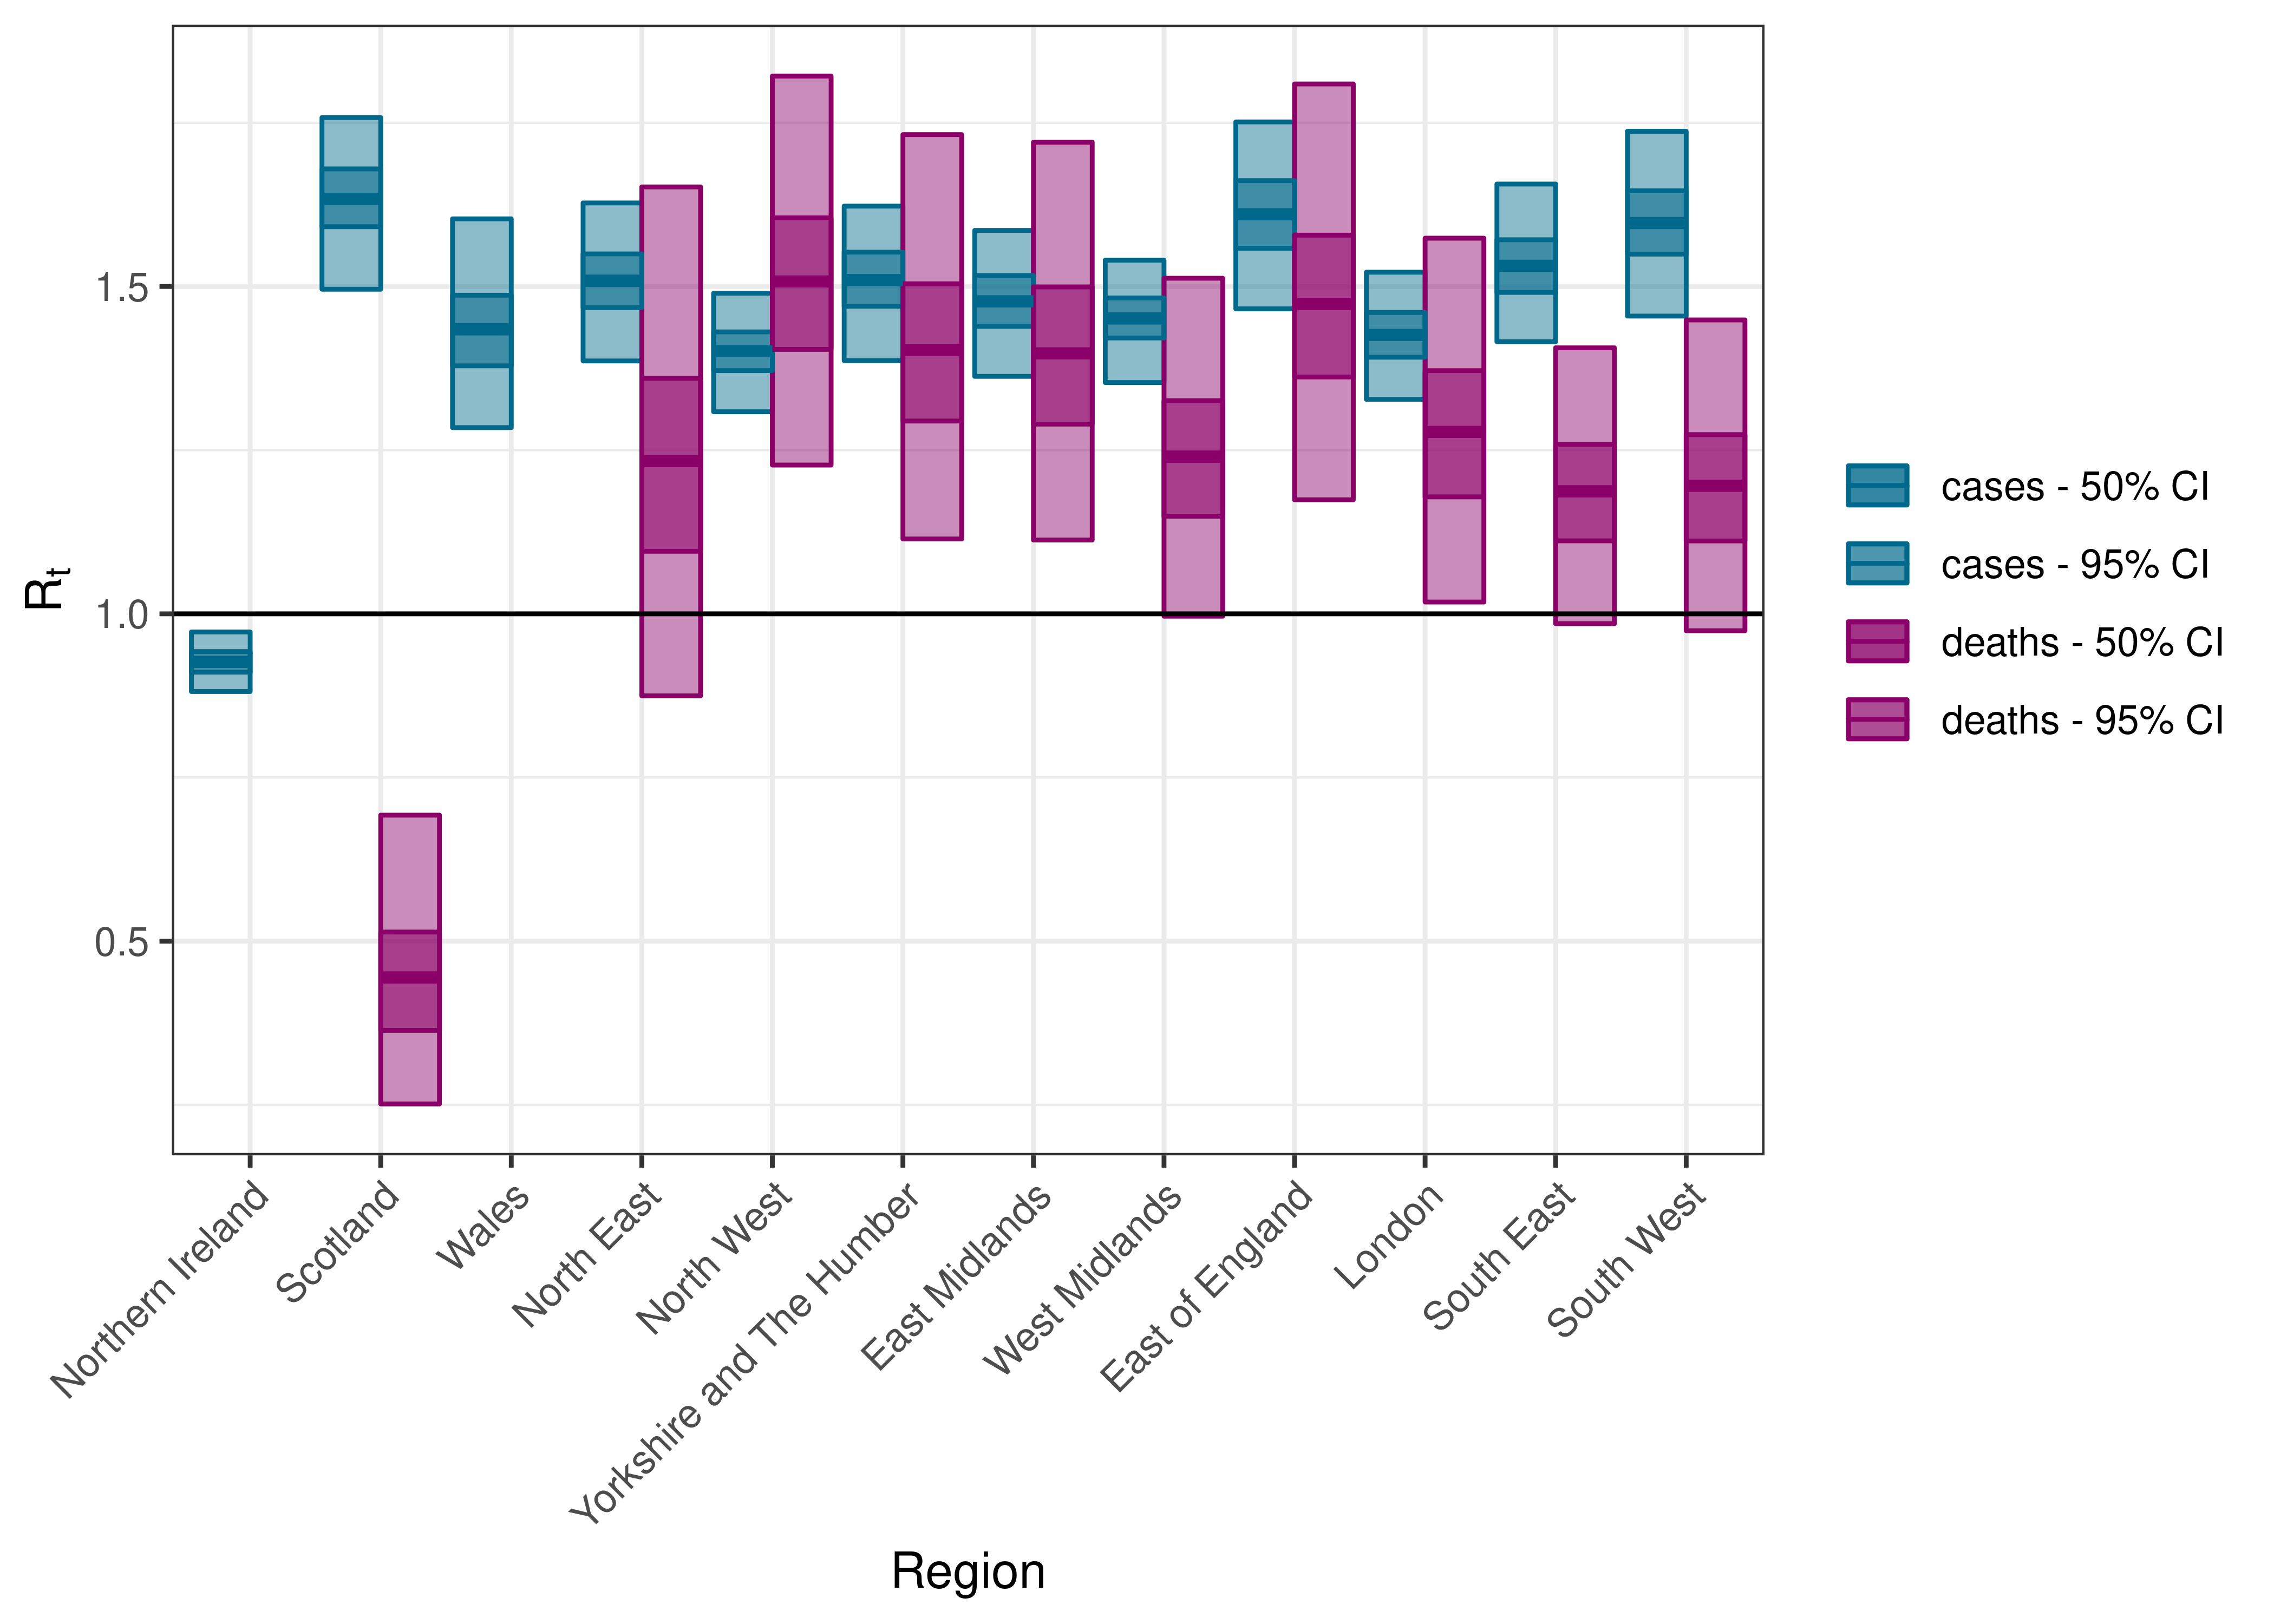
Estimated Effective Reproduction Number by Region
6.4 Maps of Effective Reproduction Number
Below we plot the current effective reproduction number on maps with boundaries provided by [5]. Data where the confidence interval for the reproduction number is wider than 1 are excluded (shown as missing on the map).
6.4.1 Cases
6.4.2 Deaths
6.5 Graphs over Time
Below we plot results for each nation.
6.5.1 Northern Ireland
6.5.2 Scotland
6.5.3 Wales

6.5.4 North East
6.5.5 North West
6.5.6 Yorkshire and The Humber
6.5.7 East Midlands
6.5.8 West Midlands
6.5.9 East of England
6.5.10 London
6.5.11 South East
6.5.12 South West
7 Results by NHS Region
7.1 Admissions
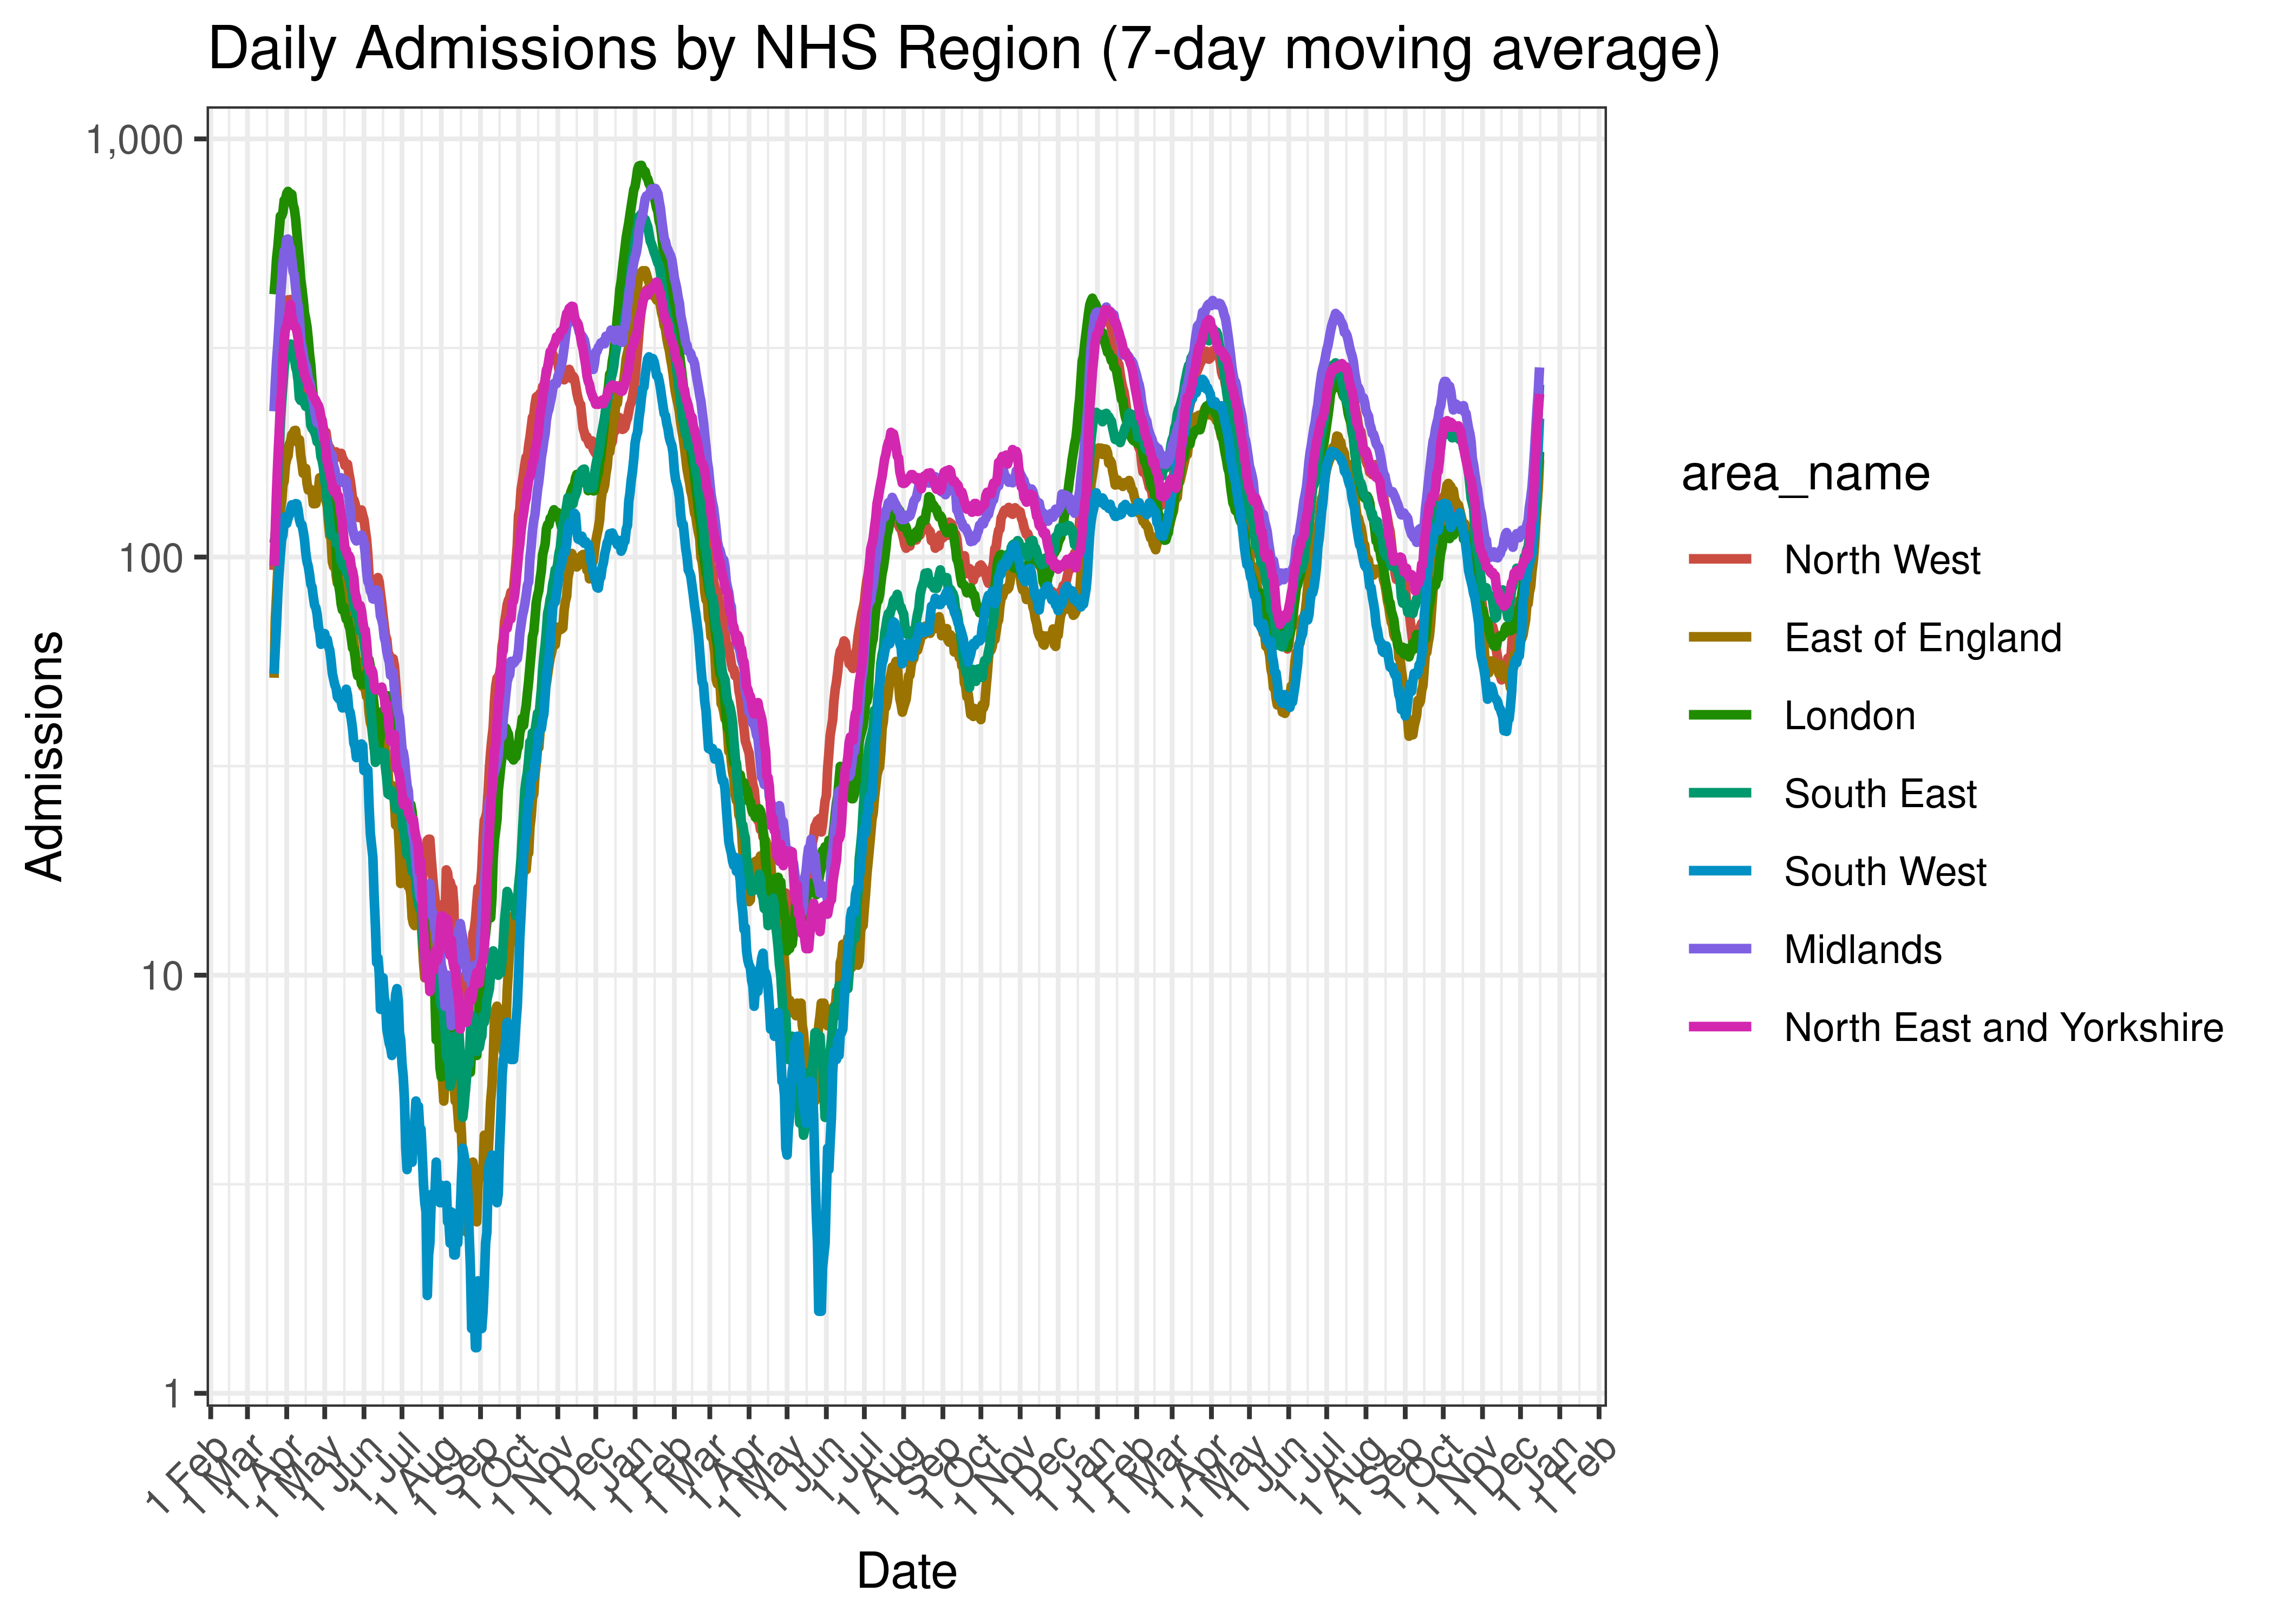
Daily Admissions by NHS Region (7-day moving average)
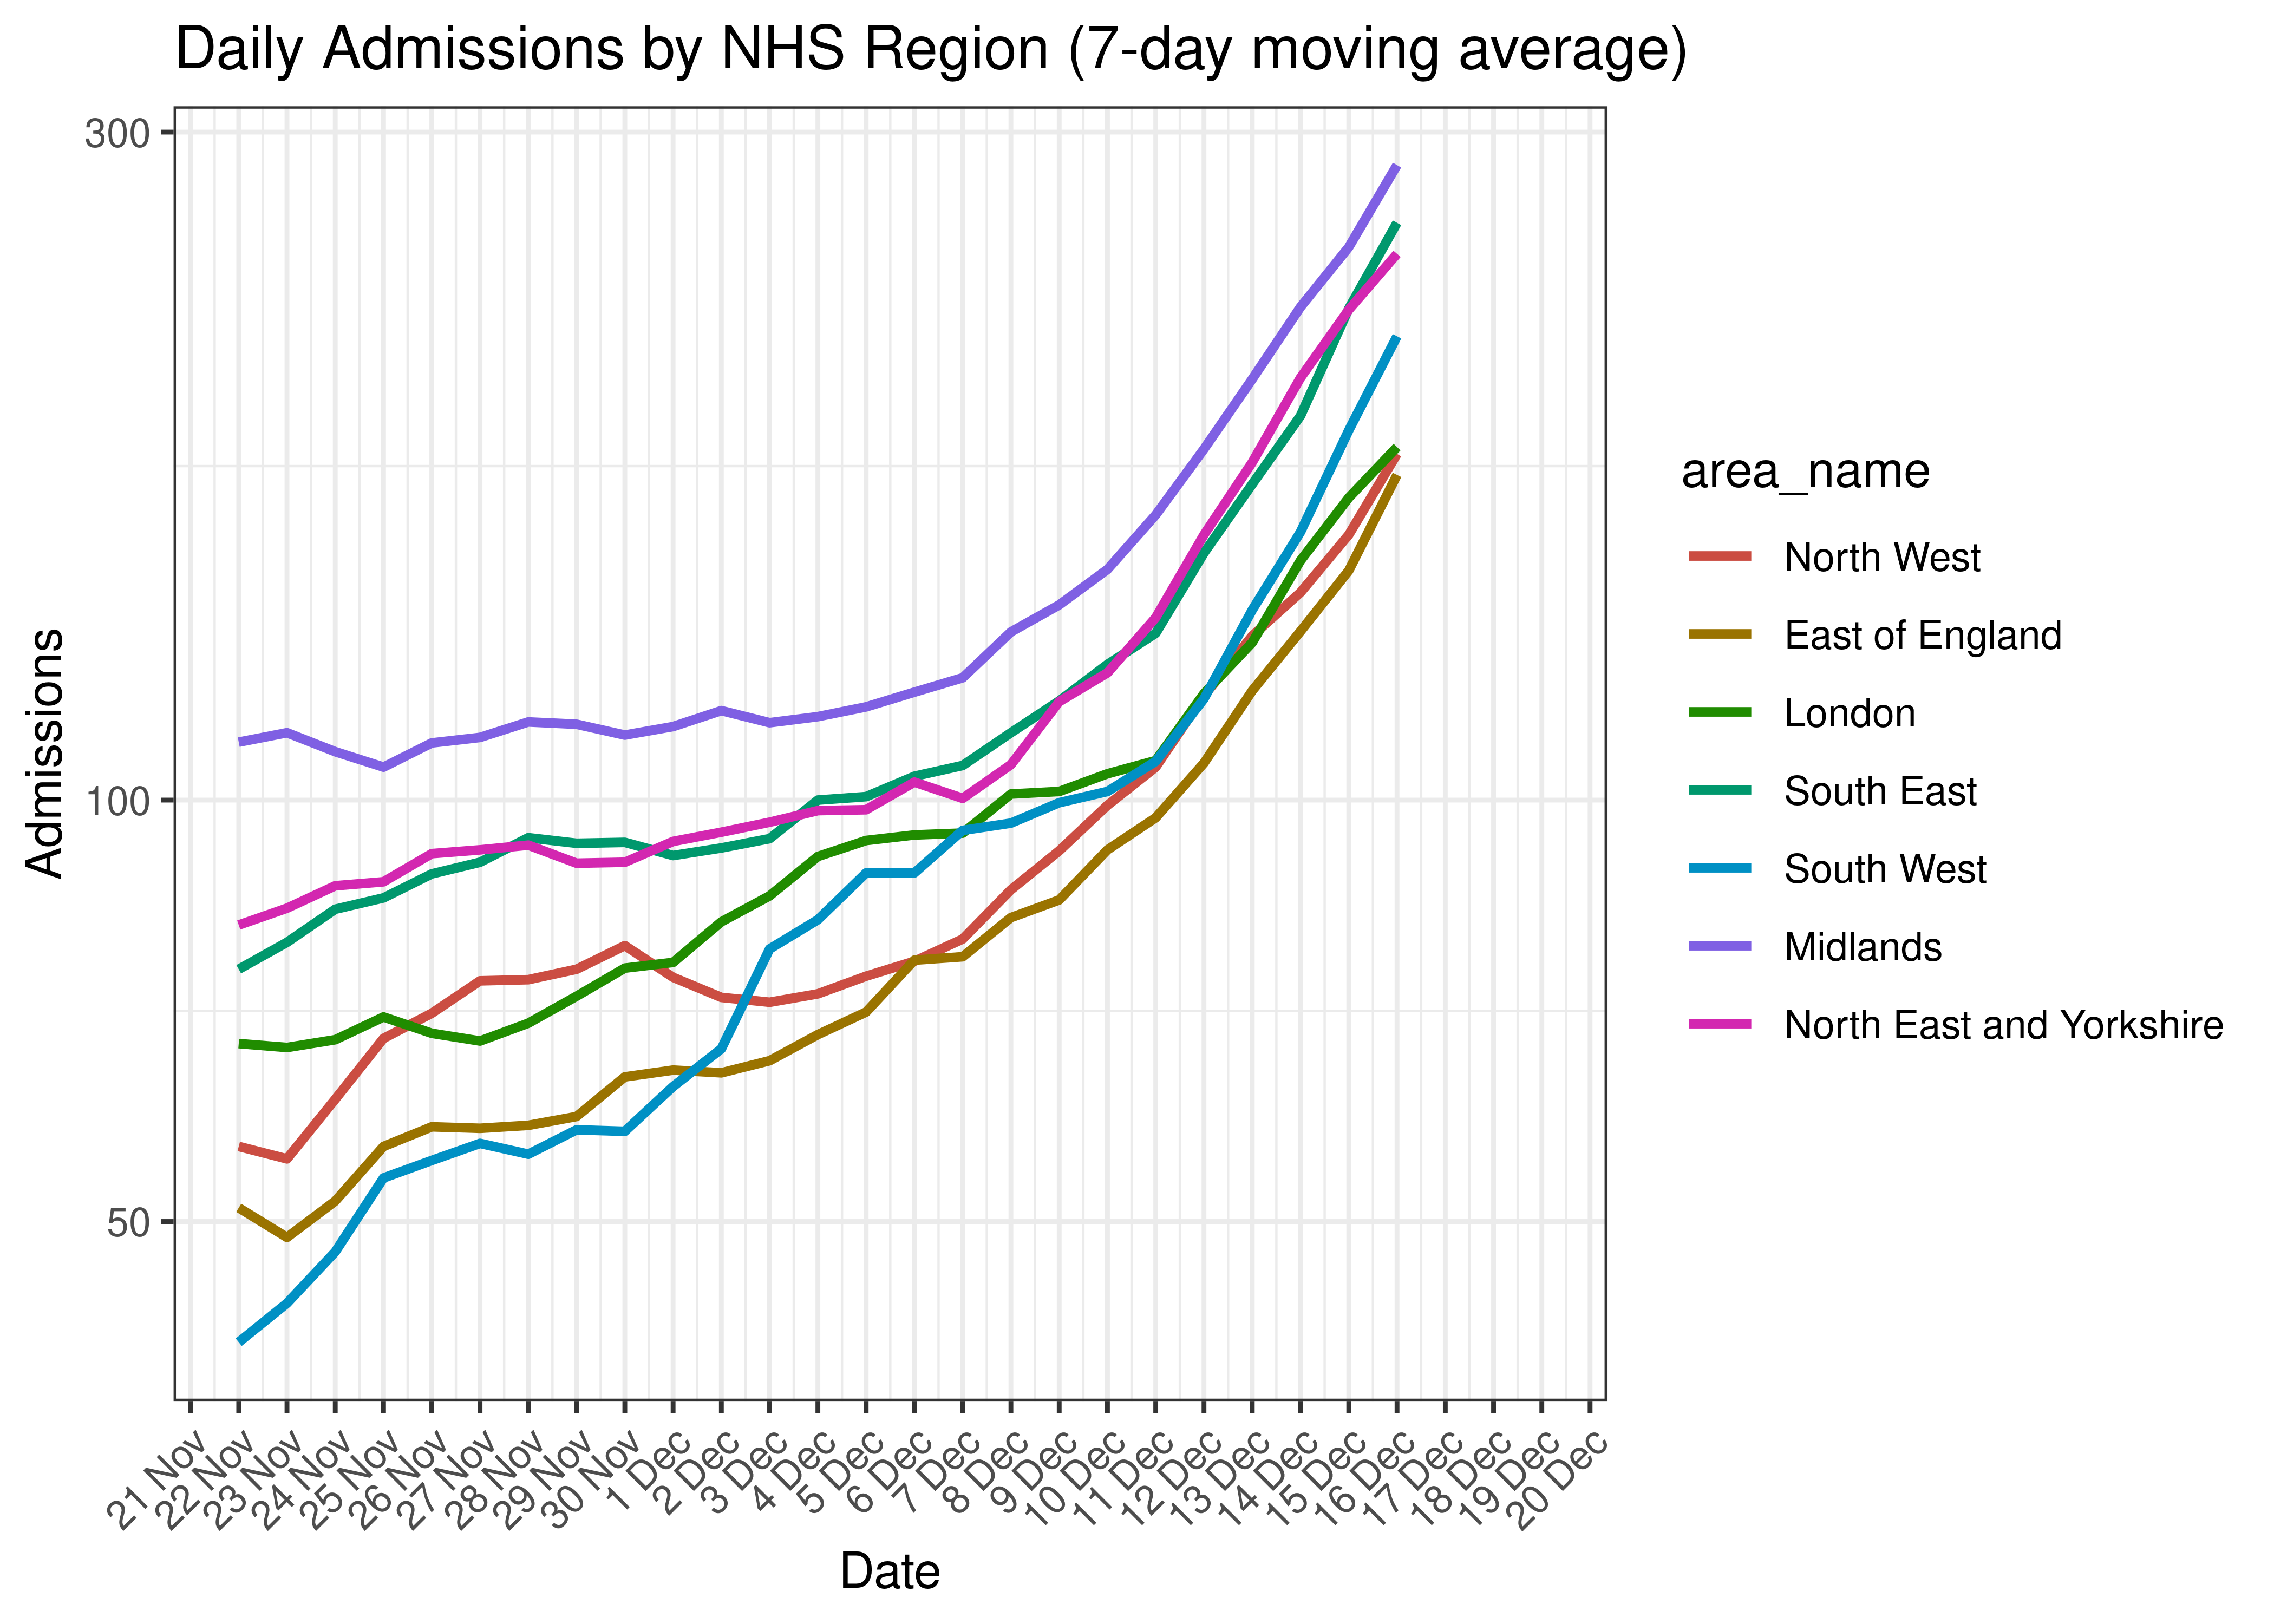
Daily Admissions by NHS Region for Last 30-days (7-day moving average)
7.2 Current reproduction number estimates by Region
Below current (last weekly) reproduction number estimates are tabulated.
| Region | Estimate Type | Daily Count (Last Week) | Week Ending | Reproduction Number [95% Confidence Interval] |
|---|---|---|---|---|
| Northern Ireland | admissions | 23 | 2022-12-15 | 1.63 [1.35 - 1.93] |
| Scotland | admissions | 53 | 2022-09-11 | 0.89 [0.81 - 0.99] |
| Wales | admissions | 20 | 2022-12-20 | 1.45 [1.21 - 1.72] |
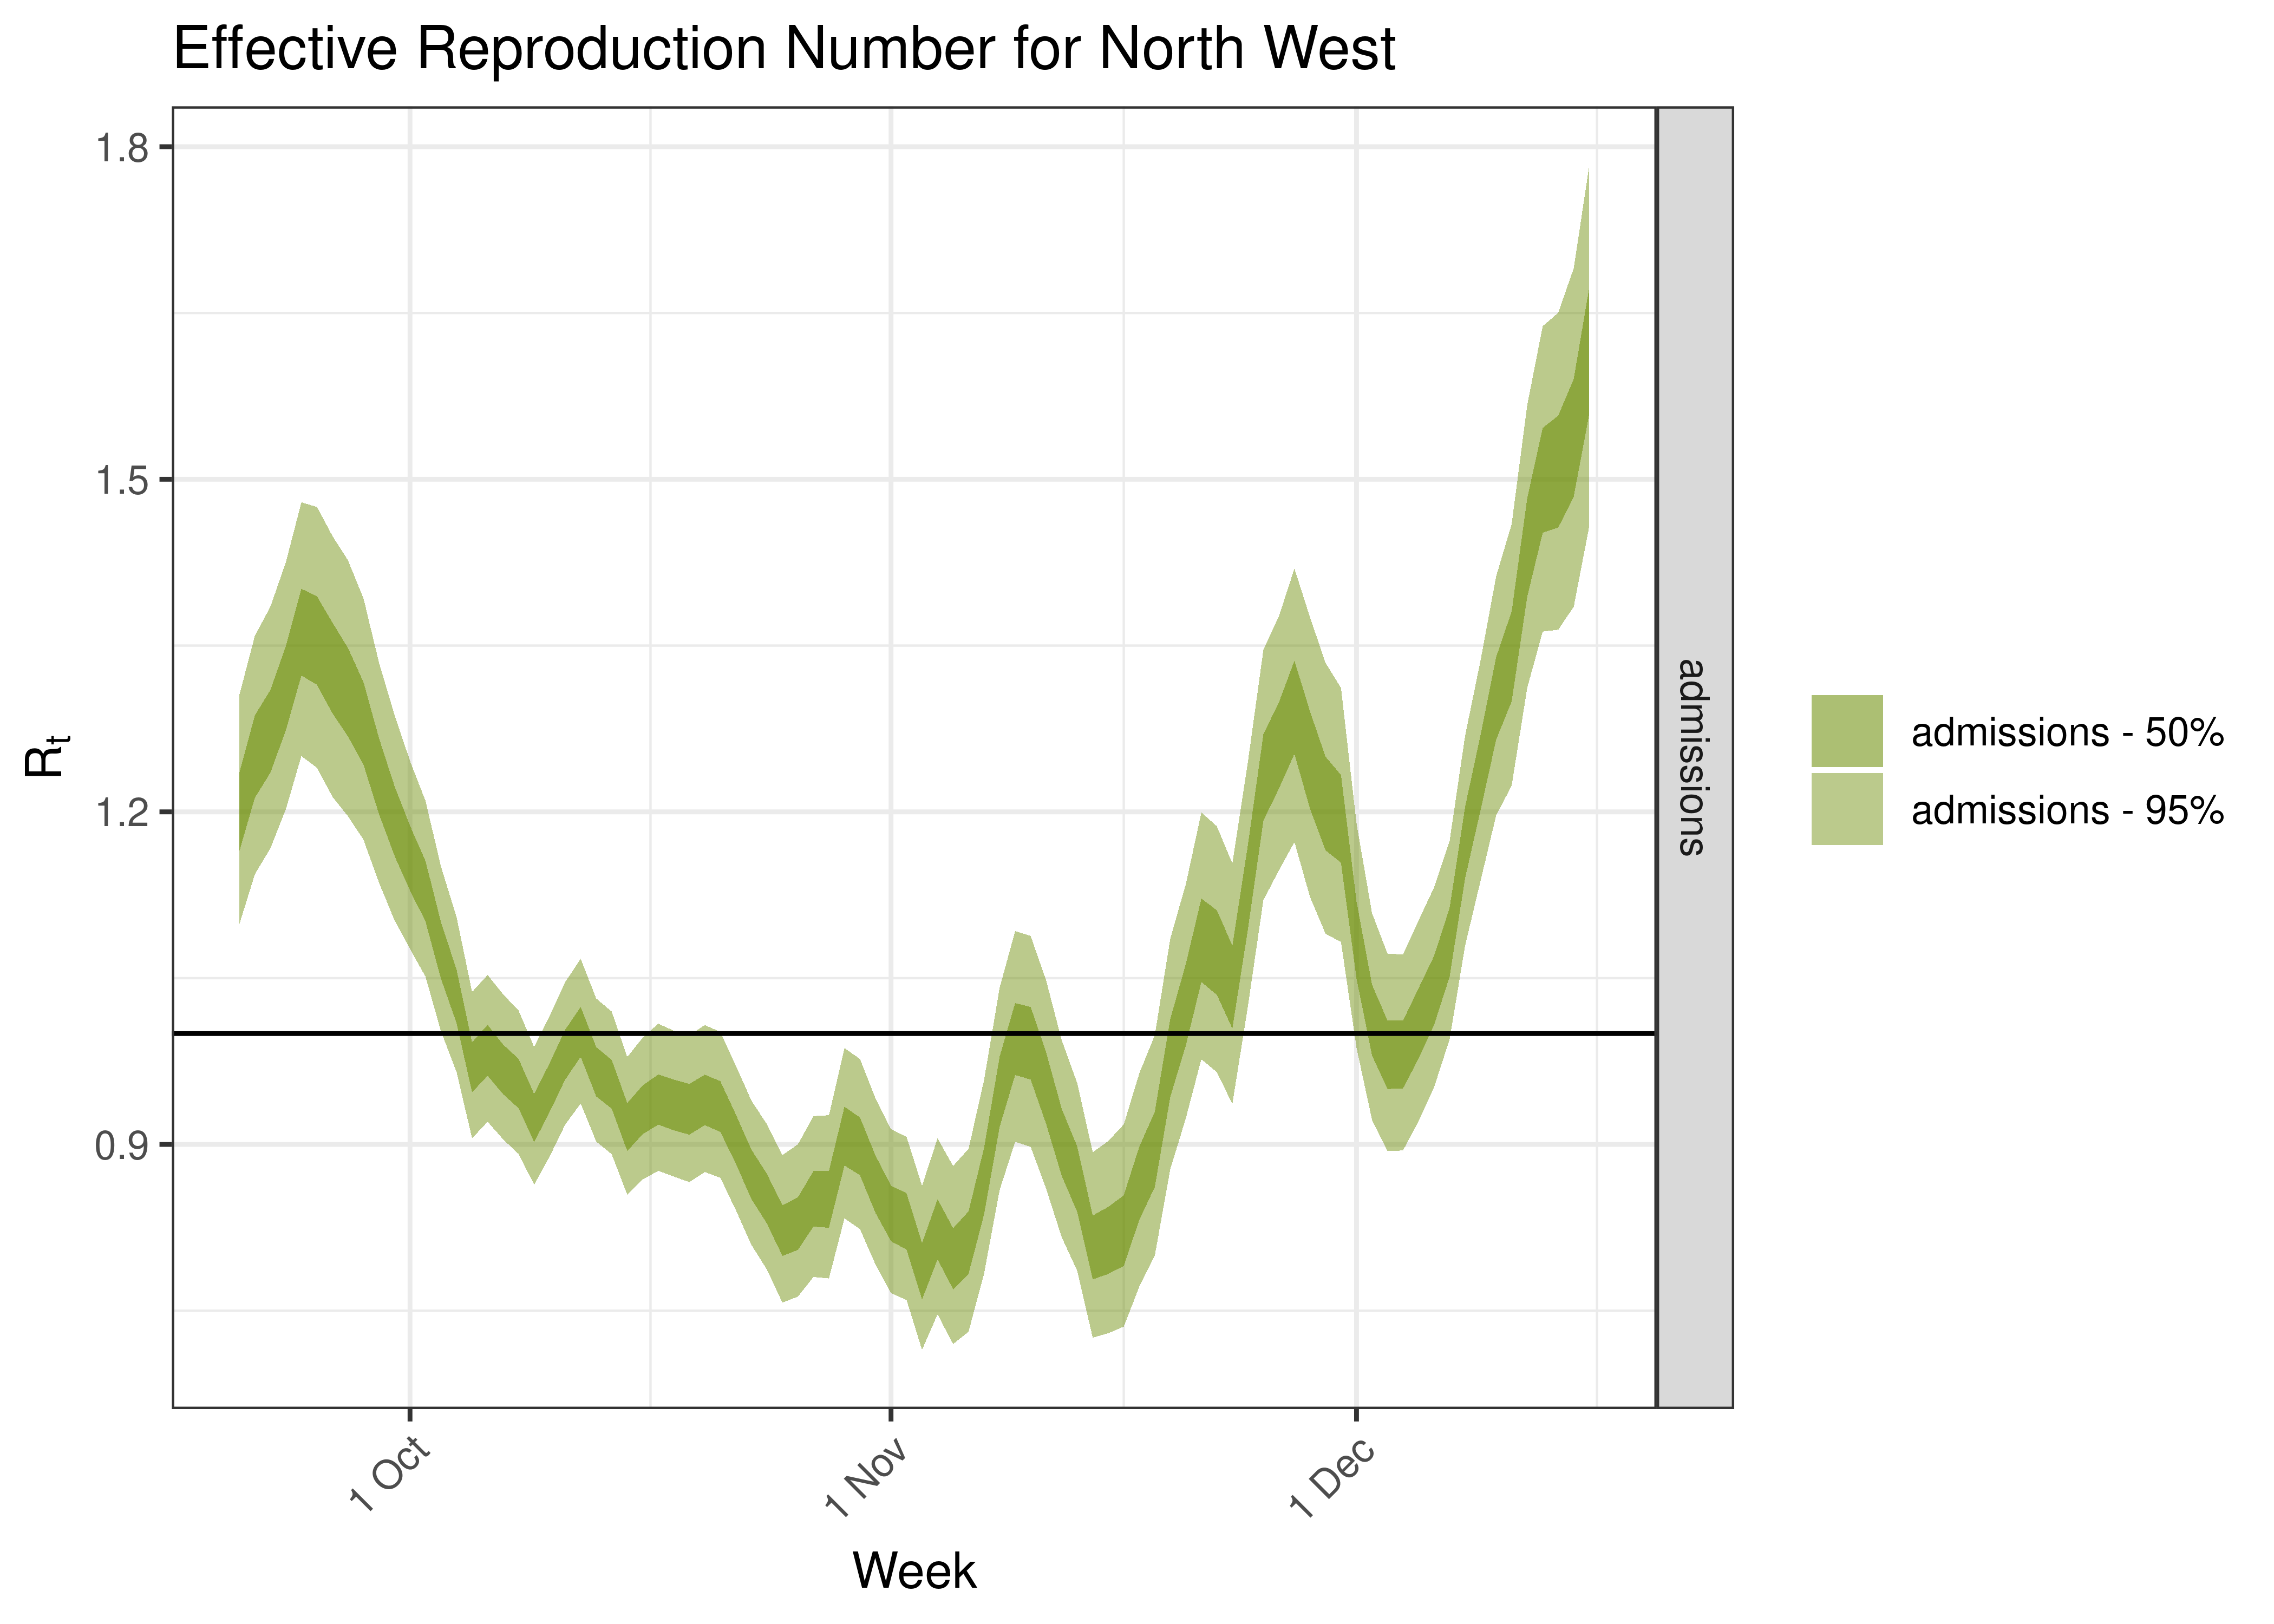
| North West | admissions | 177 | 2022-12-19 | 1.62 [1.46 - 1.78] |
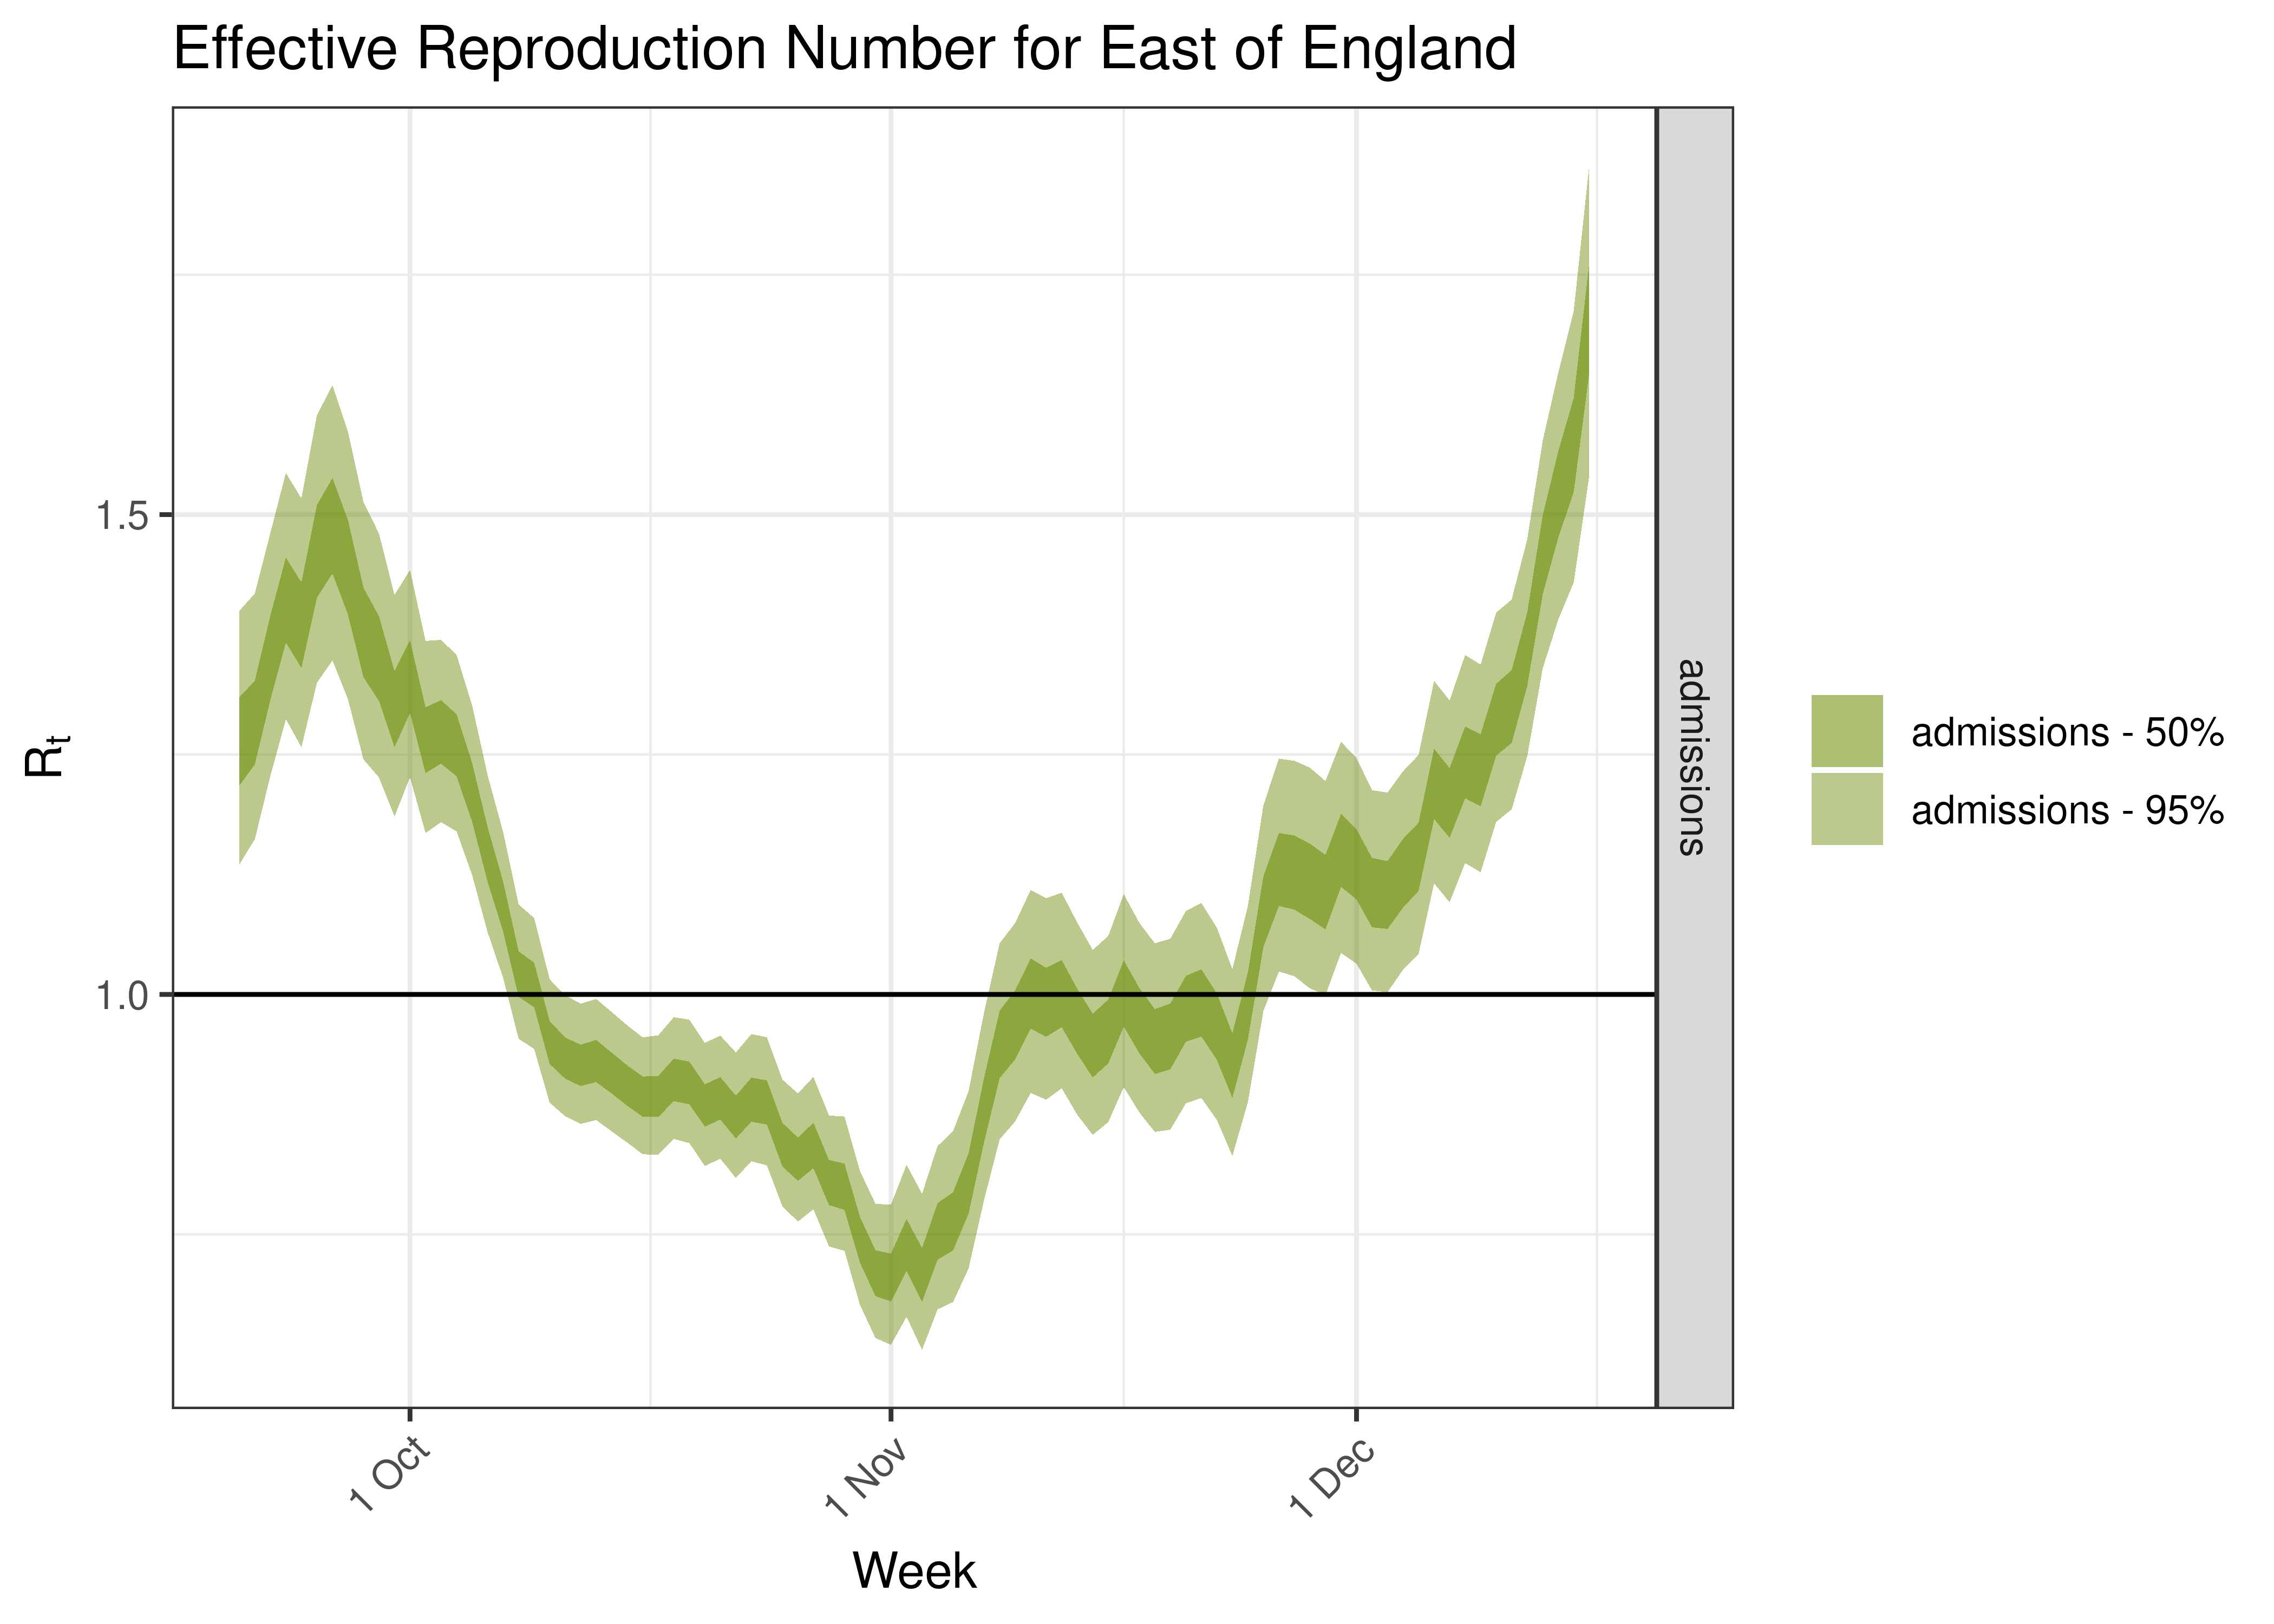
| East of England | admissions | 171 | 2022-12-19 | 1.70 [1.54 - 1.86] |
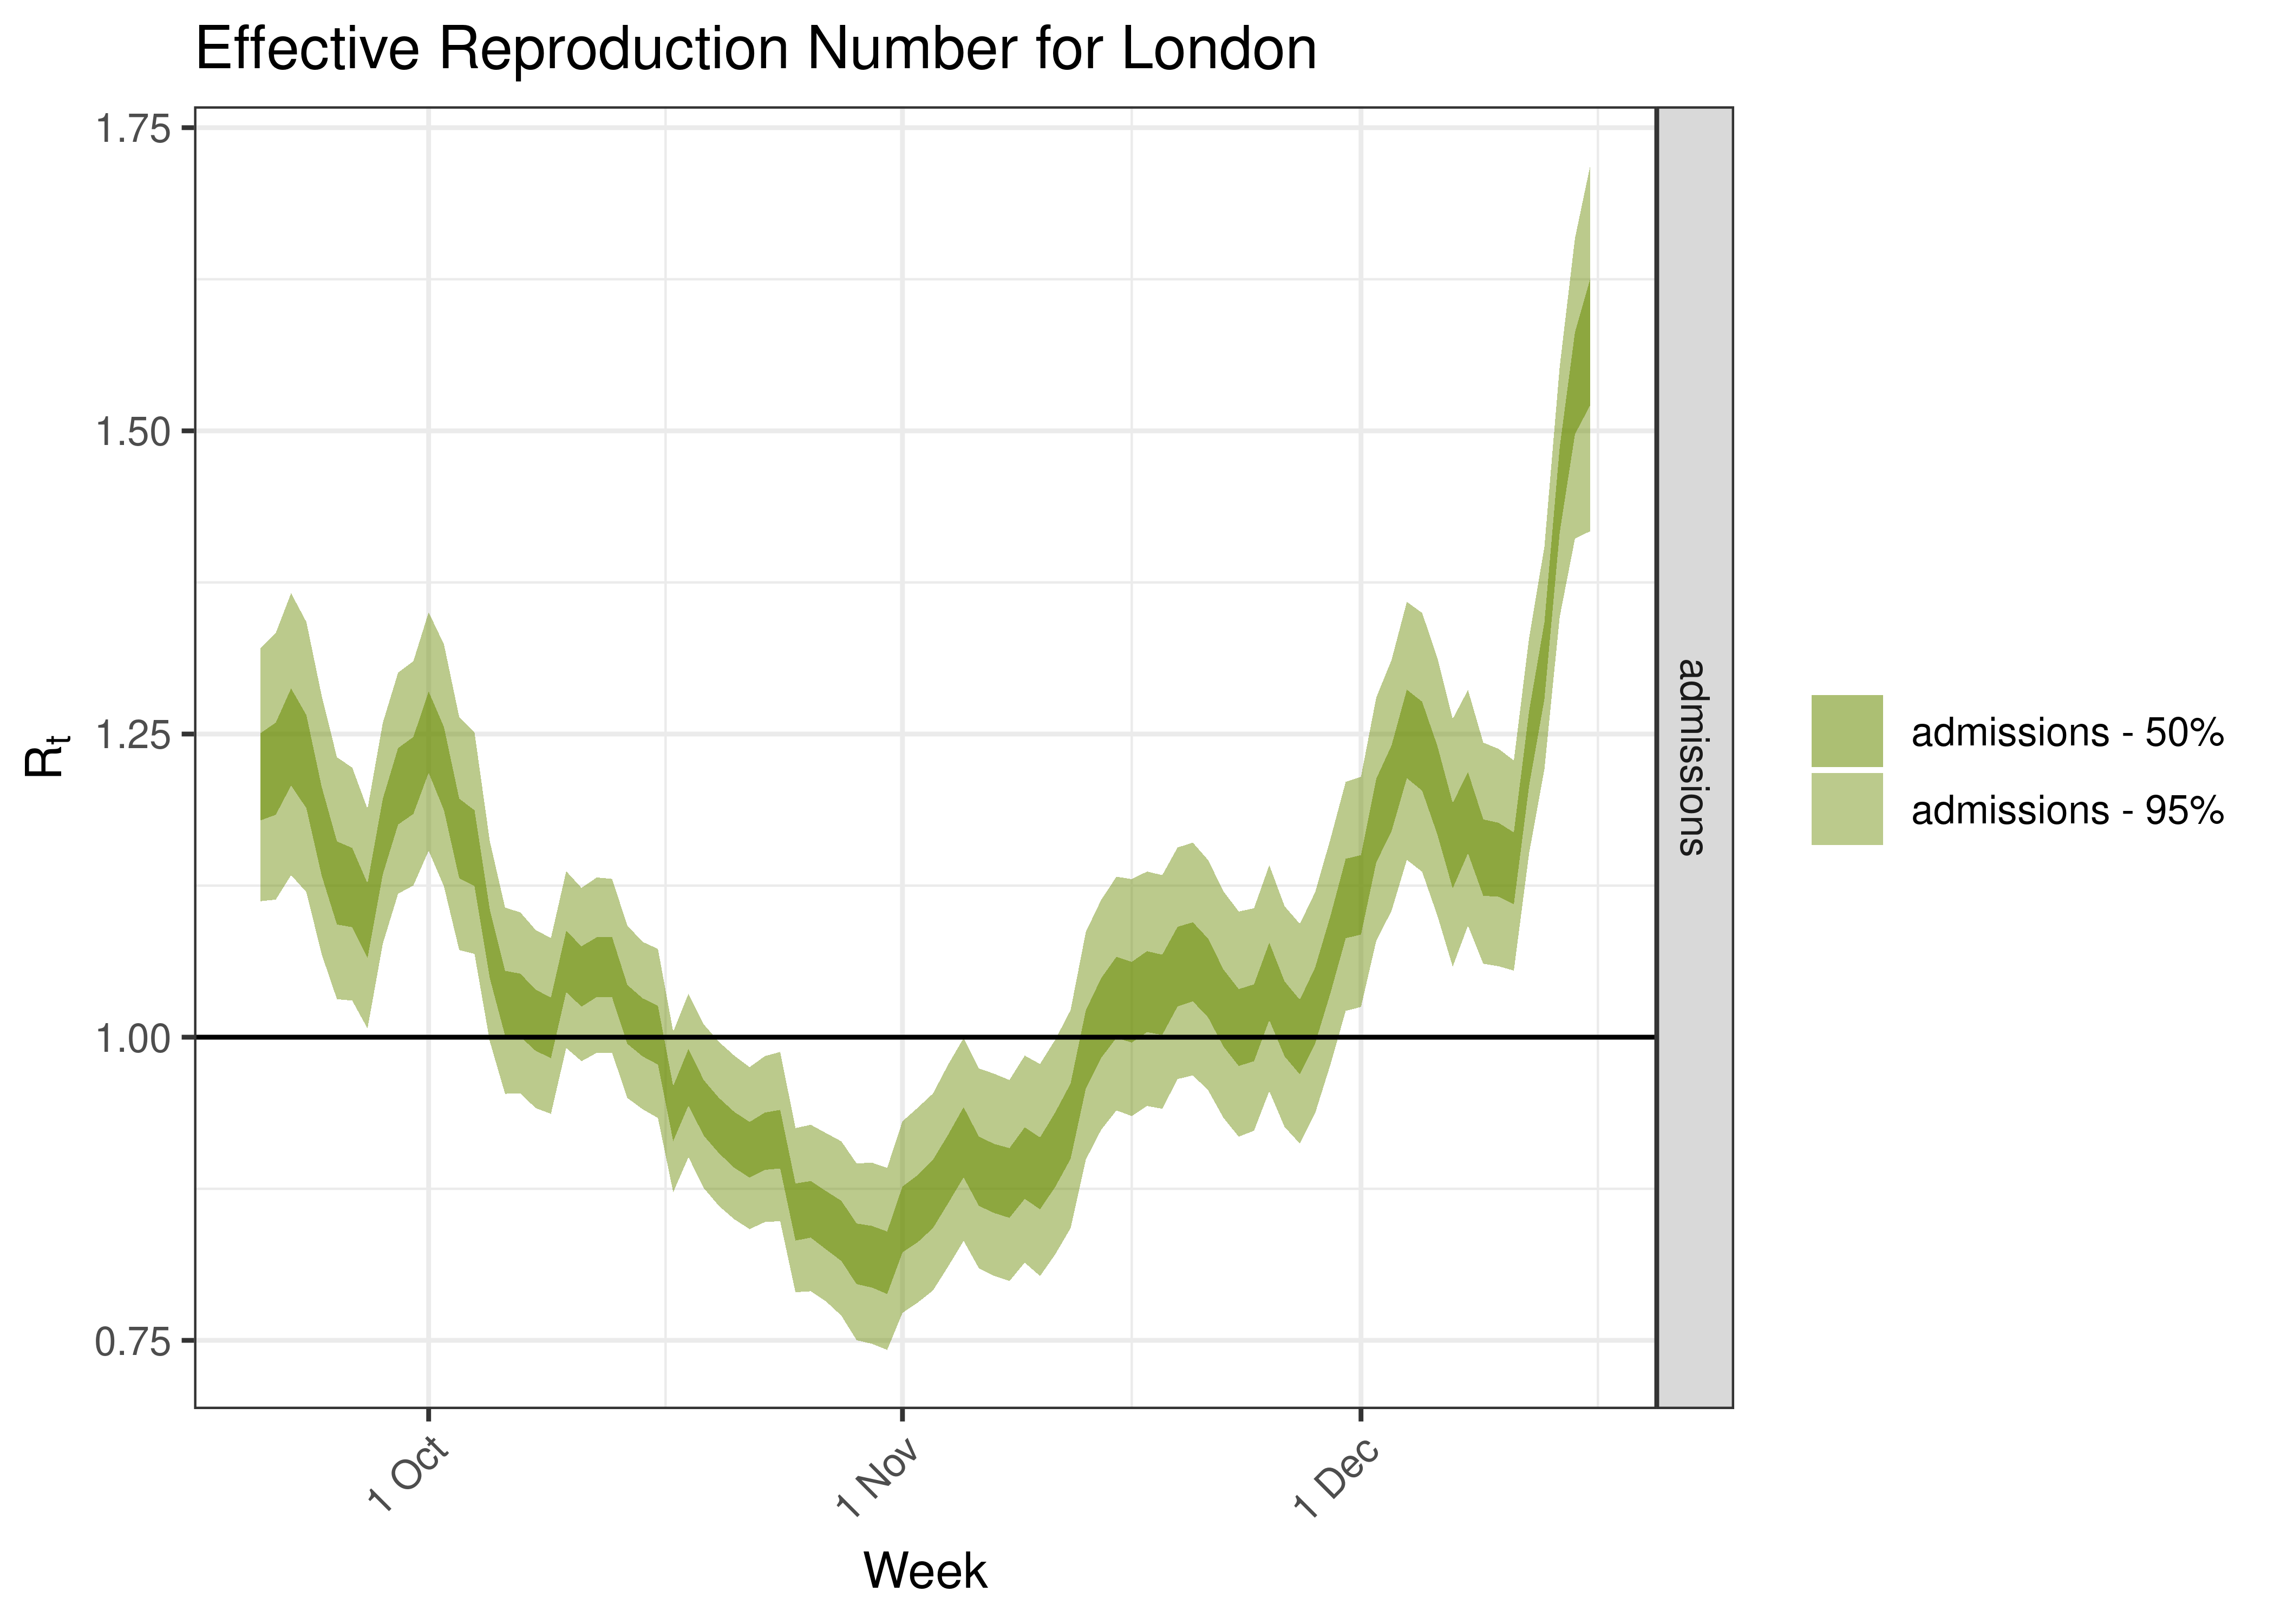
| London | admissions | 179 | 2022-12-19 | 1.57 [1.42 - 1.72] |
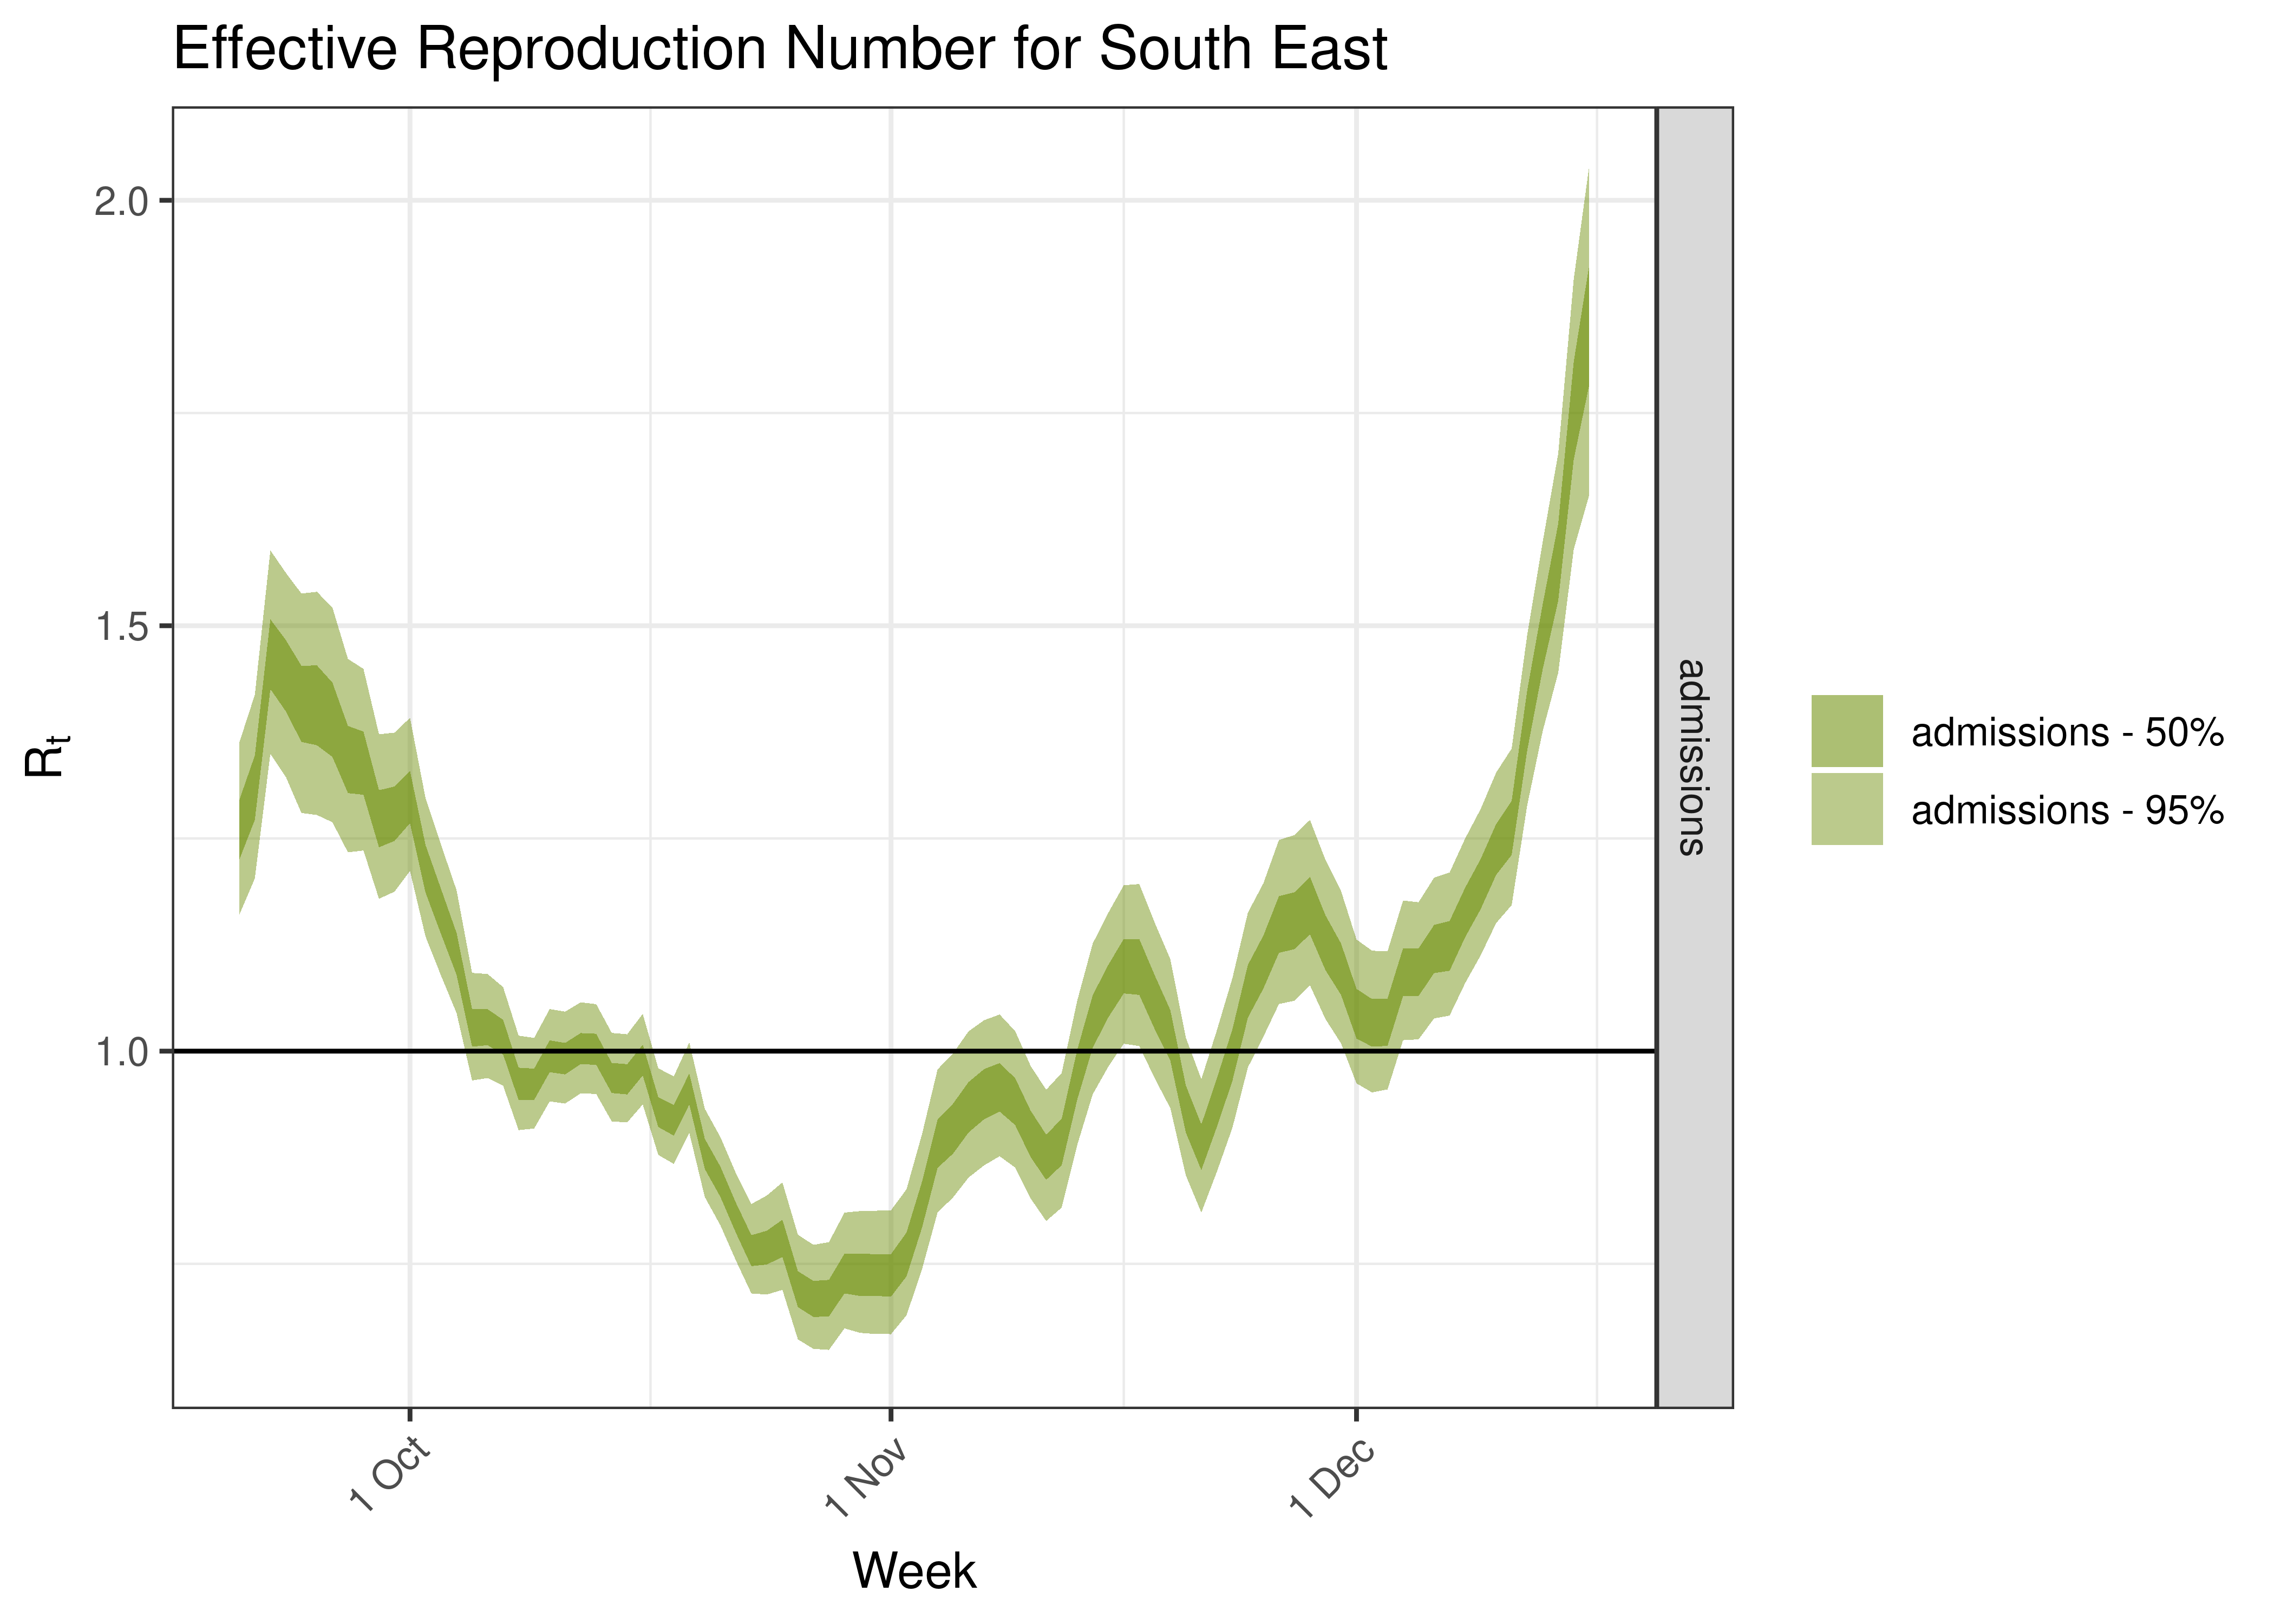
| South East | admissions | 258 | 2022-12-19 | 1.85 [1.65 - 2.04] |
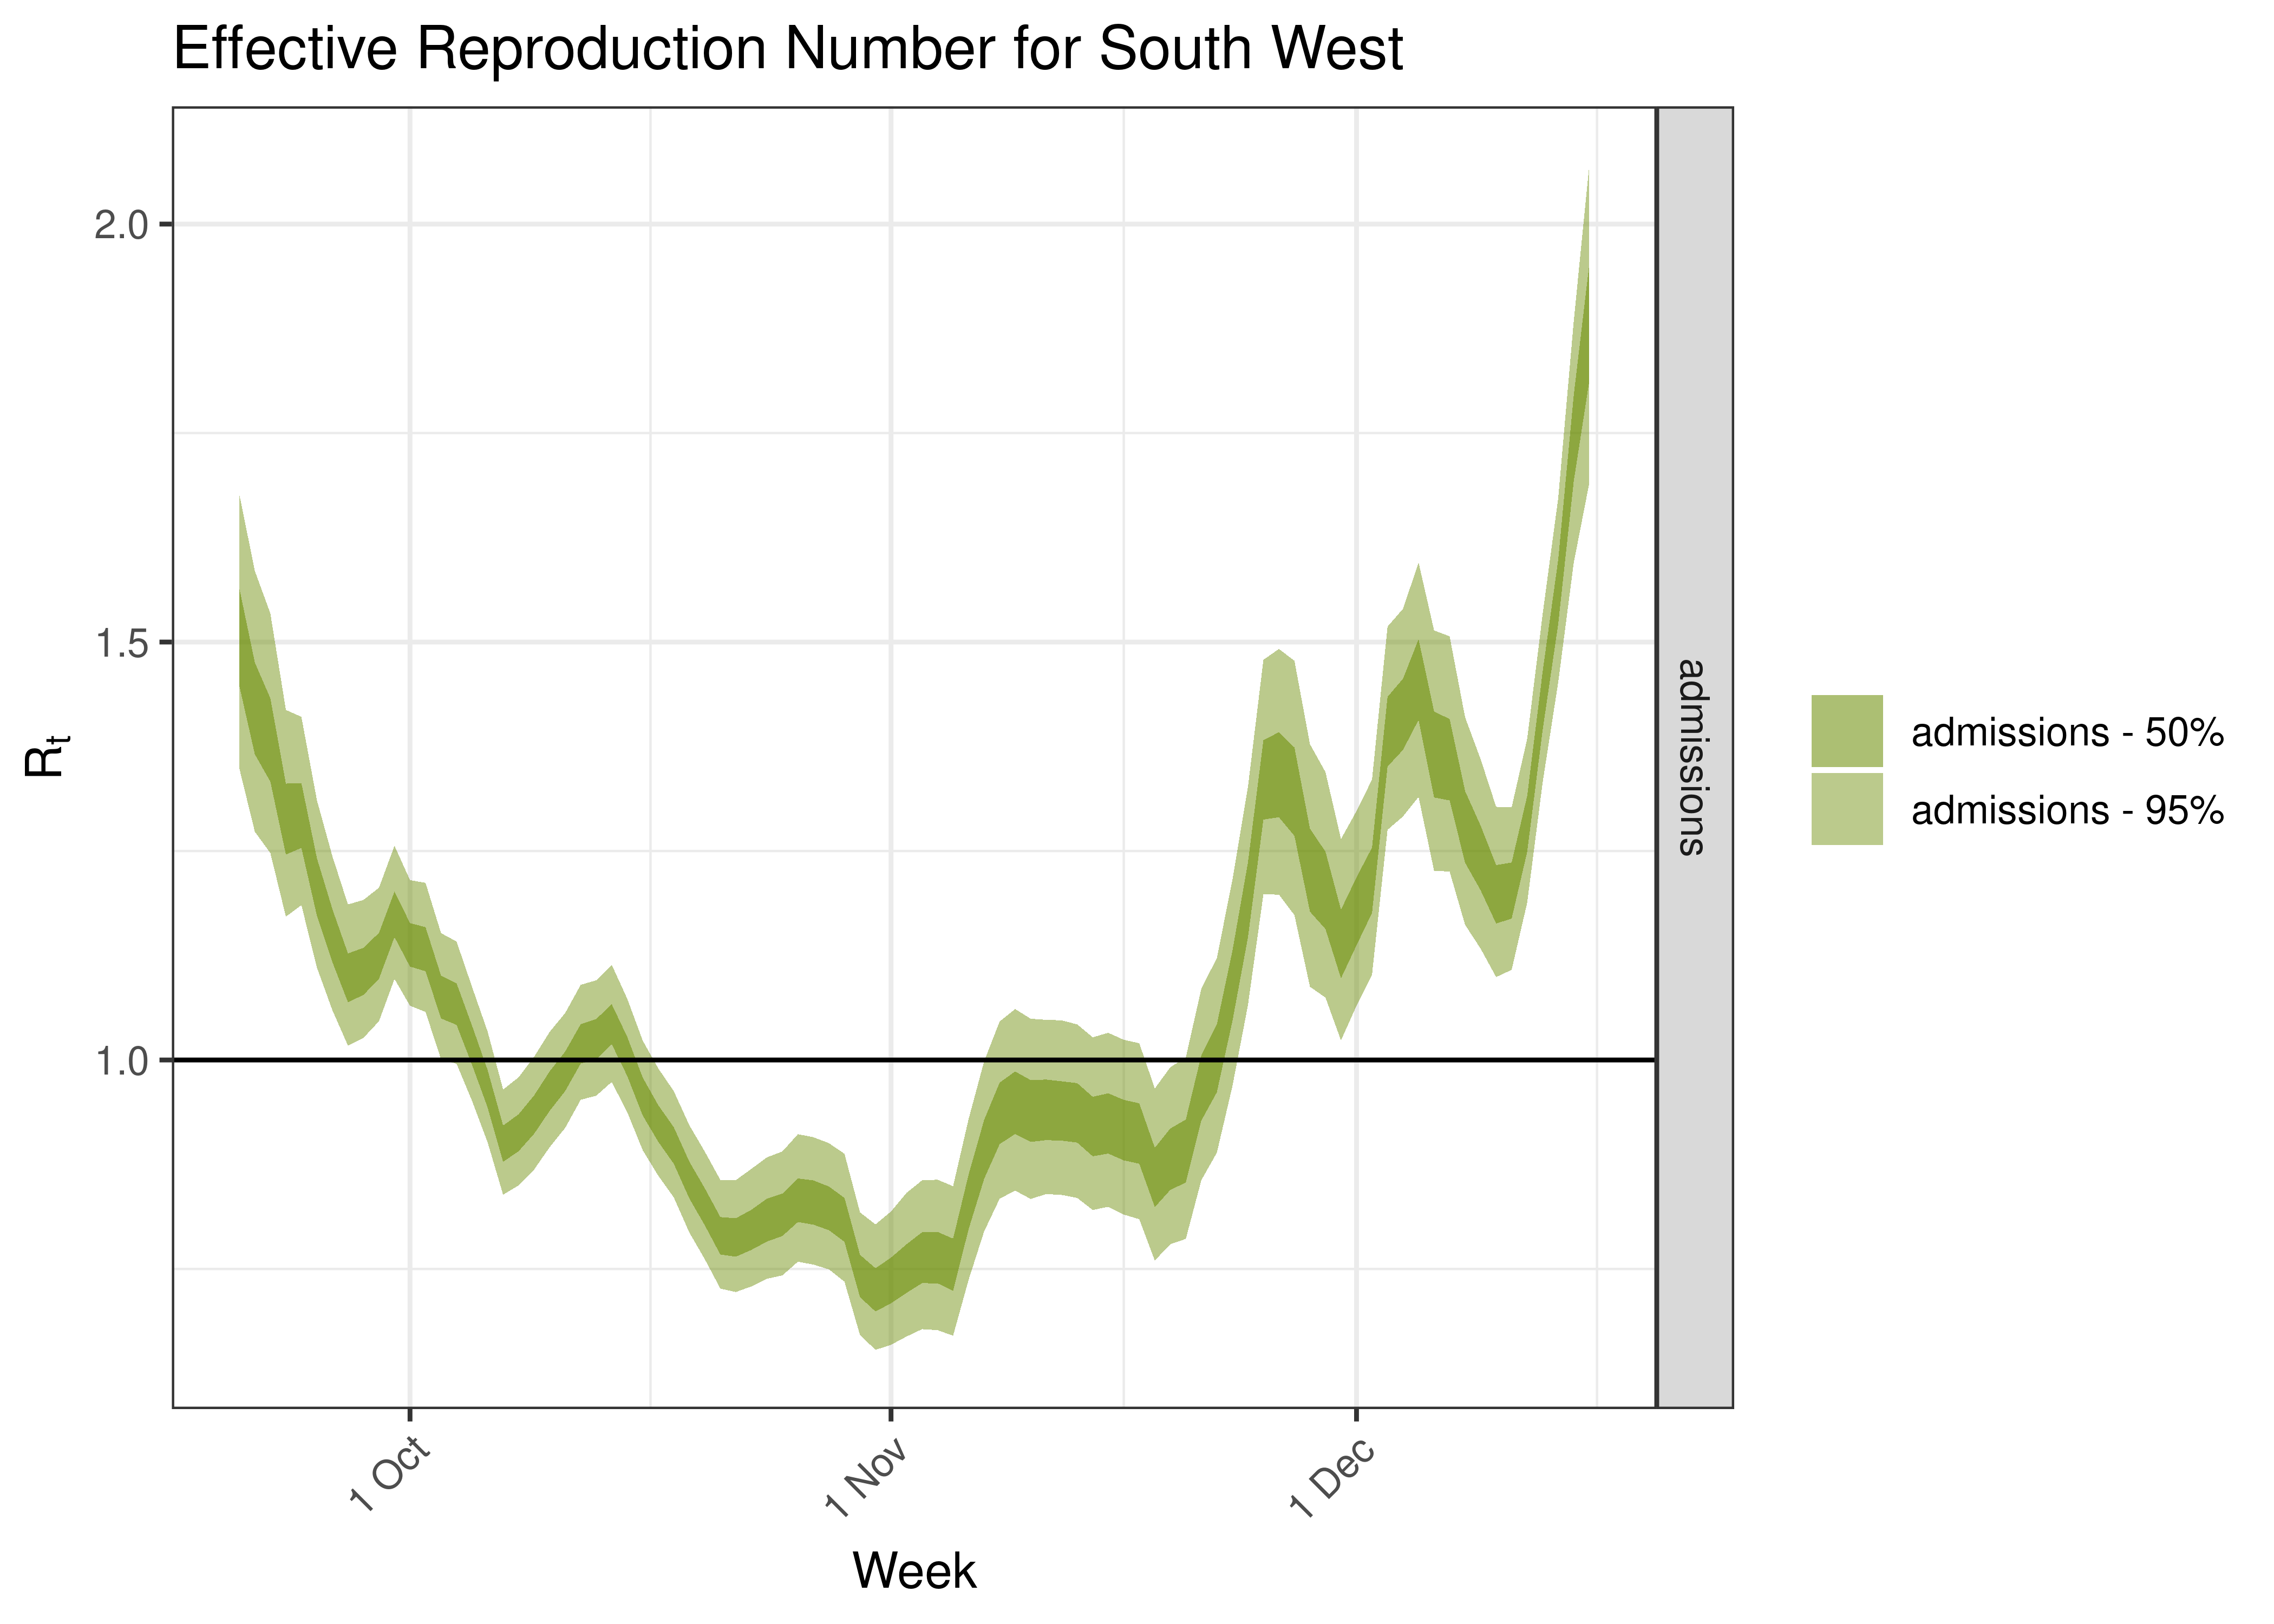
| South West | admissions | 214 | 2022-12-19 | 1.88 [1.69 - 2.07] |
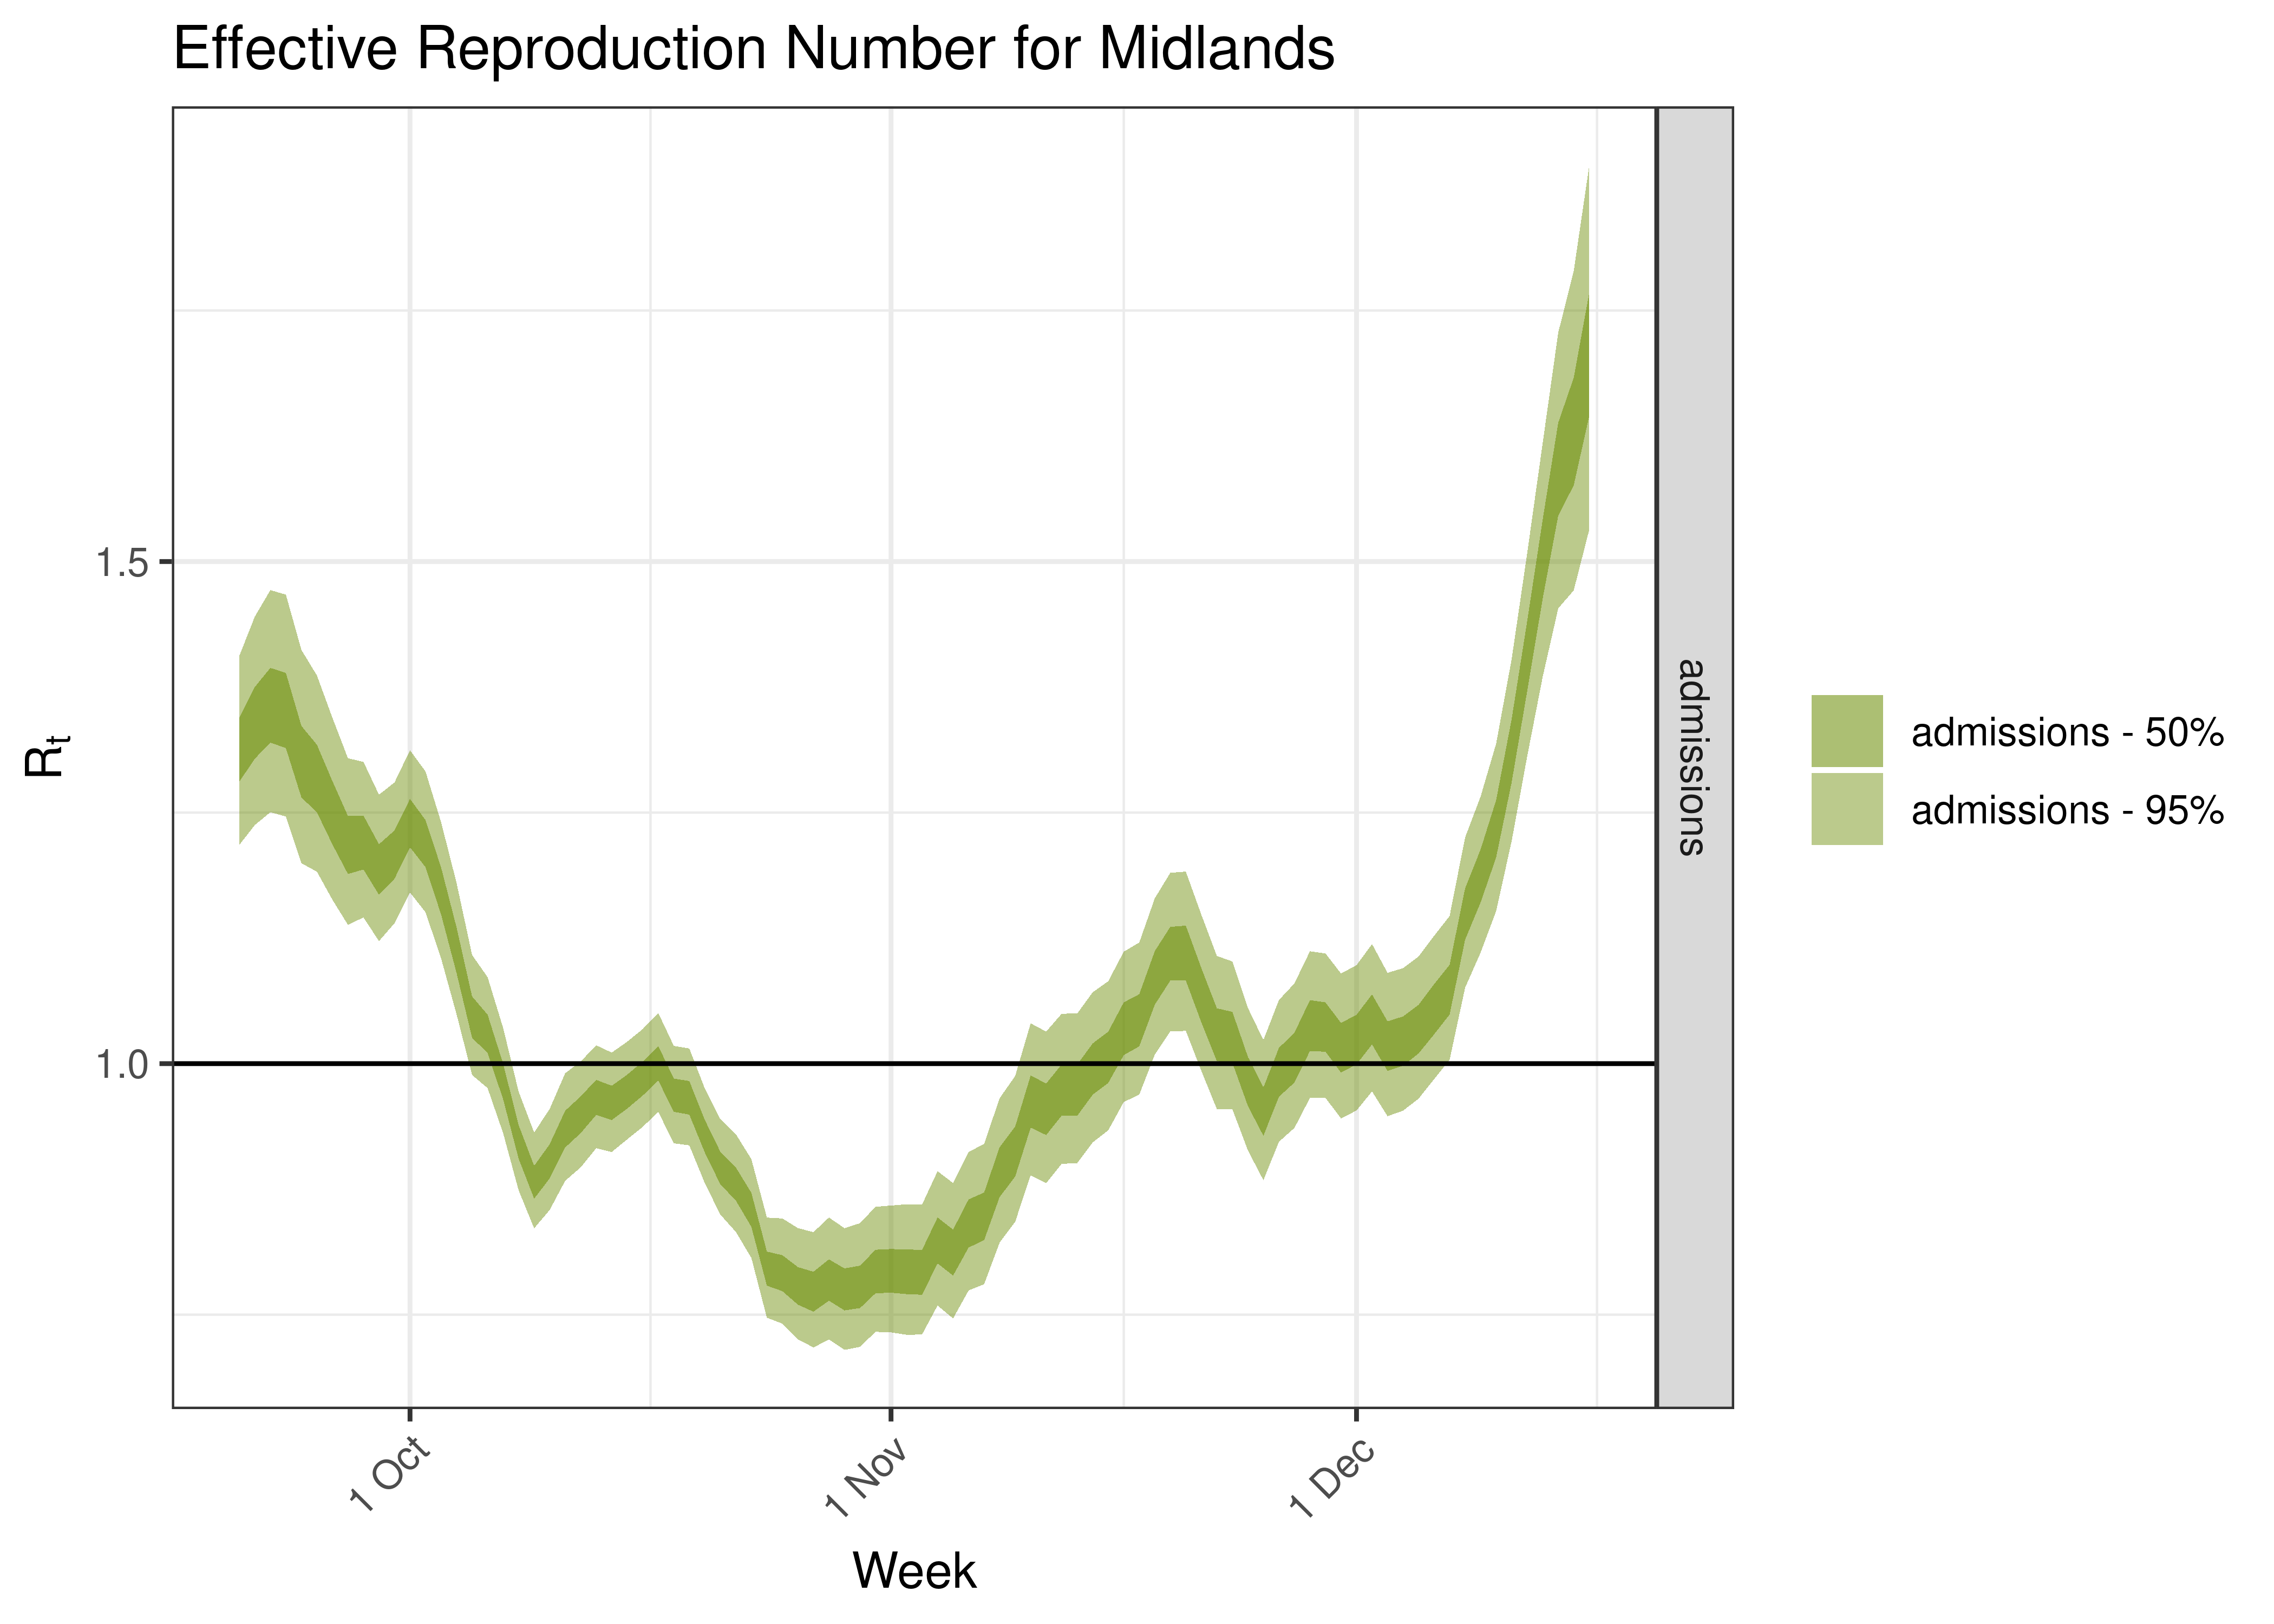
| Midlands | admissions | 284 | 2022-12-19 | 1.71 [1.53 - 1.89] |
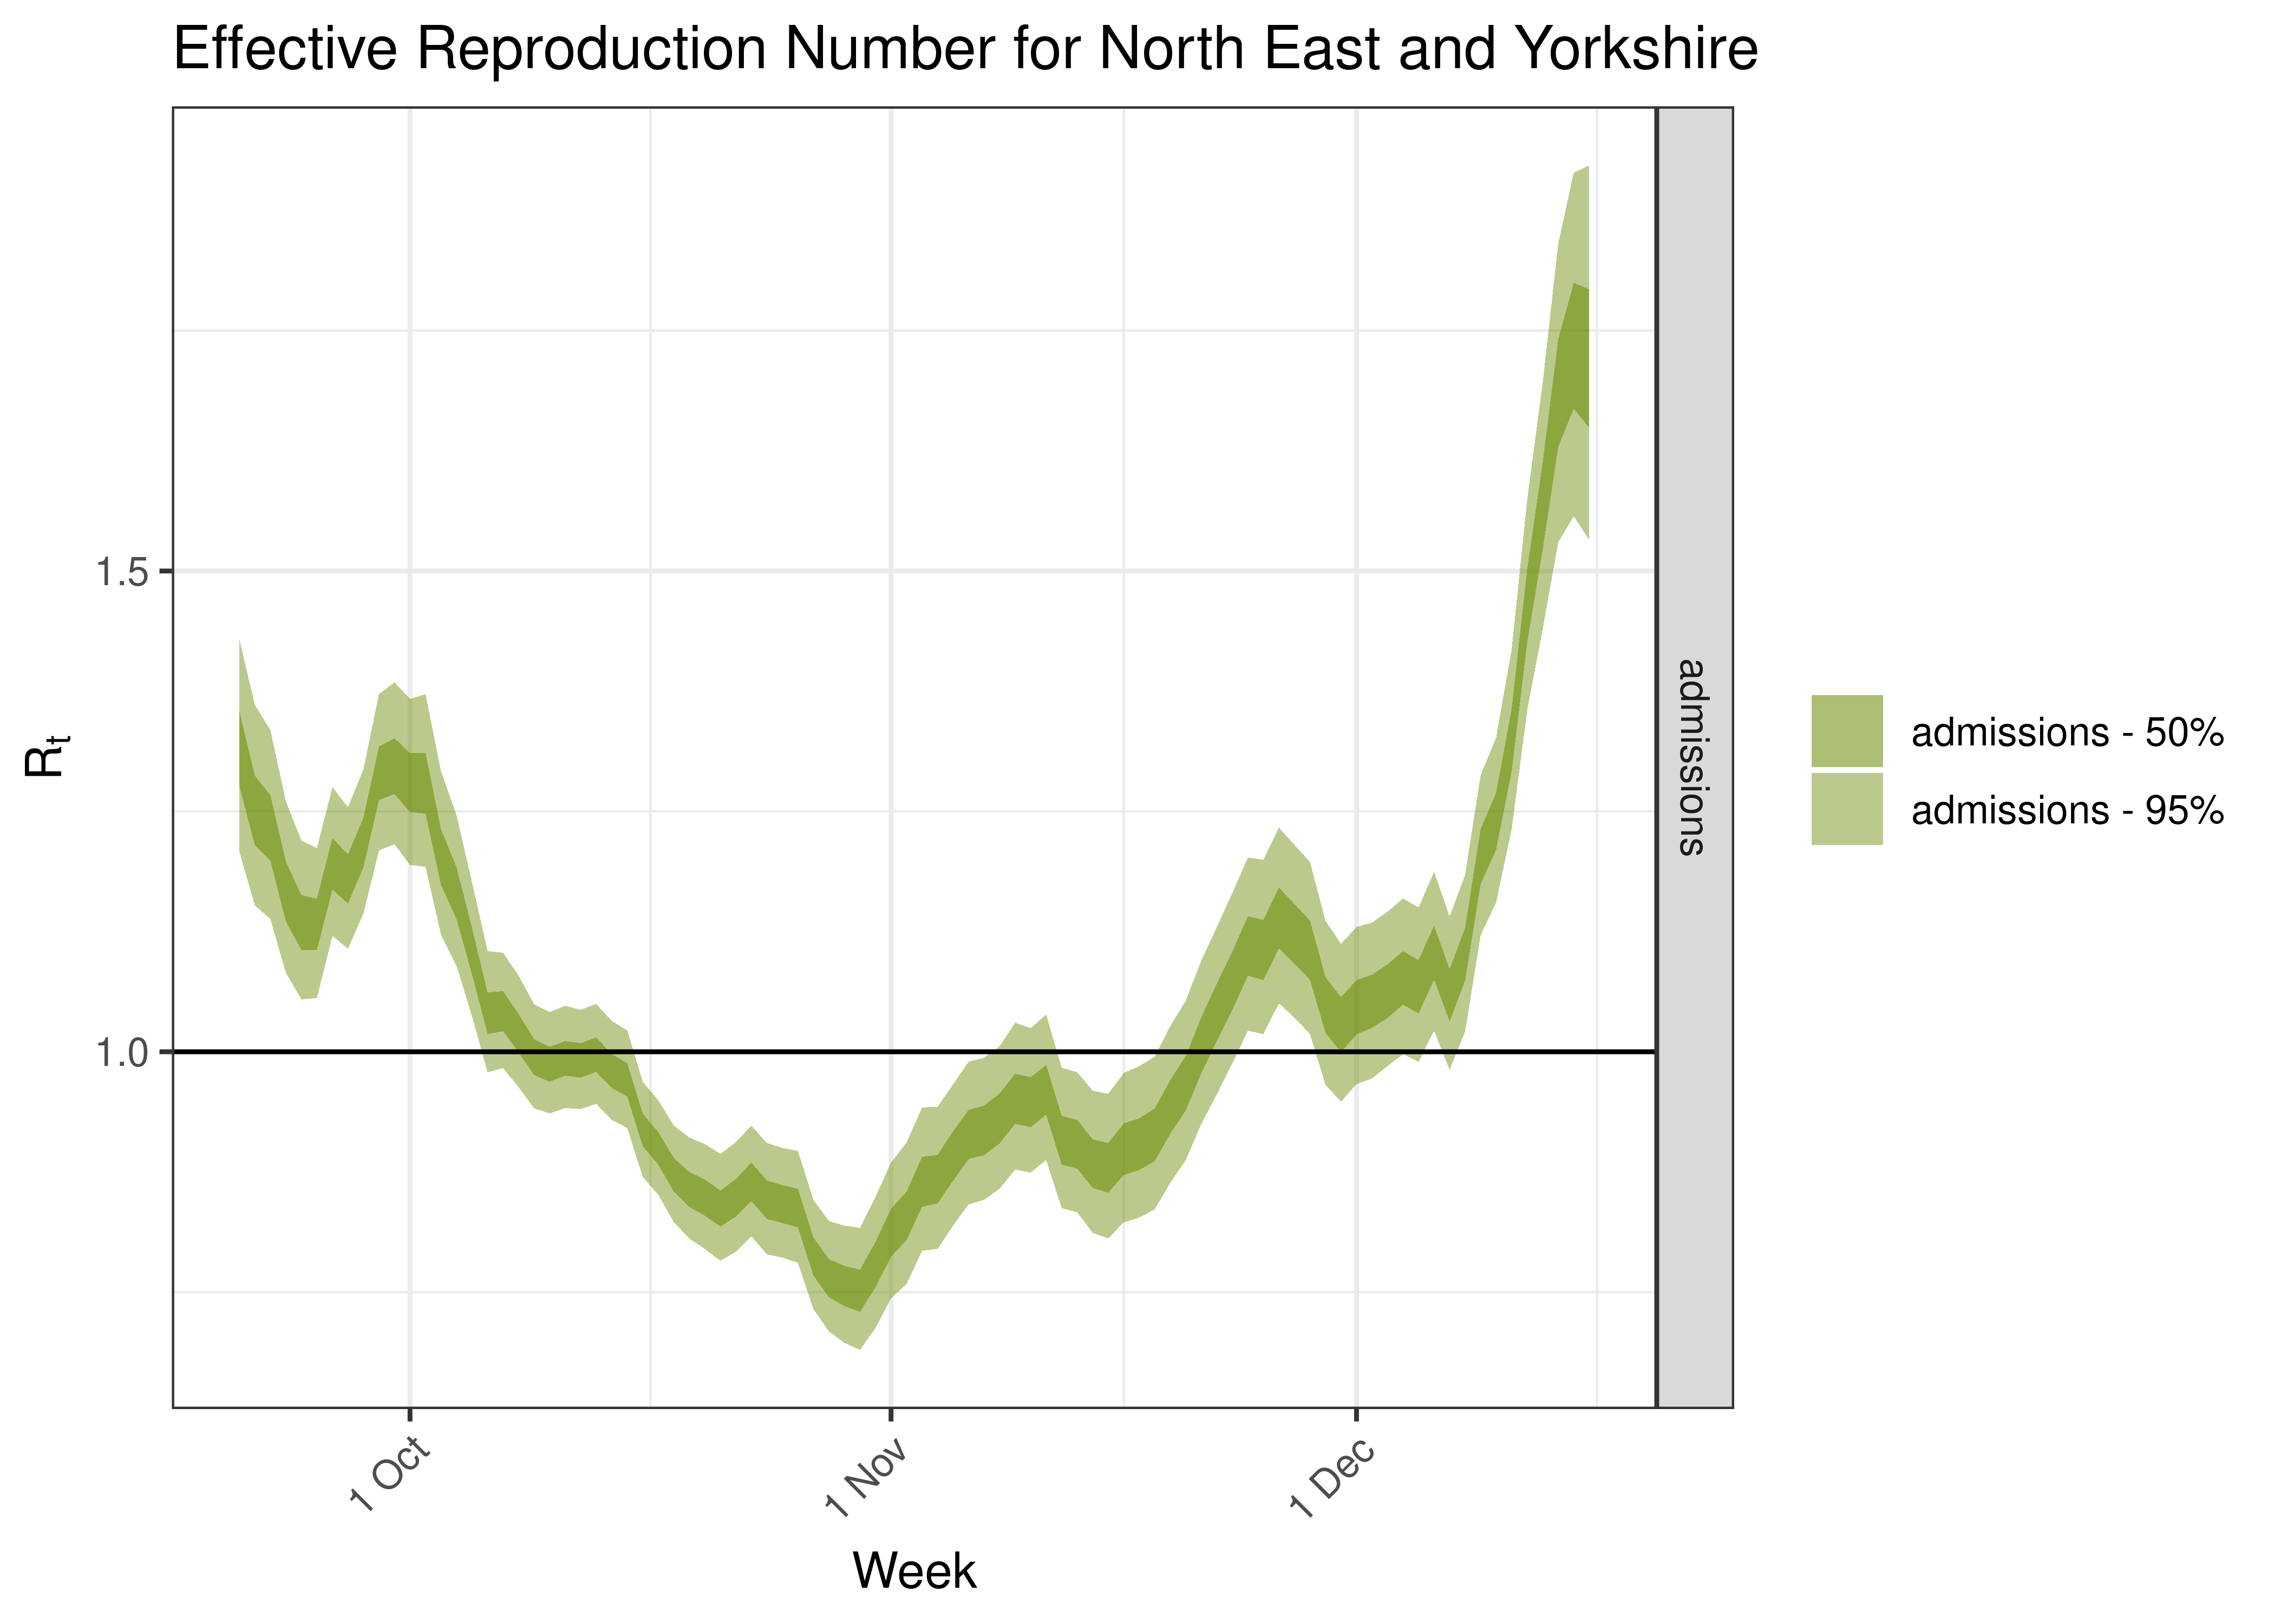
| North East and Yorkshire | admissions | 246 | 2022-12-19 | 1.72 [1.53 - 1.92] |
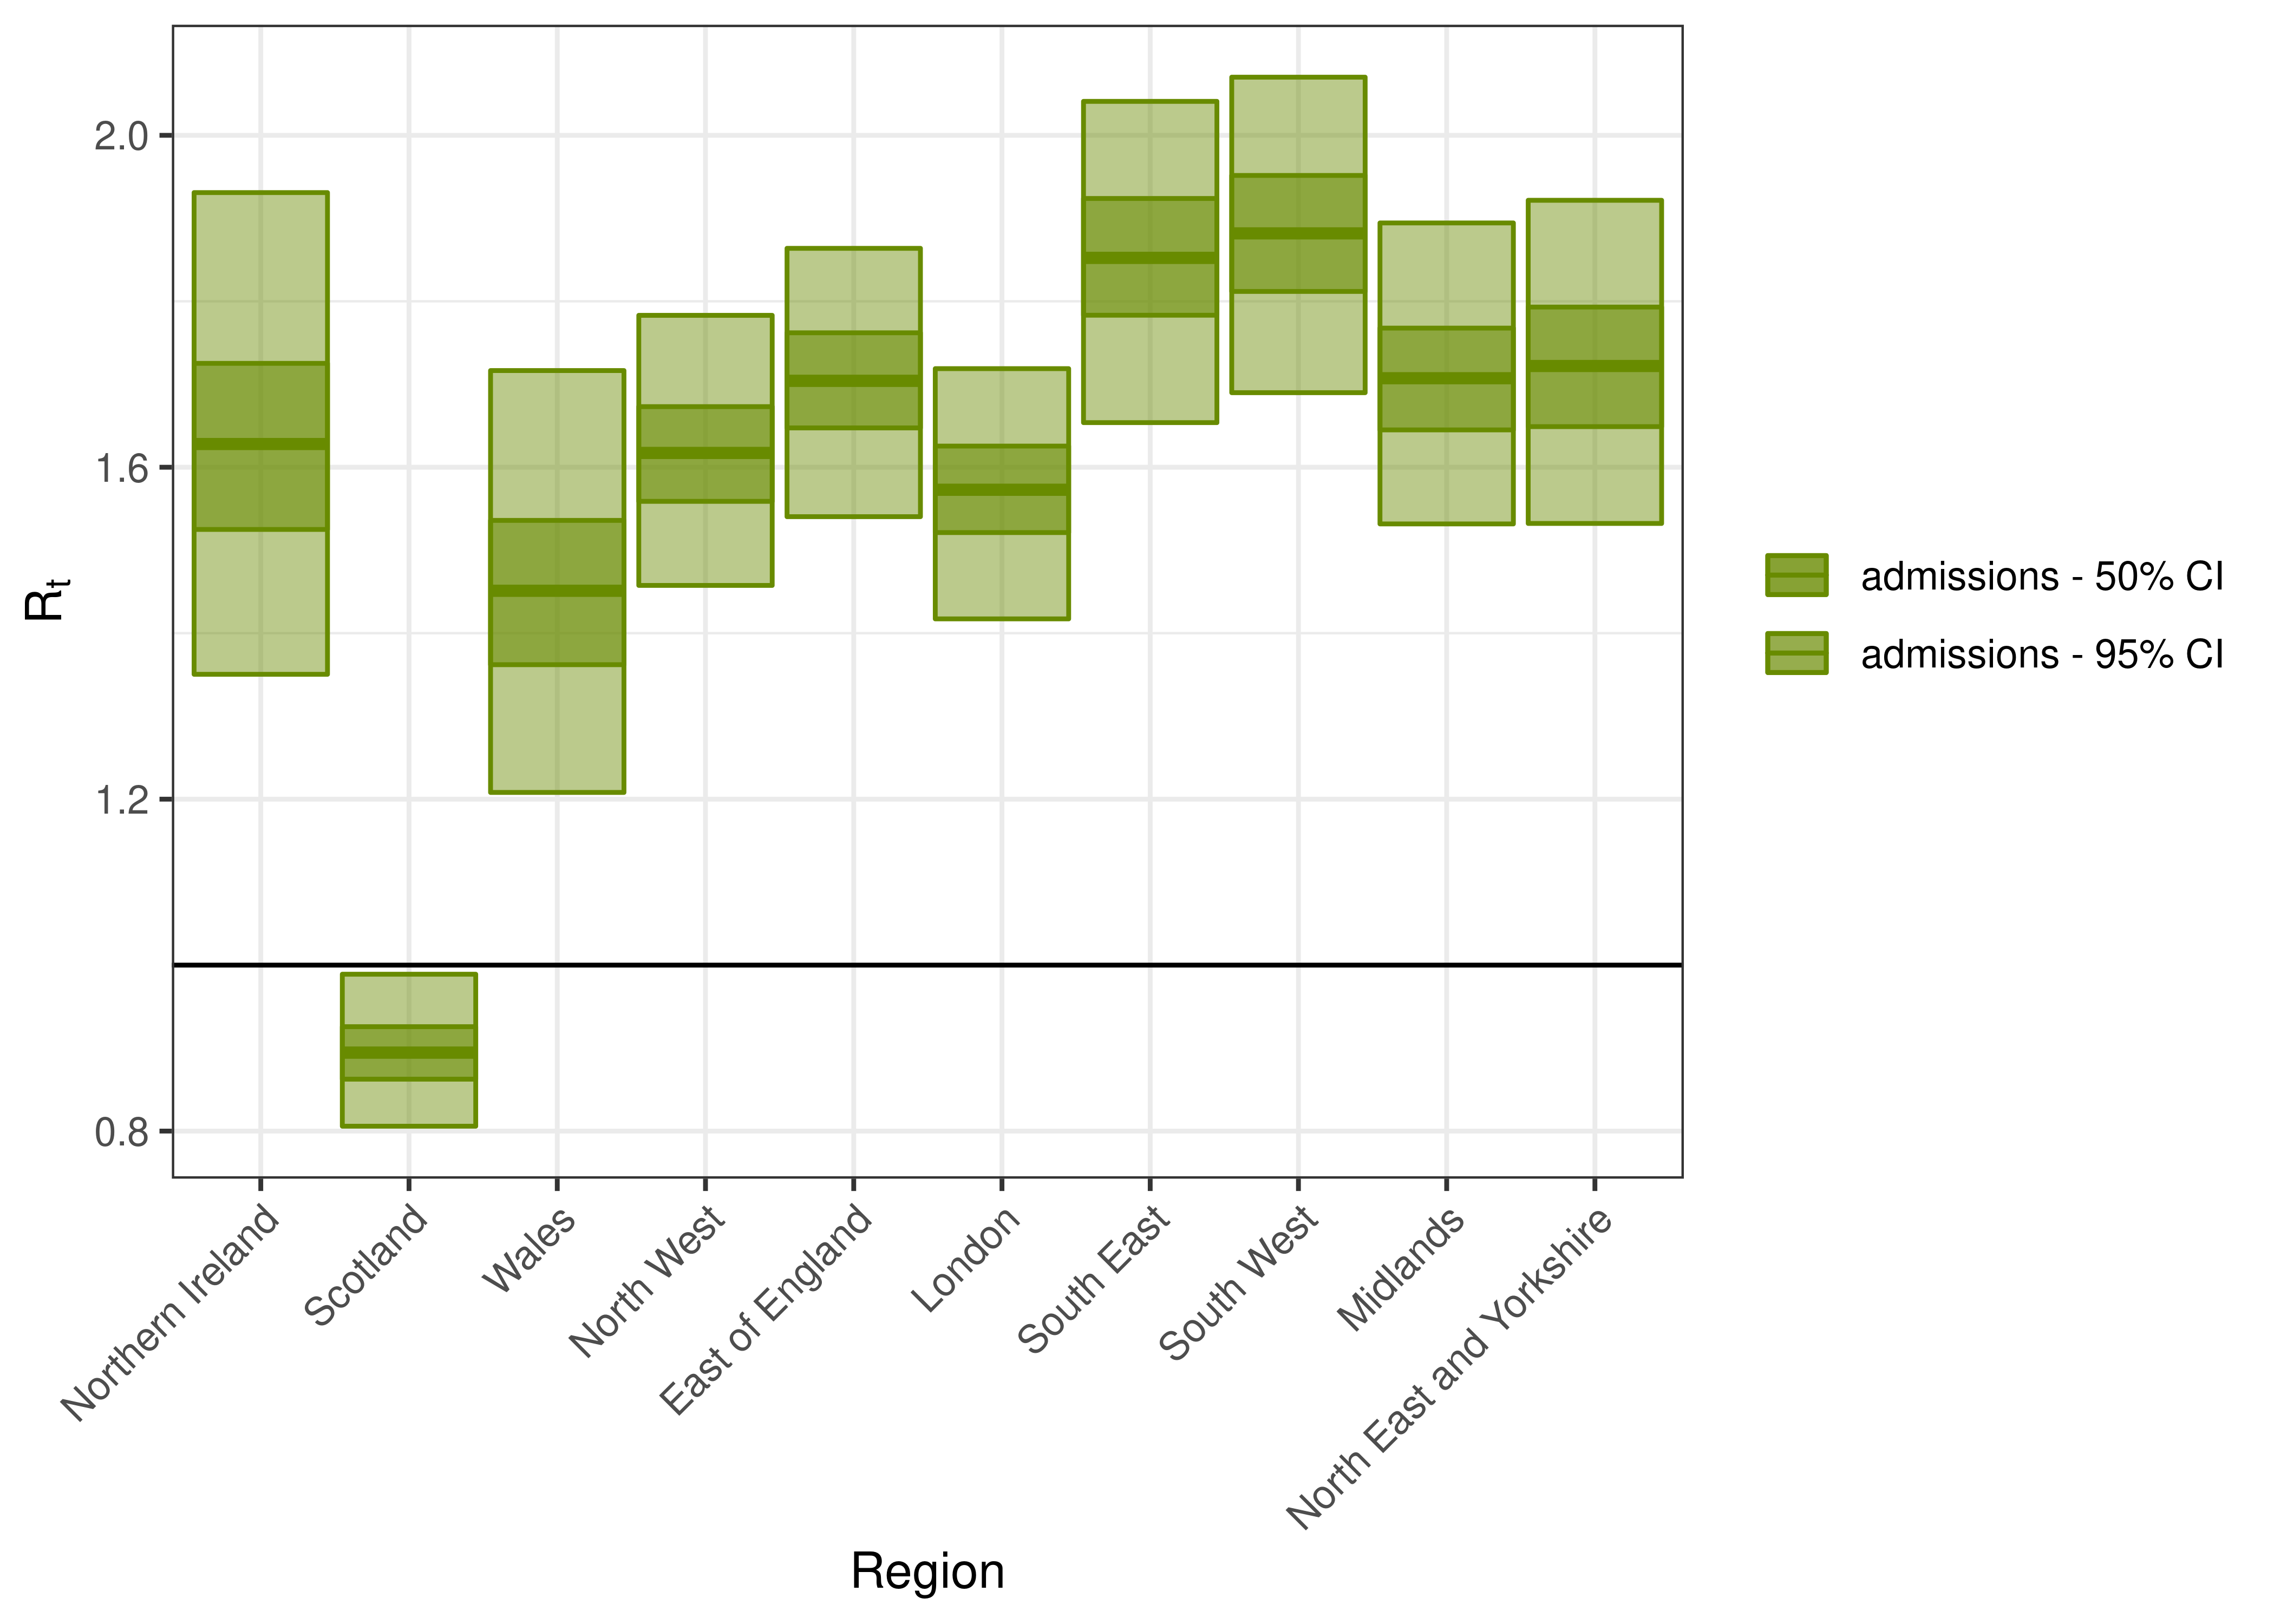
Estimated Effective Reproduction Number by Region
7.3 Maps of Effective Reproduction Number
Below we plot the current effective reproduction number on maps with boundaries provided by [6]. Data where the confidence interval for the reproduction number is wider than 1 are excluded (shown as missing on the map).
7.4 Graphs over Time
Below we plot results for each nation.
7.4.1 London
7.4.2 South East
7.4.3 South West
7.4.4 East of England
7.4.5 Midlands
7.4.6 North East and Yorkshire
7.4.7 North West
9 Detailed Results
Detailed output are saved to a comma-separated value file. The file can be found here.
10 Discussion
Limitation of this method to estimate the reproduction number are noted in [1]
- It’s sensitive to changes in transmissibility, changes in contact patterns, depletion of the susceptible population and control measures.
- It relies on an assumed generation interval assumptions.
- The size of the time window can affect the volatility of results.
- Results are time lagged with regards to true infection, more so in the case of the use of deaths.
- It’s sensitive to changes in case (or death) detection.
- The generation interval may change over time.
Further to the above the estimates are made under assumption that the cases and deaths are reported consistently over time. For cases this means that testing needs to be at similar levels and reported with similar lag. Should these change rapidly over an interval of a few weeks the above estimates of the effective reproduction numbers would be biased. For example a rapid expansion of testing over the last 3 weeks would results in overestimating recent effective reproduction numbers. Similarly any changes in reporting (over time and underreporting) of deaths would also bias estimates of the reproduction number estimated using deaths. It may well be that some catch-up in reported deaths is exaggerating the estimates for October.
Estimates for the reproduction number are plotted in time period in which the relevant measure is recorded. Though in reality the infections giving rise to those estimates would have occurred roughly between a week to 4 weeks earlier depending on whether it was cases or deaths. These figures have not been shifted back.
Despite these limitation we believe the ease of calculation of this method and the ability to use multiple sources makes it useful as a monitoring tool.
12 Digital boundaries
Office for National Statistics licensed under the Open Government Licence v.3.0
Contains OS data © Crown copyright and database right 2020