Estimating the Effective Reproduction Number of COVID-19 in South Africa
Louis Rossouw
2023-04-02 23:05:12
1 Notice
This report will no longer be produced after 29 July 2022. It appears some of the data sources continue to be updated and this report will continue if the case data continues to be updated.
2 Introduction
This paper contains estimates for the effective reproduction number
\(R_{t,m}\) over time \(t\) in various provinces \(m\) of South Africa. This is done using the
methodology as described in [1]. These
have been implemented in R using EpiEstim package [2] which is what is used here. The methodology
and assumptions are described in more detail here.
This paper and it’s results should be updated roughly daily and is available online.
3 Updates
As this paper is updated over time this section will summarise significant changes. The code producing this paper is tracked using Git. The Git commit hash for this project at the time of generating this paper was 6cab0e089bd06c9688728ab585072be9bce67169.
The following major updates have been made:
- A major update made on 29 March 2021 was to switch from data based on cases reported as captured in [3] to a data source that contains cases by date the specimen was received [4].
- A further update on 17 April 2021 was to adjust cases for public holidays and on 18 April 2021 basic testing data was also added.
- On 30 April 2021 analysis of district municipality data was added.
- On 2 May 2021 and update was made to include allowance for late reported cases. Instead of only reporting based on cases more than 3 days ago the report was adjusted to use all cases reported to date but specific provisions for late reported cases was added to allow for the fact that cases by specimen received date not complete for the most recent days and are revised upwards over subsequent days.
- On 15 May 2021 the test results were adjusted as the source indicated tests were by specimen received date. However upon review it became clear the source is supplying tests by reported date and the calculation was adjusted to follow this.
- On 17 May 2021 a fixed was made for an off by one day error when joining case data to test data when calculating the percentage testing positive.
- On 29 May 2021 plots related to vaccinations (per [3]) were added to this report.
- A further update on 29 May 2021 was made. All plots and maps were updated to consistently not plot reproduction number estimates where the 95% confidence interval associated with that estimate is wider than 1.
- On 1 June 2021 the late reported cases allowance was updated to allow for trends in cases and consequently a weekday adjustment factor was also included in the model.
- On 13 September 2021 vaccination plots were removed from this report.
- On 12 December 2021 this was adjusted to allow for longer potential delays in case reporting and various other minor adjustments.
- On 17 December 2021 trend adjustment was removed from late reported cases as it was producing high case estimates.
- On 21 December 2021 the following changes were made:
- Incorporate hospital admissions and hospital deaths reporting.
- Also estimate \(R_t\) based on hospital admissions and hospital deaths.
- Add crude ratios based on above.
- Remove animated map.
- On 23 December 2021 Excess Deaths were added to this report.
- On 23 April 2022 Wave 5 was added.
- On 28 July 2022 a notification about the report possibly ceasing was added.
- Further tweaks were made on 8 August 2022 to ensure report works with intermittent data.
4 Data
4.1 Data Source
4.1.1 Cases
Case data is extracted from the NICD National COVID-19 Daily Report [4]. This contains the daily cases reported by the NICD for South Africa by province. Data is shown by specimen reported date. Most recent data is excluded due to incomplete reporting of tests in last number of days.
Further data with regard to cases by report date are extracted from [3].
This report contains data as released at 2023-04-02 19:04:34 and contains cases up to specimen received date 2023-03-30.
4.1.2 Hospital Admissions and Hospital Deaths
Hospital admissions and death data is extracted from [3] which captures the NICD Daily Hospital Surveillance (DATCOV) [5]. These contains reported cumulative admissions and cumulative reported hospital deaths on each day. This report contains data as reported up to 2022-12-23.
4.1.3 Excess Deaths
Excess deaths are extracted from [6] and later reports. This report contains data up until the week ending 2022-12-10.
4.2 Data Fixes
4.2.1 Case Data
The following fixes are applied to case data:
- Calculate daily new cases from cumulative data captured.
- Add records (with 0 case count) in periods where no cases were recorded.
- Data reported each day is stored to enable allowance for late reported cases to be estimated.
- The sum of the districts do not add up to provinces as not all cases are allocated to a district. These additional cases are allocated in proportion to other cases during 7 days prior (both for historic data and the latest data set).
4.2.2 Hospital Admissions and Hospital Deaths
The daily cumulative admissions and hospital deaths reported in the daily PDFs were captured. There are some inconsistencies in that data though. To correct for this the following adjustments were made:
- Public and private figures are aggregated by province and day.
- Figures reported on 23 Nov are removed from the analysis as they are much higher than the cumulative figures reported the next day.
- Anywhere a cumulative figures that are lower than the day before are
removed.
- Data capturing issues and the removal of figures under the point in above results in gaps in the daily data. These are filled by linear interpolation of cumulative figures between the available dates.
- Incremental daily admissions and hospital deaths are then calculated from the resulting cumulative data.
4.2.3 Excess Deaths
Excess deaths is transformed as follows:
- Province and district names are mapped to consistent naming.
- Given that all other data is daily, weekly data is converted to daily be uniformly allocating weekly excess deaths to days in the week.
4.3 Allowance for Late Reported Cases
Late reported cases play a role as the data we are using are by specimen received date. Cases are being added to dates in the past as the data gets updated. By keeping data released on a daily basis comparisons can be made to analyse reporting delays. In most cases those are only a couple of days later, but in some cases these are further out.
Late reported claims are estimated using a model that models the reporting of claims as a function of:
- Delay since specimen received date assuming no cases are reported
after 14 days.
- The delay pattern is assumed to be consistent within provinces but potentially varied by day of week.
- Province and district
- The specimen reported date.
Only data that were reported in last 21 days are used, to ensure data reflects recent reporting delay patterns.
No allowance for late reported hopsital admissions and deaths is possible as data is only available by date reported.
4.4 Adjustments for Public Holidays
Public holidays tend to have lower number of cases received and results in distortions of the estimation of the reproduction number over time. Below we attempt to adjust for these discrepancies.
Public holiday dates are obtained from [7]
For each province counts of cases is then modelled as a function of:
- Week
- Day of Week
- Public Holiday
The impact of public holidays are then removed by observing the impact of public holidays in the model and reversing that out in the data. This has the effect of increasing the observed cases on public holidays and reducing them slightly on all other days. This effect is dependent on the province and day of the week.
No adjustments for pulbic holidays are made for admissions and deaths. Data is by date reported which makes this difficult.
5 Methodology
The methodology is described in detail here. Here we estimate the effective reproduction number on cases and admissions but not hospital deaths as the quality of reporting of hospital deaths is not of sufficient quality.
6 Results
6.1 National
6.1.1 Tests
Below raw numbers of test by date reported are plotted. Note this is not by specimen received date, so, for example, no adjustment is made for old cases/tests that were loaded on 23 November 2021. A 7-day moving average is also plotted. No adjustment is made for public holidays for this data.
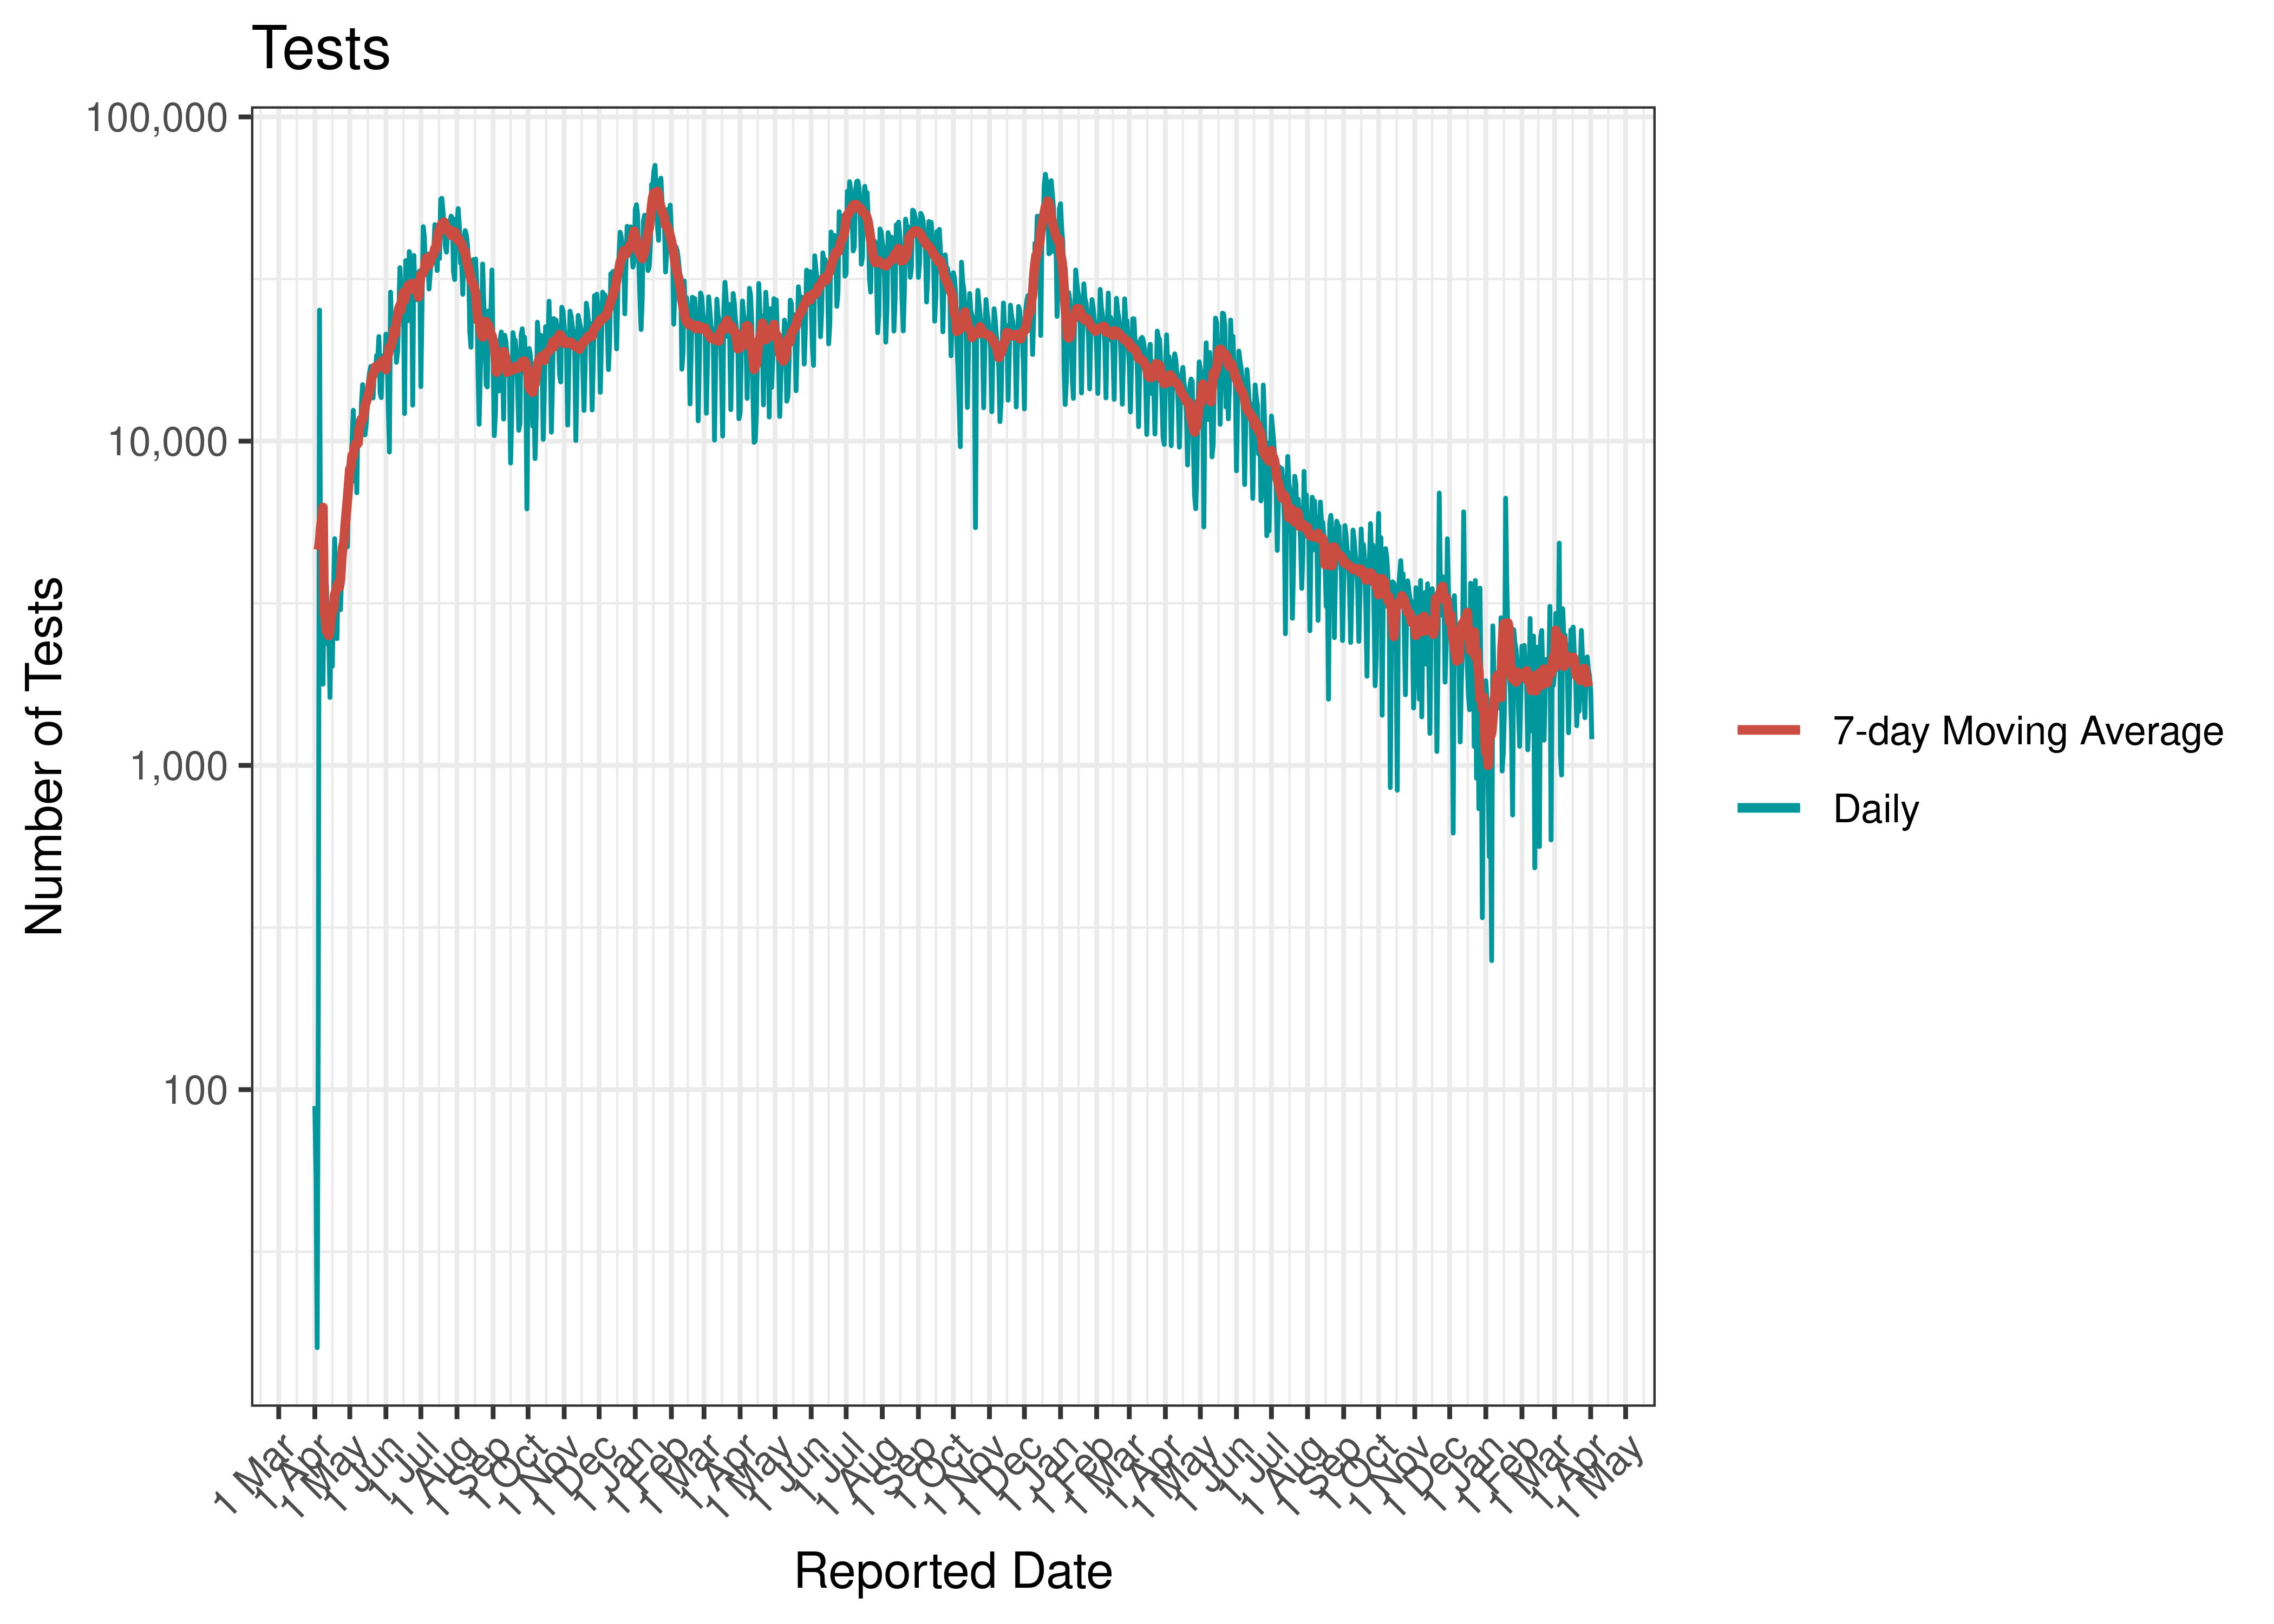
Tests
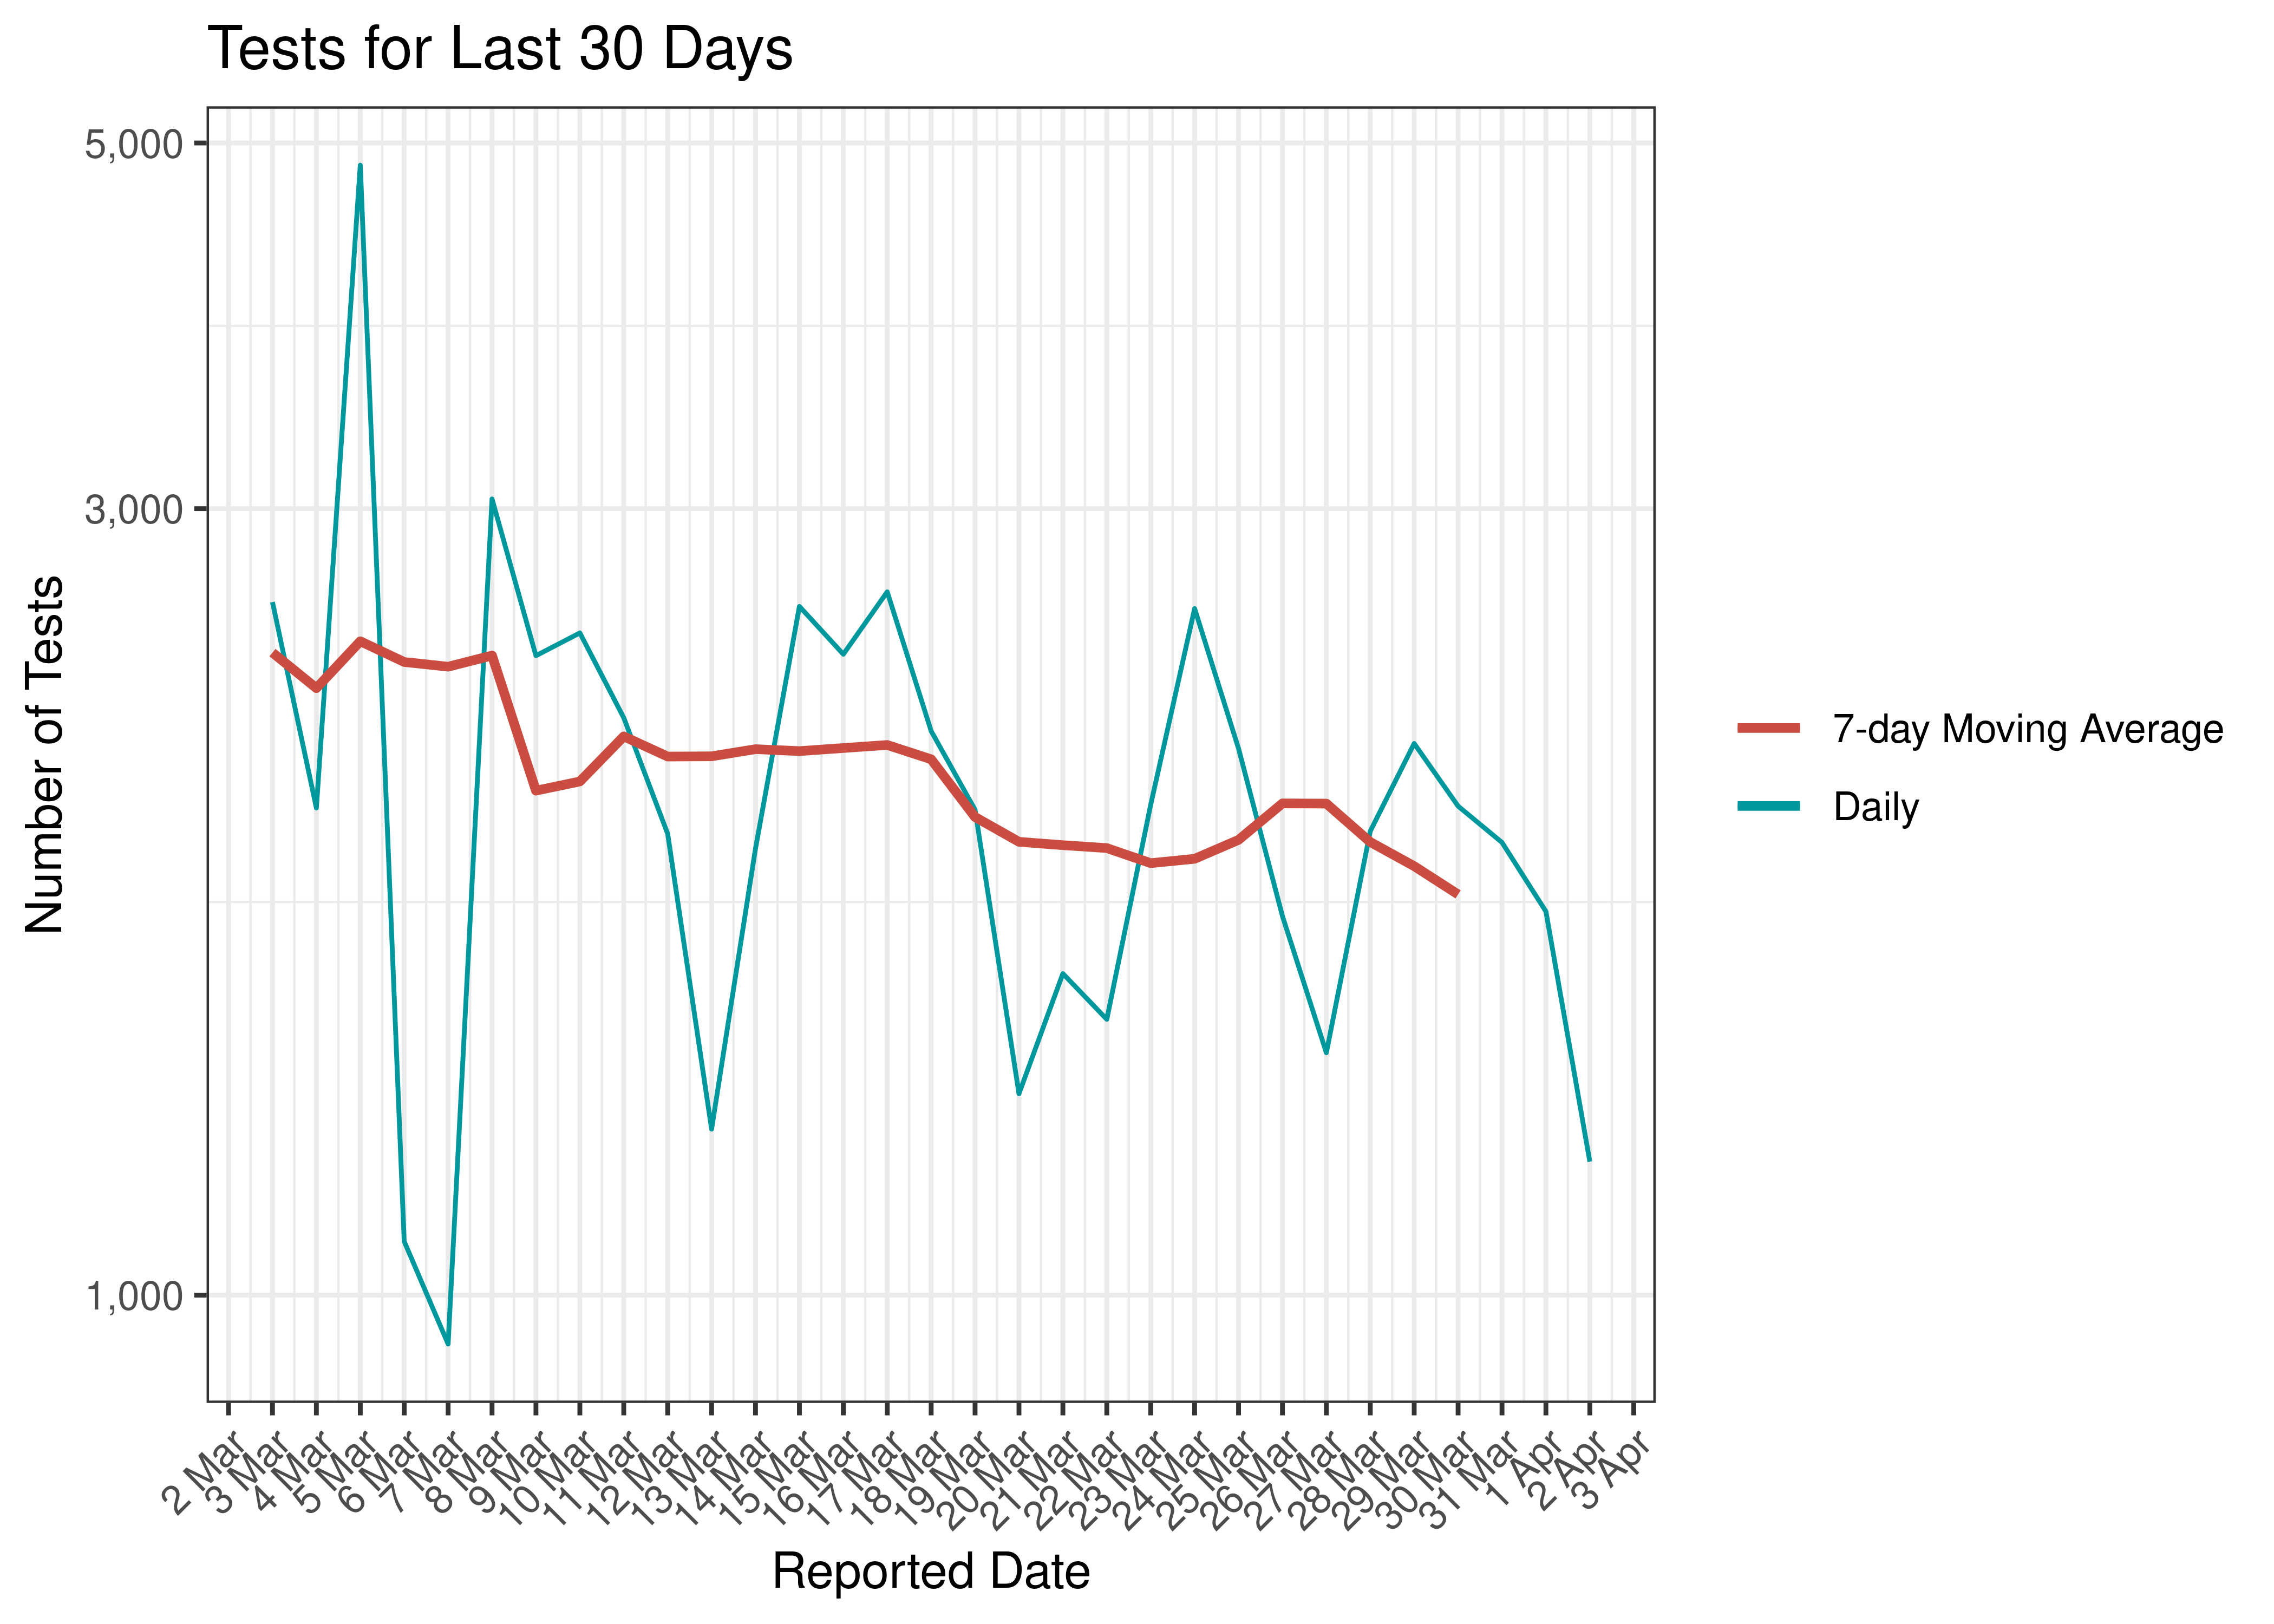
Tests for Last 30 Days
6.1.2 Percentage testing positive
Below the percentage testing positive is plotted by reported date, so, for example, no adjustment is made for old cases/tests that were loaded on 23 November 2021. A 7-day sliding window percentage is also plotted. No adjustment is made for public holidays or delays for this data as the assumption is that the numerator and denominator should be similarly impacted (both are by date reported).
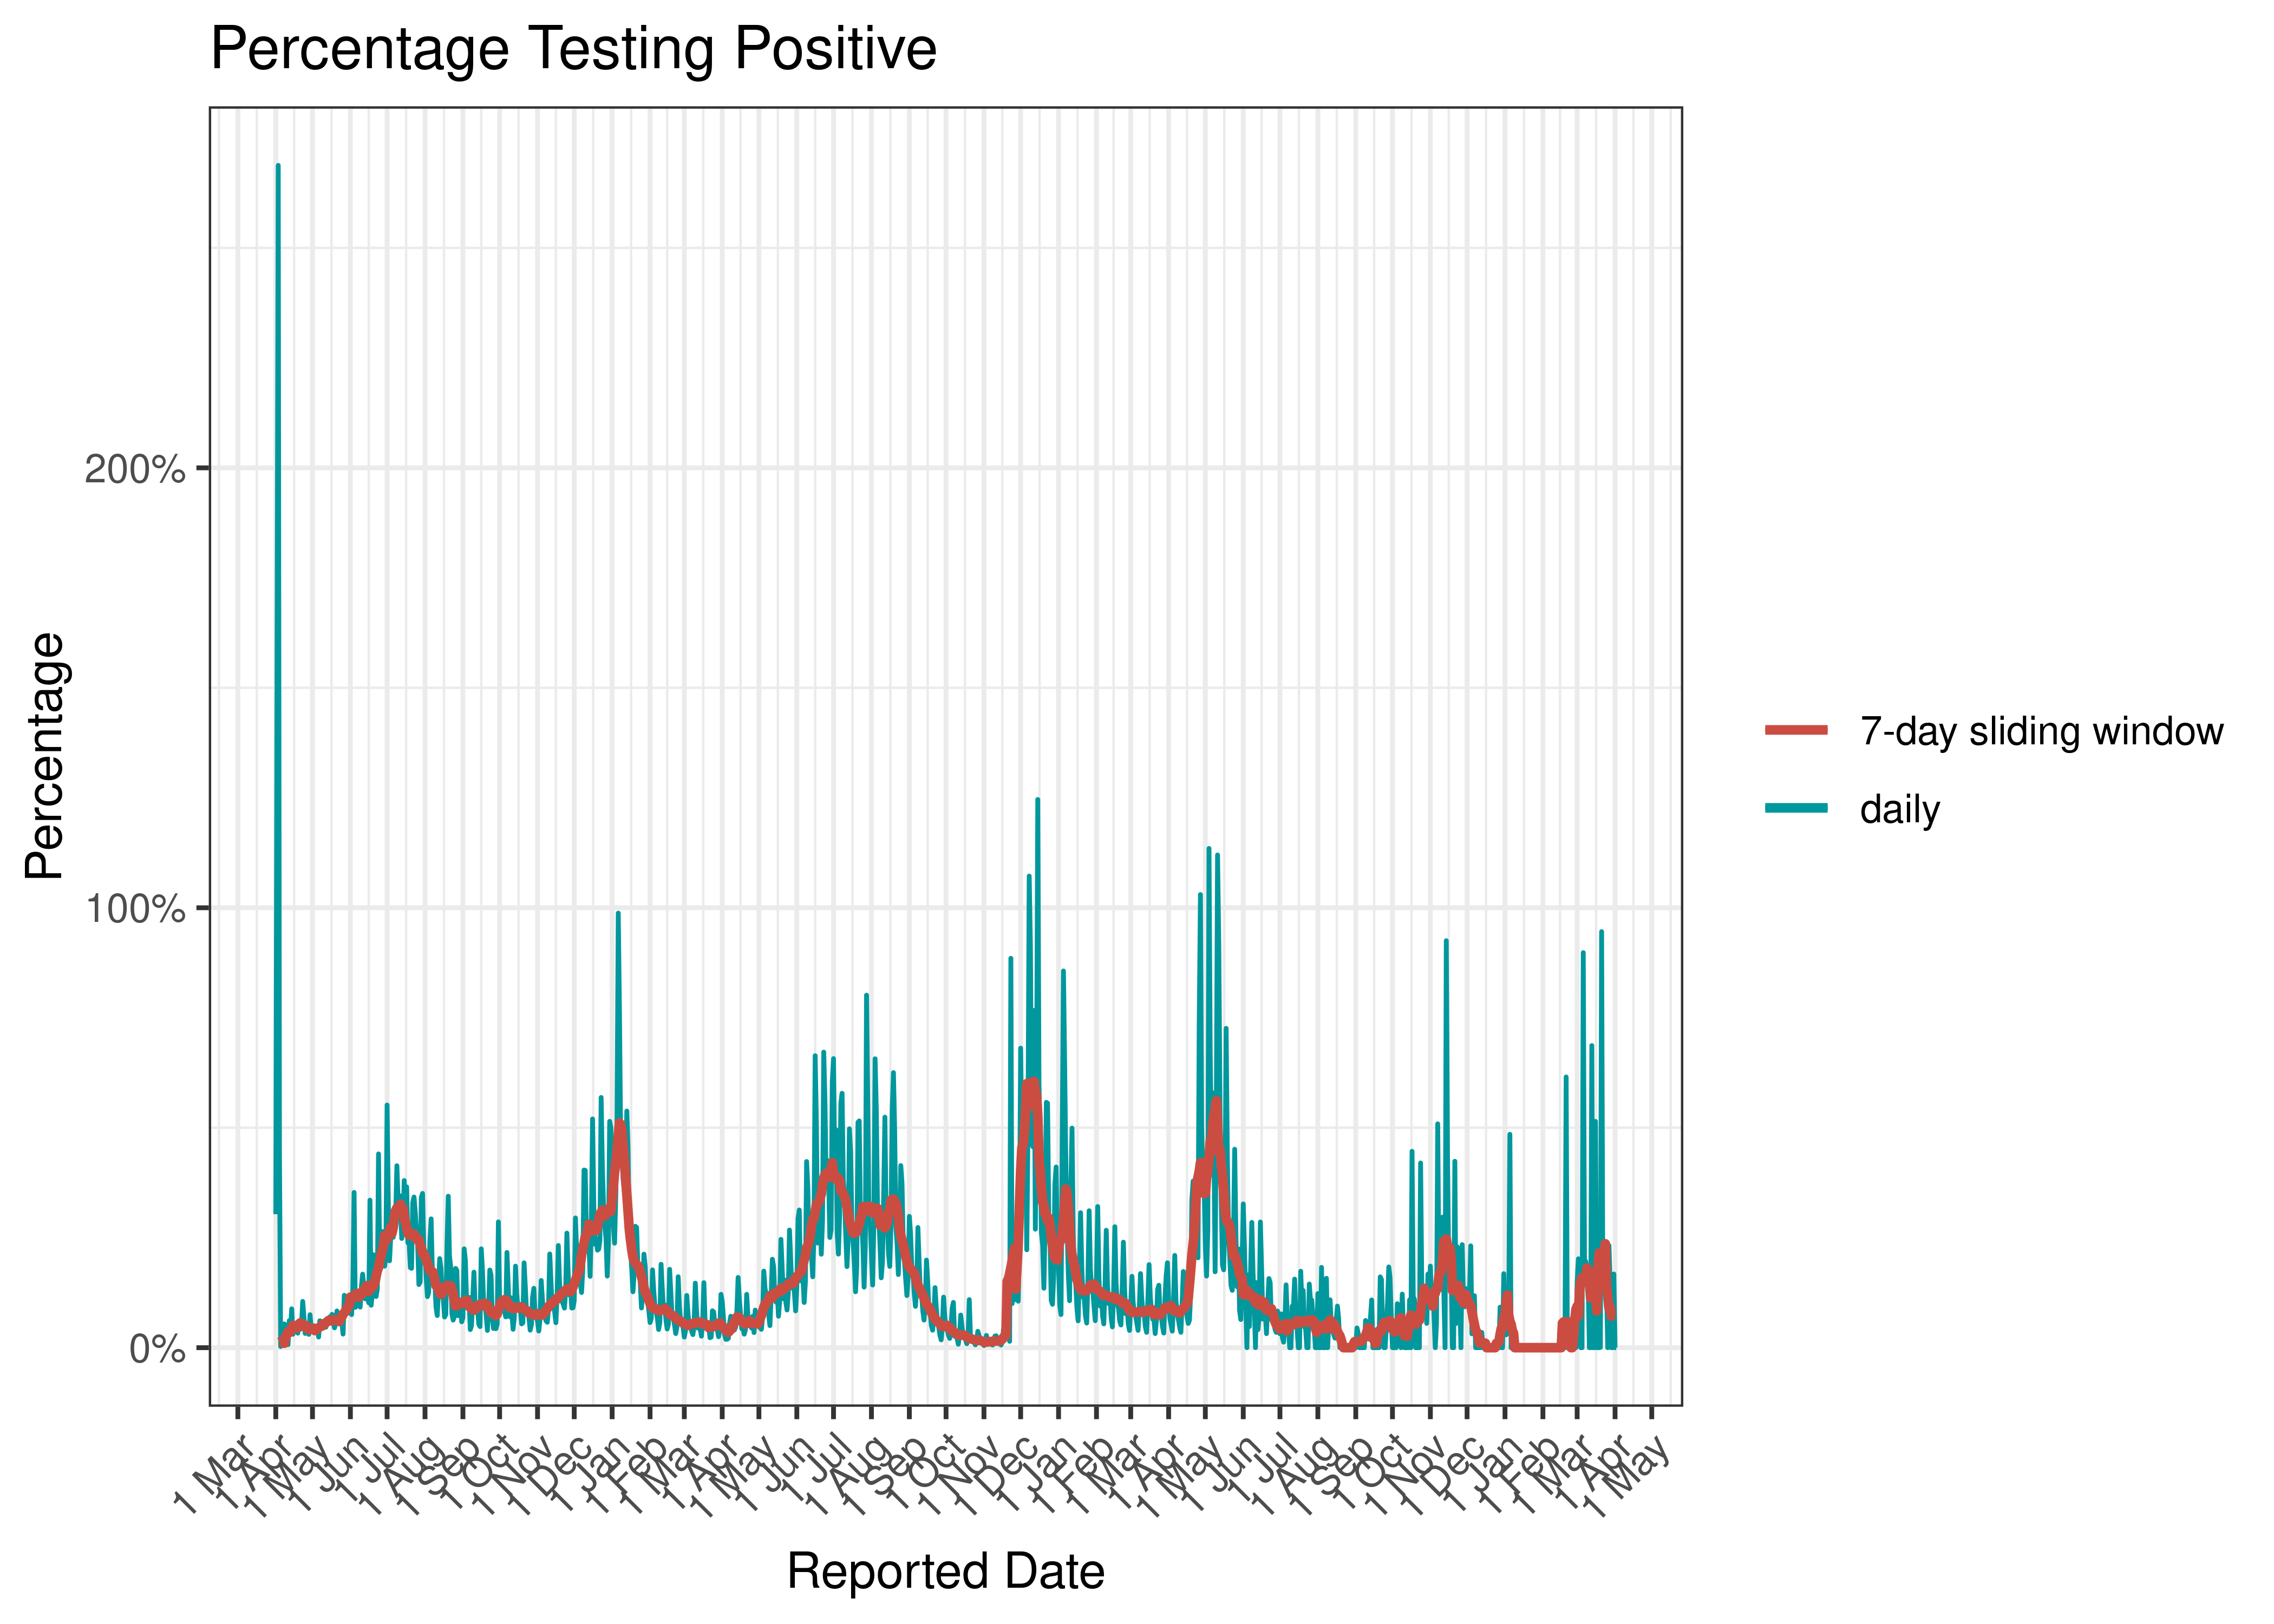
Percentage Testing Positive
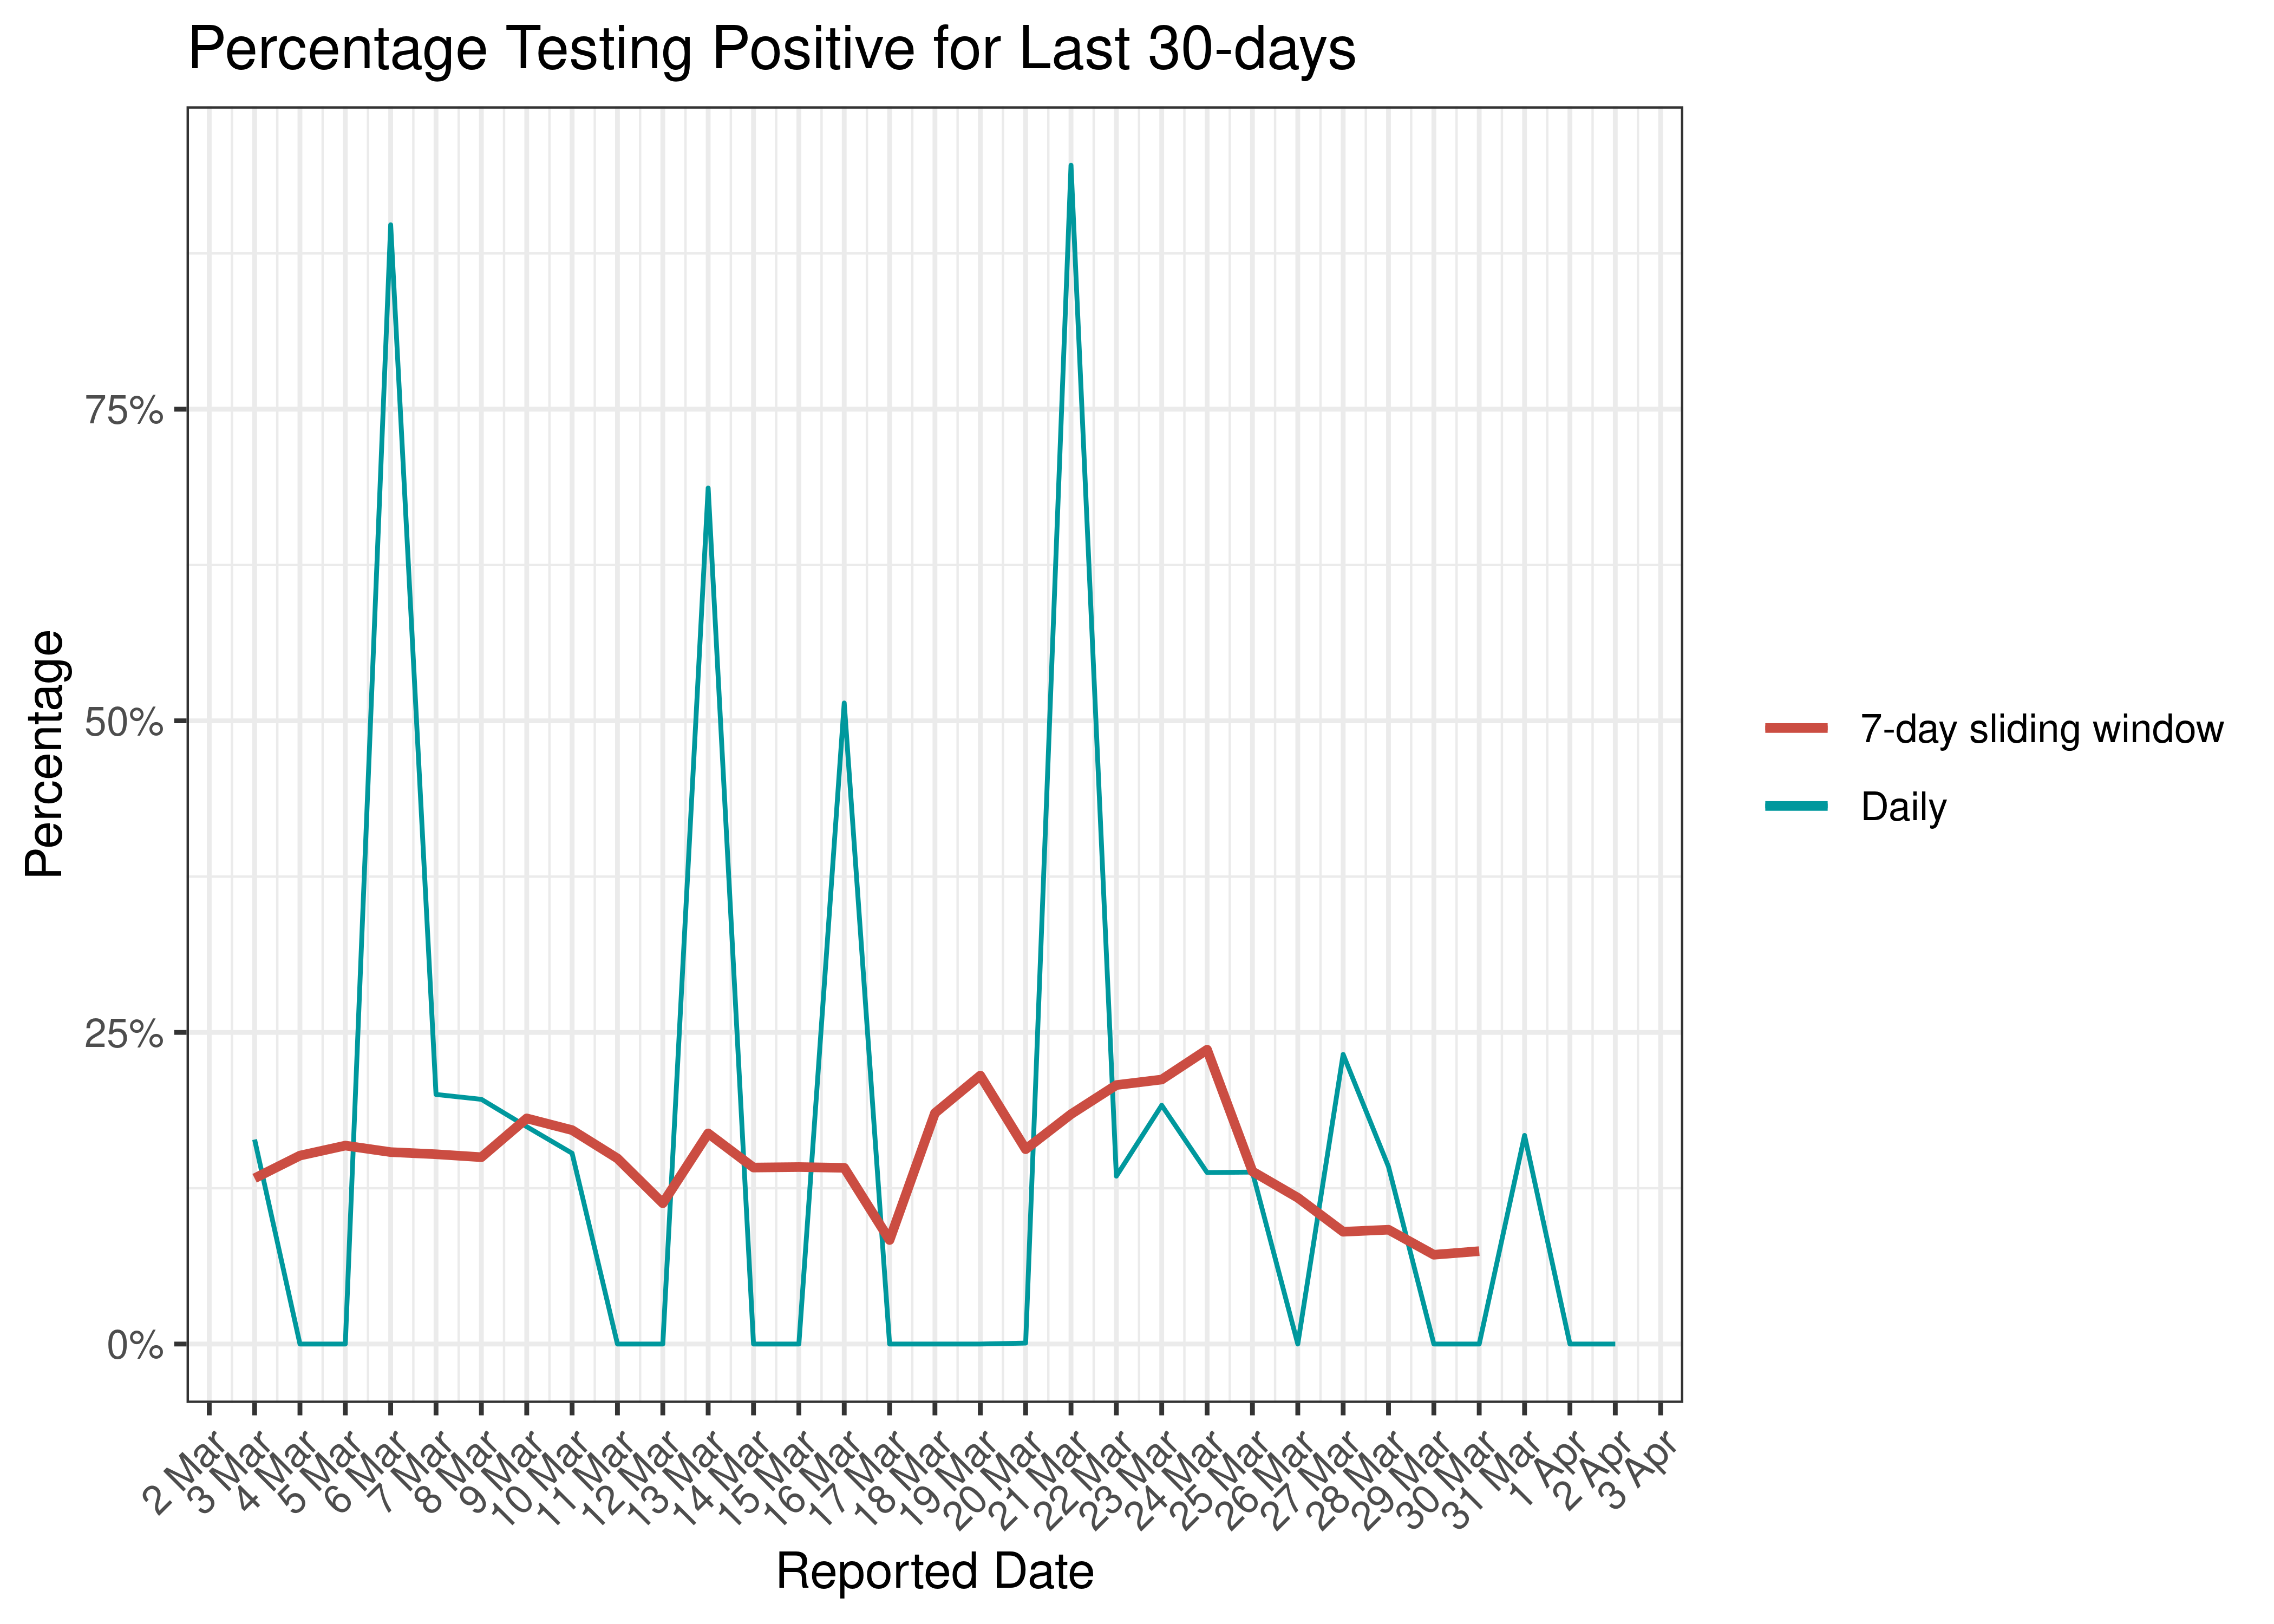
Percentage Testing Positive for Last 30-days
6.1.3 Allowance for Late Reported Cases
Below the estimations for daily cases are plotted against the cases reported to date for the last 14 days. More recent dates are not fully reported yet and are increased more to the estimated levels.
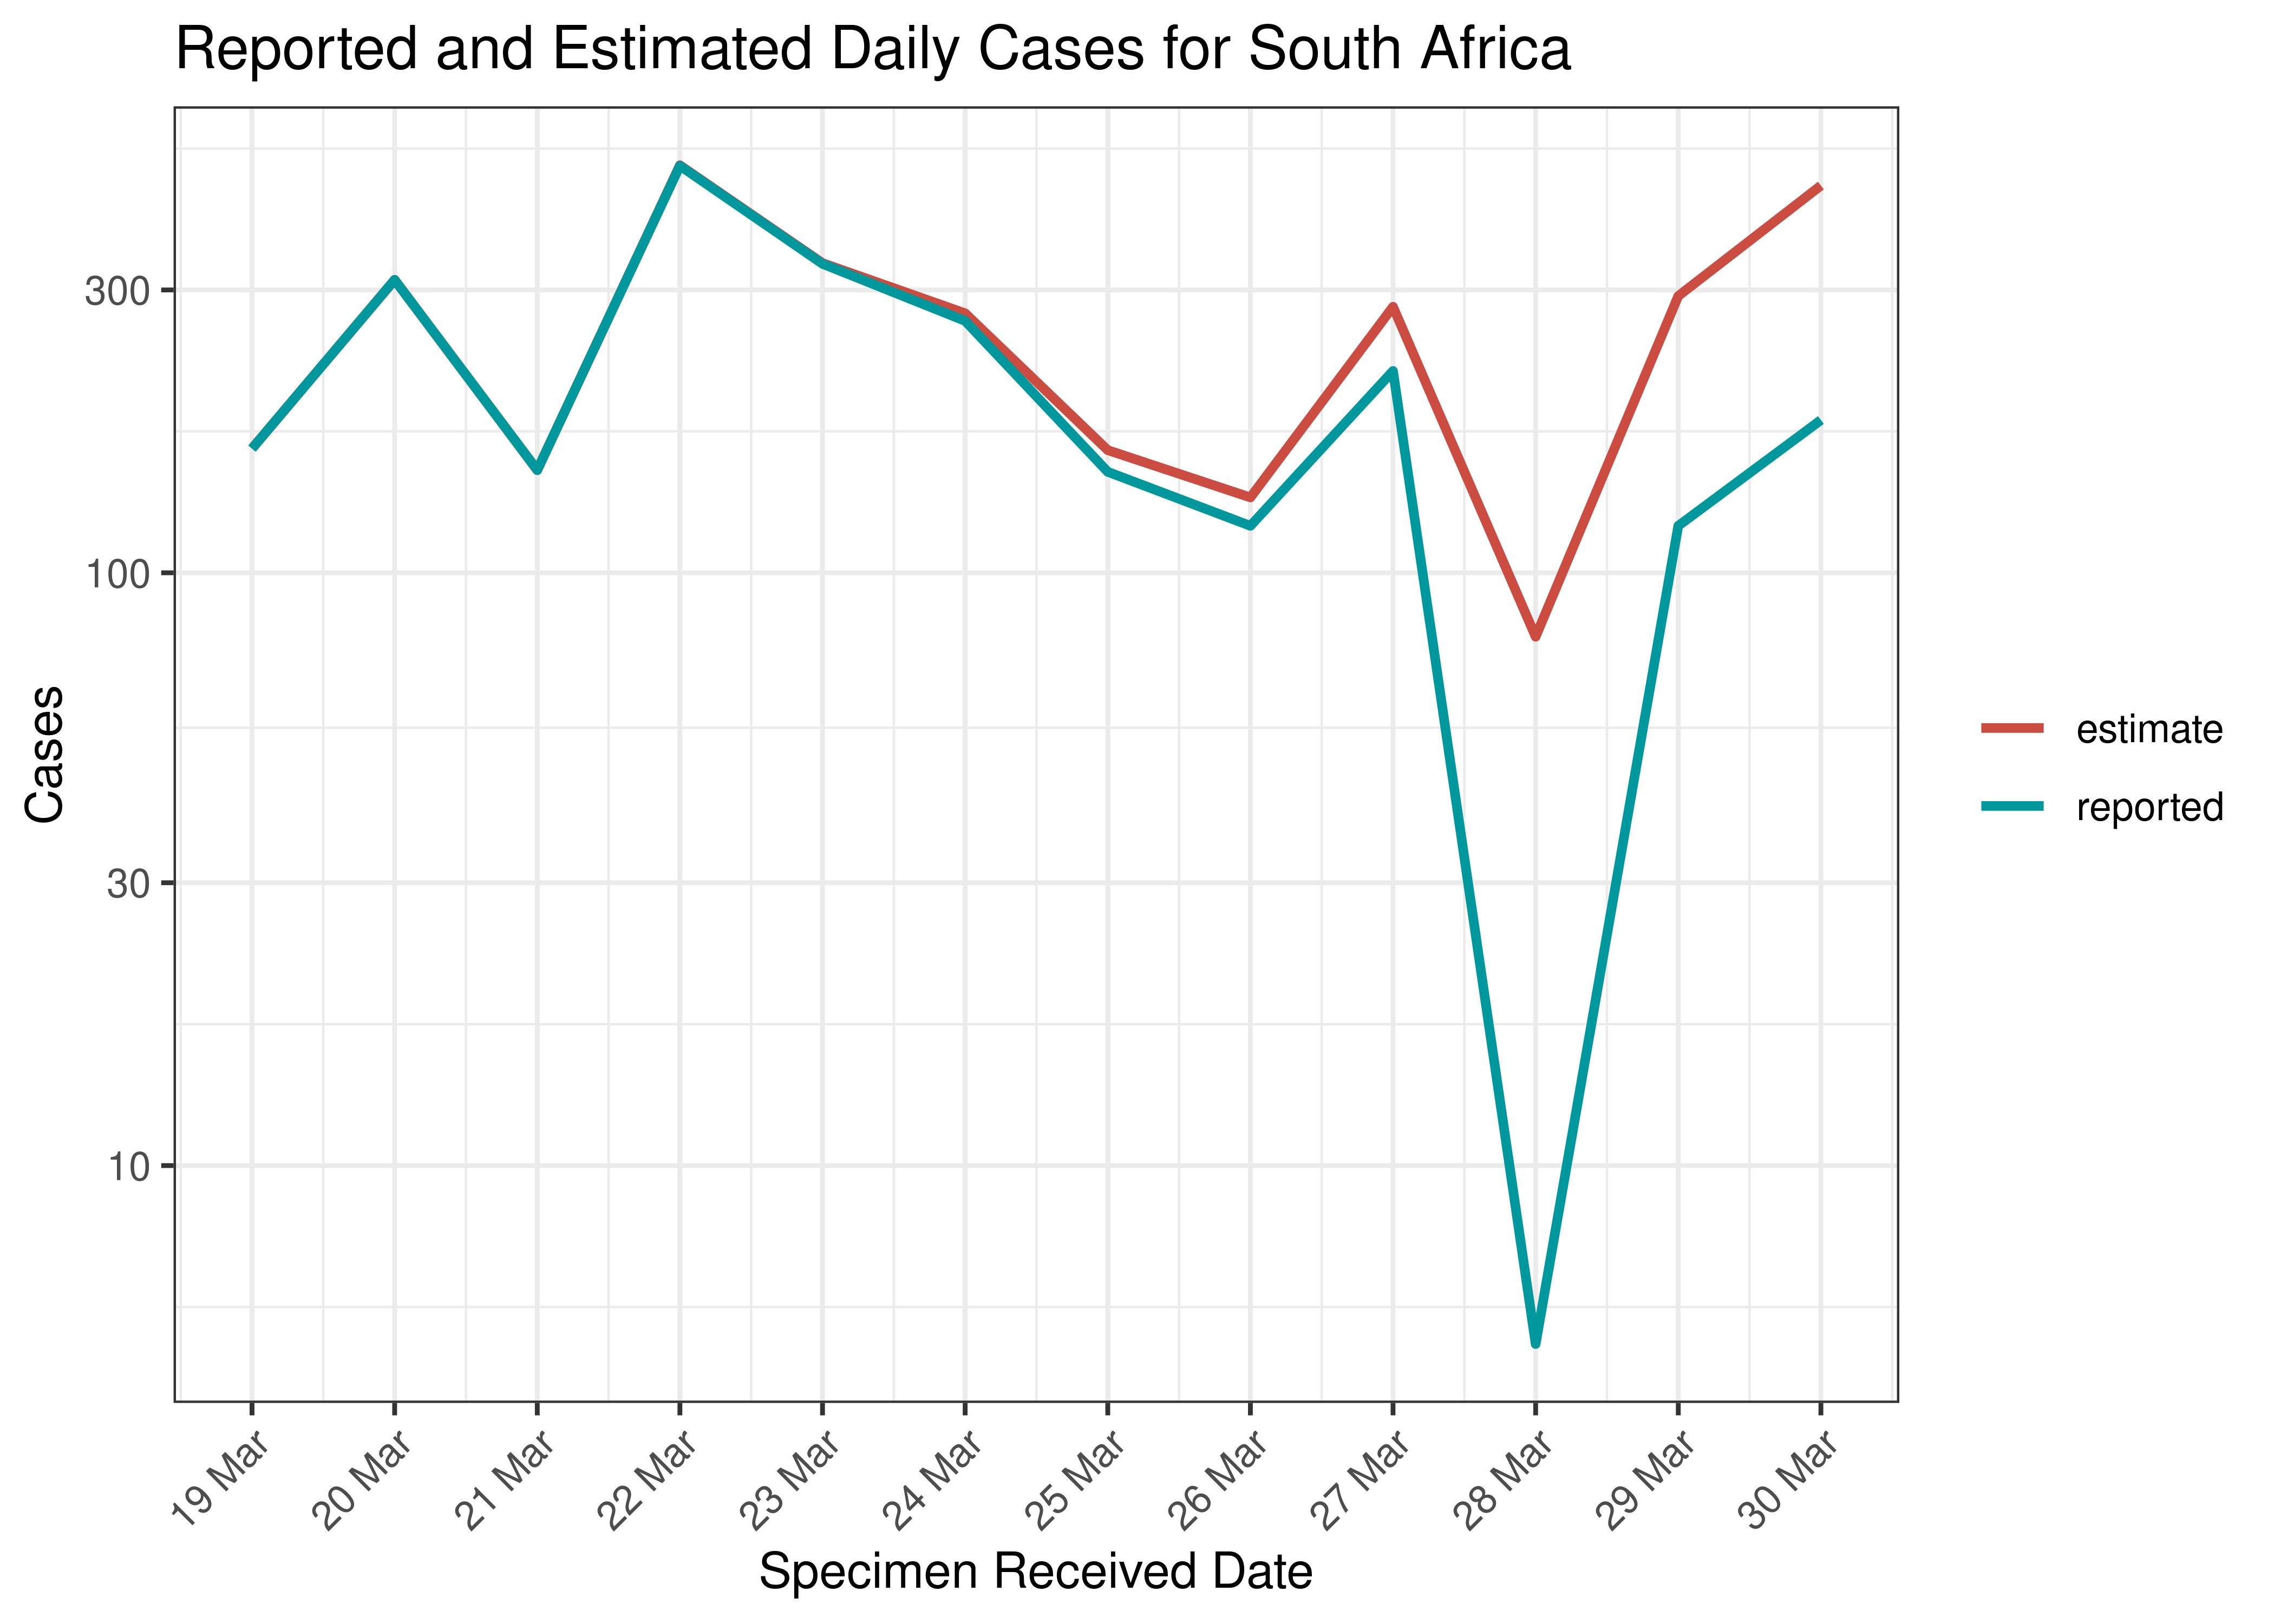
Reported and Estimated Daily Cases for South Africa
6.1.4 Adjustments for Public Holidays to Cases
Cases before and after adjustment for public holidays for South Africa are shown below for last 60 days. Cases are increased on days of public holidays and reduced on other days. Weekends are not impacted significantly.
Further in this report the adjusted cases are used.
Unadjusted and Adjusted Daily Cases for South Africa for last 60 days
6.1.5 Cases
This report uses cases by specimen received date. Below the cases are tabulated by reporting date and how many days before the report date the specimens were received. The “-1” column is the number of cases reported on a particular date where specimens were received the day before the report date. “-2” is the previous day etc.
On some days the report is not run in which case the reported cases may not be stored and thus the calculation below would not be possible. Those dates will be missing from the table.
The data used in the report is mainly captured from [4] as it contains data by specimen received date. Totals from the Department of Health / NICD as captured in [3] are also shown. There are minor differences from time to time.
| Report Date | -1 | -2 | -3 | -4 | -5 | -6 | -7 | Older | Total | DoH |
|---|---|---|---|---|---|---|---|---|---|---|
| 2023-03-13 | 94 | 205 | 329 | 132 | 8 | 2 | 3 | 86 | 859 | 866 |
| 2023-03-14 | NA | 0 | 0 | 0 | 0 | 0 | 0 | 3 | NA | 0 |
| 2023-03-15 | NA | NA | 0 | 0 | 0 | 0 | 0 | -9 | NA | 0 |
| 2023-03-16 | 277 | 418 | 508 | 39 | 1 | 2 | 0 | 14 | 1,259 | 1,259 |
| 2023-03-17 | NA | 0 | 0 | 0 | 0 | 0 | 0 | -12 | NA | 0 |
| 2023-03-18 | NA | NA | 0 | 0 | 0 | 0 | 0 | 5 | NA | 0 |
| 2023-03-19 | NA | NA | NA | 0 | 0 | 0 | 0 | 11 | NA | 0 |
| 2023-03-20 | 1 | 0 | 0 | 0 | 0 | 0 | 0 | -8 | -7 | 1 |
| 2023-03-21 | 220 | 159 | 193 | 343 | 380 | 170 | 2 | 3 | 1,470 | 1,482 |
| 2023-03-22 | 109 | 85 | 2 | 1 | 0 | 0 | 0 | -6 | 191 | 198 |
| 2023-03-23 | 330 | 39 | 4 | 0 | 0 | 0 | 0 | 5 | 378 | 380 |
| 2023-03-24 | 204 | 156 | 1 | 0 | 0 | 0 | 0 | -7 | 354 | 359 |
| 2023-03-25 | 169 | 119 | 0 | 0 | 0 | 0 | 0 | 11 | 299 | 296 |
| 2023-03-26 | NA | 0 | 0 | 0 | 0 | 0 | 0 | 3 | NA | 0 |
| 2023-03-27 | 85 | 143 | 89 | 8 | 0 | 0 | 0 | 0 | 325 | 326 |
| 2023-03-28 | 219 | 35 | 5 | 8 | 0 | 0 | 0 | 5 | 272 | 272 |
| 2023-03-29 | NA | 0 | 0 | 0 | 0 | 0 | 0 | -5 | NA | 0 |
| 2023-03-30 | NA | NA | 0 | 0 | 0 | 0 | 0 | -7 | NA | 0 |
| 2023-03-31 | 181 | 120 | 5 | 0 | 0 | 0 | 0 | 13 | 319 | 315 |
| 2023-04-01 | NA | 0 | 0 | 0 | 0 | 0 | 0 | -15 | NA | 0 |
| 2023-04-02 | NA | NA | 0 | 0 | 0 | 0 | 0 | 5 | NA | 0 |
Cases are tabulated by specimen received date below. Cases include estimates for late reporting in recent days as well as adjustments for any public holidays. A centred 7-day moving average is also shown. The peak daily cases in previous waves (as measured by the moving average) is also shown.
| Specimen Received Date | Cases | 7-day Moving Average | Comment |
|---|---|---|---|
| 2020-07-11 | 7,836 | 11,476 | Wave 1 Peak |
| 2021-01-06 | 23,097 | 19,374 | Wave 2 Peak |
| 2021-07-03 | 12,487 | 19,537 | Wave 3 Peak |
| 2021-12-12 | 8,398 | 21,980 | Wave 4 Peak |
| 2022-05-06 | 8,173 | 7,575 | Wave 5 Peak (to date) |
The above are based on the following dates:
- Wave 1 started on 2020-01-01.
- Wave 2 started on 2020-10-01.
- Wave 3 started on 2021-04-01.
- Wave 4 started on 2021-11-01.
- Wave 5 started on 2022-04-01.
Below a 7-day moving average daily case is plotted by on a log scale since start of the epidemic. Cases are plotted by specimen received date.
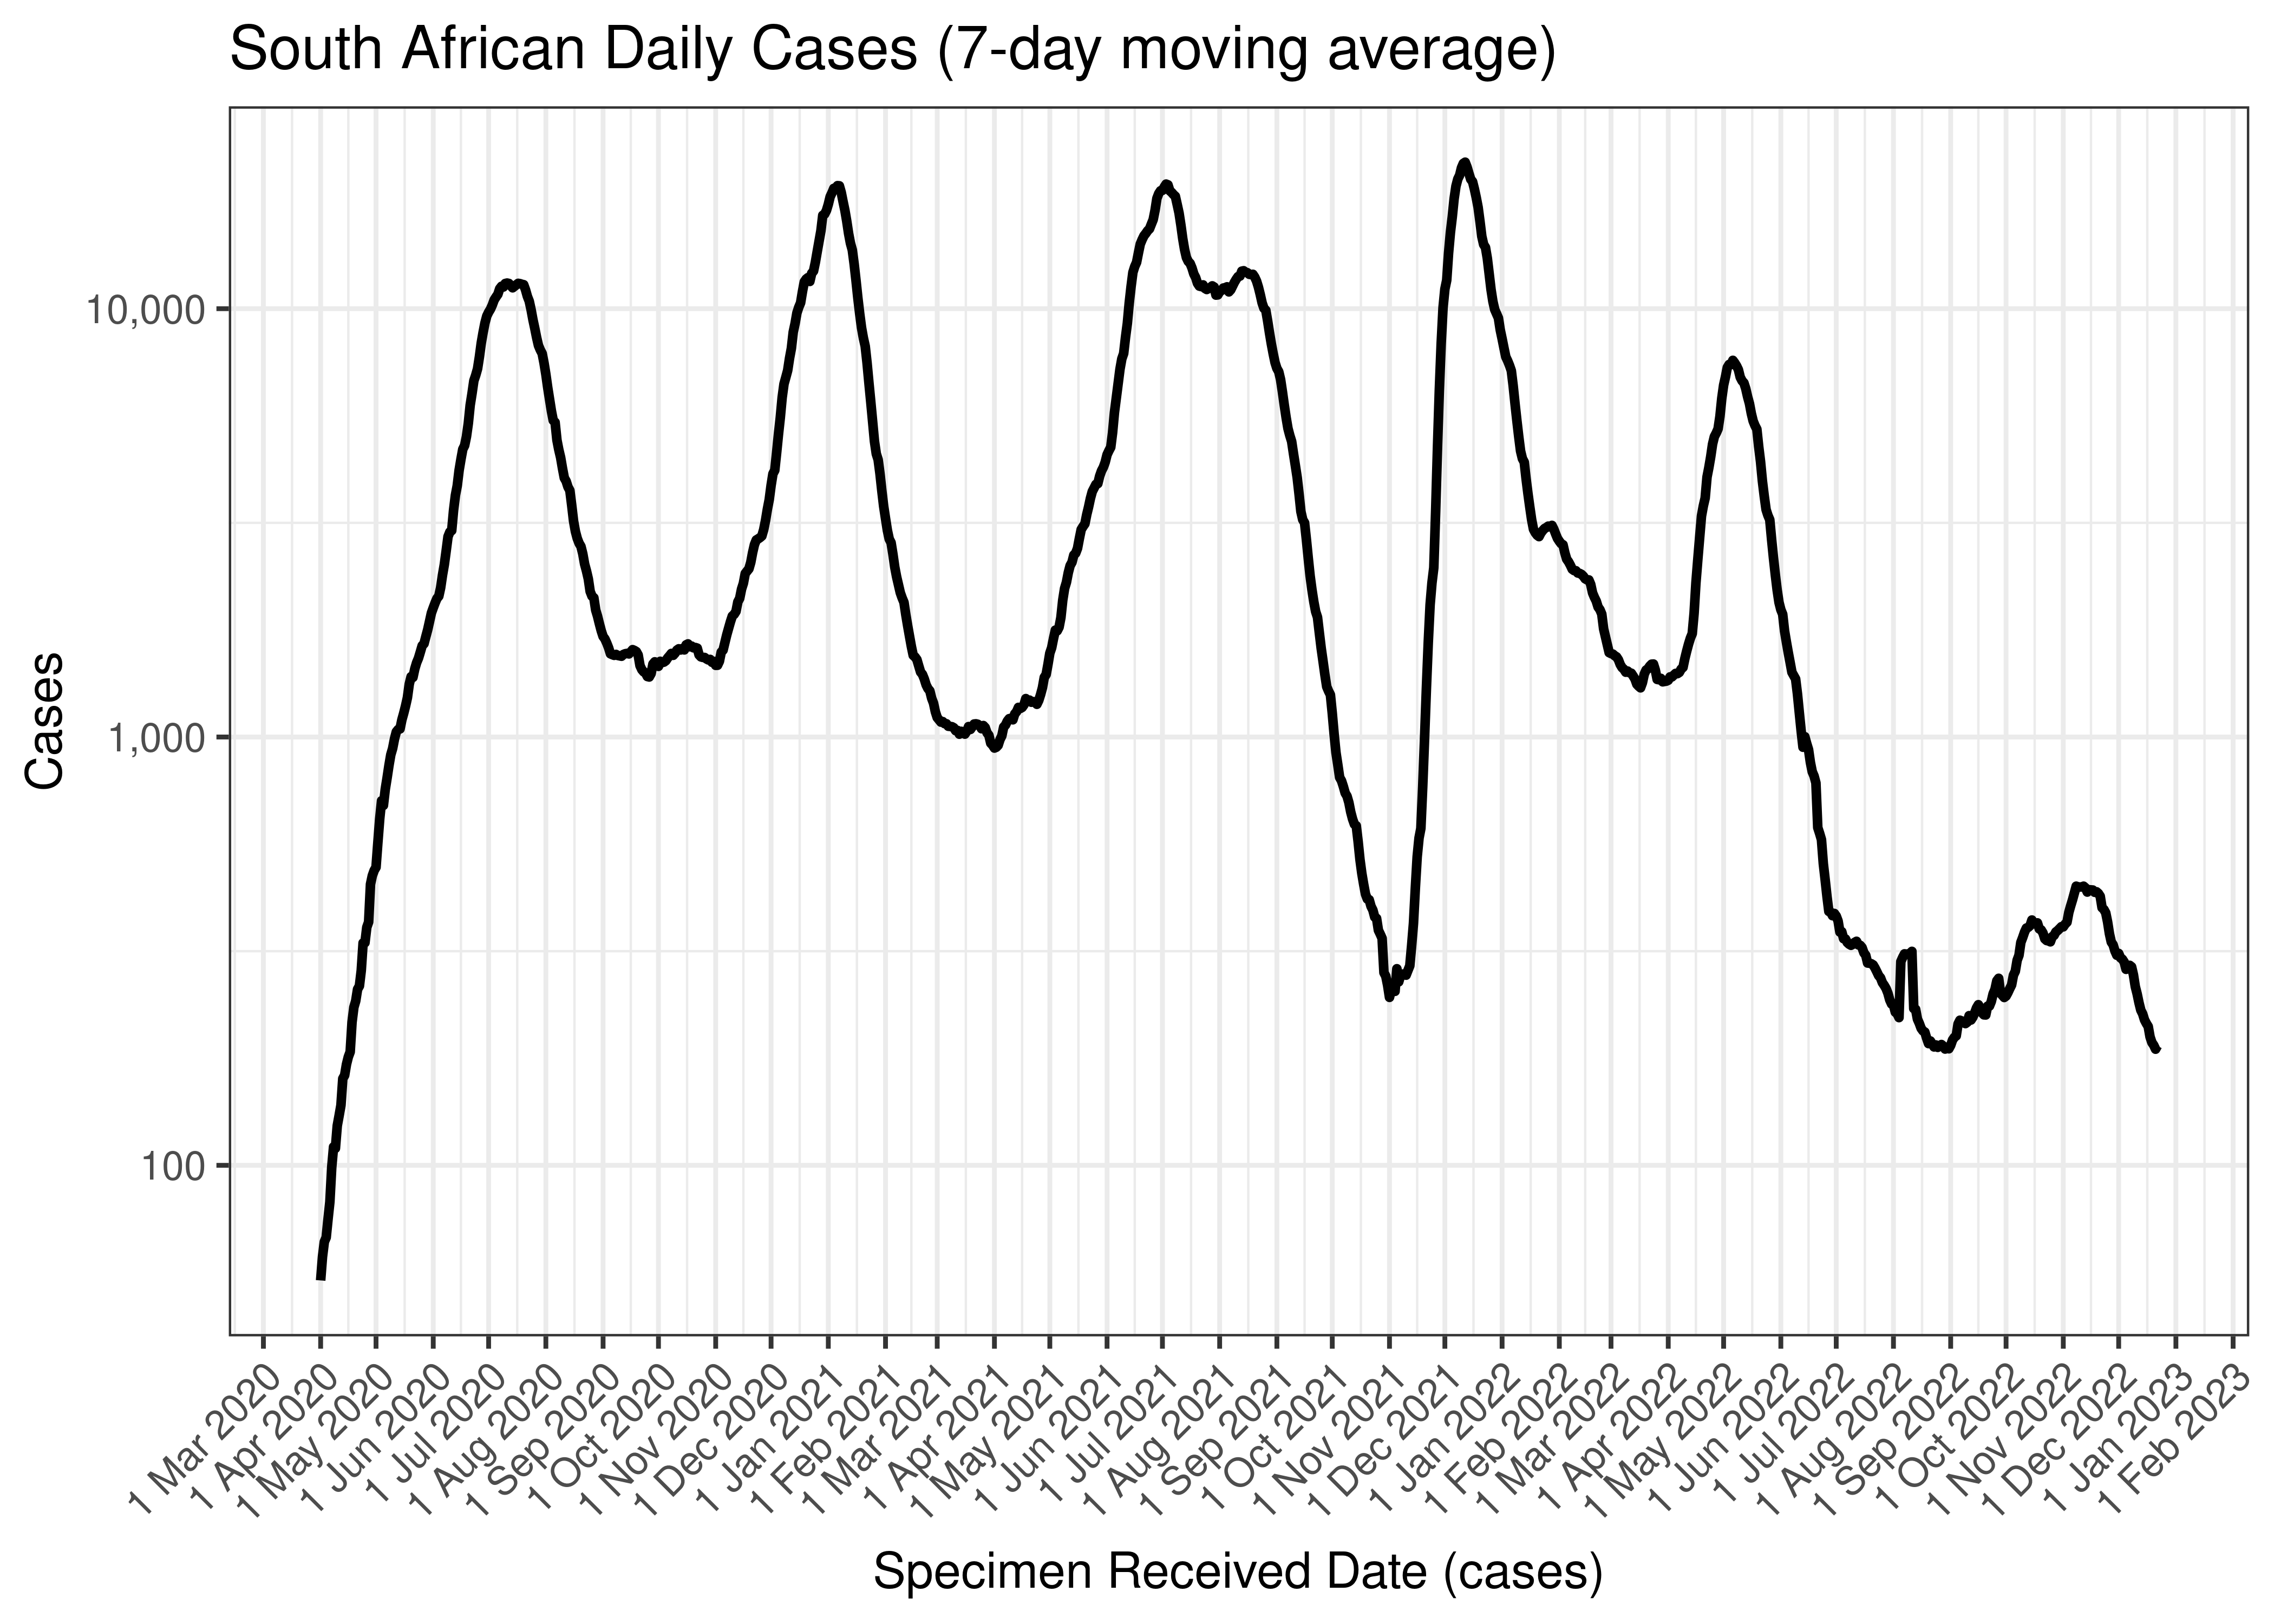
South African Daily Cases (7-day moving average)
Below the above chart is repeated for the last 30-days:

South African Daily Cases for Last 30-days (7-day moving average)
Below a 7-day moving average daily case count is plotted by province on a log scale since start of the epidemic:
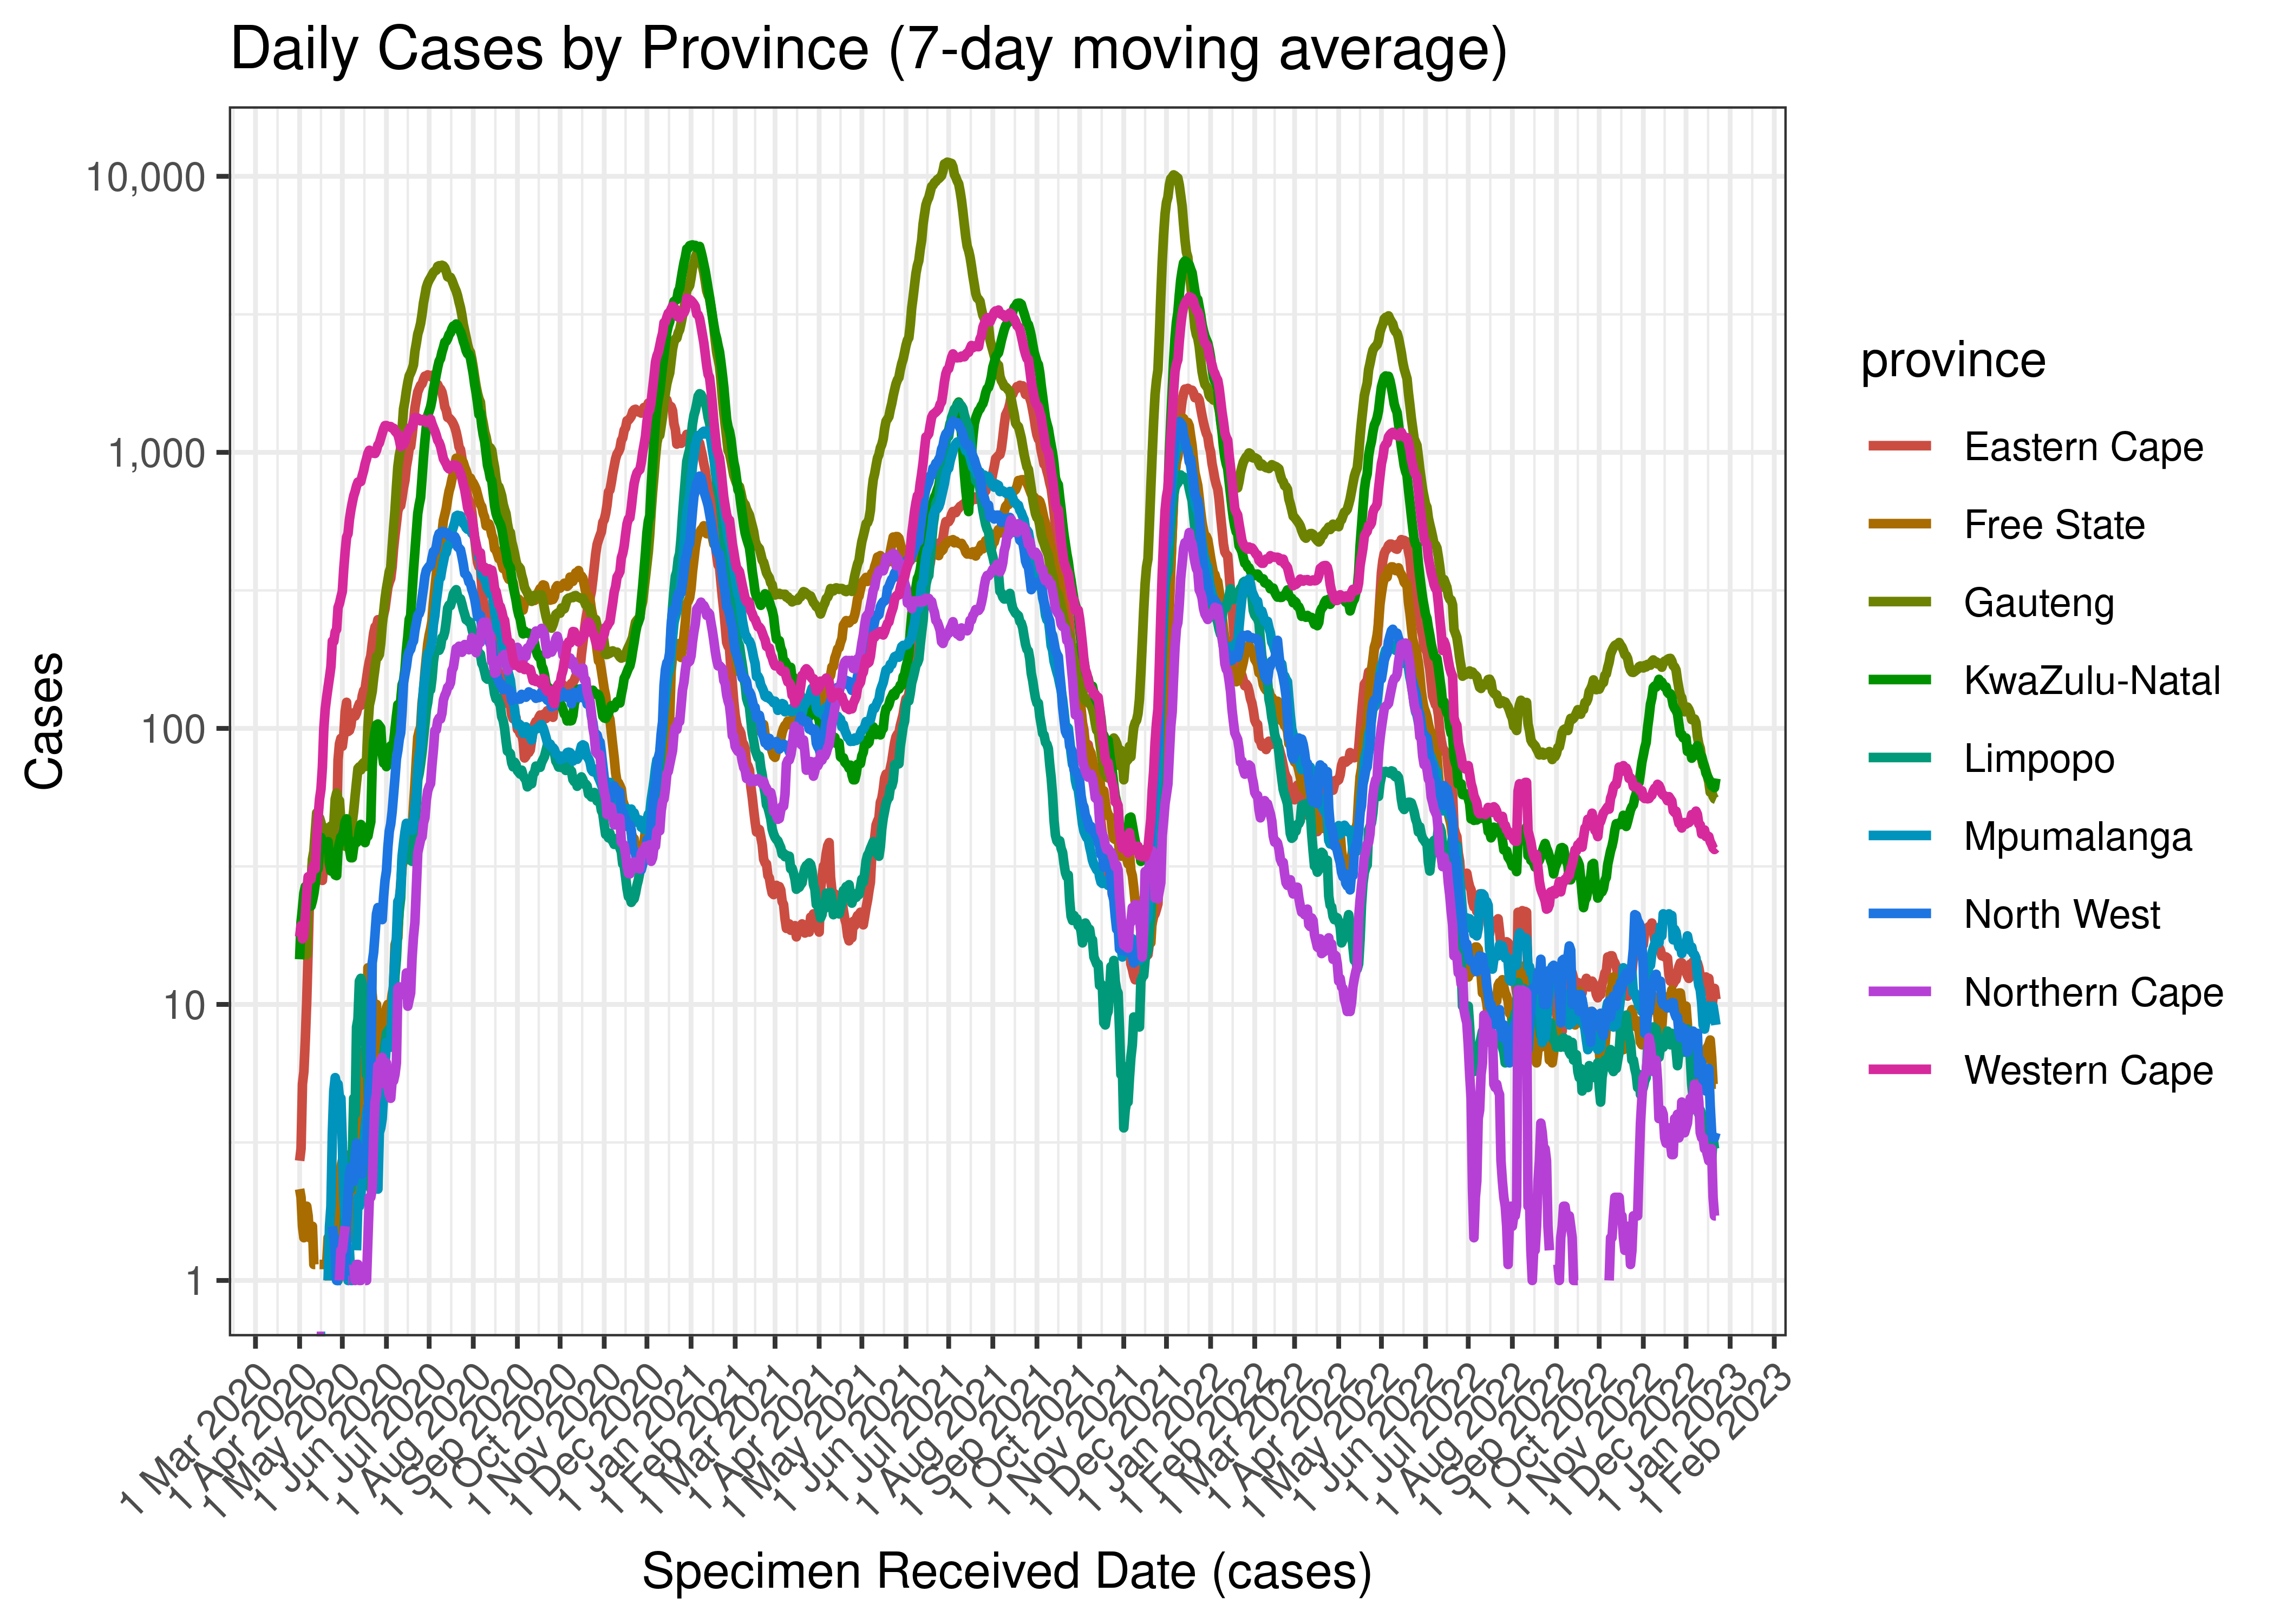
Daily Cases by Province (7-day moving average)
Below the above chart is repeated for the last 30-days:

Daily Cases for Last 30-days by Province (7-day moving average)
6.1.6 Hospital Admissions
Admissions are tabulated by report date below. A centred 7-day moving average is also shown. The peak daily admissions in previous waves (as measured by the moving average) is also shown.
| Reported Date | Hospital Admissions | 7-day Moving Average | Comment |
|---|---|---|---|
| 2020-07-31 | 694 | 1,436 | Wave 1 Peak |
| 2021-01-24 | 885 | 3,677 | Wave 2 Peak |
| 2021-07-12 | 1,890 | 2,129 | Wave 3 Peak |
| 2021-12-21 | 2,524 | 1,413 | Wave 4 Peak |
| 2022-05-12 | 537 | 732 | Wave 5 Peak (to date) |
| 2022-12-16 | 0 | 34 | |
| 2022-12-17 | 25 | 31 | |
| 2022-12-18 | 25 | 29 | |
| 2022-12-19 | 19 | 27 | |
| 2022-12-20 | 56 | 29 | |
| 2022-12-21 | 29 | NA | |
| 2022-12-22 | 33 | NA | |
| 2022-12-23 | 16 | NA |
The above are based on the following dates:
- Wave 1 started on 2020-01-01.
- Wave 2 started on 2020-10-01.
- Wave 3 started on 2021-04-01.
- Wave 4 started on 2021-11-01.
- Wave 5 started on 2022-04-01.
Below a 7-day moving average of daily hospital admissions is plotted by on a log scale since start of the epidemic. Note admissions are plotted by reported date.
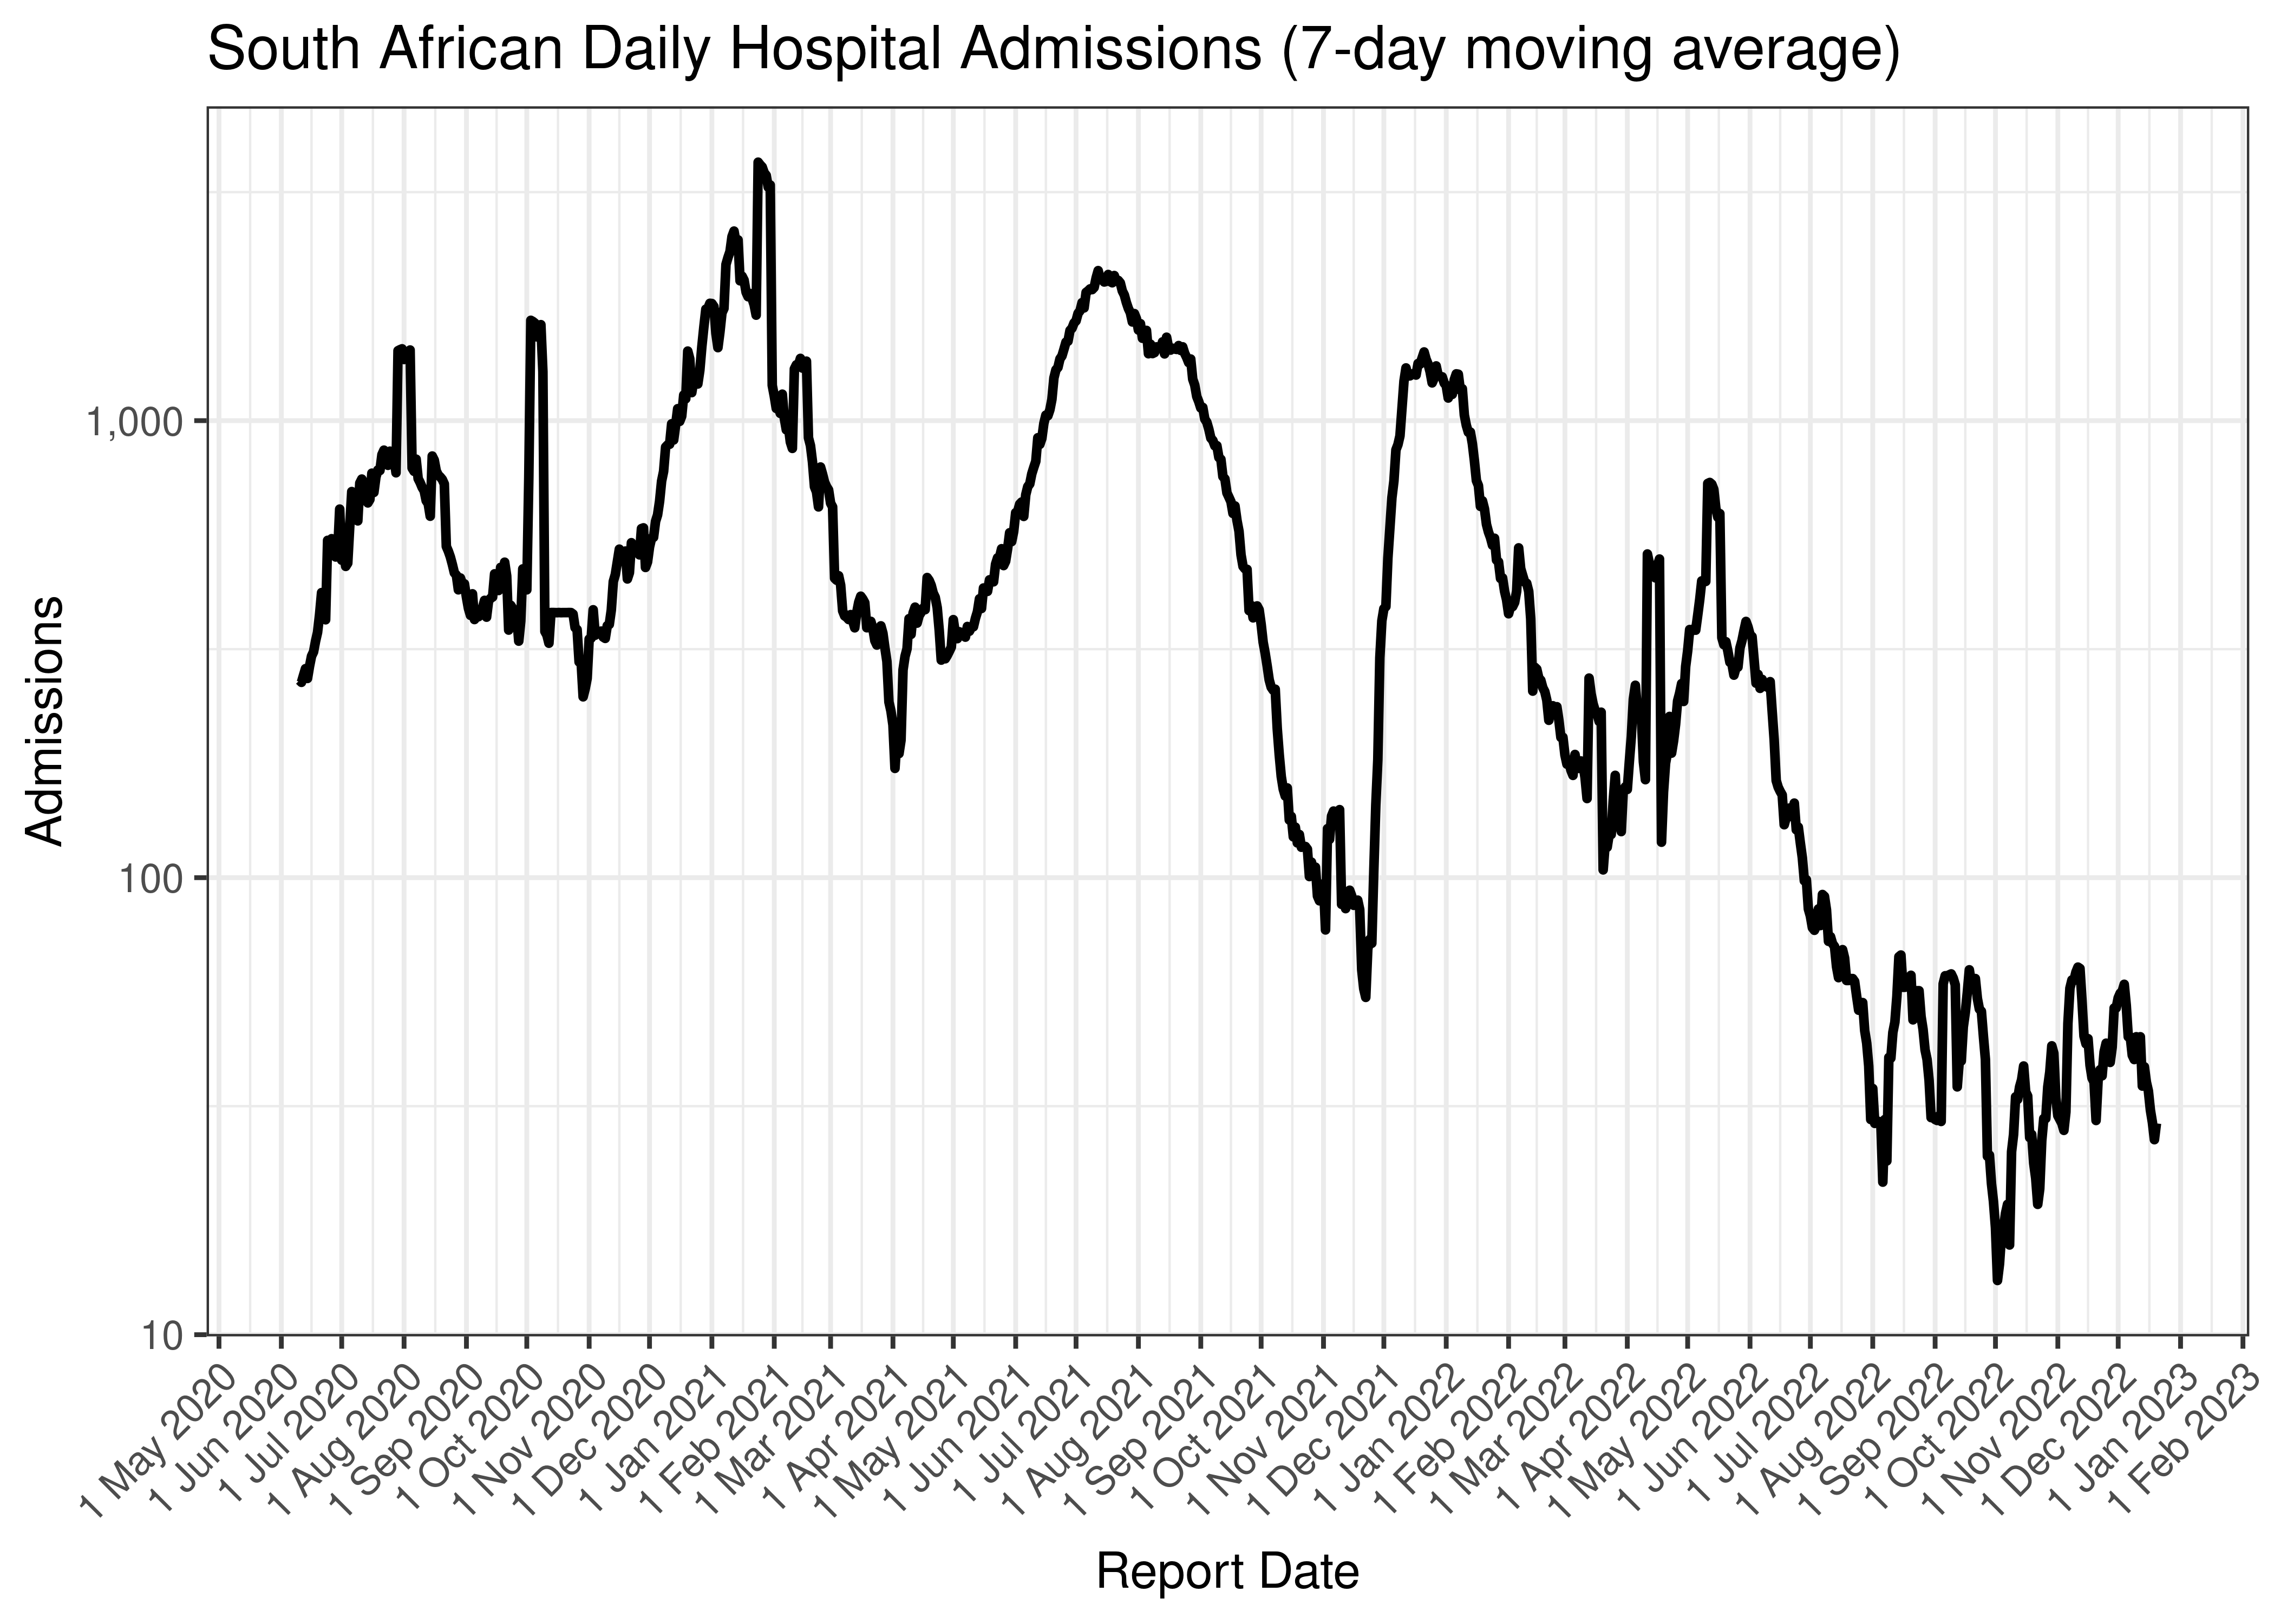
South African Daily Hospital Admissions (7-day moving average)
Below the above chart is repeated for the last 30-days:
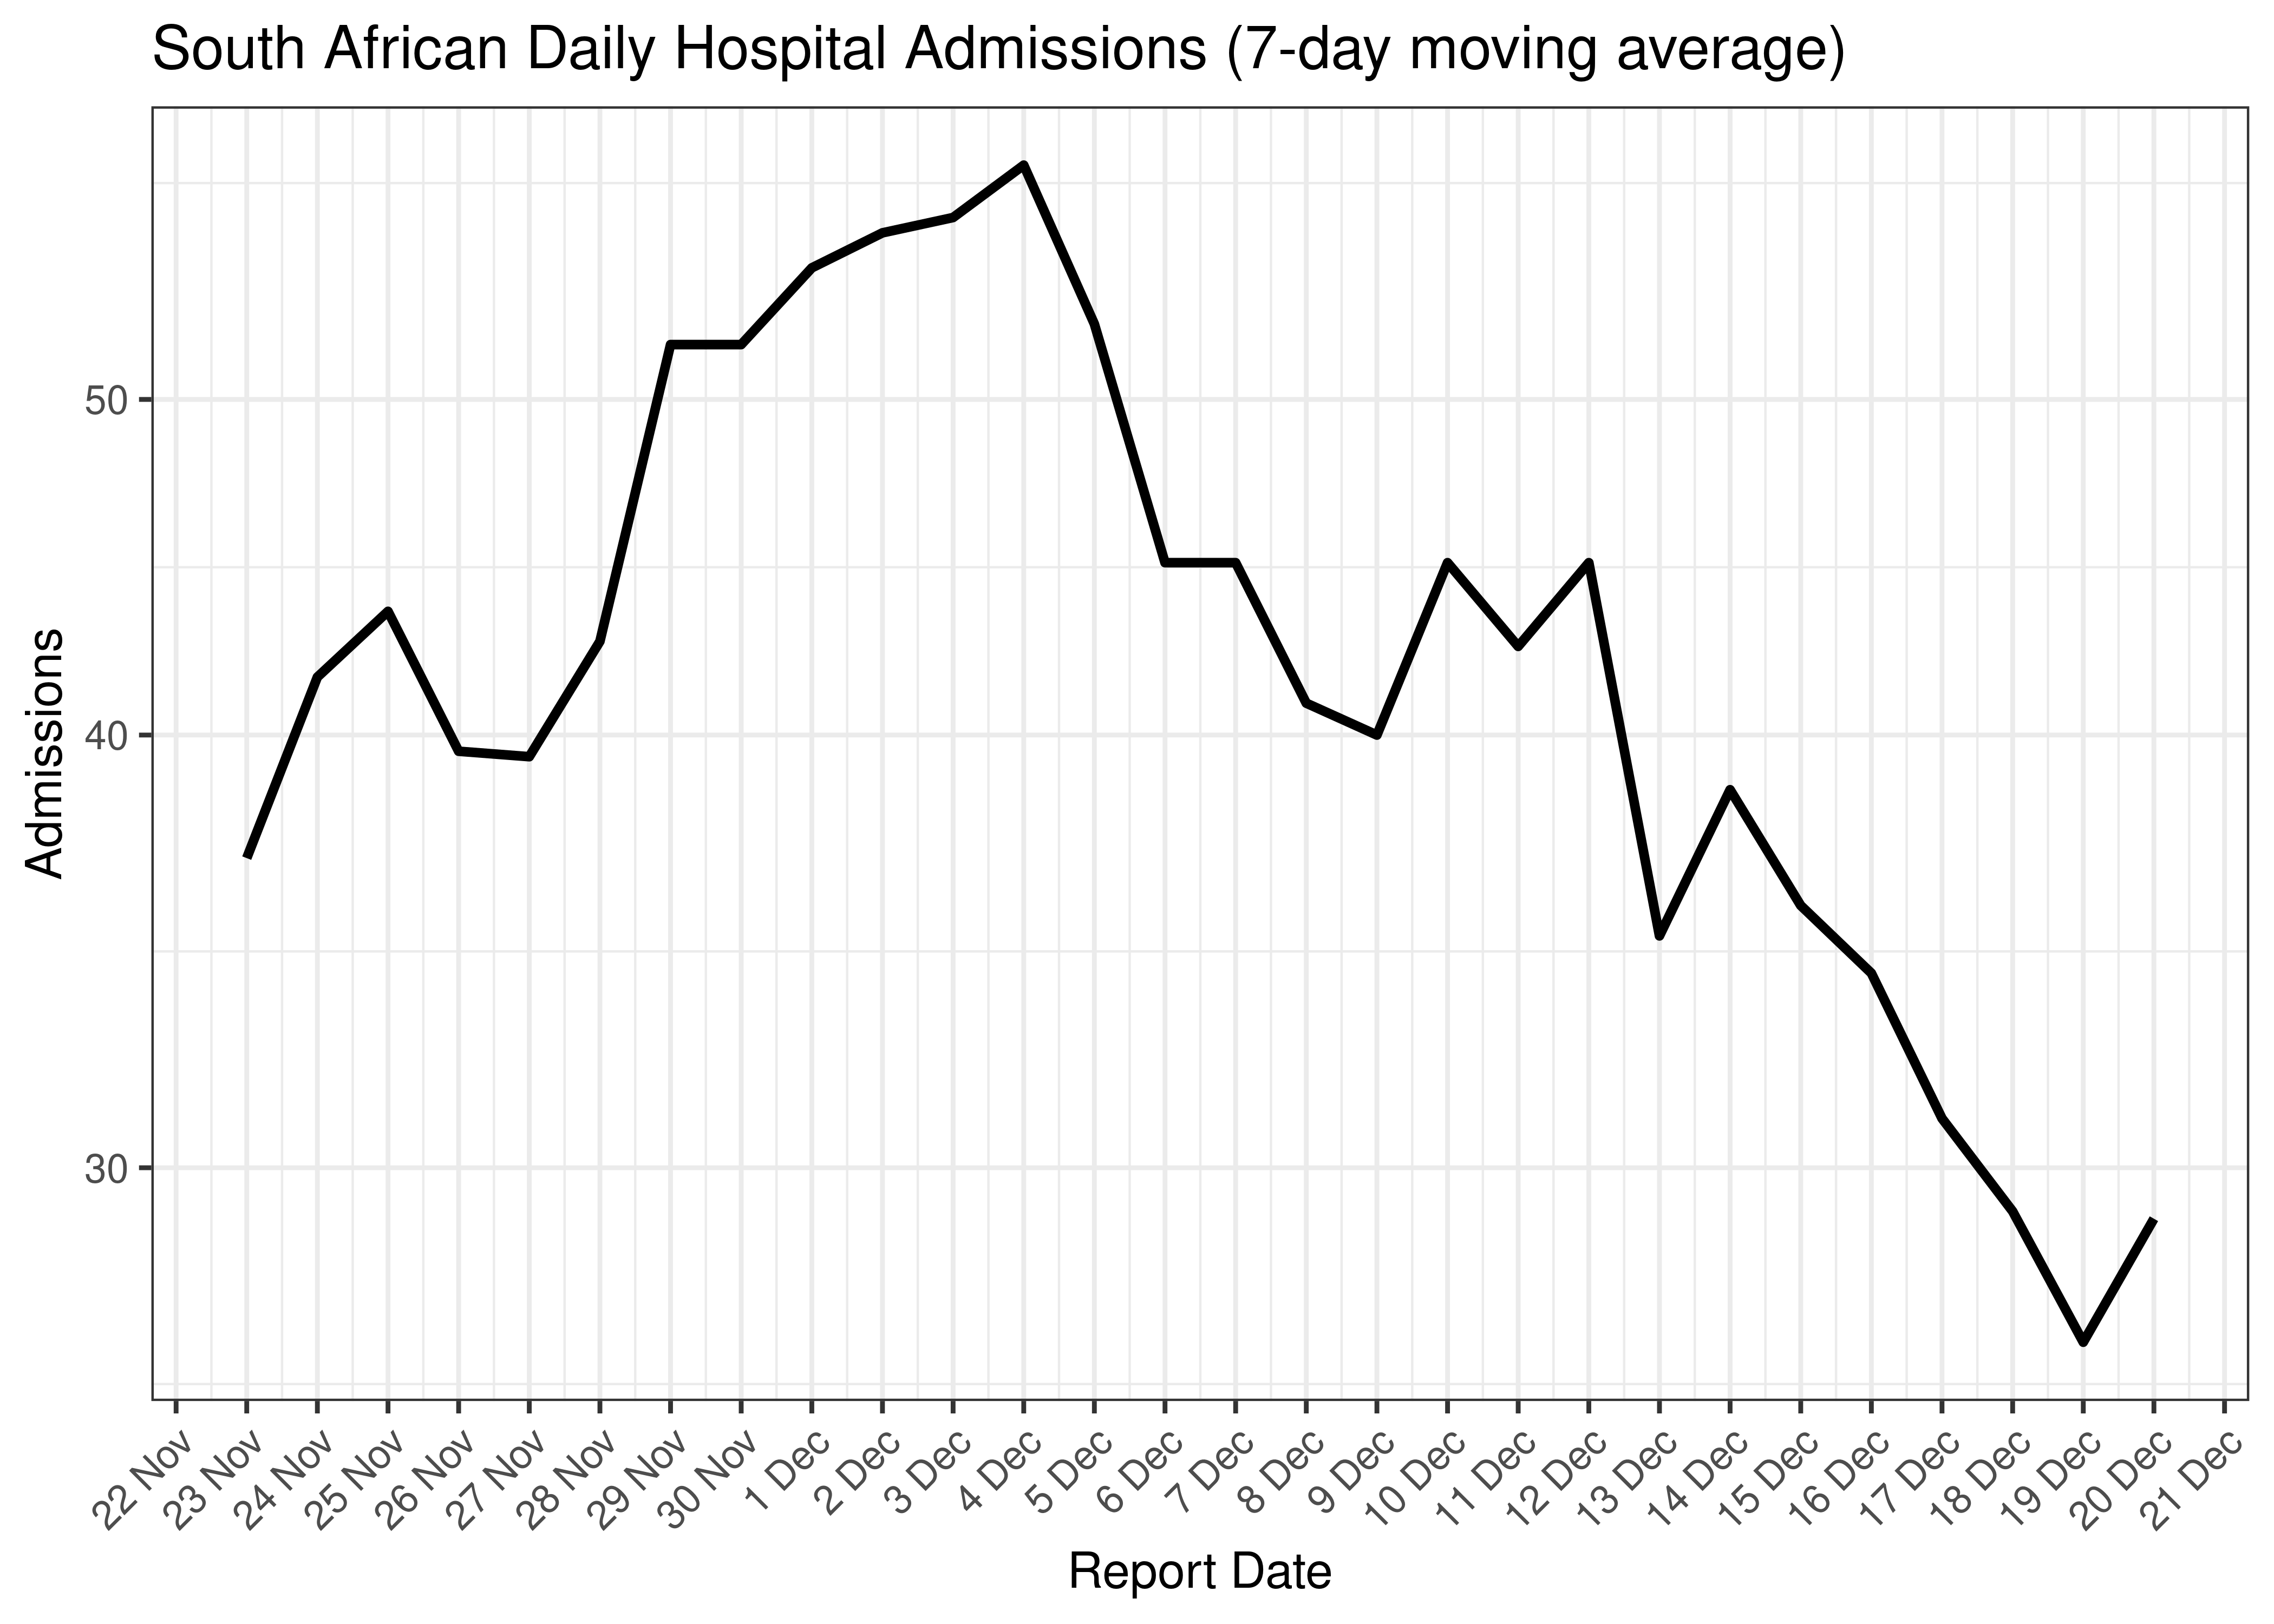
South African Daily Hospital Admissions for Last 30-days (7-day moving average)
Below a 7-day moving average daily admissions are plotted by province on a log scale since start of the epidemic:
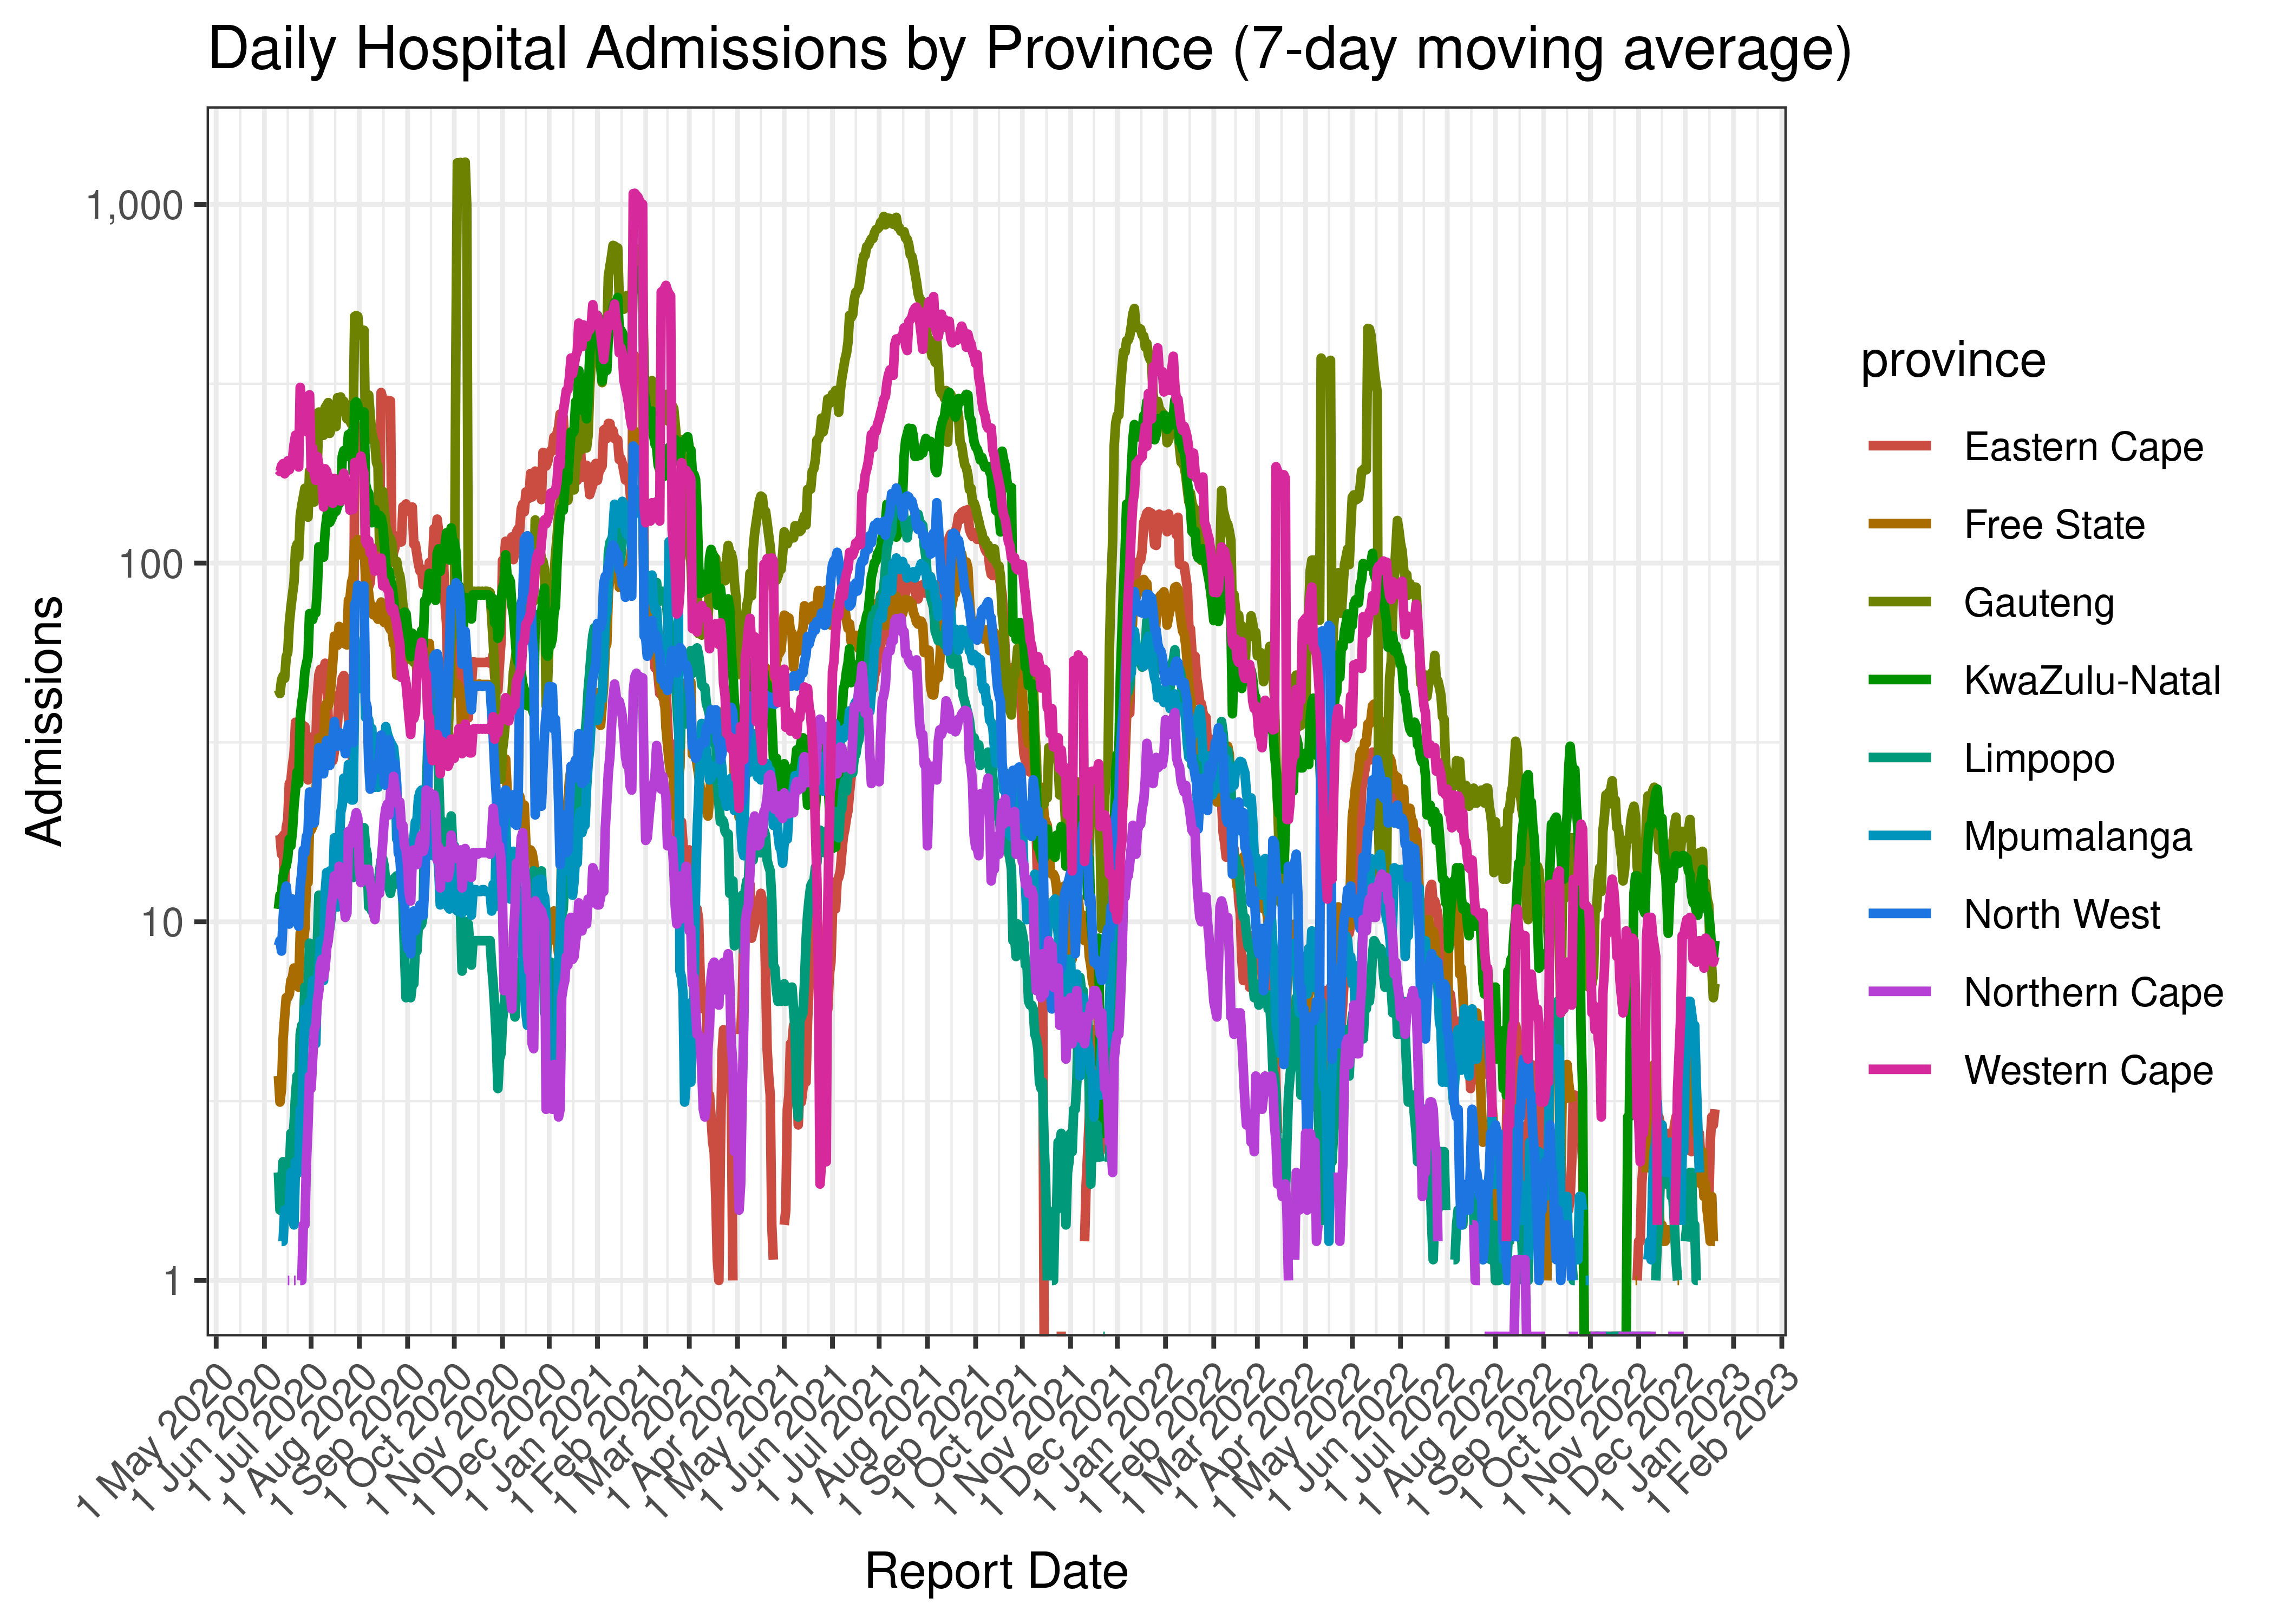
Daily Hospital Admissions by Province (7-day moving average)
Below the above chart is repeated for the last 30-days:
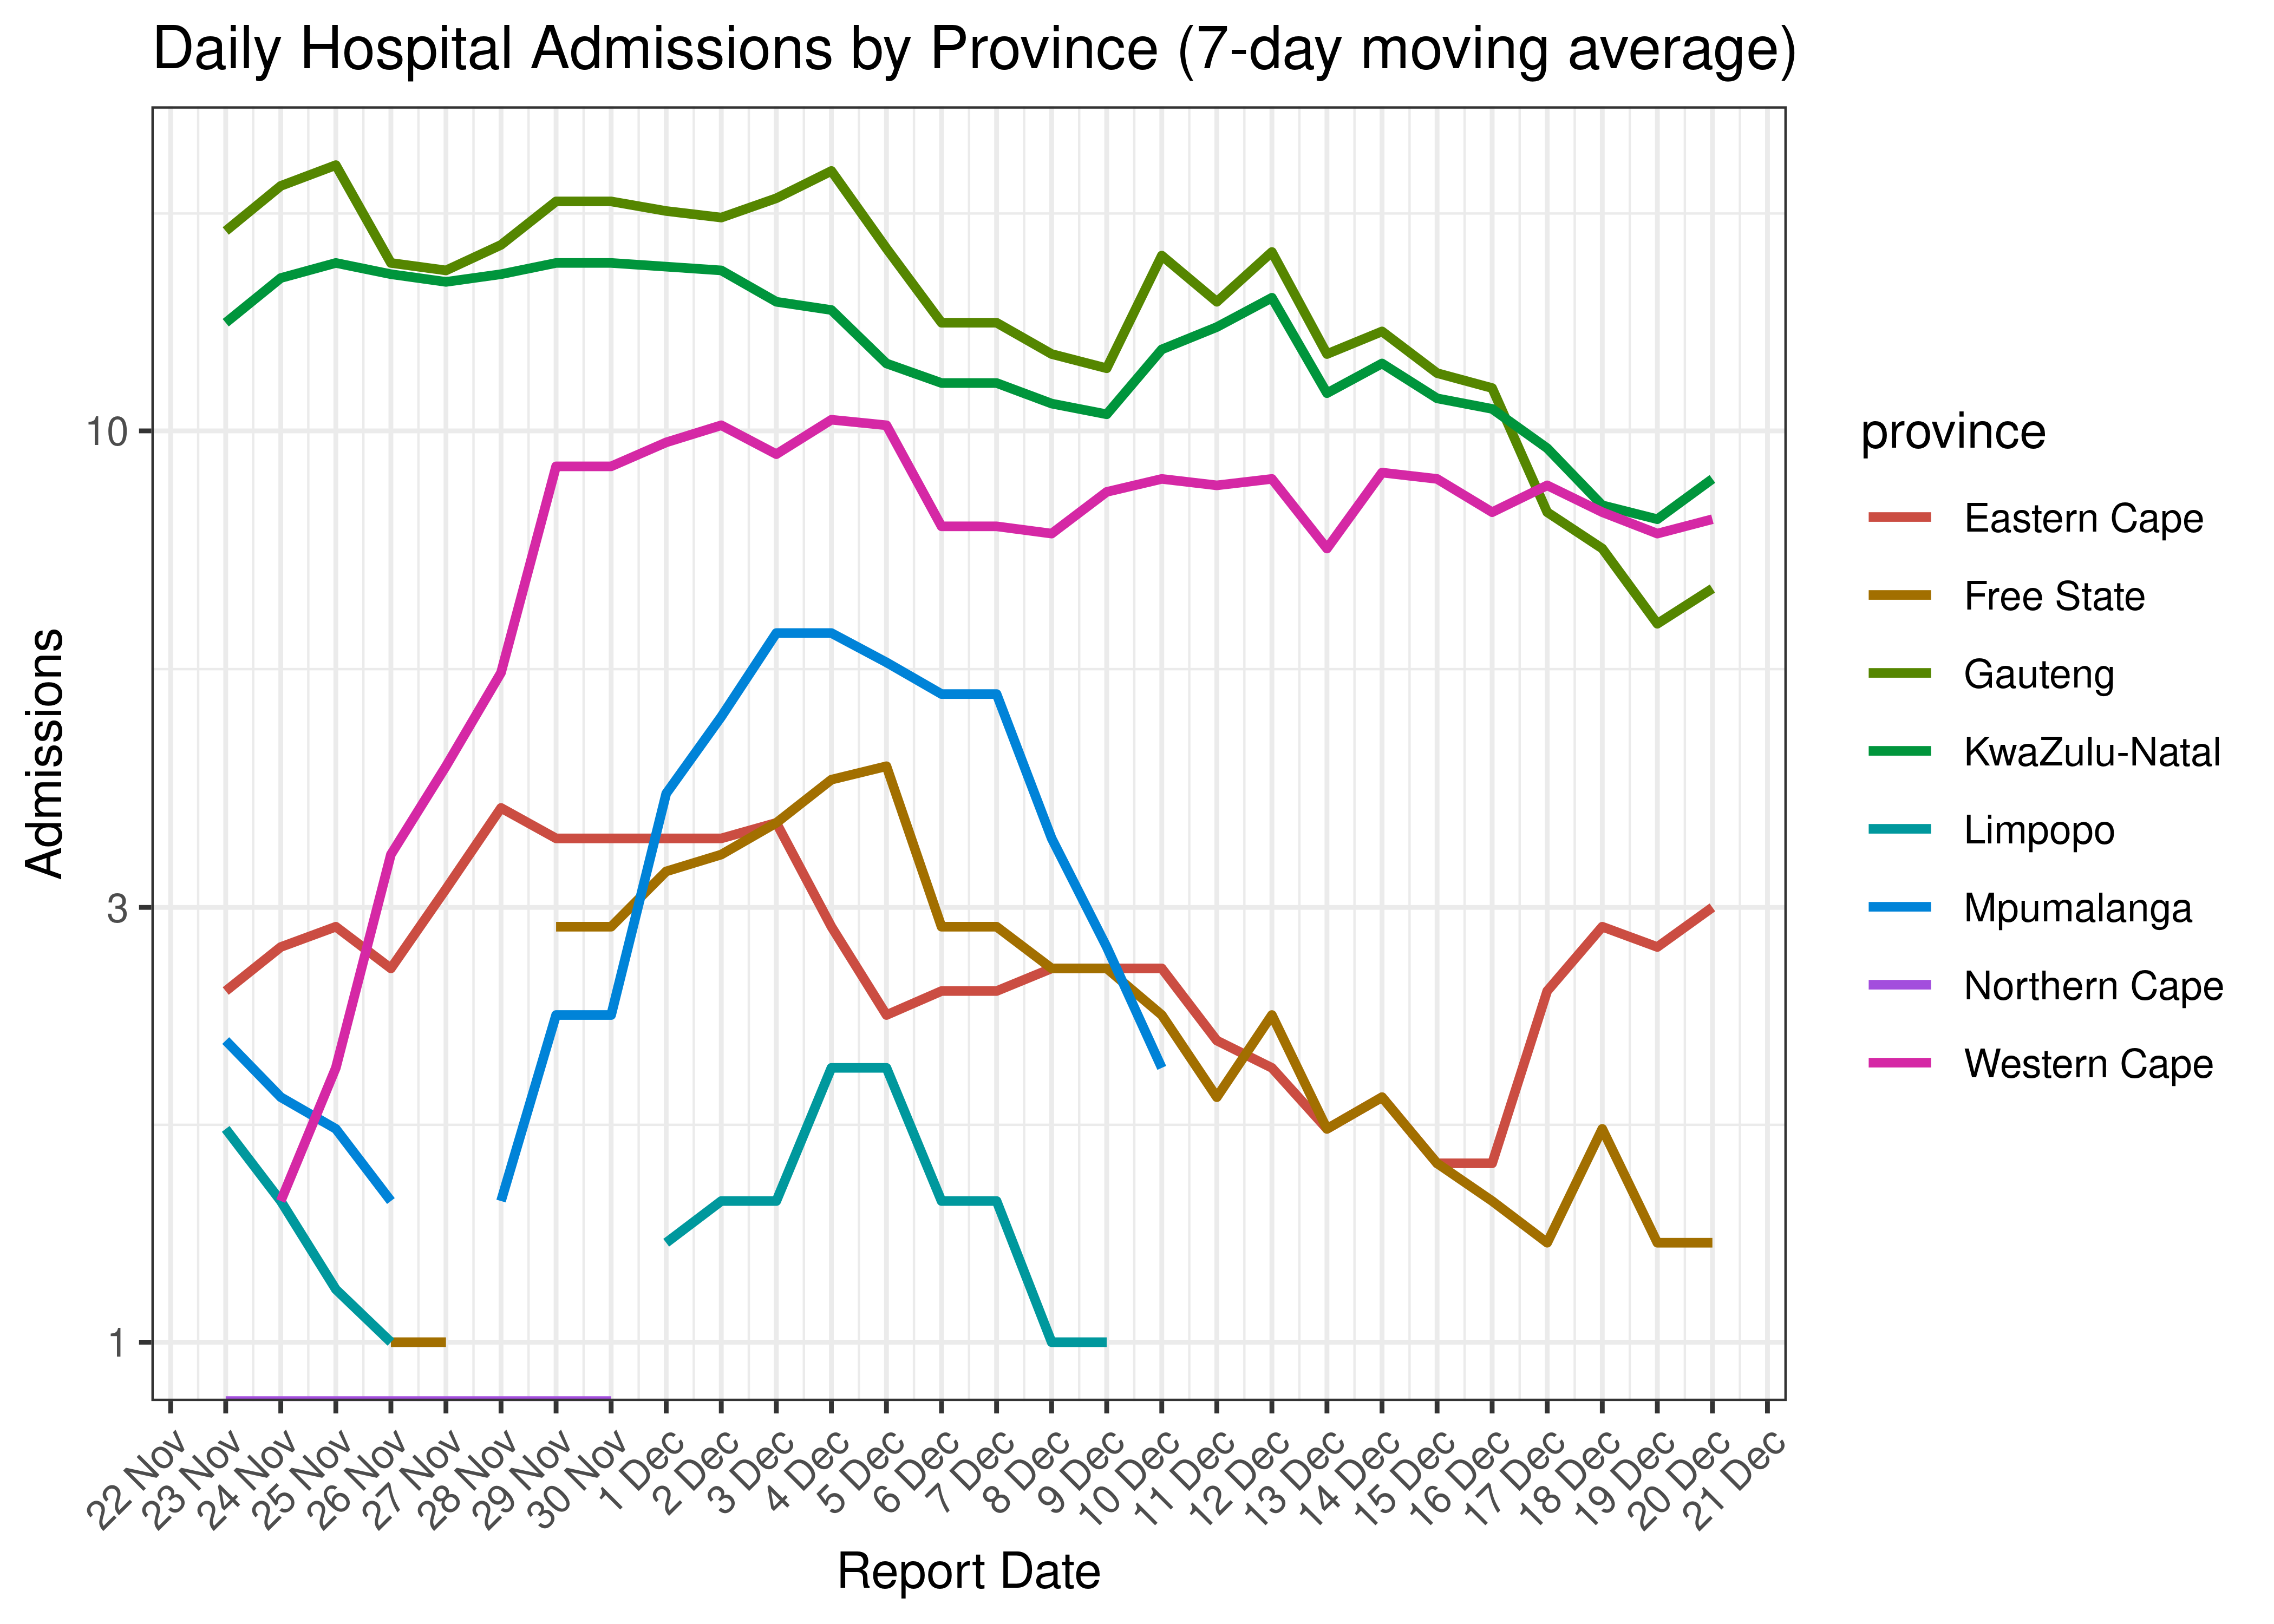
Daily Hospital Admissions for Last 30-days by Province (7-day moving average)
6.1.7 Hospital Deaths
Hospital deaths are tabulated by report date below. A centred 7-day moving average is also shown. The peak daily deaths in previous waves (as measured by the moving average) is also shown.
Note that hospital deaths underestimates total COVID-19 deaths in South Africa.
| Reported Date | Hospital Deaths | 7-day Moving Average | Comment |
|---|---|---|---|
| 2020-08-04 | 204 | 218 | Wave 1 Peak |
| 2021-01-14 | 672 | 637 | Wave 2 Peak |
| 2021-07-23 | 642 | 542 | Wave 3 Peak |
| 2022-01-09 | 46 | 200 | Wave 4 Peak |
| 2022-04-17 | 1 | 64 | Wave 5 Peak (to date) |
| 2022-12-16 | 0 | 3 | |
| 2022-12-17 | 1 | 2 | |
| 2022-12-18 | 0 | 2 | |
| 2022-12-19 | 1 | 2 | |
| 2022-12-20 | 4 | 2 | |
| 2022-12-21 | 5 | NA | |
| 2022-12-22 | 1 | NA | |
| 2022-12-23 | 1 | NA |
The above are based on the following dates:
- Wave 1 started on 2020-01-01.
- Wave 2 started on 2020-10-01.
- Wave 3 started on 2021-04-01.
- Wave 4 started on 2021-11-01.
- Wave 5 started on 2022-04-01.
Below a 7-day moving average of daily hospital deaths is plotted by on a log scale since start of the epidemic. Note hospital deaths are plotted by reported date.
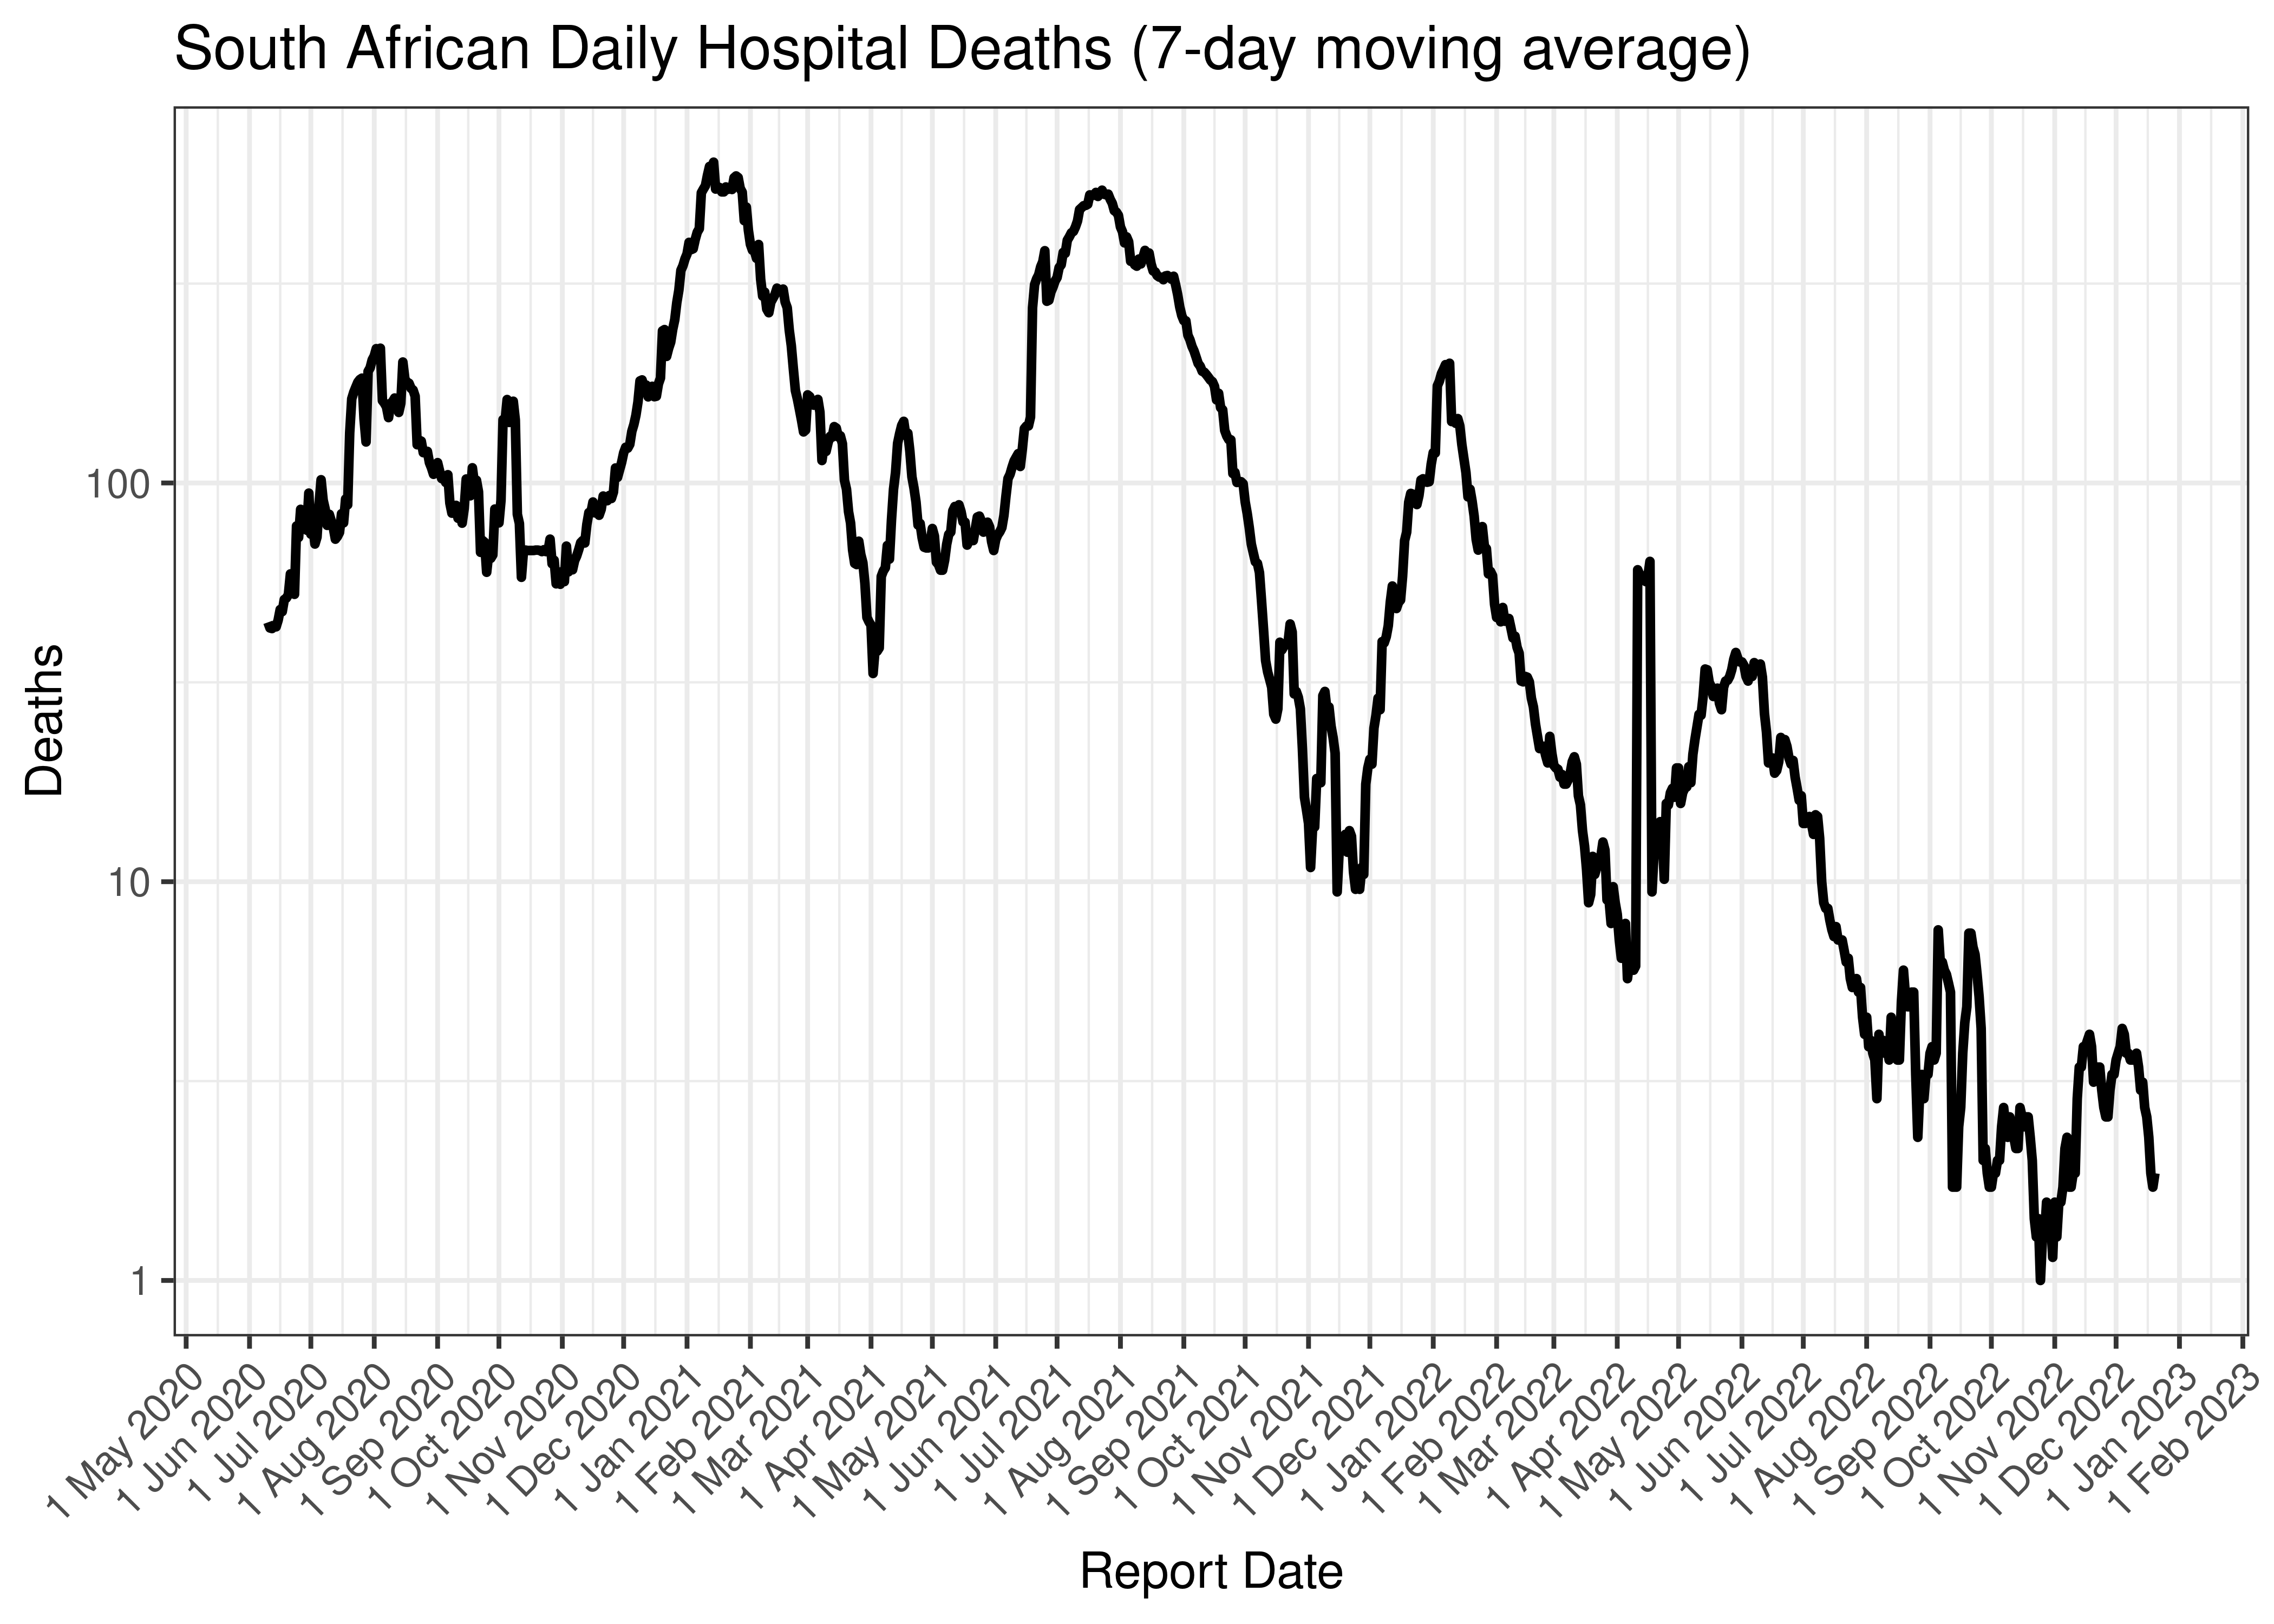
Daily Hospital Deaths (7-day moving average)
Below the above chart is repeated for the last 30-days:
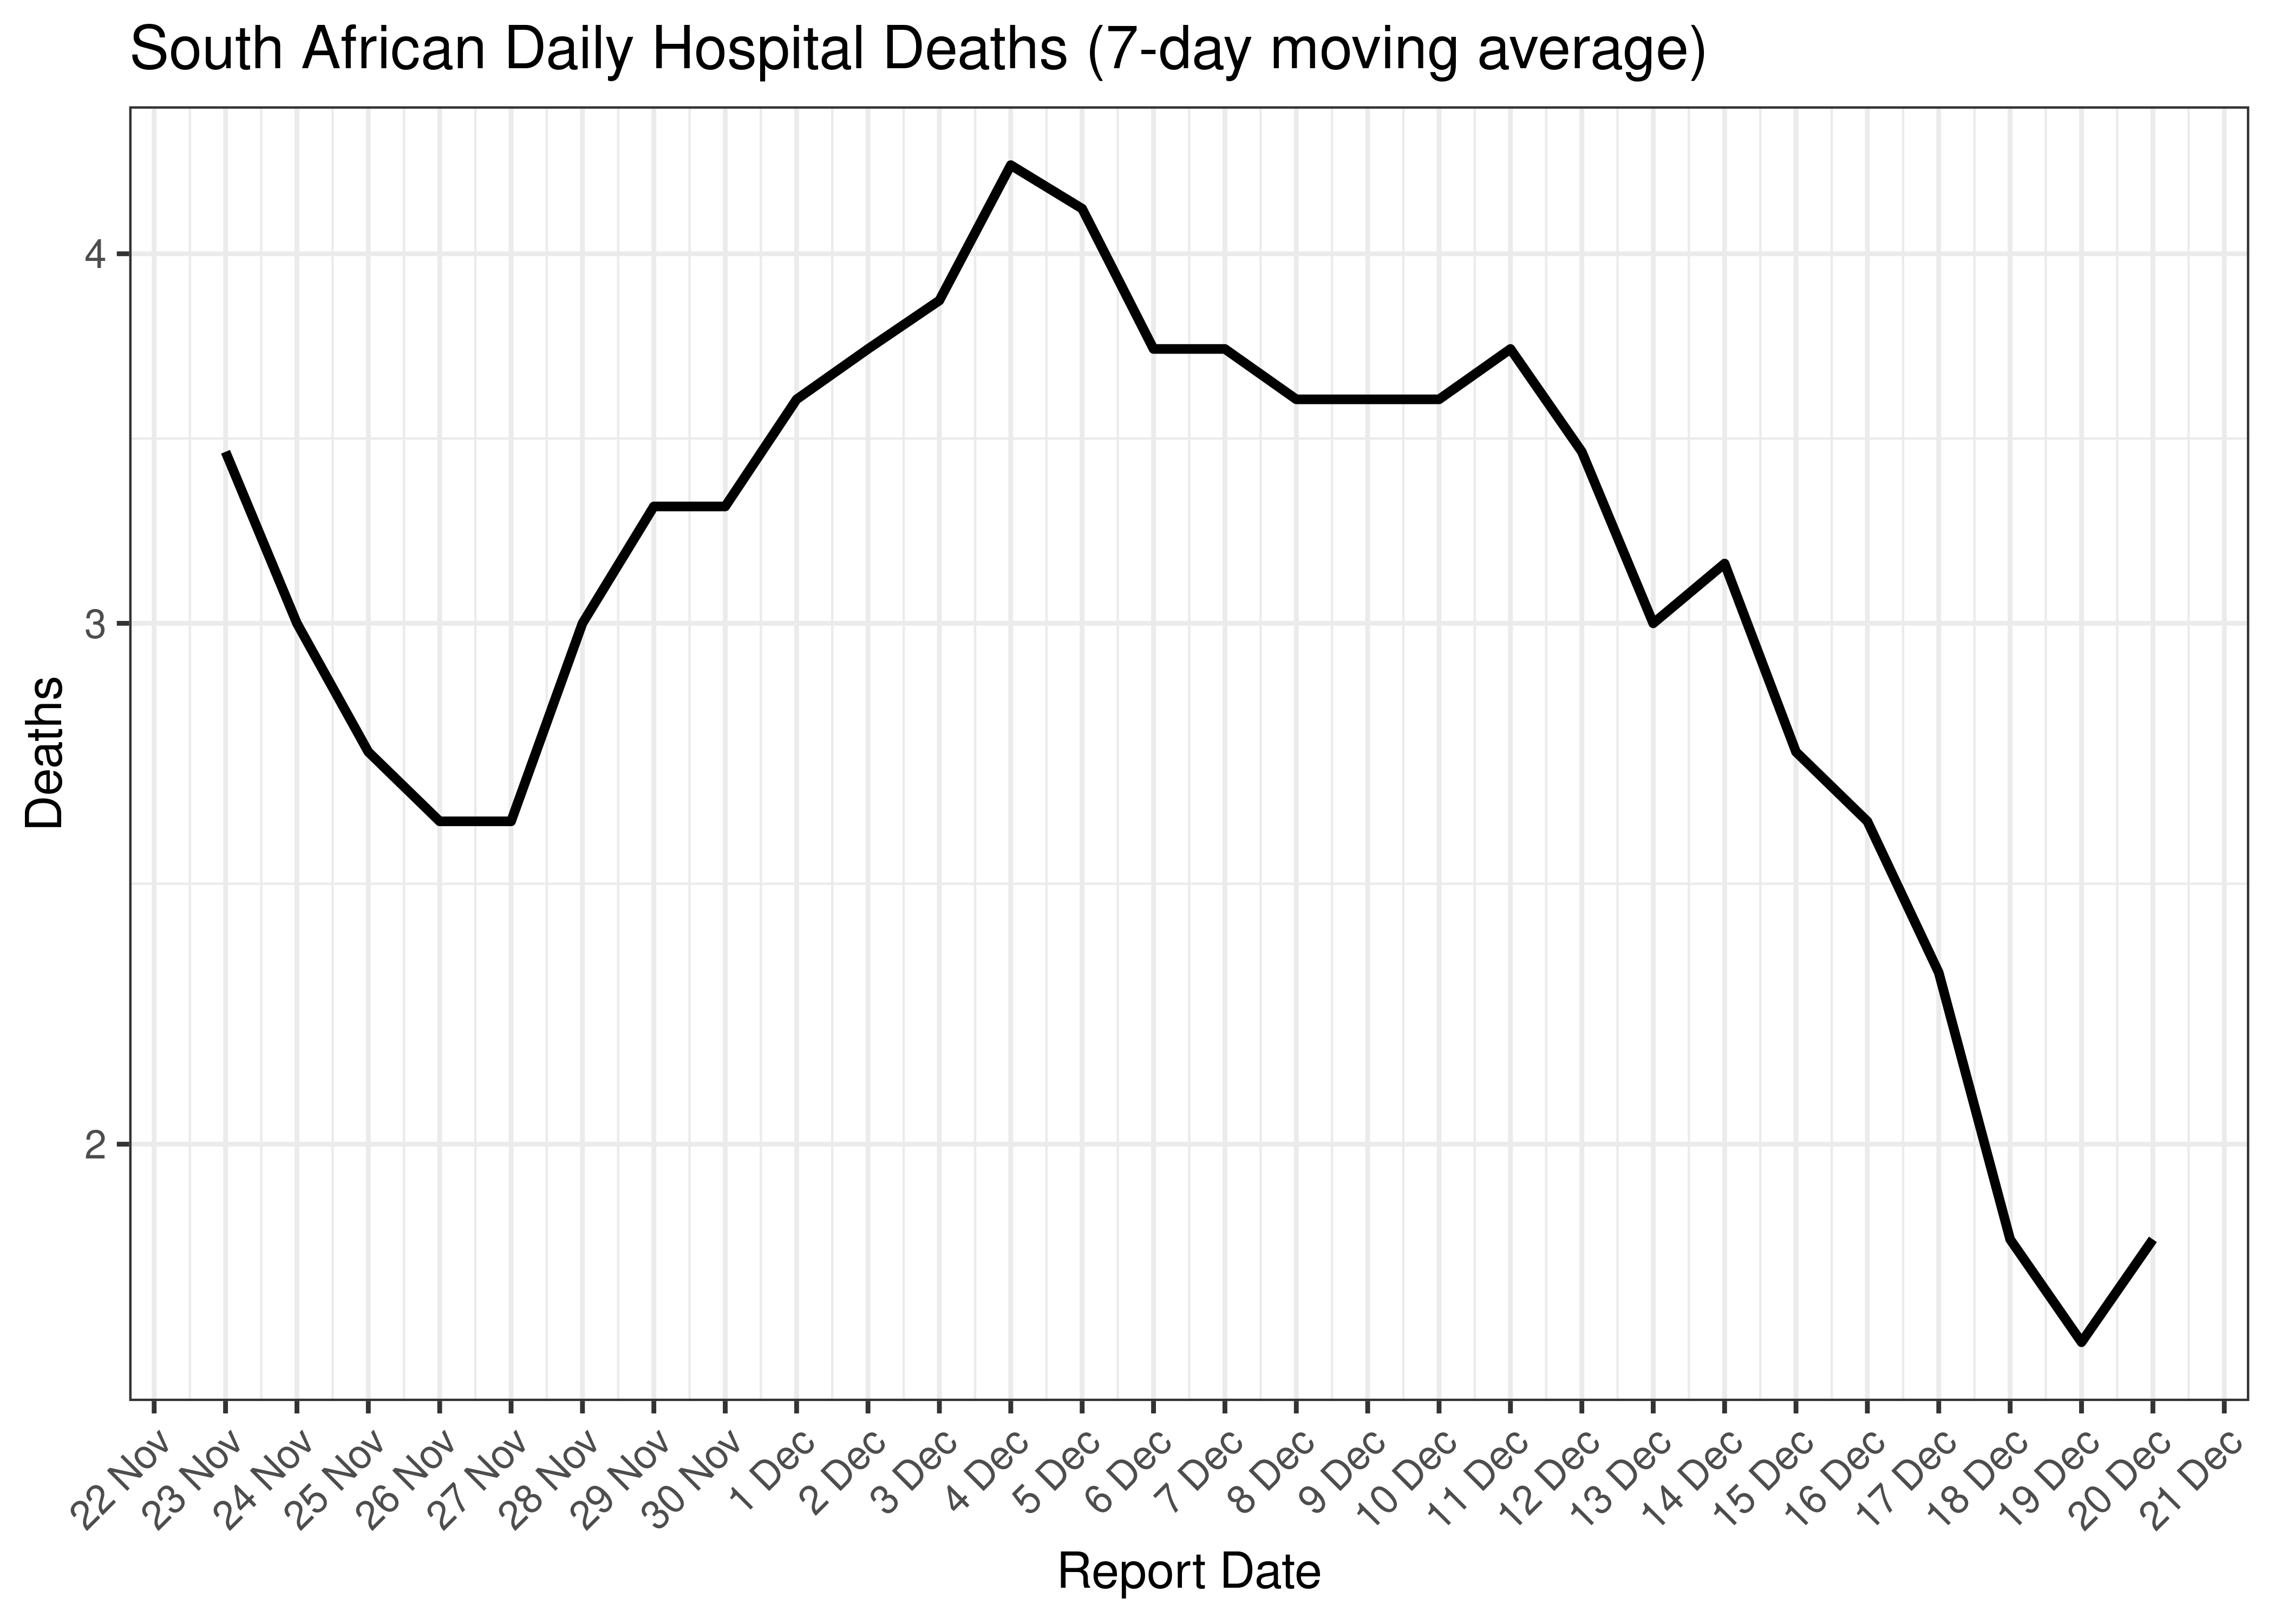
South African Daily Hospital Deaths for Last 30-days (7-day moving average)
Below a 7-day moving average daily hospital deaths are plotted by province on a log scale since start of the epidemic:
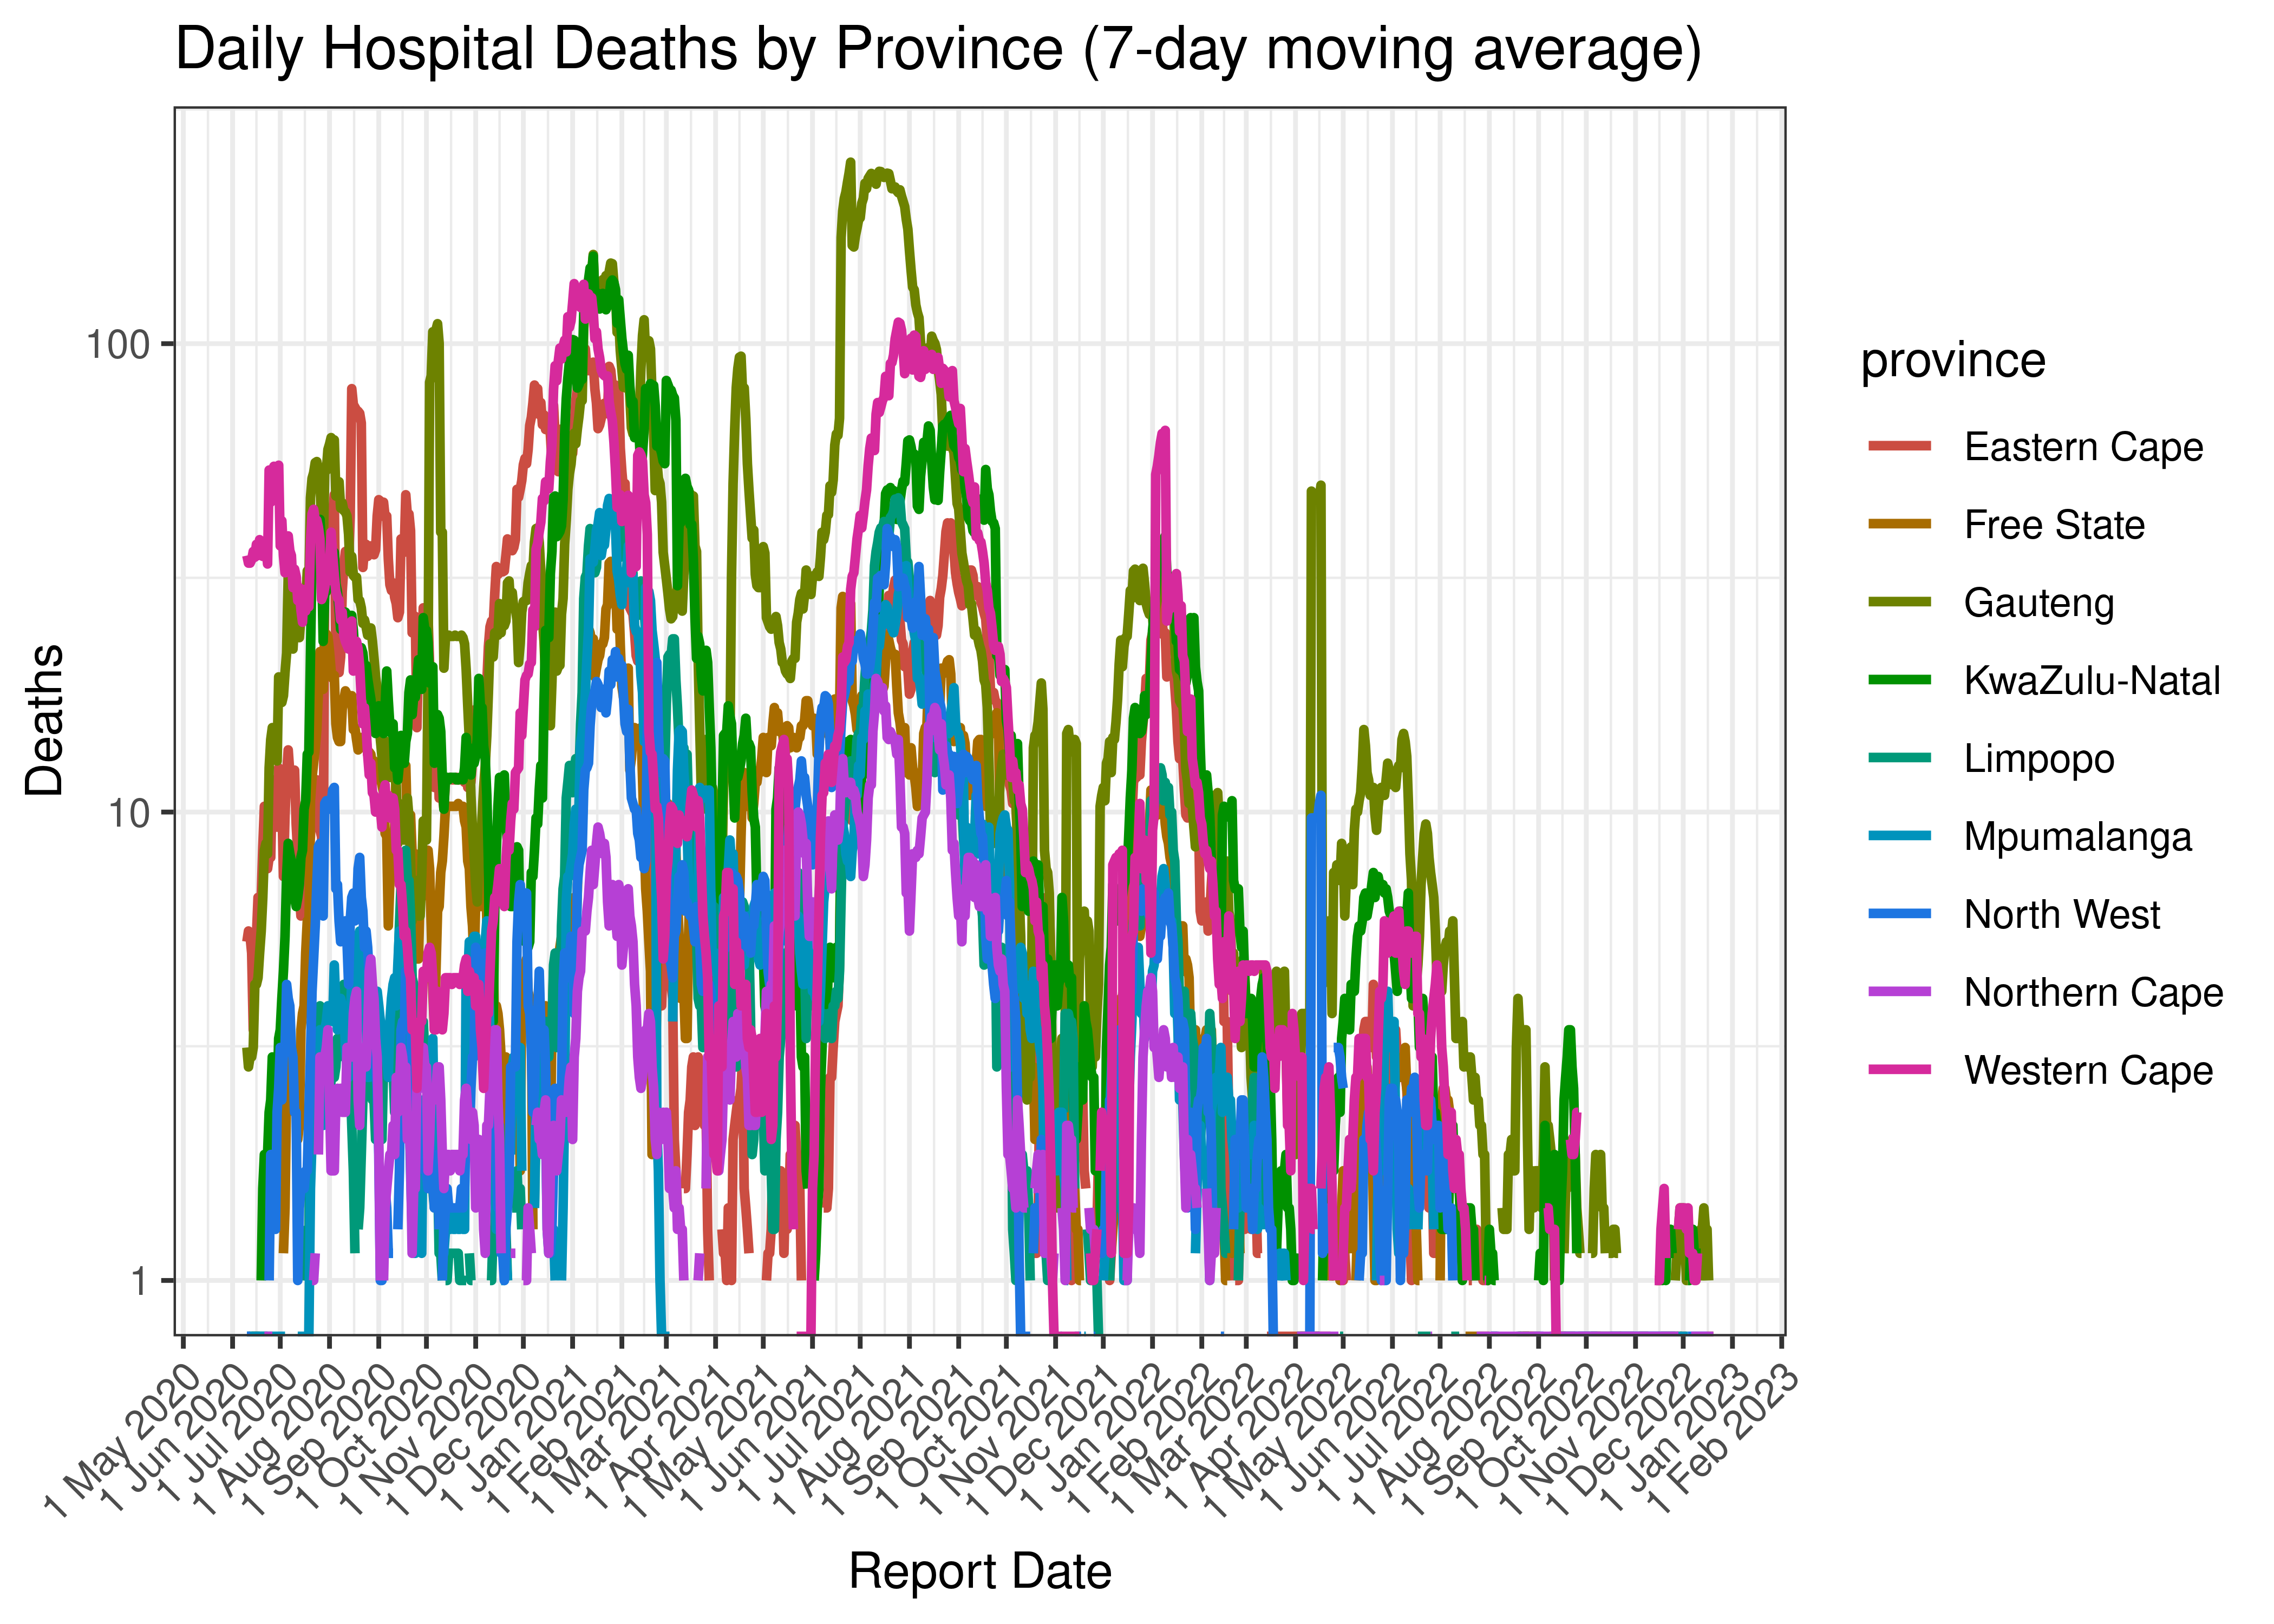
Daily Hospital Deaths by Province (7-day moving average)
Below the above chart is repeated for the last 30-days:
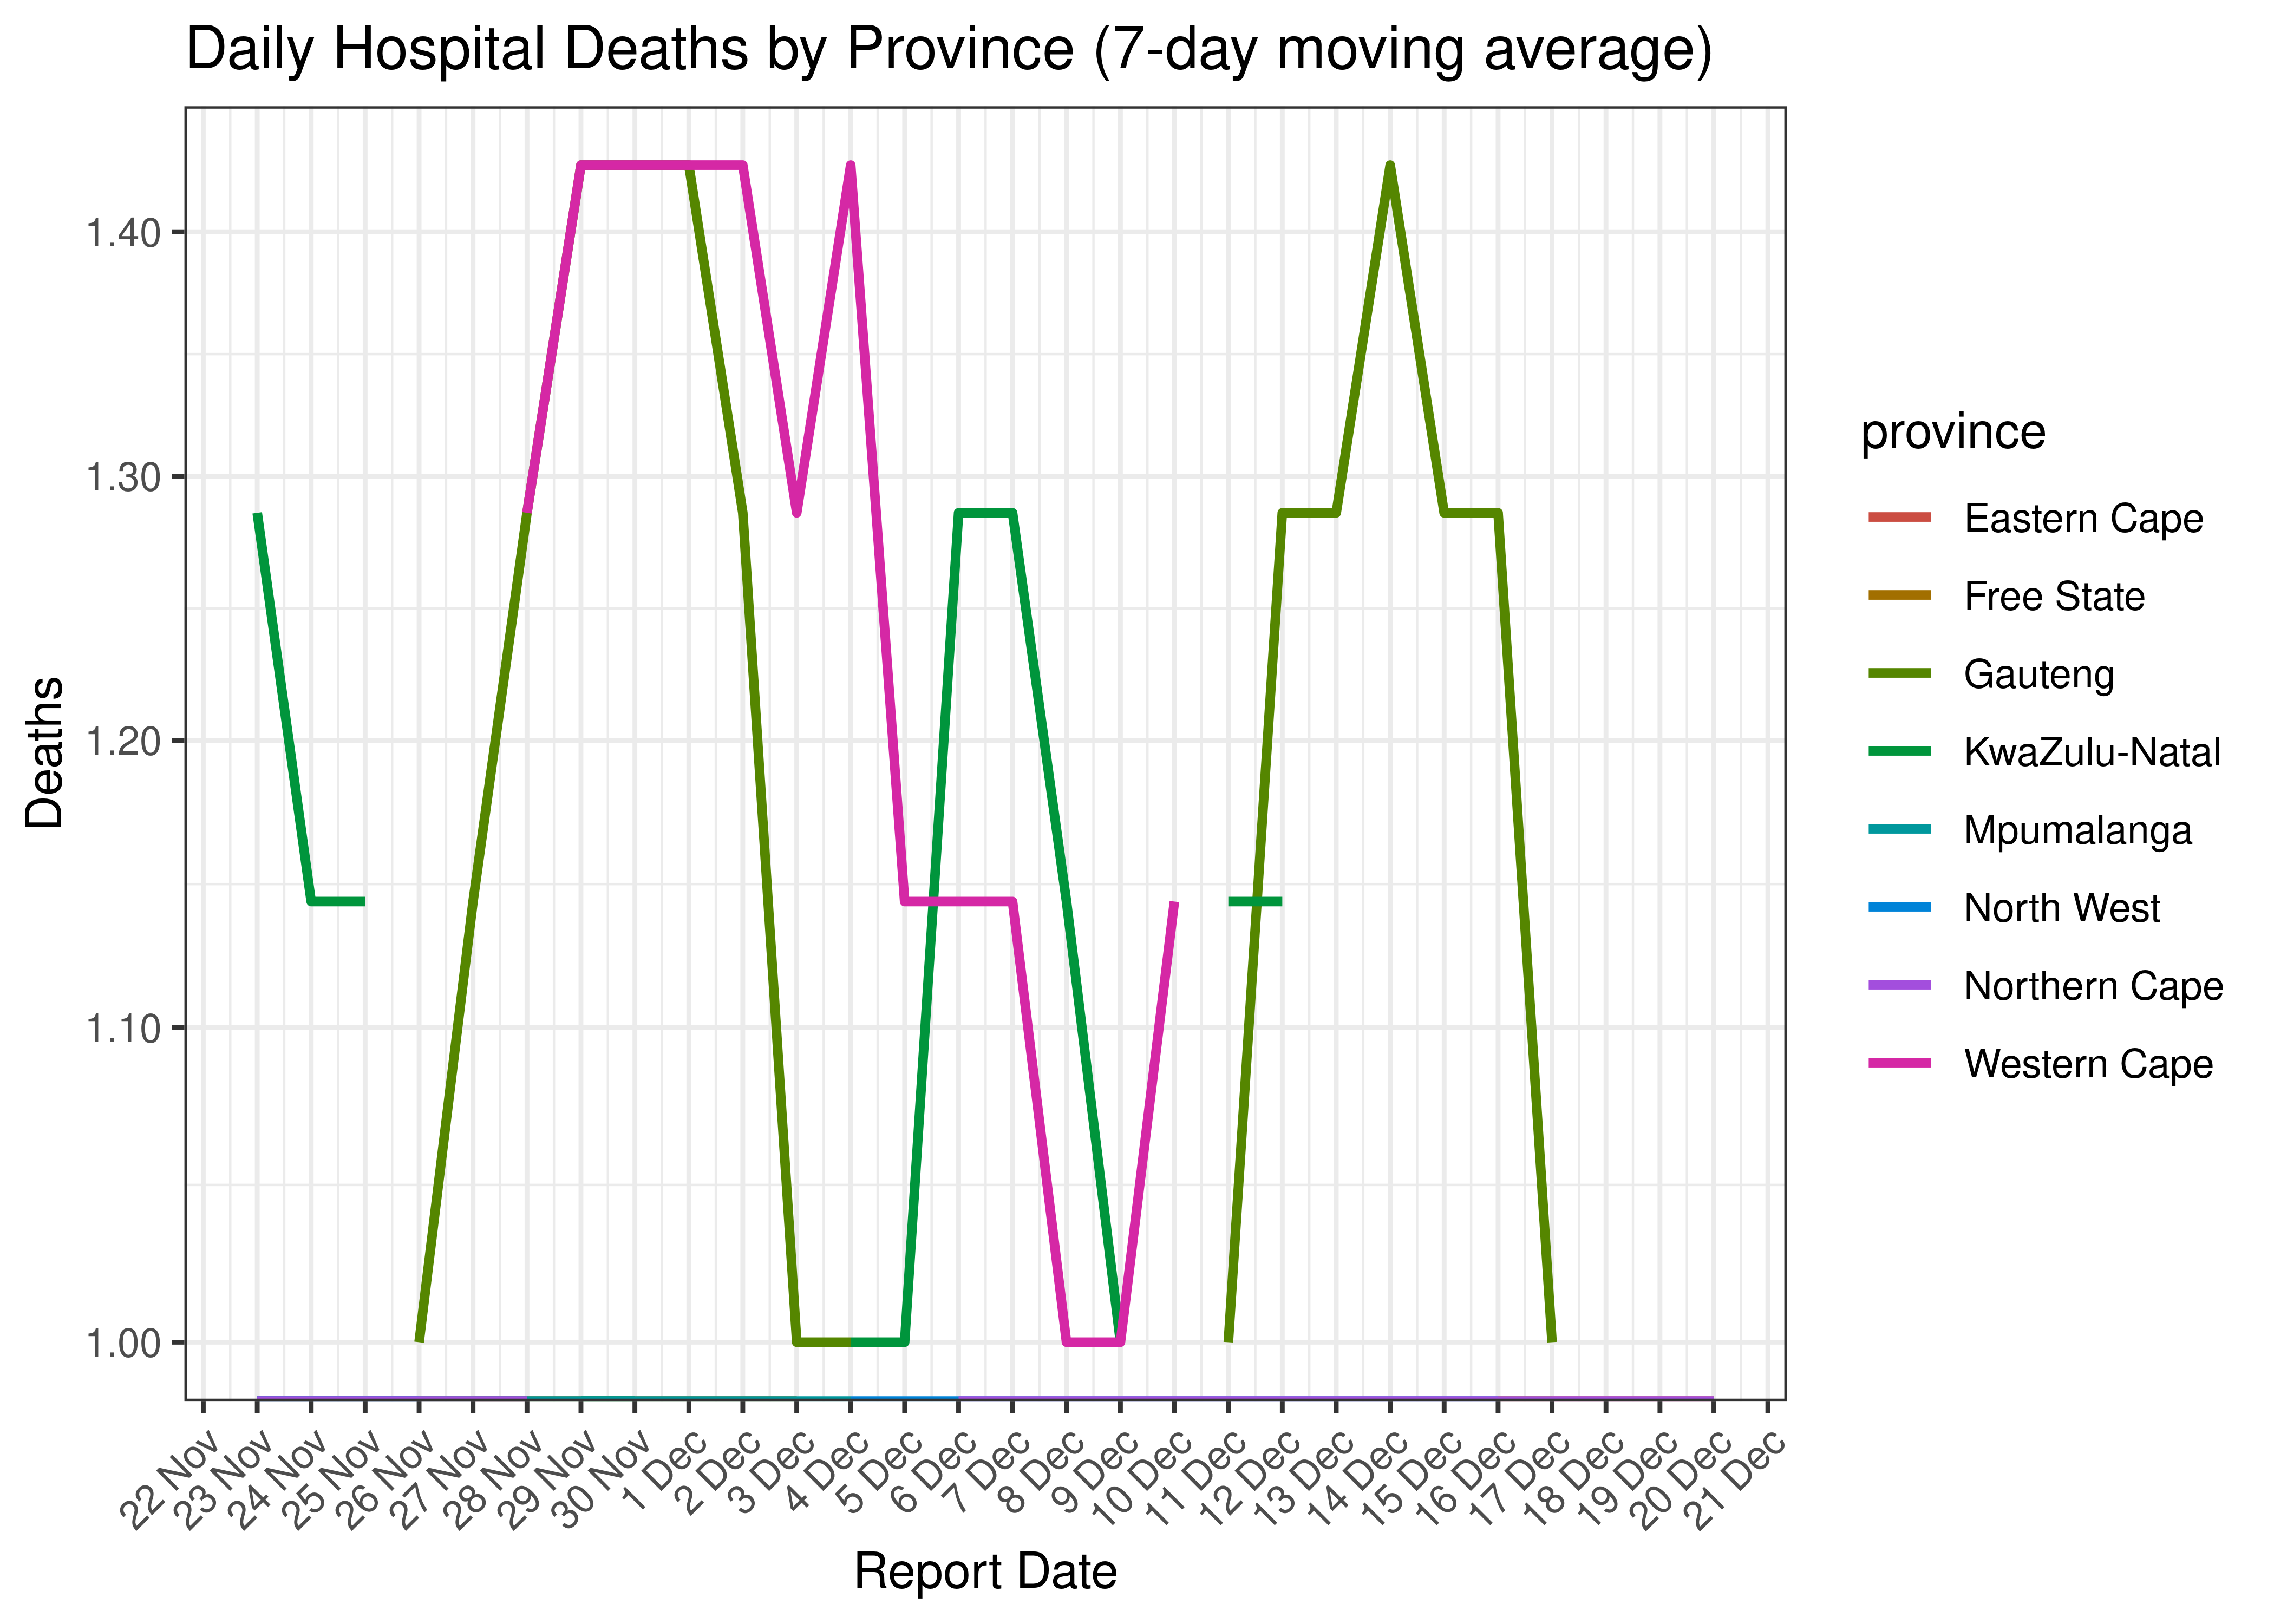
Daily Hospital Deaths for Last 30-days by Province (7-day moving average)
6.1.8 Excess Deaths
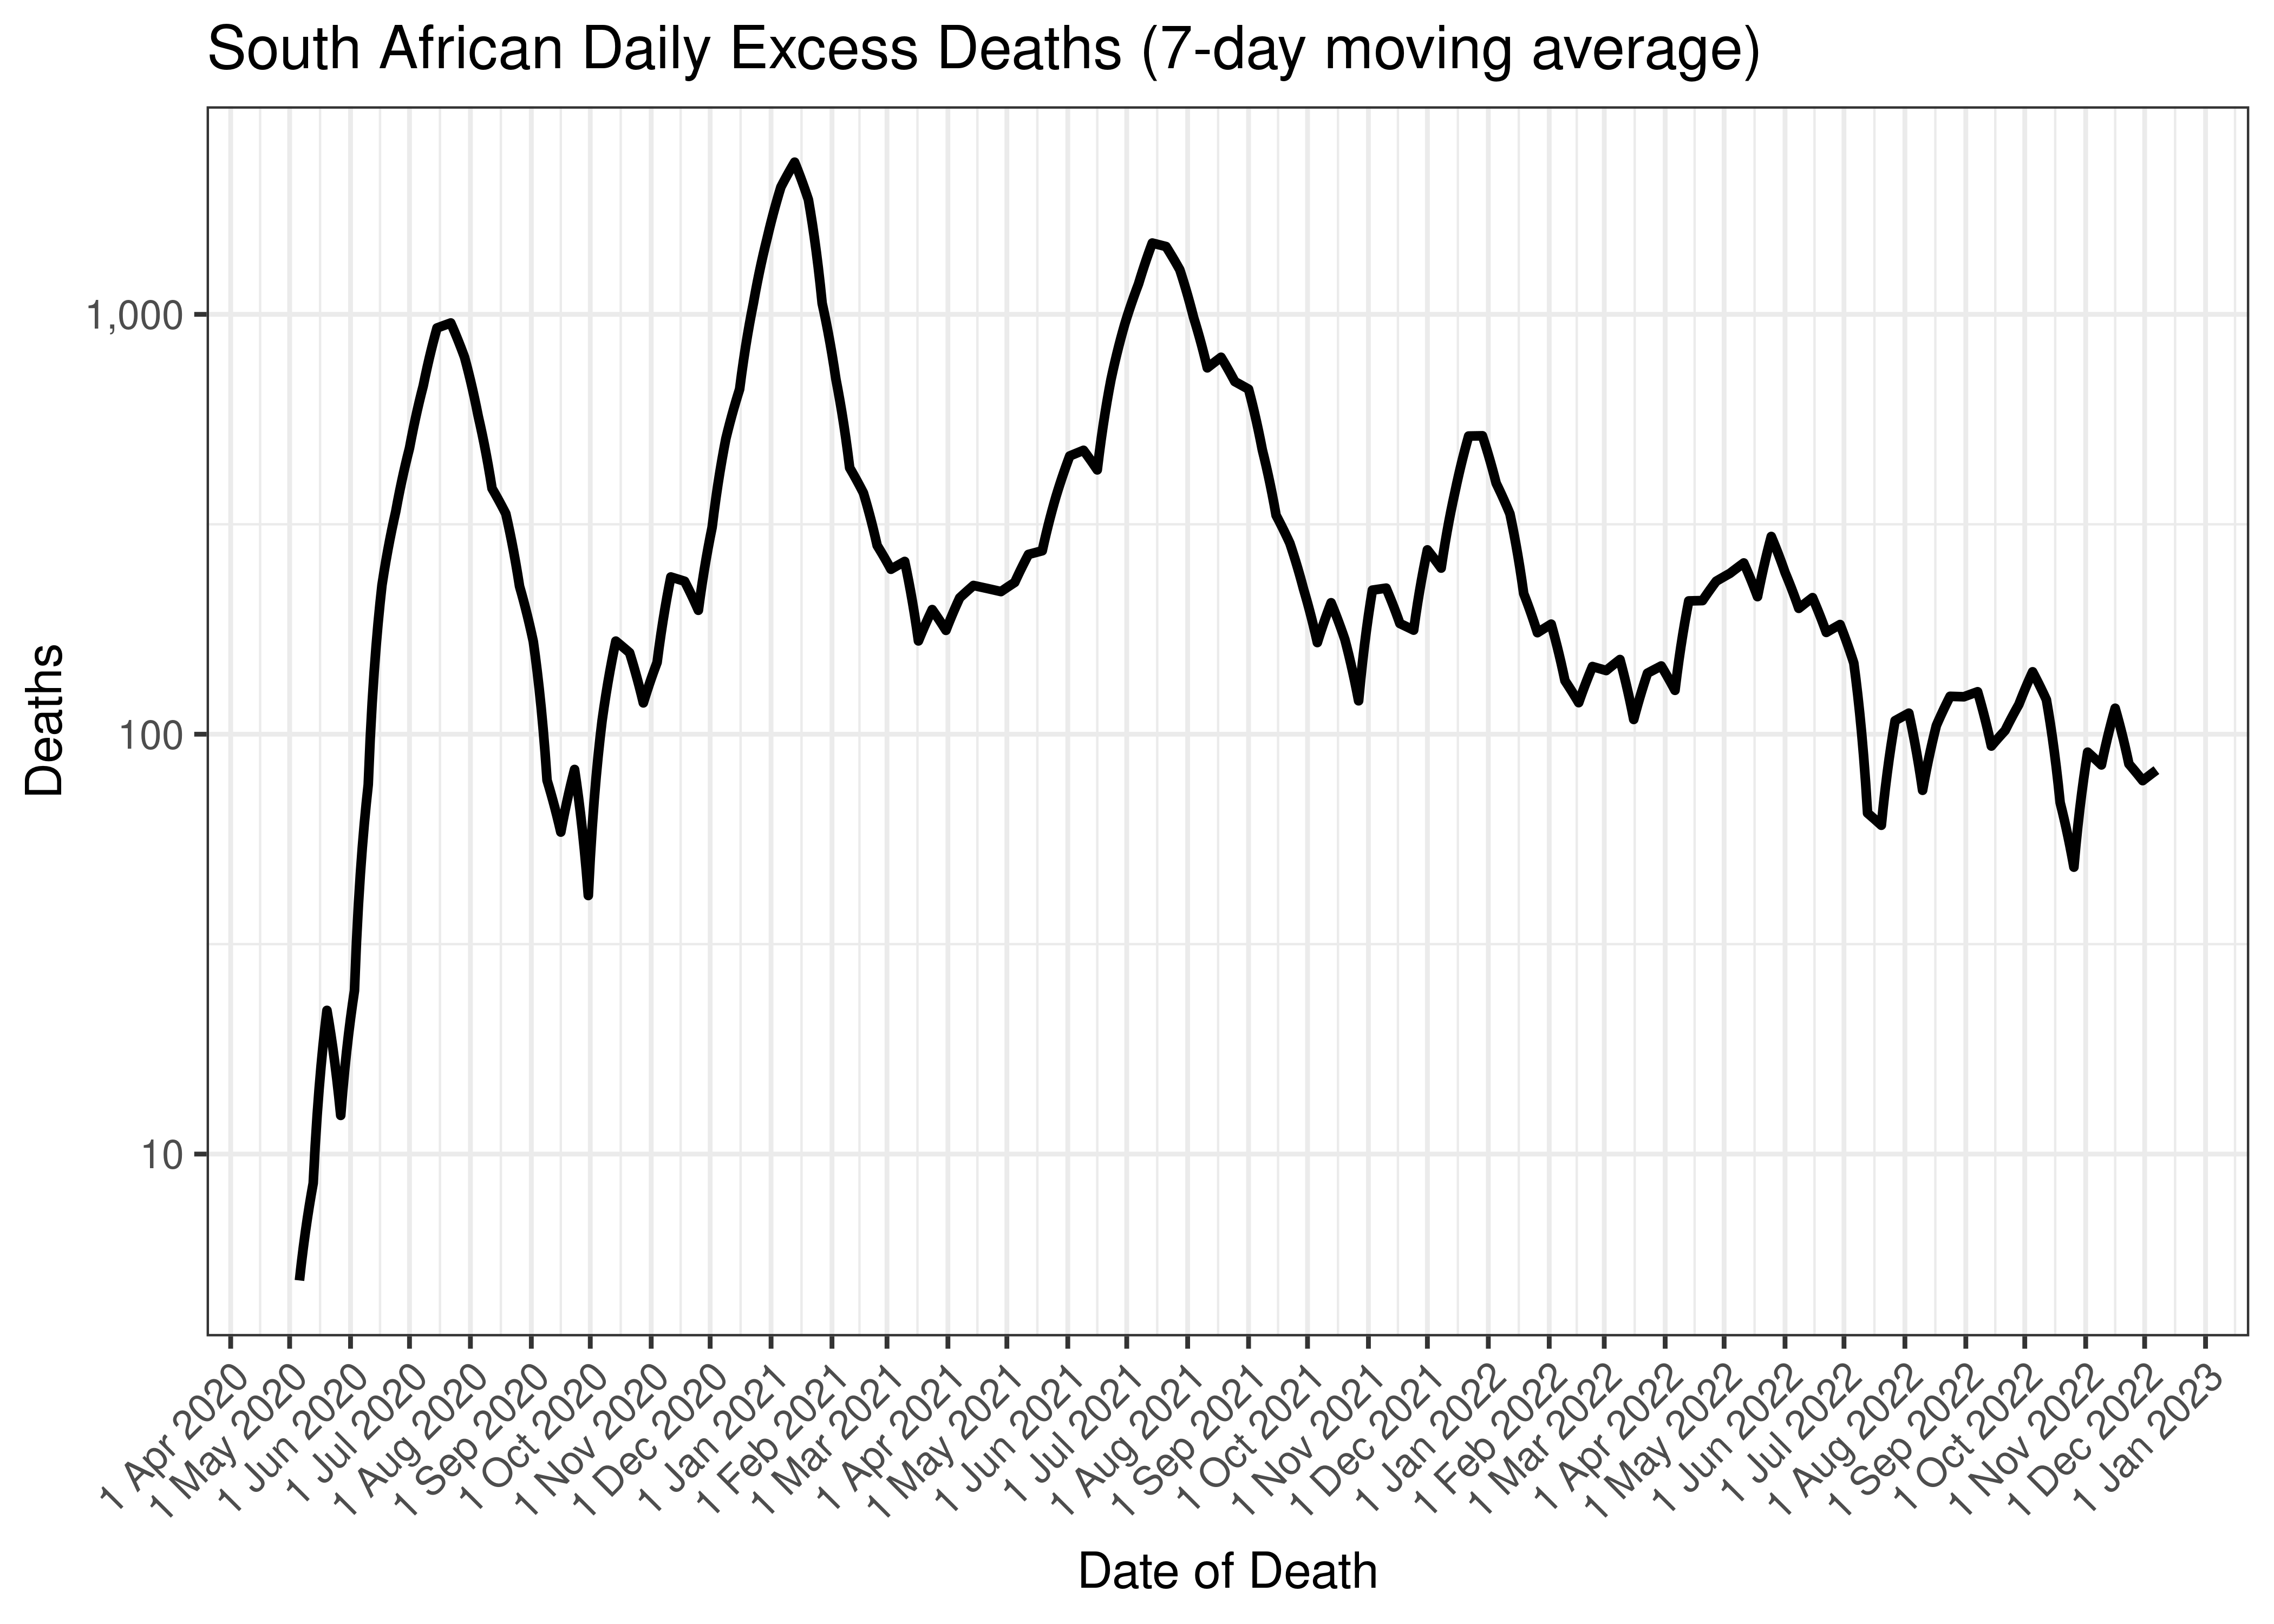
Excess deaths are tabulated by report date below. A centred 7-day moving average is also shown. The peak daily deaths in previous waves (as measured by the moving average) is also shown.
| Date of Death | Excess Deaths | 7-day Moving Average | Comment |
|---|---|---|---|
| 2020-07-22 | 954 | 954 | Wave 1 Peak |
| 2021-01-13 | 2,304 | 2,304 | Wave 2 Peak |
| 2021-07-14 | 1,479 | 1,479 | Wave 3 Peak |
| 2021-12-29 | 514 | 514 | Wave 4 Peak |
| 2022-05-25 | 296 | 296 | Wave 5 Peak (to date) |
| 2022-12-03 | 78 | 79 | |
| 2022-12-04 | 82 | 80 | |
| 2022-12-05 | 82 | 81 | |
| 2022-12-06 | 82 | 81 | |
| 2022-12-07 | 82 | 82 | |
| 2022-12-08 | 82 | NA | |
| 2022-12-09 | 82 | NA | |
| 2022-12-10 | 82 | NA |
The above are based on the following dates:
- Wave 1 started on 2020-01-01.
- Wave 2 started on 2020-10-01.
- Wave 3 started on 2021-04-01.
- Wave 4 started on 2021-11-01.
- Wave 5 started on 2022-04-01.
Below a 7-day moving average of daily excess deaths is plotted by on a log scale since start of the epidemic. Note excess deaths are plotted by date of death.
South African Daily Excess Deaths (7-day moving average)
Below the above chart is repeated for the last 30-days:
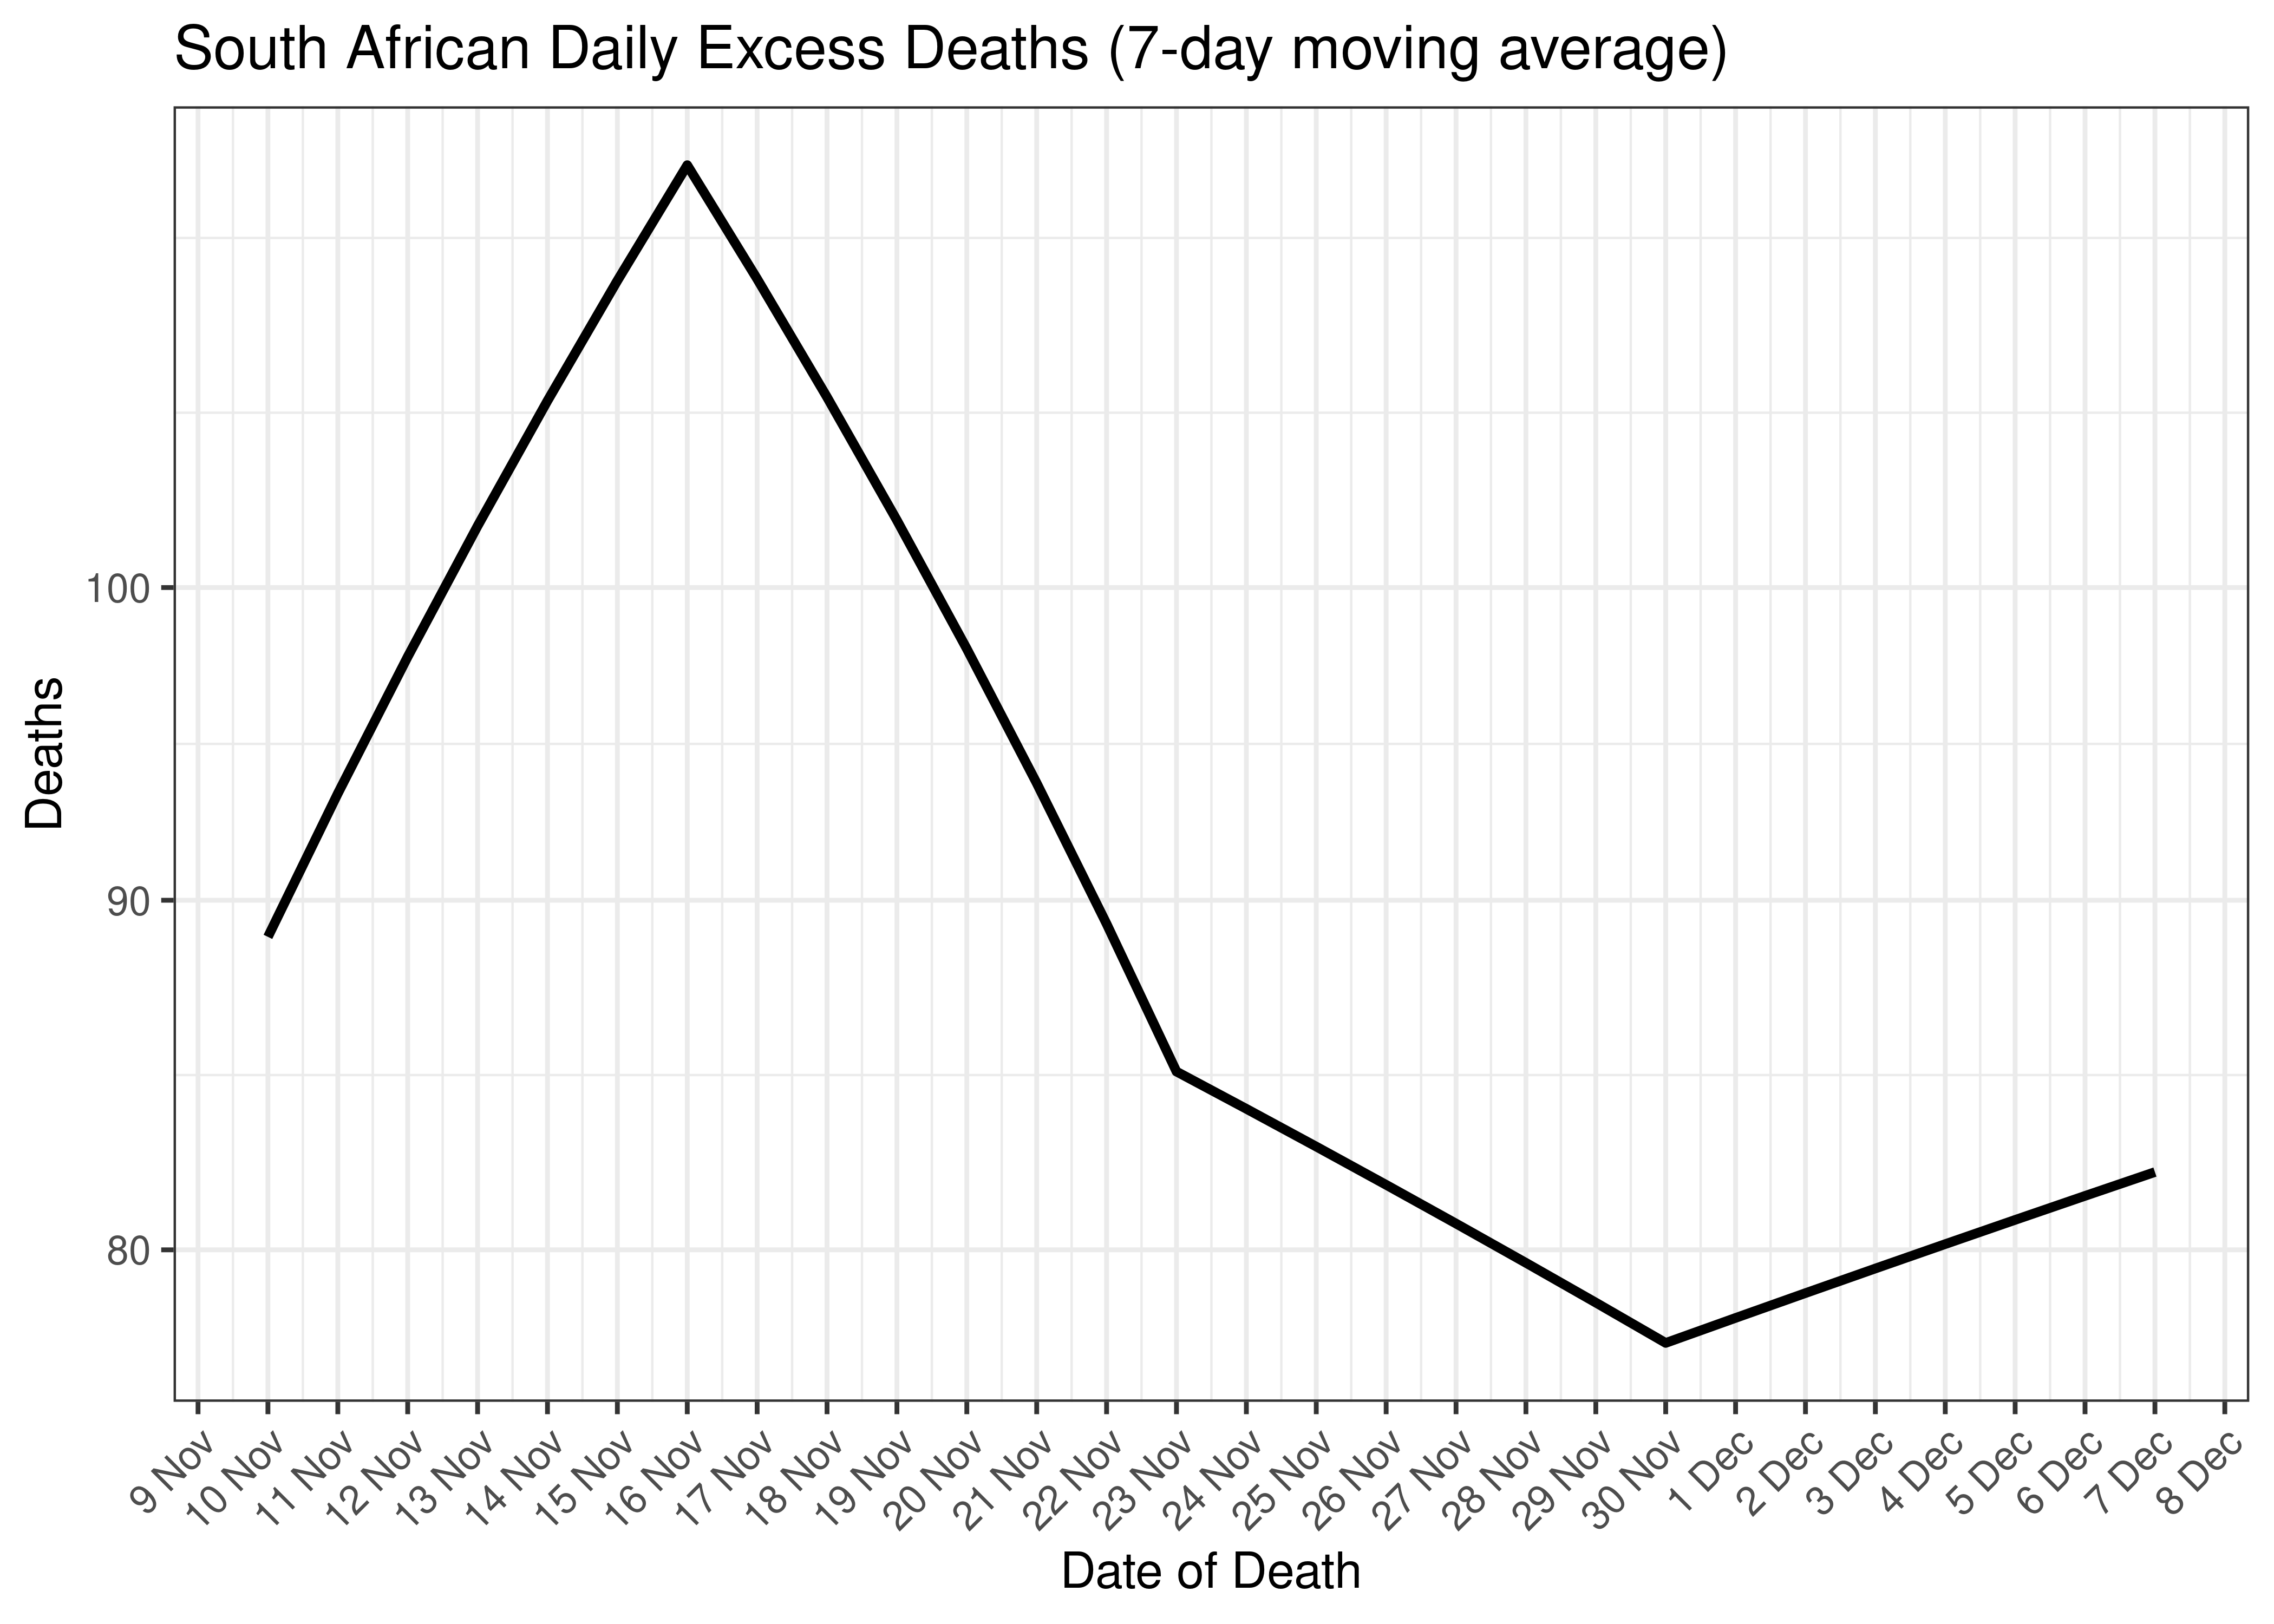
South African Daily Excess Deaths for Last 30-days (7-day moving average)
Below a 7-day moving average daily excess deaths are plotted by province on a log scale since start of the epidemic:
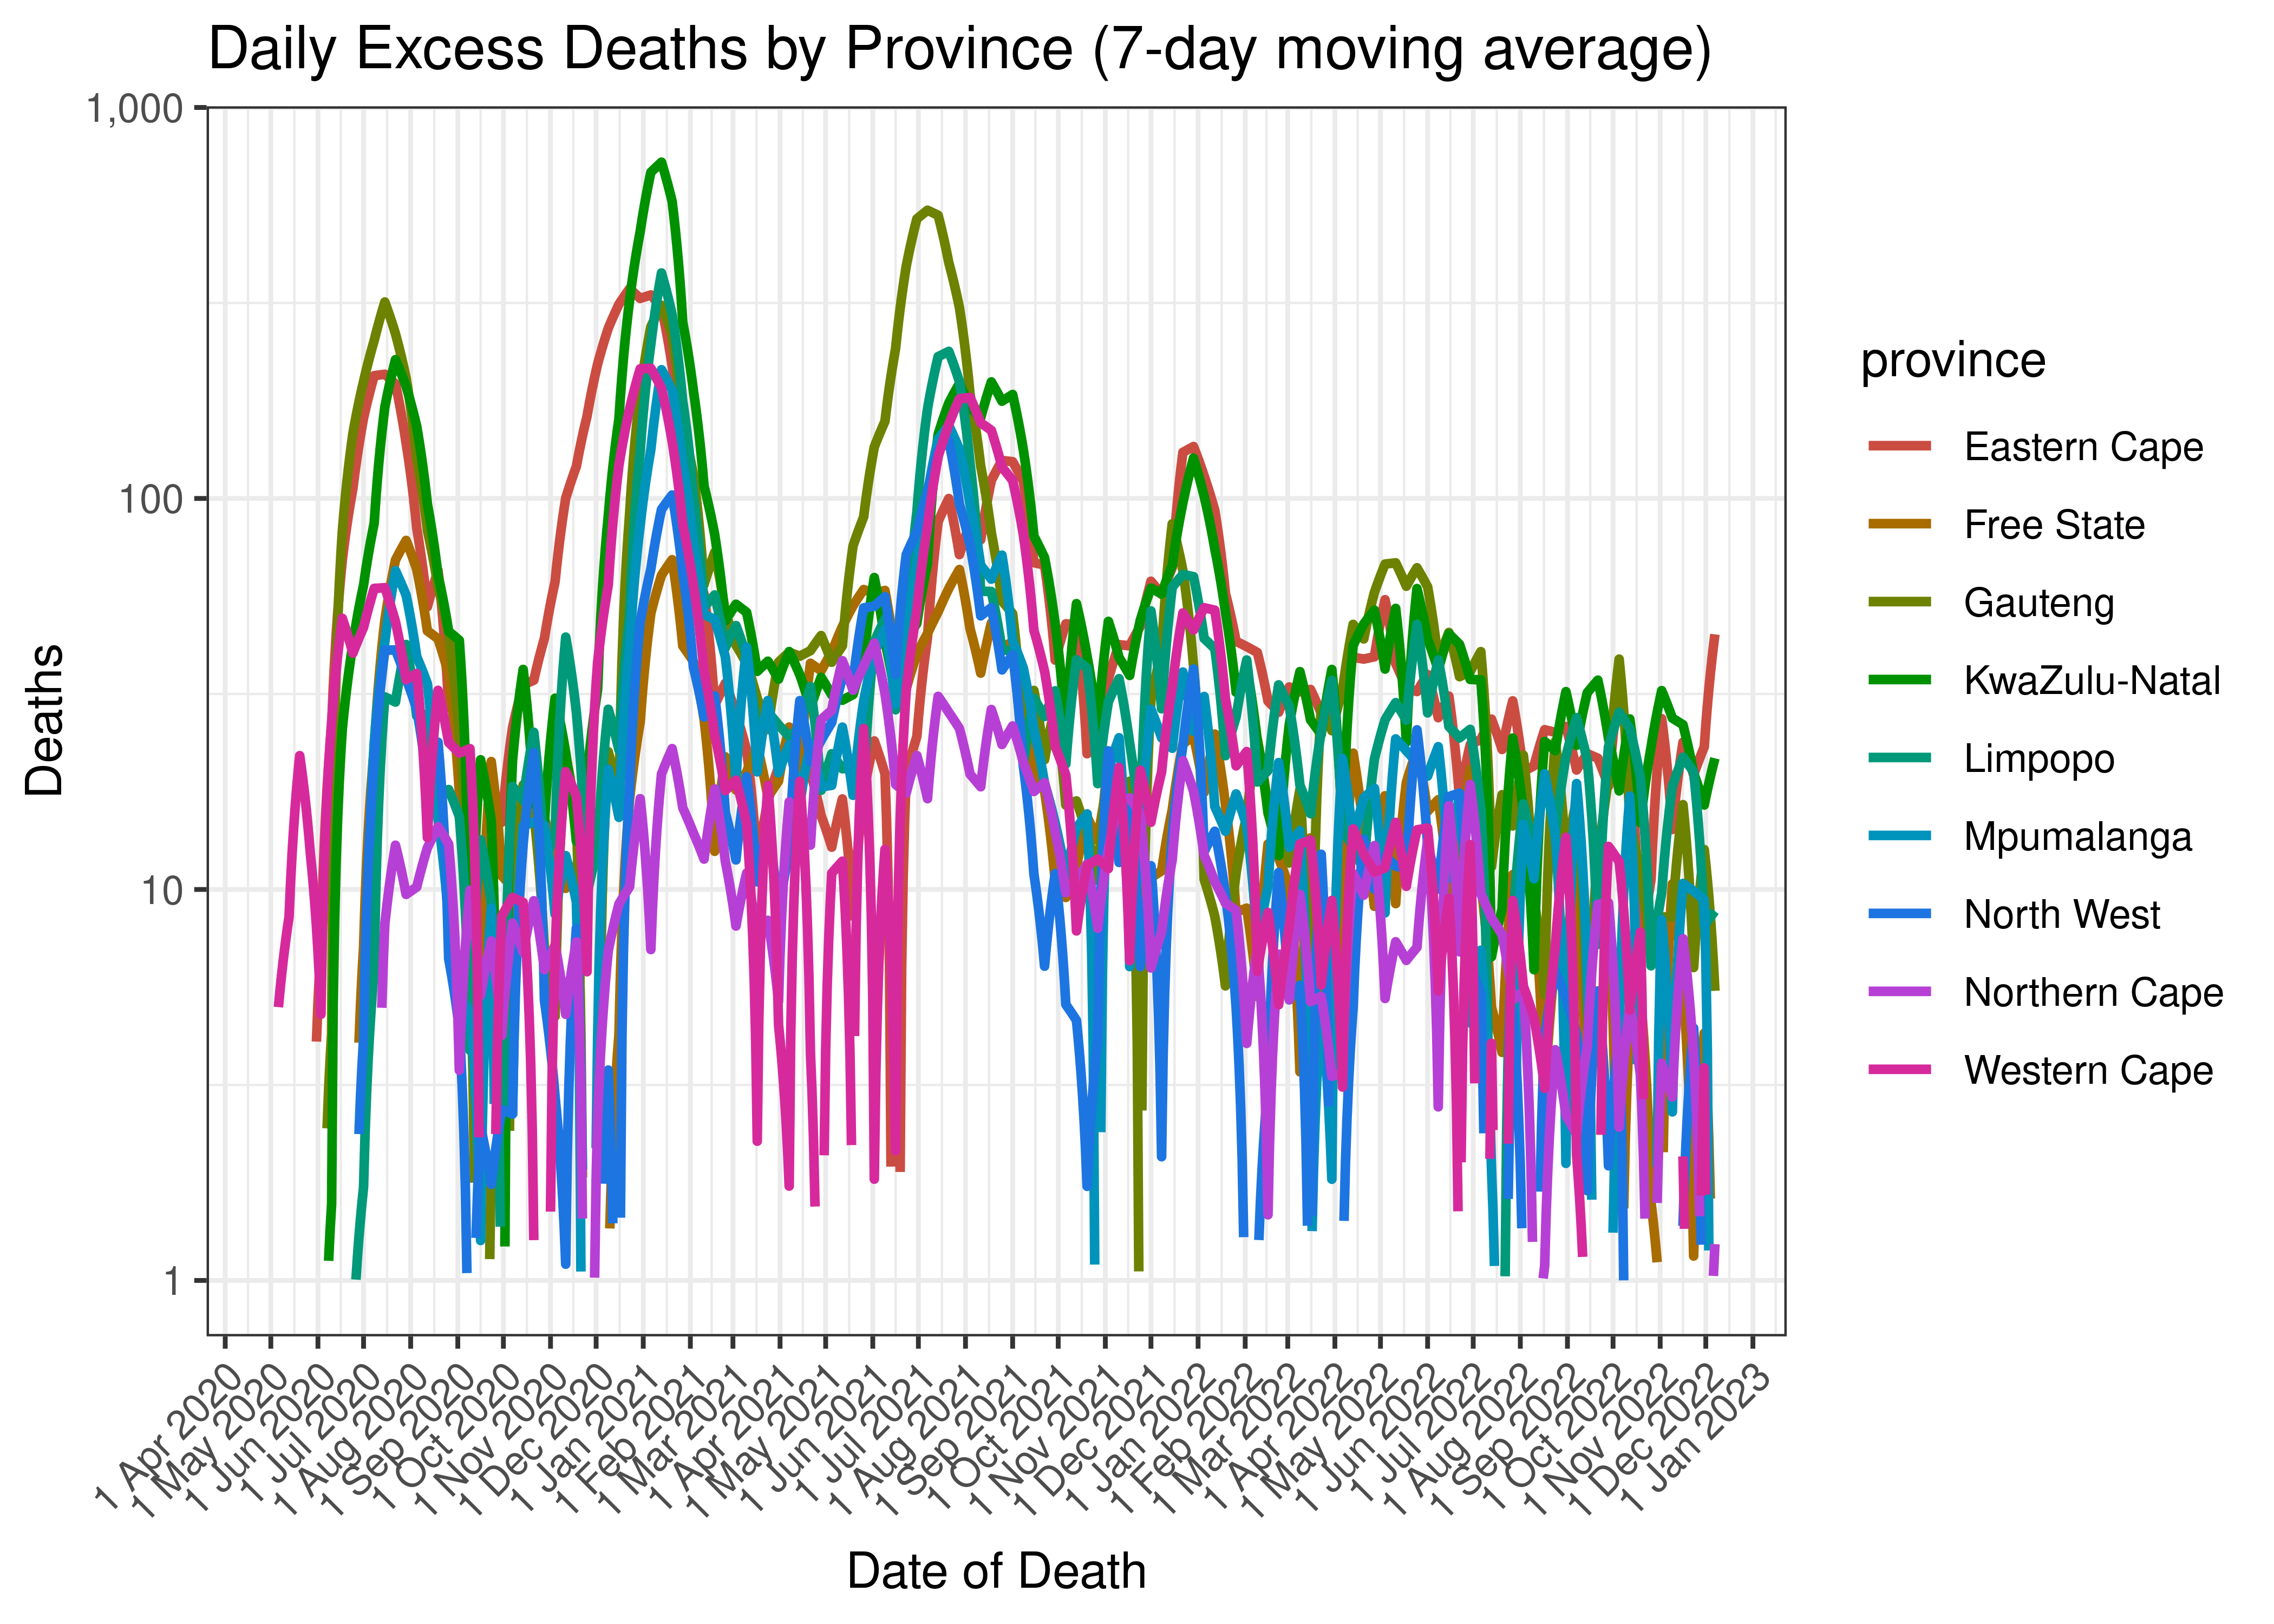
Daily Excess Deaths by Province (7-day moving average)
Below the above chart is repeated for the last 30-days:
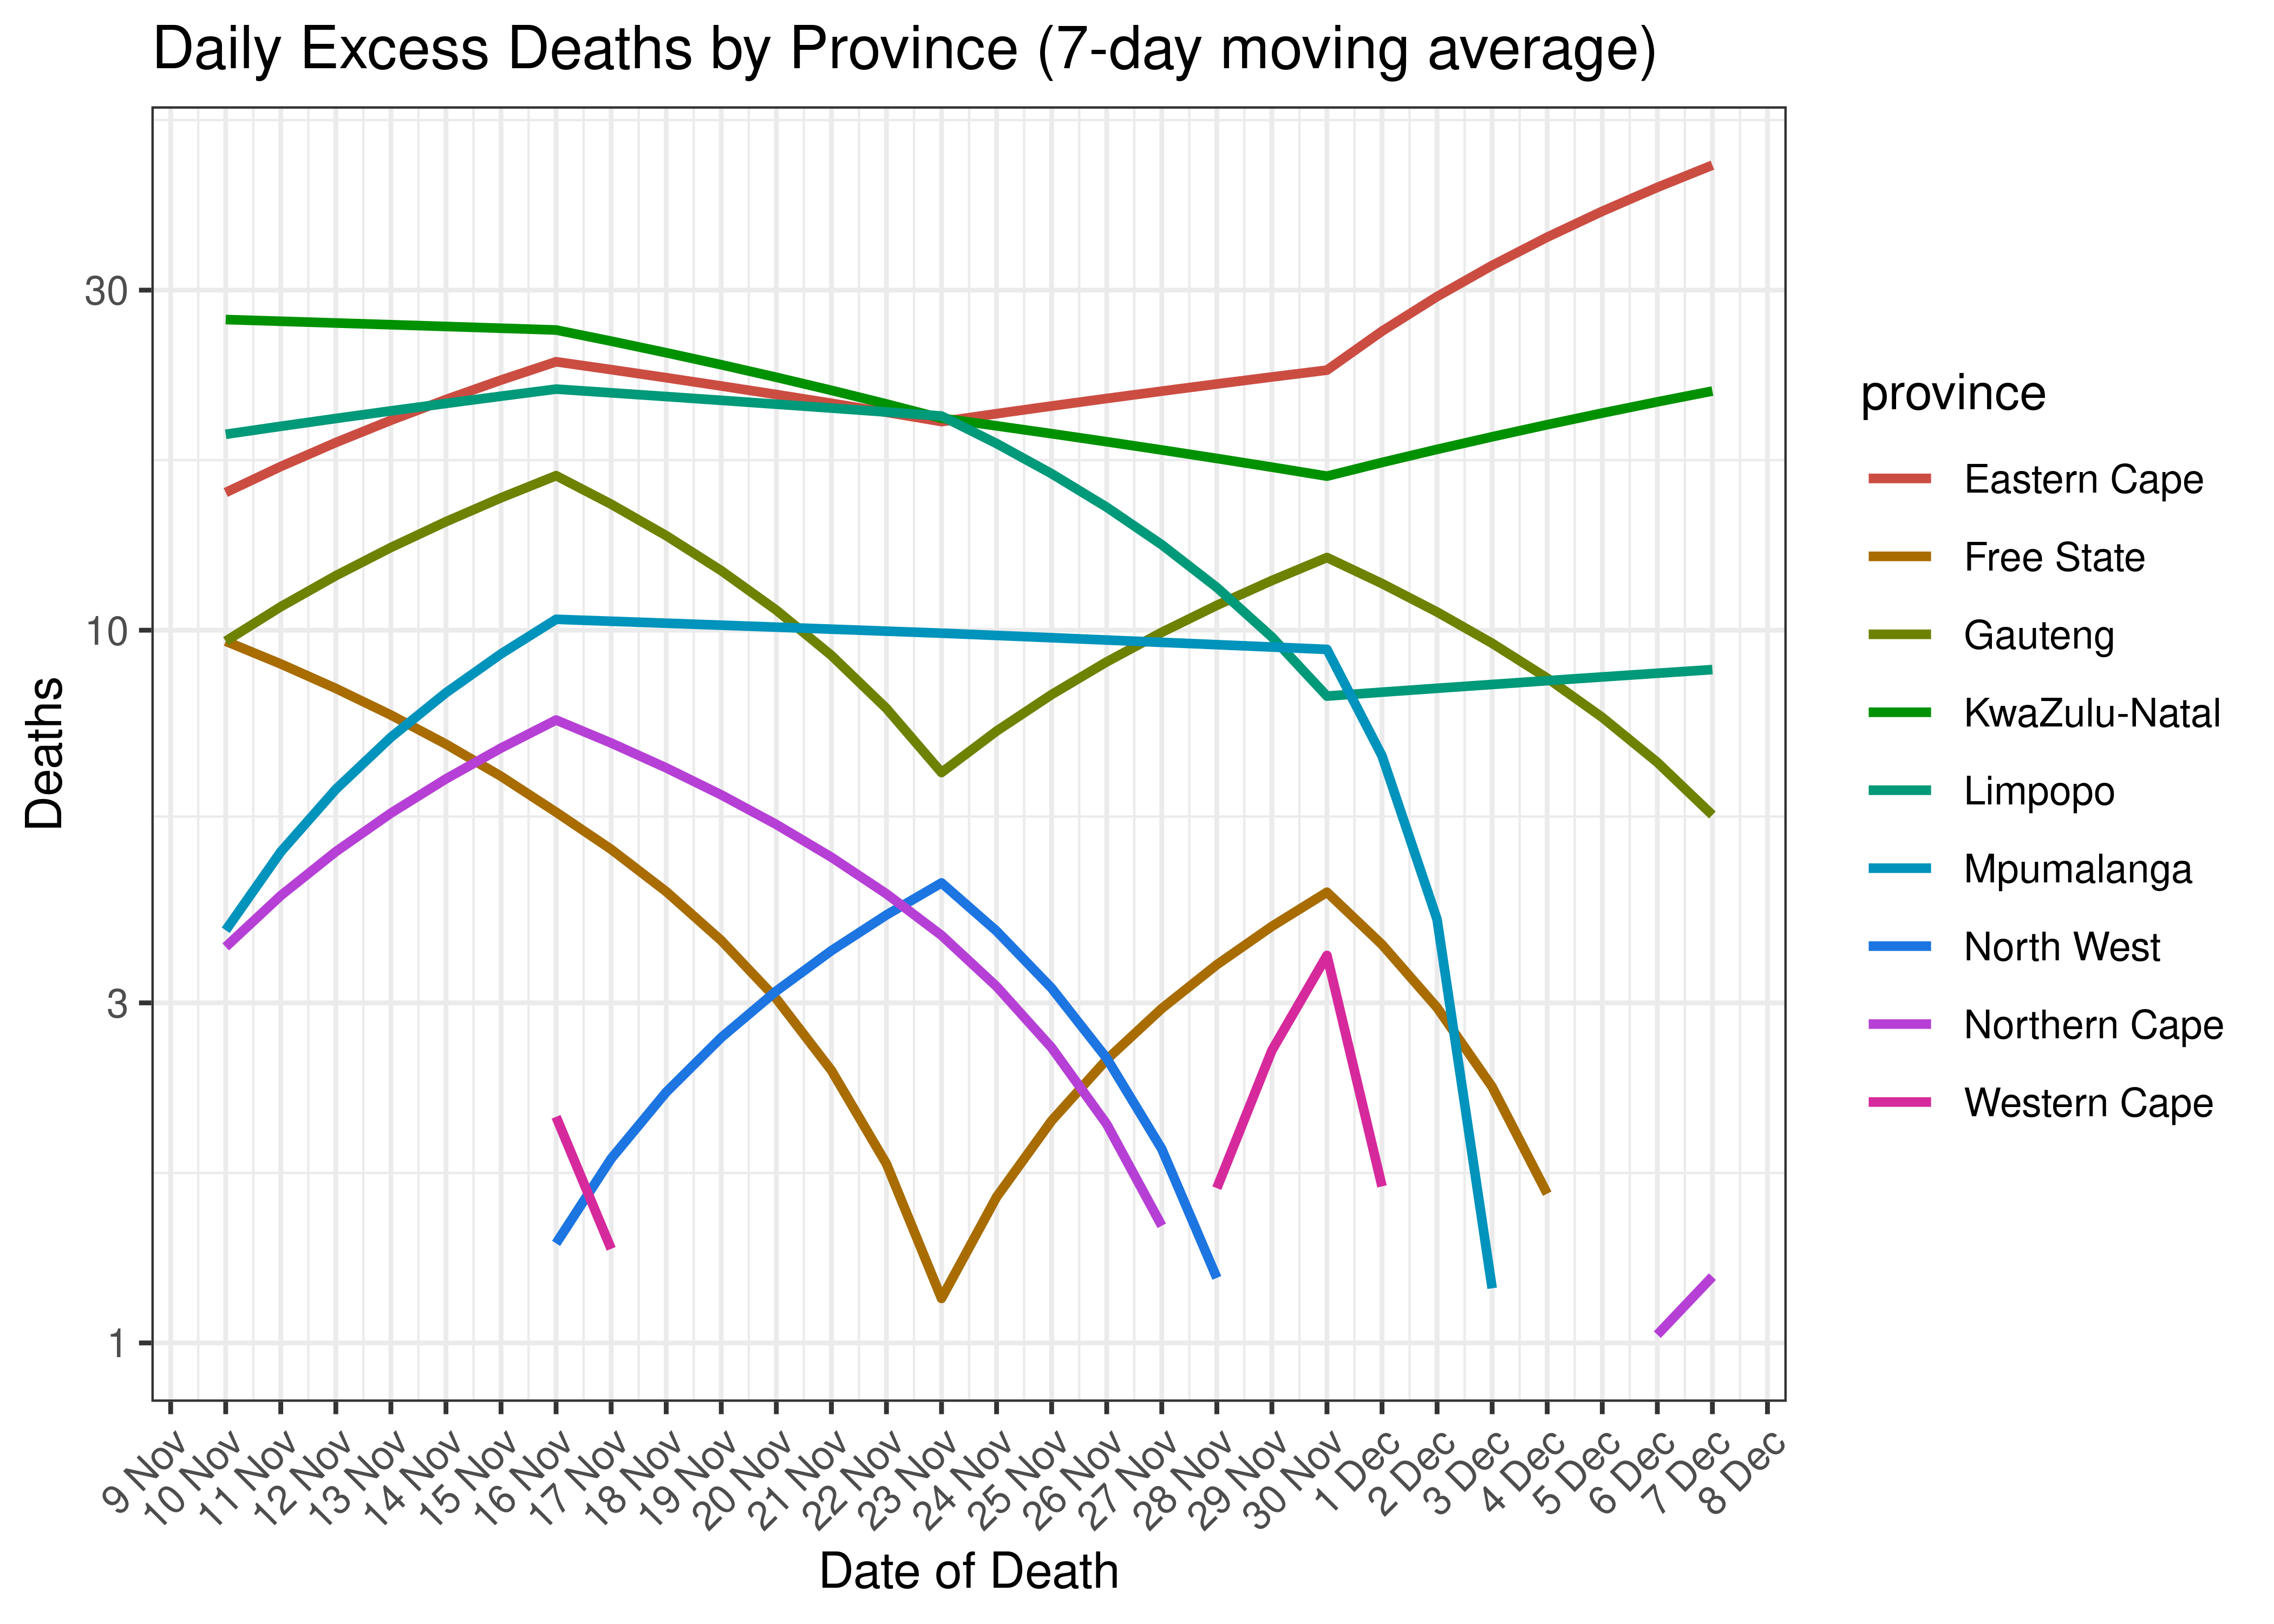
Daily Excess Deaths for Last 30-days by Province (7-day moving average)
6.1.9 Cases, Admissions and Deaths Combined
Below a 7-day moving average daily case, admission and excess death counts are plotted by province on a log scale since start of the epidemic. Note admissions and excess deaths are plotted by reported date, whereas cases are plotted by specimen received date.
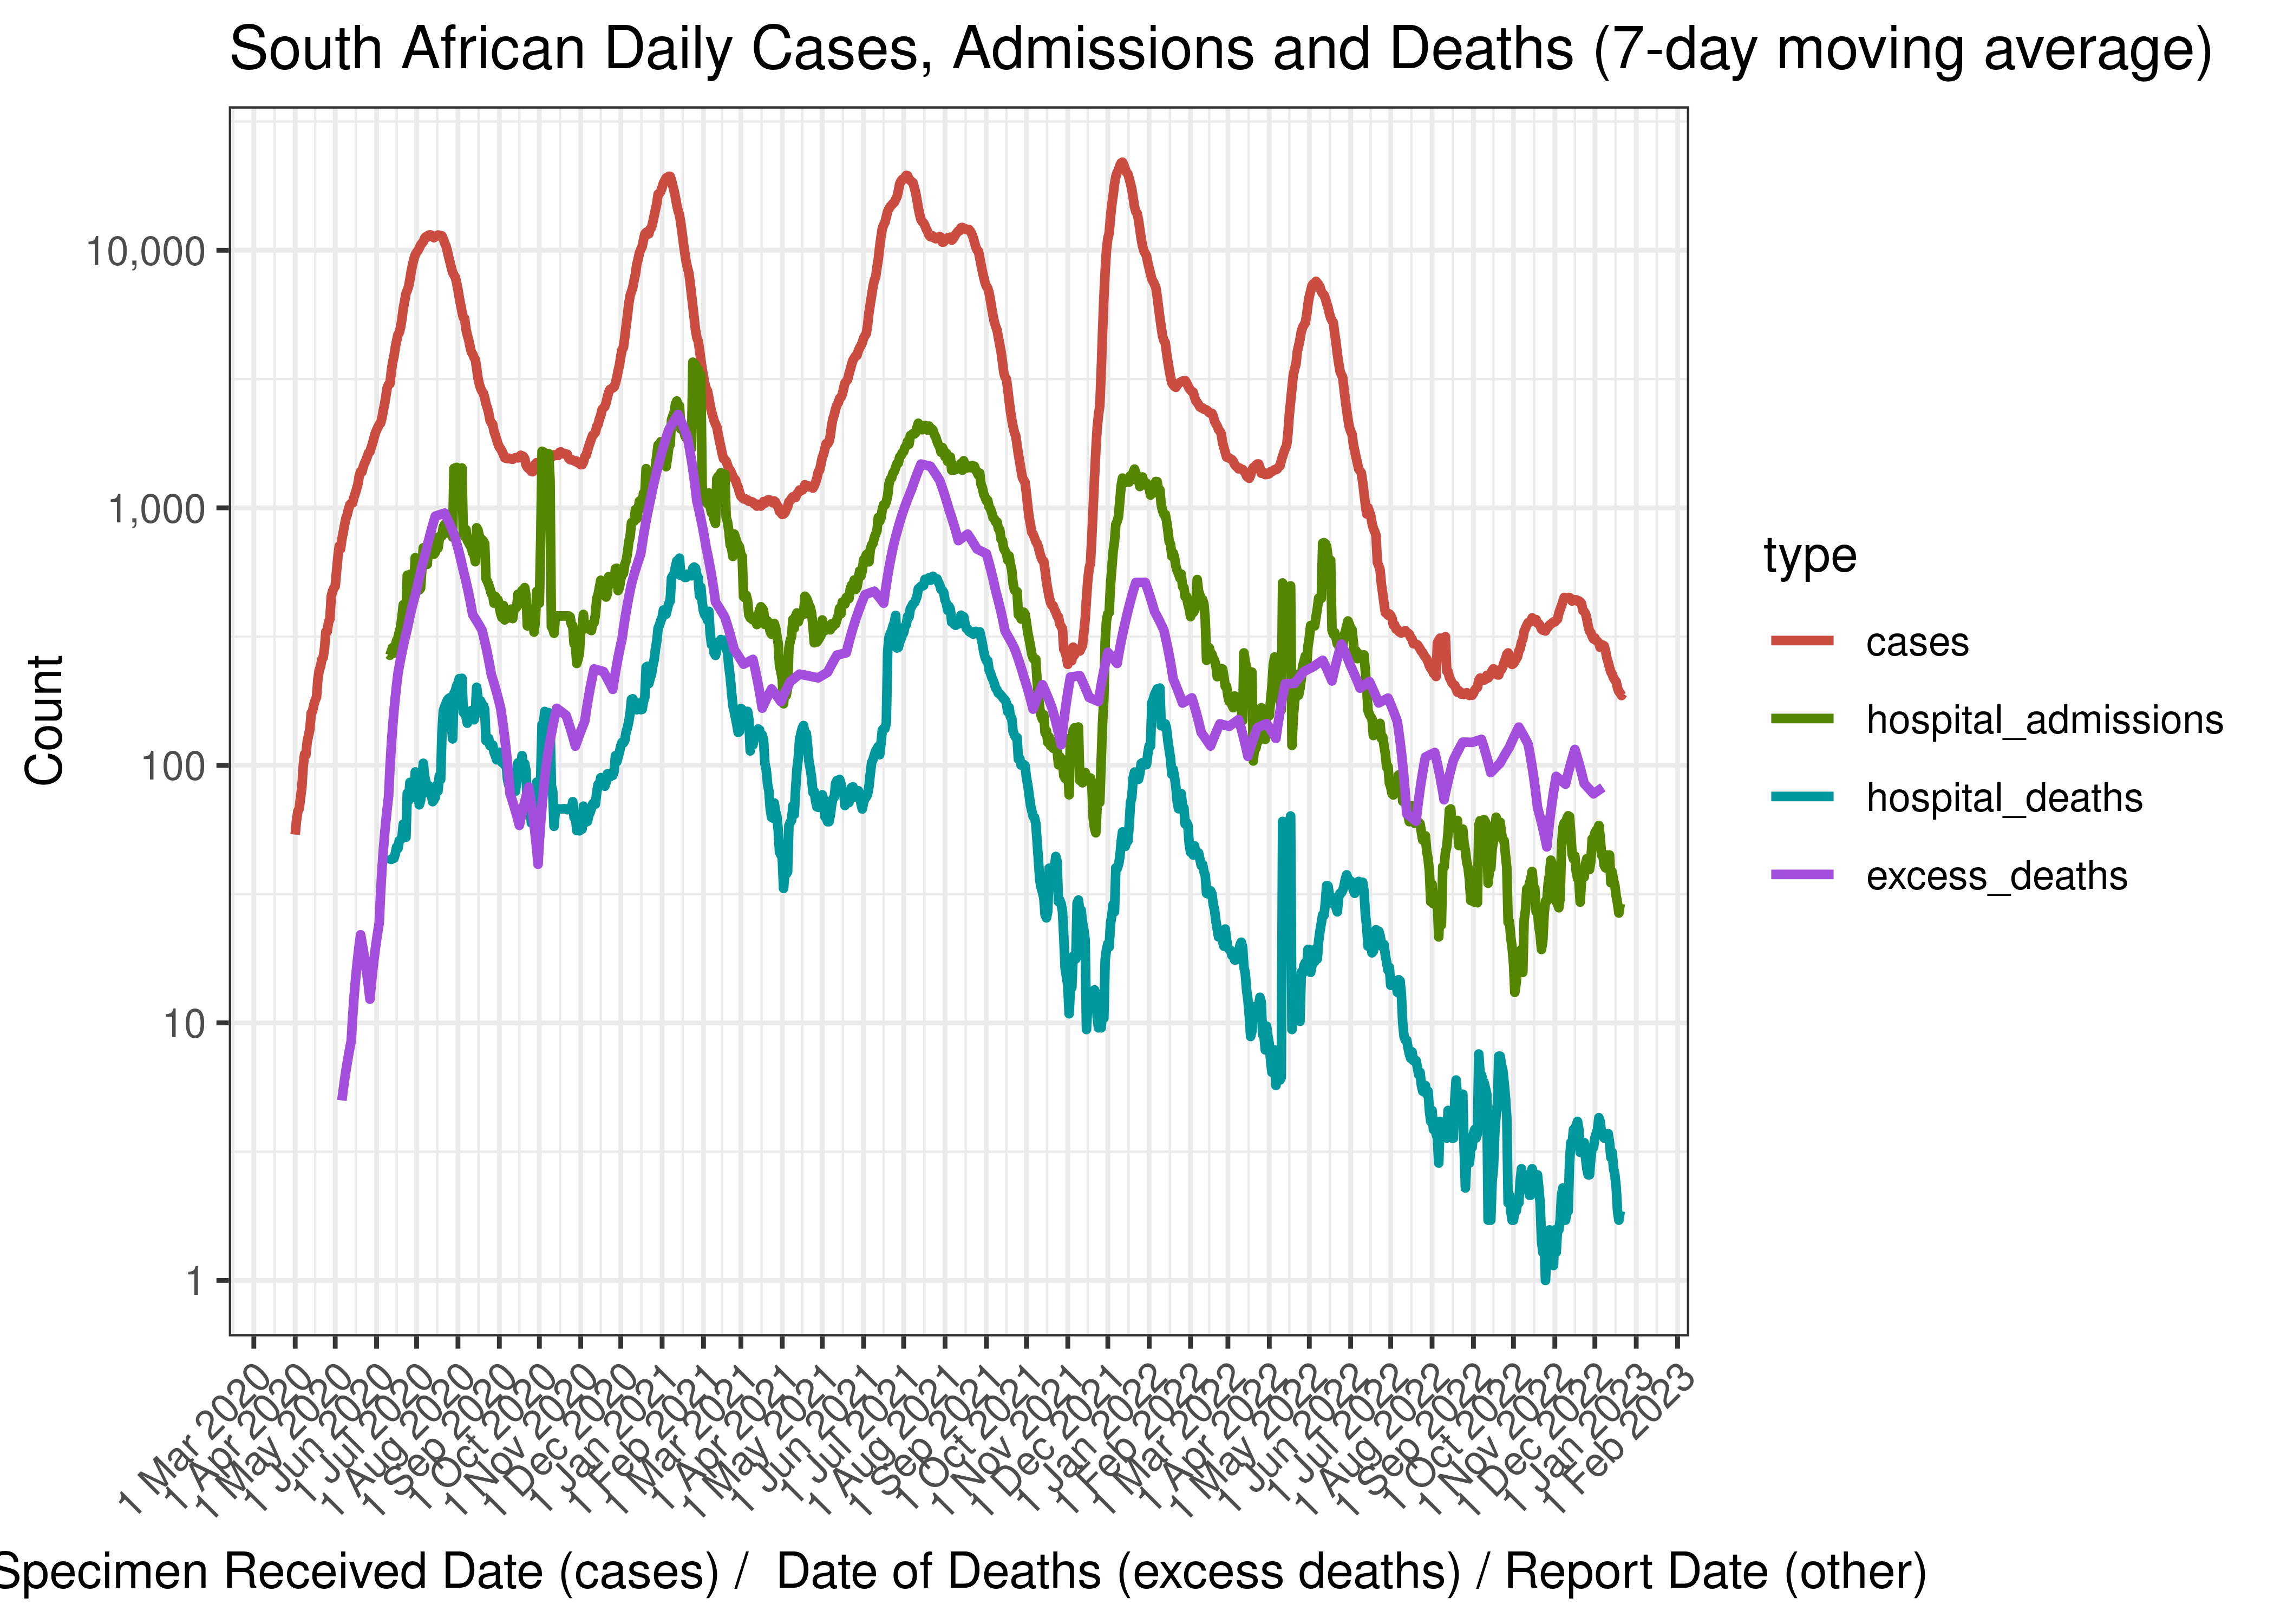
South African Daily Cases, Admissions and Deaths (7-day moving average)
Below the above chart is repeated for the last 30-days:

South African Daily Cases, Admissions and Deaths for Last 30-days (7-day moving average)
6.1.10 Crude Ratios per Wave
Below crude rations are calculated between the waves. It’s based on the following starting dates:
- Wave 1 started on 2020-01-01.
- Wave 2 started on 2020-10-01.
- Wave 3 started on 2021-04-01.
- Wave 4 started on 2021-11-01.
- Wave 5 started on 2022-04-01.
Below crude ratios are tabulated and plotted. These ratios are:
- Case admissions ratio calculated as admissions divided by cases.
- Case fatality ratio calculated as hospital deaths divided by cases (Note that COVID-19 deaths are under-reported by a significant factor in South Africa).
- Case excess deaths ratio calculated as excess deaths divided by cases.
- Hospital fatality ratio calculated as hospital deaths divided by admissions (Note that COVID-19 deaths are under-reported by a significant factor in South Africa).
- Death reporting ratio calculated as hospital deaths divided by excess deaths.
| Wave | Case Admission Ratio | Case Fatality Ratio | Case Excess Deaths Ratio | Hospital Fatality Ratio | Death Reporting Ratio | |
|---|---|---|---|---|---|---|
| South Africa | Wave 1 | 10.2% | 1.87% | 6.77% | 18.3% | 27.6% |
| South Africa | Wave 2 | 20.3% | 4.40% | 12.36% | 21.7% | 35.6% |
| South Africa | Wave 3 | 13.4% | 3.10% | 8.37% | 23.1% | 37.0% |
| South Africa | Wave 4 | 9.8% | 0.95% | 4.47% | 9.7% | 21.2% |
| South Africa | Wave 5 | 10.5% | 0.91% | 10.77% | 8.7% | 8.5% |
Below the rations above are plotted graphically:
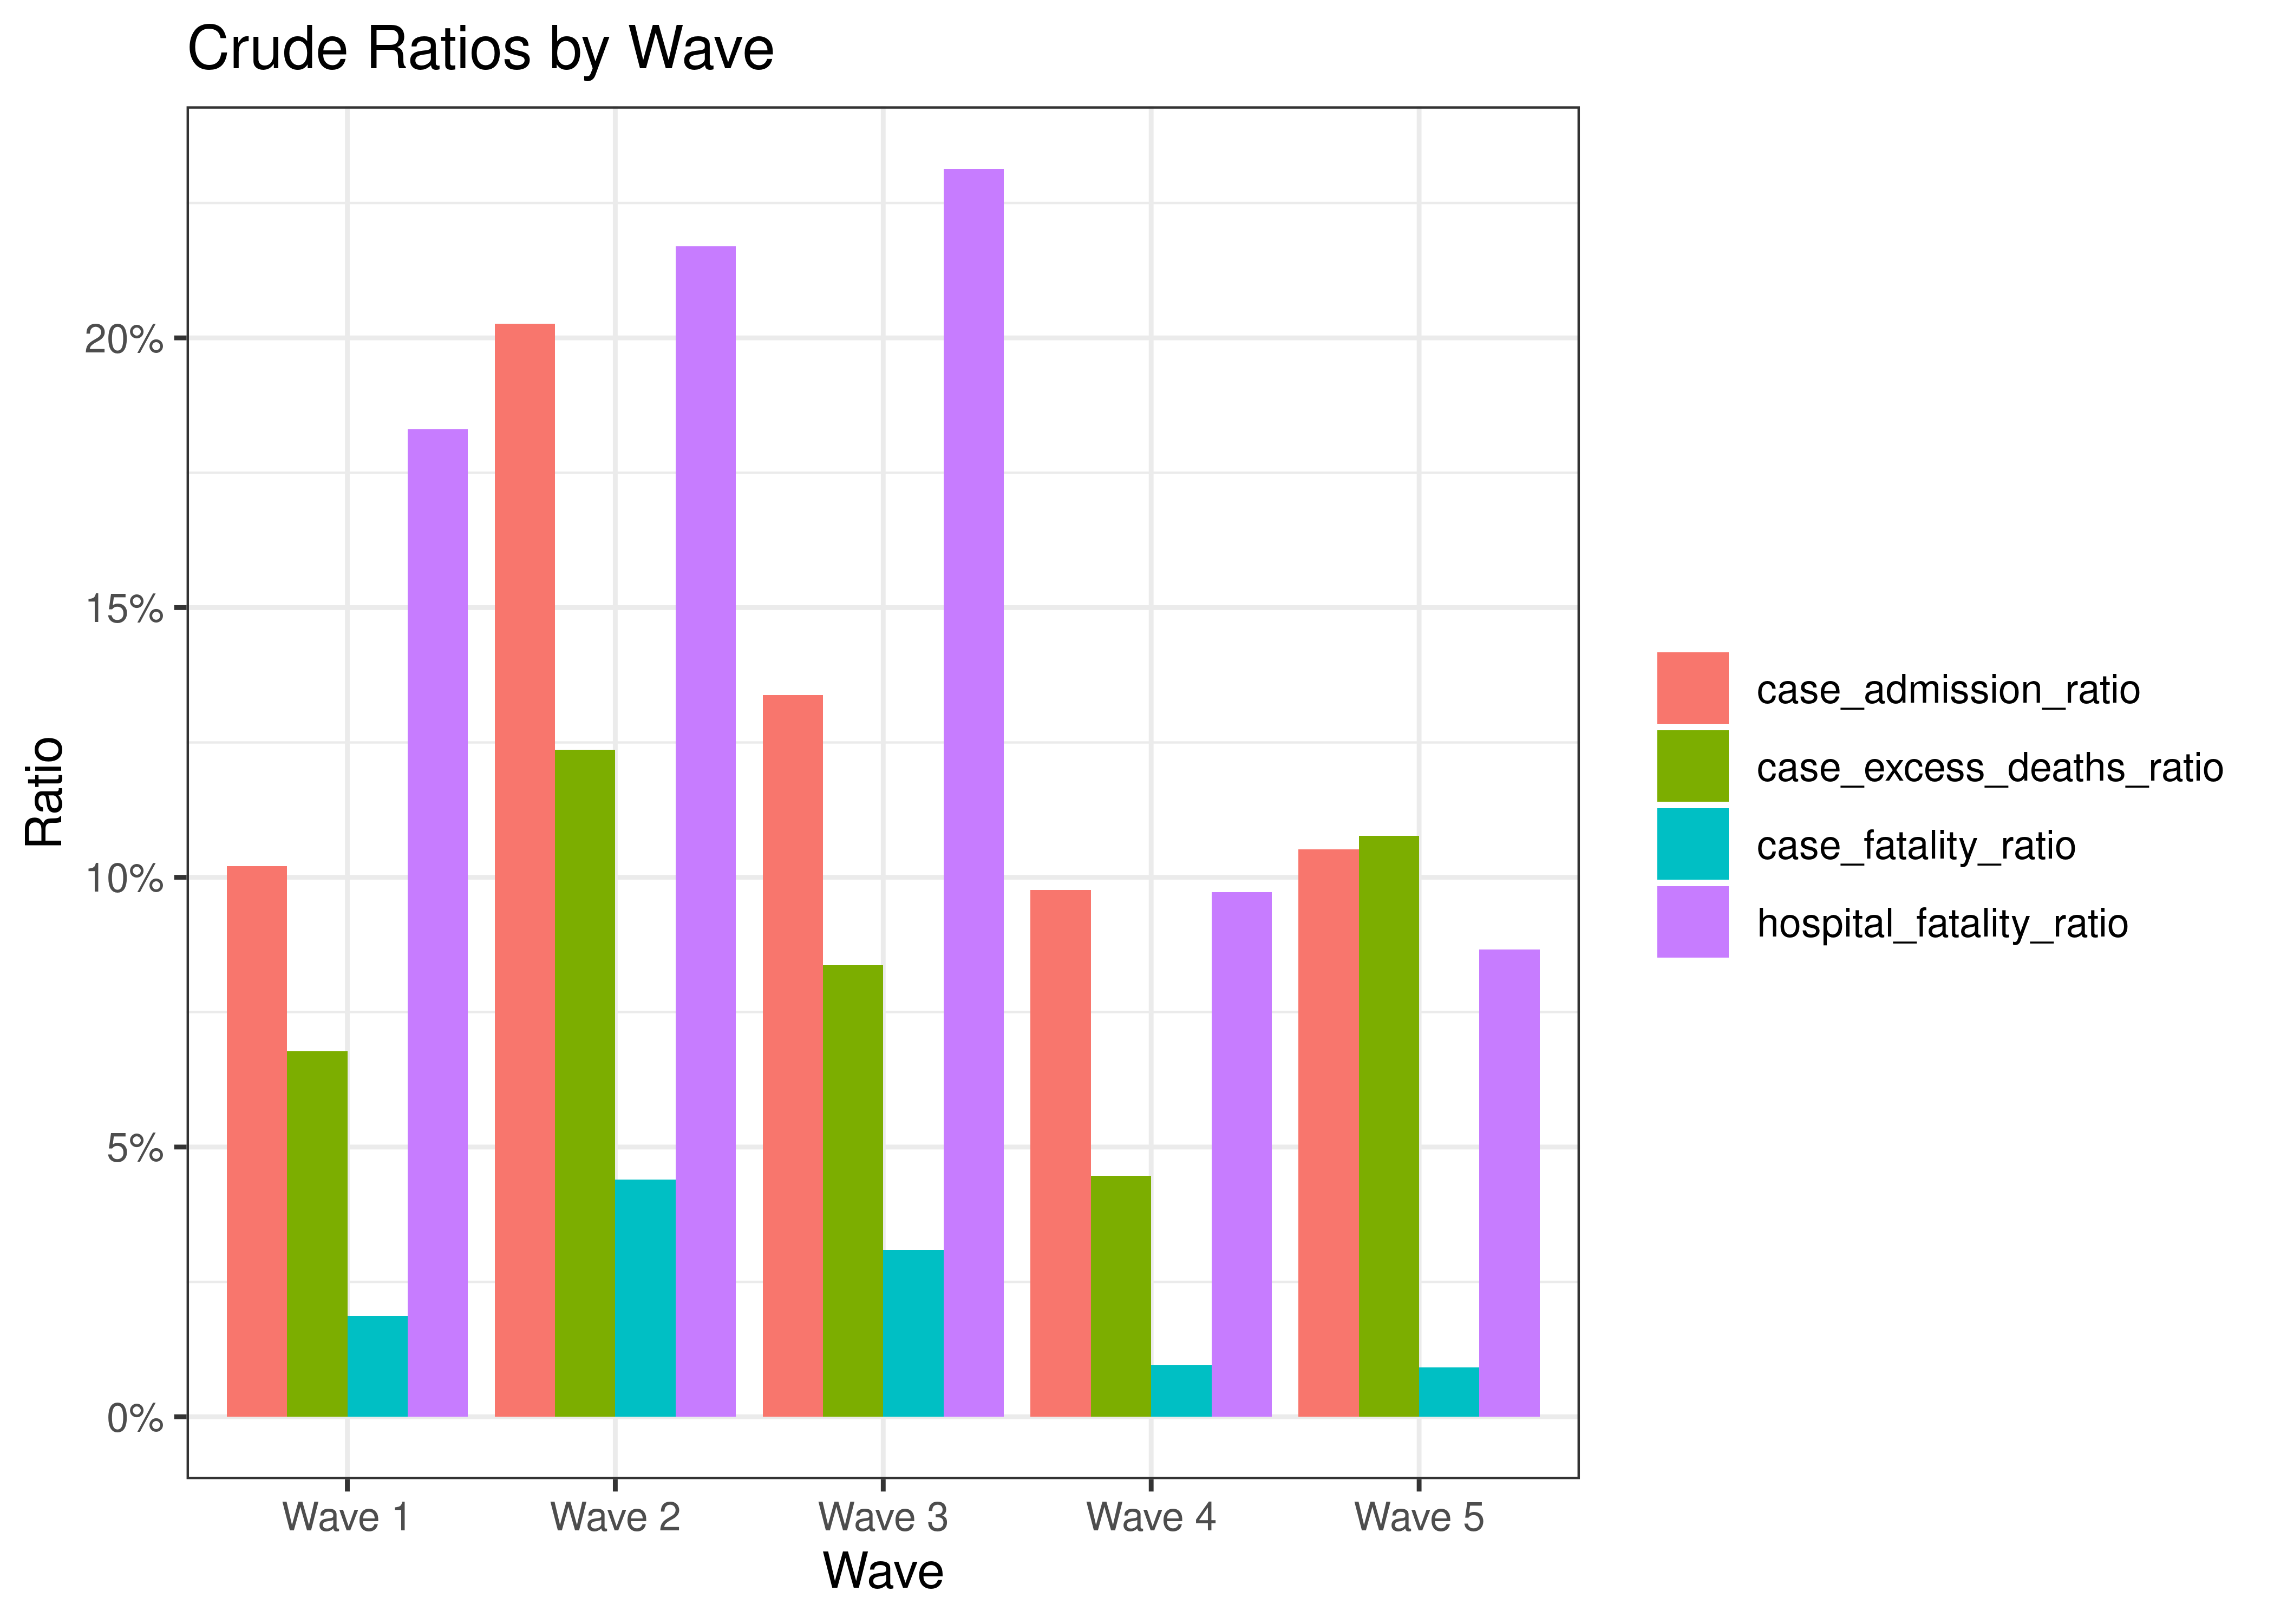
Crude Ratios by Wave
6.1.11 Reproduction Number
Below current (last weekly) effective reproduction number estimates are tabulated for South Africa and by province.
| Type | Count (Per Day) | Week Ending | Reproduction Number [95% Confidence Interval] | |
|---|---|---|---|---|
| South Africa | cases | 190 | 2022-12-25 | 0.91 [0.86 - 0.96] |
| South Africa | hospital_admissions | 29 | 2022-12-23 | 0.82 [0.71 - 0.94] |
| Province | Type | Count (Per Day) | Week Ending | Reproduction Number [95% Confidence Interval] |
|---|---|---|---|---|
| Eastern Cape | cases | 10 | 2022-12-25 | 0.92 [0.72 - 1.15] |
| Eastern Cape | hospital_admissions | 3 | 2022-12-23 | 1.57 [0.97 - 2.33] |
| Free State | cases | 5 | 2022-12-25 | 0.79 [0.55 - 1.06] |
| Free State | hospital_admissions | 1 | 2022-12-23 | 0.84 [0.41 - 1.46] |
| Gauteng | cases | 55 | 2022-12-25 | 0.86 [0.77 - 0.95] |
| Gauteng | hospital_admissions | 7 | 2022-12-23 | 0.61 [0.44 - 0.81] |
| KwaZulu-Natal | cases | 66 | 2022-12-25 | 0.99 [0.90 - 1.09] |
| KwaZulu-Natal | hospital_admissions | 9 | 2022-12-23 | 0.83 [0.64 - 1.06] |
| Limpopo | cases | 3 | 2022-12-25 | 1.02 [0.63 - 1.49] |
| Limpopo | hospital_admissions | 1 | 2022-12-23 | 2.45 [0.77 - 5.15] |
| Mpumalanga | cases | 8 | 2022-12-25 | 0.91 [0.69 - 1.15] |
| Mpumalanga | hospital_admissions | 2 | 2022-12-13 | 0.42 [0.24 - 0.67] |
| North West | cases | 3 | 2022-12-25 | 0.76 [0.49 - 1.10] |
| North West | hospital_admissions | 0 | 2022-09-26 | 0.53 [0.14 - 1.17] |
| Northern Cape | cases | 2 | 2022-12-25 | 0.64 [0.34 - 1.02] |
| Northern Cape | hospital_admissions | 1 | 2022-12-23 | 1.56 [0.50 - 3.19] |
| Western Cape | cases | 37 | 2022-12-25 | 0.93 [0.82 - 1.04] |
| Western Cape | hospital_admissions | 8 | 2022-12-23 | 0.96 [0.73 - 1.22] |
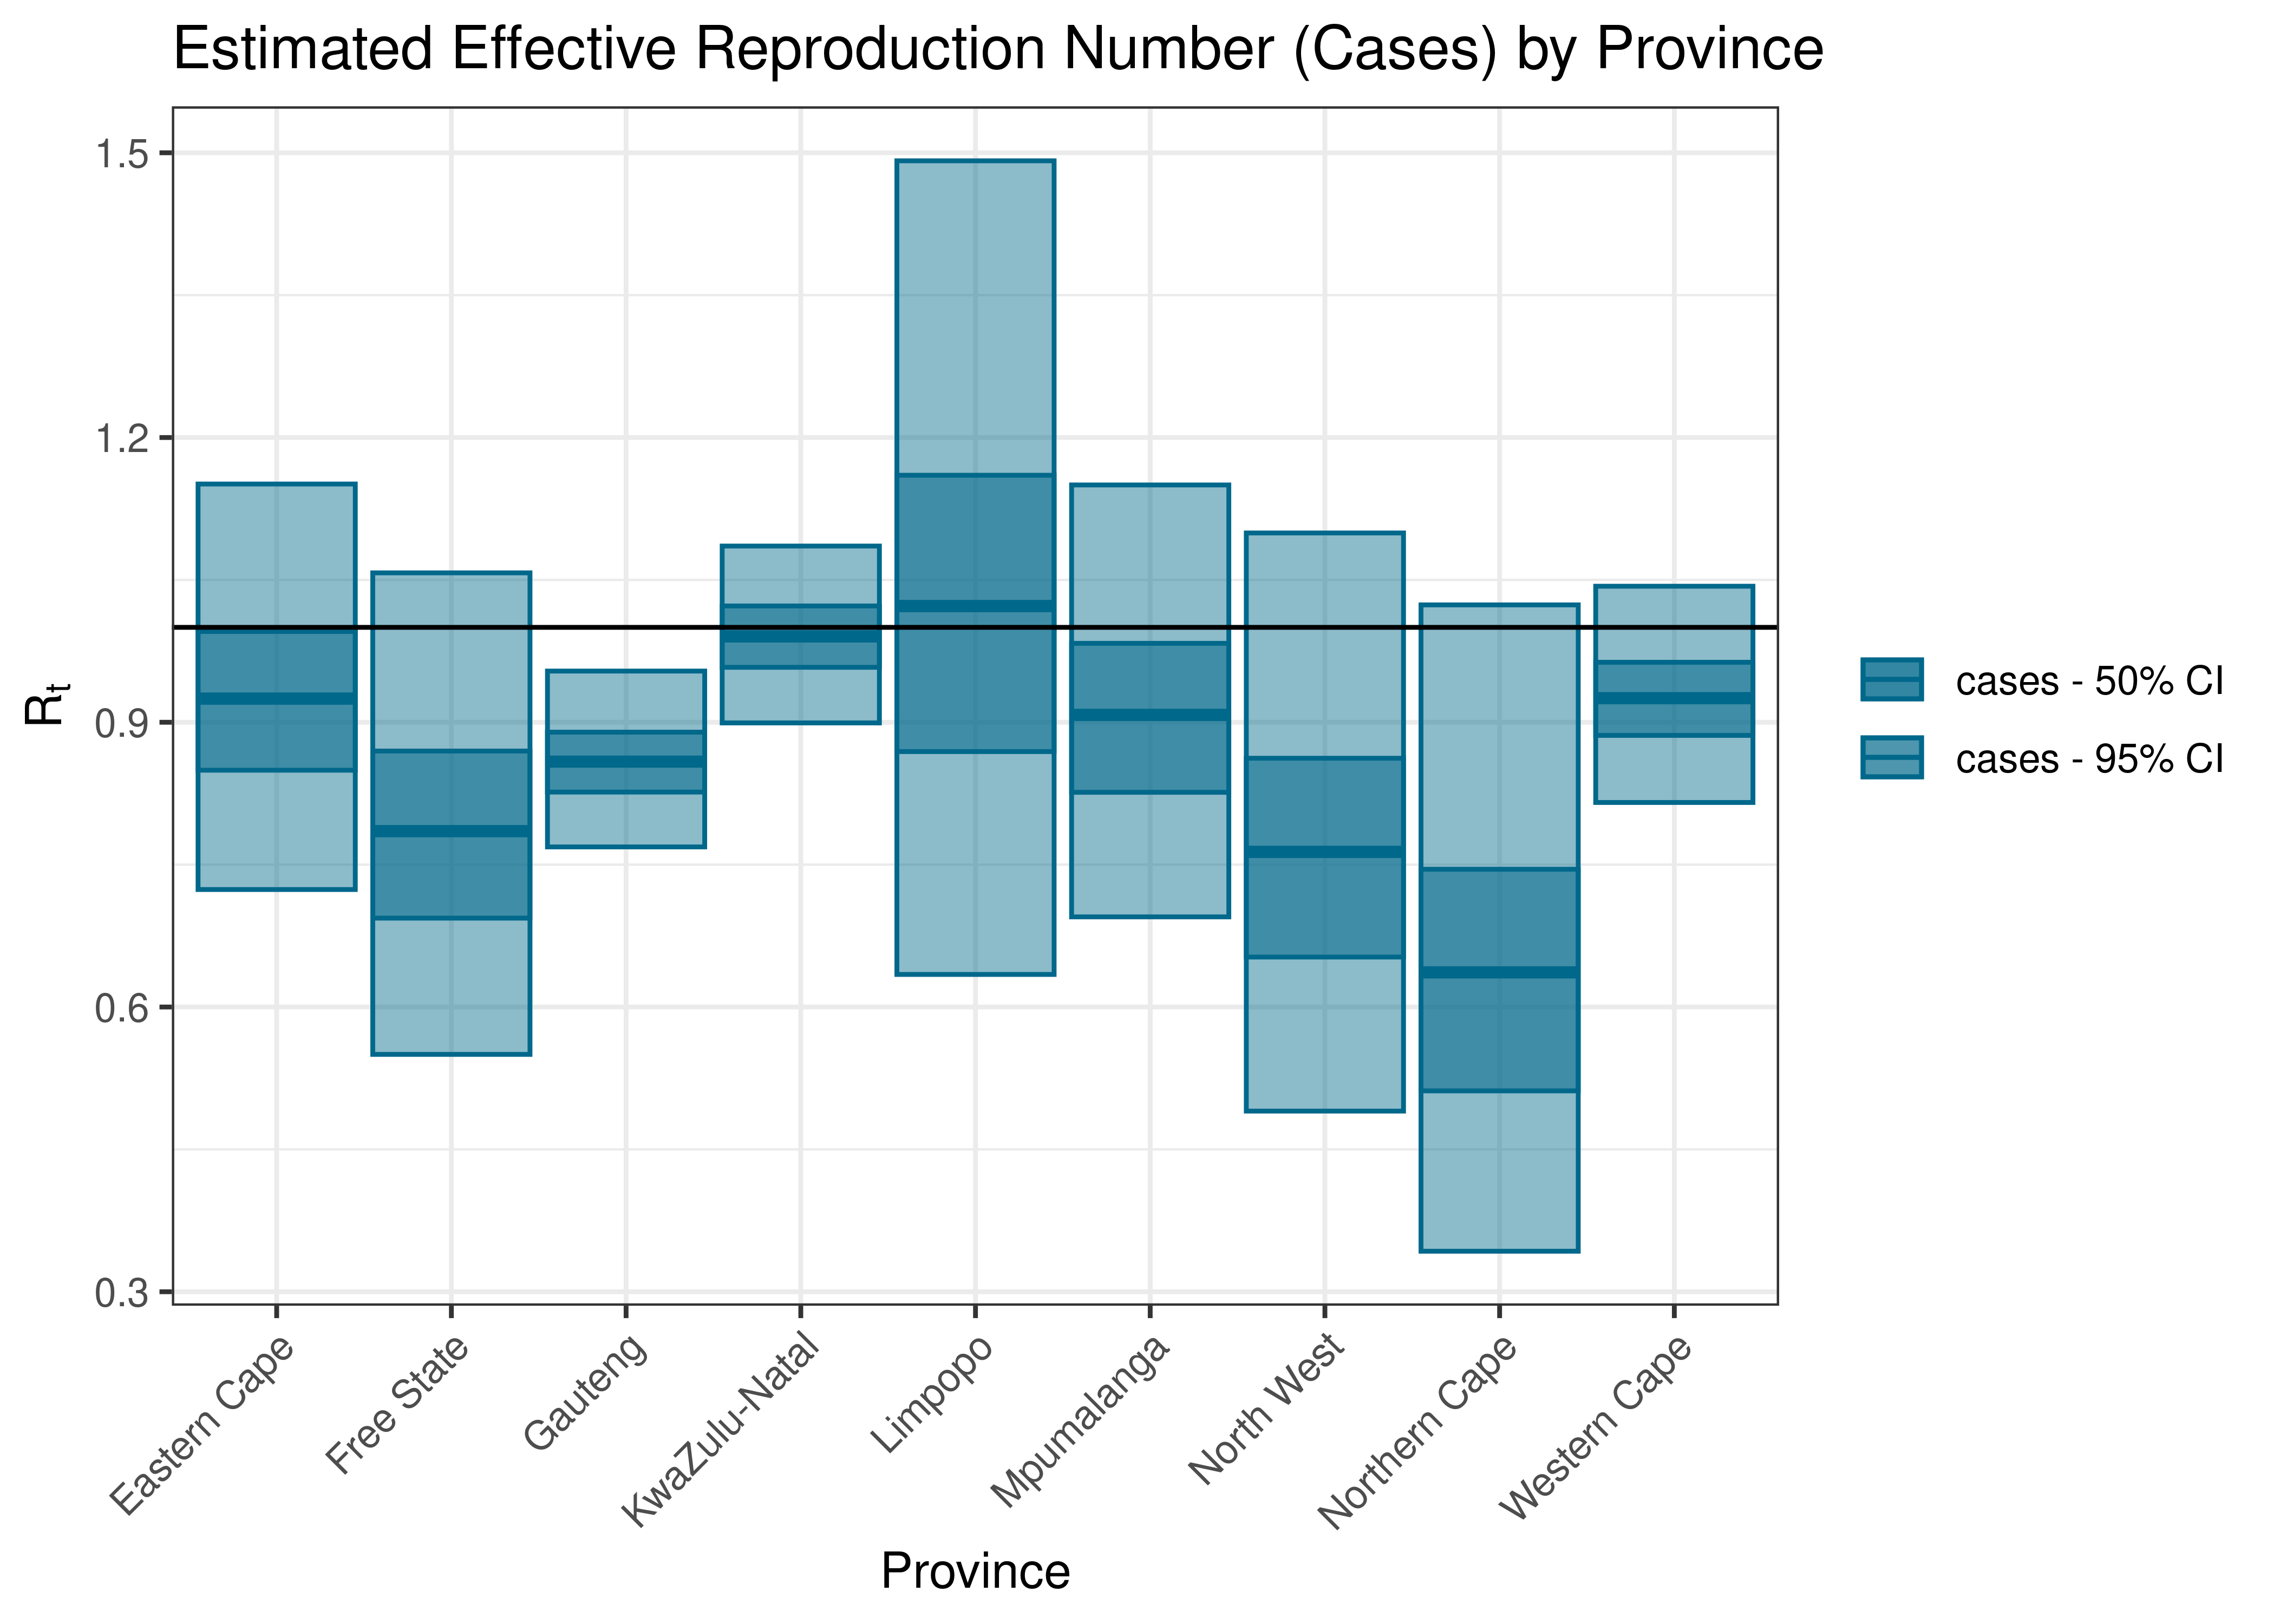
Estimated Effective Reproduction Number based on Cases by Province
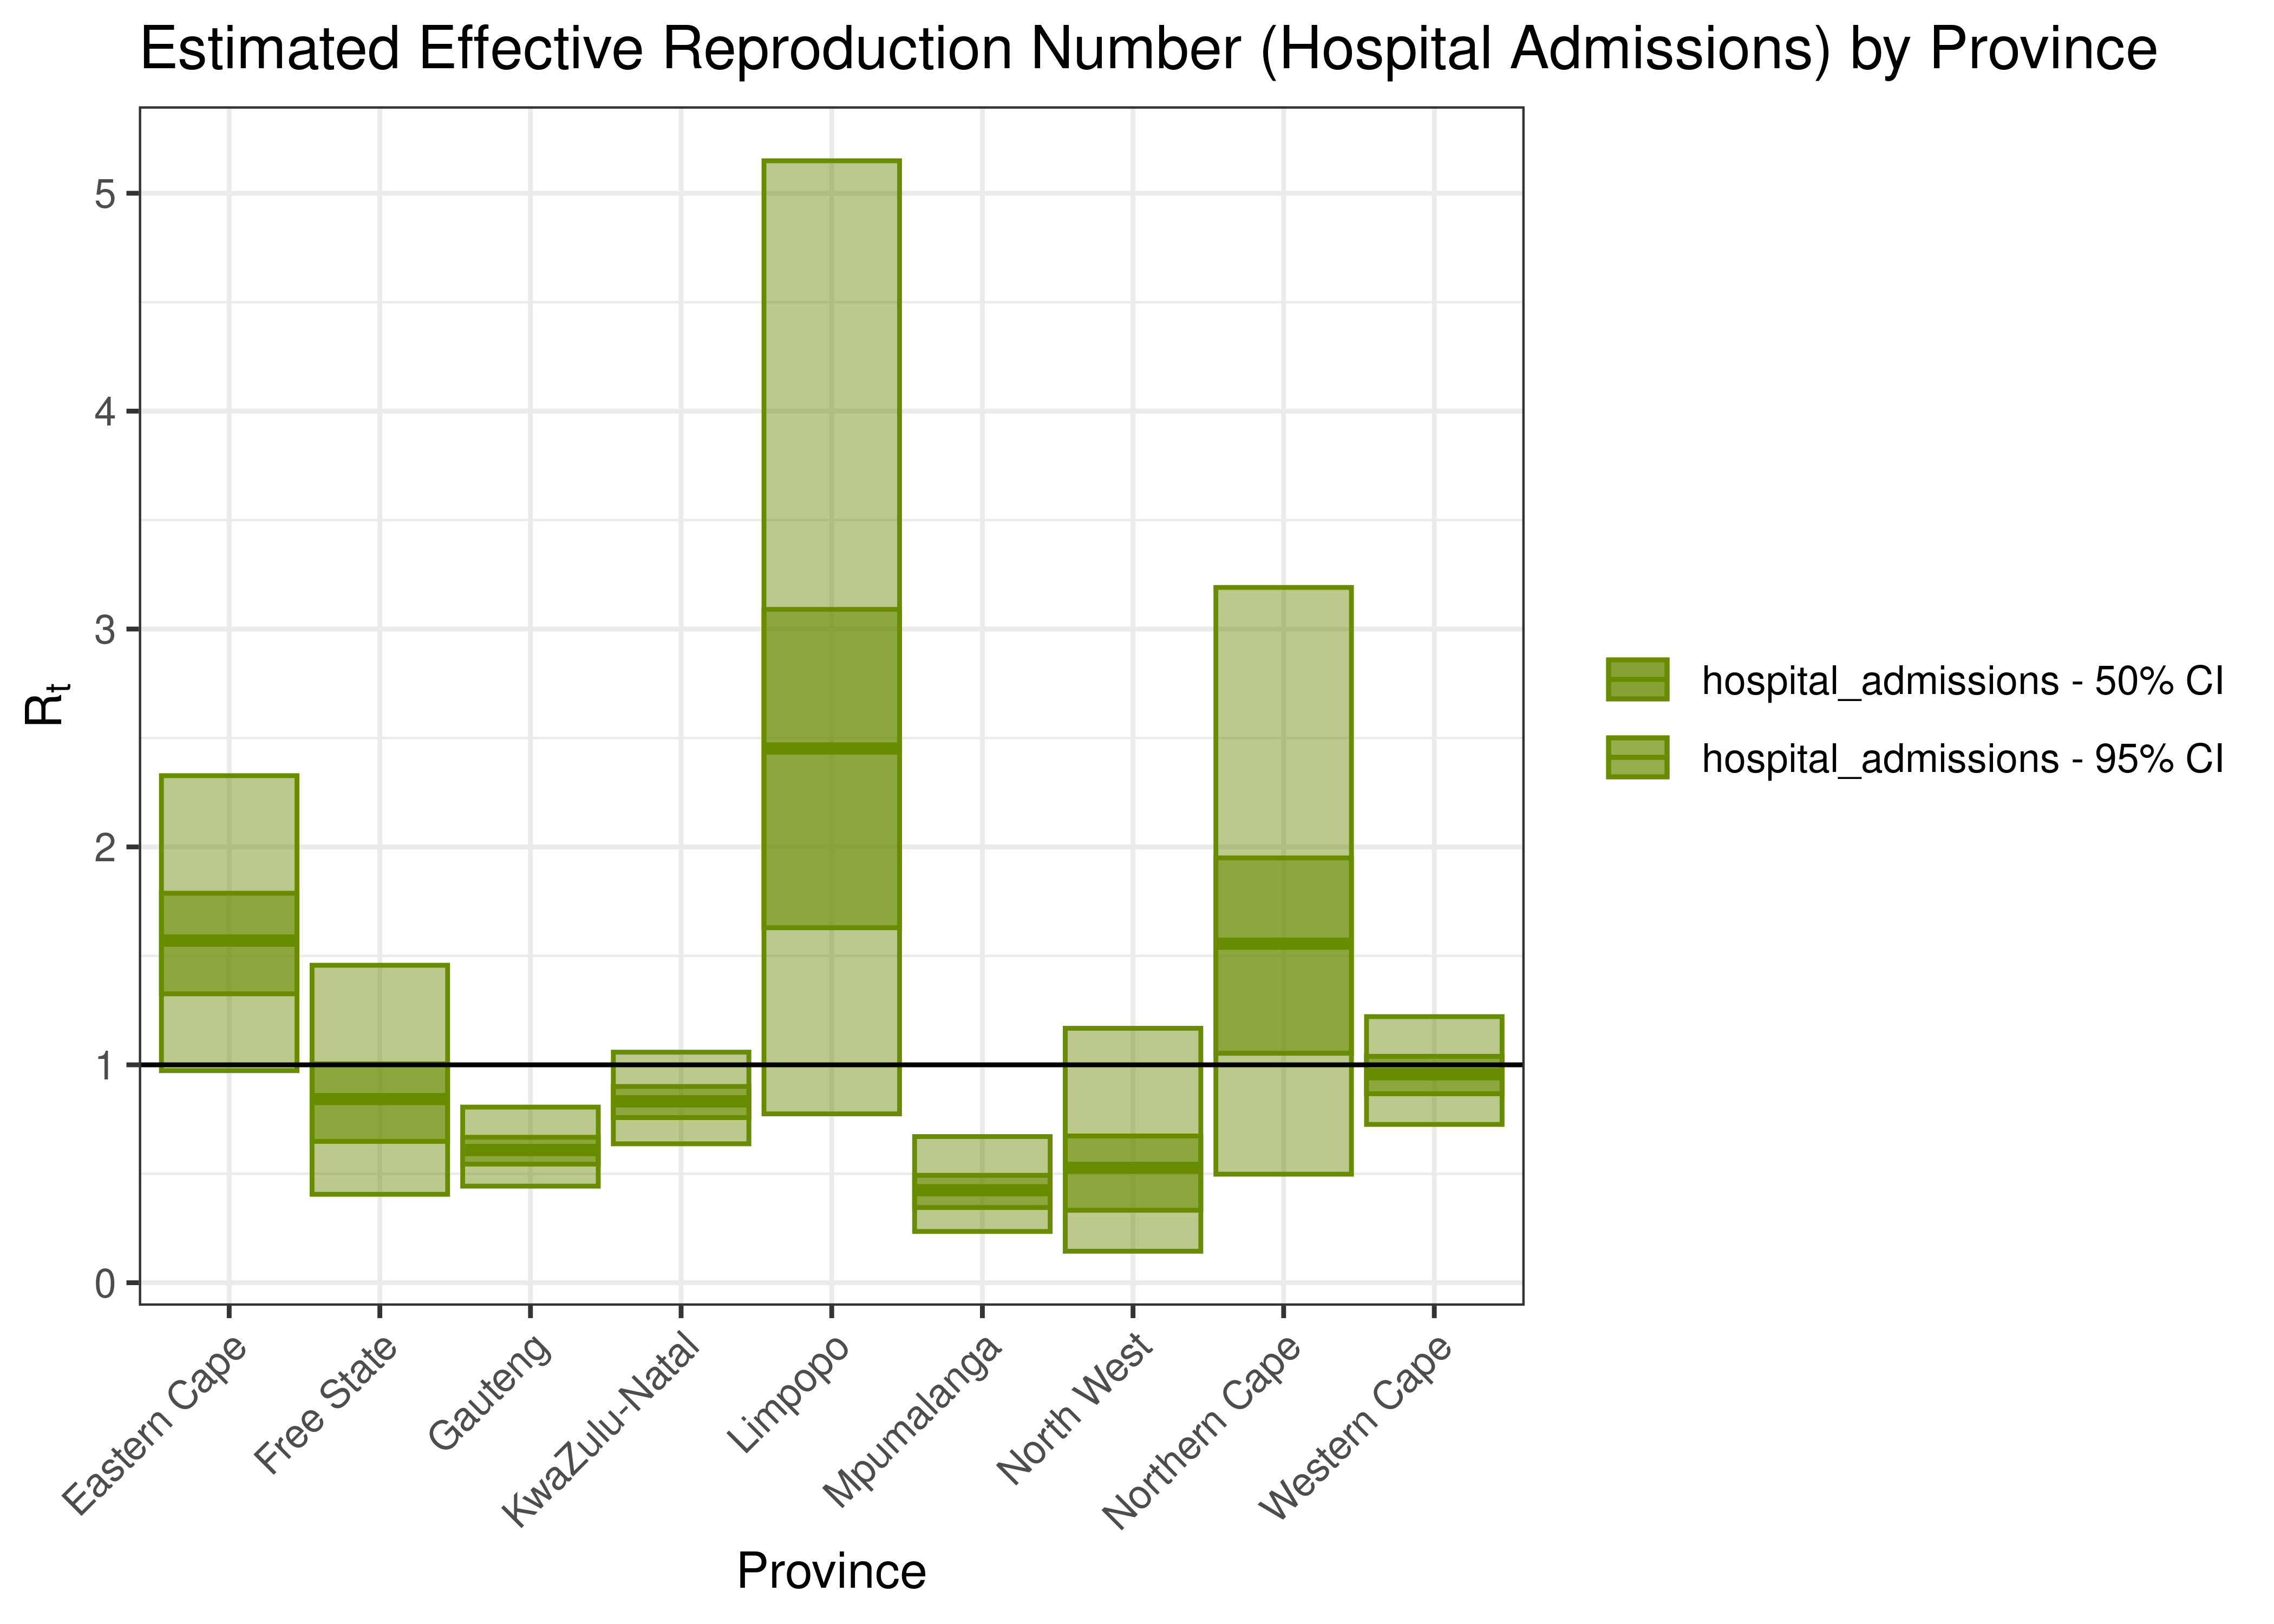
Estimated Effective Reproduction Number based on Hospital Admissions by Province
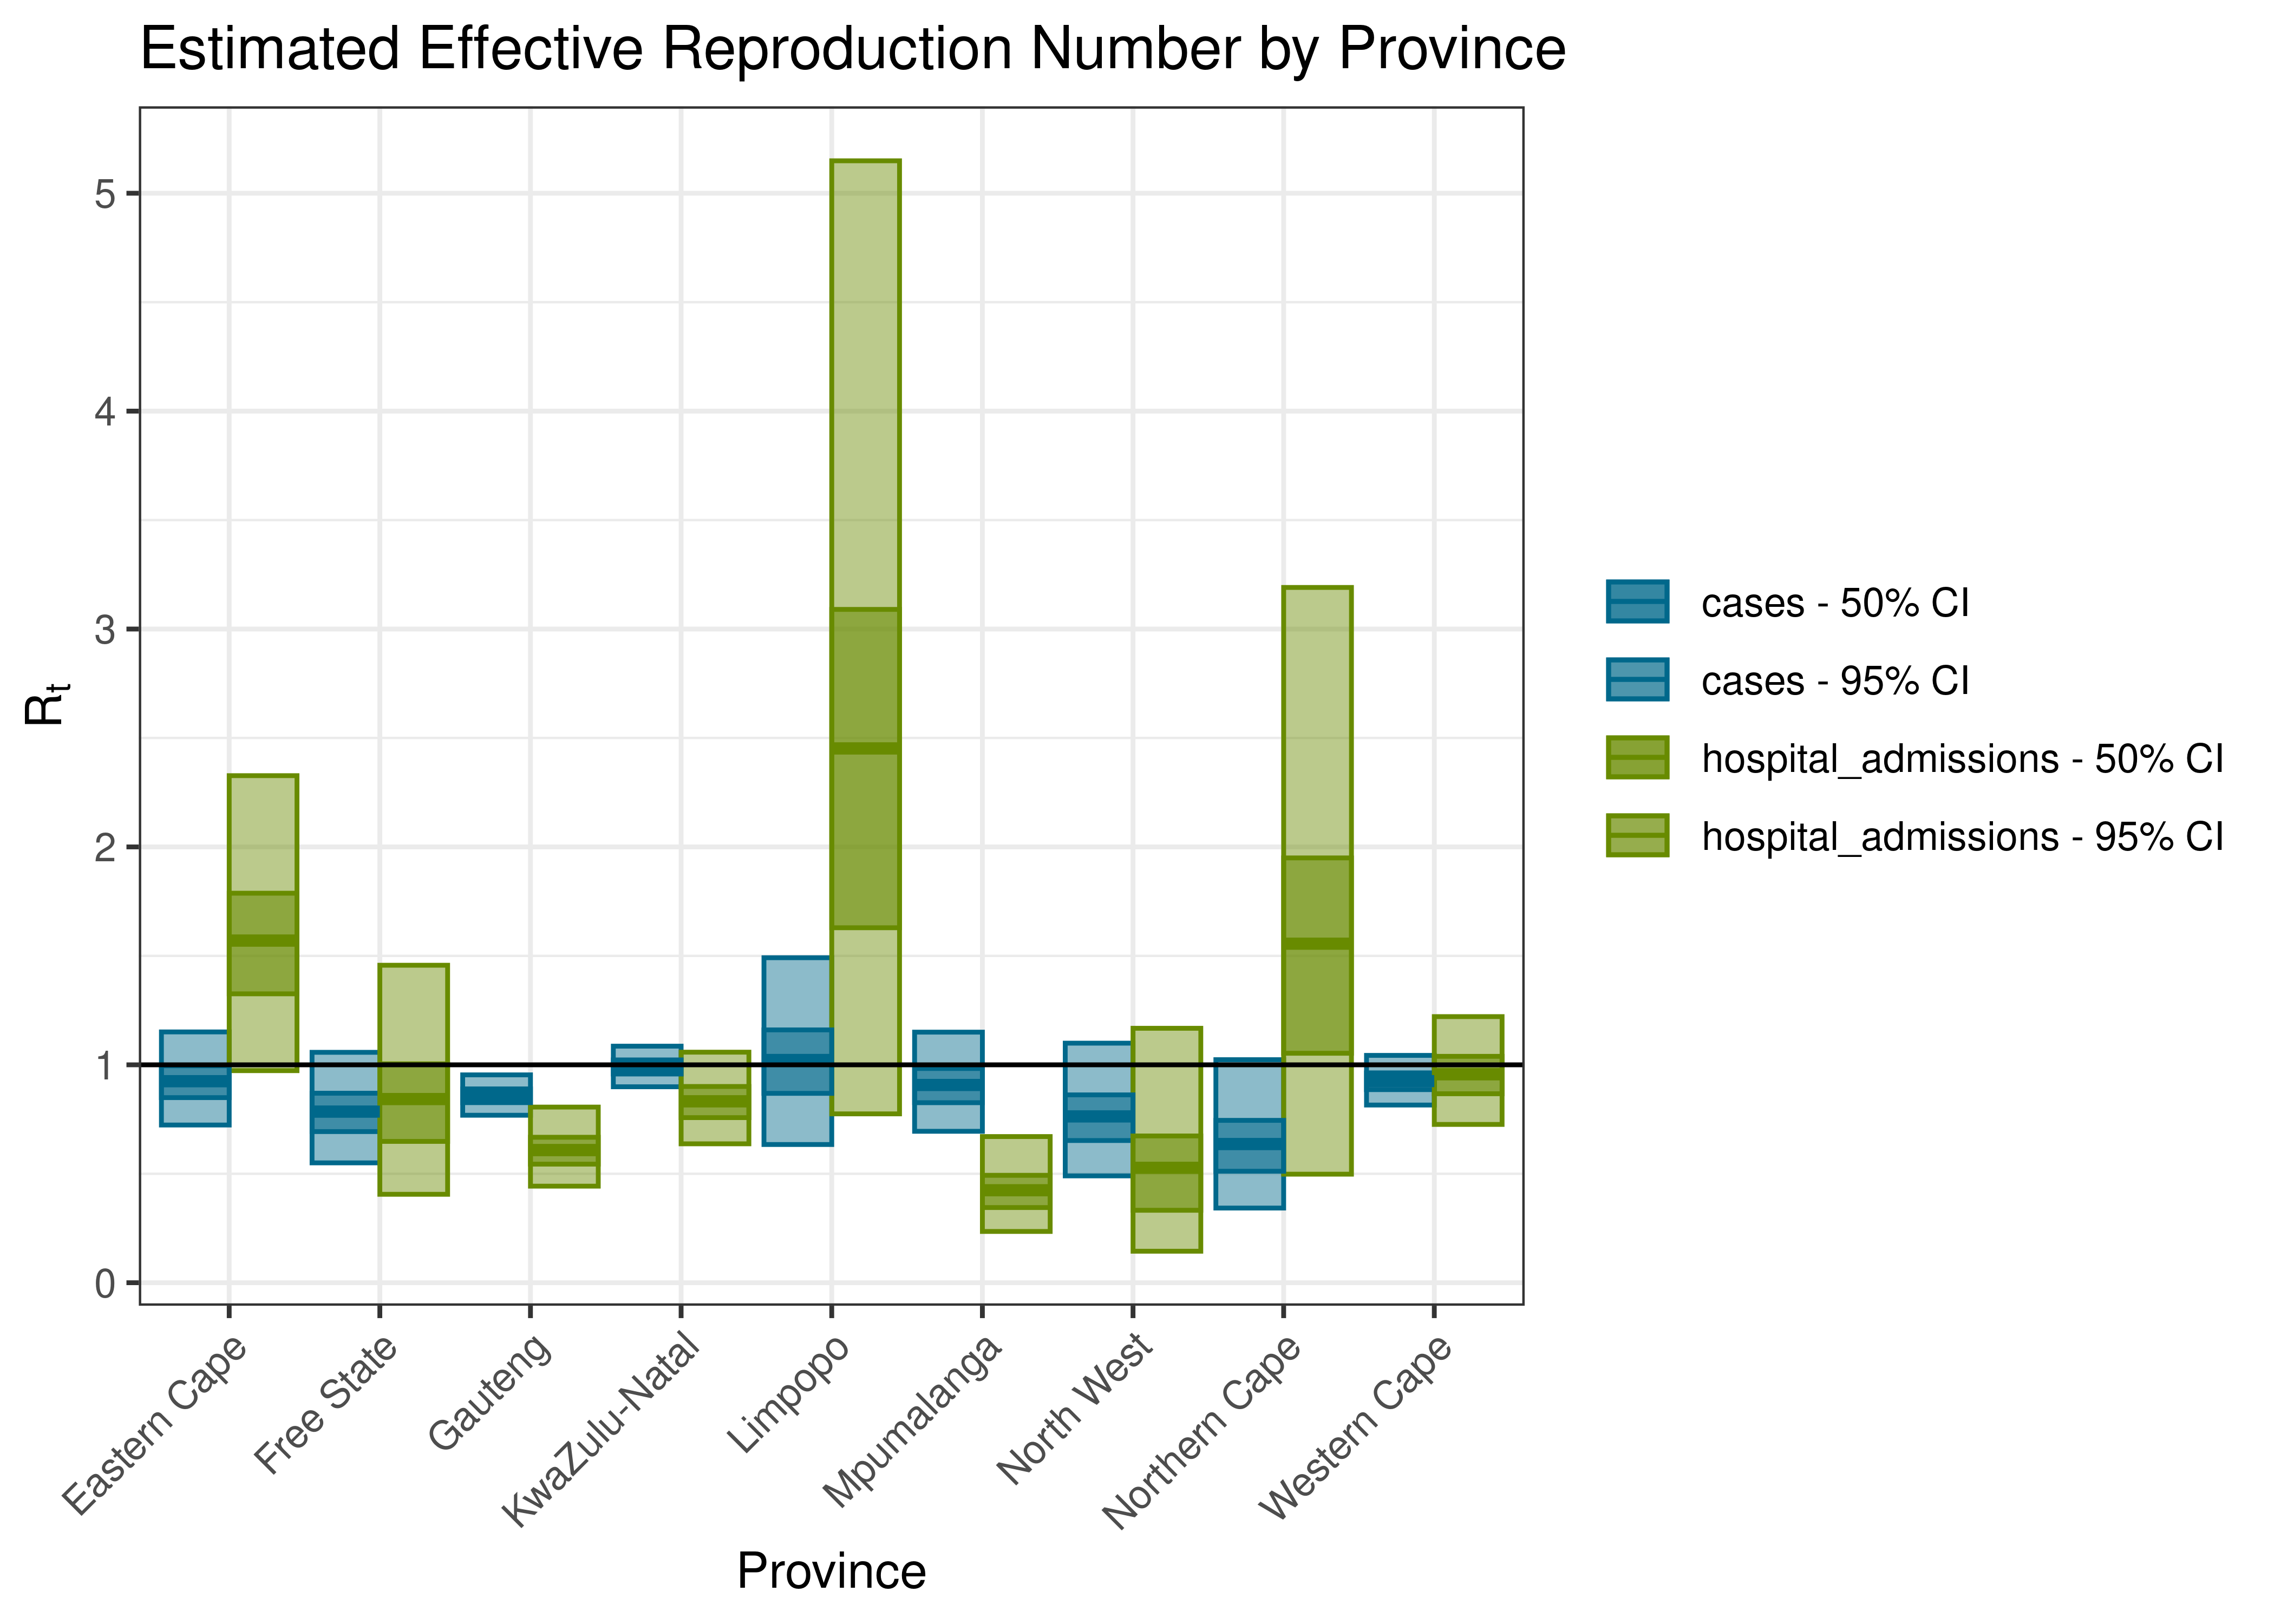
Estimated Effective Reproduction Number by Province
Below the effective reproduction number for South Africa over the last 90 days are plotted together with a plot since start of the pandemic.
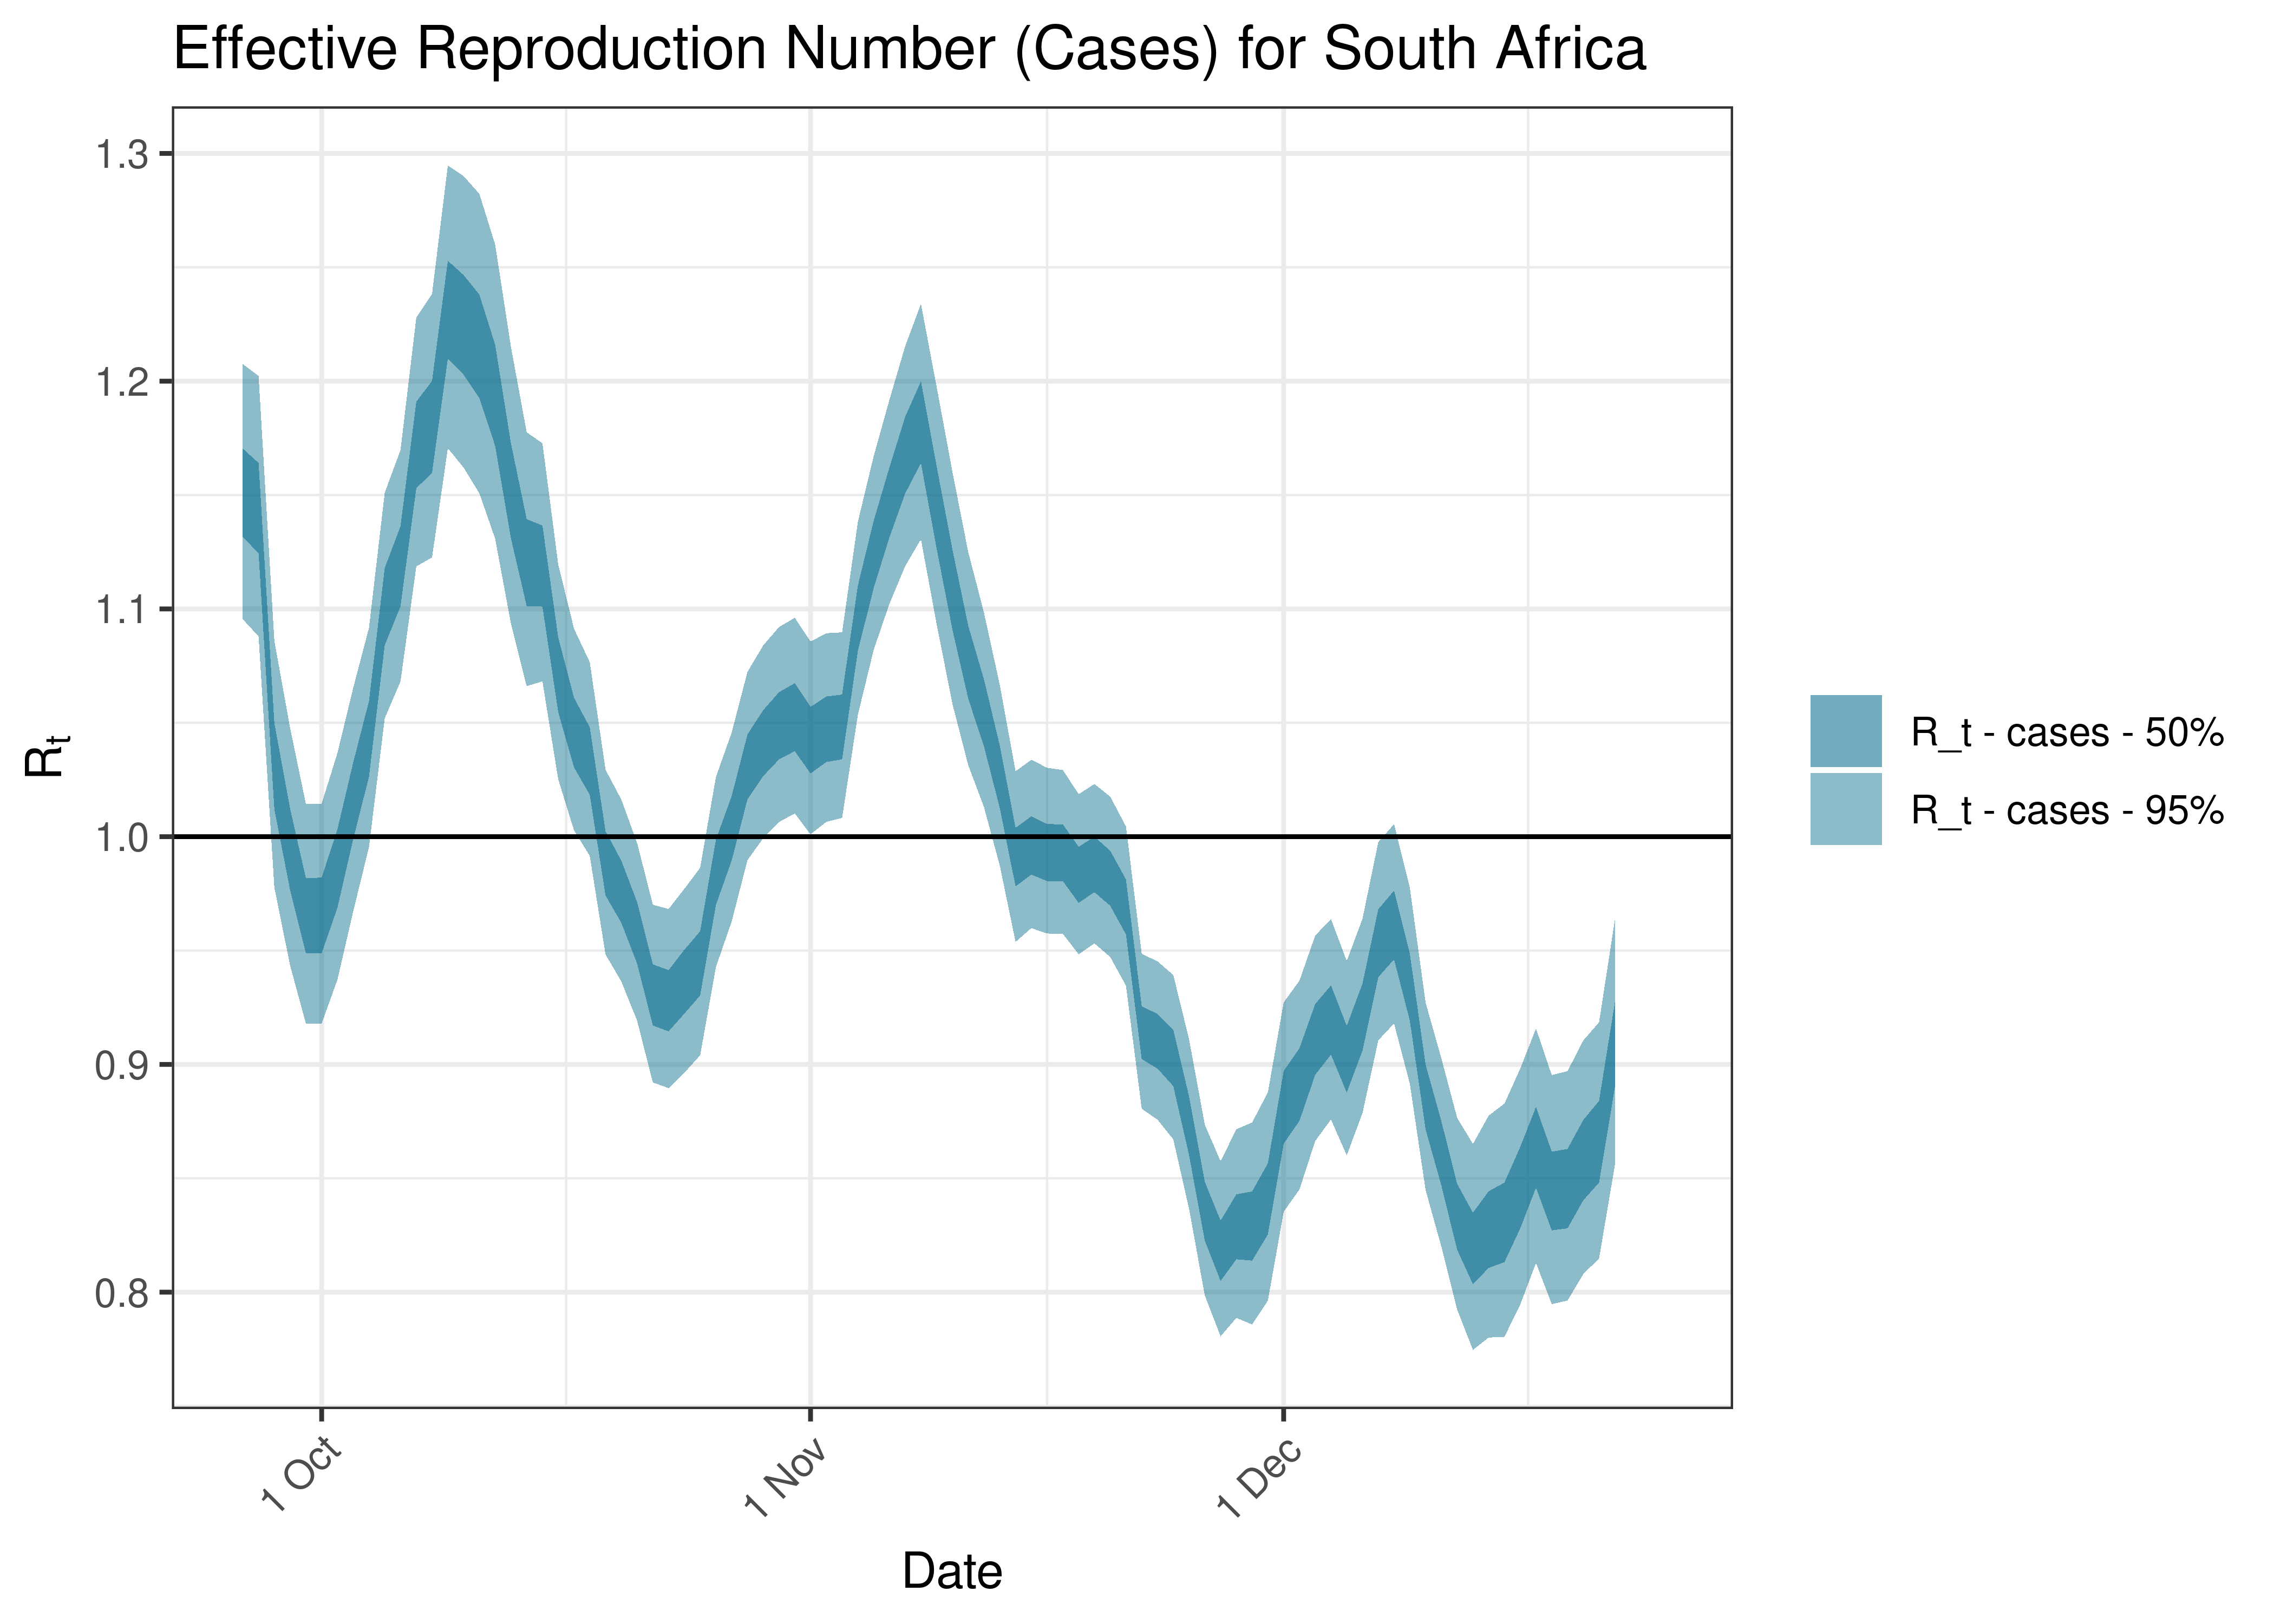
Estimated Effective Reproduction Number Based on Cases for South Africa over last 90 days
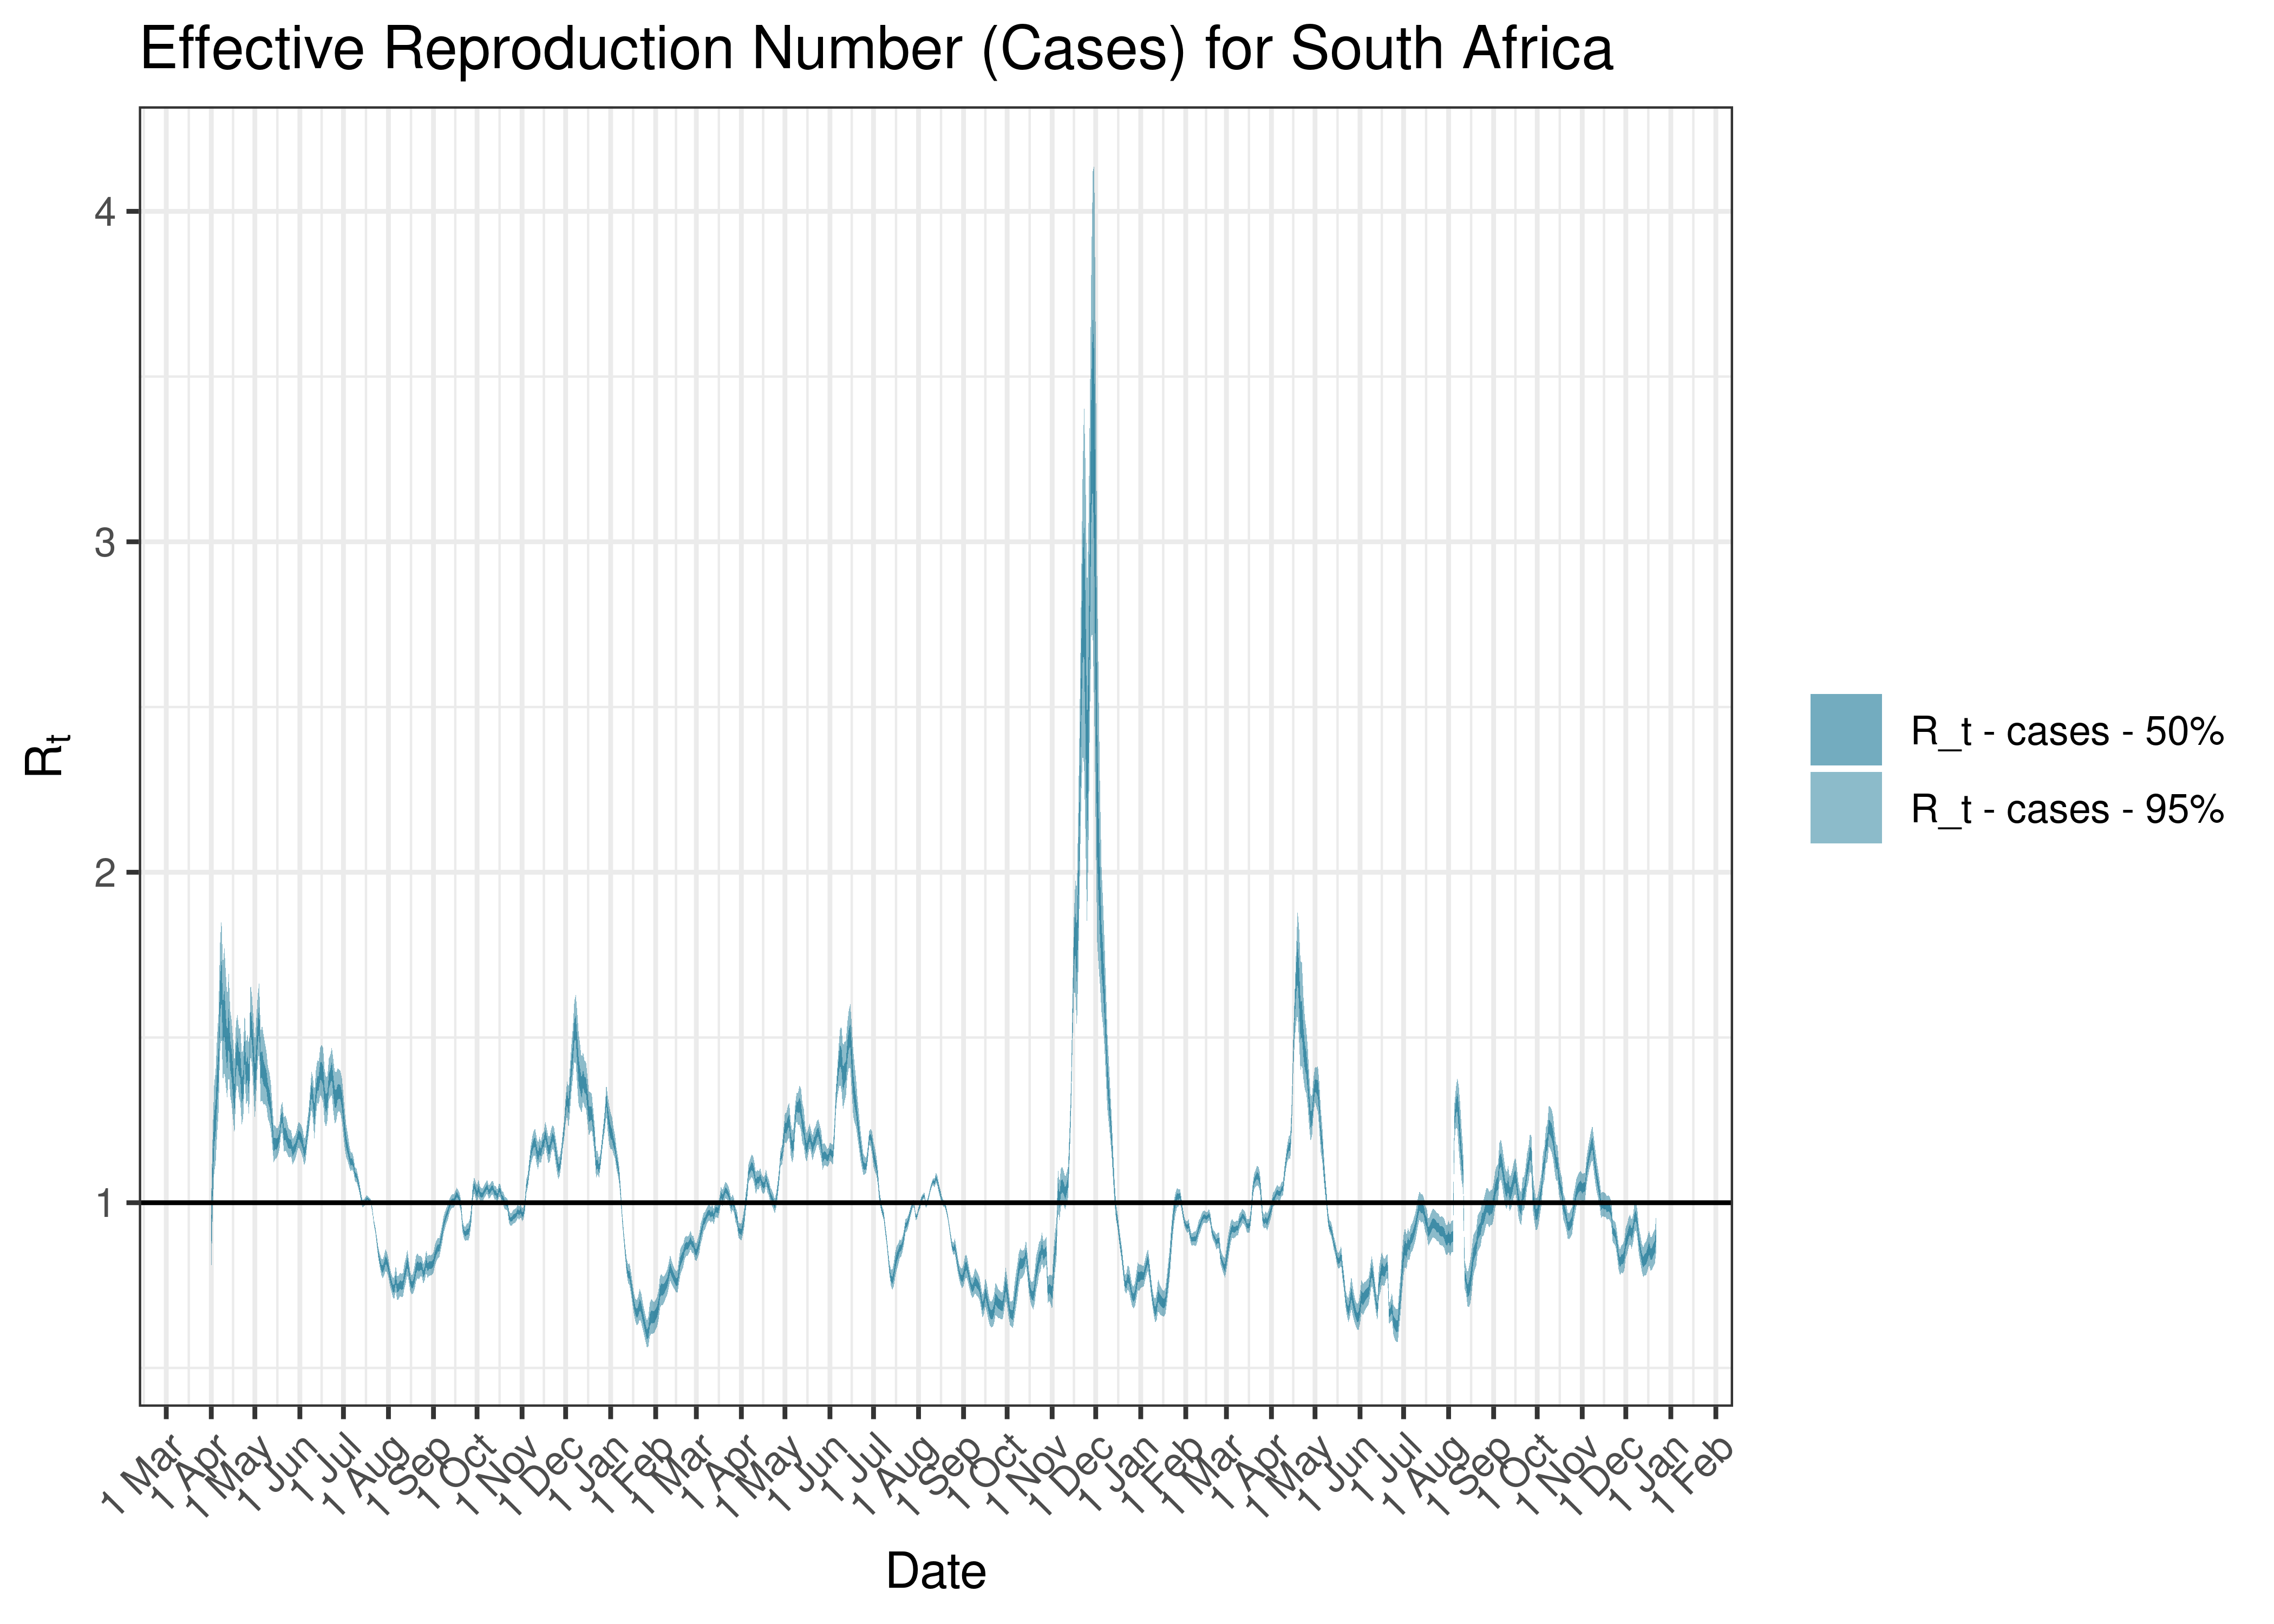
Estimated Effective Reproduction Number Based on Cases for South Africa since 1 April 2020
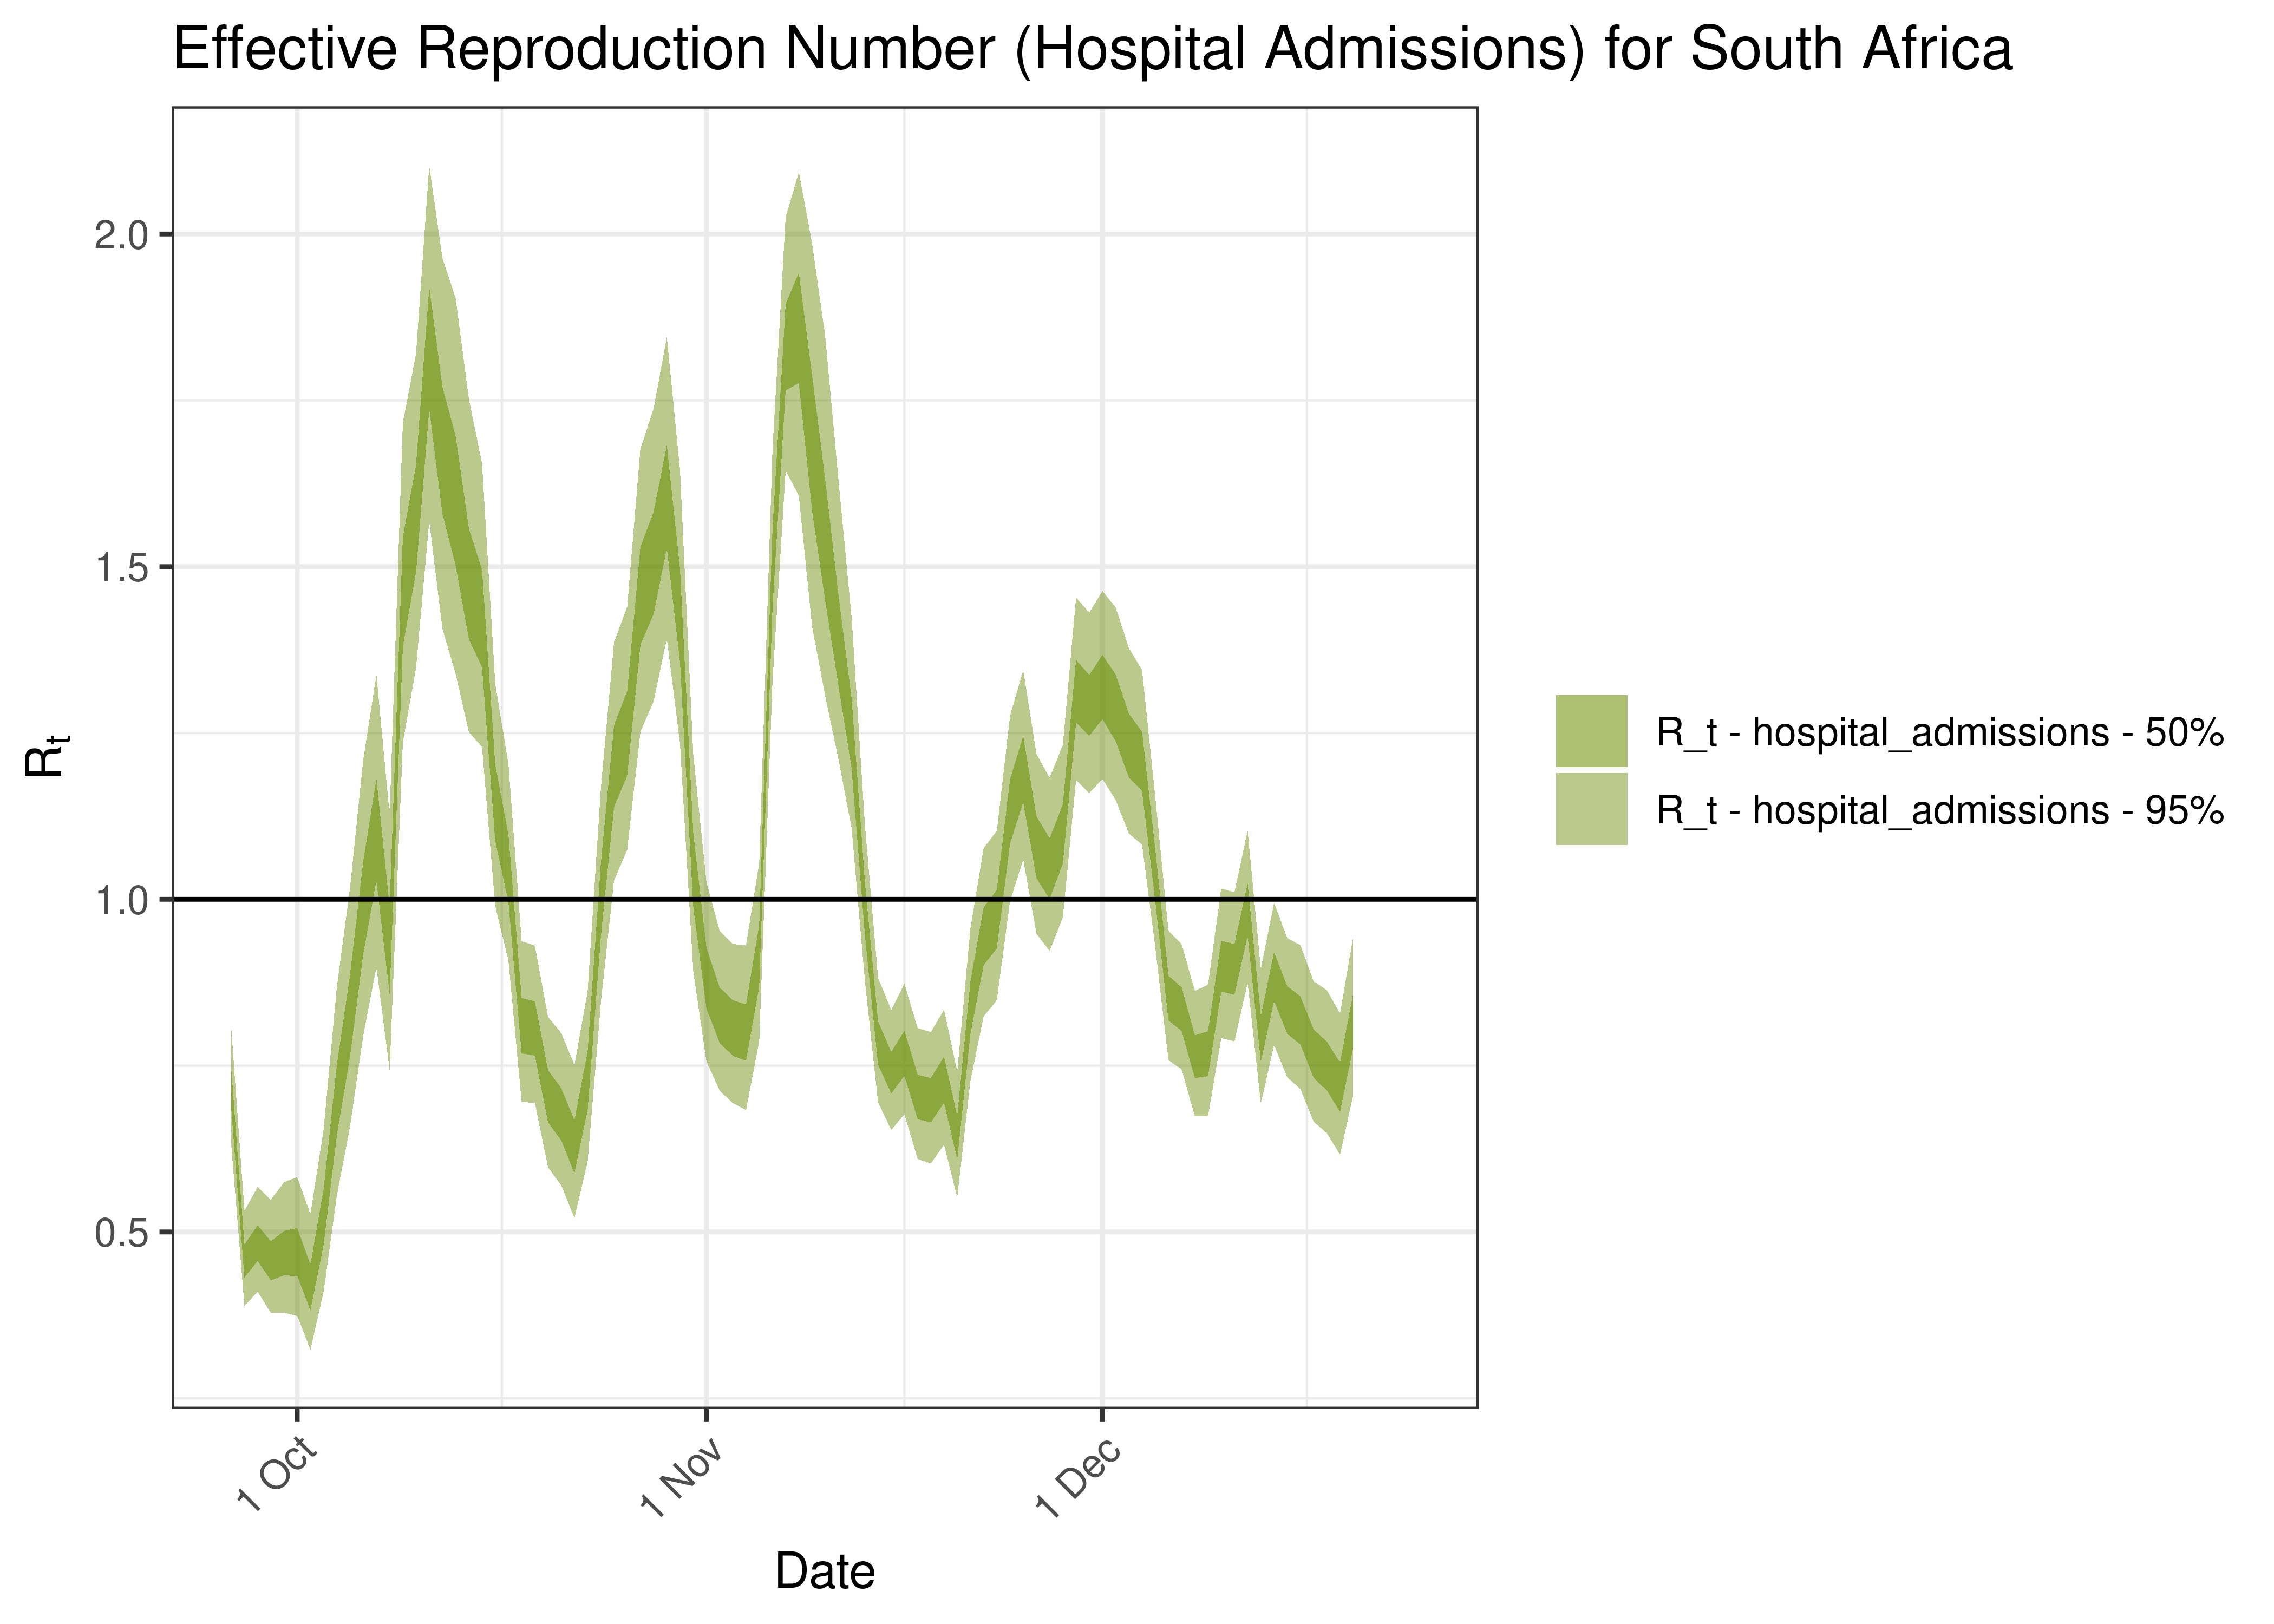
Estimated Effective Reproduction Number Based on Hospital Admissions for South Africa over last 90 days
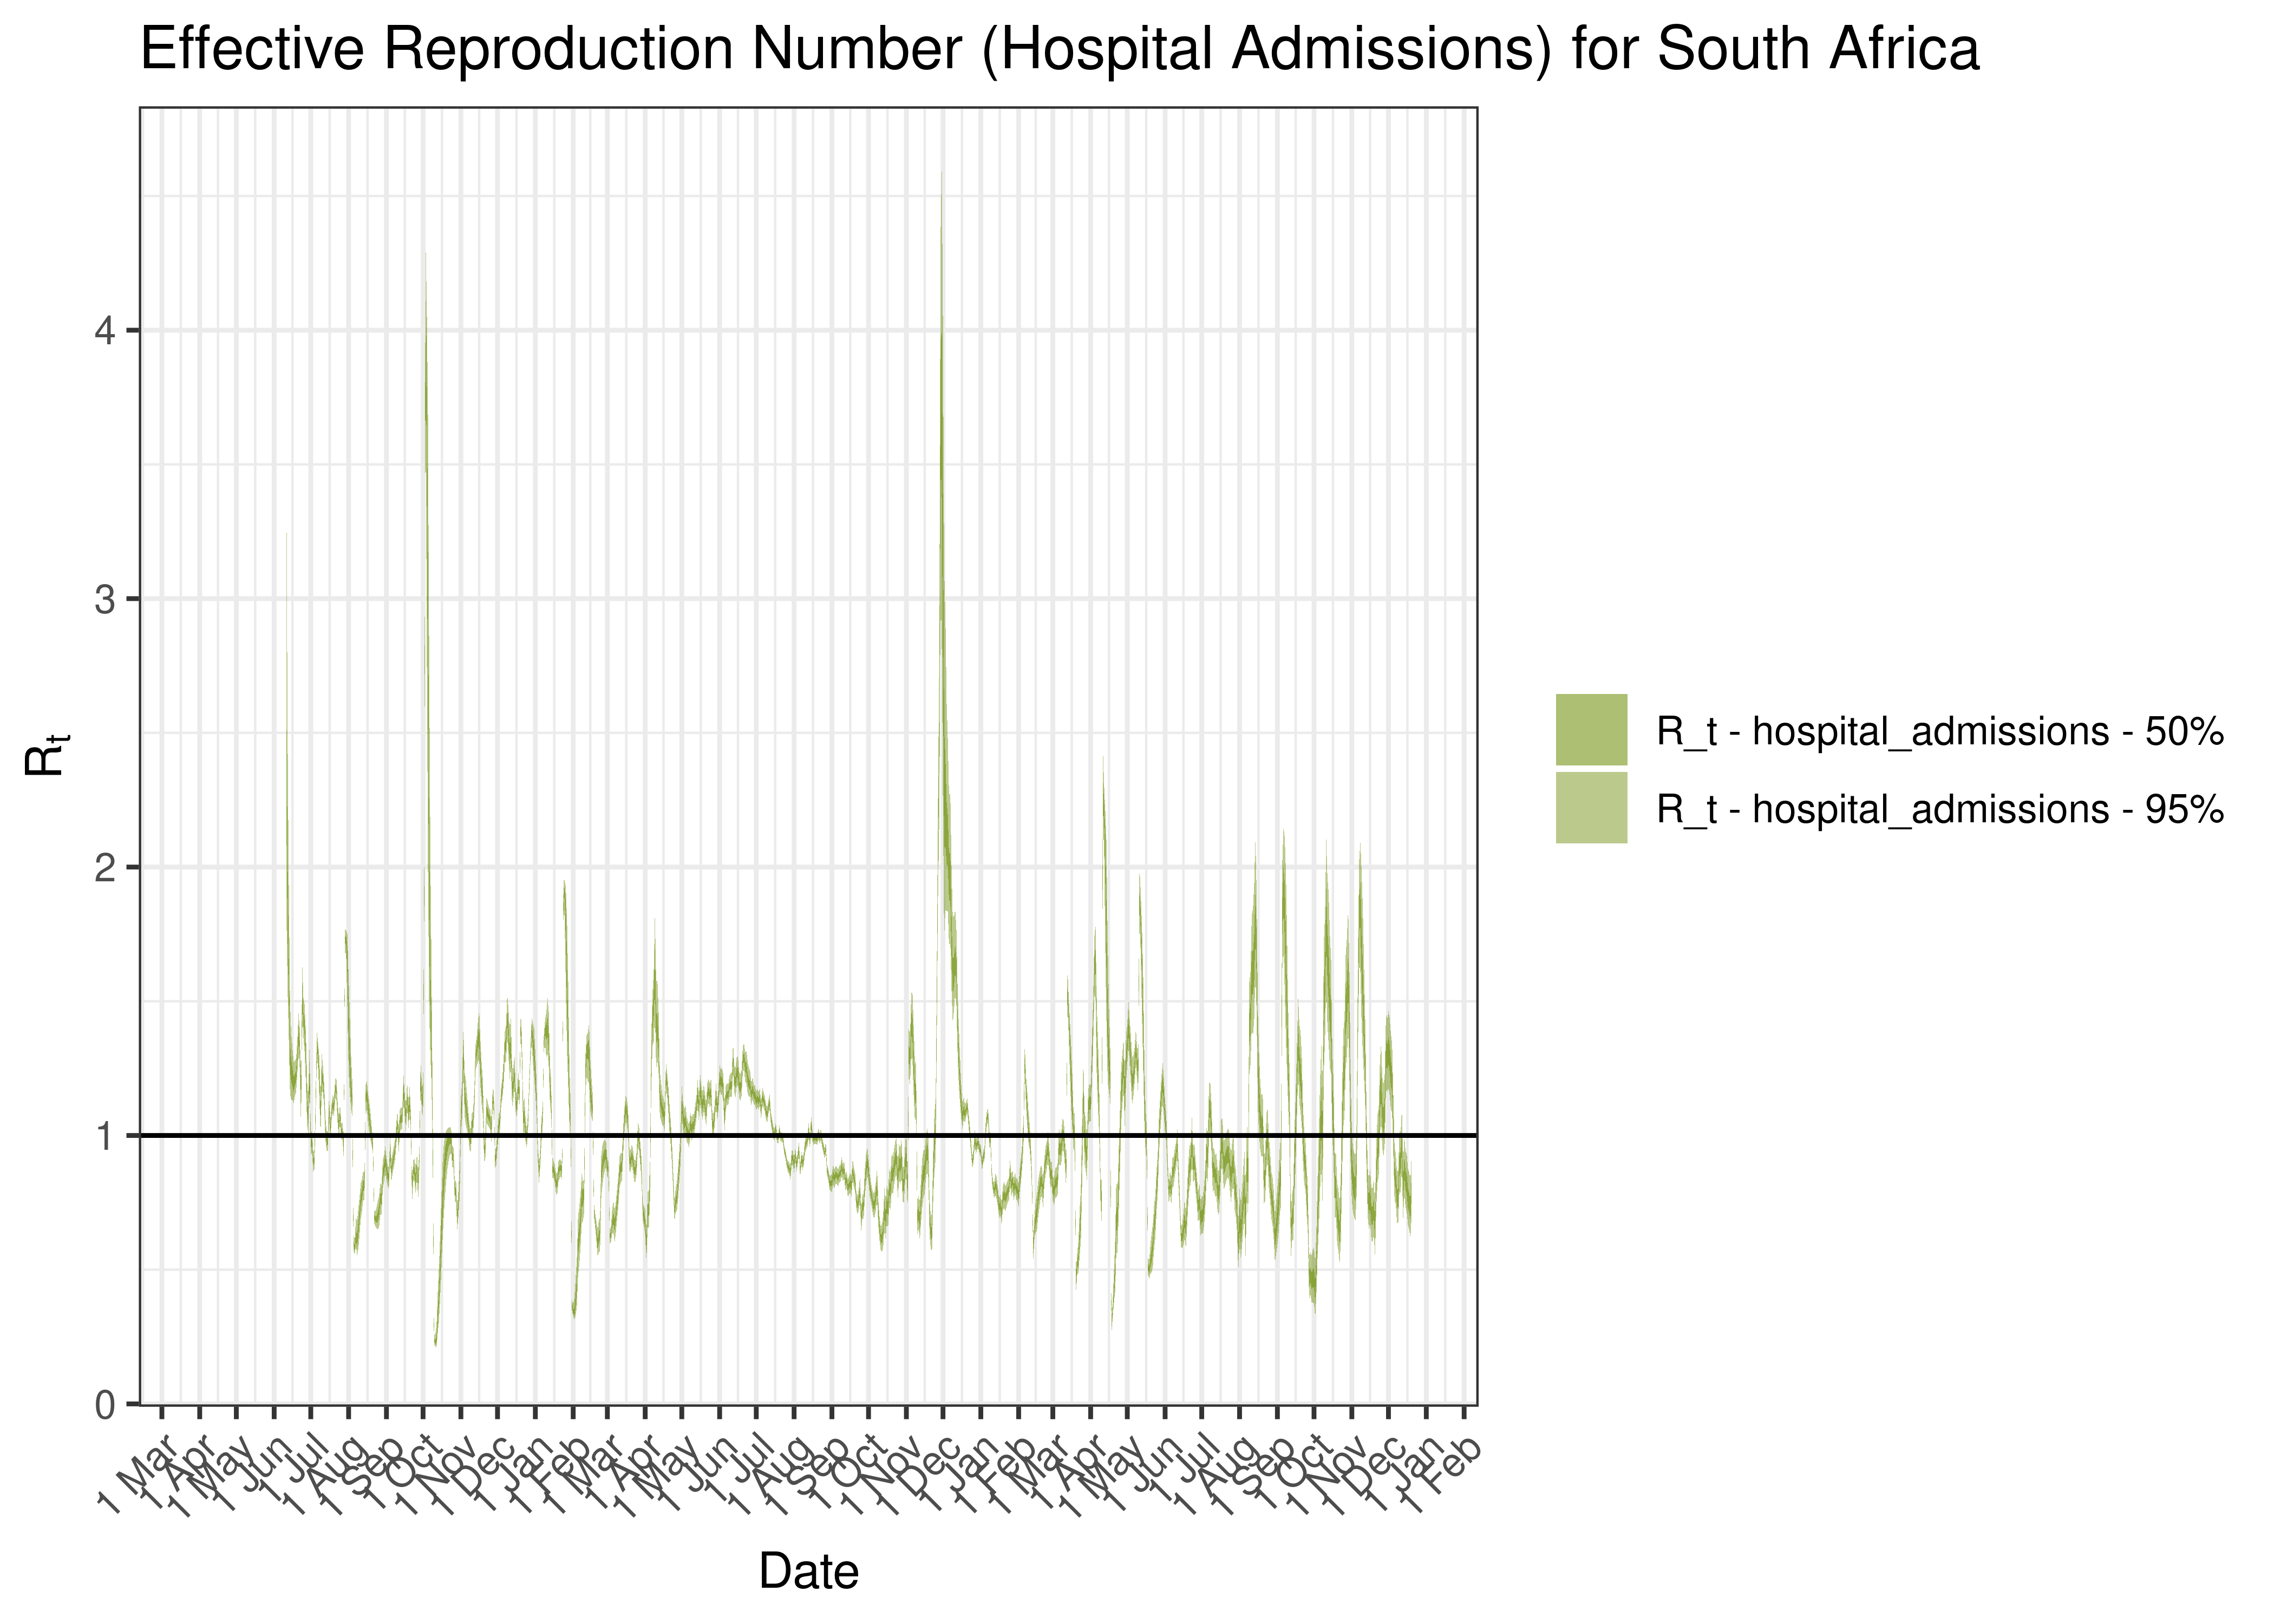
Estimated Effective Reproduction Number Based on Hospital Admissions for South Africa since 1 April 2020
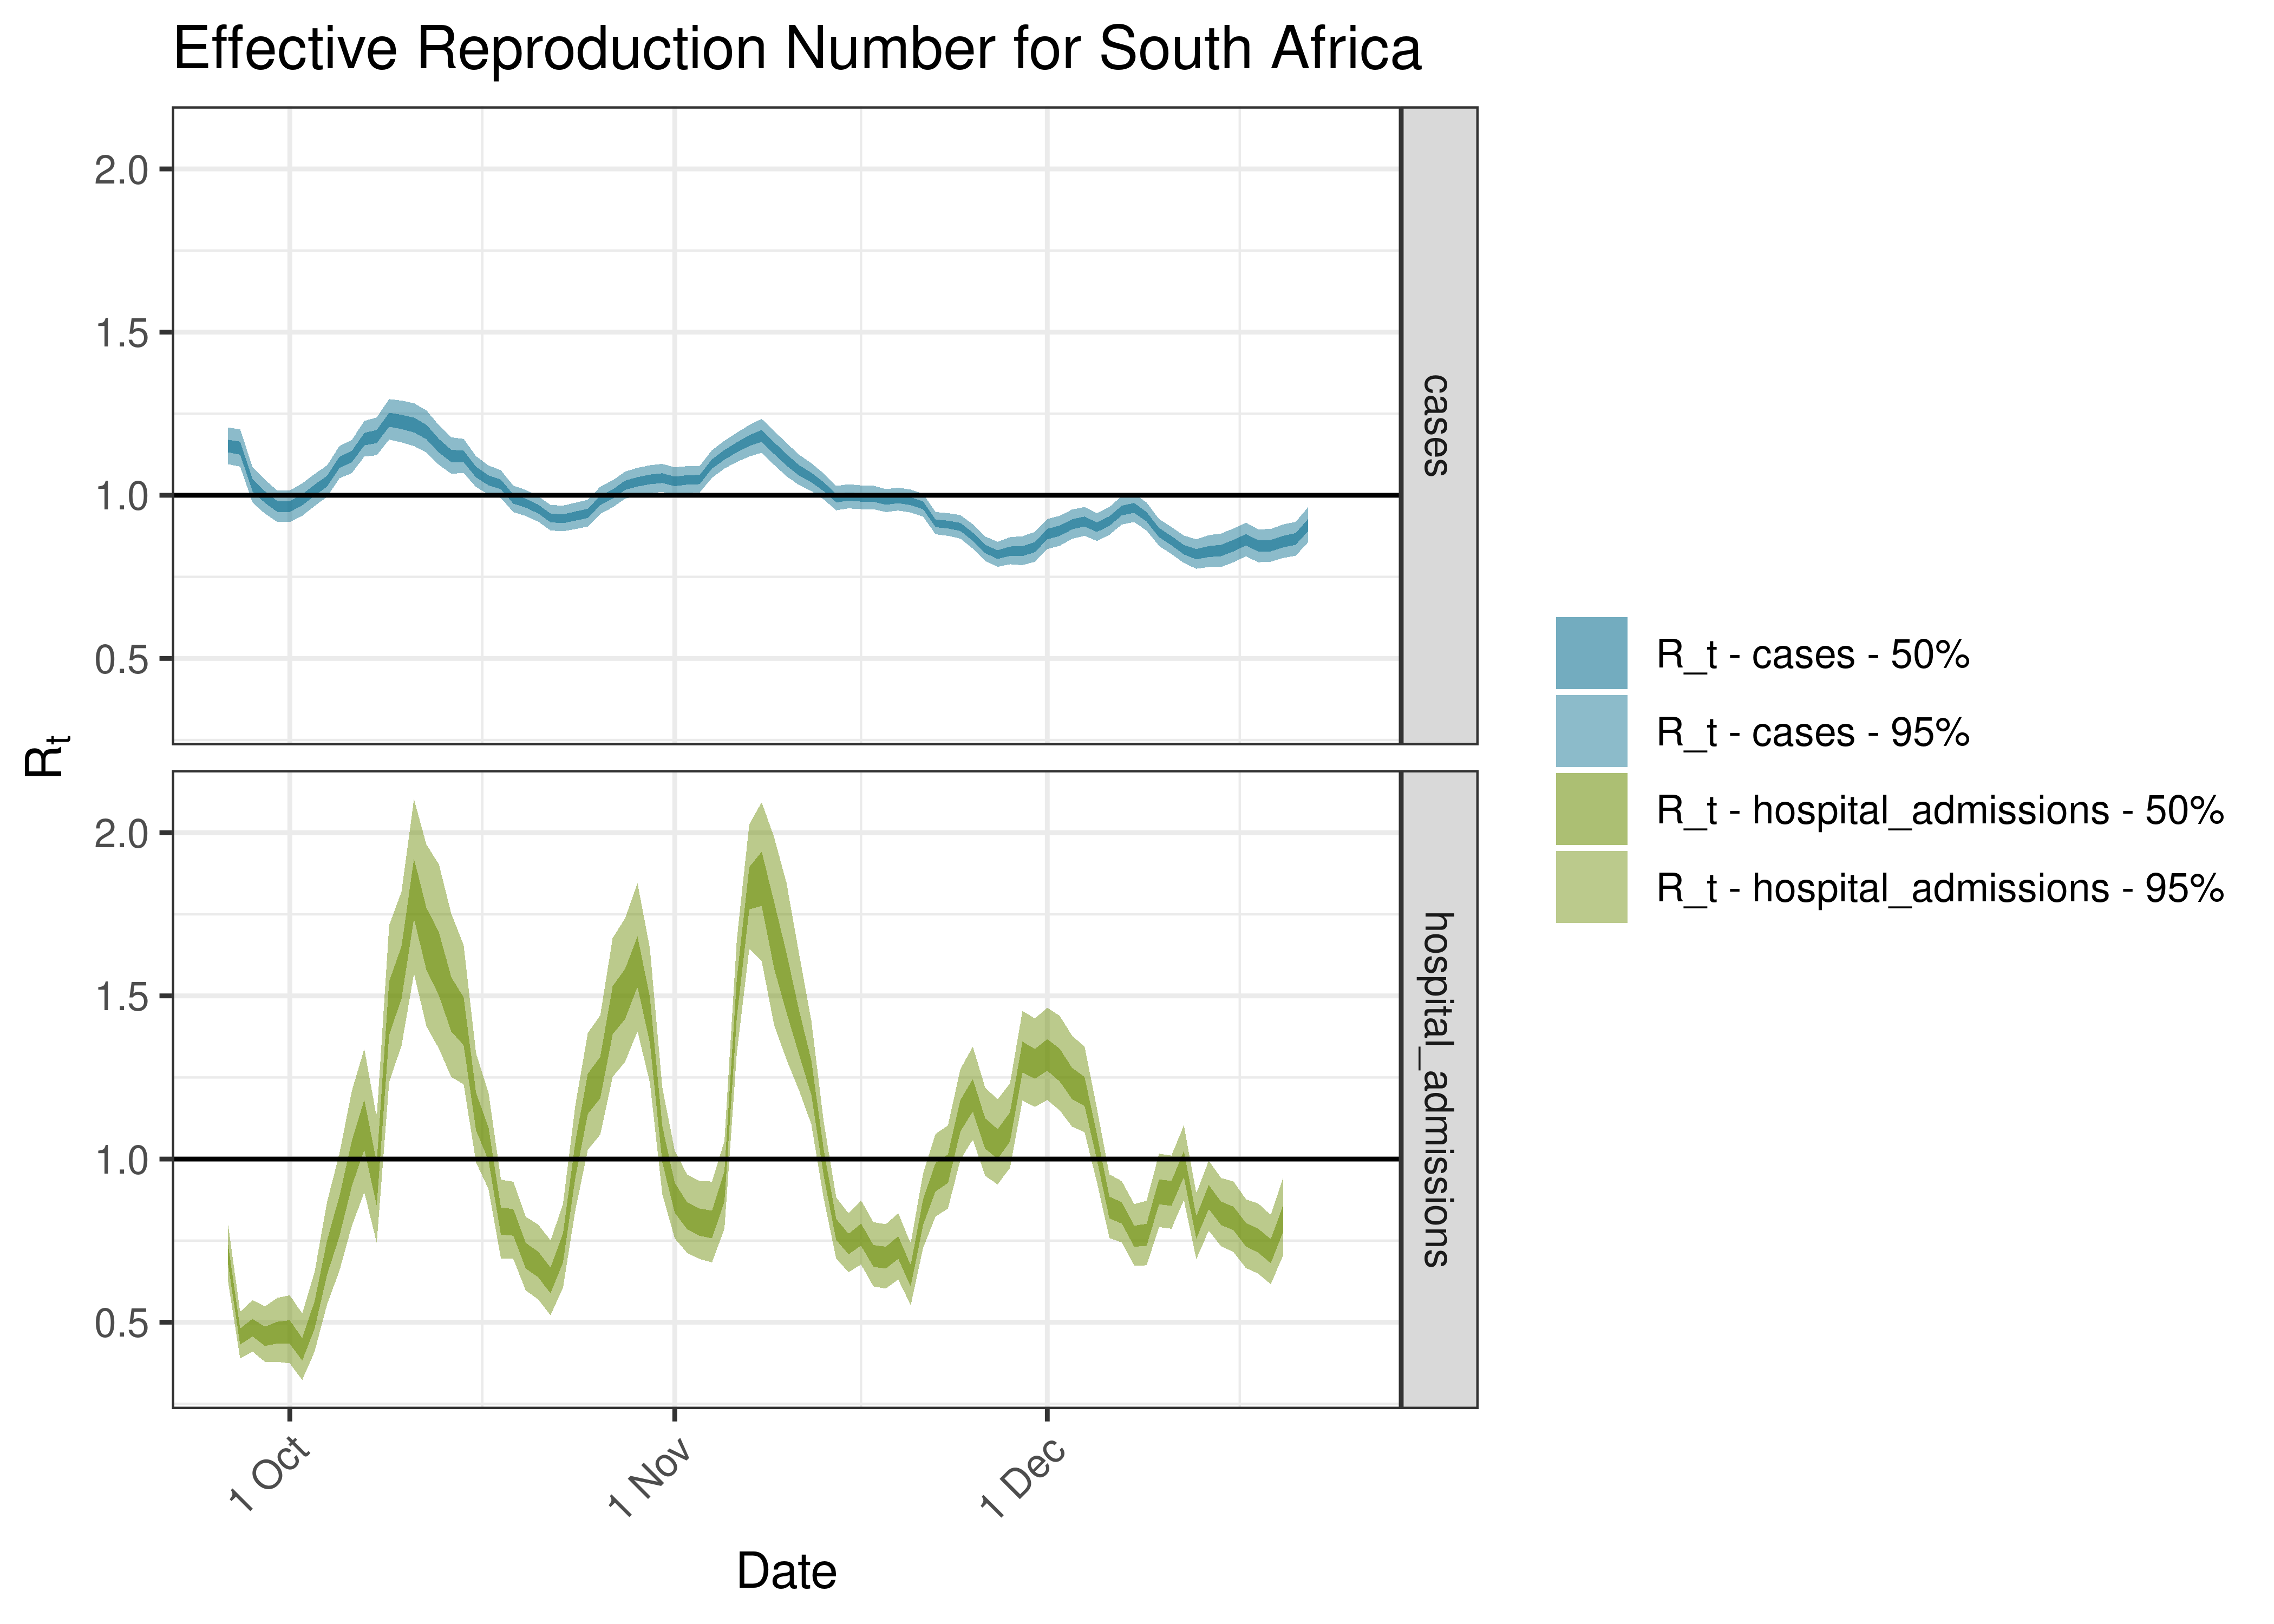
Estimated Effective Reproduction Number for South Africa over last 90 days
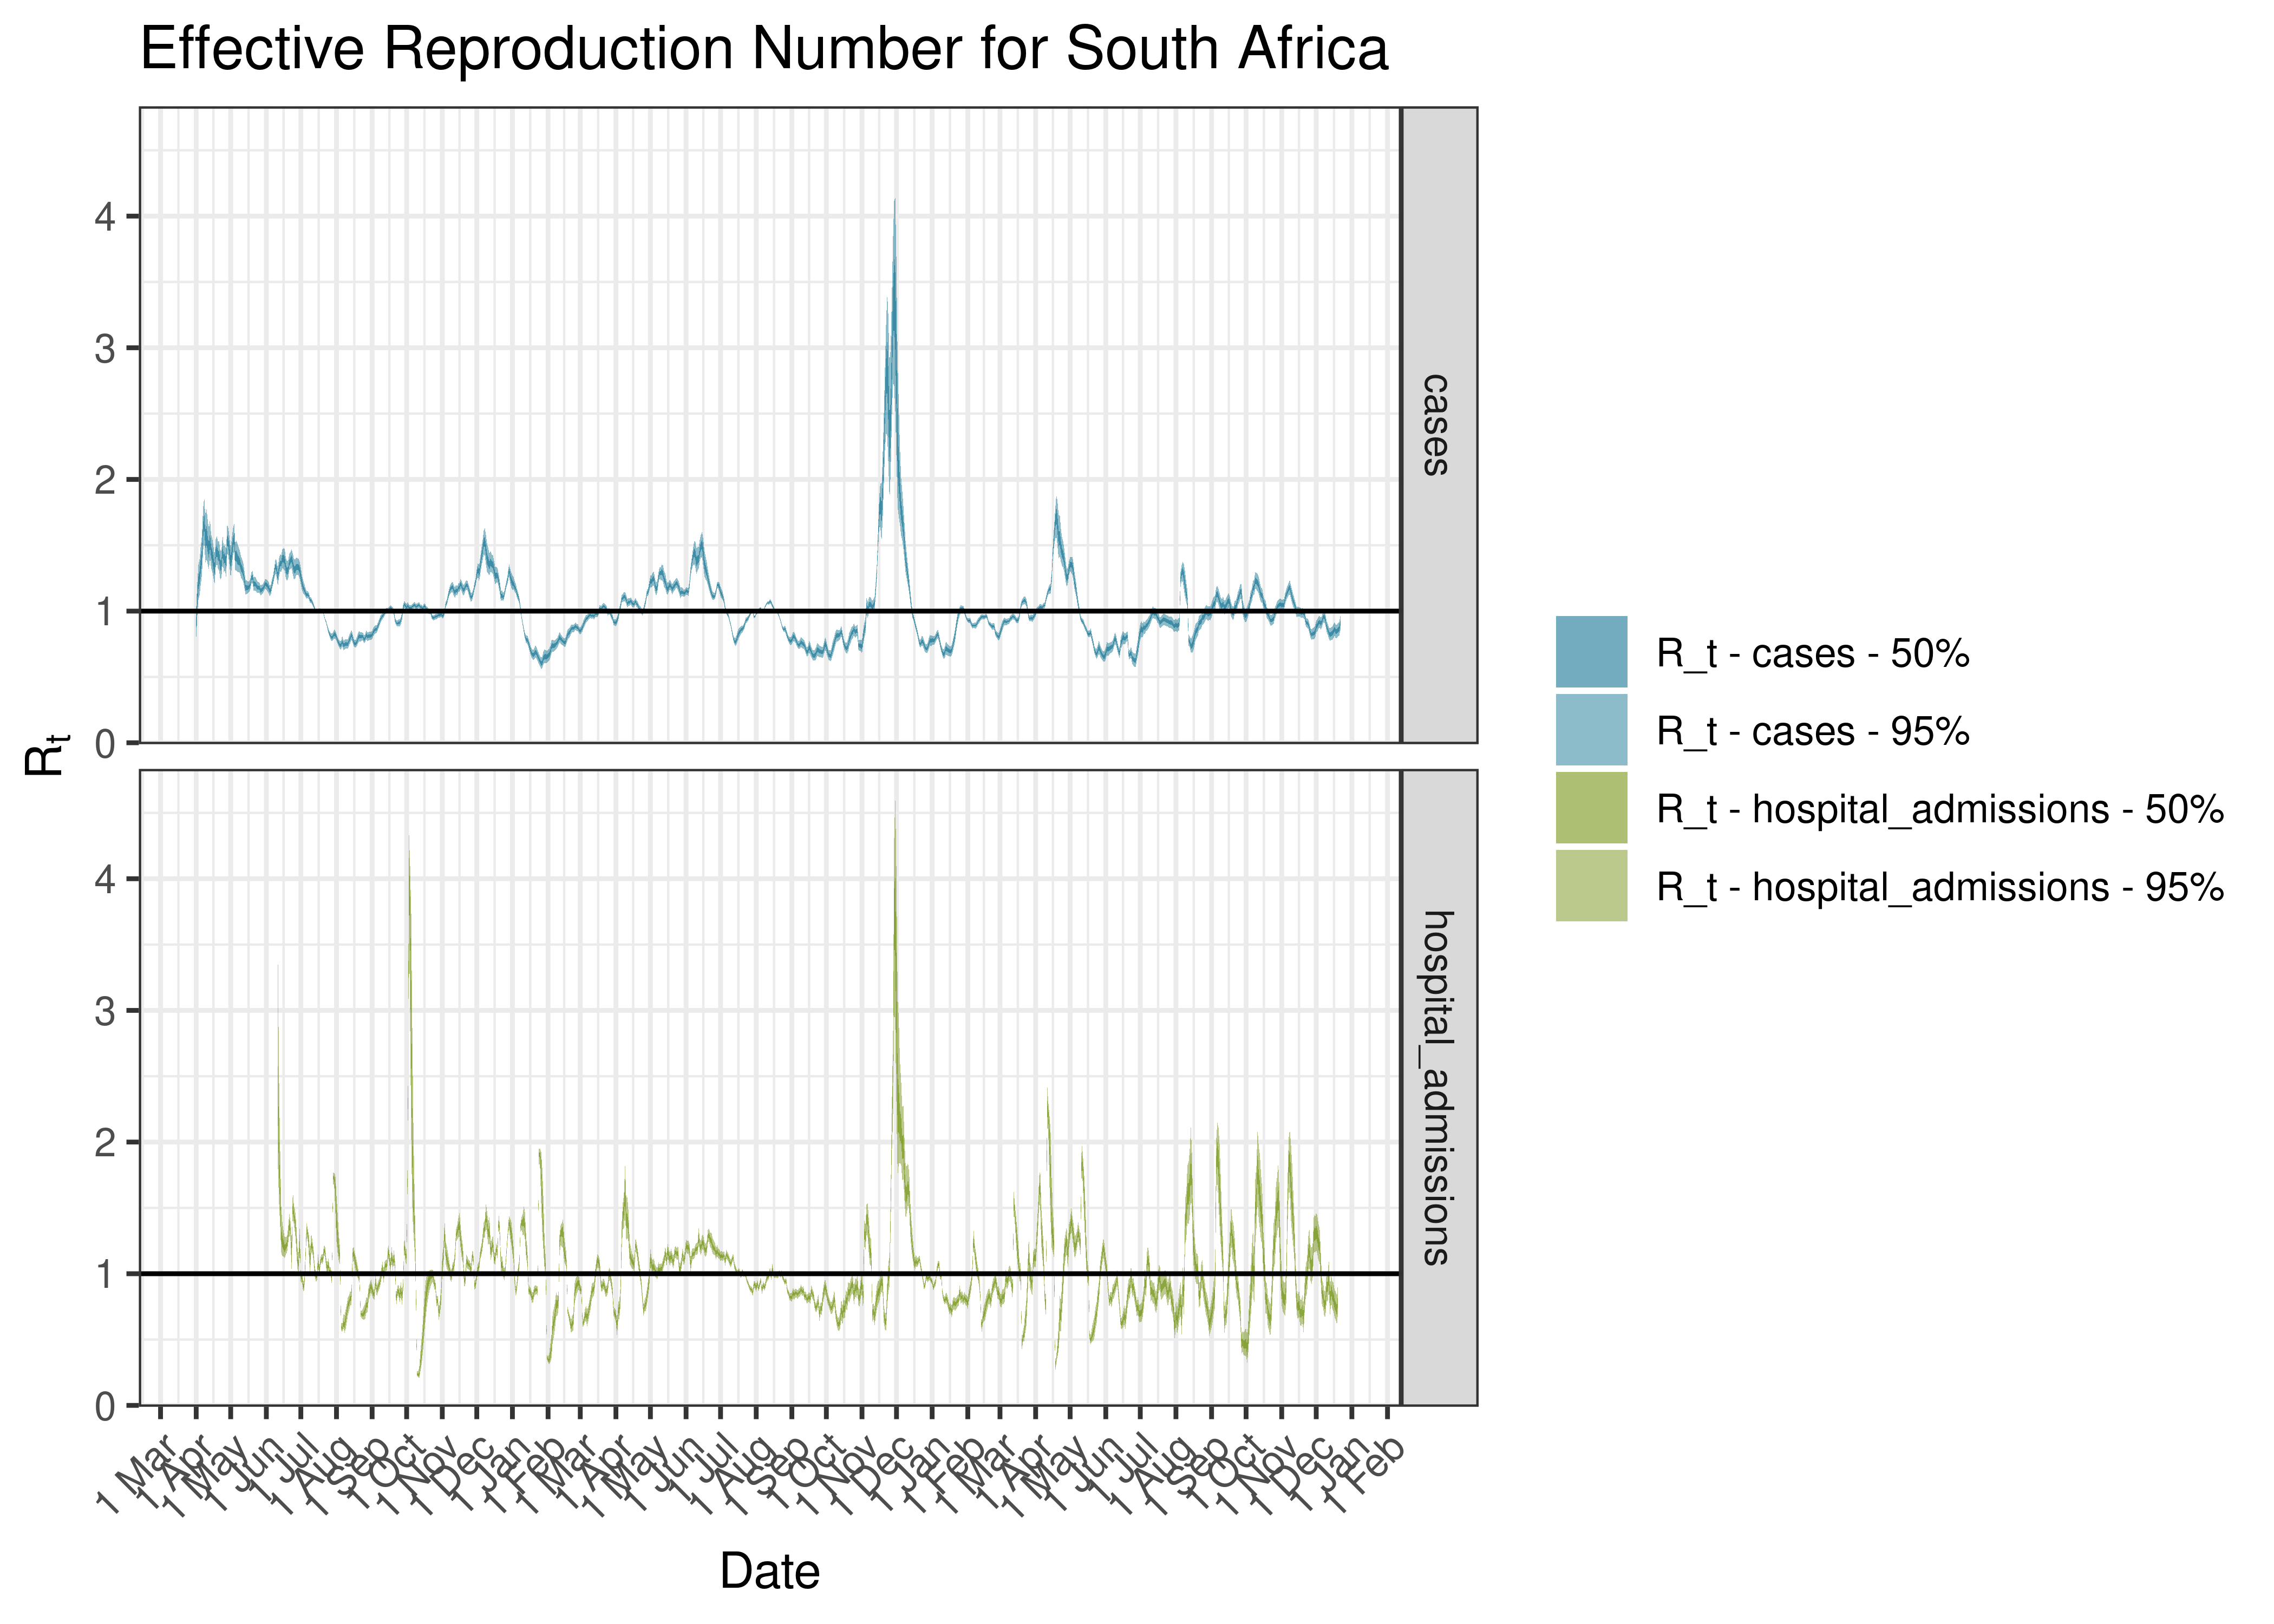
Estimated Effective Reproduction Number for South Africa since 1 April 2020
6.1.12 Risk Quadrants
The plots below show average daily cases over the last 7-days on the X-axis and the reproduction number on the Y-axis for each district municipality. By dividing this into 4 quadrants we can identify district municipalities with high numbers of cases and high reproduction numbers, or high cases and low reproduction numbers etc.
Values where the reproduction number exceeds 3 are plotted at 3.
Where there are very few cases (on the left of this chart), estimates for the reproduction number are more uncertain and volatile.
Risk Quadrants
6.1.13 Maps
6.1.13.1 Provinces
Below estimates of the reproductive number are plotted on a map of South Africa [8].
6.1.13.2 District Municipalities
Below estimates of the reproductive number by district are plotted on a map of South Africa [8].
6.2 Eastern Cape
6.2.1 Cases
Cases are tabulated by specimen received date below. Cases include estimates for late reporting in recent days as well as adjustments for any public holidays. A centred 7-day moving average is also shown. The peak daily cases in previous waves (as measured by the moving average) is also shown.
| Specimen Received Date | Cases | 7-day Moving Average | Comment |
|---|---|---|---|
| 2020-06-30 | 2,592 | 1,909 | Wave 1 Peak |
| 2020-12-08 | 2,158 | 1,597 | Wave 2 Peak |
| 2021-08-20 | 2,105 | 1,750 | Wave 3 Peak |
| 2021-12-16 | 2,065 | 1,705 | Wave 4 Peak |
| 2022-05-15 | 93 | 483 | Wave 5 Peak (to date) |
Below a 7-day moving average daily case count is plotted for Eastern Cape on a log scale since start of the epidemic:
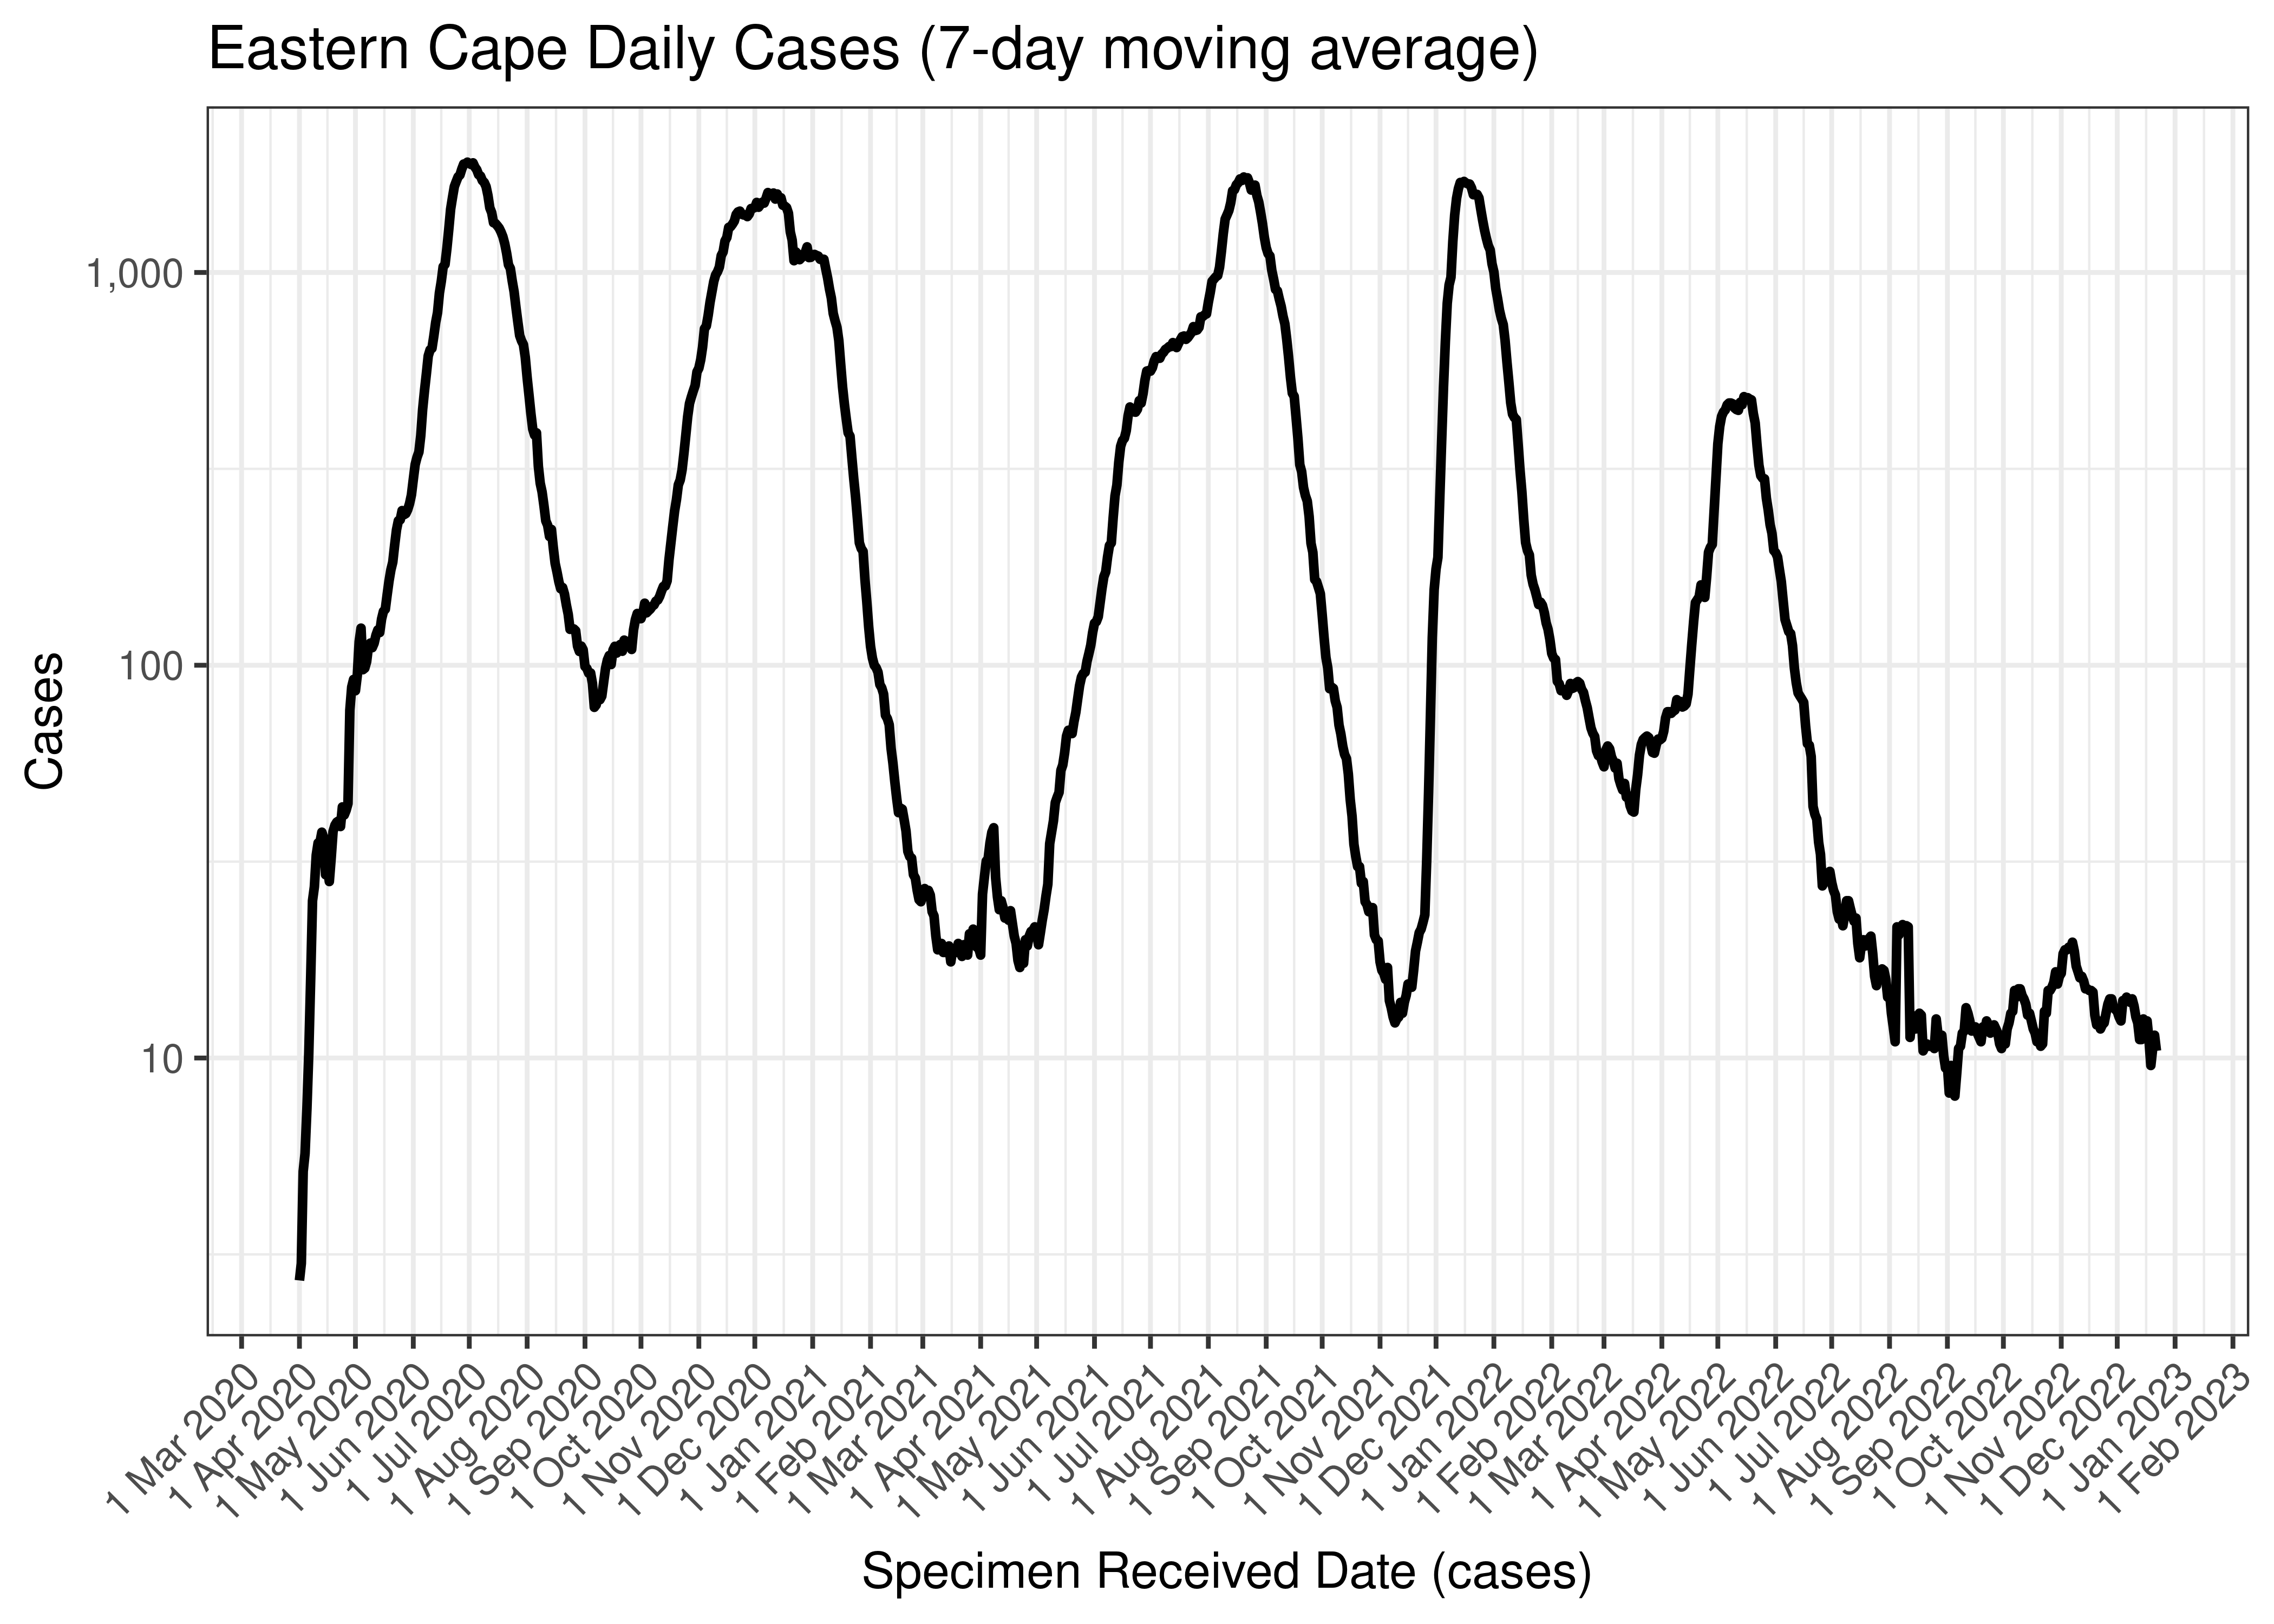
Eastern Cape Daily Cases (7-day moving average)
Below the above chart is repeated for the last 30-days:

Eastern Cape Daily Cases for Last 30-days (7-day moving average)
Below a 7-day moving average daily case count is plotted for Eastern Cape by district municipality on a log scale since start of the epidemic:
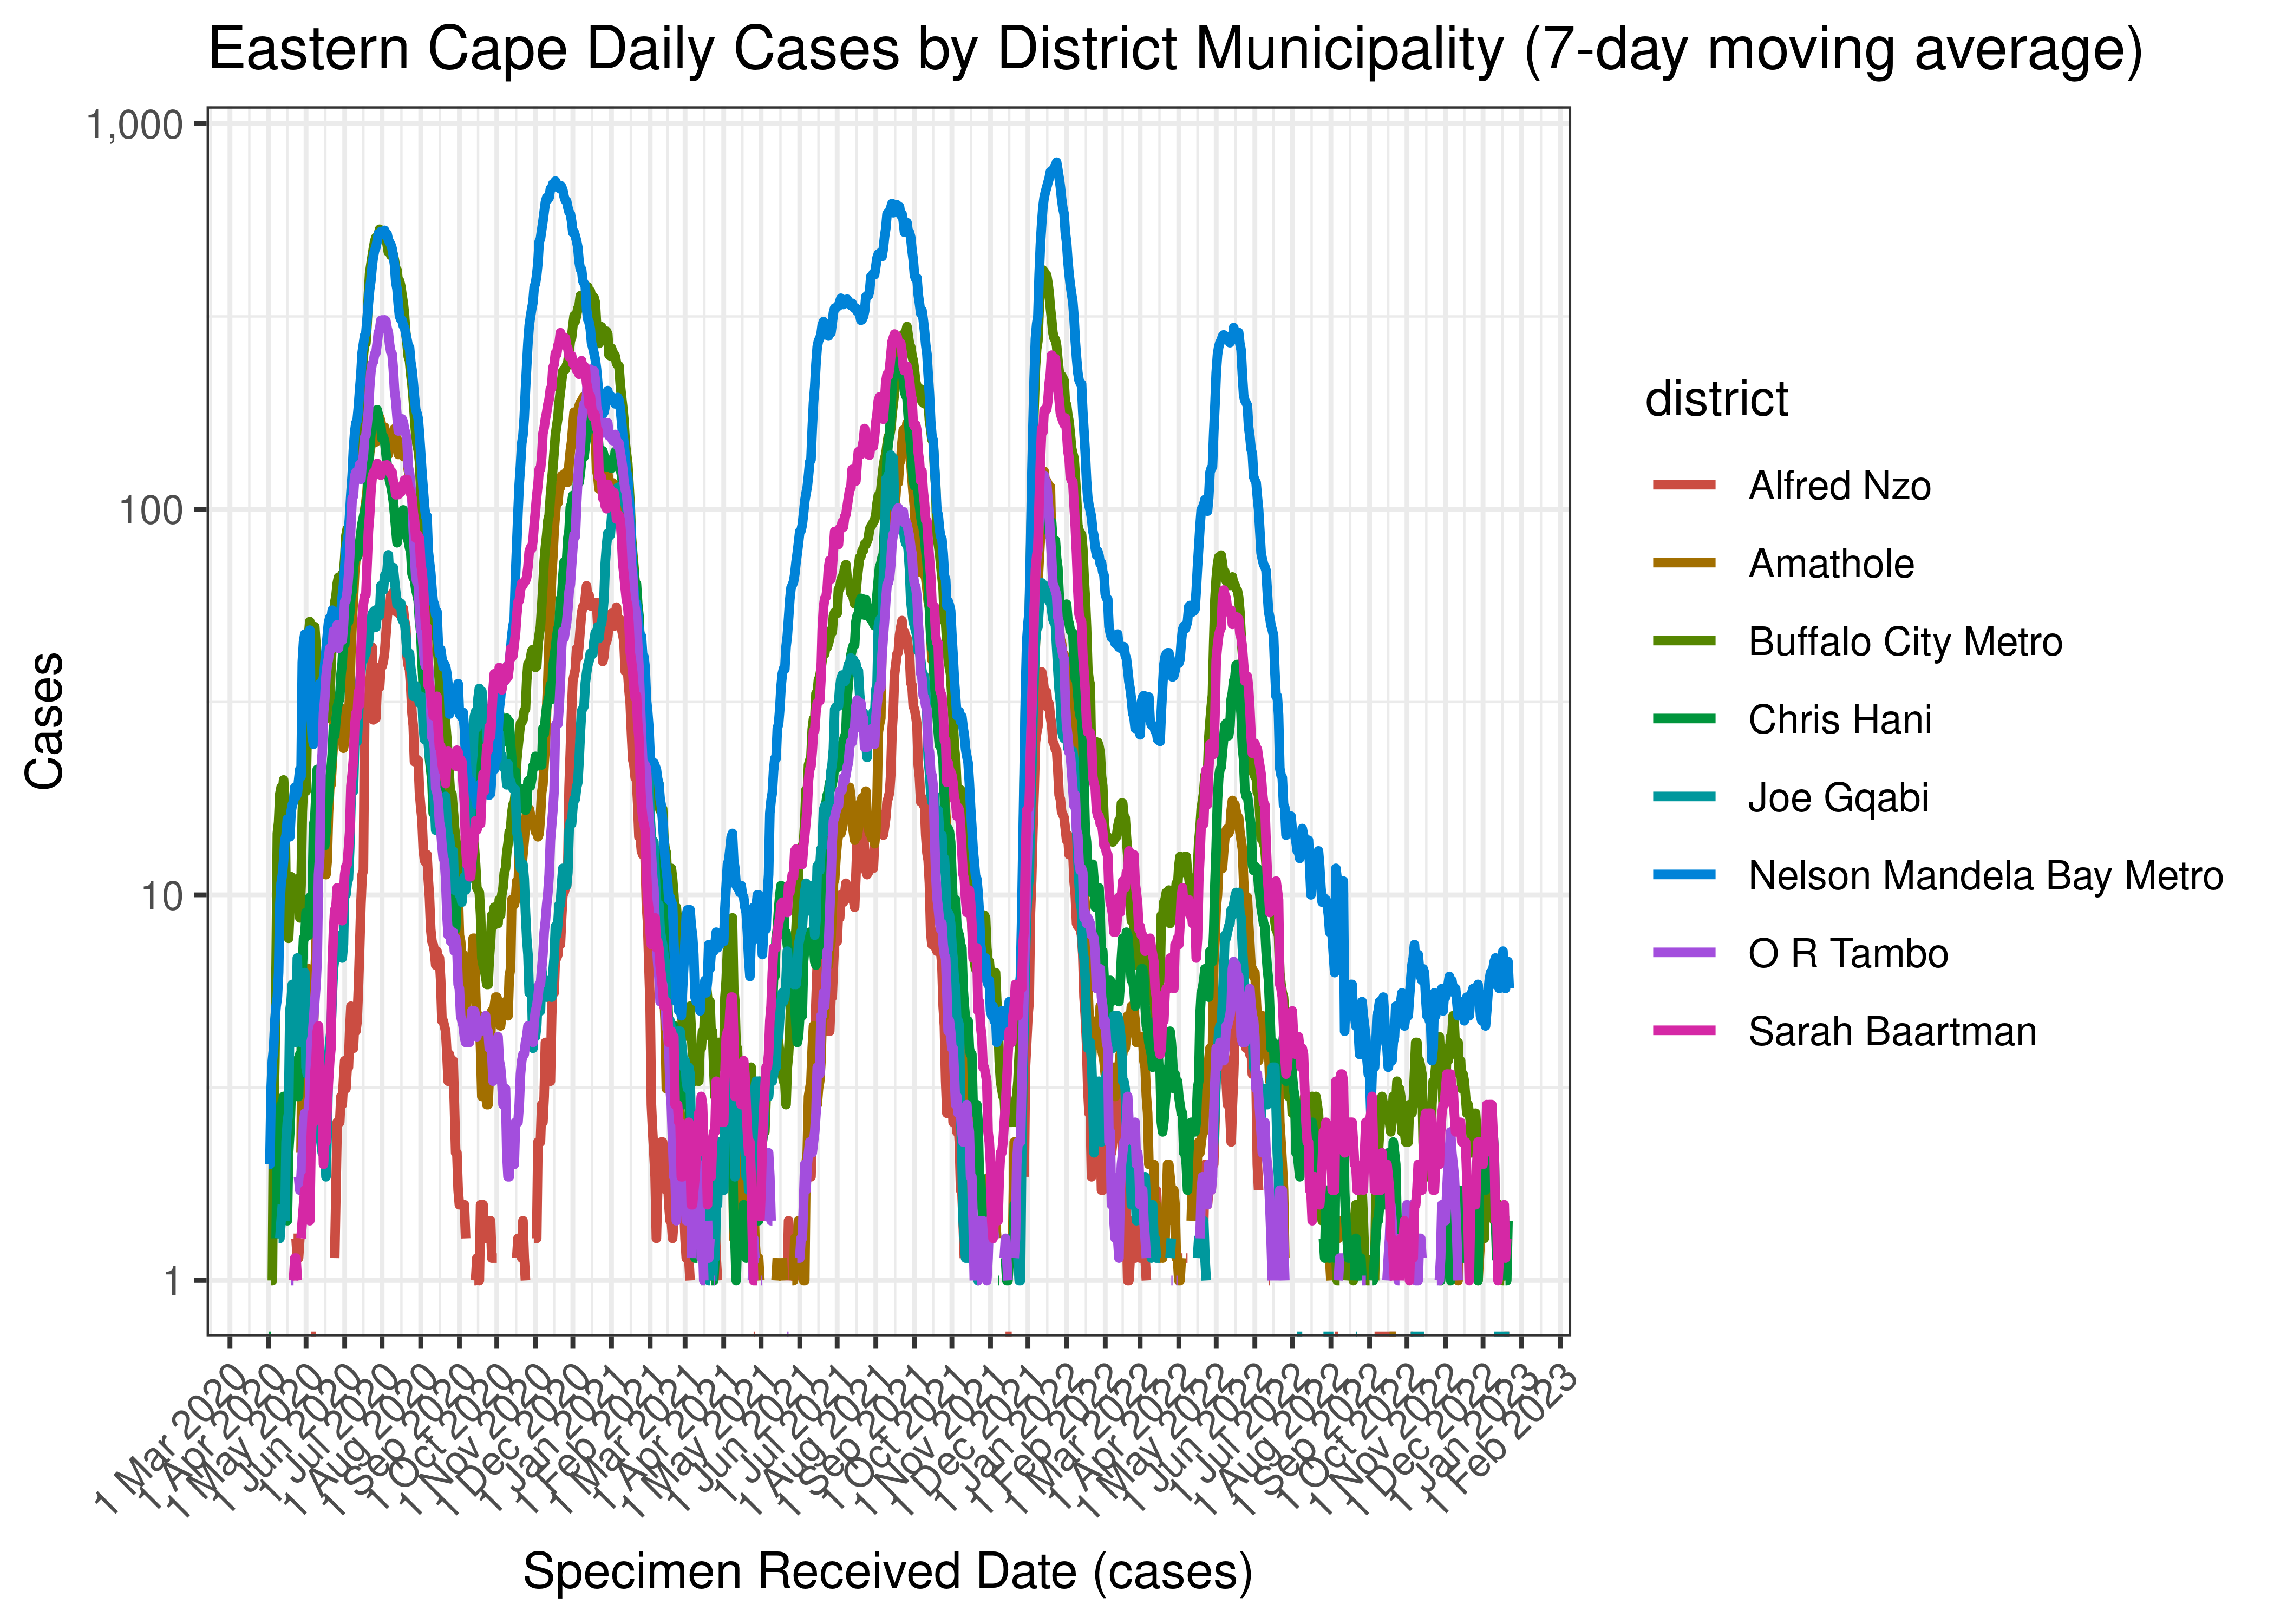
Eastern Cape Daily Cases by District Municipality (7-day moving average)
Below the above chart is repeated for the last 30-days:
Eastern Cape Daily Cases for Last 30-days by District Municipality (7-day moving average)
6.2.2 Hospital Admissions
Hospital admissions are tabulated by reported date below. The peak daily admissions in previous waves (as measured by the moving average) is also shown.
| Reported Date | Hospital Admissions | 7-day Moving Average | Comment |
|---|---|---|---|
| 2020-08-15 | 76 | 299 | Wave 1 Peak |
| 2021-01-24 | 54 | 382 | Wave 2 Peak |
| 2021-08-27 | 119 | 141 | Wave 3 Peak |
| 2021-12-21 | 297 | 139 | Wave 4 Peak |
| 2022-05-20 | 34 | 31 | Wave 5 Peak (to date) |
| 2022-12-16 | 0 | 2 | |
| 2022-12-17 | 1 | 2 | |
| 2022-12-18 | 1 | 3 | |
| 2022-12-19 | 1 | 3 | |
| 2022-12-20 | 11 | 3 | |
| 2022-12-21 | 3 | NA | |
| 2022-12-22 | 2 | NA | |
| 2022-12-23 | 2 | NA |
Below a 7-day moving average daily hospital admissions count is plotted for Eastern Cape on a log scale since start of the epidemic:
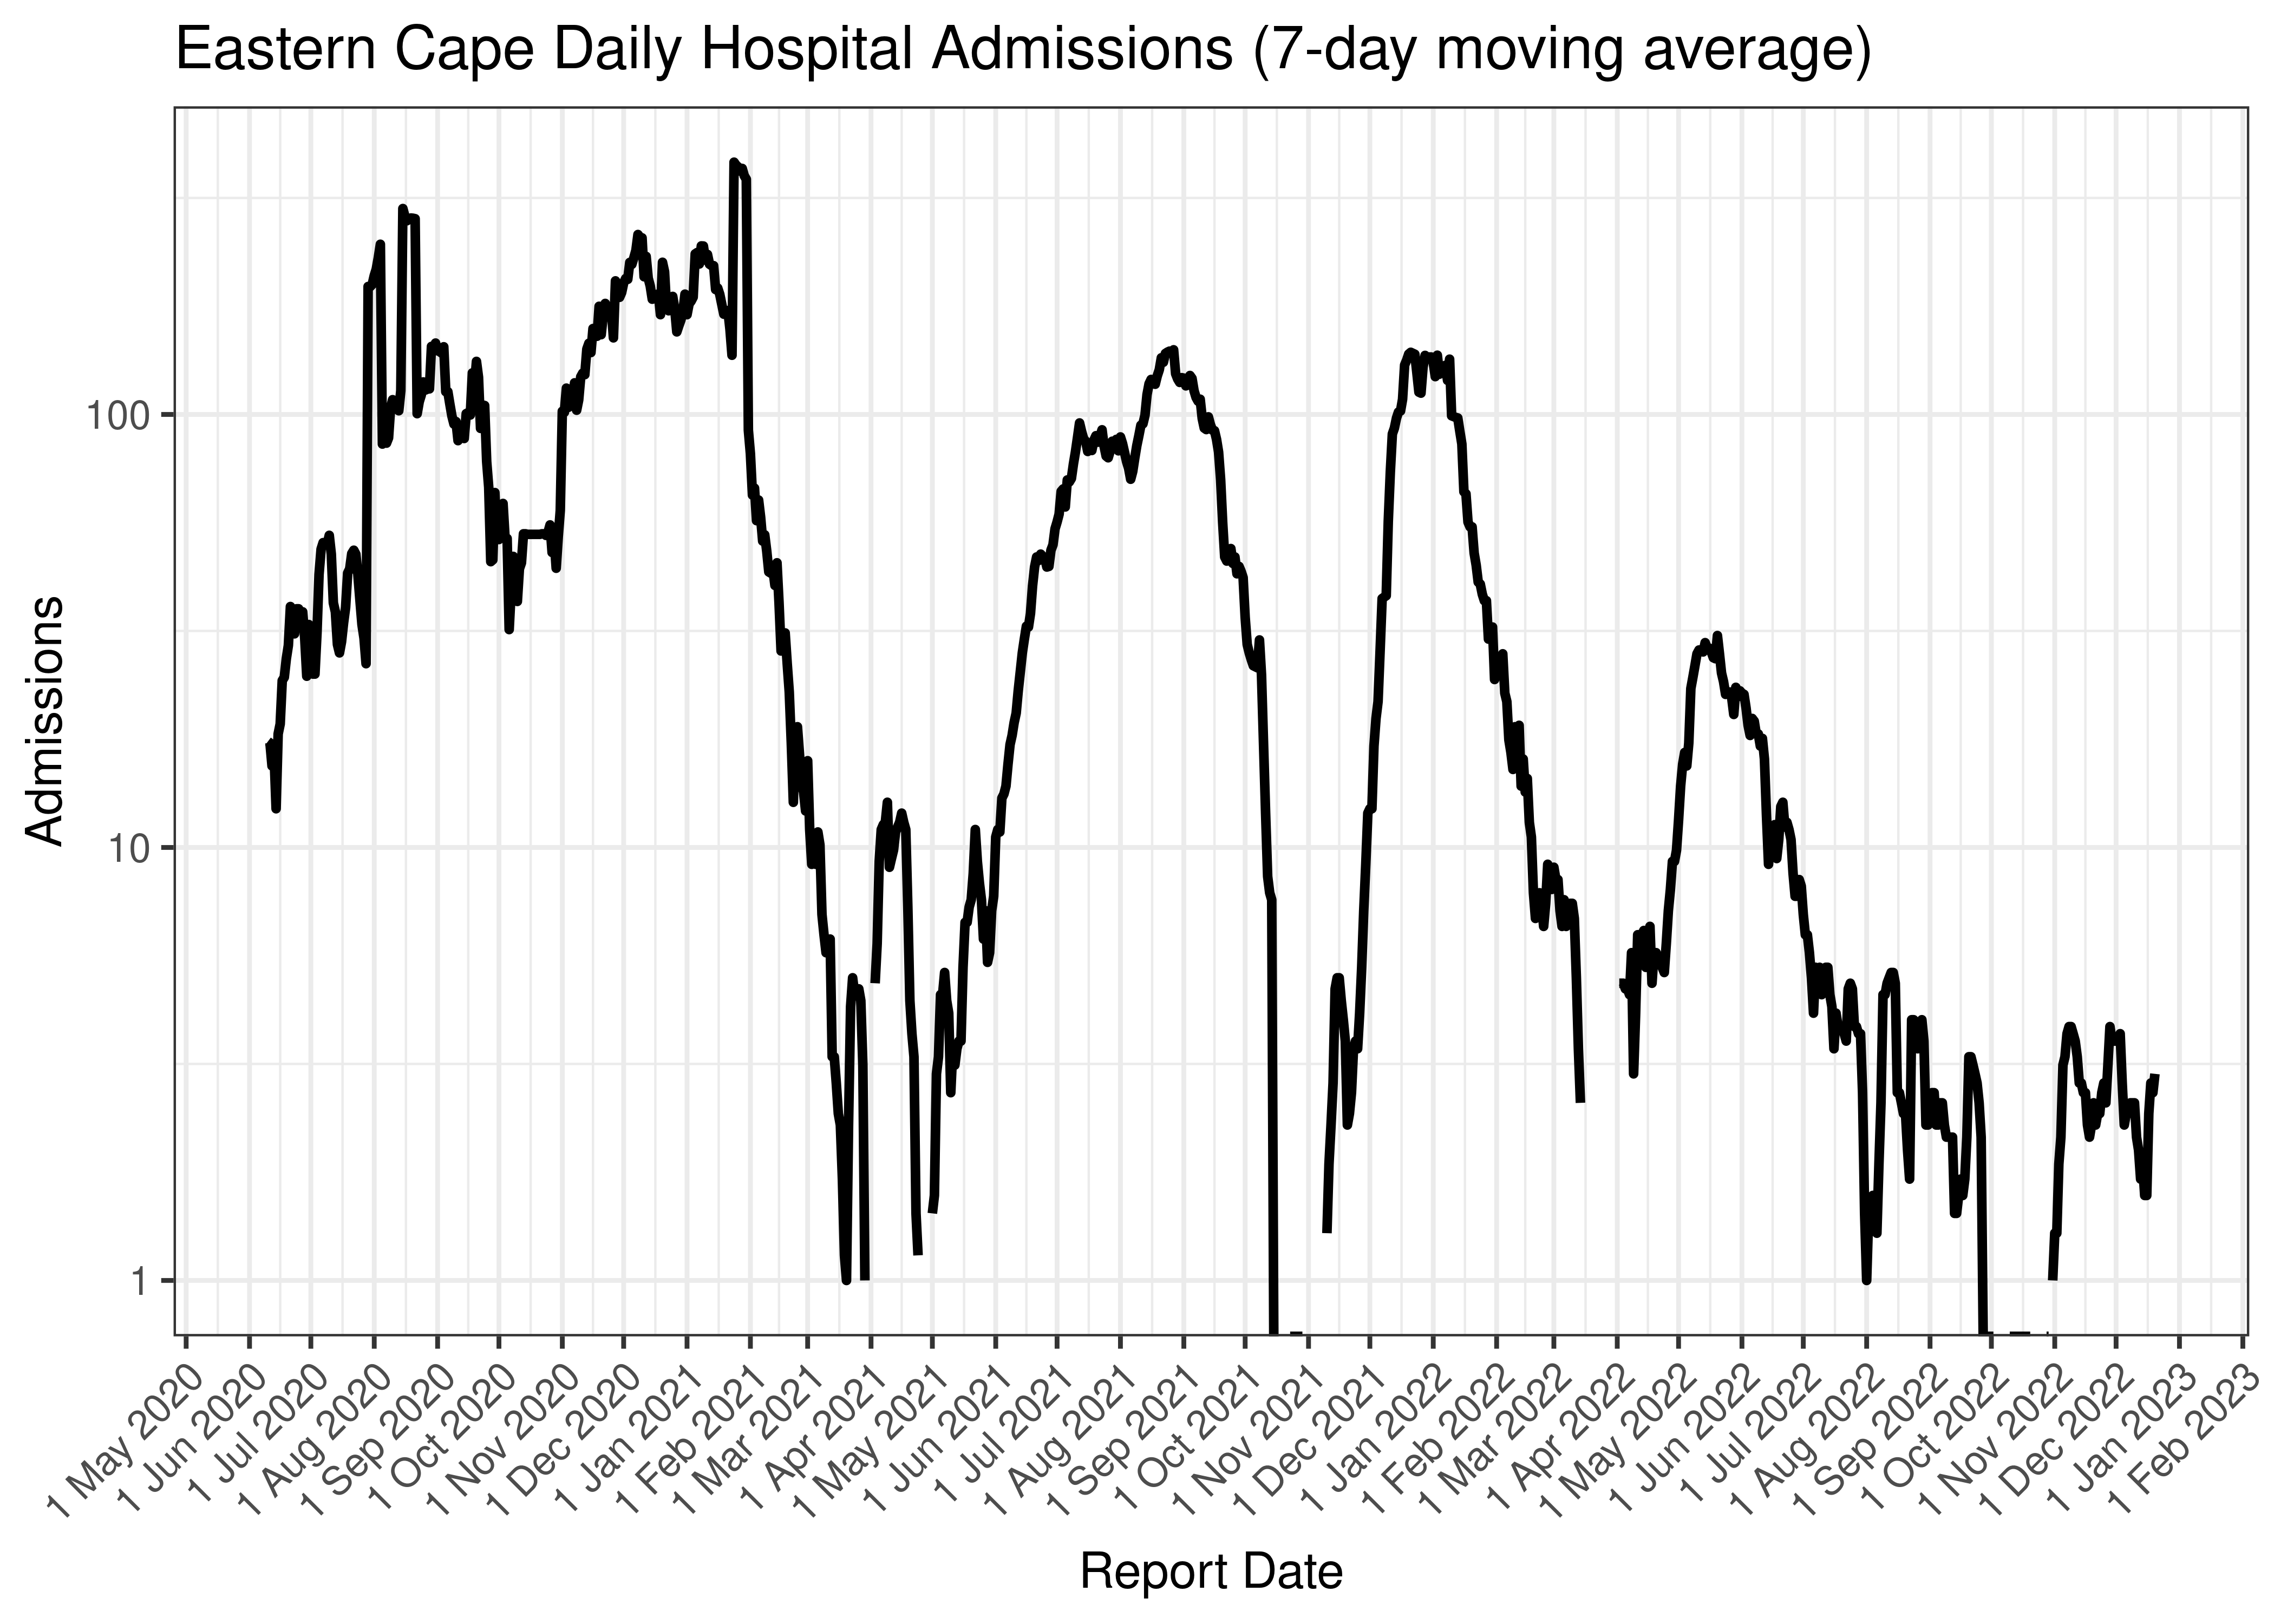
Eastern Cape Daily Hospital Admissions (7-day moving average)
Below the above chart is repeated for the last 30-days:
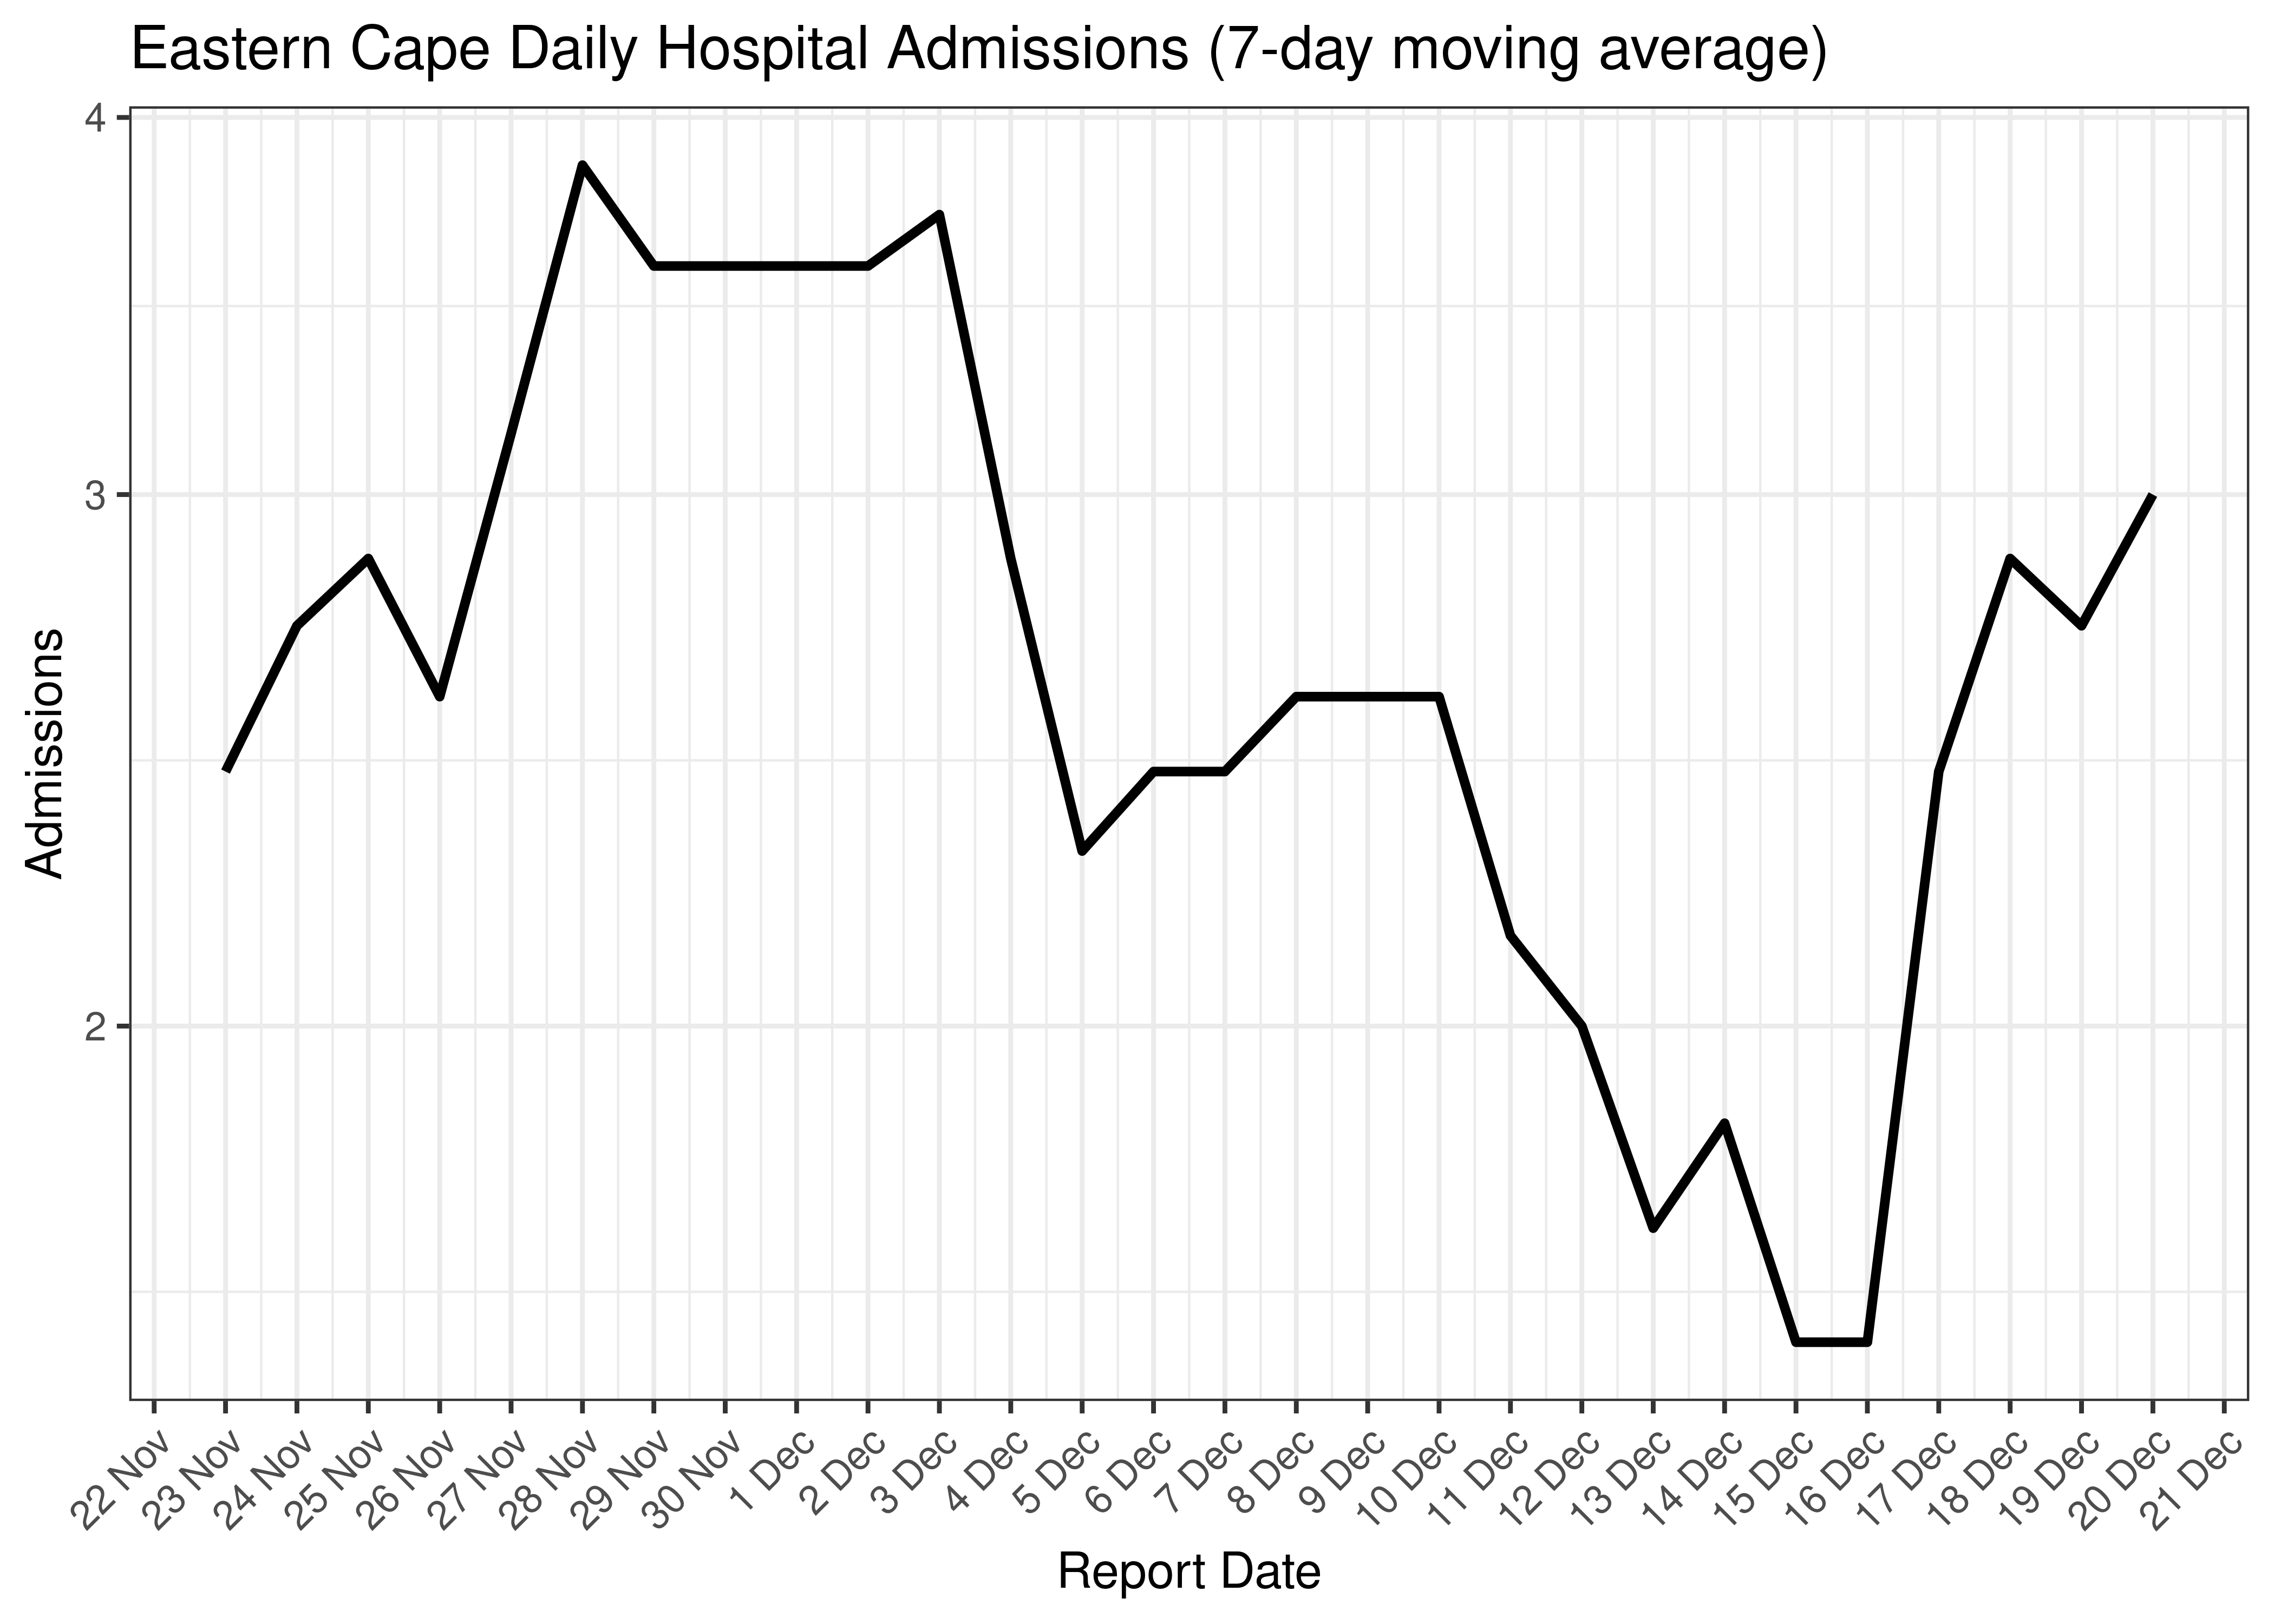
Eastern Cape Daily Hospital Admissions for Last 30-days (7-day moving average)
6.2.3 Hospital Deaths
Hospital deaths are tabulated by reported date below. The peak daily deaths in previous waves (as measured by the moving average) is also shown.
Note that hospital deaths underestimates total COVID-19 deaths in South Africa.
| Reported Date | Hospital Deaths | 7-day Moving Average | Comment |
|---|---|---|---|
| 2020-08-15 | 14 | 80 | Wave 1 Peak |
| 2021-01-09 | 38 | 97 | Wave 2 Peak |
| 2021-08-25 | 45 | 41 | Wave 3 Peak |
| 2021-08-27 | 45 | 41 | Wave 3 Peak |
| 2022-01-03 | 48 | 30 | Wave 4 Peak |
| 2022-05-20 | 4 | 4 | Wave 5 Peak (to date) |
| 2022-12-16 | 0 | 0 | |
| 2022-12-17 | 0 | 0 | |
| 2022-12-18 | 0 | 0 | |
| 2022-12-19 | 0 | 0 | |
| 2022-12-20 | 0 | 0 | |
| 2022-12-21 | 0 | NA | |
| 2022-12-22 | 0 | NA | |
| 2022-12-23 | 0 | NA |
Below a 7-day moving average daily hospital deaths count is plotted for Eastern Cape on a log scale since start of the epidemic:
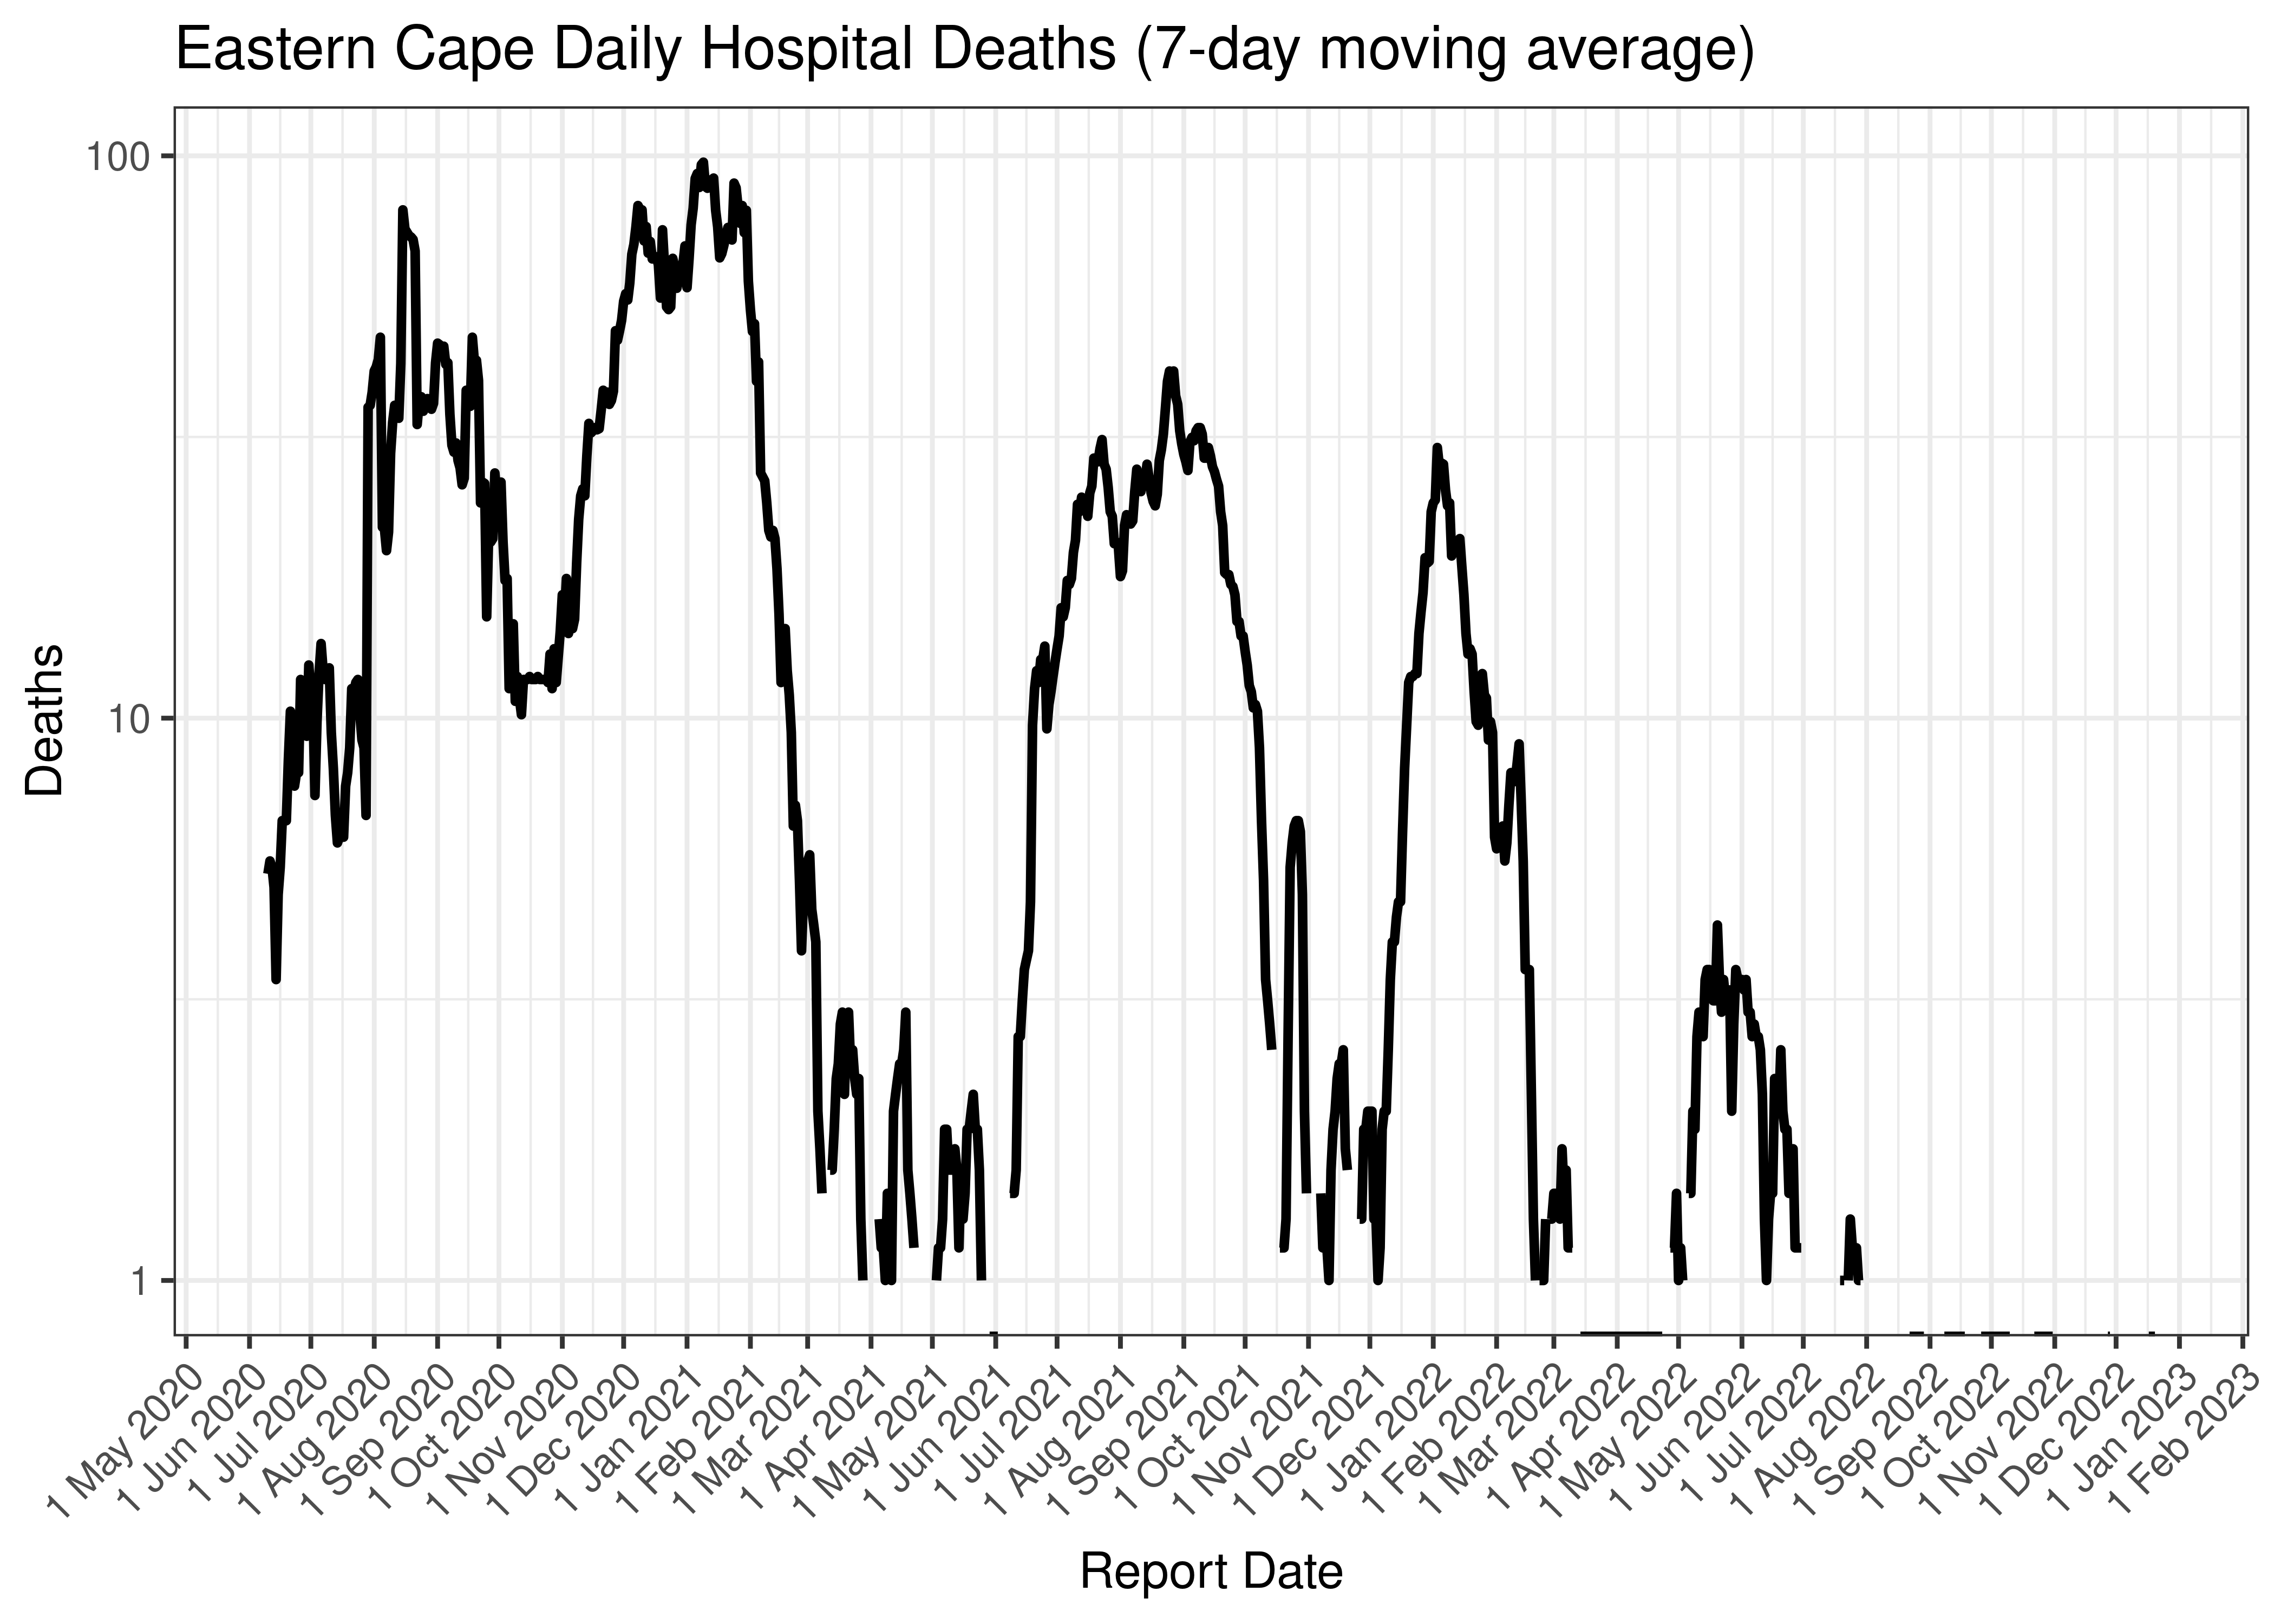
Eastern Cape Daily Hospital Deaths (7-day moving average)
Below the above chart is repeated for the last 30-days:
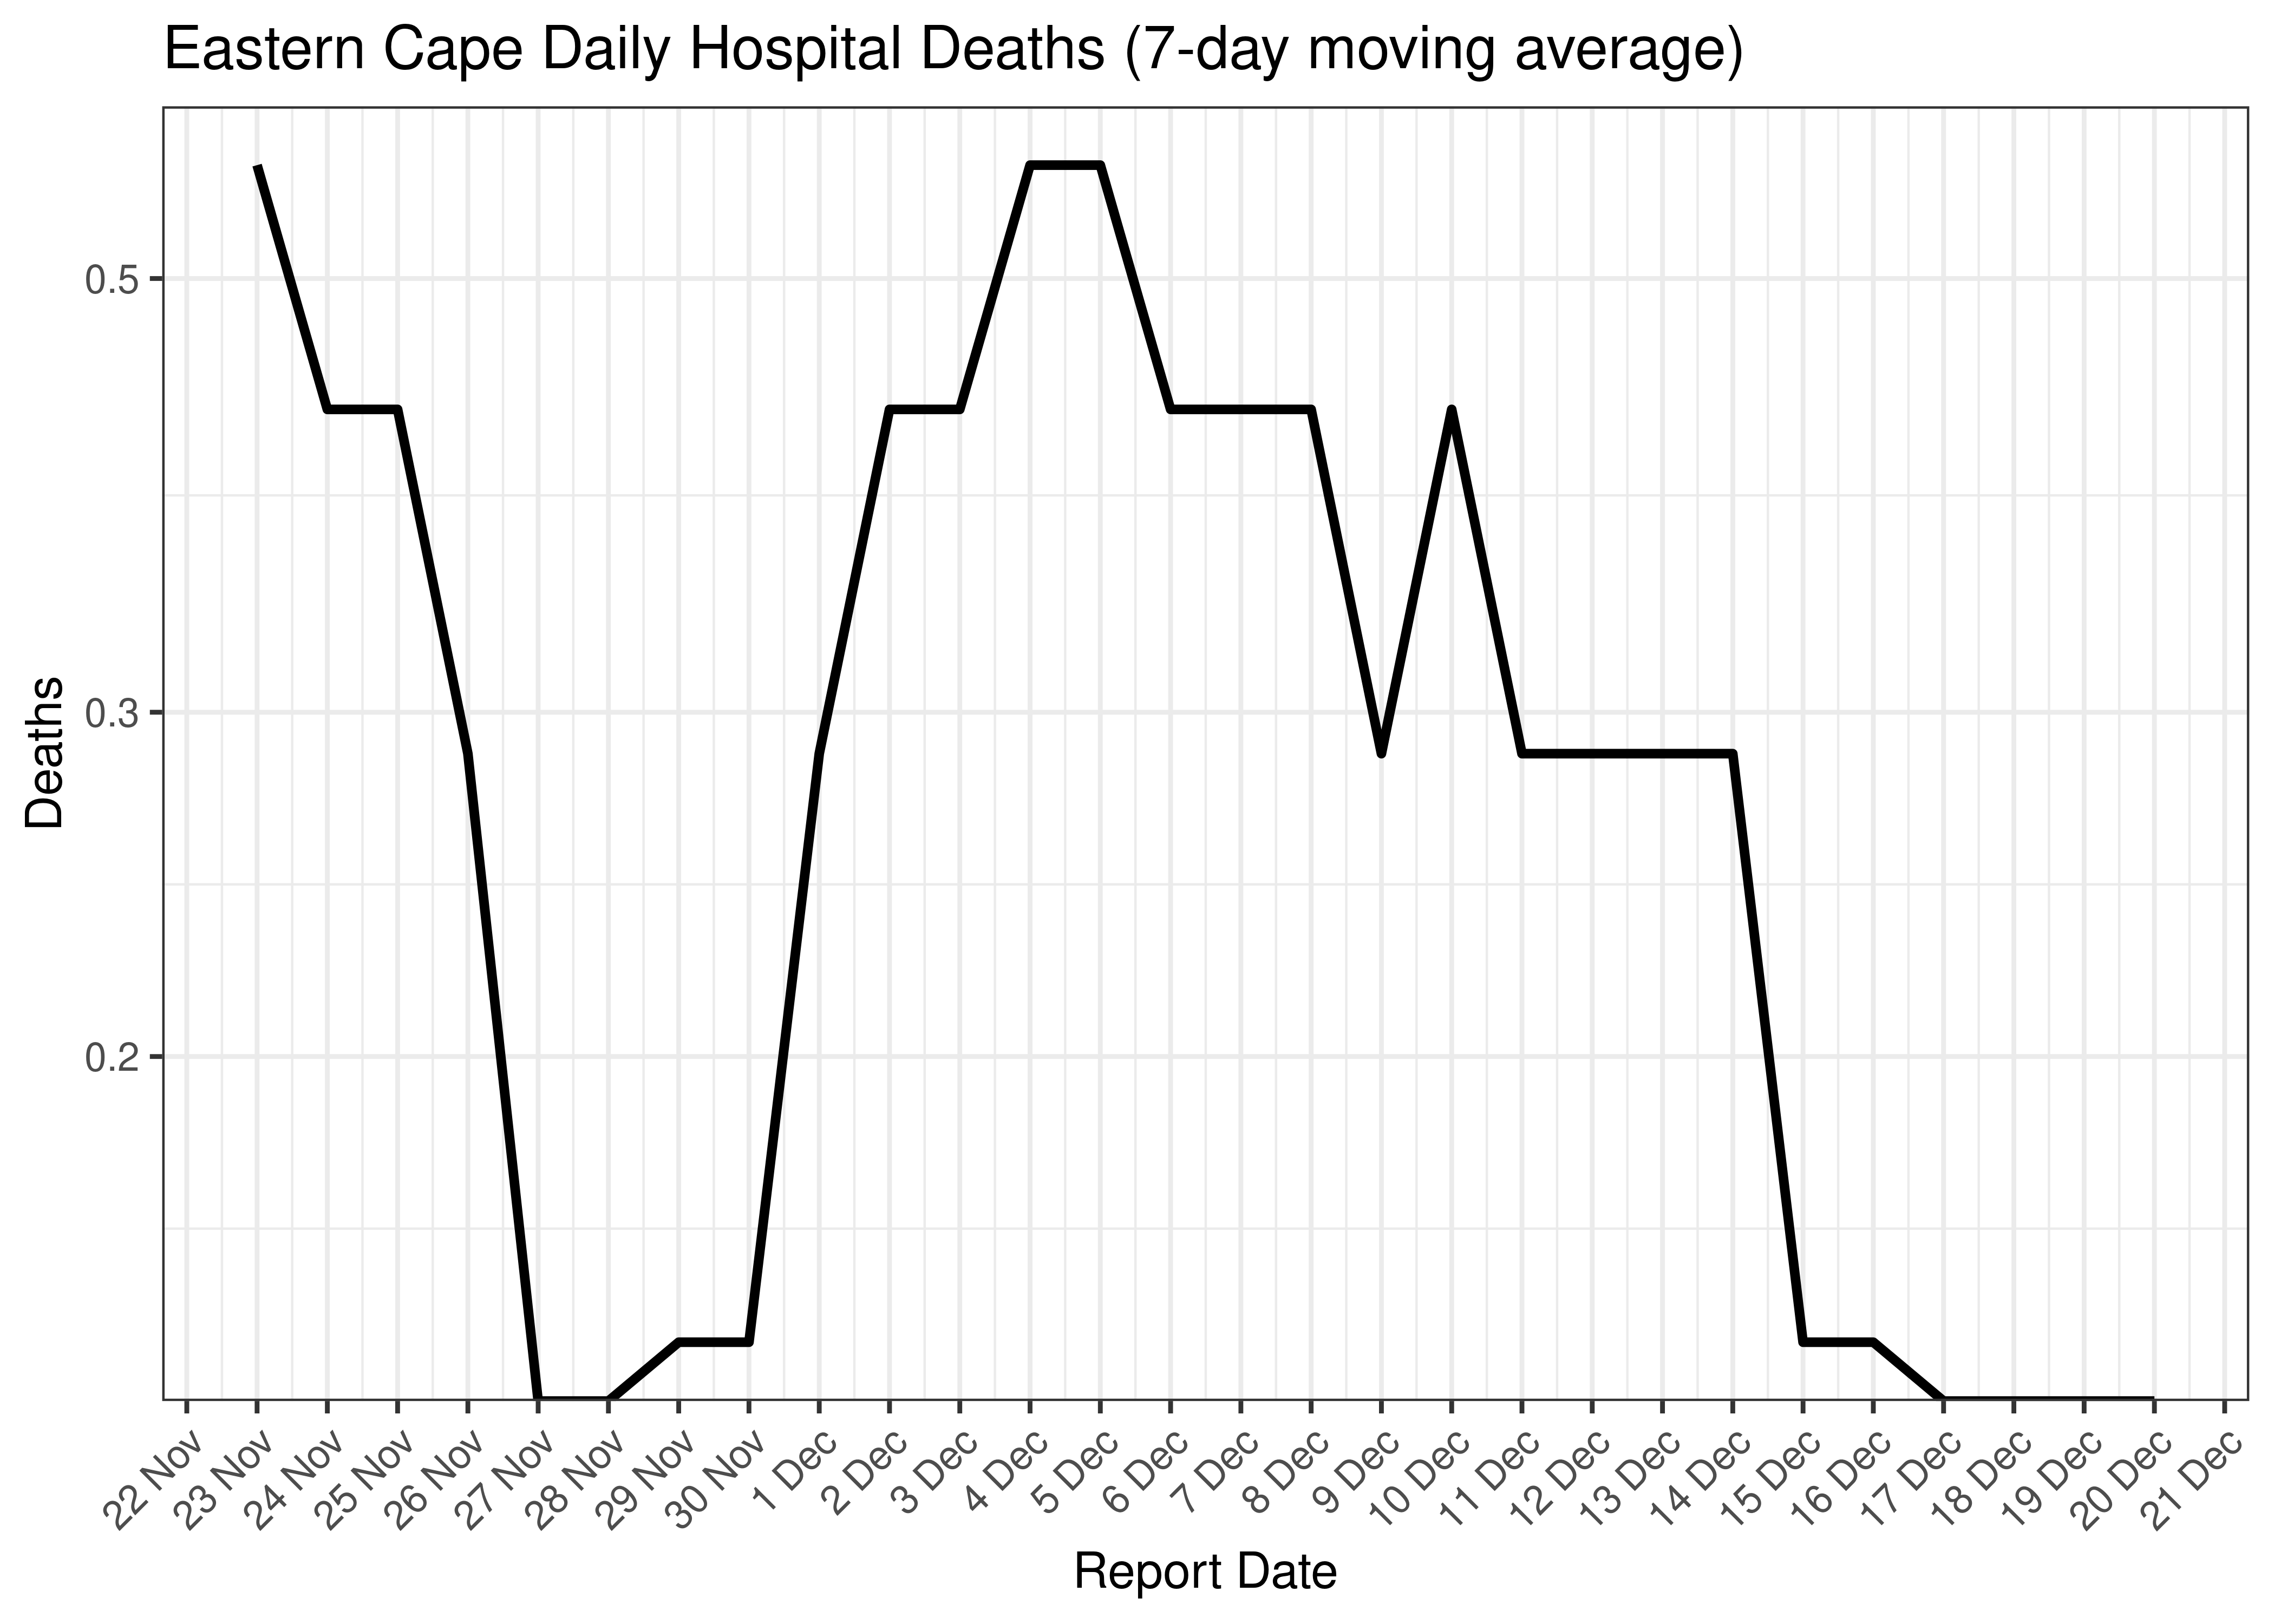
Eastern Cape Daily Hospital Deaths for Last 30-days (7-day moving average)
6.2.4 Excess Deaths
Excess deaths are tabulated by date of death below. The peak daily deaths in previous waves (as measured by the moving average) is also shown.
| Date of Death | Excess Deaths | 7-day Moving Average | Comment |
|---|---|---|---|
| 2020-07-15 | 208 | 208 | Wave 1 Peak |
| 2020-12-23 | 344 | 344 | Wave 2 Peak |
| 2021-08-25 | 125 | 125 | Wave 3 Peak |
| 2021-12-29 | 136 | 136 | Wave 4 Peak |
| 2022-05-04 | 55 | 55 | Wave 5 Peak (to date) |
| 2022-12-03 | 23 | 32 | |
| 2022-12-04 | 45 | 36 | |
| 2022-12-05 | 45 | 39 | |
| 2022-12-06 | 45 | 42 | |
| 2022-12-07 | 45 | 45 | |
| 2022-12-08 | 45 | NA | |
| 2022-12-09 | 45 | NA | |
| 2022-12-10 | 45 | NA |
Below a 7-day moving average daily excess deaths count is plotted for Eastern Cape on a log scale since start of the epidemic:
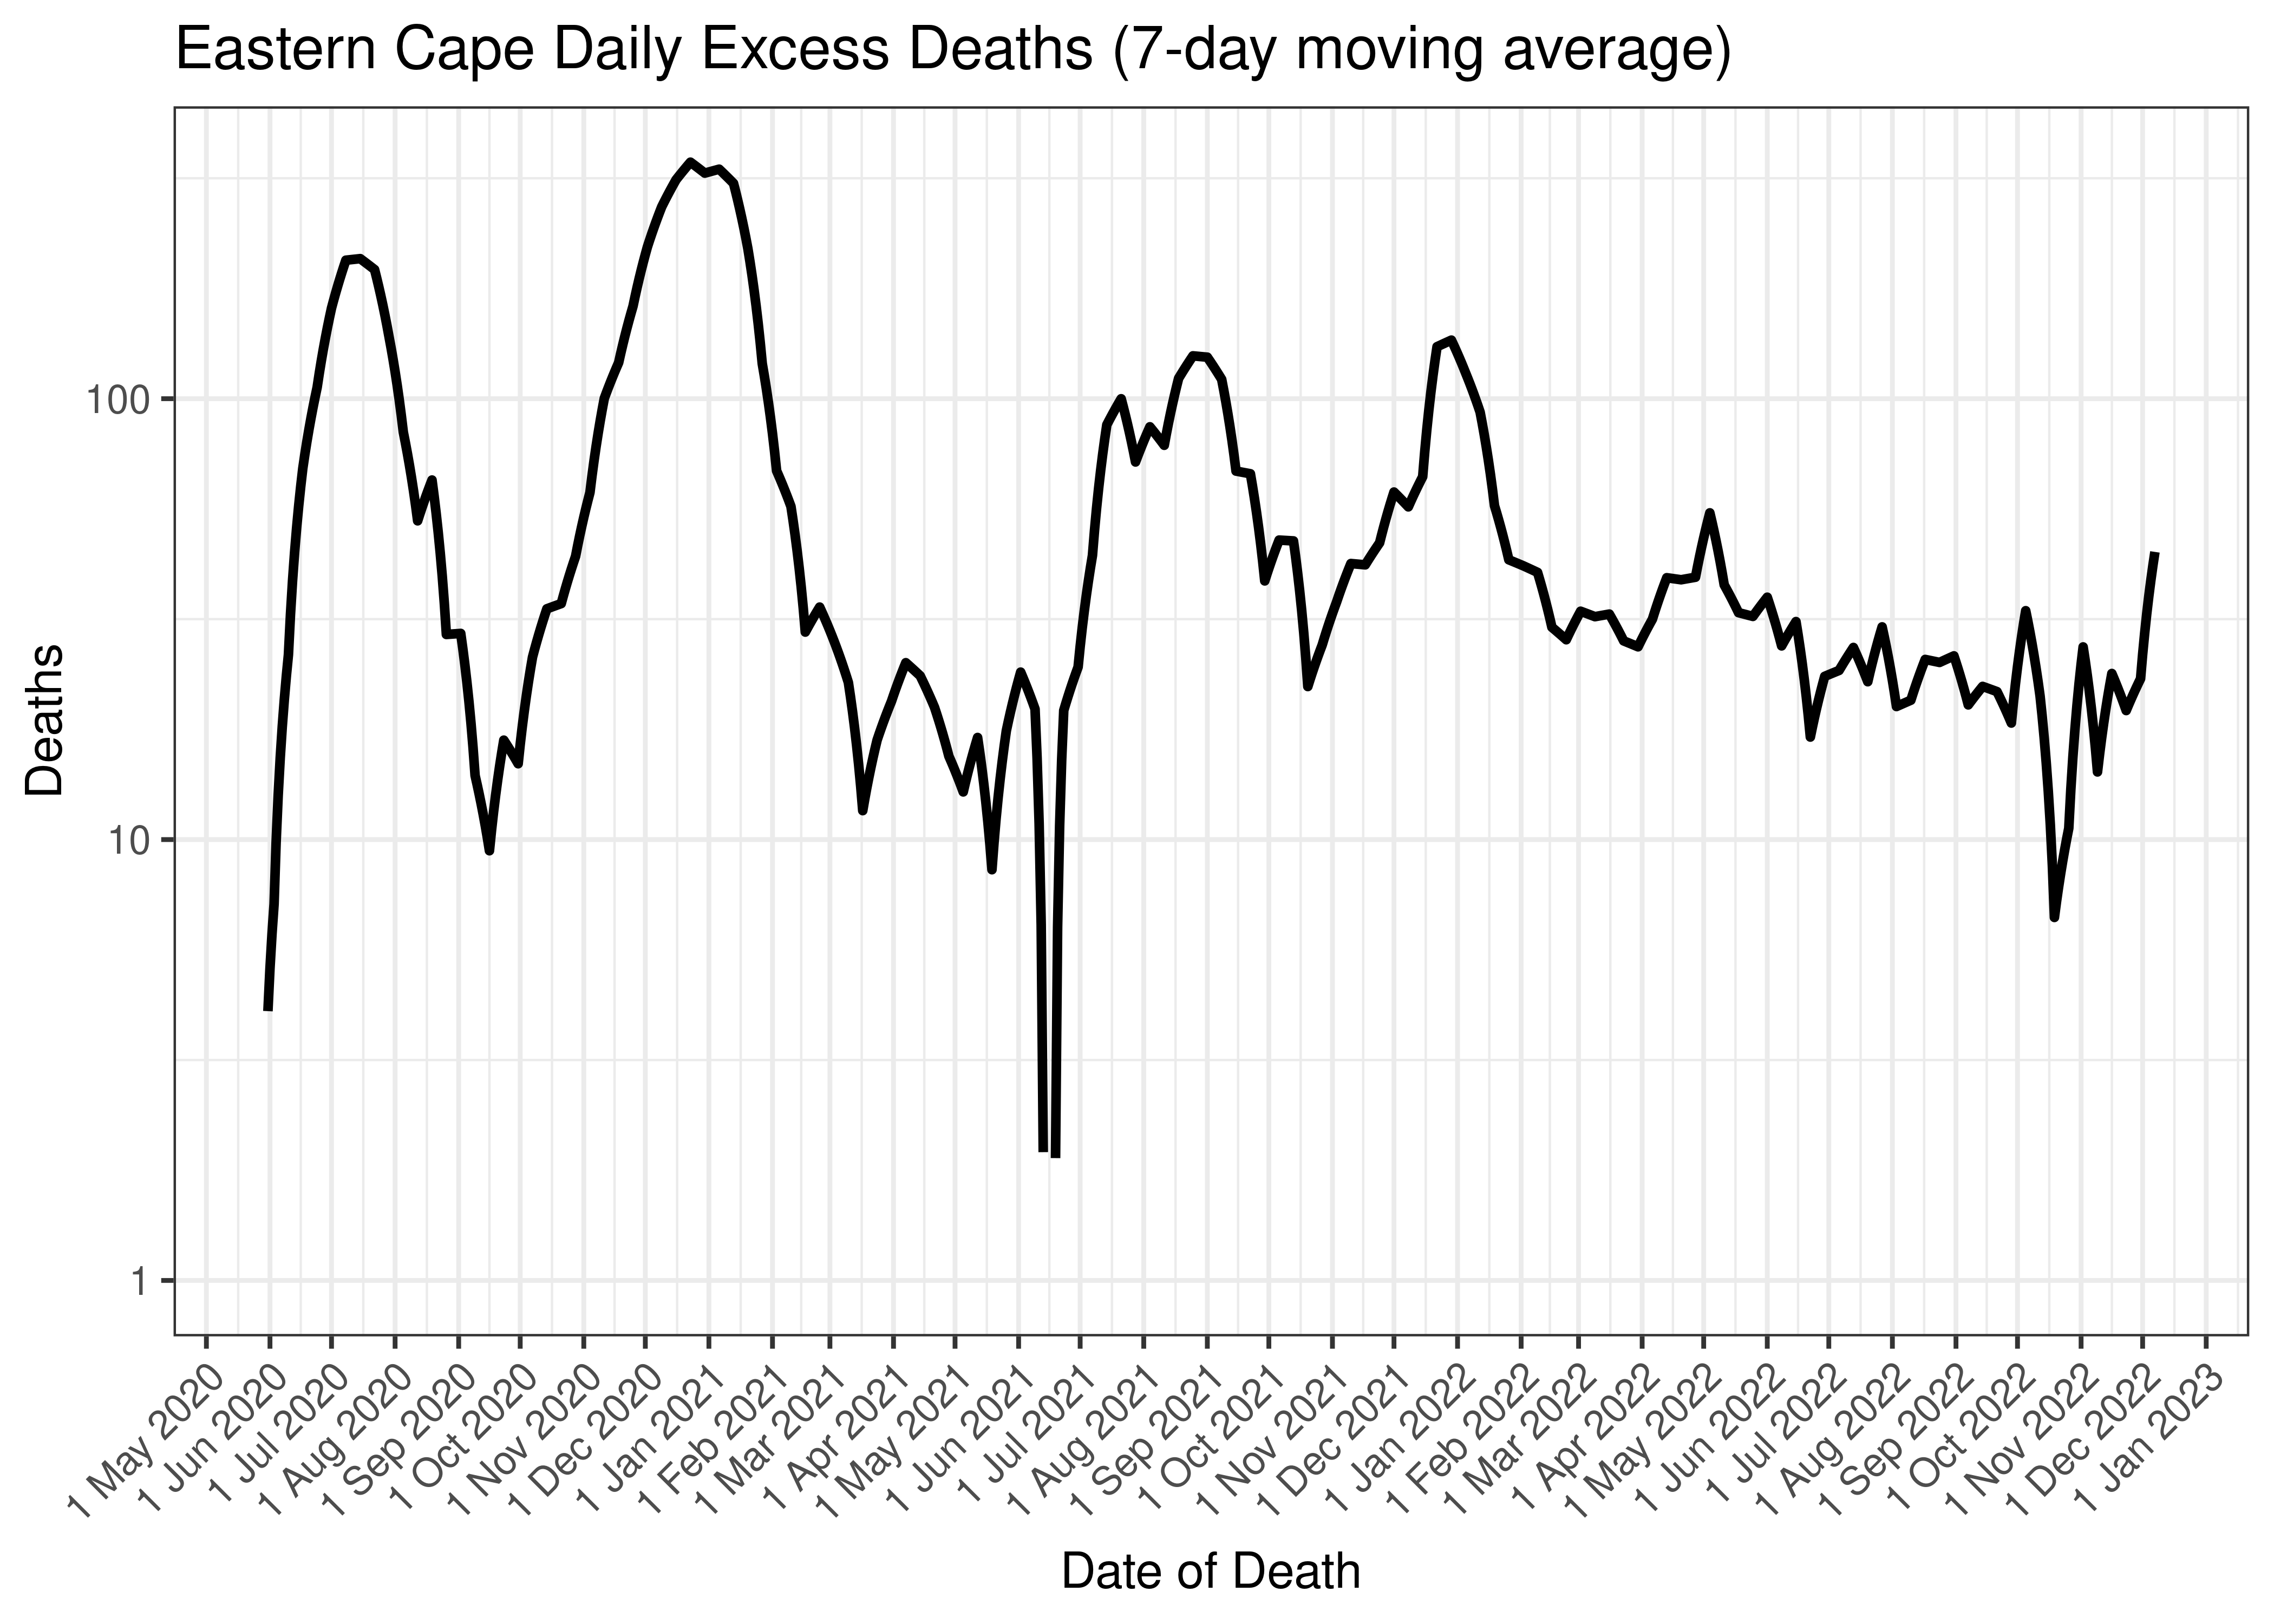
Eastern Cape Daily Excess Deaths (7-day moving average)
Below the above chart is repeated for the last 30-days:
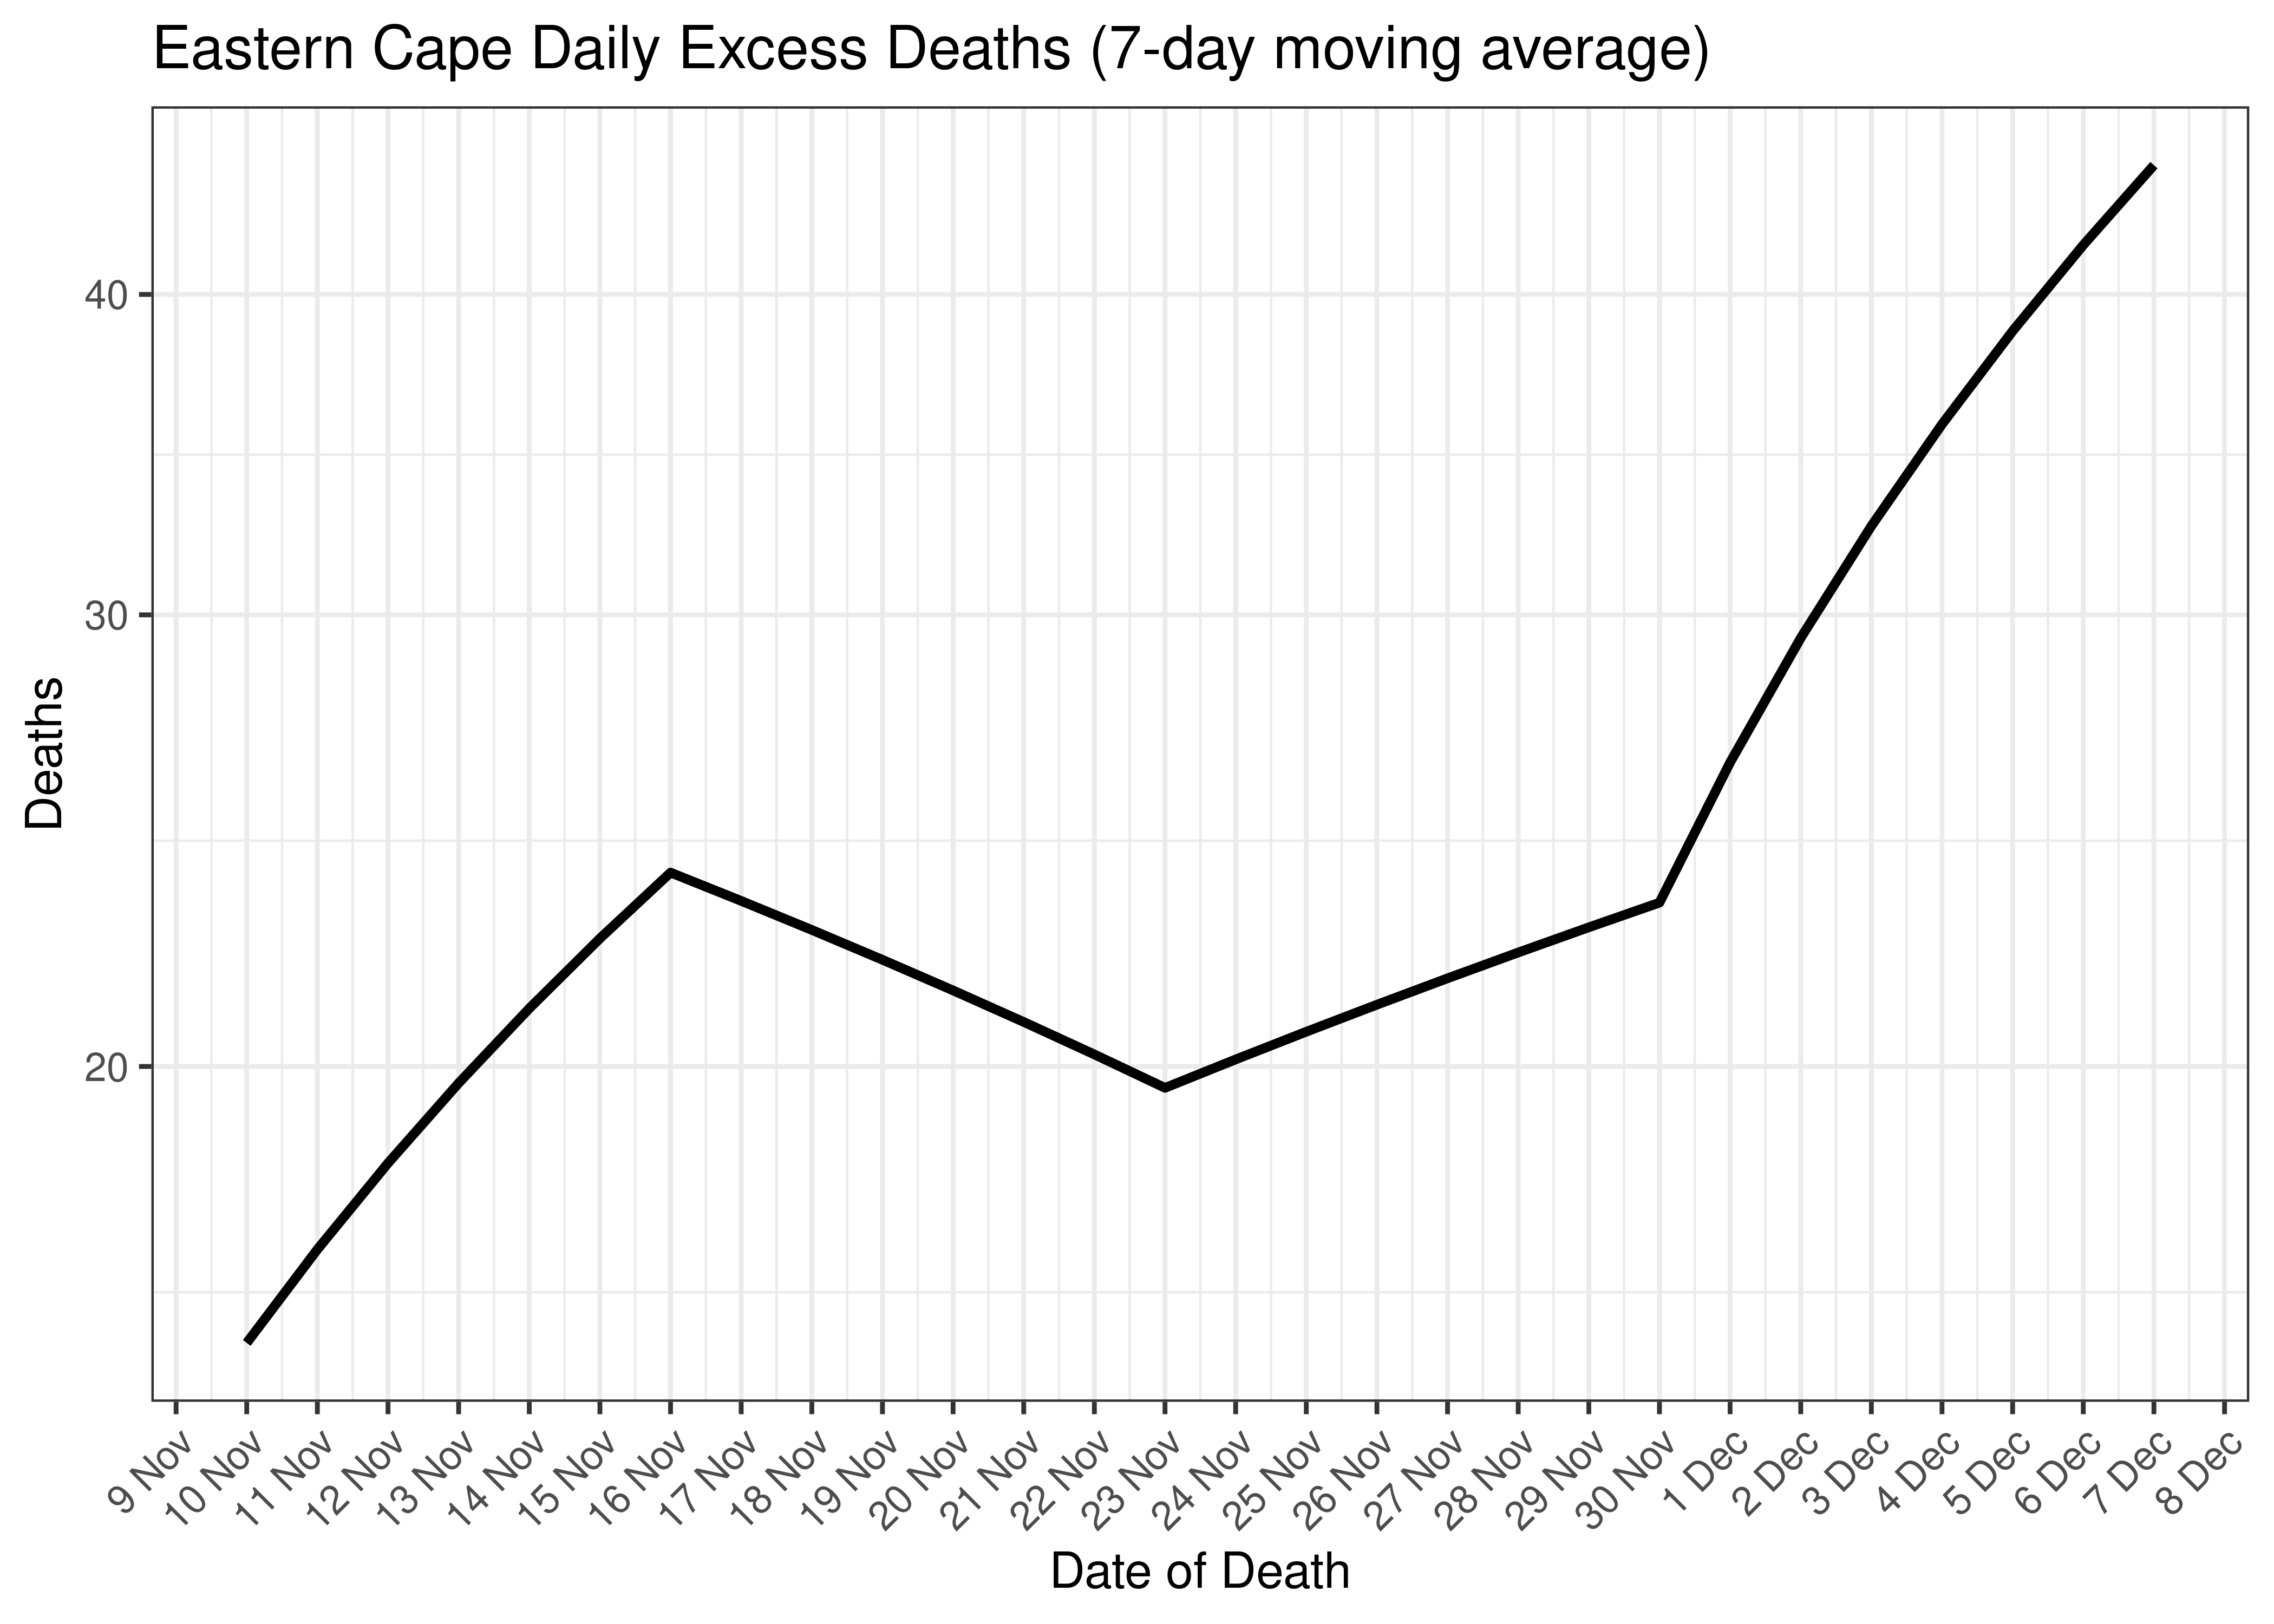
Eastern Cape Daily Excess Deaths for Last 30-days (7-day moving average)
6.2.5 Cases, Admissions and Deaths Combined
Below a 7-day moving average daily case, admission and excess death counts are plotted for Eastern Cape on a log scale since start of the epidemic. Note admissions and excess deaths are plotted by reported date, whereas cases are plotted by specimen received date.
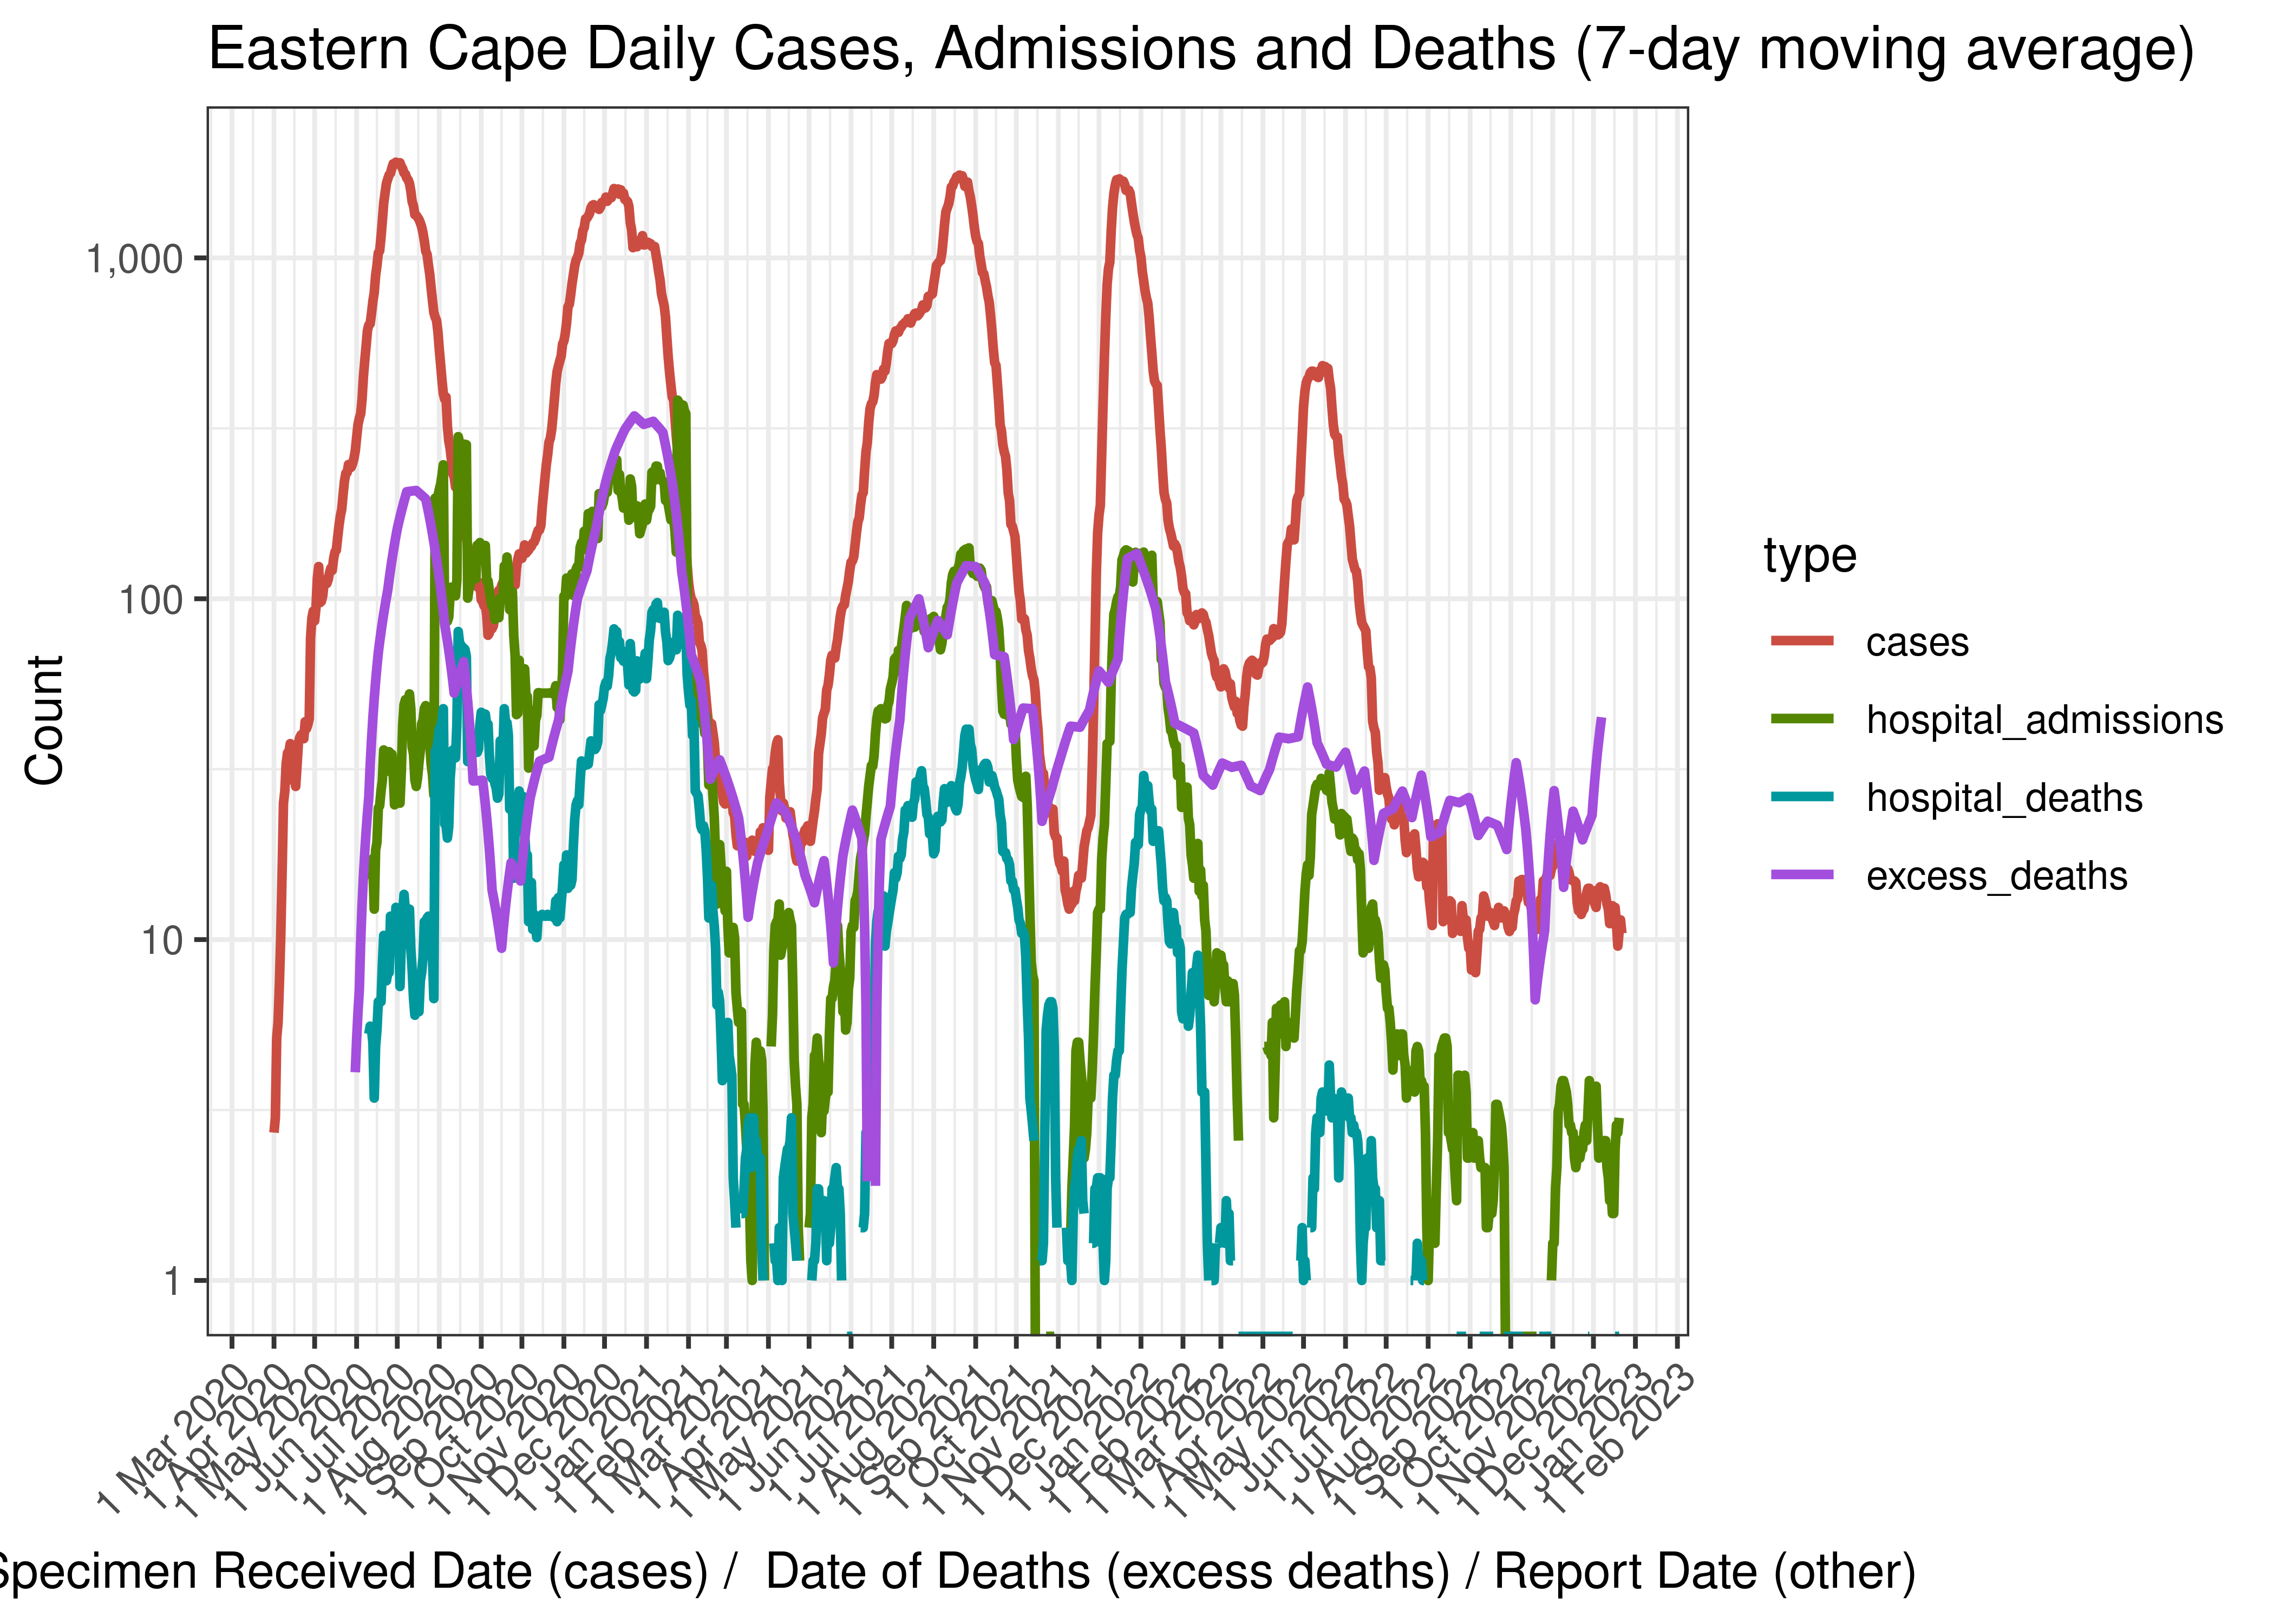
Eastern Cape Daily Cases, Admissions and Deaths (7-day moving average)
Below the above chart is repeated for the last 30-days:
Eastern Cape Daily Cases, Admissions and Deaths for Last 30-days (7-day moving average)
6.2.6 Crude Ratios per Wave
Below crude rations are calculated between the waves. It’s based on the following starting dates:
- Wave 1 started on 2020-01-01.
- Wave 2 started on 2020-10-01.
- Wave 3 started on 2021-04-01.
- Wave 4 started on 2021-11-01.
- Wave 5 started on 2022-04-01.
Below crude ratios are tabulated and plotted. These ratios are:
- Case admissions ratio calculated as admissions divided by cases.
- Case fatality ratio calculated as hospital deaths divided by cases (Note that COVID-19 deaths are under-reported by a significant factor in South Africa).
- Case excess deaths ratio calculated as excess deaths divided by cases.
- Hospital fatality ratio calculated as hospital deaths divided by admissions (Note that COVID-19 deaths are under-reported by a significant factor in South Africa).
- Death reporting ratio calculated as hospital deaths divided by excess deaths.
| Wave | Case Admission Ratio | Case Fatality Ratio | Case Excess Deaths Ratio | Hospital Fatality Ratio | Death Reporting Ratio | |
|---|---|---|---|---|---|---|
| Eastern Cape | Wave 1 | 11.8% | 3.30% | 11.36% | 28.0% | 29.1% |
| Eastern Cape | Wave 2 | 19.5% | 6.09% | 22.00% | 31.2% | 27.7% |
| Eastern Cape | Wave 3 | 10.4% | 2.87% | 10.92% | 27.6% | 26.3% |
| Eastern Cape | Wave 4 | 10.7% | 1.77% | 15.55% | 16.5% | 11.4% |
| Eastern Cape | Wave 5 | 8.4% | 0.99% | 32.53% | 11.8% | 3.1% |
Below the rations above are plotted graphically:
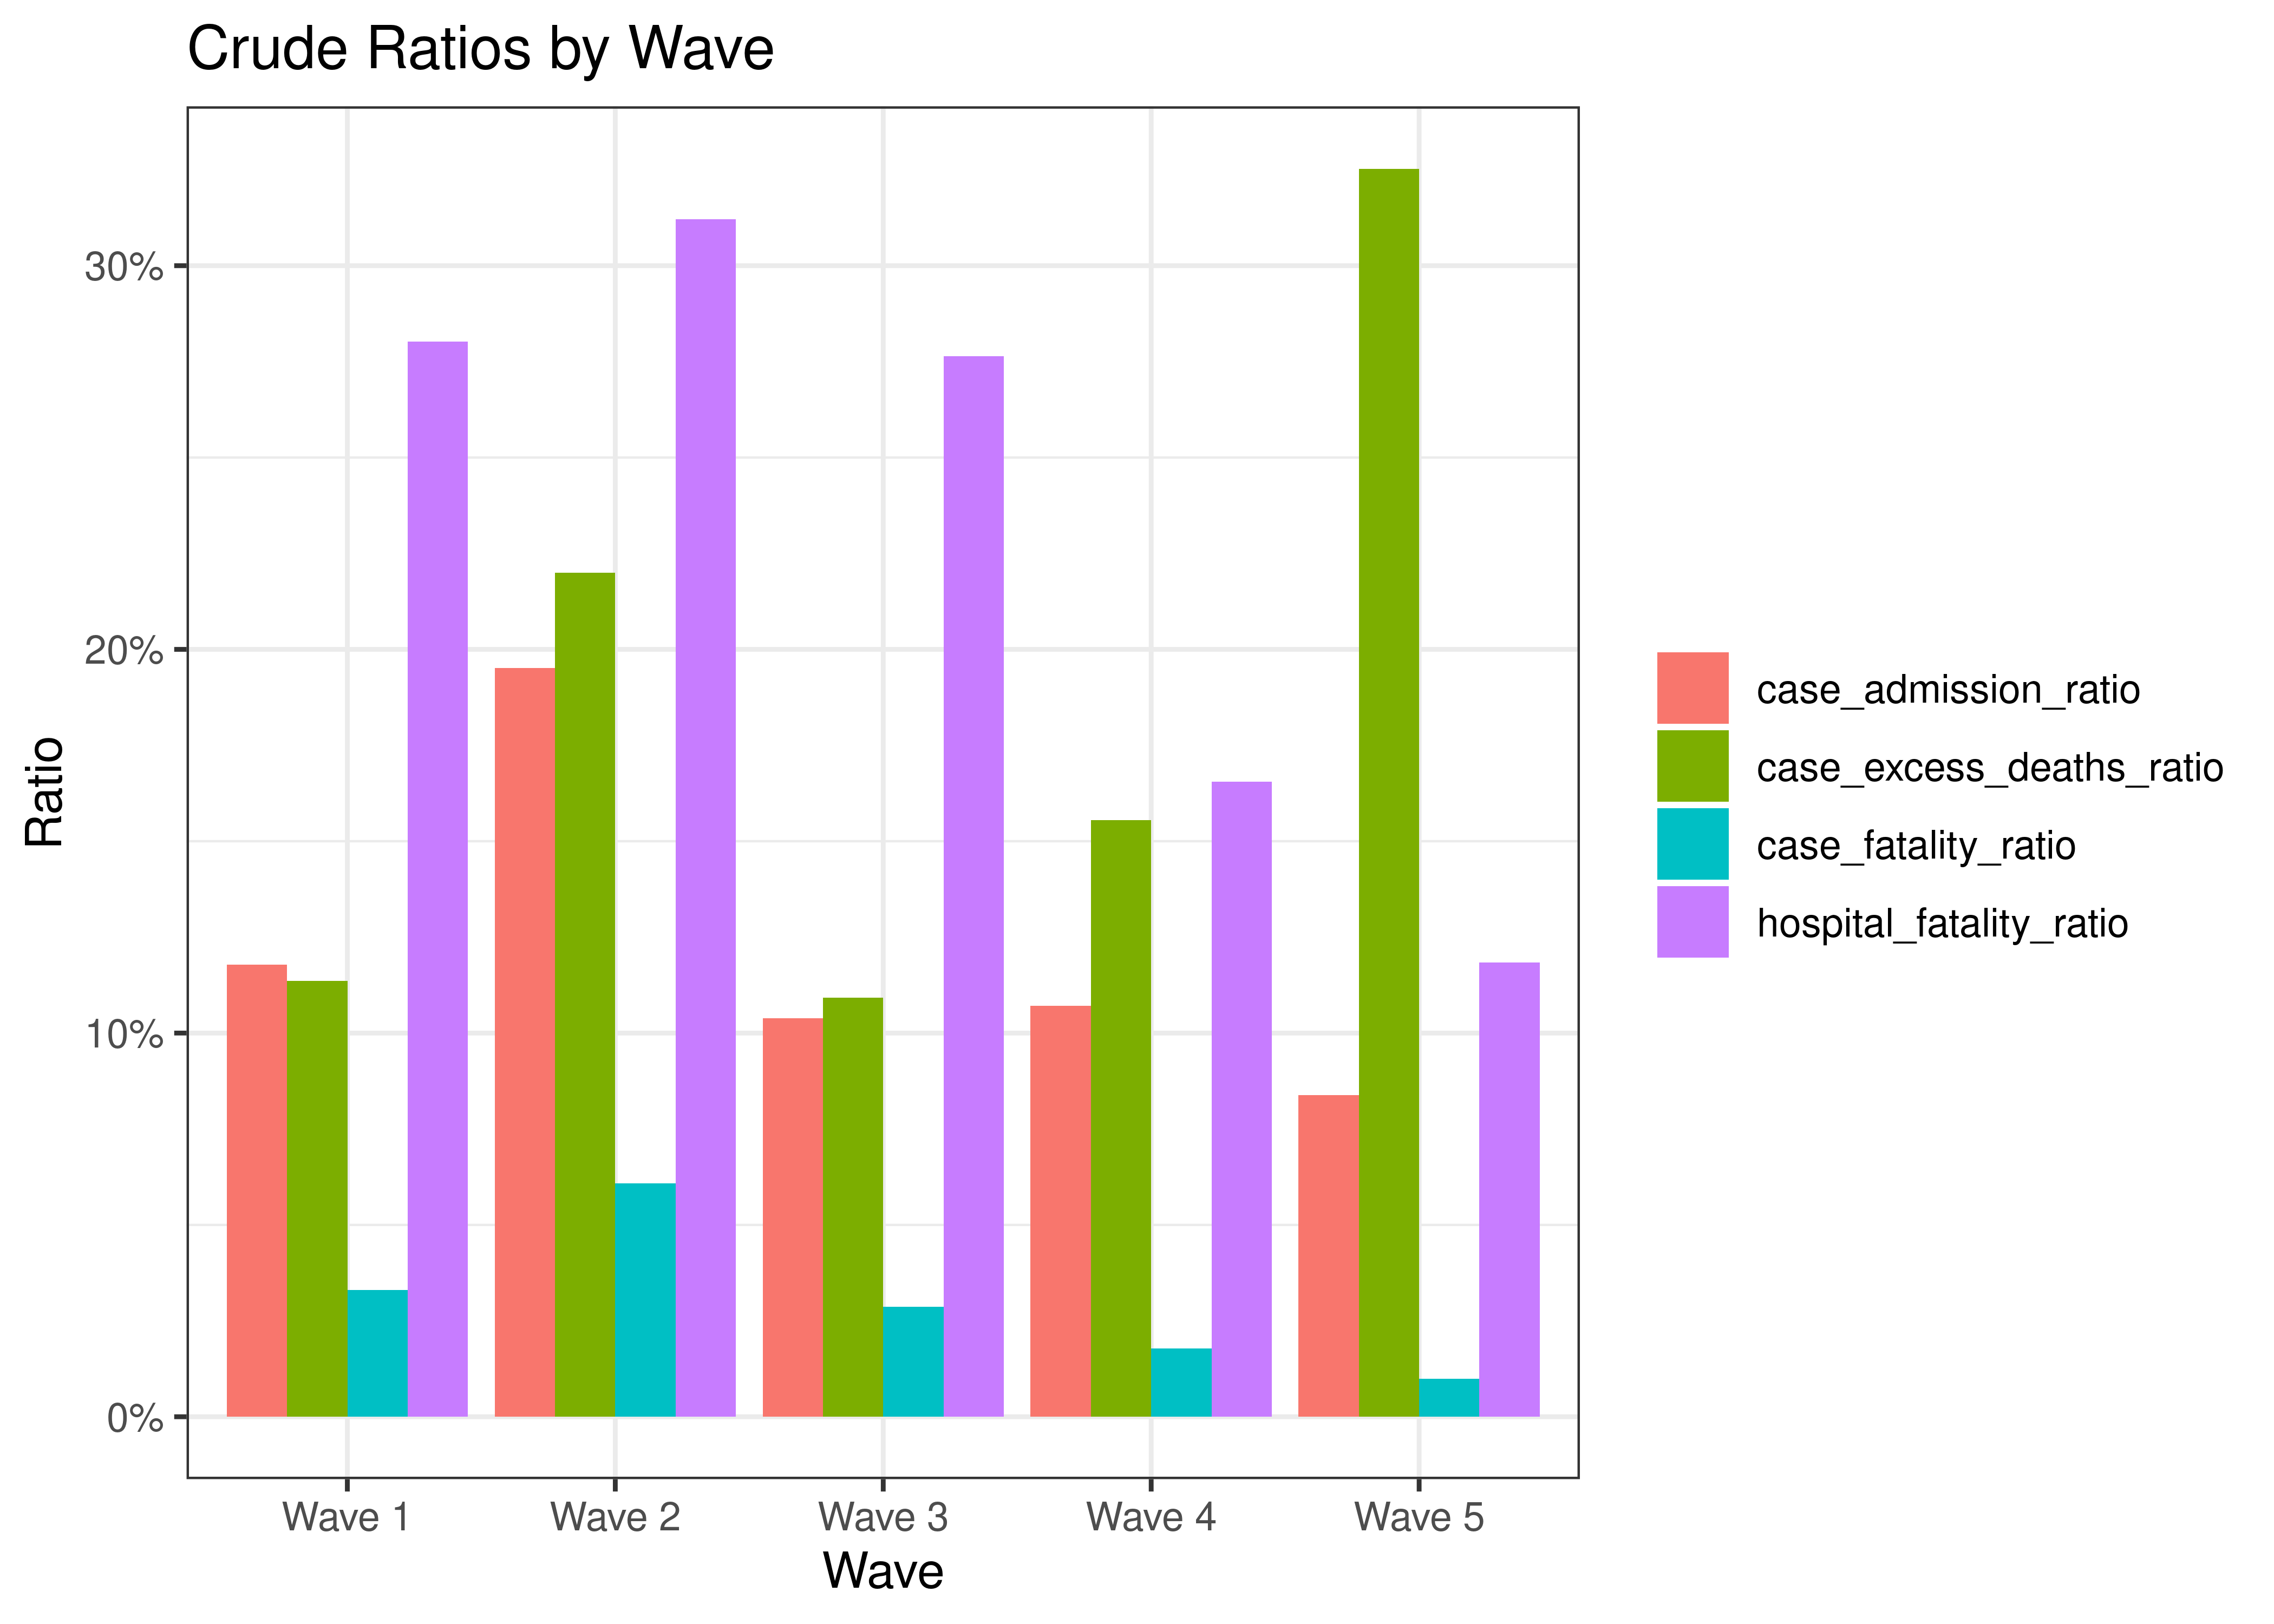
Crude Ratios by Wave
6.2.7 Reproduction Number
Below current (last weekly) effective reproduction number estimates are tabulated for Eastern Cape and by district municipality.
| Type | Count (Per Day) | Week Ending | Reproduction Number [95% Confidence Interval] | |
|---|---|---|---|---|
| Eastern Cape | cases | 10.4 | 2022-12-25 | 0.92 [0.72 - 1.15] |
| Eastern Cape | hospital_admissions | 3.0 | 2022-12-23 | 1.57 [0.97 - 2.33] |
| District Municipality | Type | Count (Per Day) | Week Ending | Reproduction Number [95% Confidence Interval] |
|---|---|---|---|---|
| Alfred Nzo | cases | 0.0 | 2022-12-25 | 0.66 [0.02 - 2.47] |
| Amathole | cases | 0.1 | 2022-12-25 | 0.34 [0.04 - 0.95] |
| Buffalo City Metro | cases | 1.3 | 2022-12-25 | 1.32 [0.63 - 2.28] |
| Chris Hani | cases | 1.4 | 2022-12-25 | 1.62 [0.80 - 2.73] |
| Joe Gqabi | cases | 0.0 | 2022-12-25 | 4.45 [0.11 - 16.47] |
| Nelson Mandela Bay Metro | cases | 5.7 | 2022-12-25 | 0.92 [0.66 - 1.22] |
| O R Tambo | cases | 0.6 | 2022-12-25 | 0.98 [0.31 - 2.01] |
| Sarah Baartman | cases | 1.3 | 2022-12-25 | 1.06 [0.51 - 1.81] |
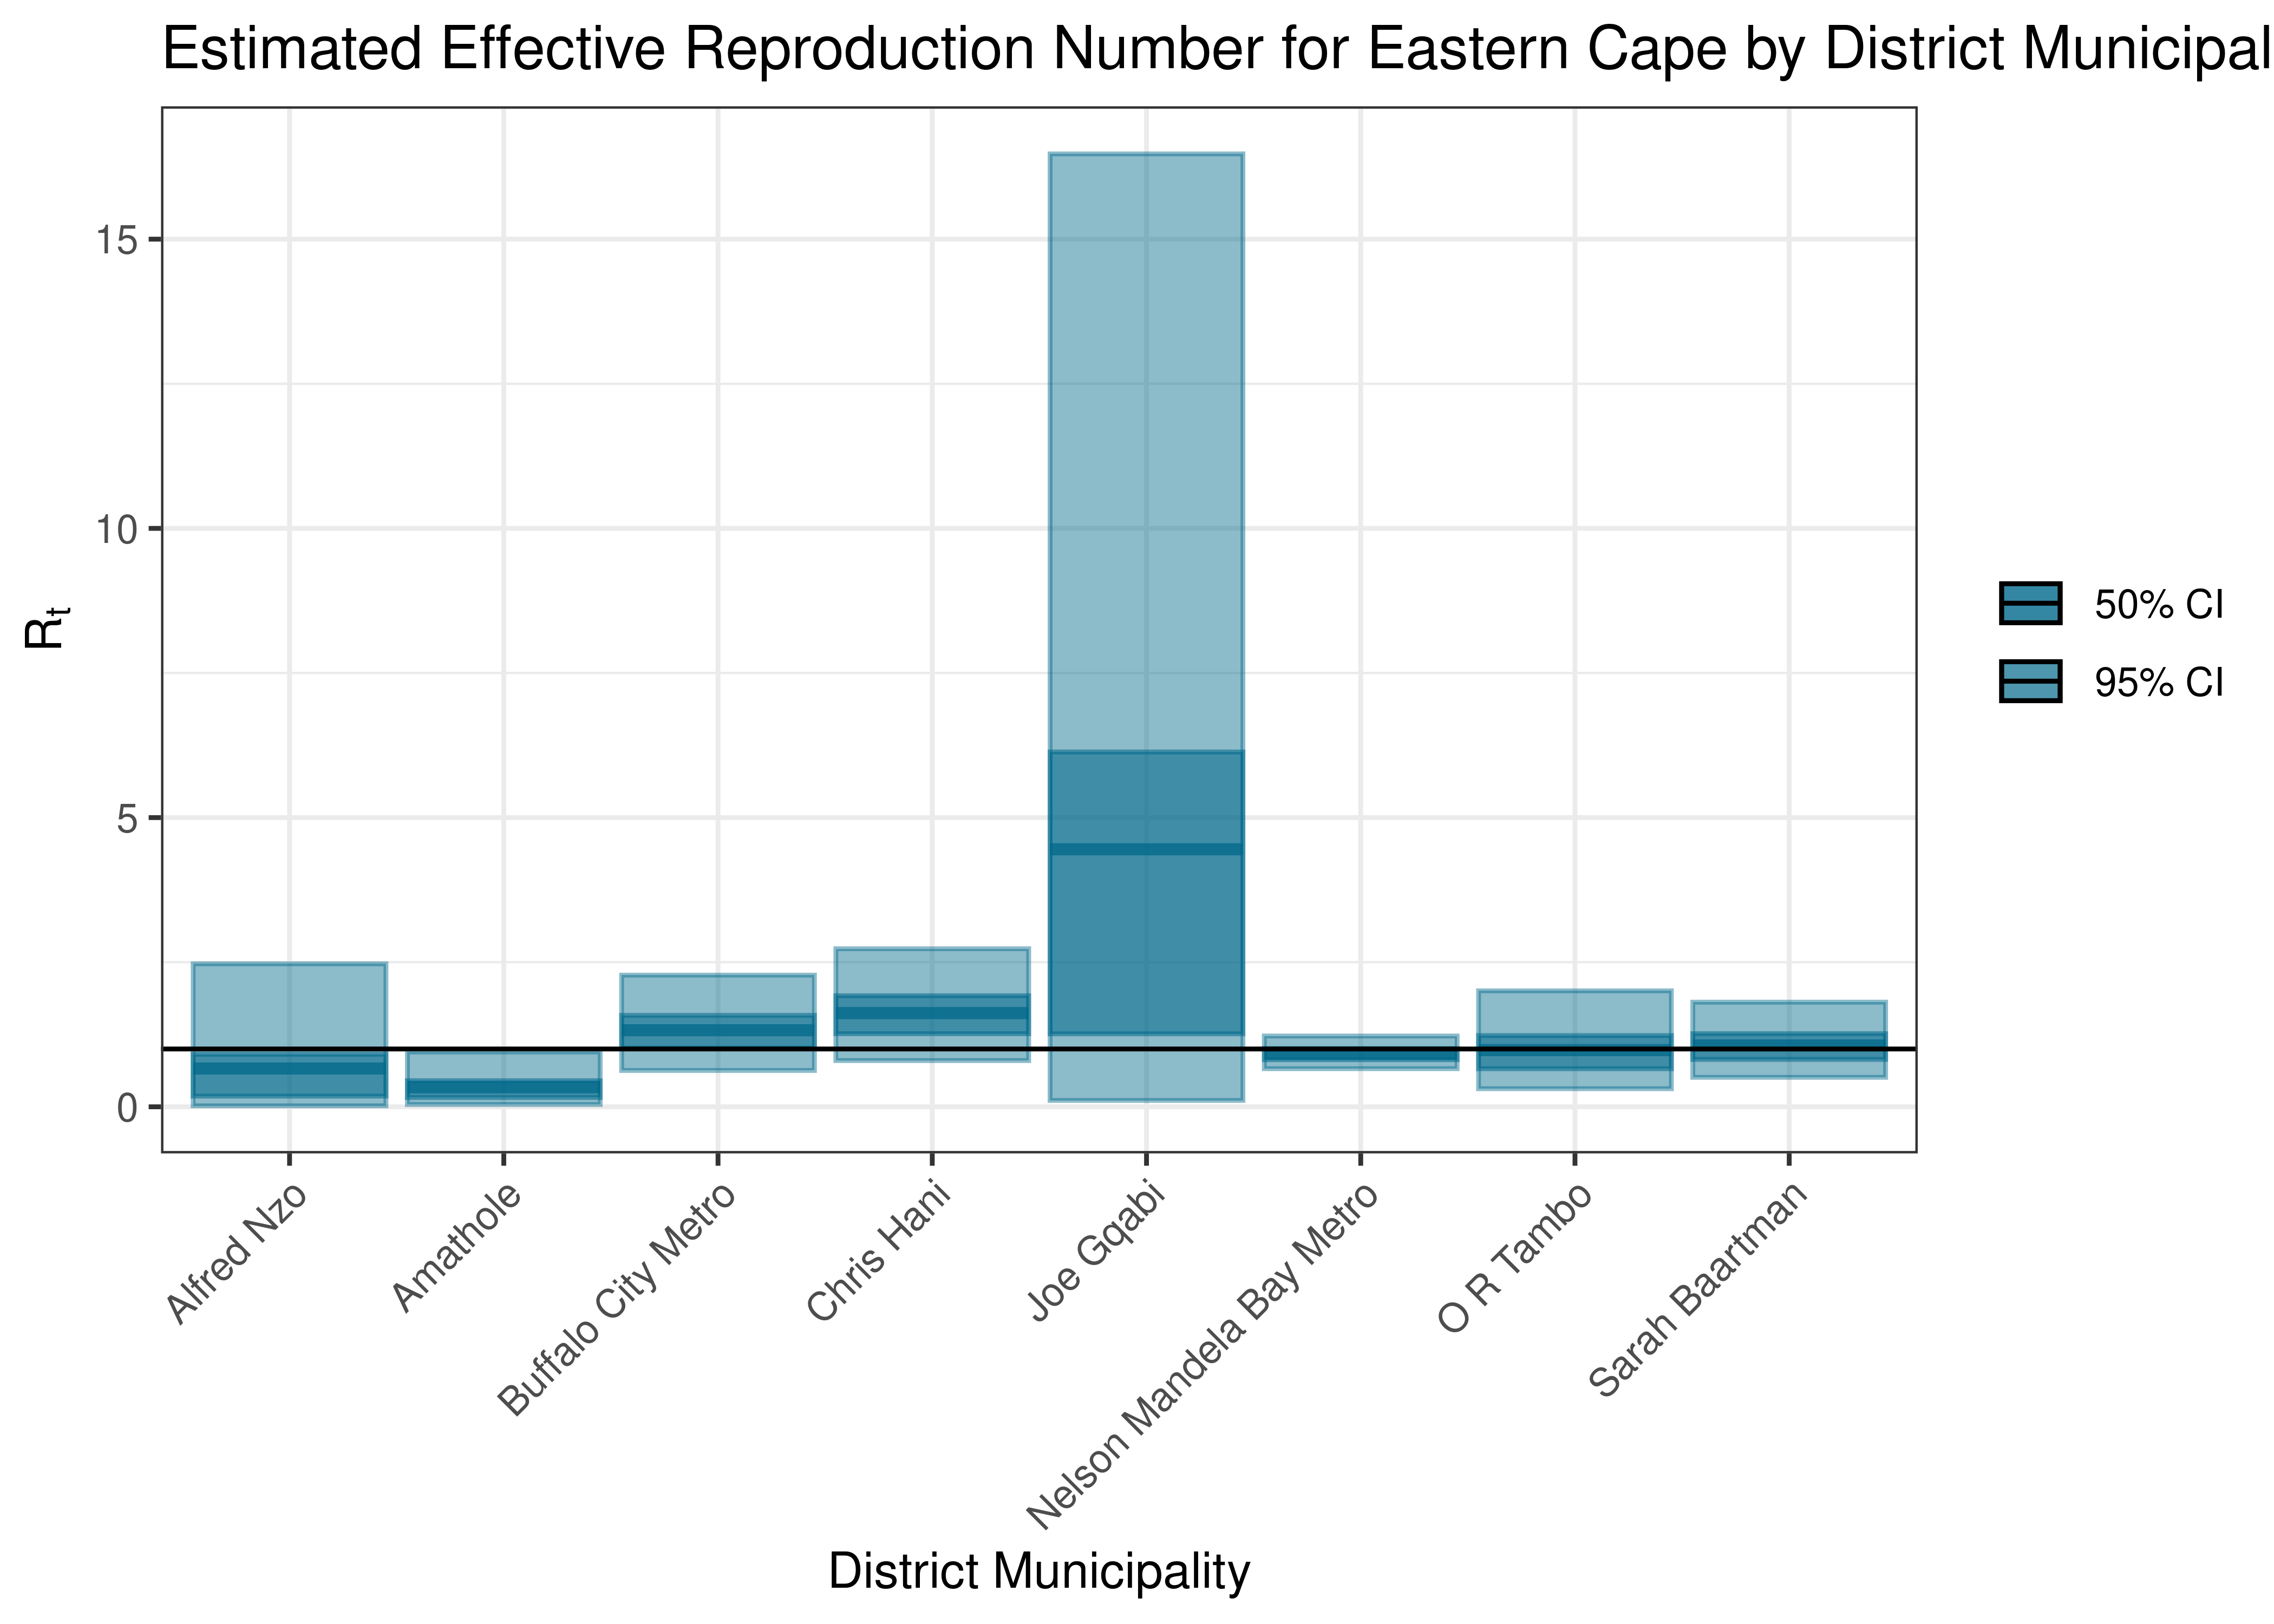
Estimated Effective Reproduction Number for Eastern Cape by District Municipality
Below the effective reproduction number for Eastern Cape over the last 90 days are plotted together with a plot since start of the pandemic.
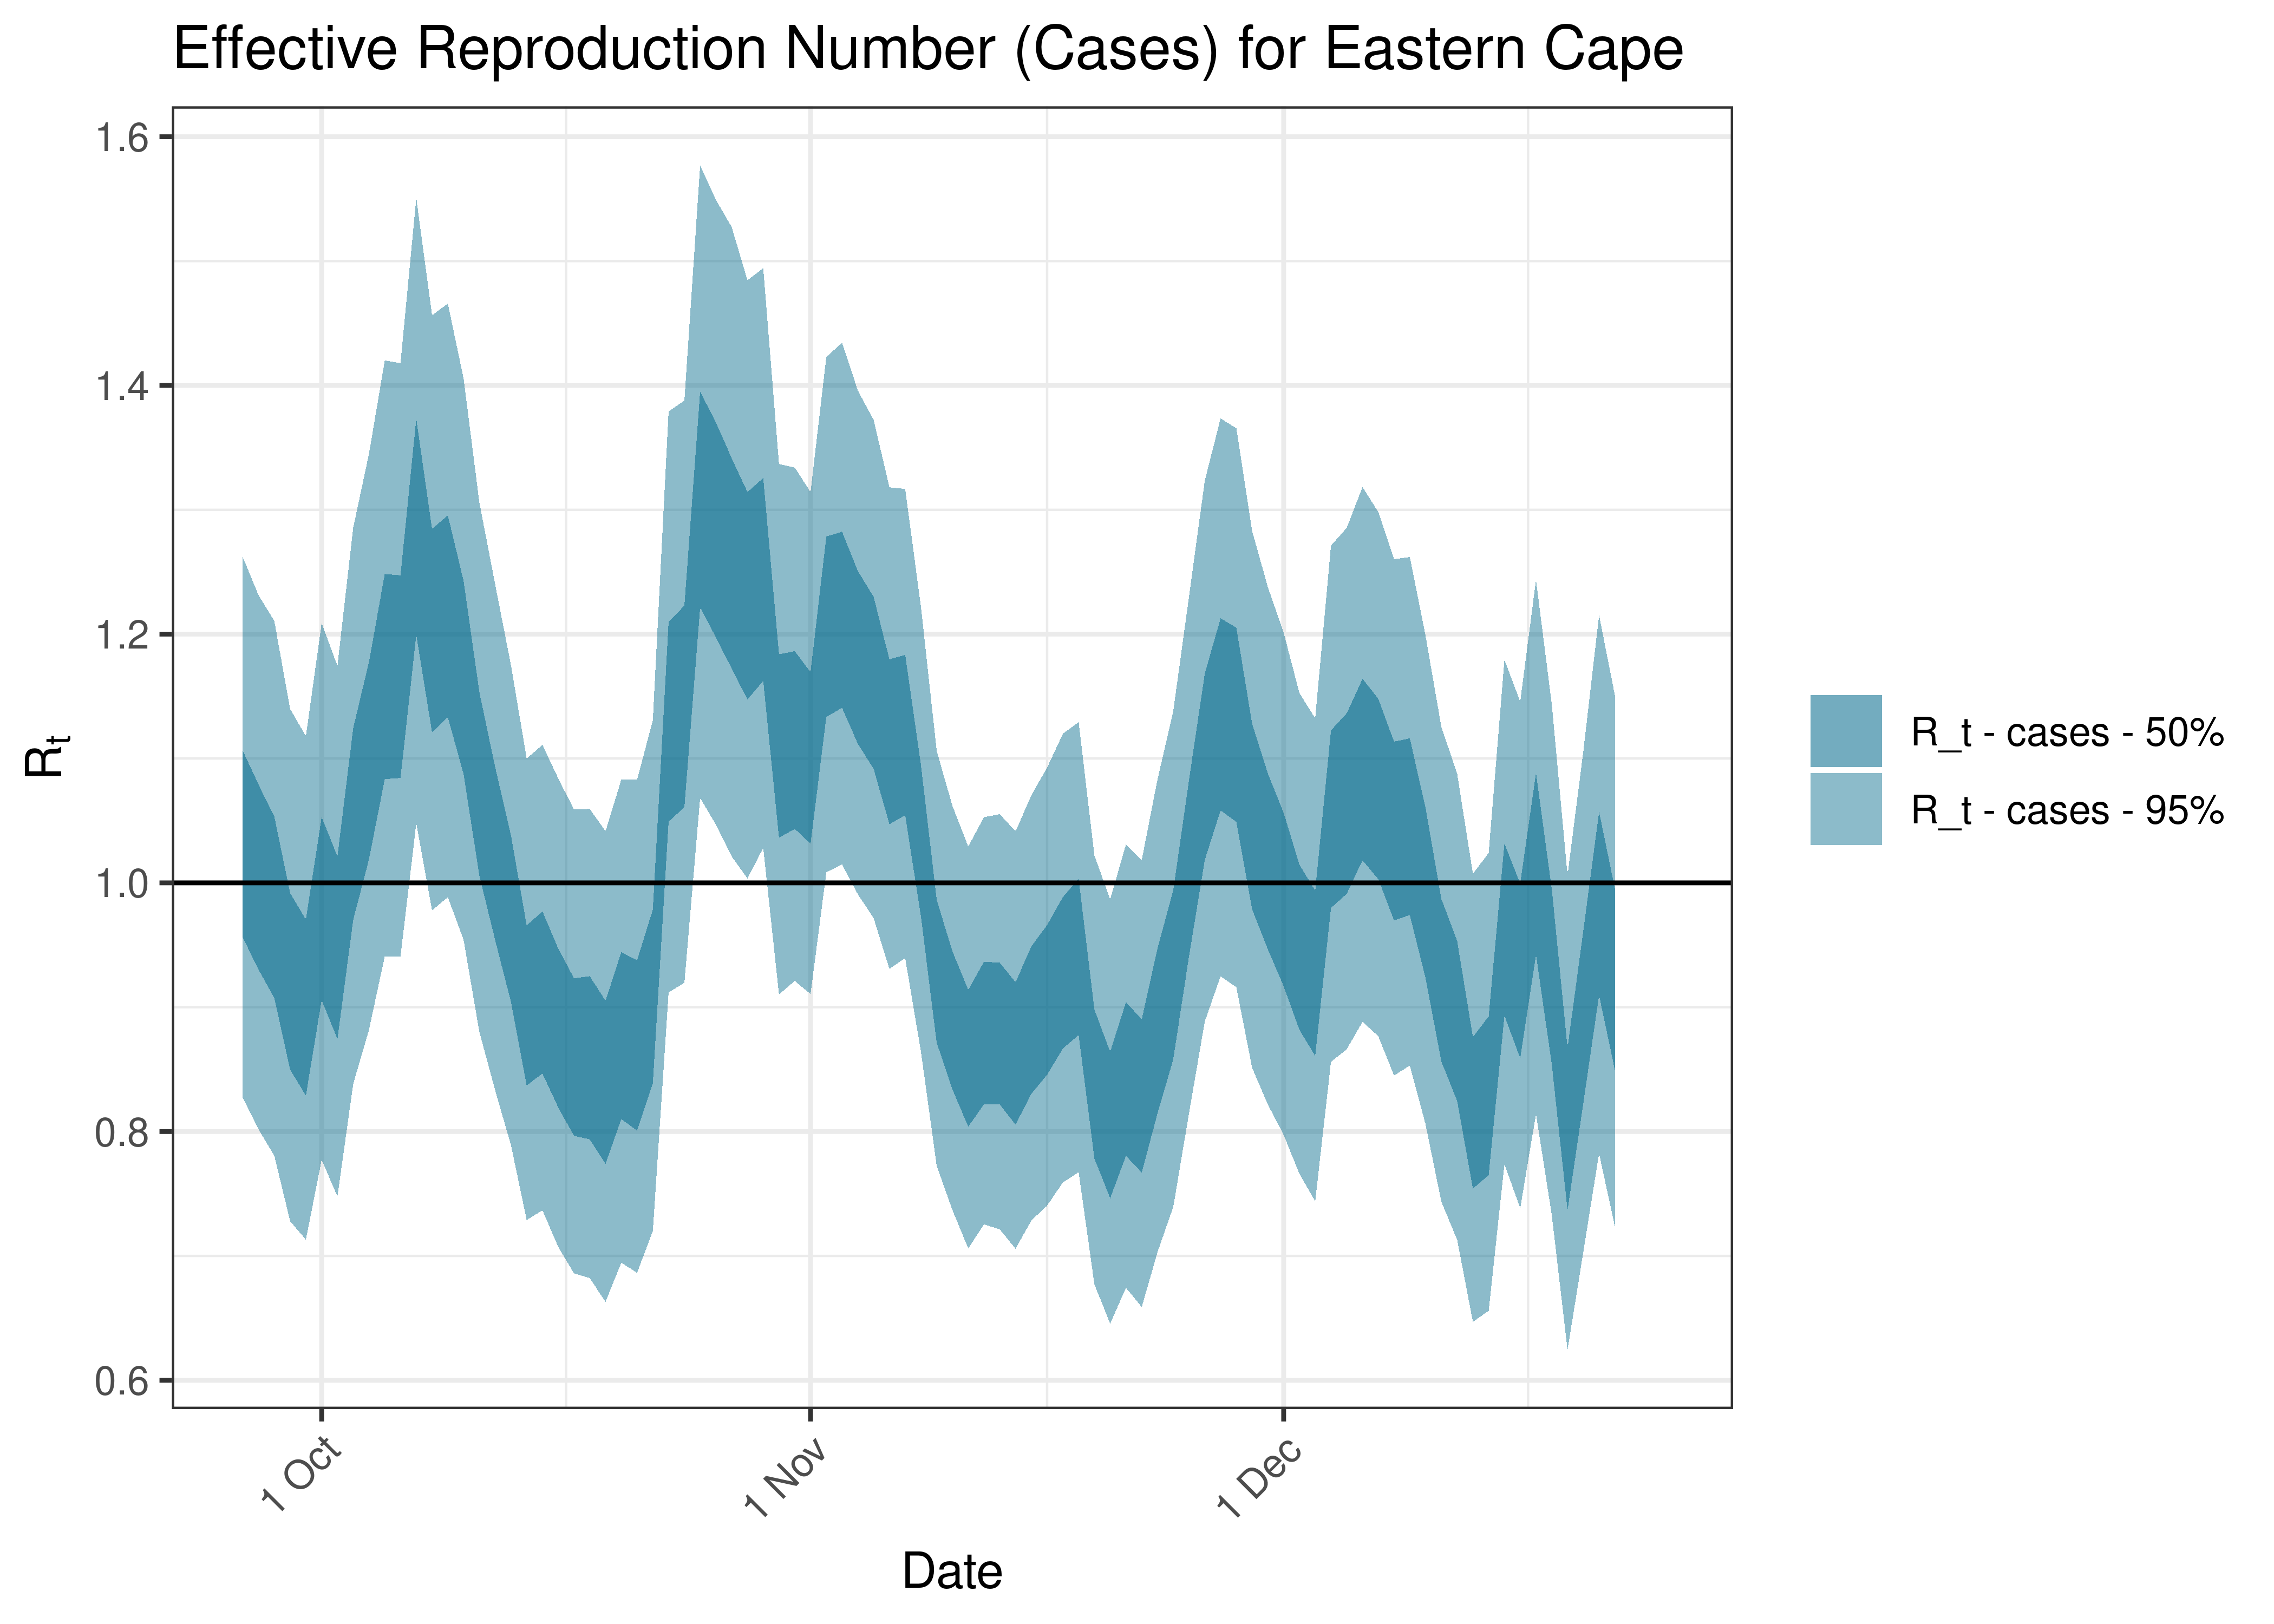
Estimated Effective Reproduction Number Based on Cases for Eastern Cape over last 90 days
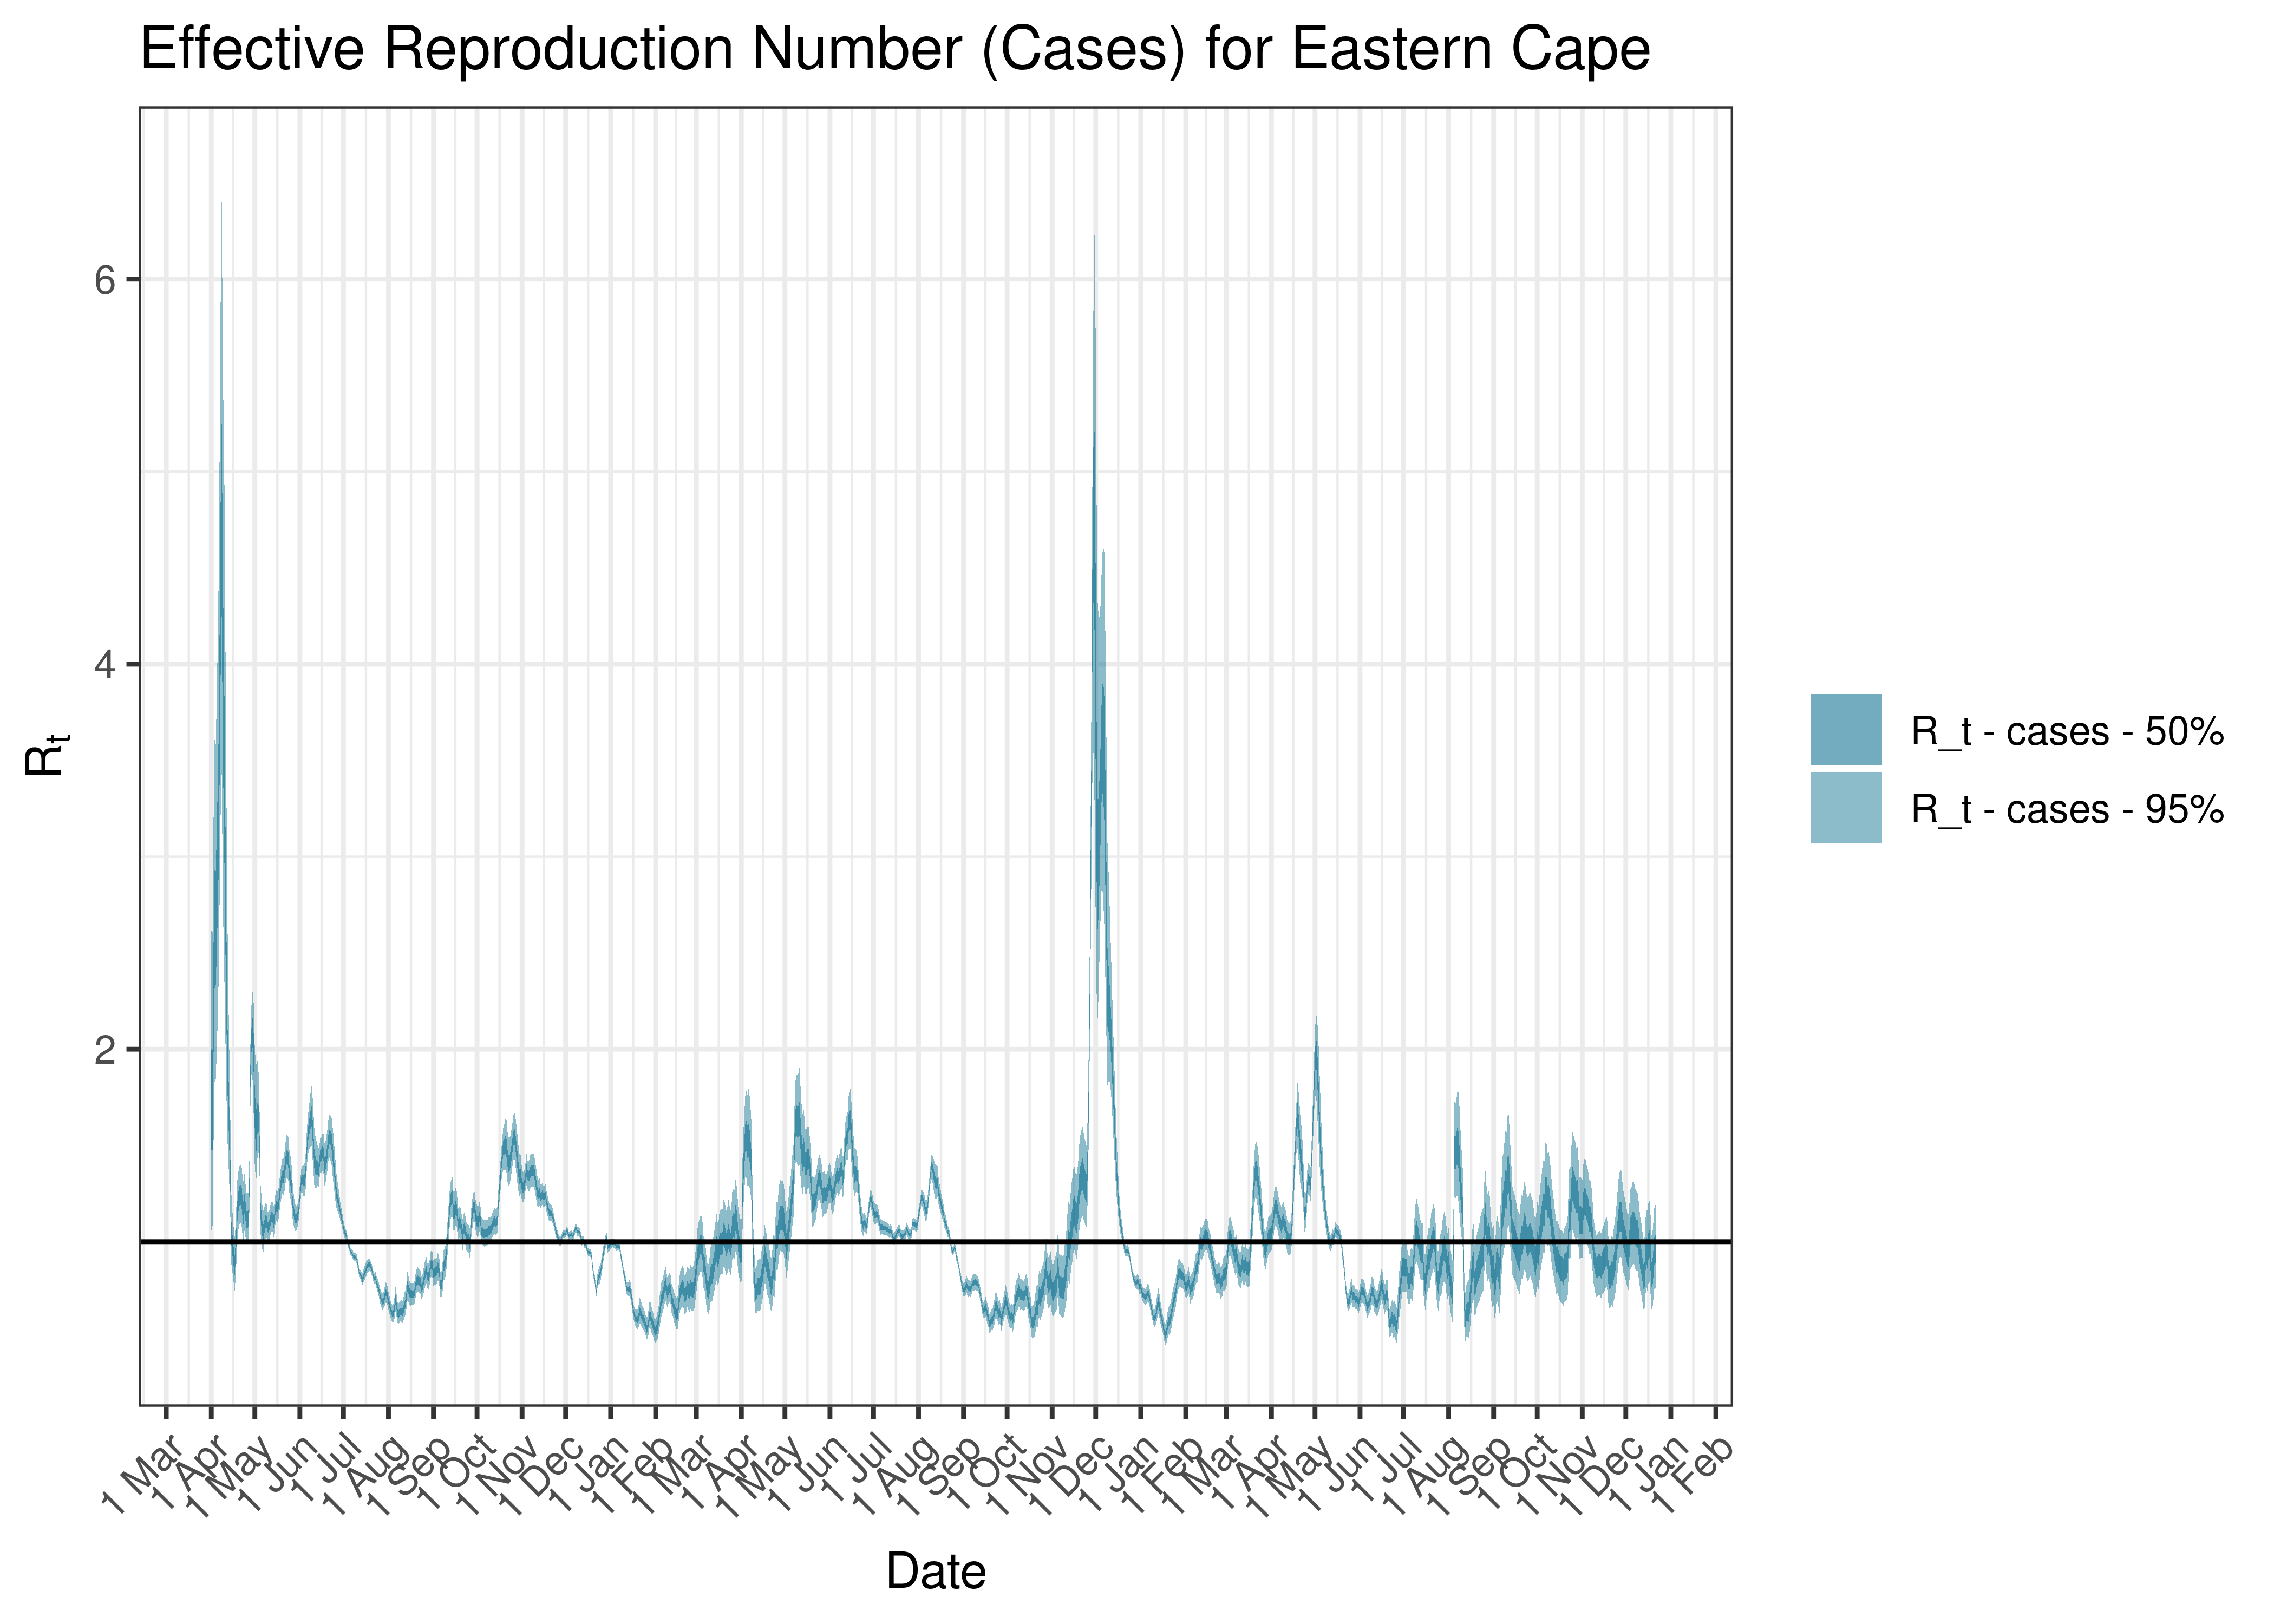
Estimated Effective Reproduction Number Based on Cases for Eastern Cape since 1 April 2020
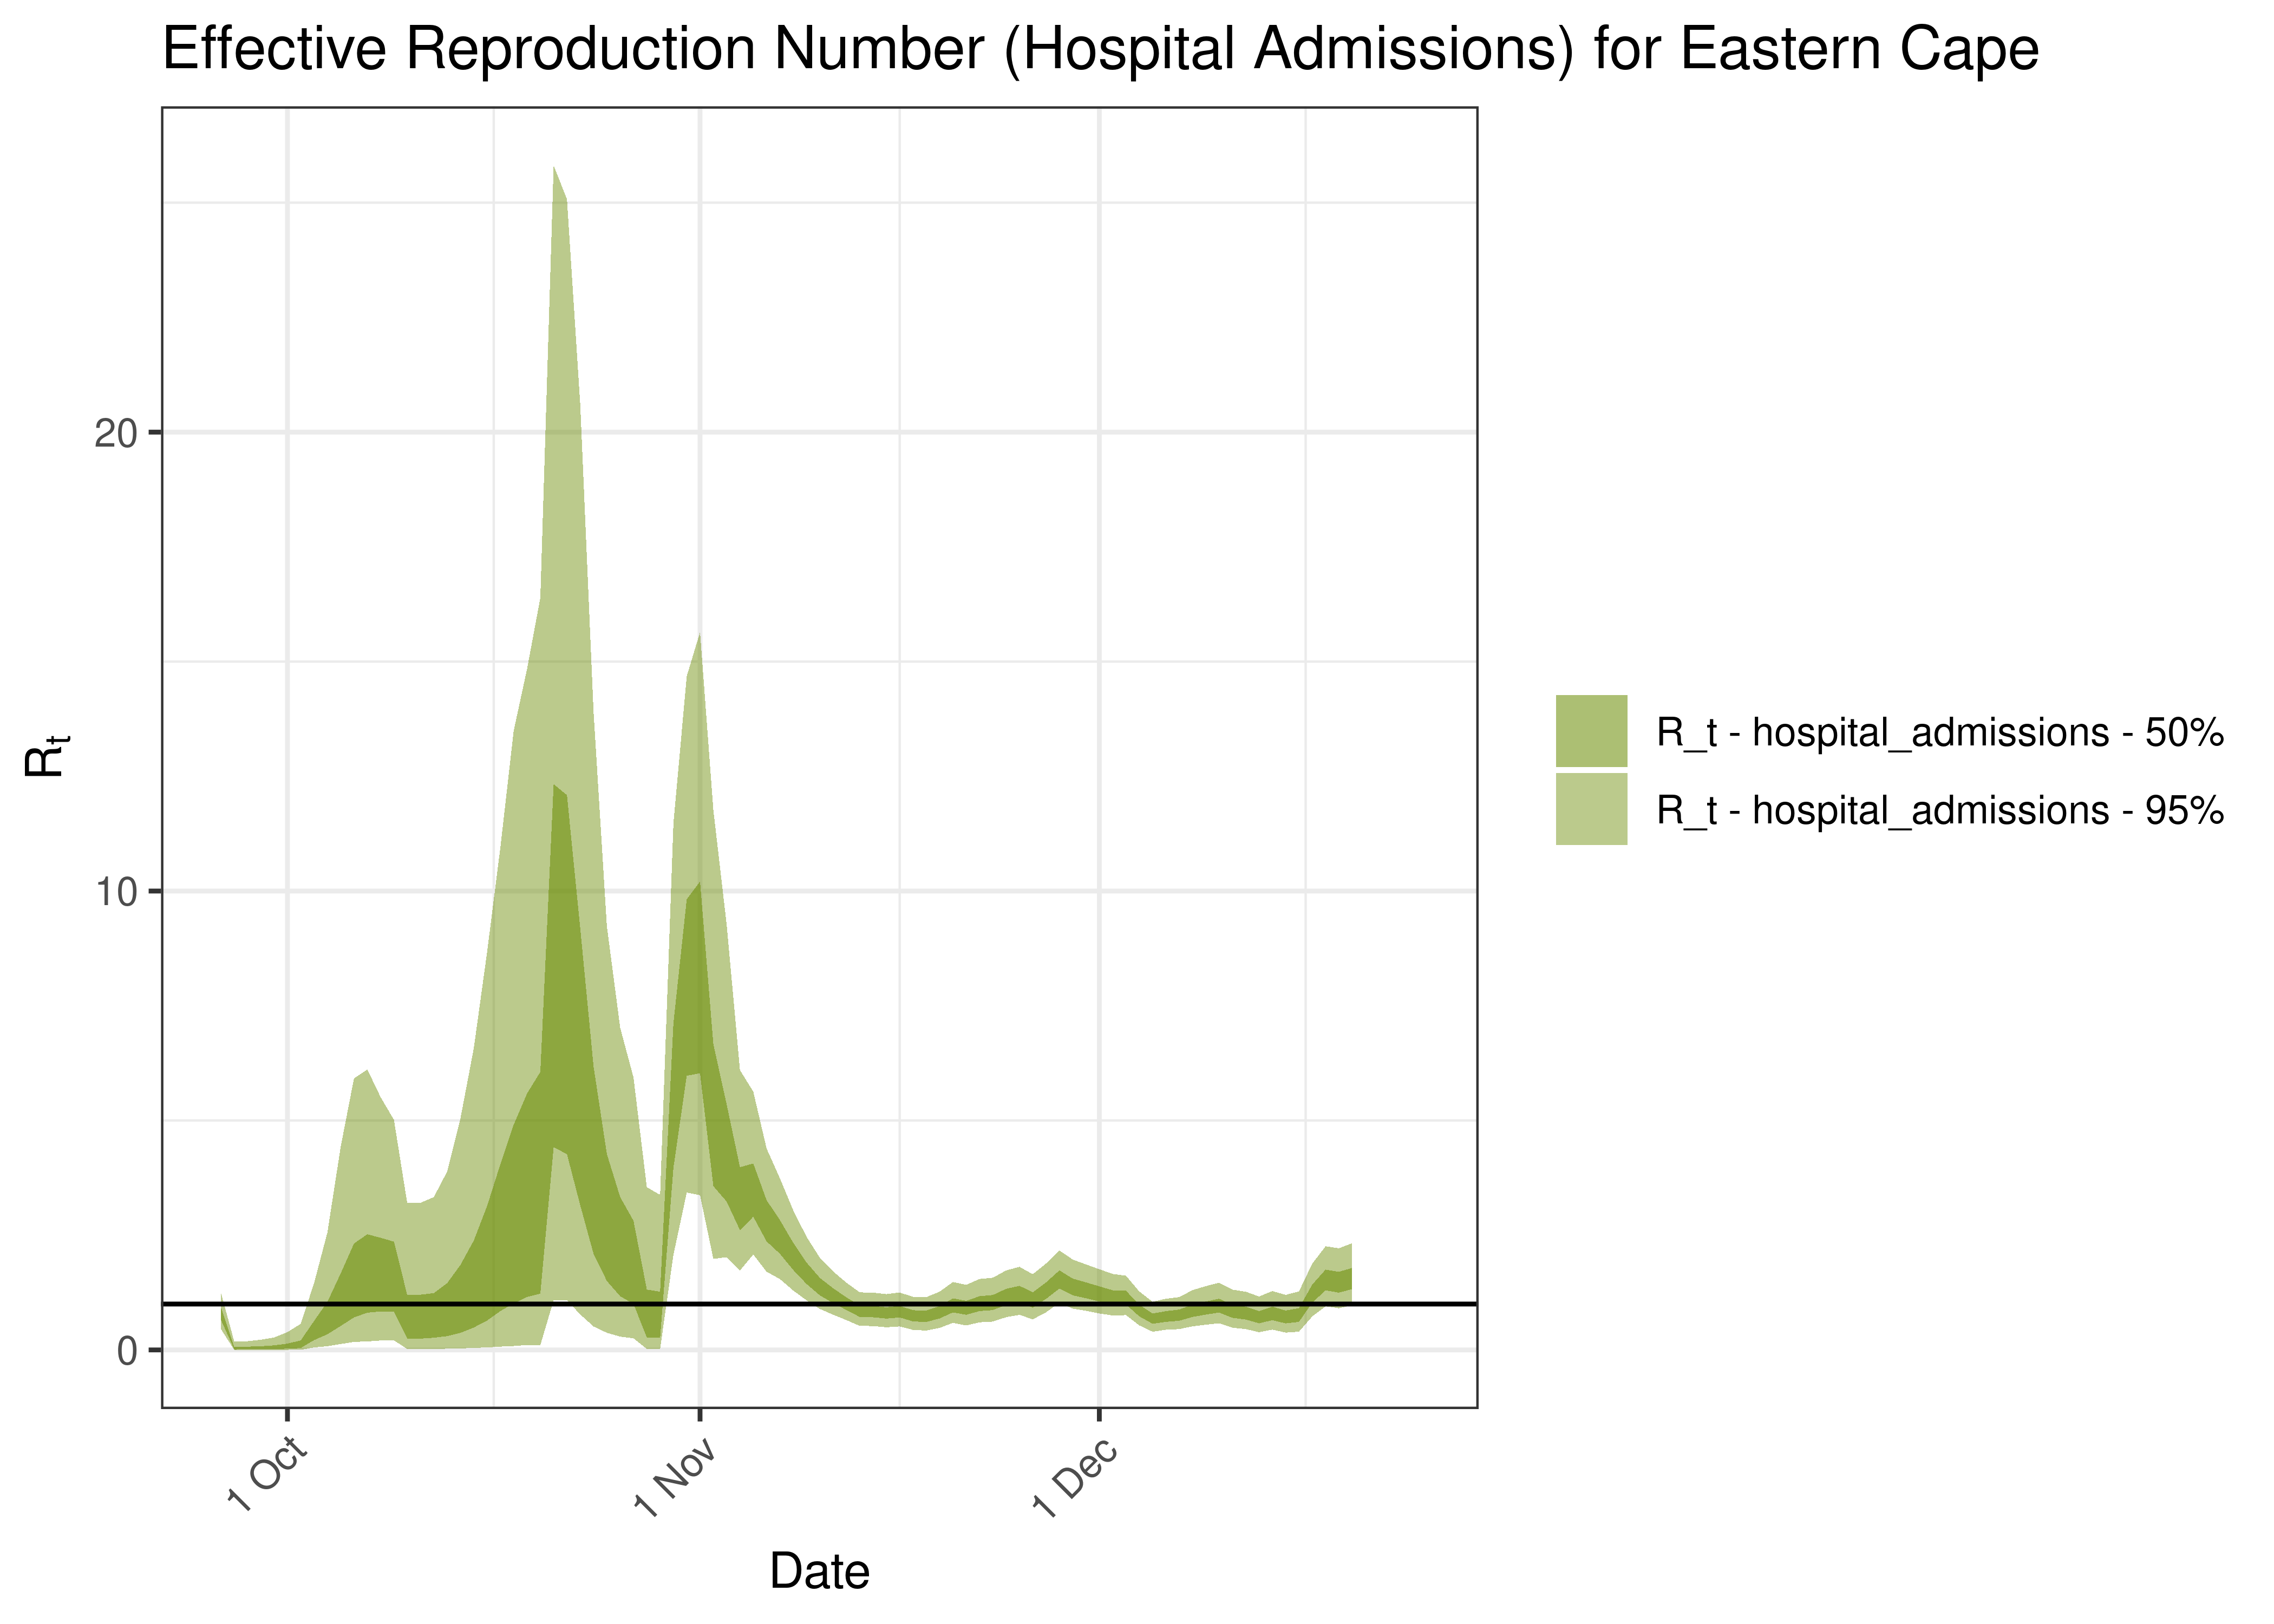
Estimated Effective Reproduction Number Based on Hospital Admissions for Eastern Cape over last 90 days
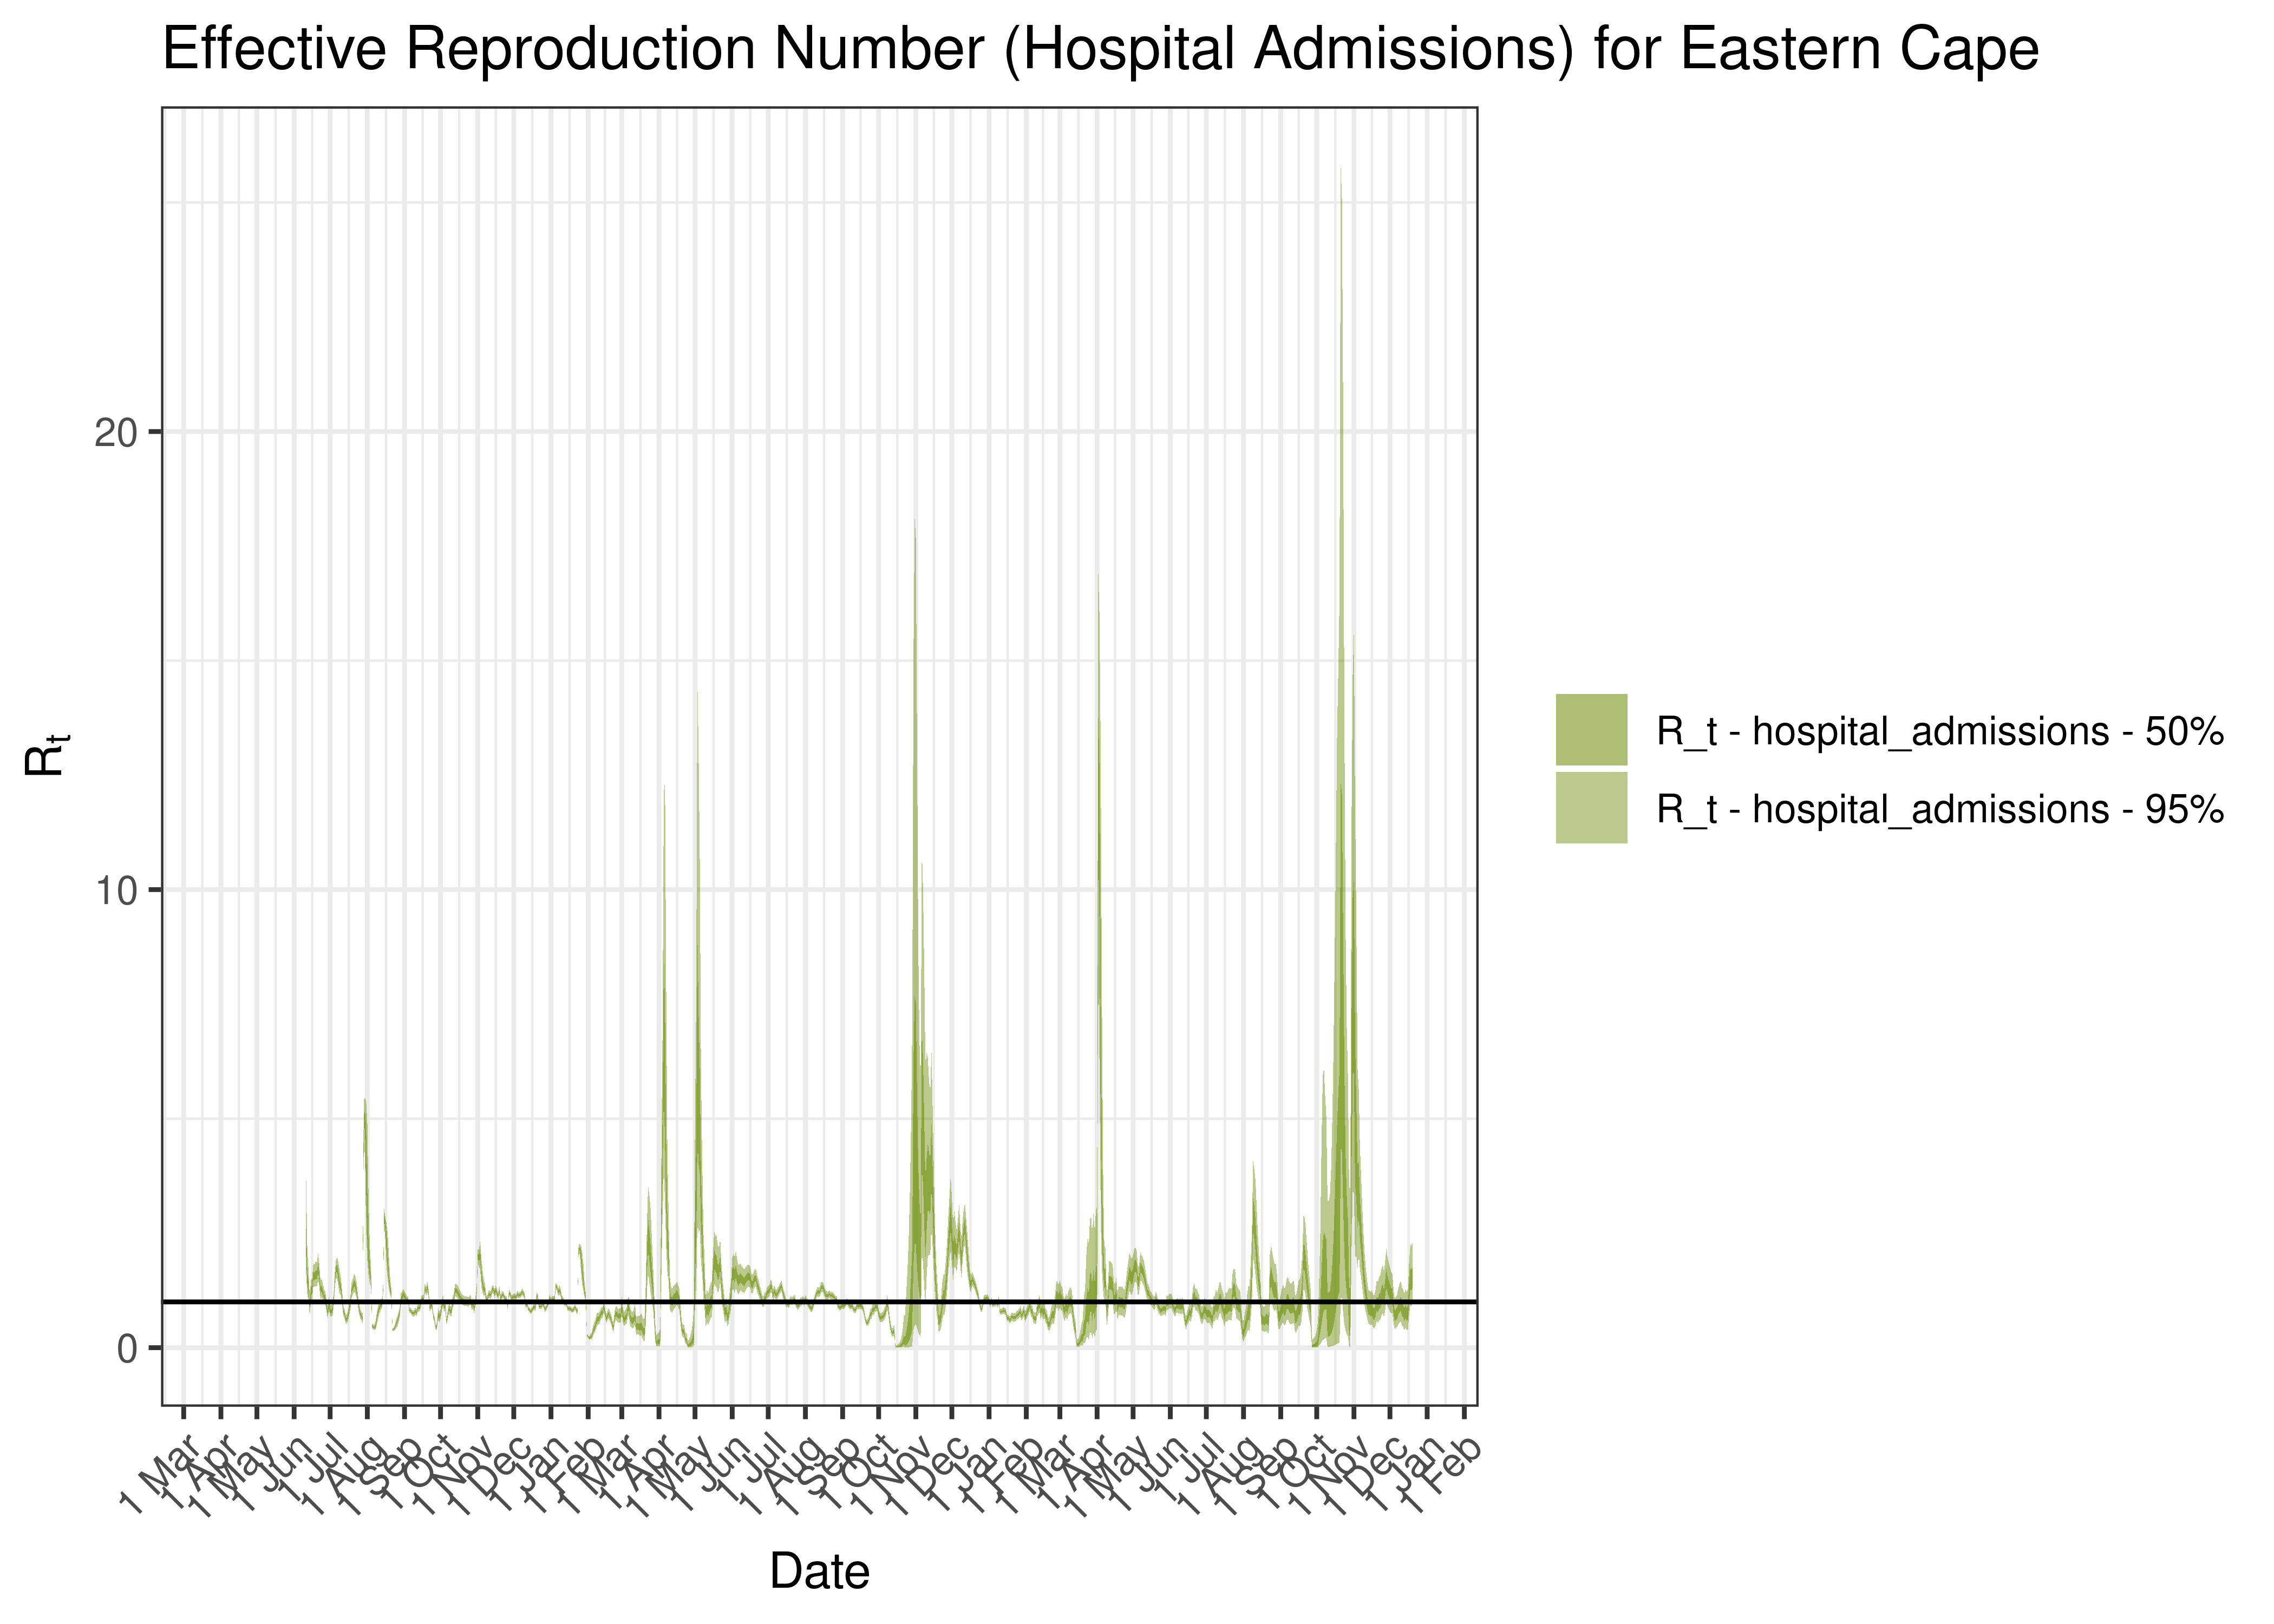
Estimated Effective Reproduction Number Based on Hospital Admissions for Eastern Cape since 1 April 2020
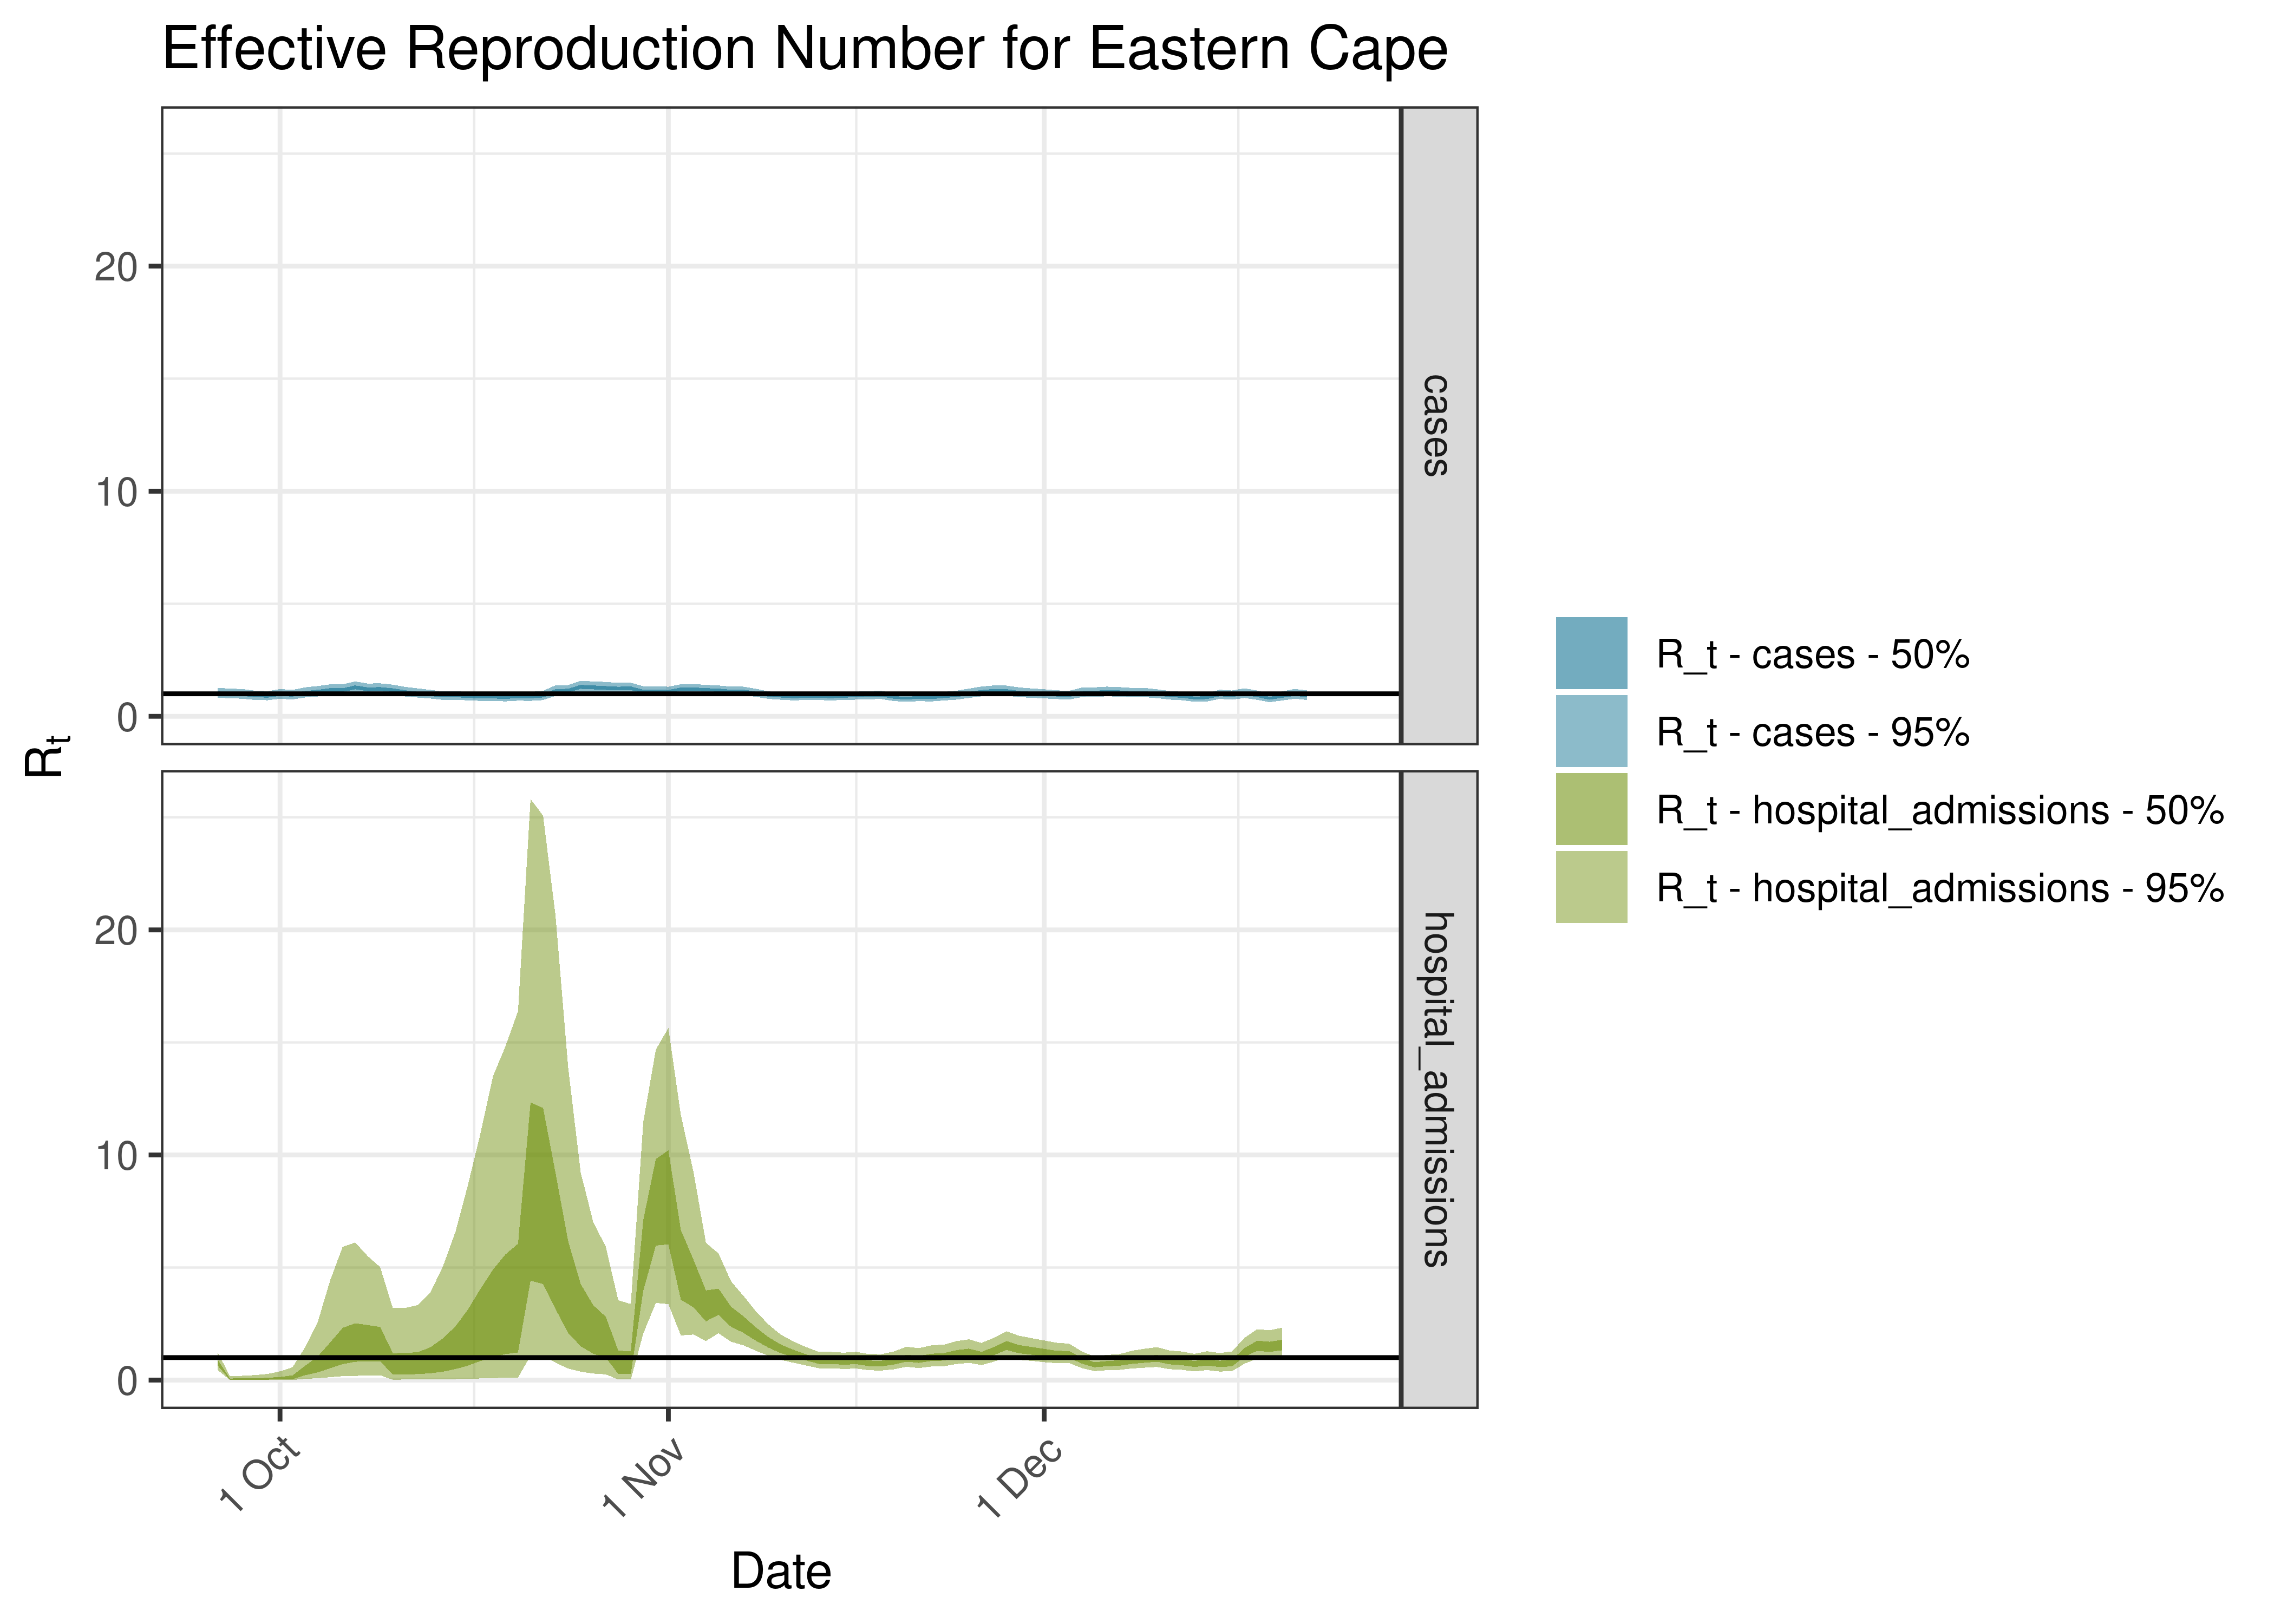
Estimated Effective Reproduction Number for Eastern Cape over last 90 days
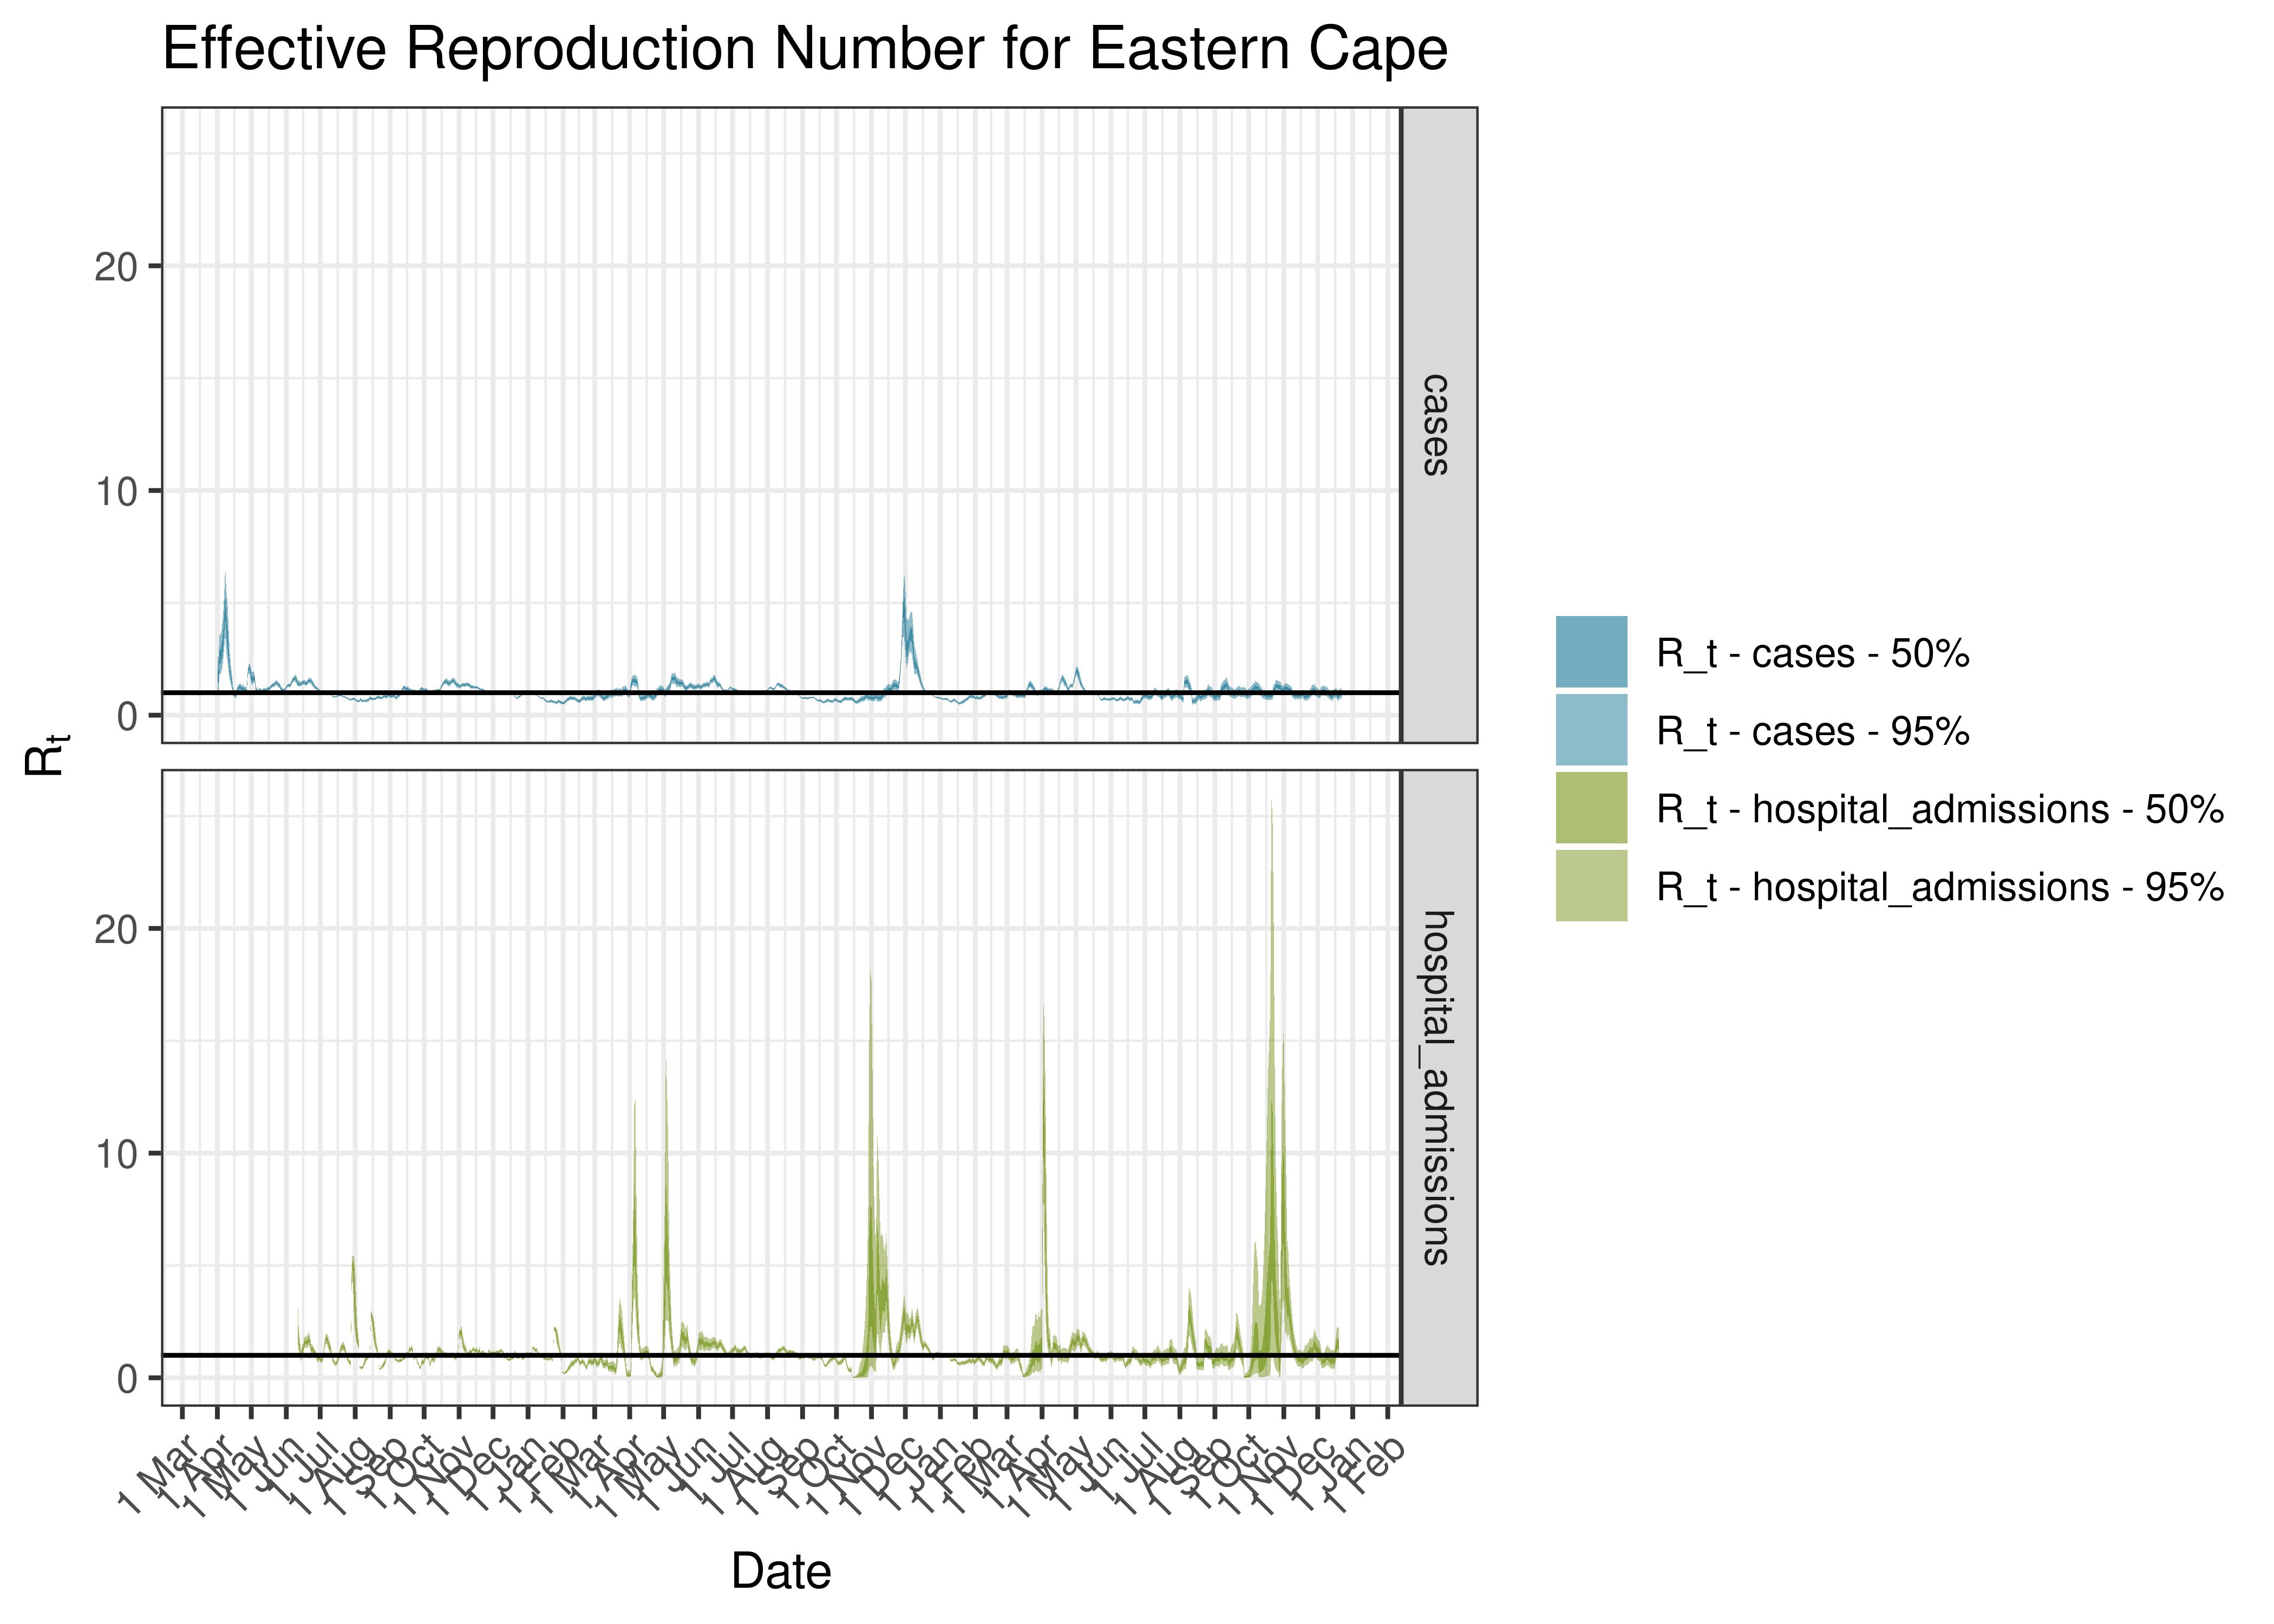
Estimated Effective Reproduction Number for Eastern Cape since 1 April 2020
6.2.8 Alfred Nzo
6.2.8.1 Cases
Cases are tabulated by specimen received date below. Cases include estimates for late reporting in recent days as well as adjustments for any public holidays. A centred 7-day moving average is also shown. The peak daily cases in previous waves (as measured by the moving average) is also shown.
| Specimen Received Date | Cases | 7-day Moving Average | Comment |
|---|---|---|---|
| 2020-07-10 | 68 | 61 | Wave 1 Peak |
| 2020-12-12 | 26 | 63 | Wave 2 Peak |
| 2021-08-22 | 11 | 51 | Wave 3 Peak |
| 2021-12-12 | 10 | 38 | Wave 4 Peak |
| 2022-05-20 | 6 | 6 | Wave 5 Peak (to date) |
| 2022-05-21 | 3 | 6 | Wave 5 Peak (to date) |
Below a 7-day moving average daily case count are plotted for Alfred Nzo on a log scale since start of the epidemic:
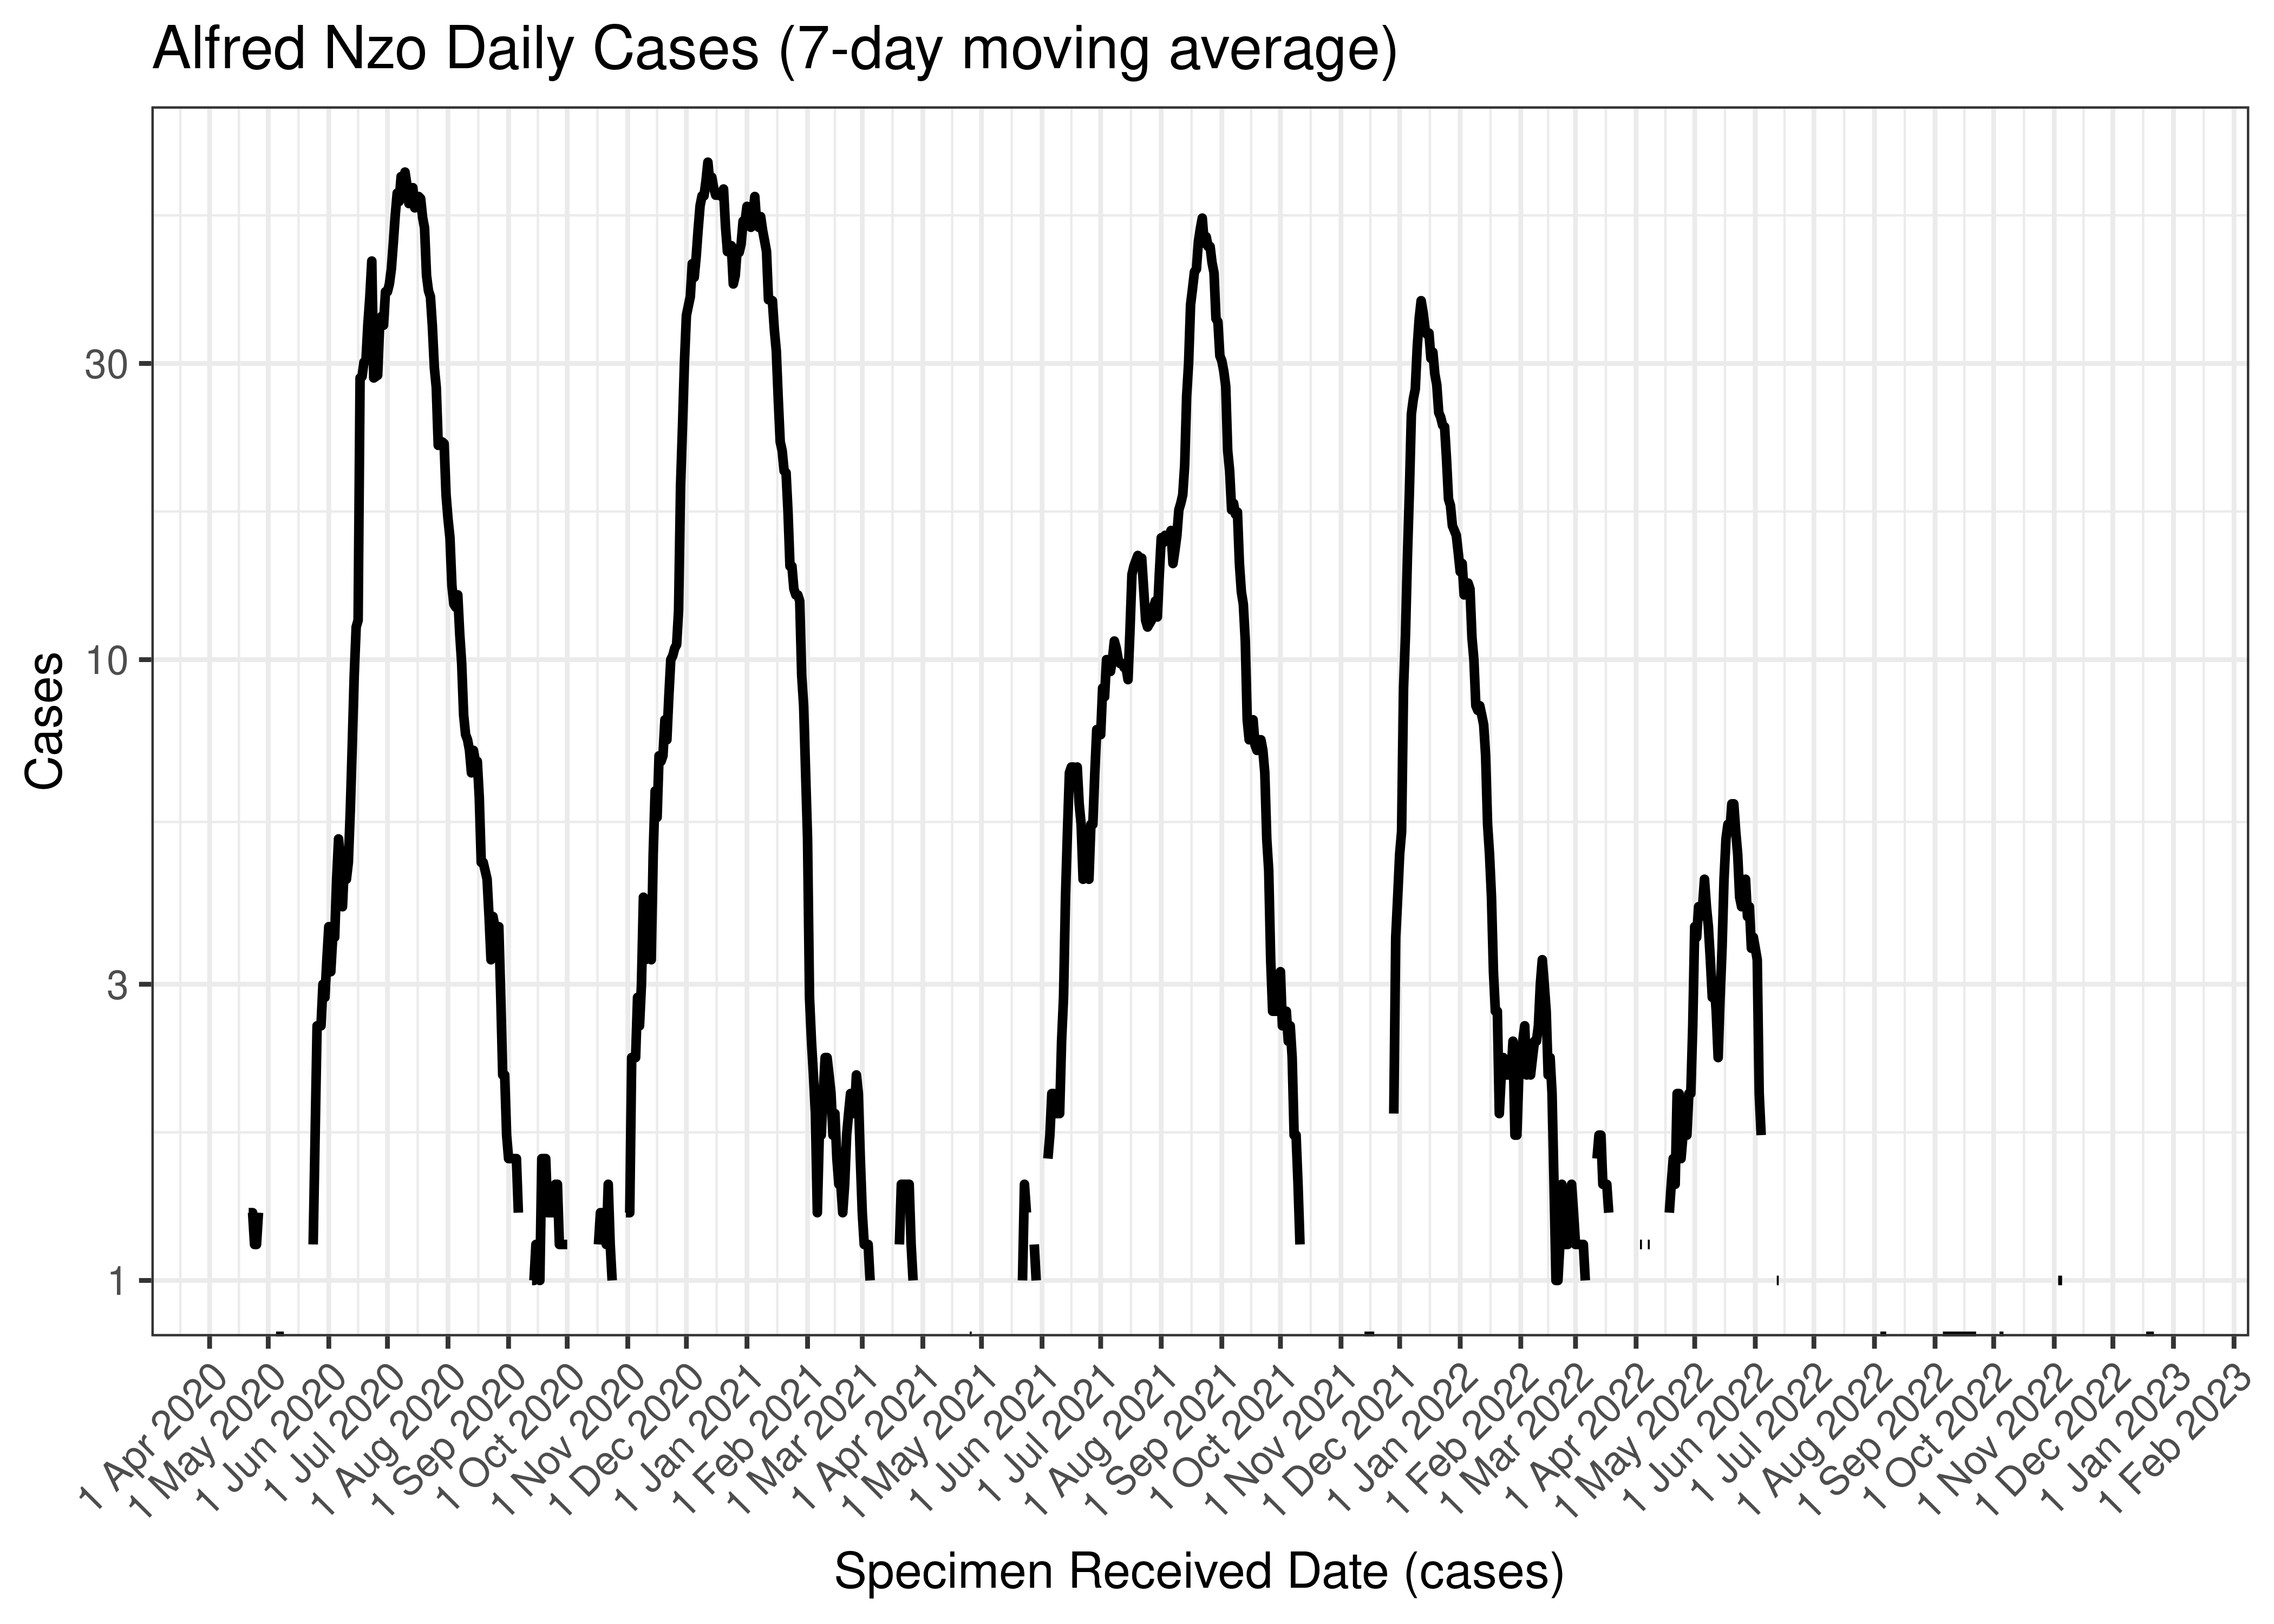
Alfred Nzo Daily Cases (7-day moving average)
Below the above chart is repeated for the last 30-days:

Alfred Nzo Daily Cases for Last 30-days (7-day moving average)
6.2.8.2 Reproduction Number
Below current (last weekly) reproduction number estimates are tabulated for Alfred Nzo.
| Count (Per Day) | Week Ending | Reproduction Number [95% Confidence Interval] | |
|---|---|---|---|
| Alfred Nzo | 0 | 2022-12-25 | 0.66 [0.02 - 2.47] |
Below the effective reproduction number for Alfred Nzo over the last 90 days are plotted together with a plot since start of the pandemic.
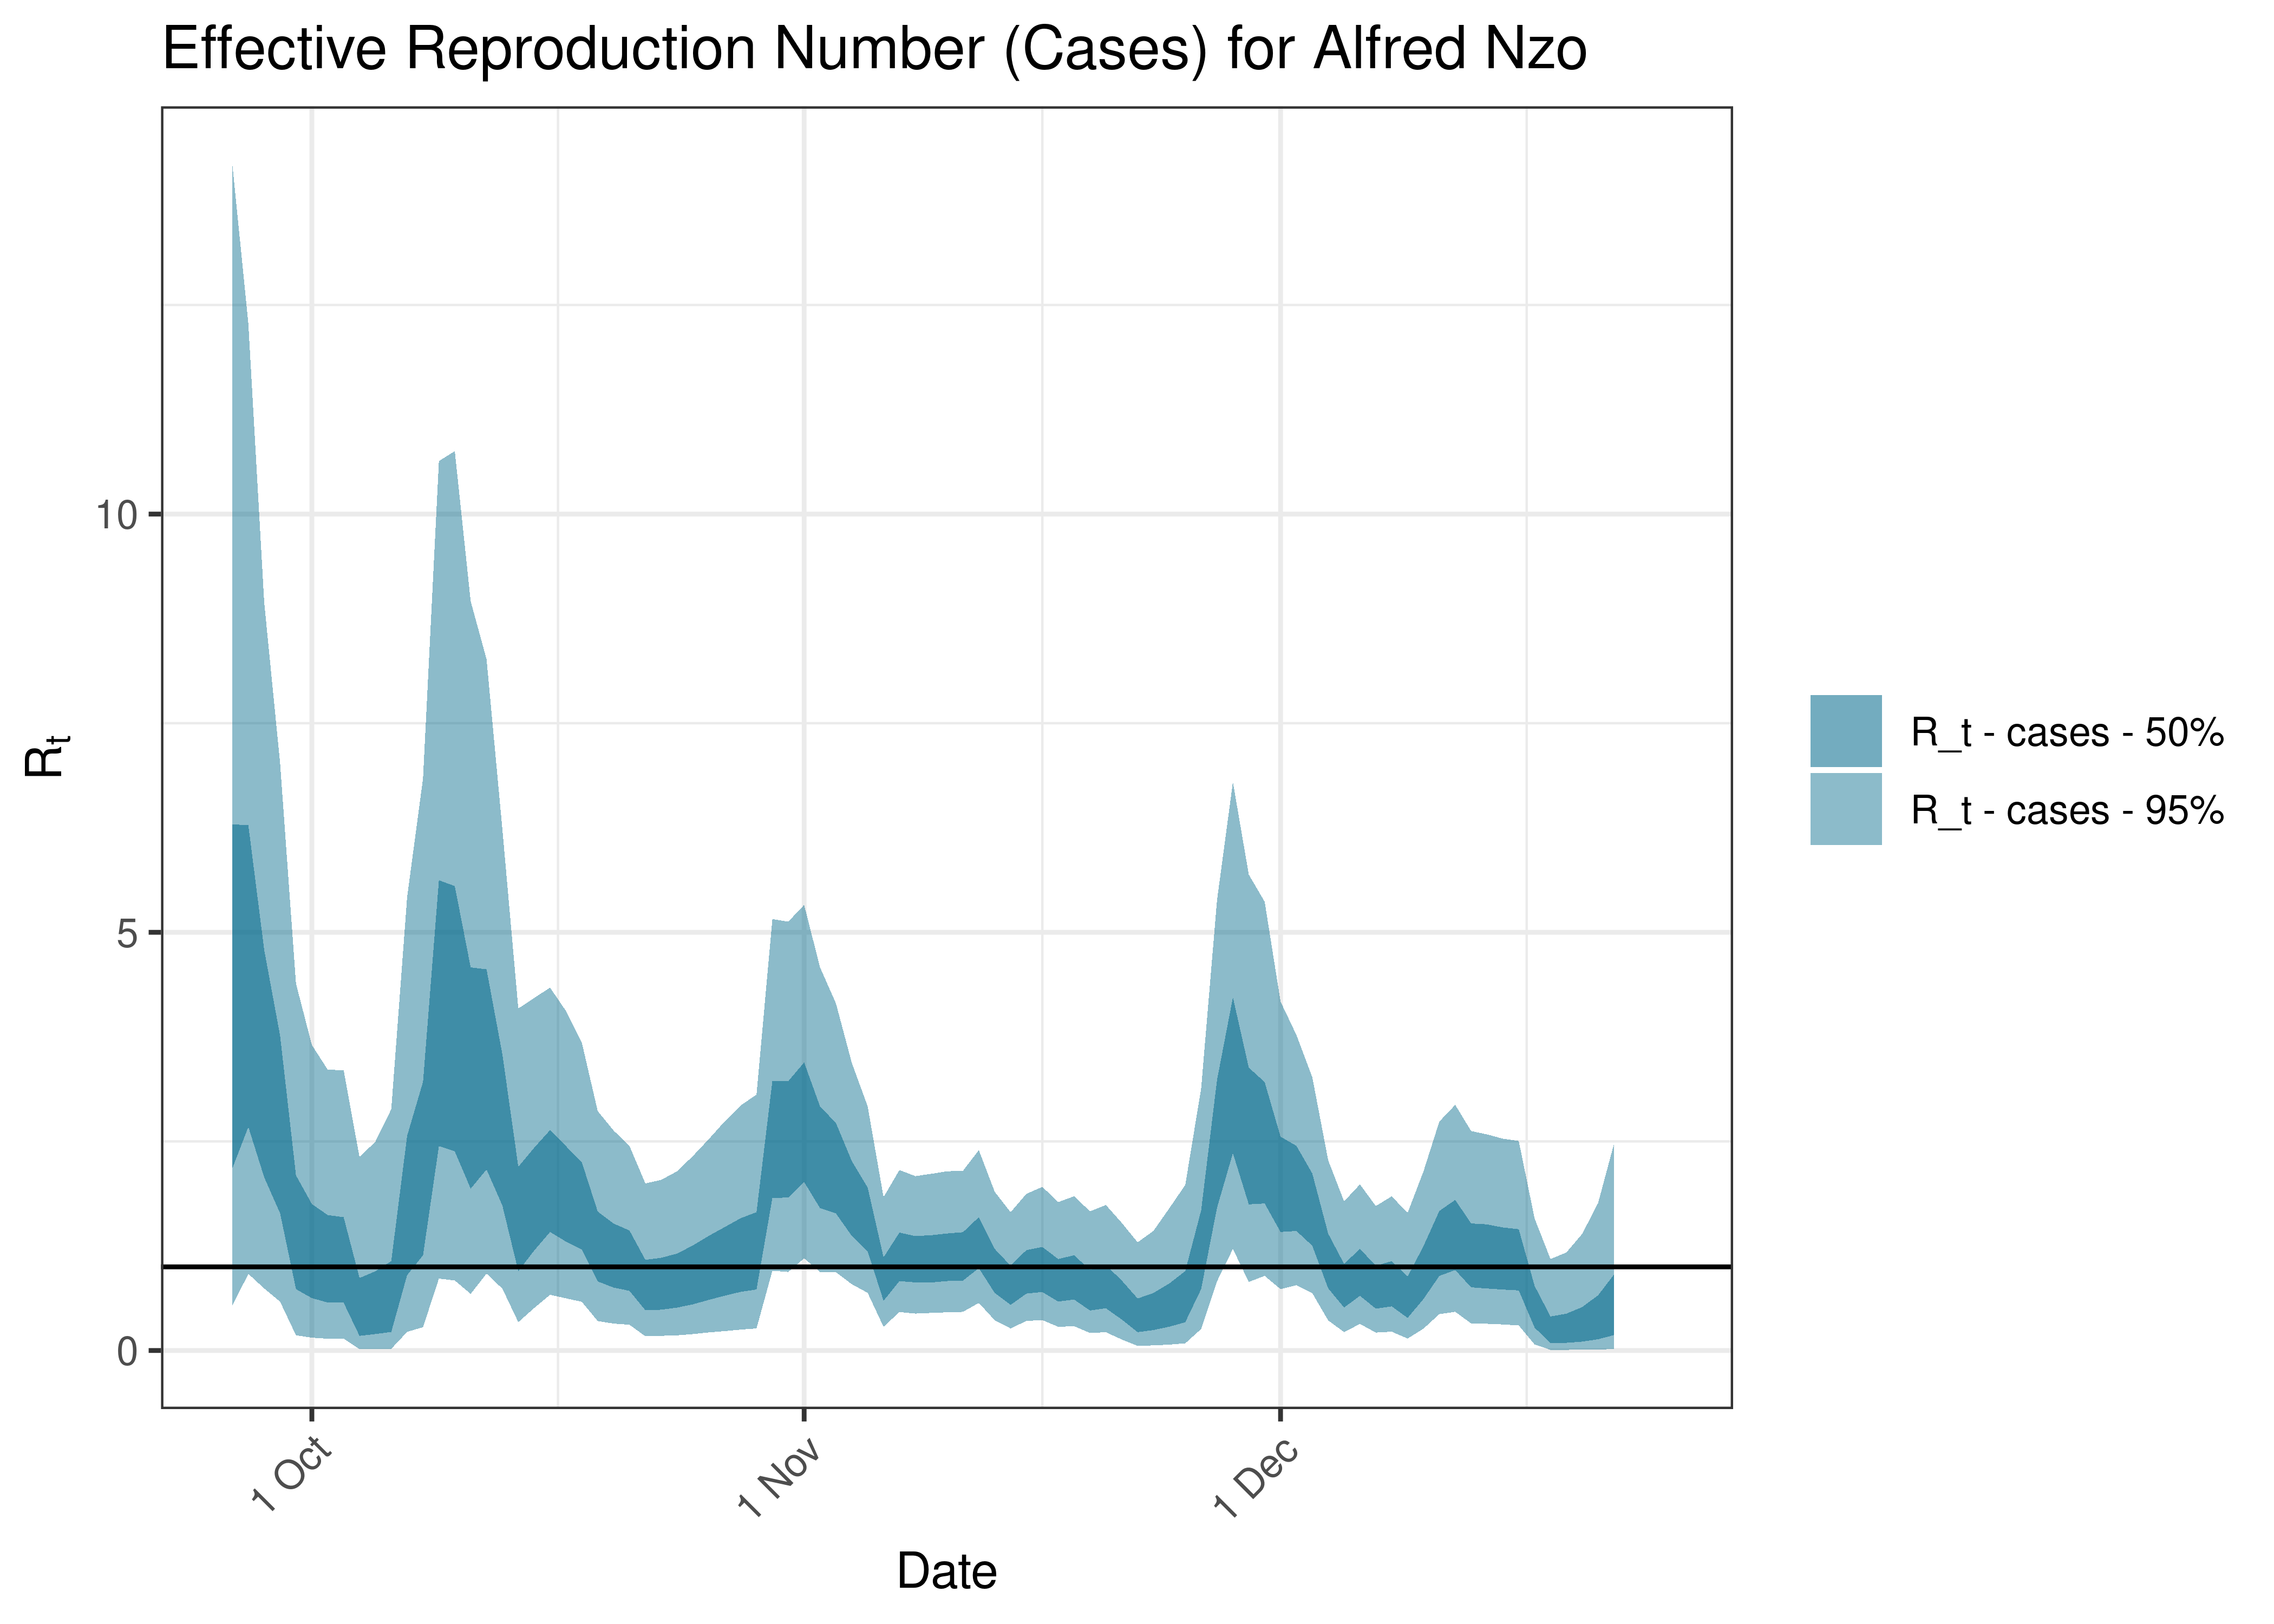
Estimated Effective Reproduction Number Based on Cases for Alfred Nzo over last 90 days
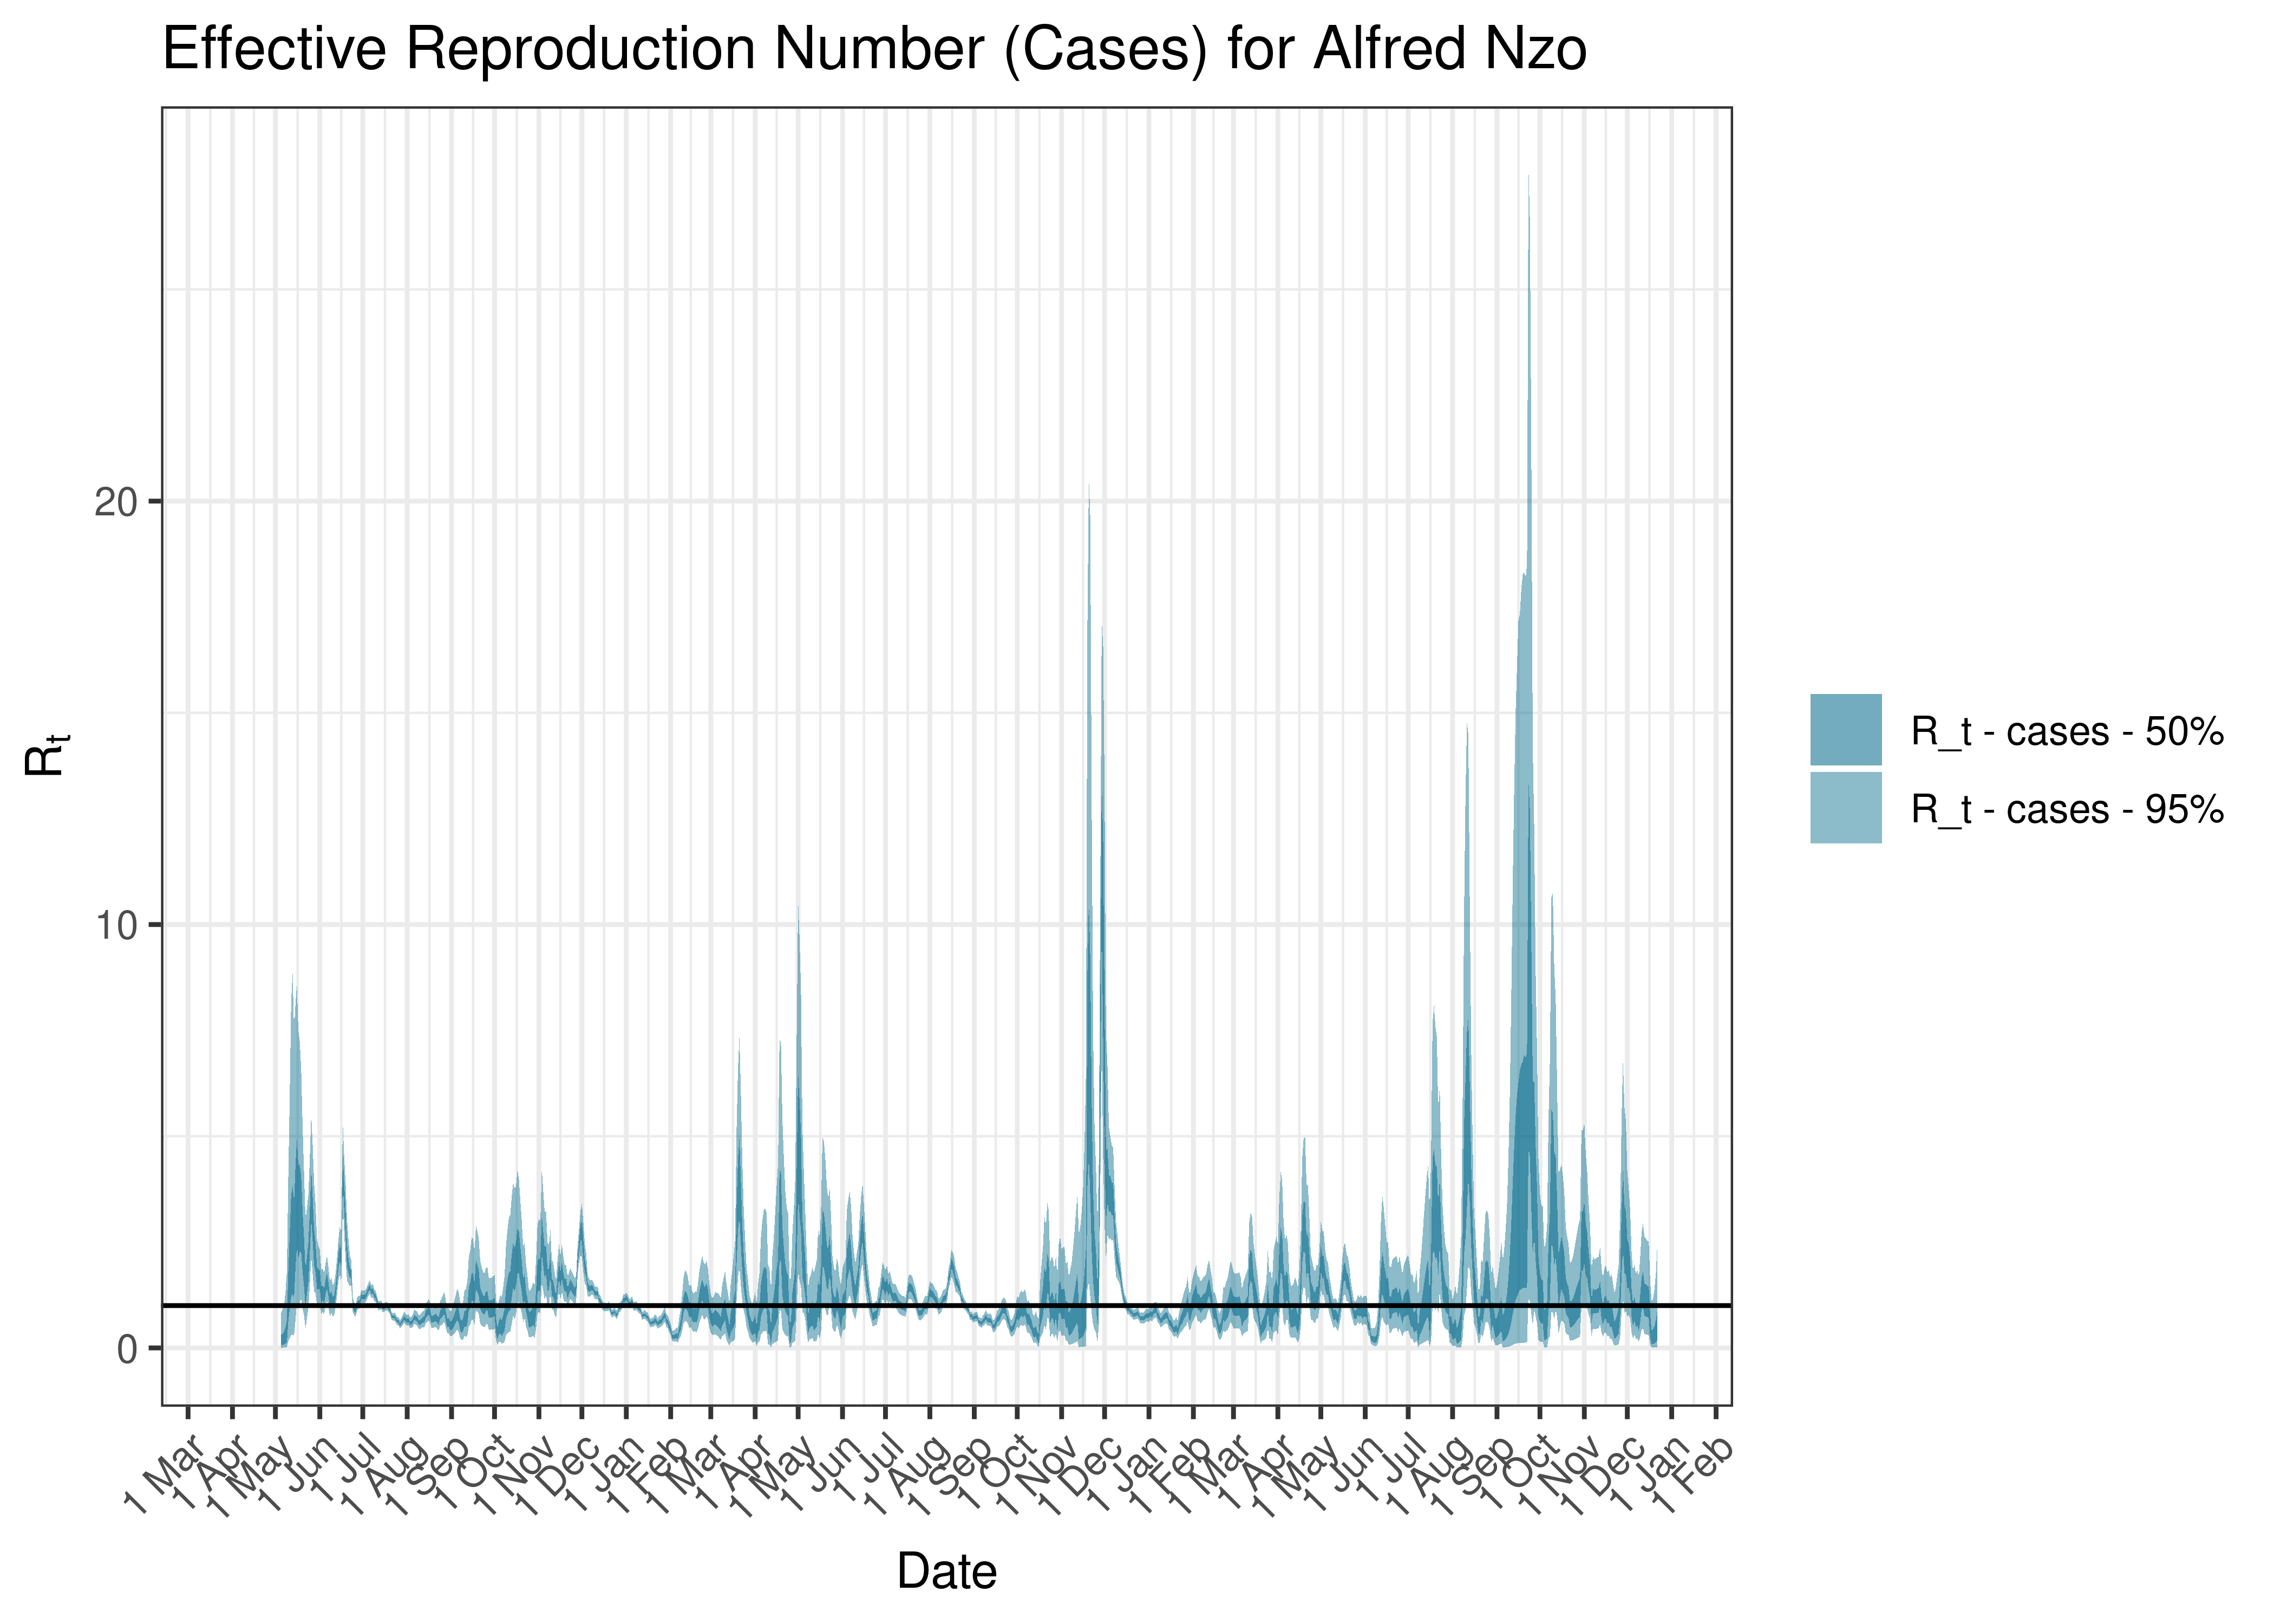
Estimated Effective Reproduction Number Based on Cases for Alfred Nzo since 1 April 2020
6.2.9 Amathole
6.2.9.1 Cases
Cases are tabulated by specimen received date below. Cases include estimates for late reporting in recent days as well as adjustments for any public holidays. A centred 7-day moving average is also shown. The peak daily cases in previous waves (as measured by the moving average) is also shown.
| Specimen Received Date | Cases | 7-day Moving Average | Comment |
|---|---|---|---|
| 2020-06-29 | 113 | 173 | Wave 1 Peak |
| 2020-12-13 | 31 | 198 | Wave 2 Peak |
| 2021-08-26 | 206 | 167 | Wave 3 Peak |
| 2021-12-14 | 115 | 125 | Wave 4 Peak |
| 2022-05-14 | 6 | 18 | Wave 5 Peak (to date) |
Below a 7-day moving average daily case count are plotted for Amathole on a log scale since start of the epidemic:
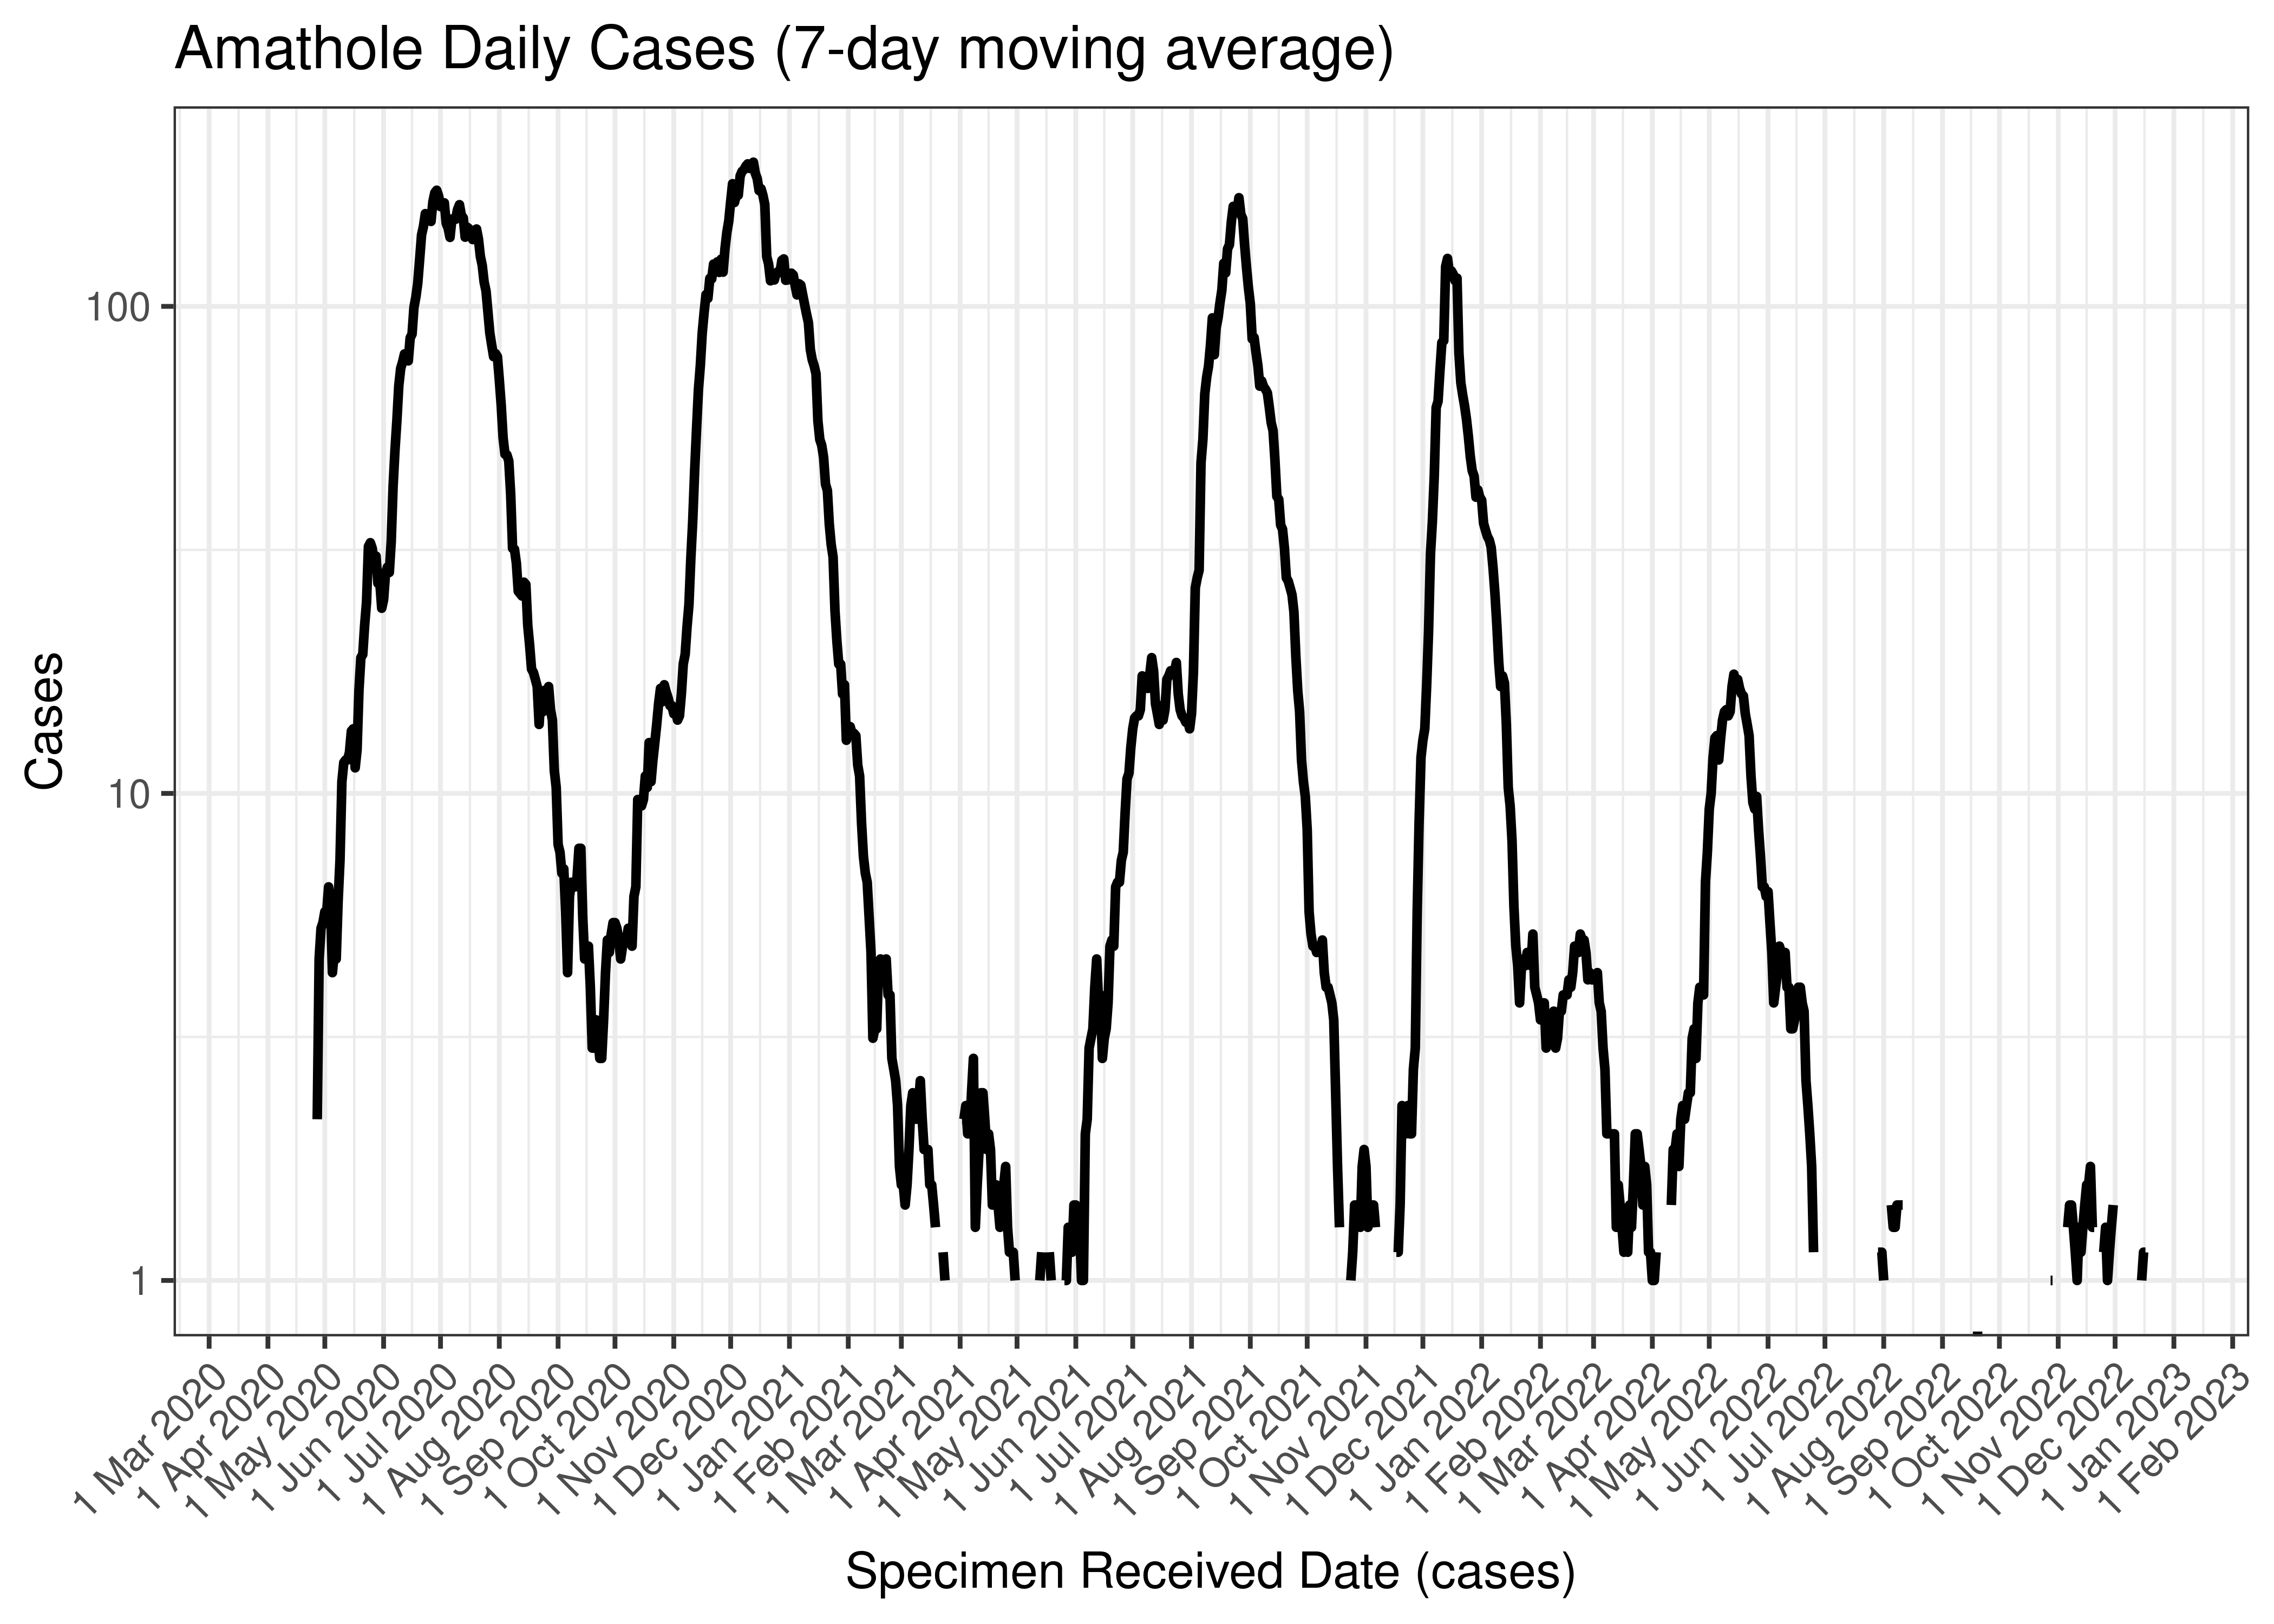
Amathole Daily Cases (7-day moving average)
Below the above chart is repeated for the last 30-days:

Amathole Daily Cases for Last 30-days (7-day moving average)
6.2.9.2 Reproduction Number
Below current (last weekly) reproduction number estimates are tabulated for Amathole.
| Count (Per Day) | Week Ending | Reproduction Number [95% Confidence Interval] | |
|---|---|---|---|
| Amathole | 0.1 | 2022-12-25 | 0.34 [0.04 - 0.95] |
Below the effective reproduction number for Amathole over the last 90 days are plotted together with a plot since start of the pandemic.
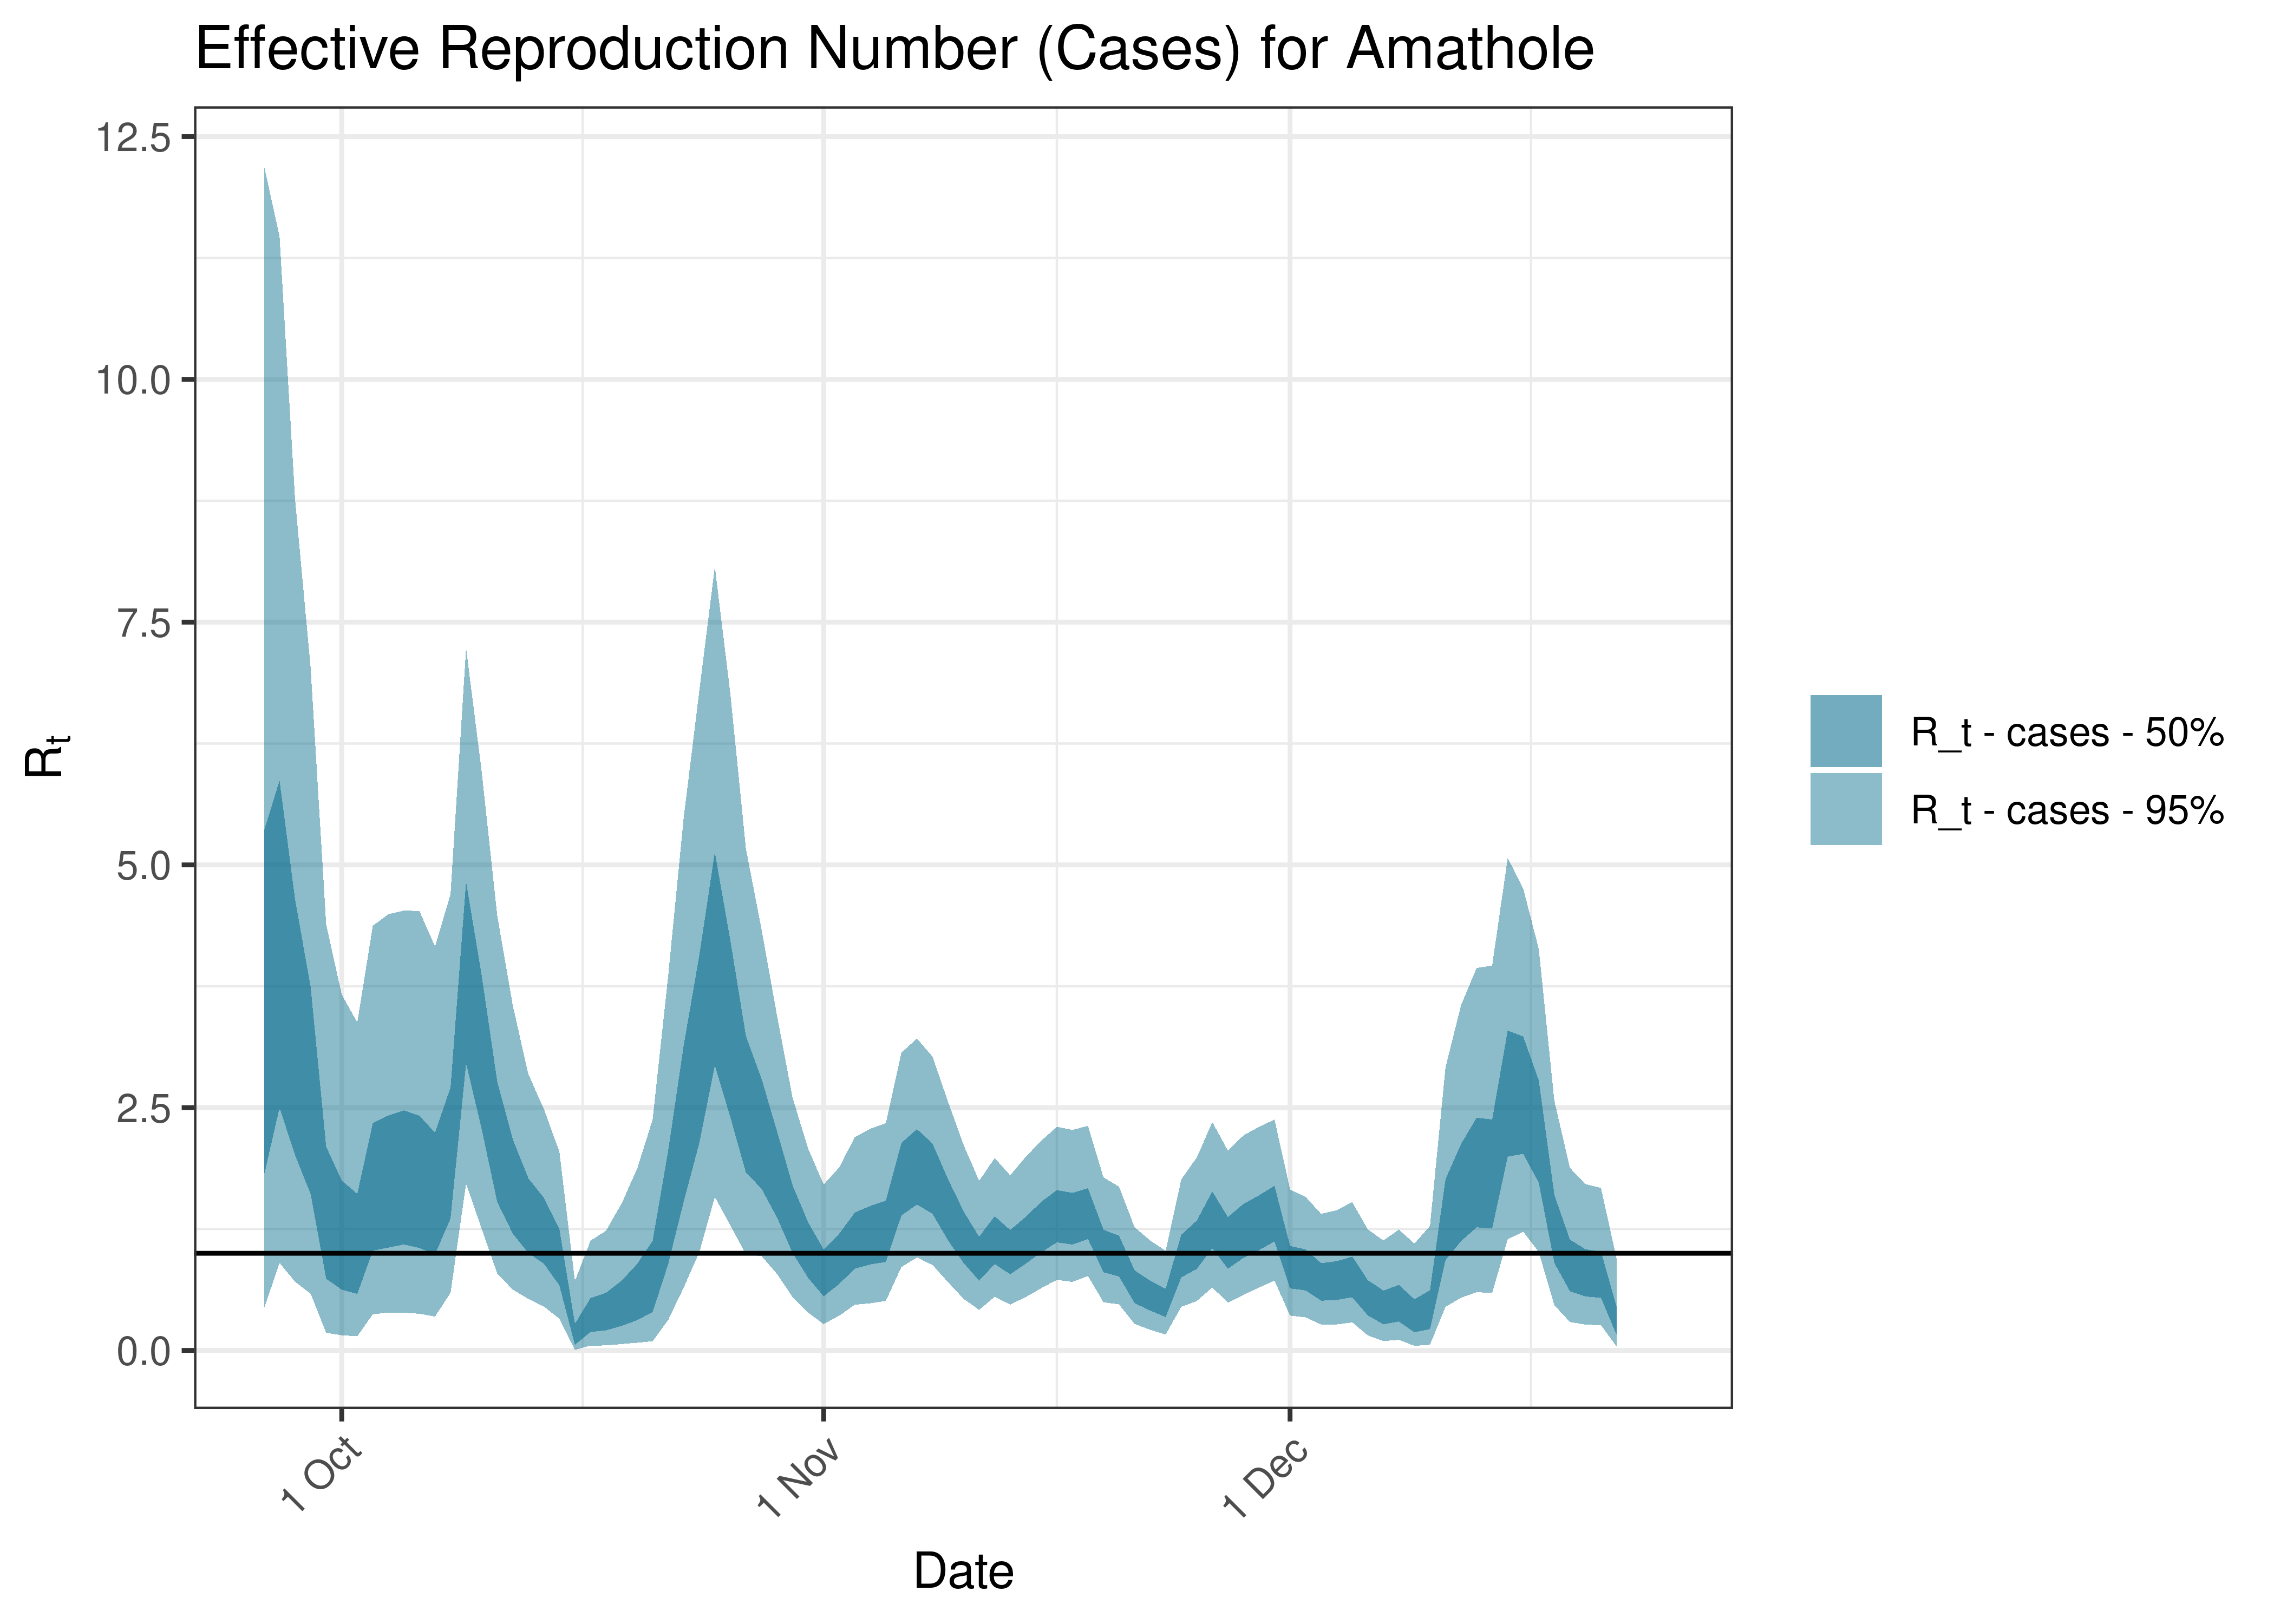
Estimated Effective Reproduction Number Based on Cases for Amathole over last 90 days
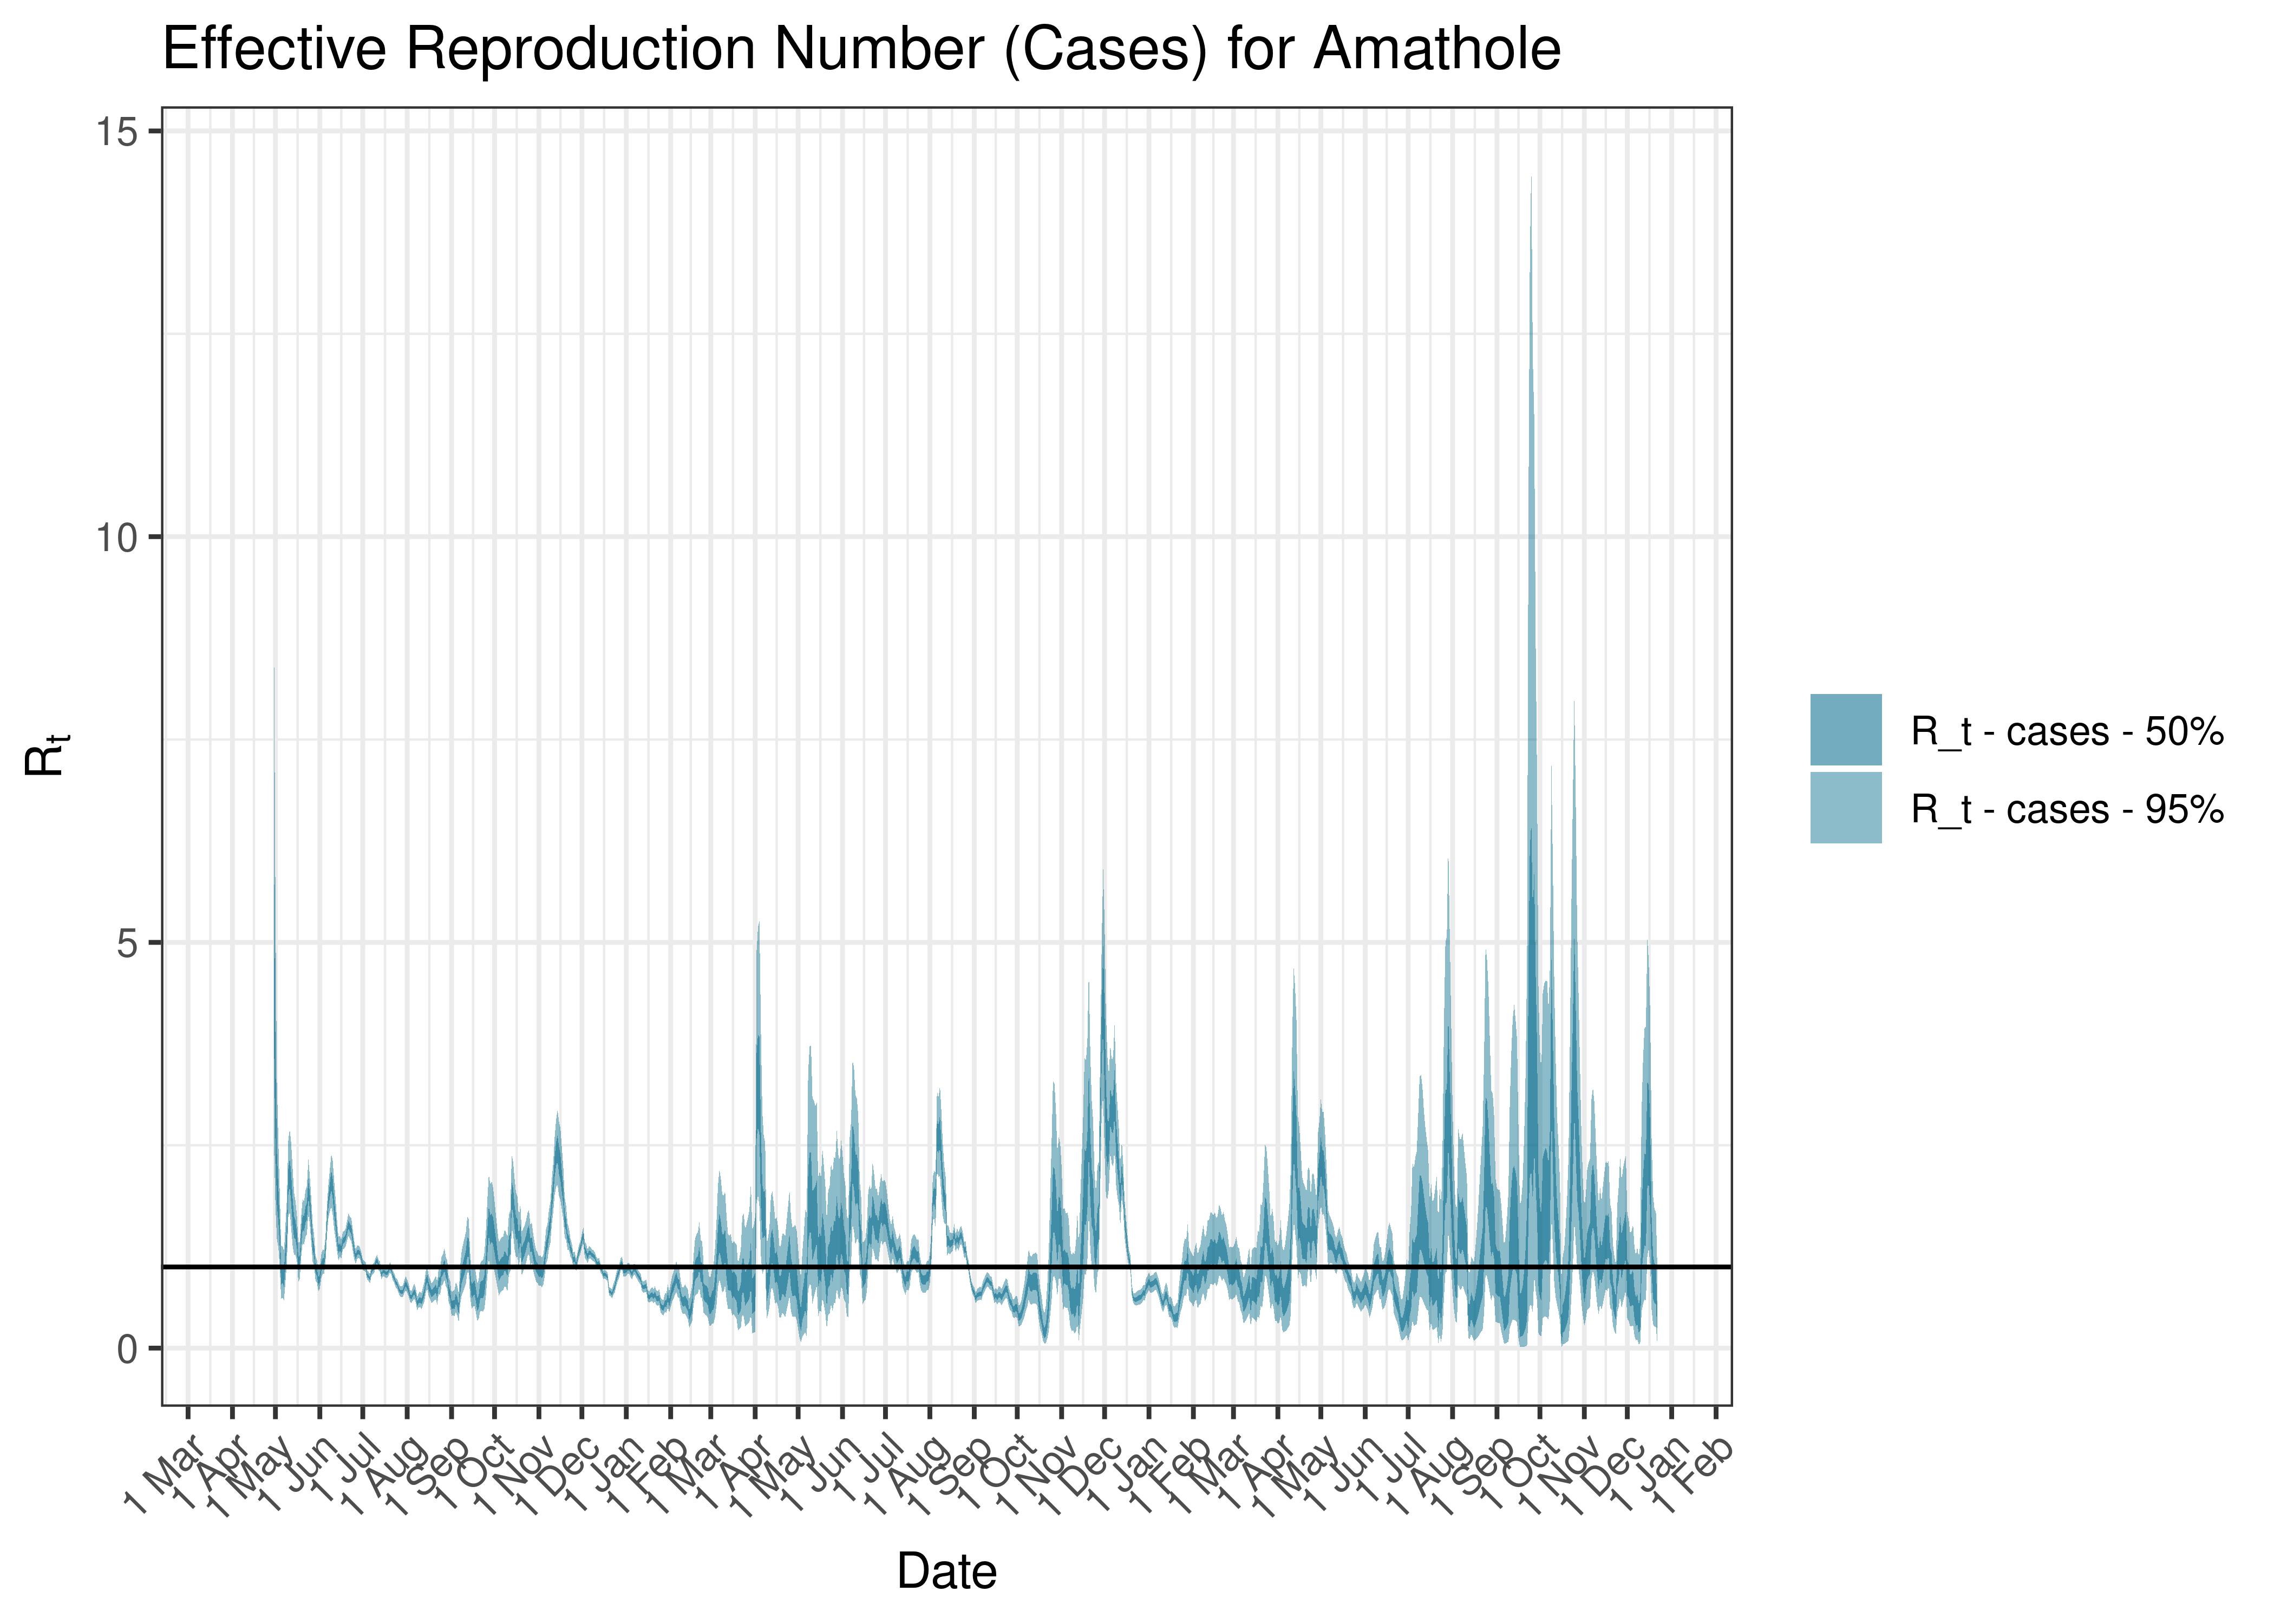
Estimated Effective Reproduction Number Based on Cases for Amathole since 1 April 2020
6.2.10 Buffalo City Metro
6.2.10.1 Cases
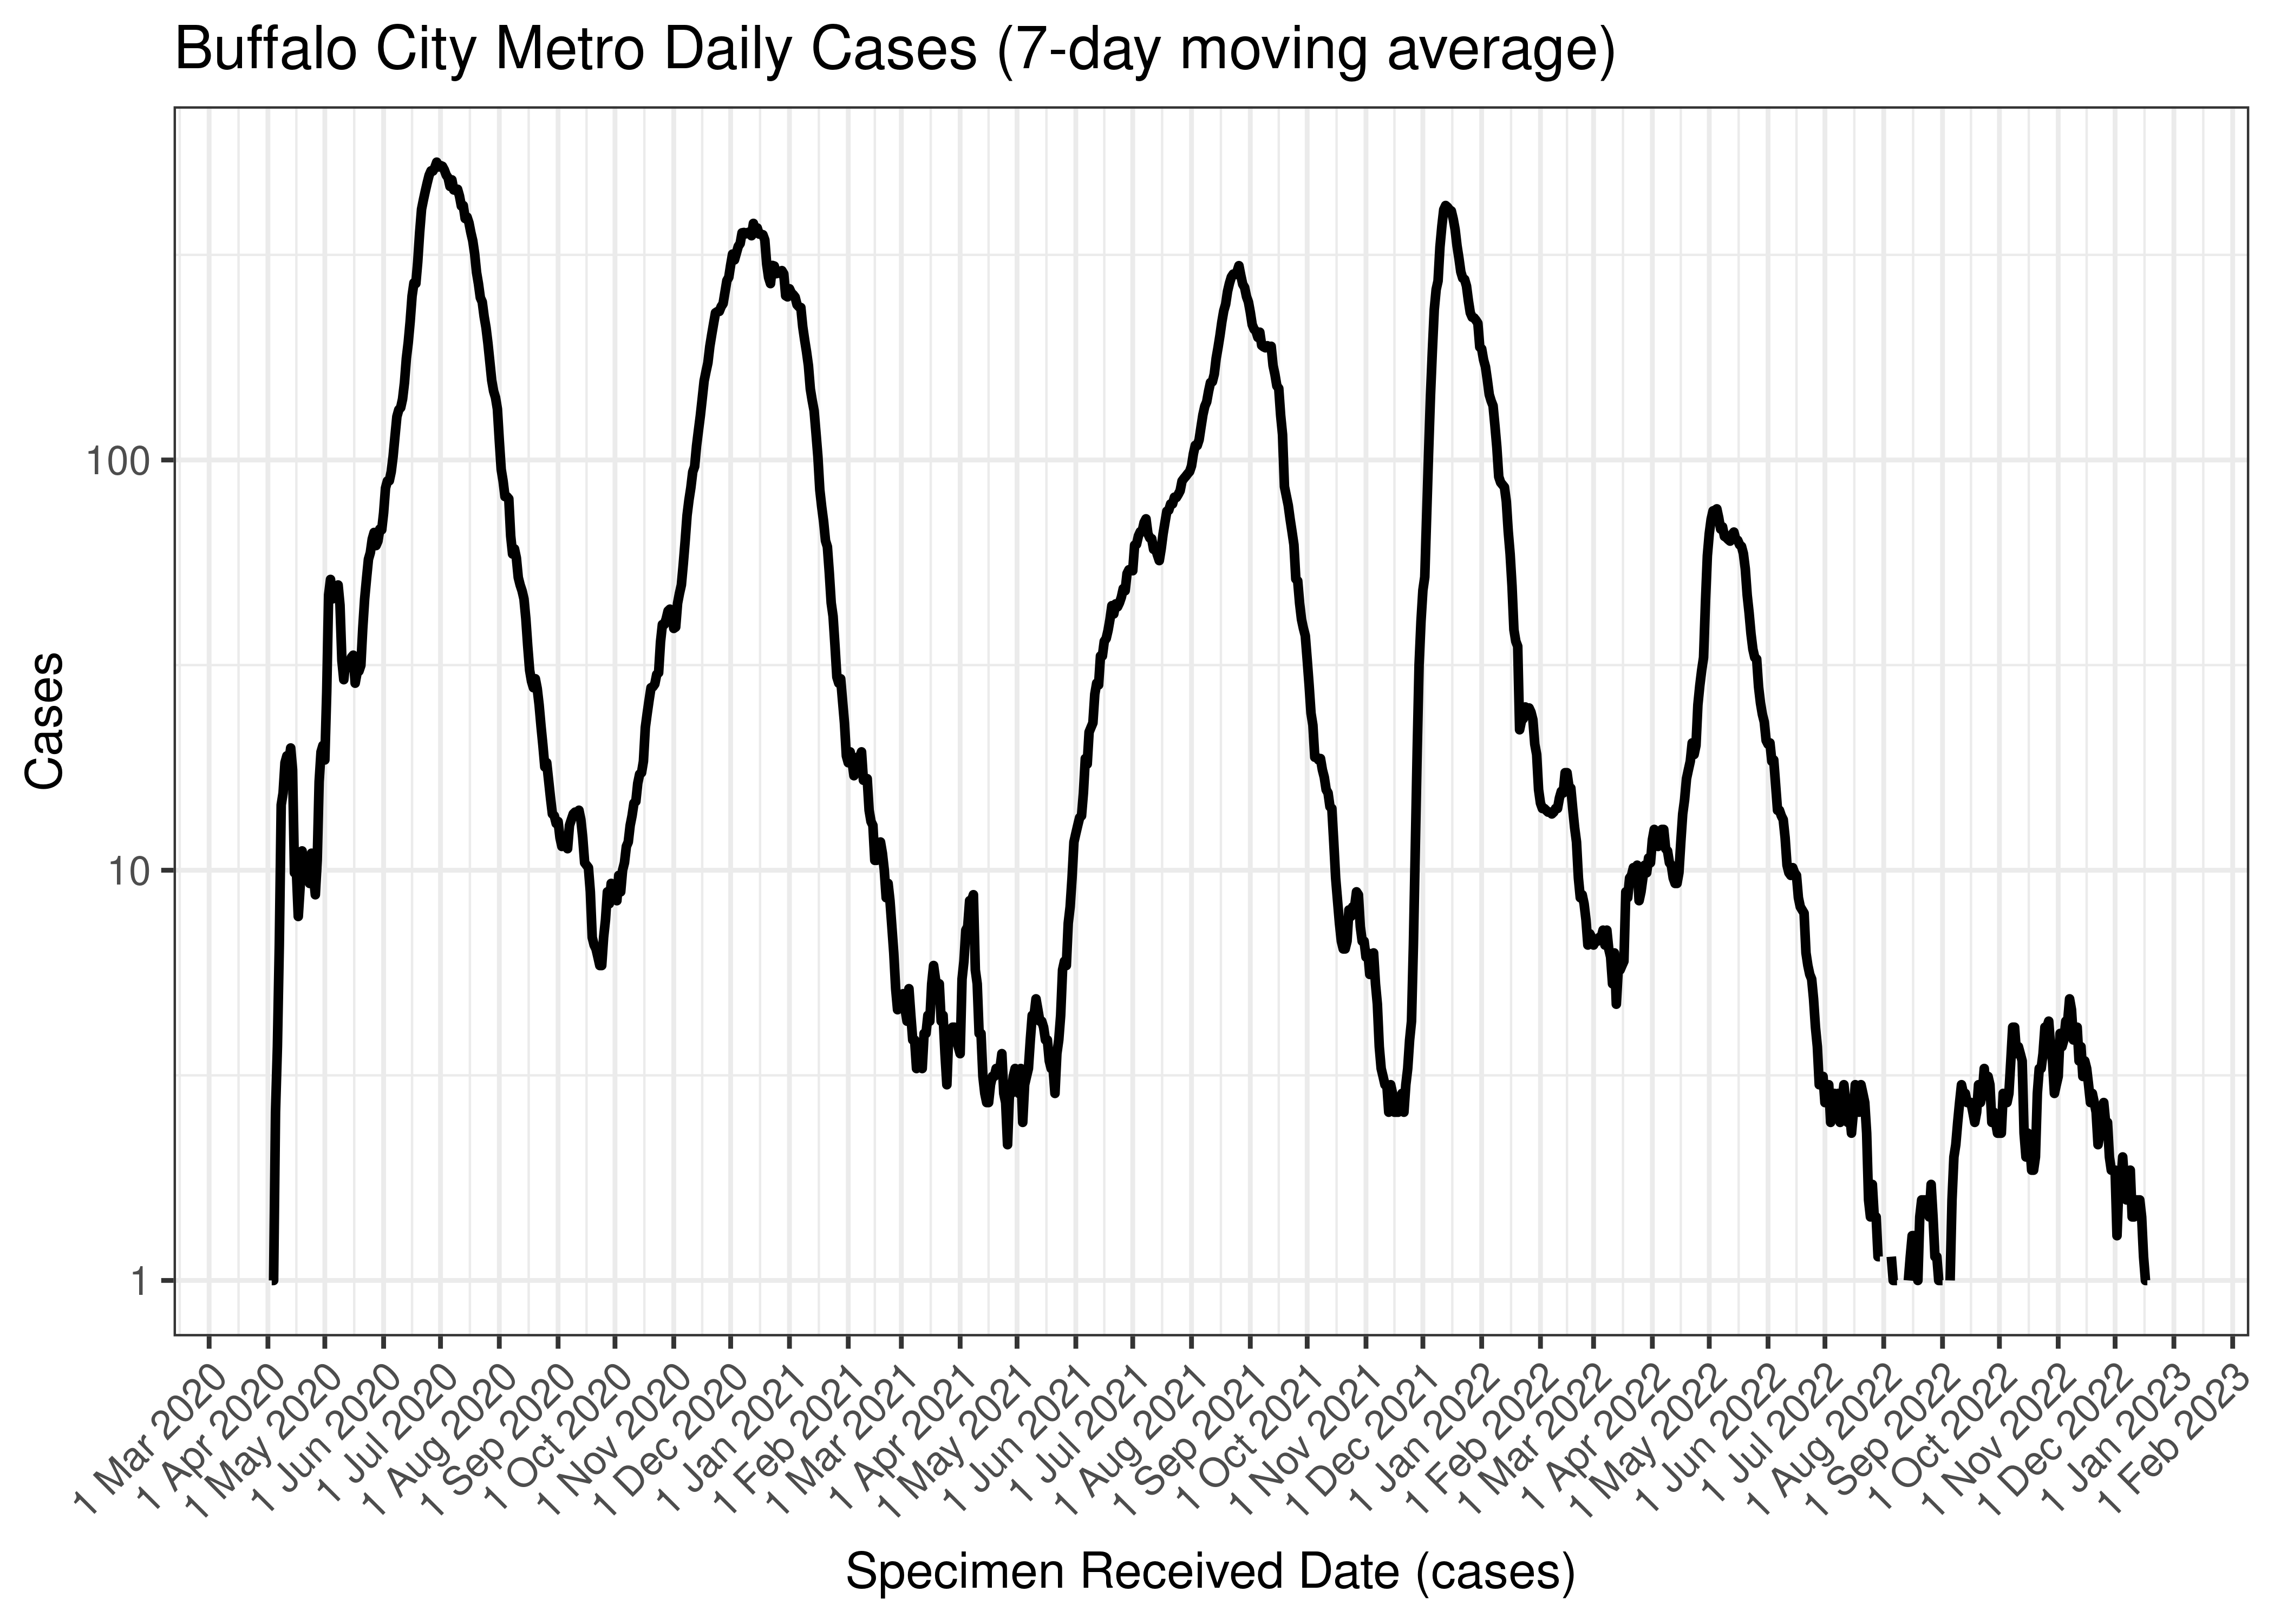
Cases are tabulated by specimen received date below. Cases include estimates for late reporting in recent days as well as adjustments for any public holidays. A centred 7-day moving average is also shown. The peak daily cases in previous waves (as measured by the moving average) is also shown.
| Specimen Received Date | Cases | 7-day Moving Average | Comment |
|---|---|---|---|
| 2020-06-29 | 549 | 532 | Wave 1 Peak |
| 2020-12-13 | 105 | 377 | Wave 2 Peak |
| 2021-08-26 | 297 | 298 | Wave 3 Peak |
| 2021-12-13 | 577 | 417 | Wave 4 Peak |
| 2022-05-05 | 93 | 76 | Wave 5 Peak (to date) |
Below a 7-day moving average daily case count are plotted for Buffalo City Metro on a log scale since start of the epidemic:
Buffalo City Metro Daily Cases (7-day moving average)
Below the above chart is repeated for the last 30-days:

Buffalo City Metro Daily Cases for Last 30-days (7-day moving average)
6.2.10.2 Excess Deaths
Excess deaths are tabulated by date of death below. A centred 7-day moving average is also shown. The peak daily deaths in previous waves (as measured by the moving average) is also shown.
| Specimen Received Date | Excess Deaths | 7-day Moving Average | Comment |
|---|---|---|---|
| 2020-07-15 | 29 | 29 | Wave 1 Peak |
| 2020-12-23 | 40 | 40 | Wave 2 Peak |
| 2021-09-08 | 16 | 16 | Wave 3 Peak |
| 2021-12-22 | 16 | 16 | Wave 4 Peak |
| 2022-07-27 | 12 | 12 | Wave 5 Peak (to date) |
| 2022-12-03 | 5 | 6 | |
| 2022-12-04 | 7 | 6 | |
| 2022-12-05 | 7 | 6 | |
| 2022-12-06 | 7 | 6 | |
| 2022-12-07 | 7 | 7 | |
| 2022-12-08 | 7 | NA | |
| 2022-12-09 | 7 | NA | |
| 2022-12-10 | 7 | NA |
Below a 7-day moving average daily excess deaths is plotted for Buffalo City Metro on a log scale since start of the epidemic:
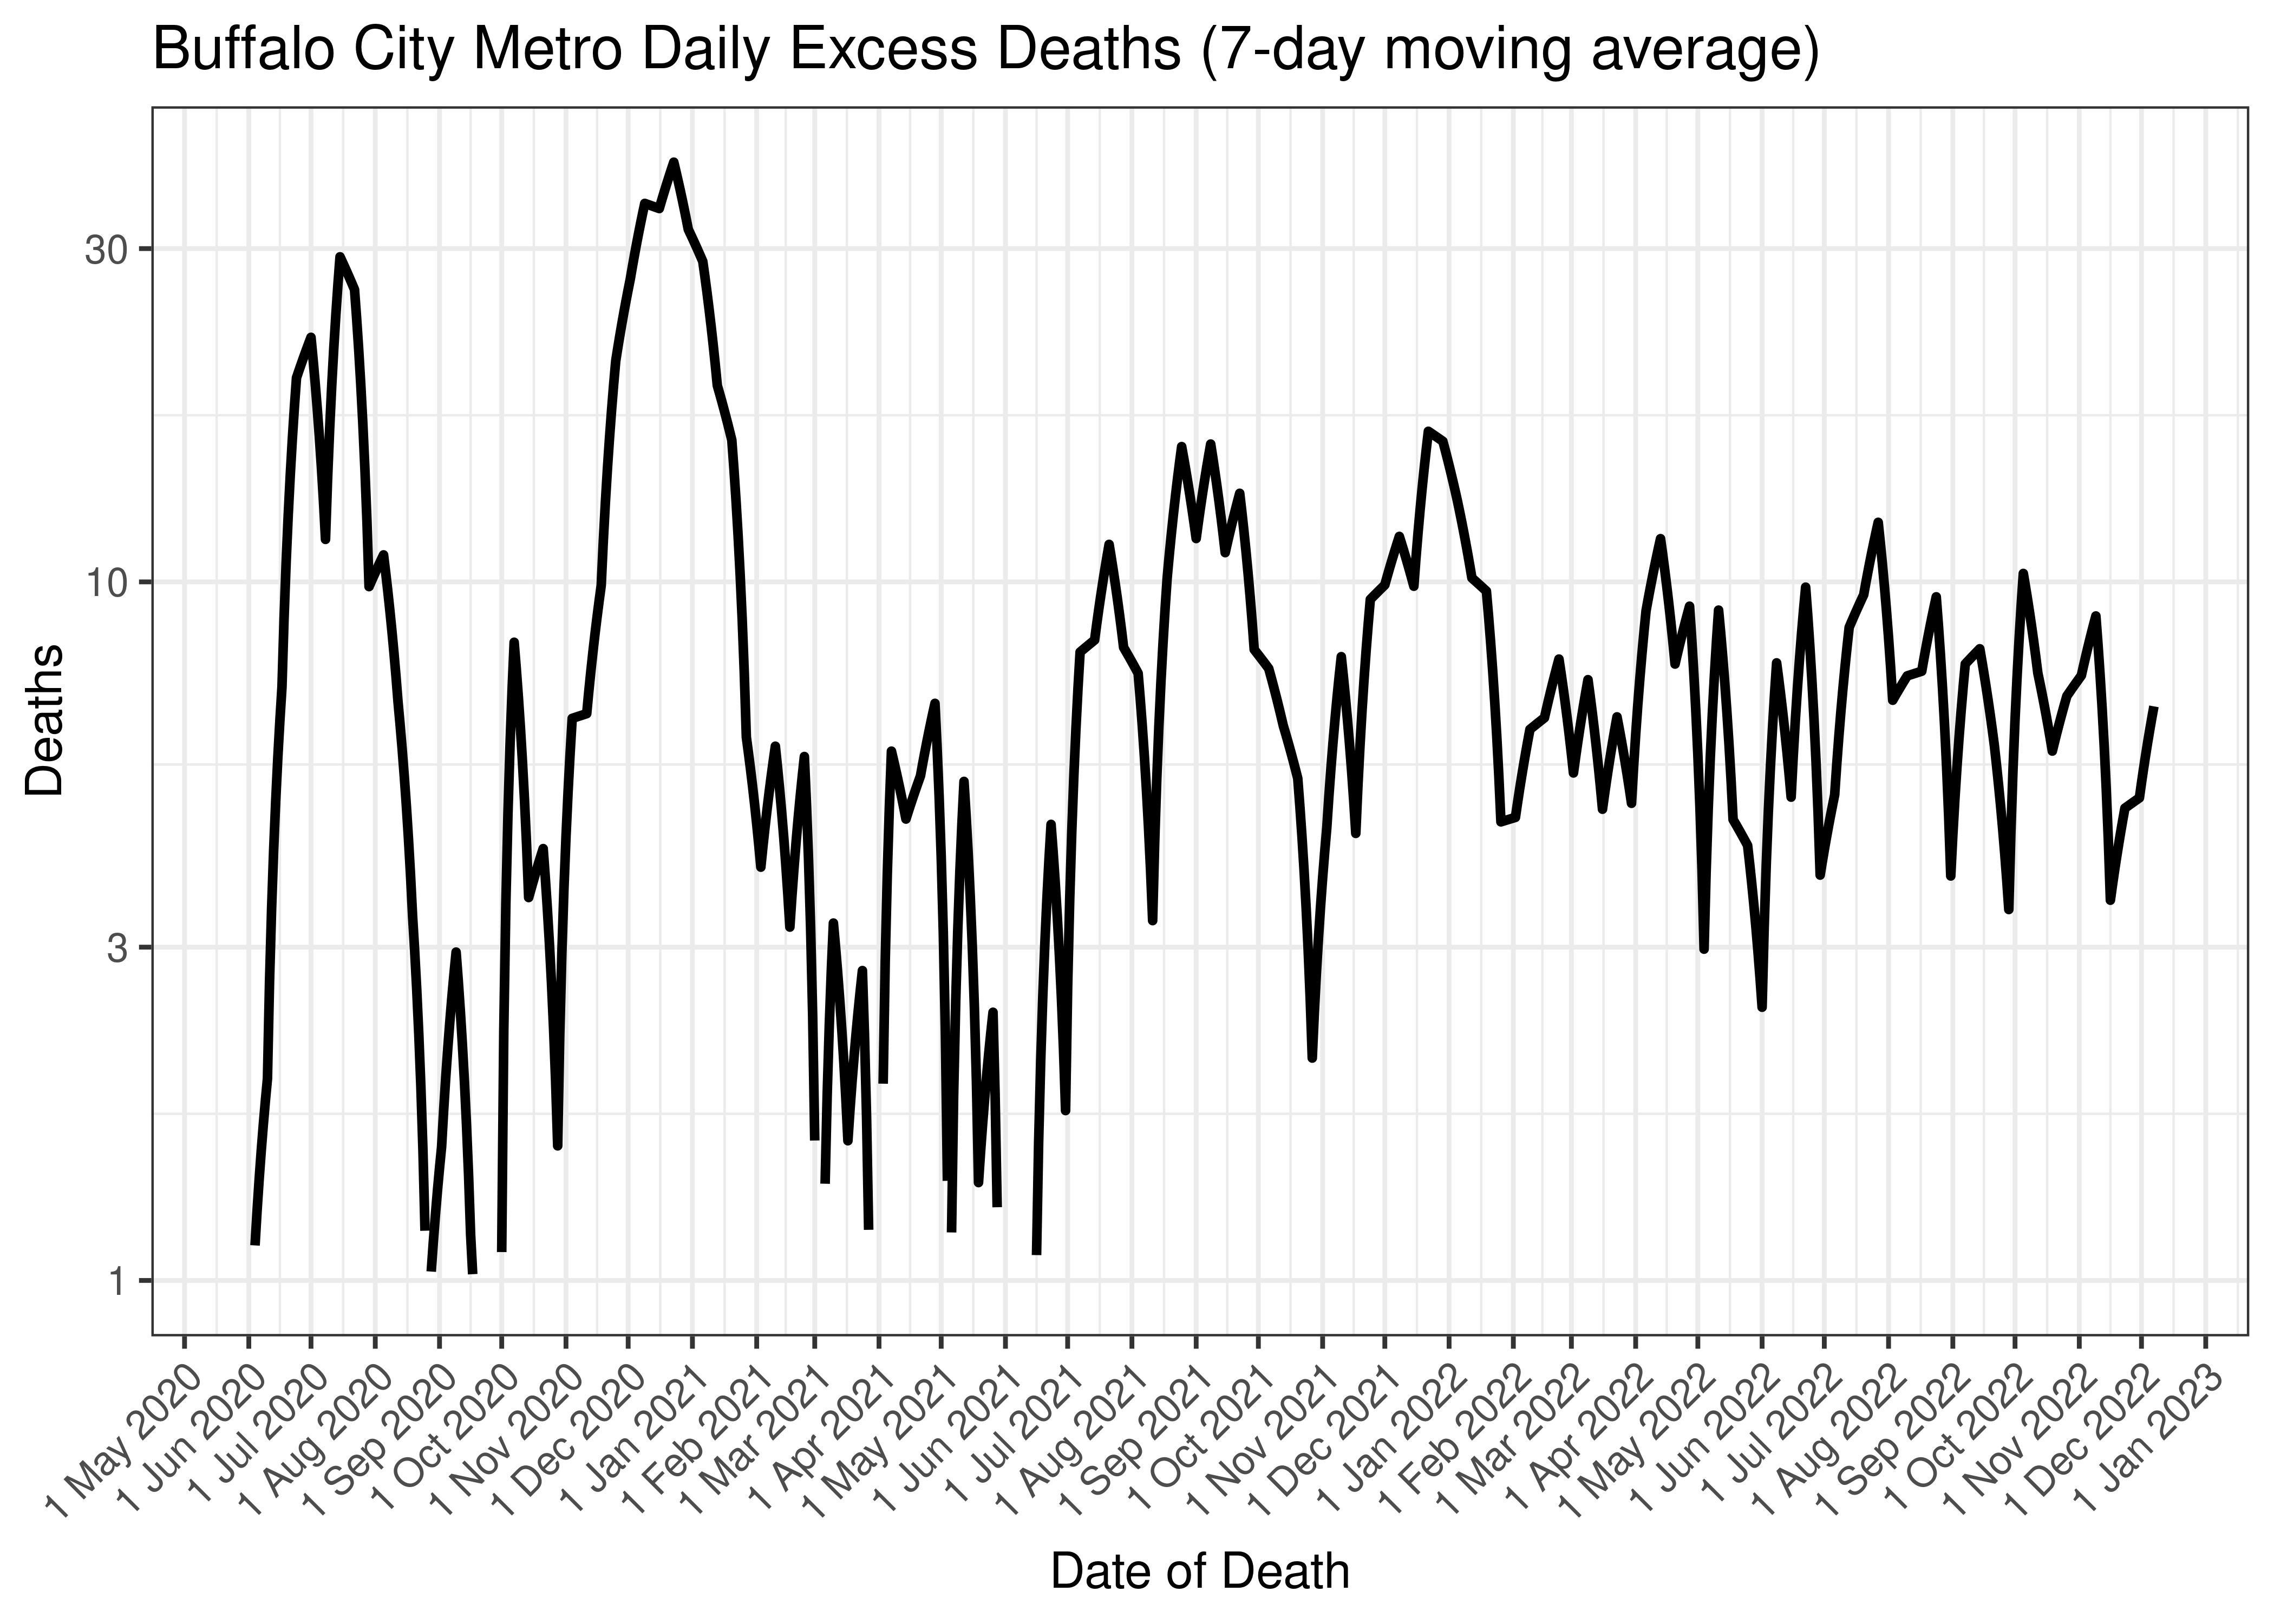
Buffalo City Metro Daily Excess Deaths (7-day moving average)
Below the above chart is repeated for the last 30-days:
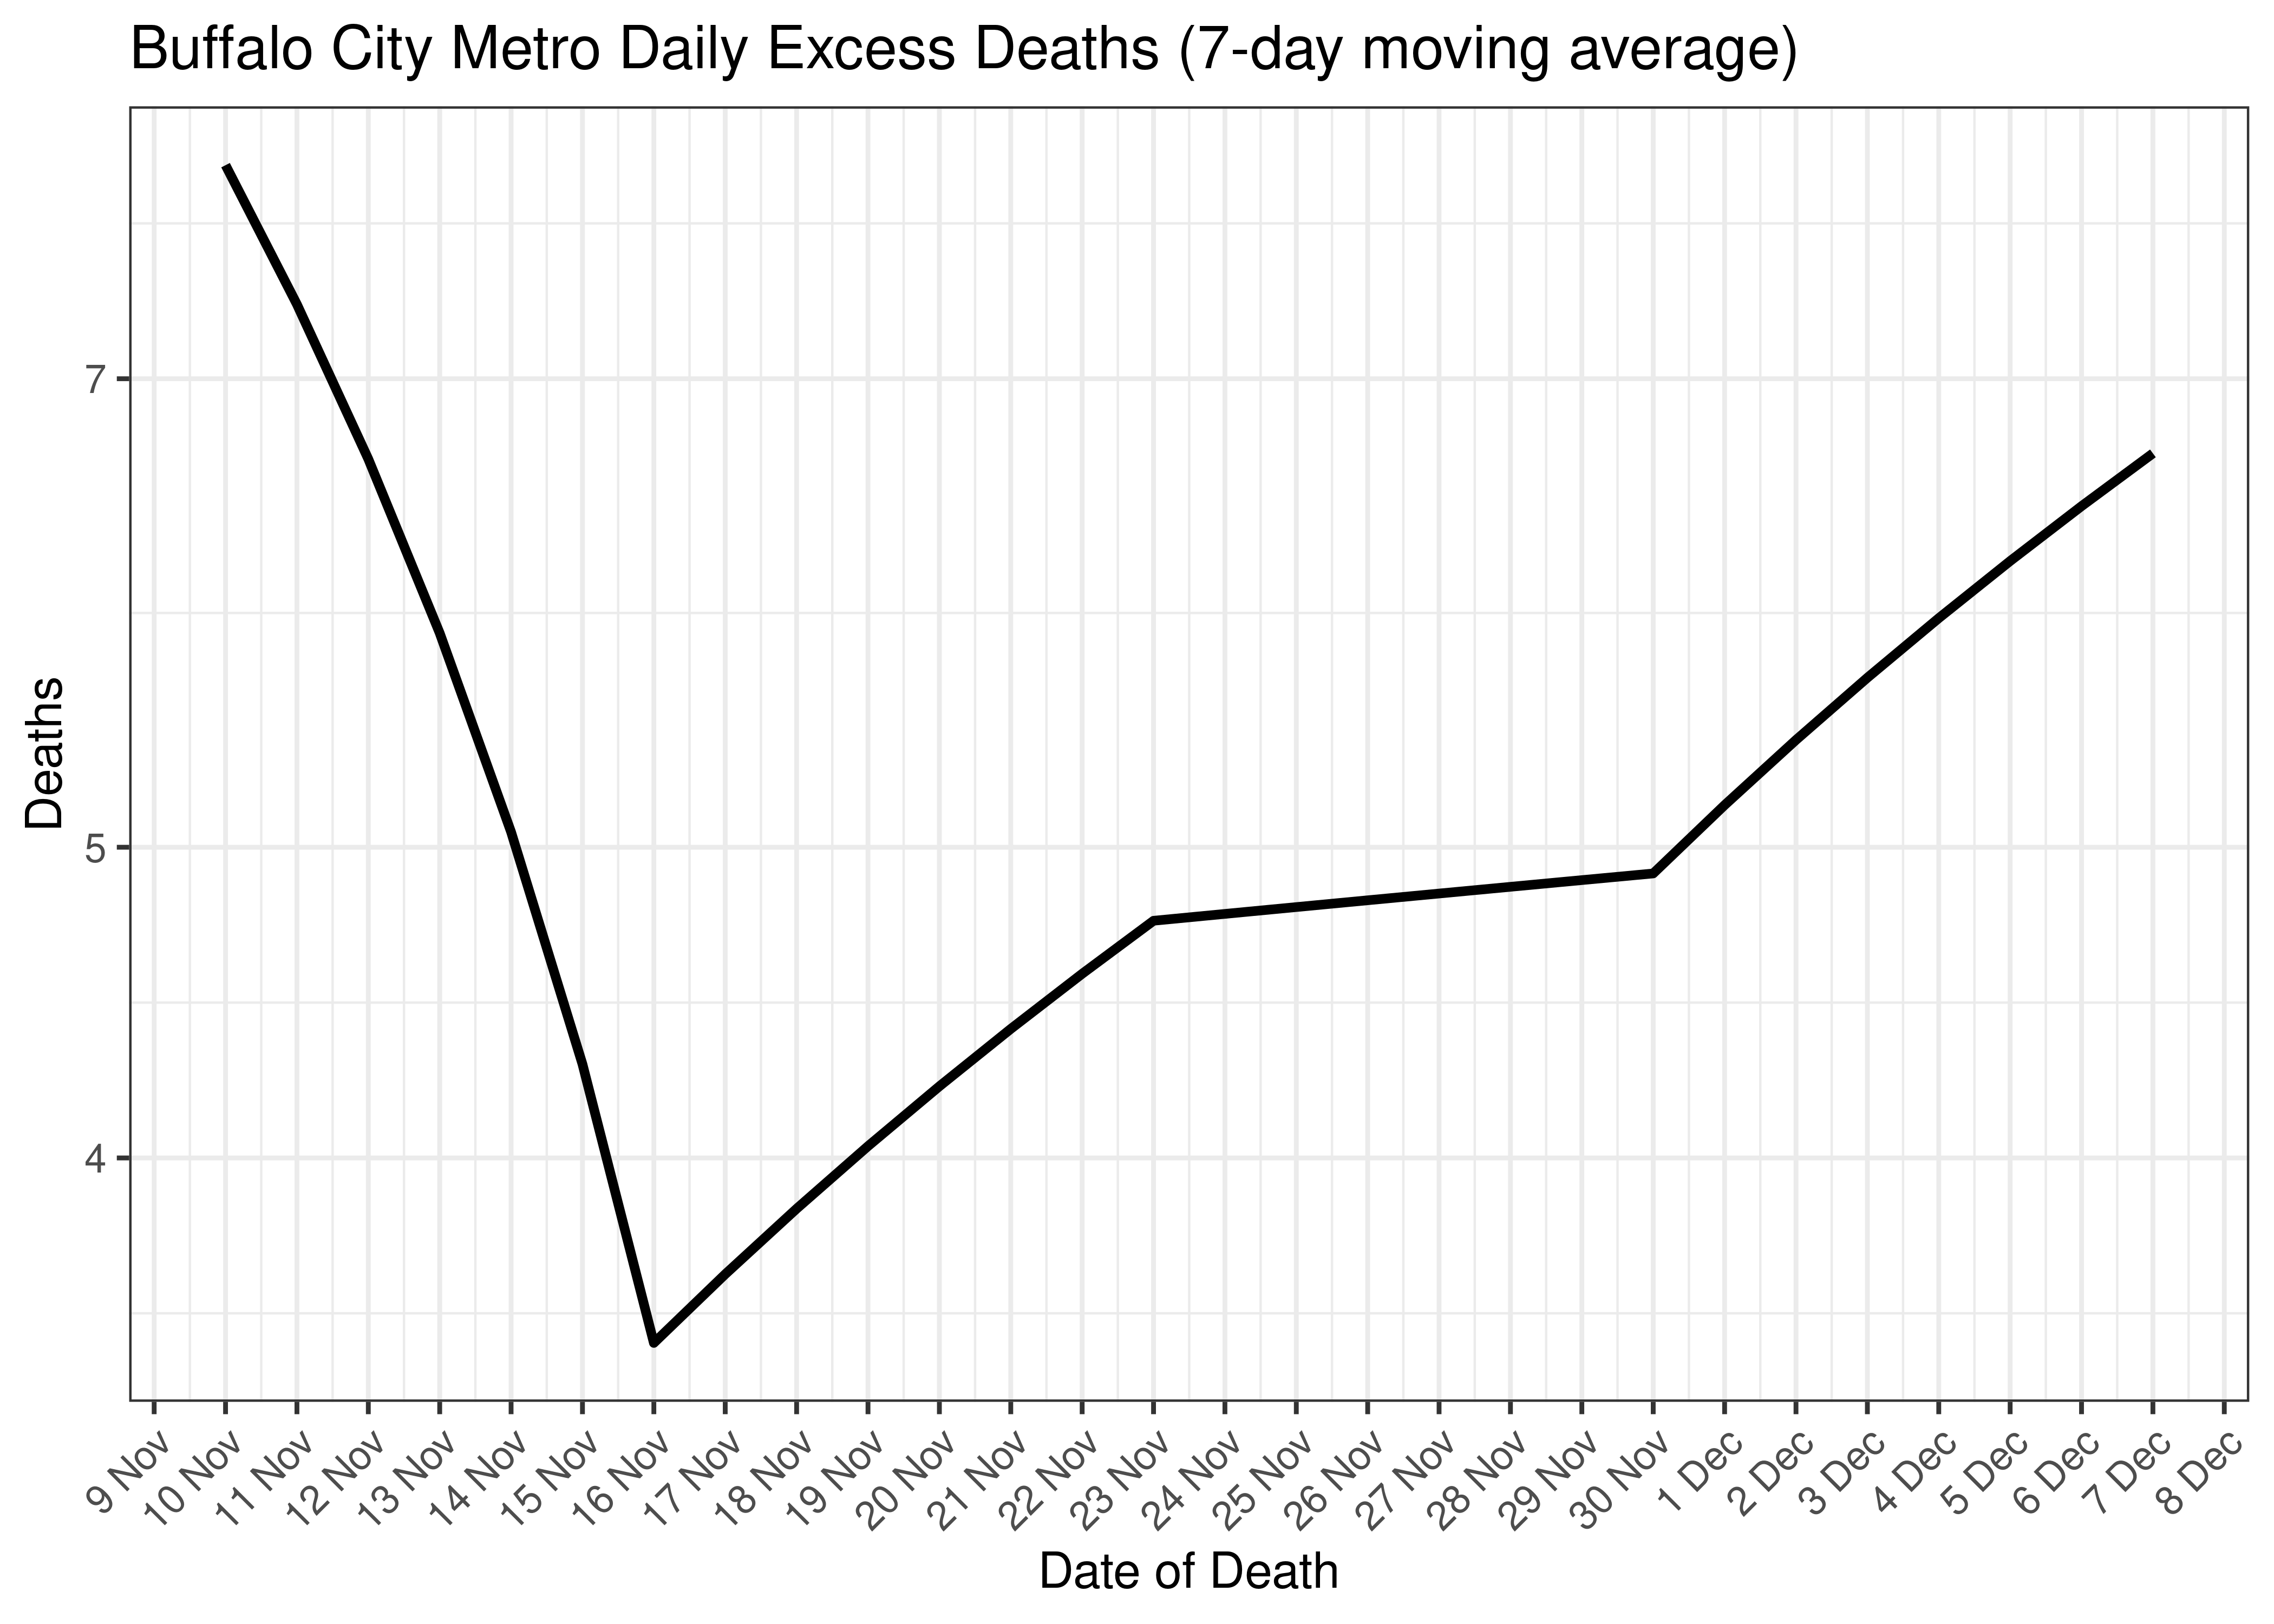
Buffalo City Metro Excess Deaths for Last 30-days (7-day moving average)
6.2.10.3 Cases and Excess Deaths Combined
Below a 7-day moving average daily case count and estimated daily excess deaths are plotted for Buffalo City Metro on a log scale since start of the epidemic:
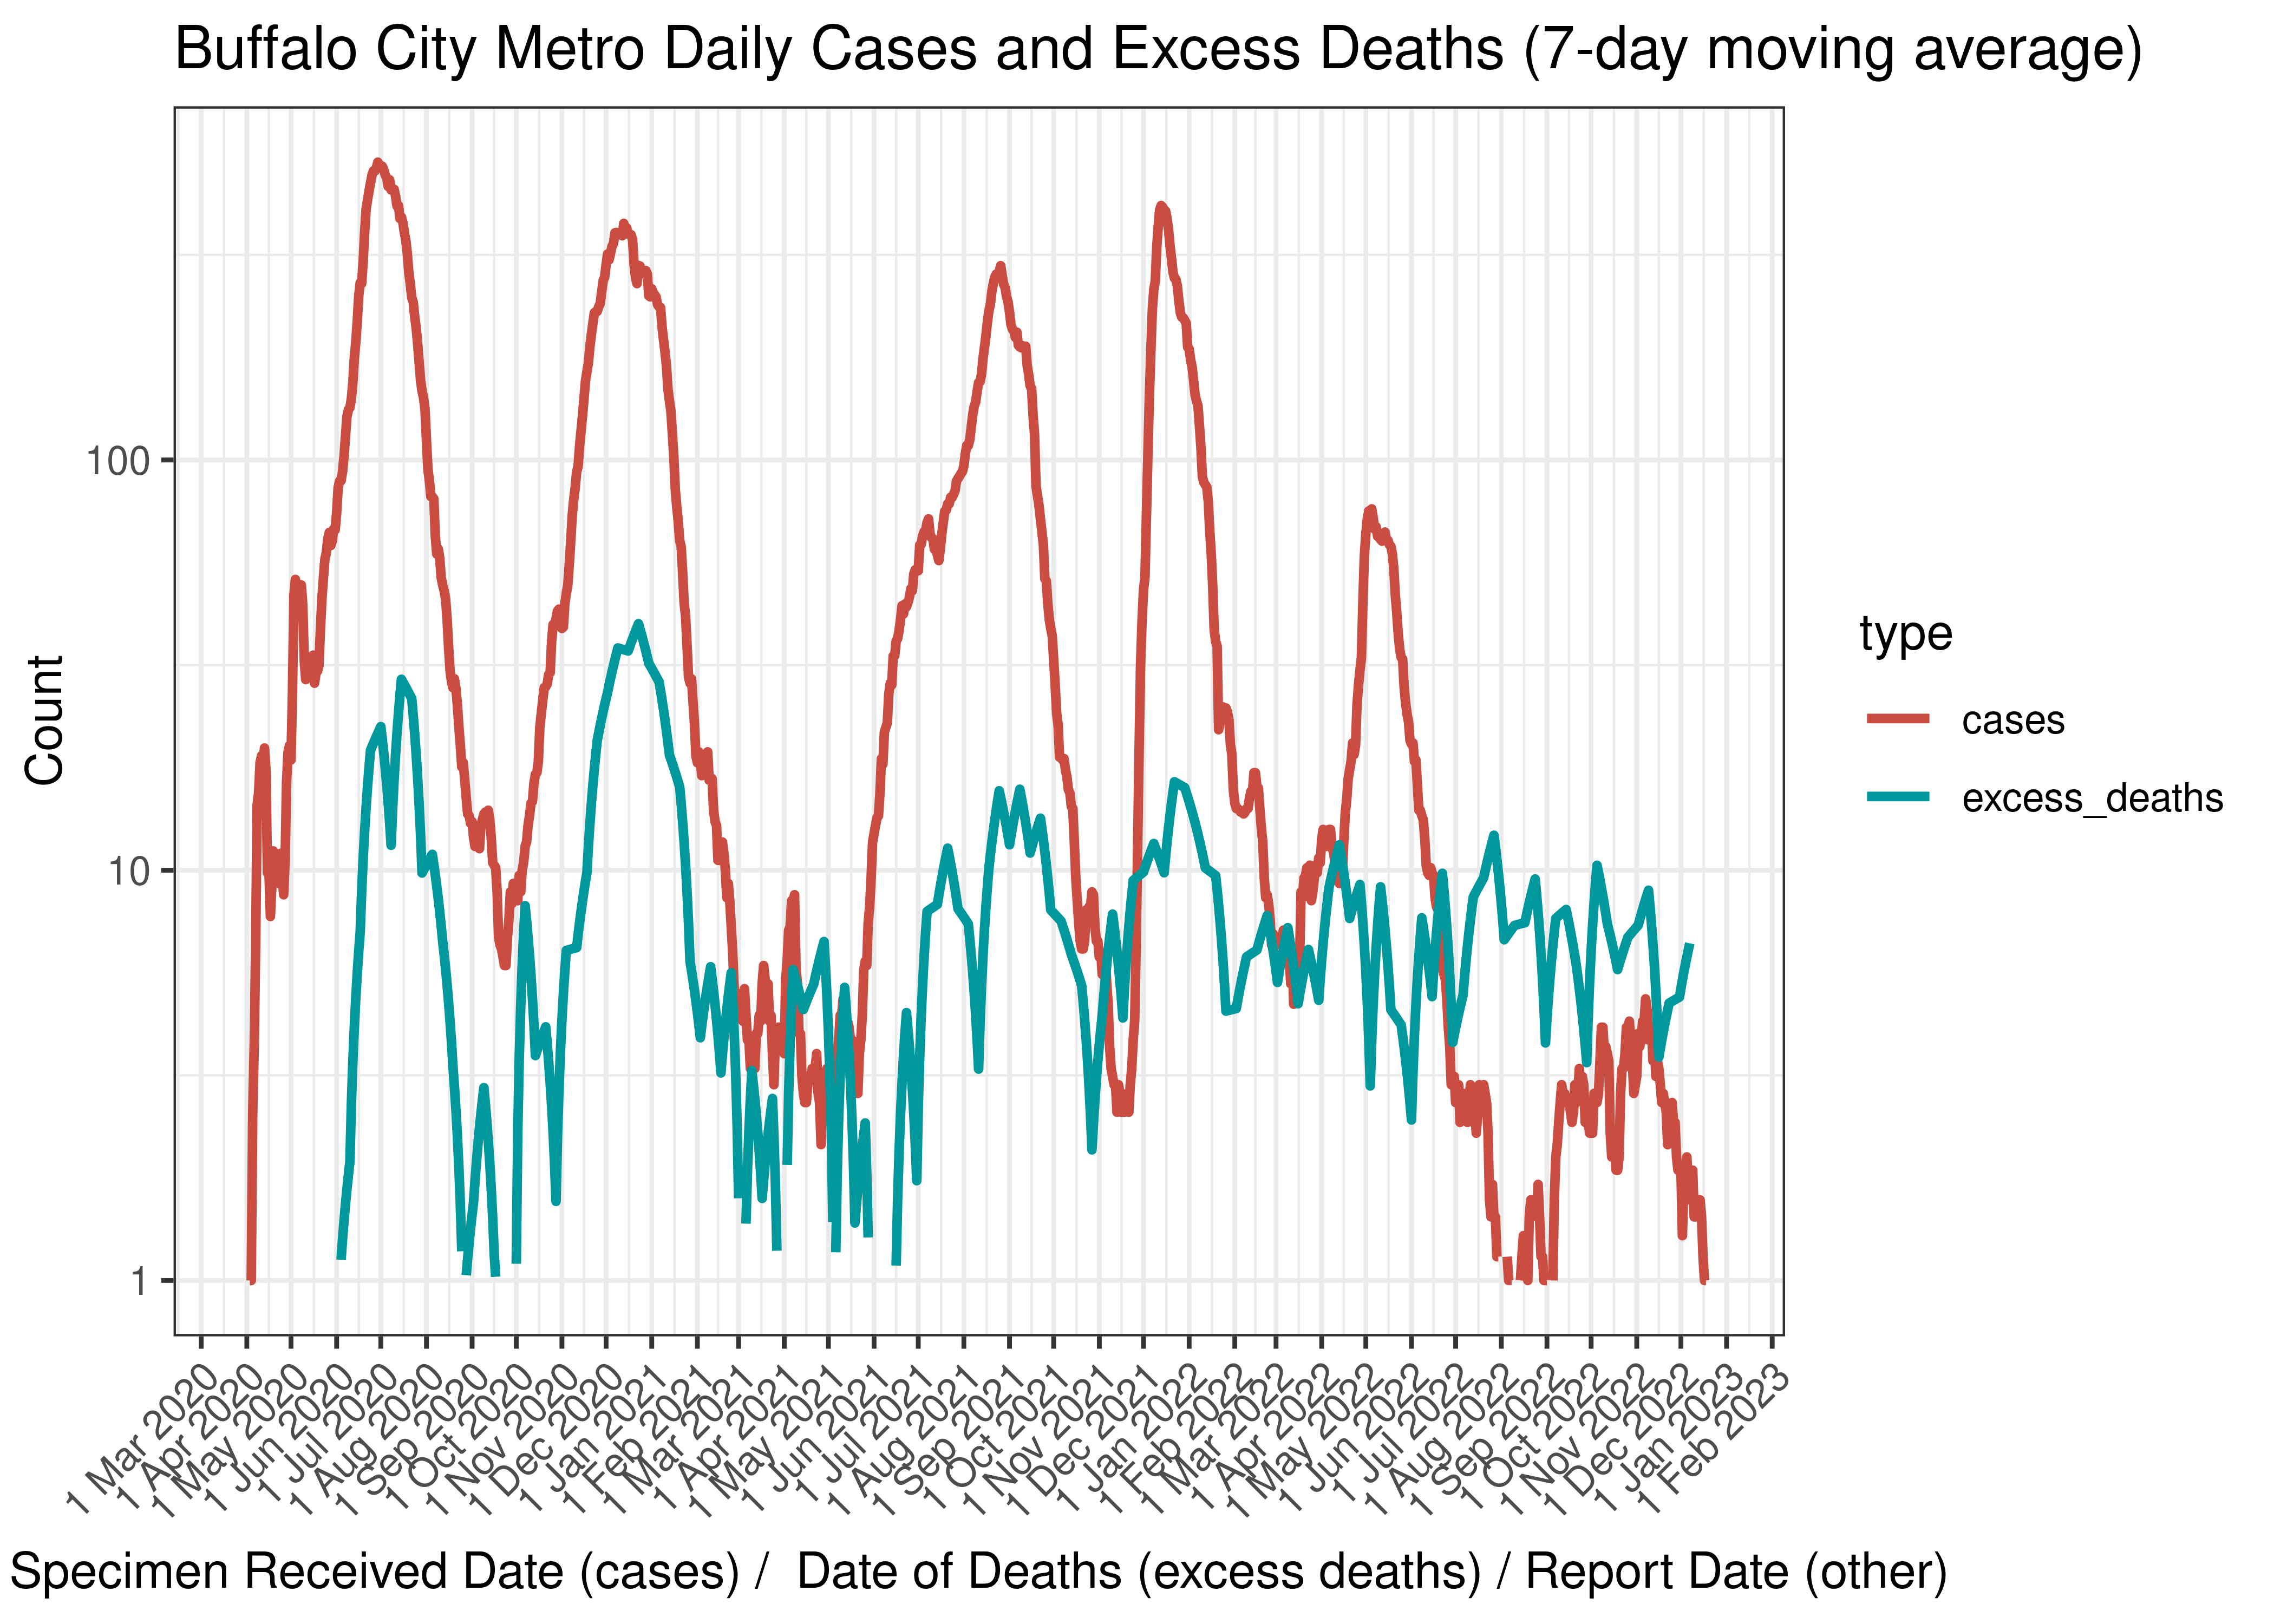
Buffalo City Metro Daily Cases and Excess Deaths (7-day moving average)
Below the above chart is repeated for the last 30-days:

Buffalo City Metro Daily Cases and Deaths (if available) for Last 30-days (7-day moving average)
6.2.10.4 Reproduction Number
Below current (last weekly) reproduction number estimates are tabulated for Buffalo City Metro.
| Count (Per Day) | Week Ending | Reproduction Number [95% Confidence Interval] | |
|---|---|---|---|
| Buffalo City Metro | 1.3 | 2022-12-25 | 1.32 [0.63 - 2.28] |
Below the effective reproduction number for Buffalo City Metro over the last 90 days are plotted together with a plot since start of the pandemic.
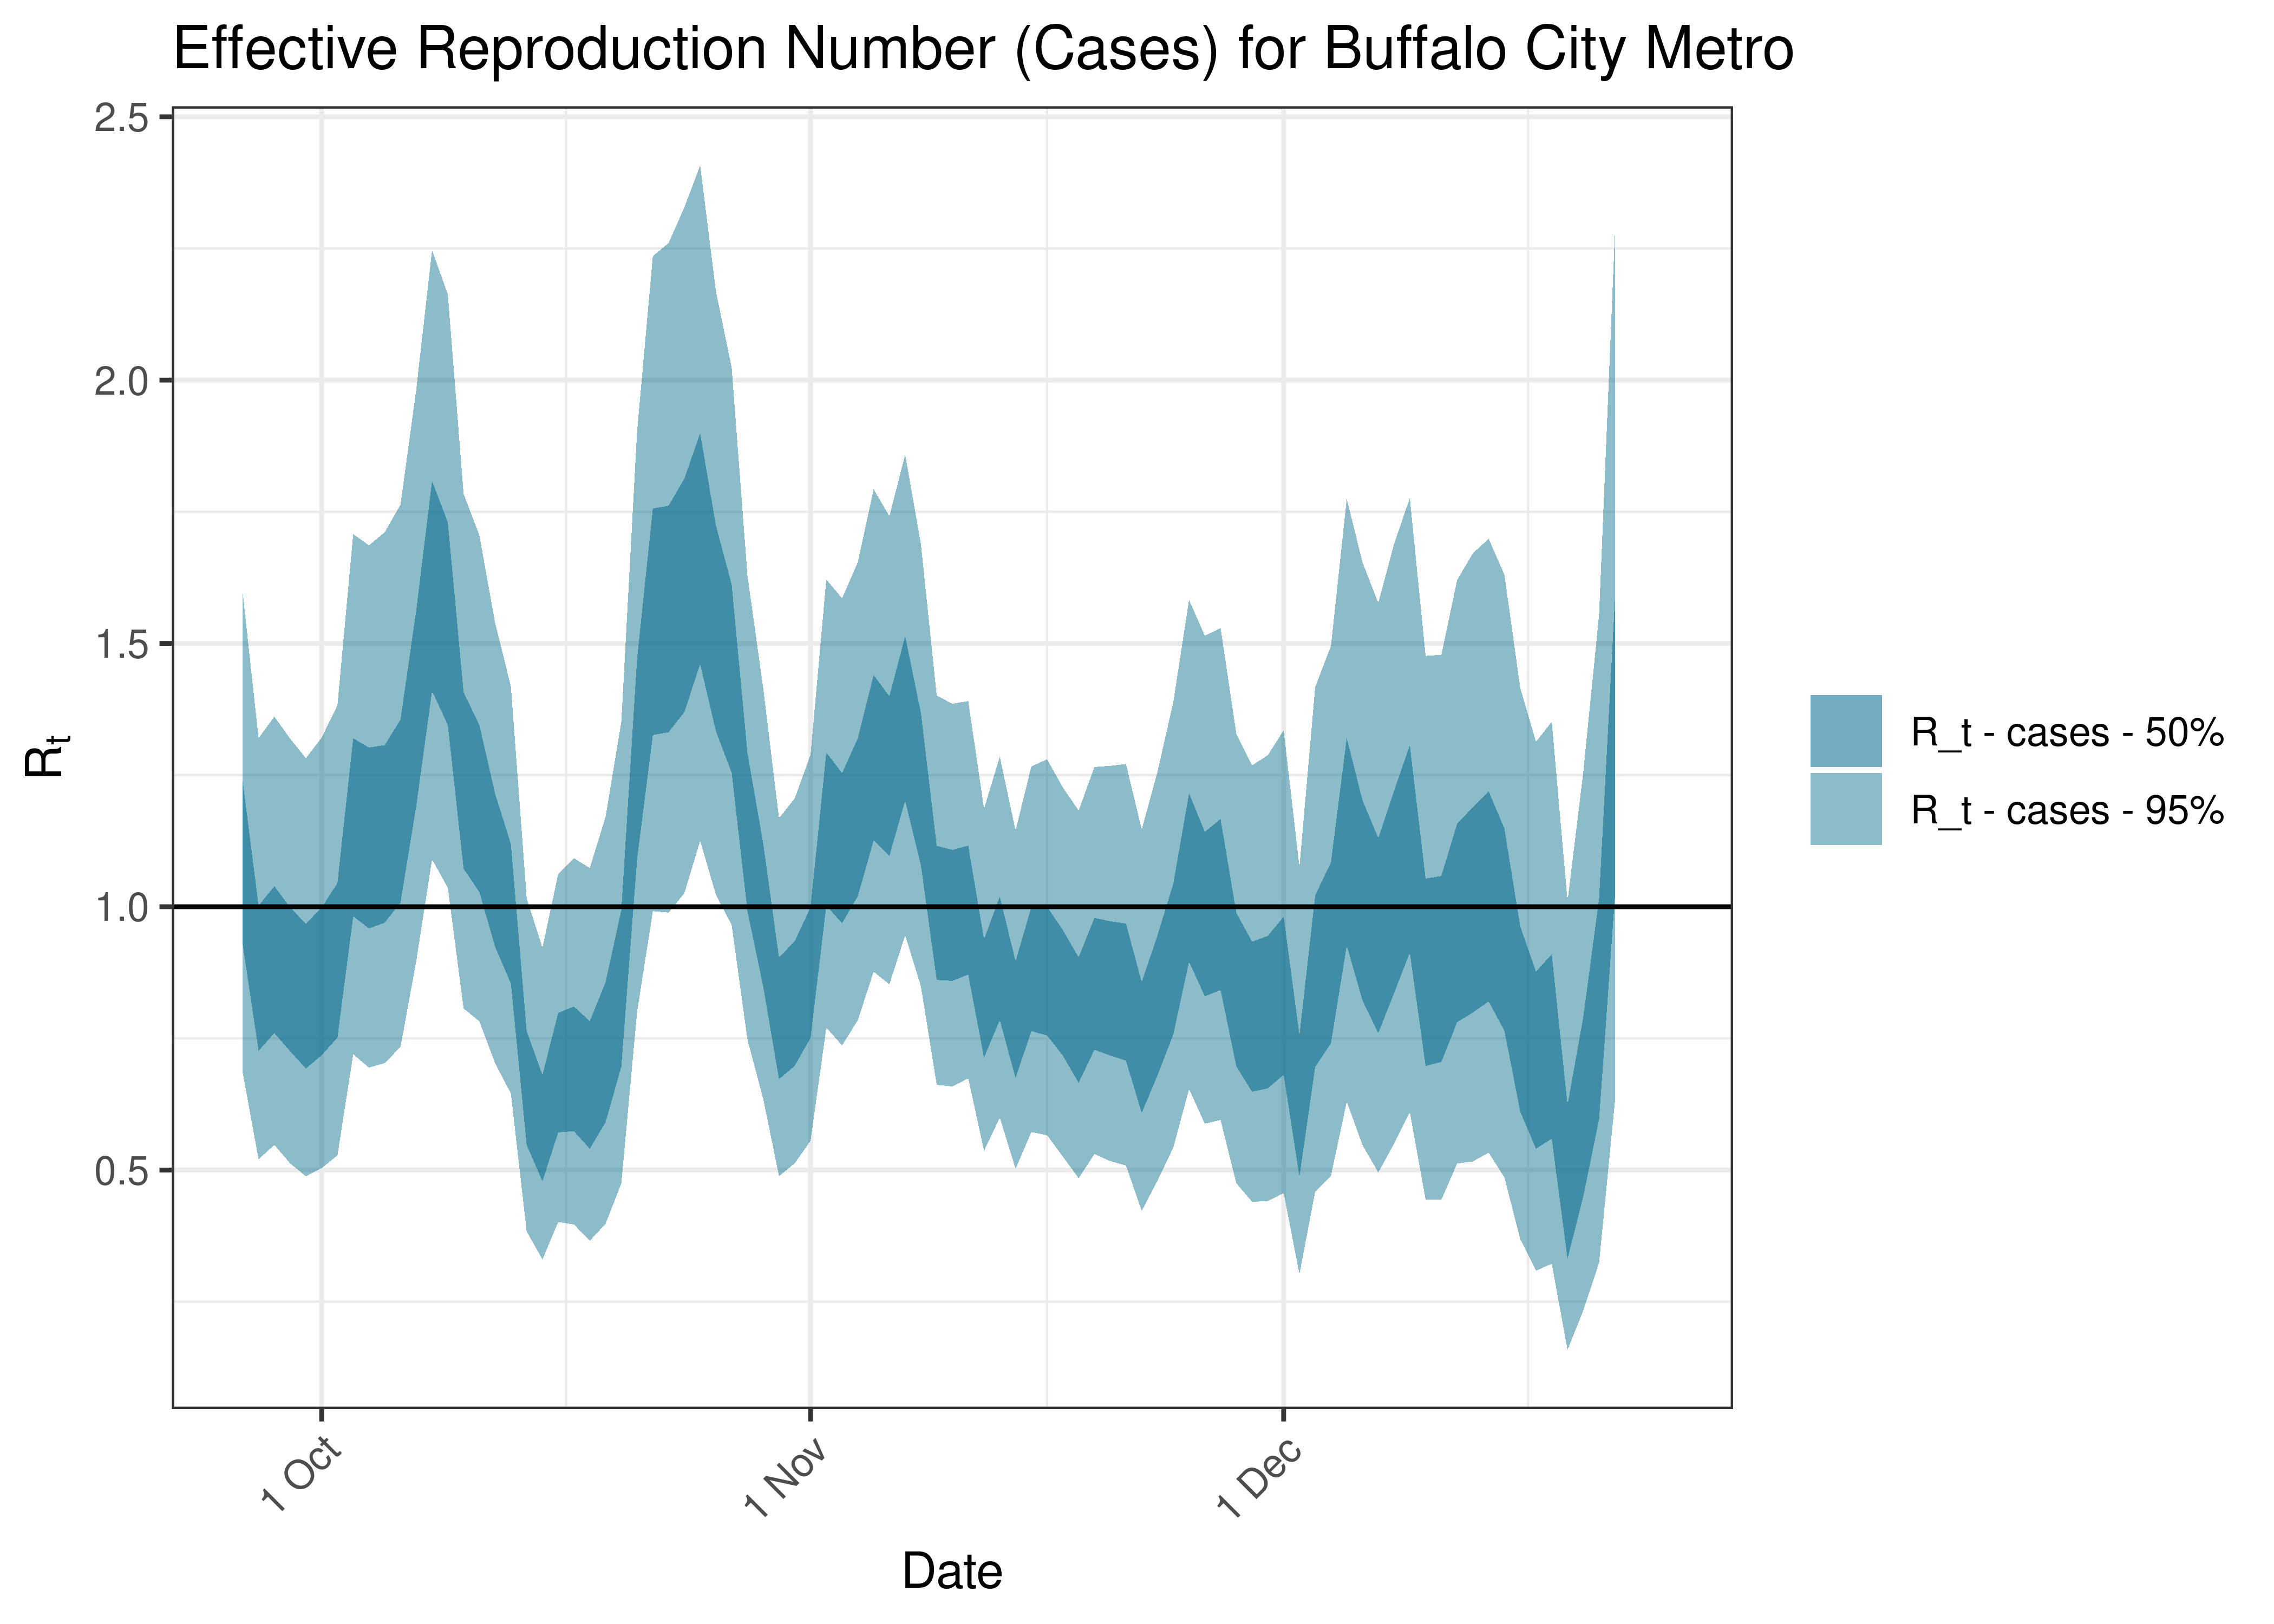
Estimated Effective Reproduction Number Based on Cases for Buffalo City Metro over last 90 days
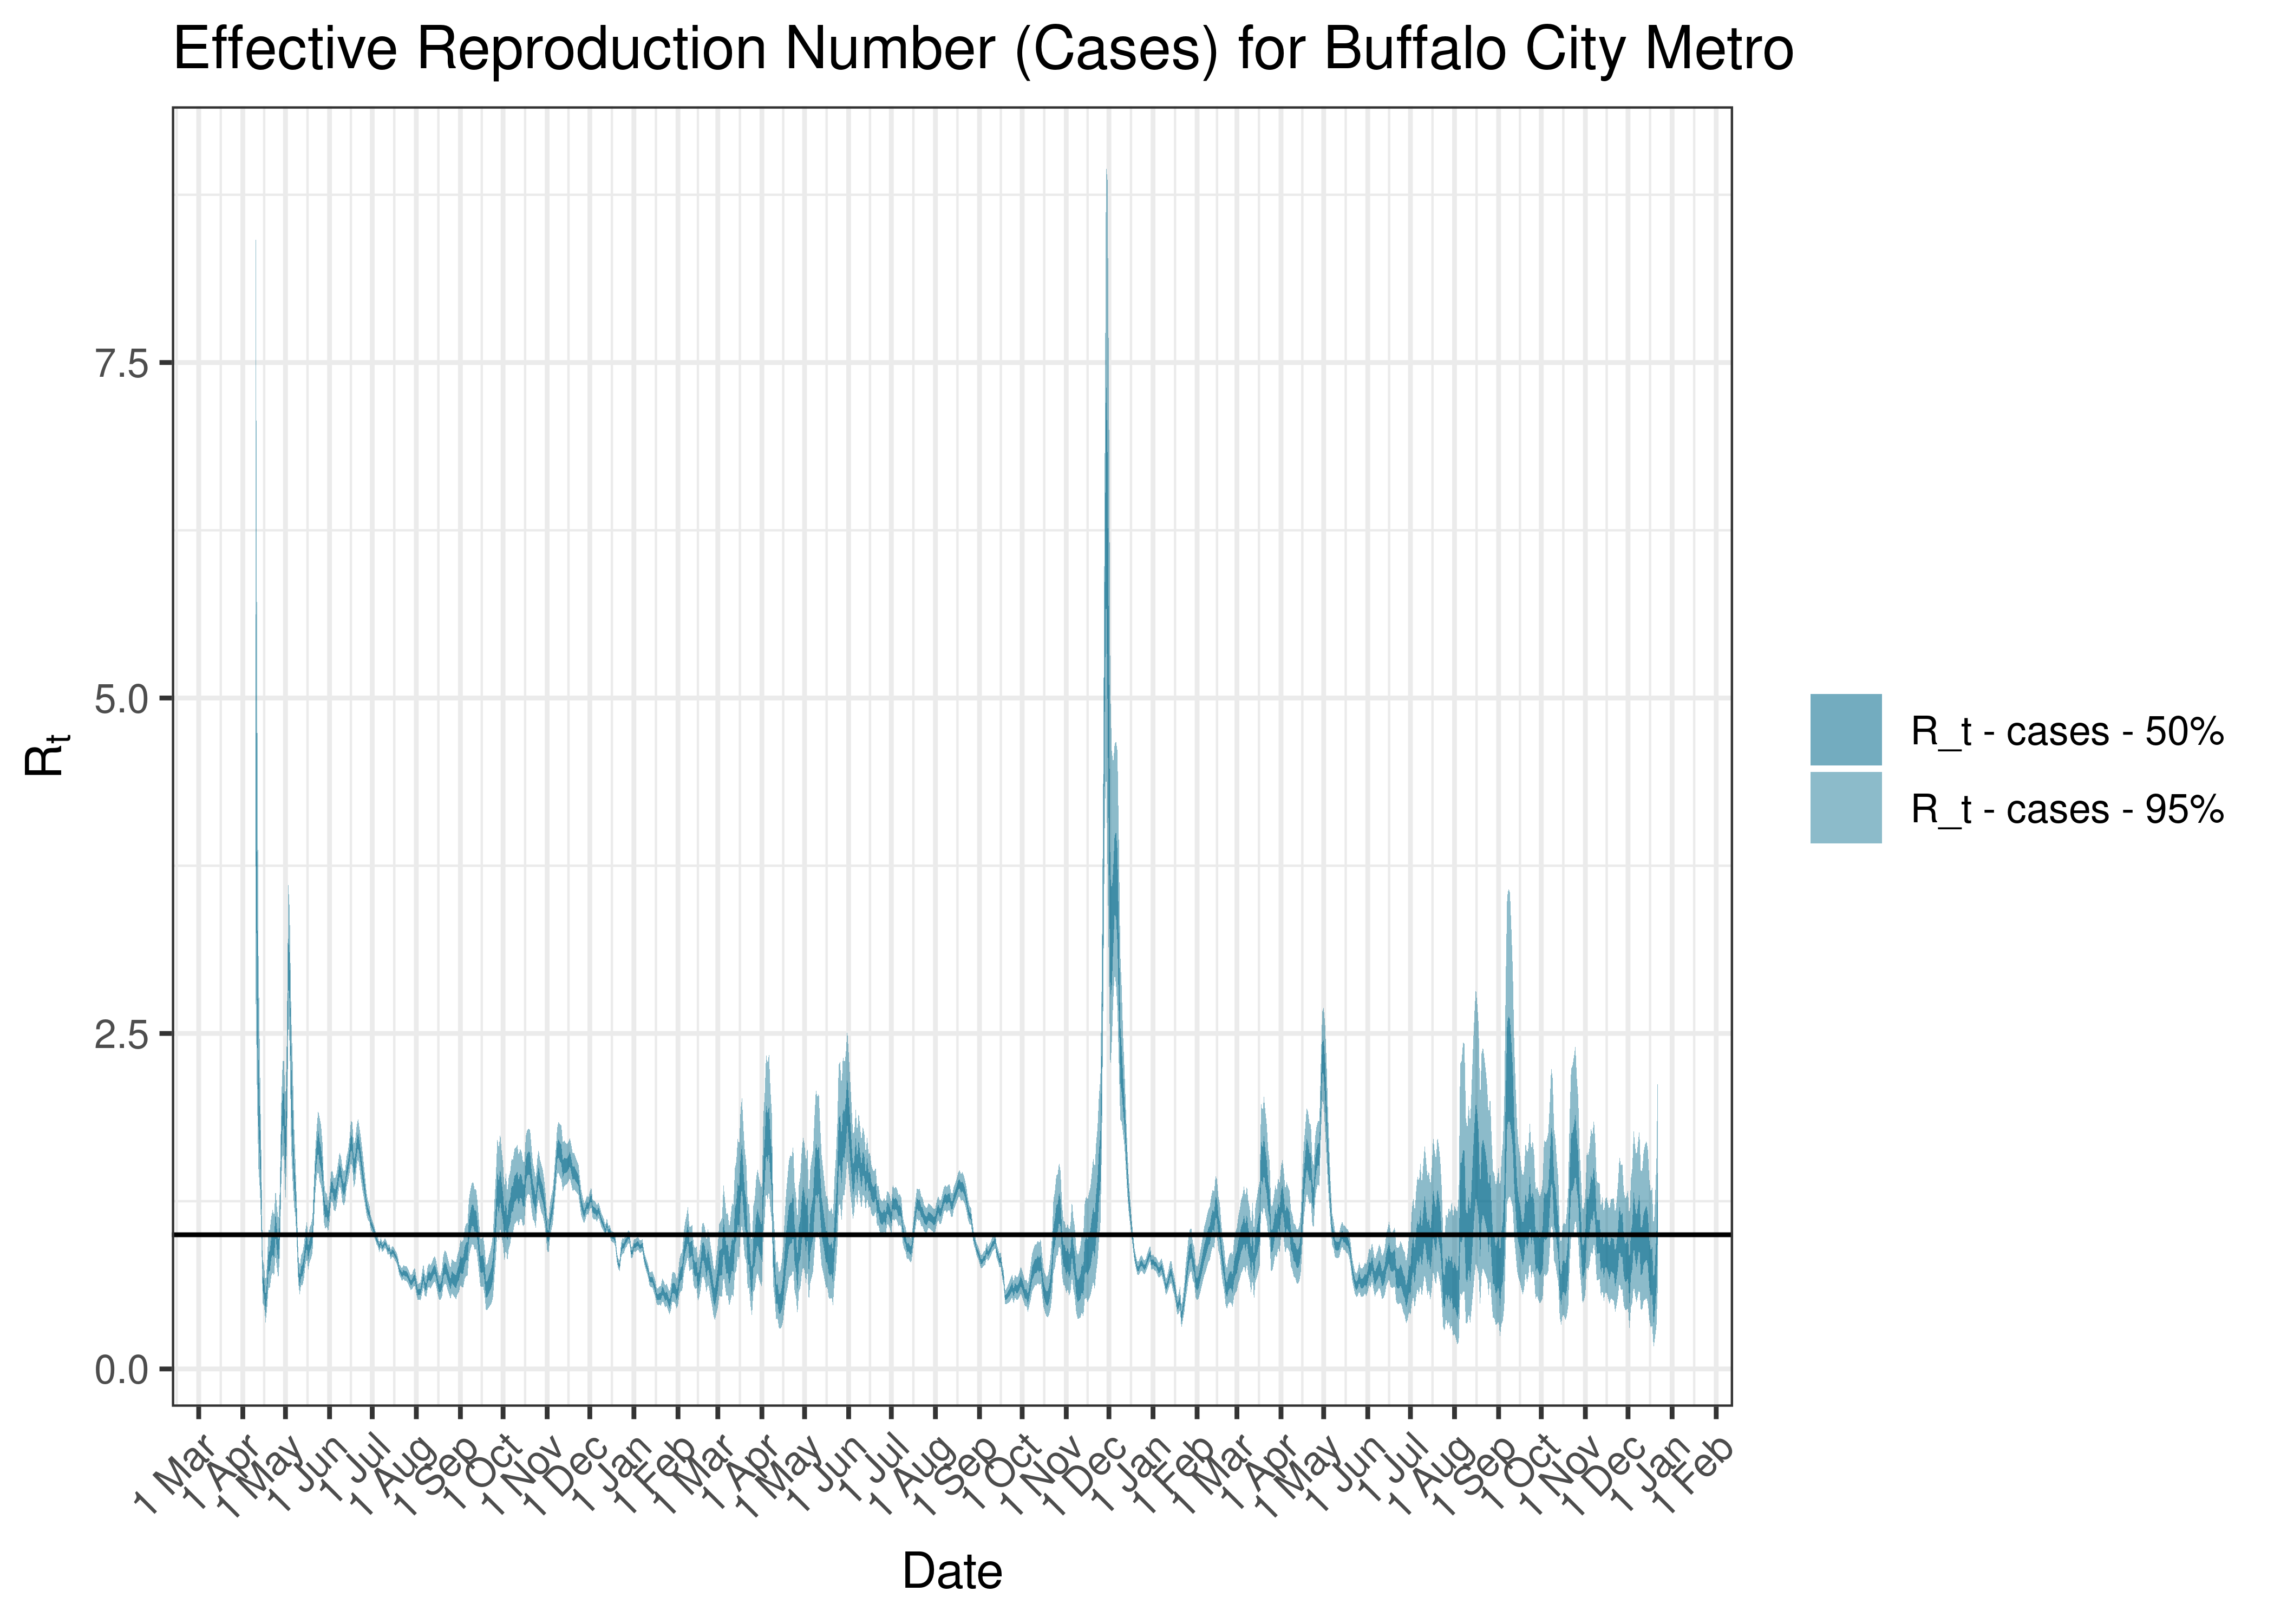
Estimated Effective Reproduction Number Based on Cases for Buffalo City Metro since 1 April 2020
6.2.11 Chris Hani
6.2.11.1 Cases
Cases are tabulated by specimen received date below. Cases include estimates for late reporting in recent days as well as adjustments for any public holidays. A centred 7-day moving average is also shown. The peak daily cases in previous waves (as measured by the moving average) is also shown.
| Specimen Received Date | Cases | 7-day Moving Average | Comment |
|---|---|---|---|
| 2020-06-27 | 149 | 181 | Wave 1 Peak |
| 2020-12-17 | 175 | 187 | Wave 2 Peak |
| 2021-08-16 | 245 | 242 | Wave 3 Peak |
| 2021-12-12 | 32 | 122 | Wave 4 Peak |
| 2022-05-18 | 54 | 40 | Wave 5 Peak (to date) |
Below a 7-day moving average daily case count are plotted for Chris Hani on a log scale since start of the epidemic:
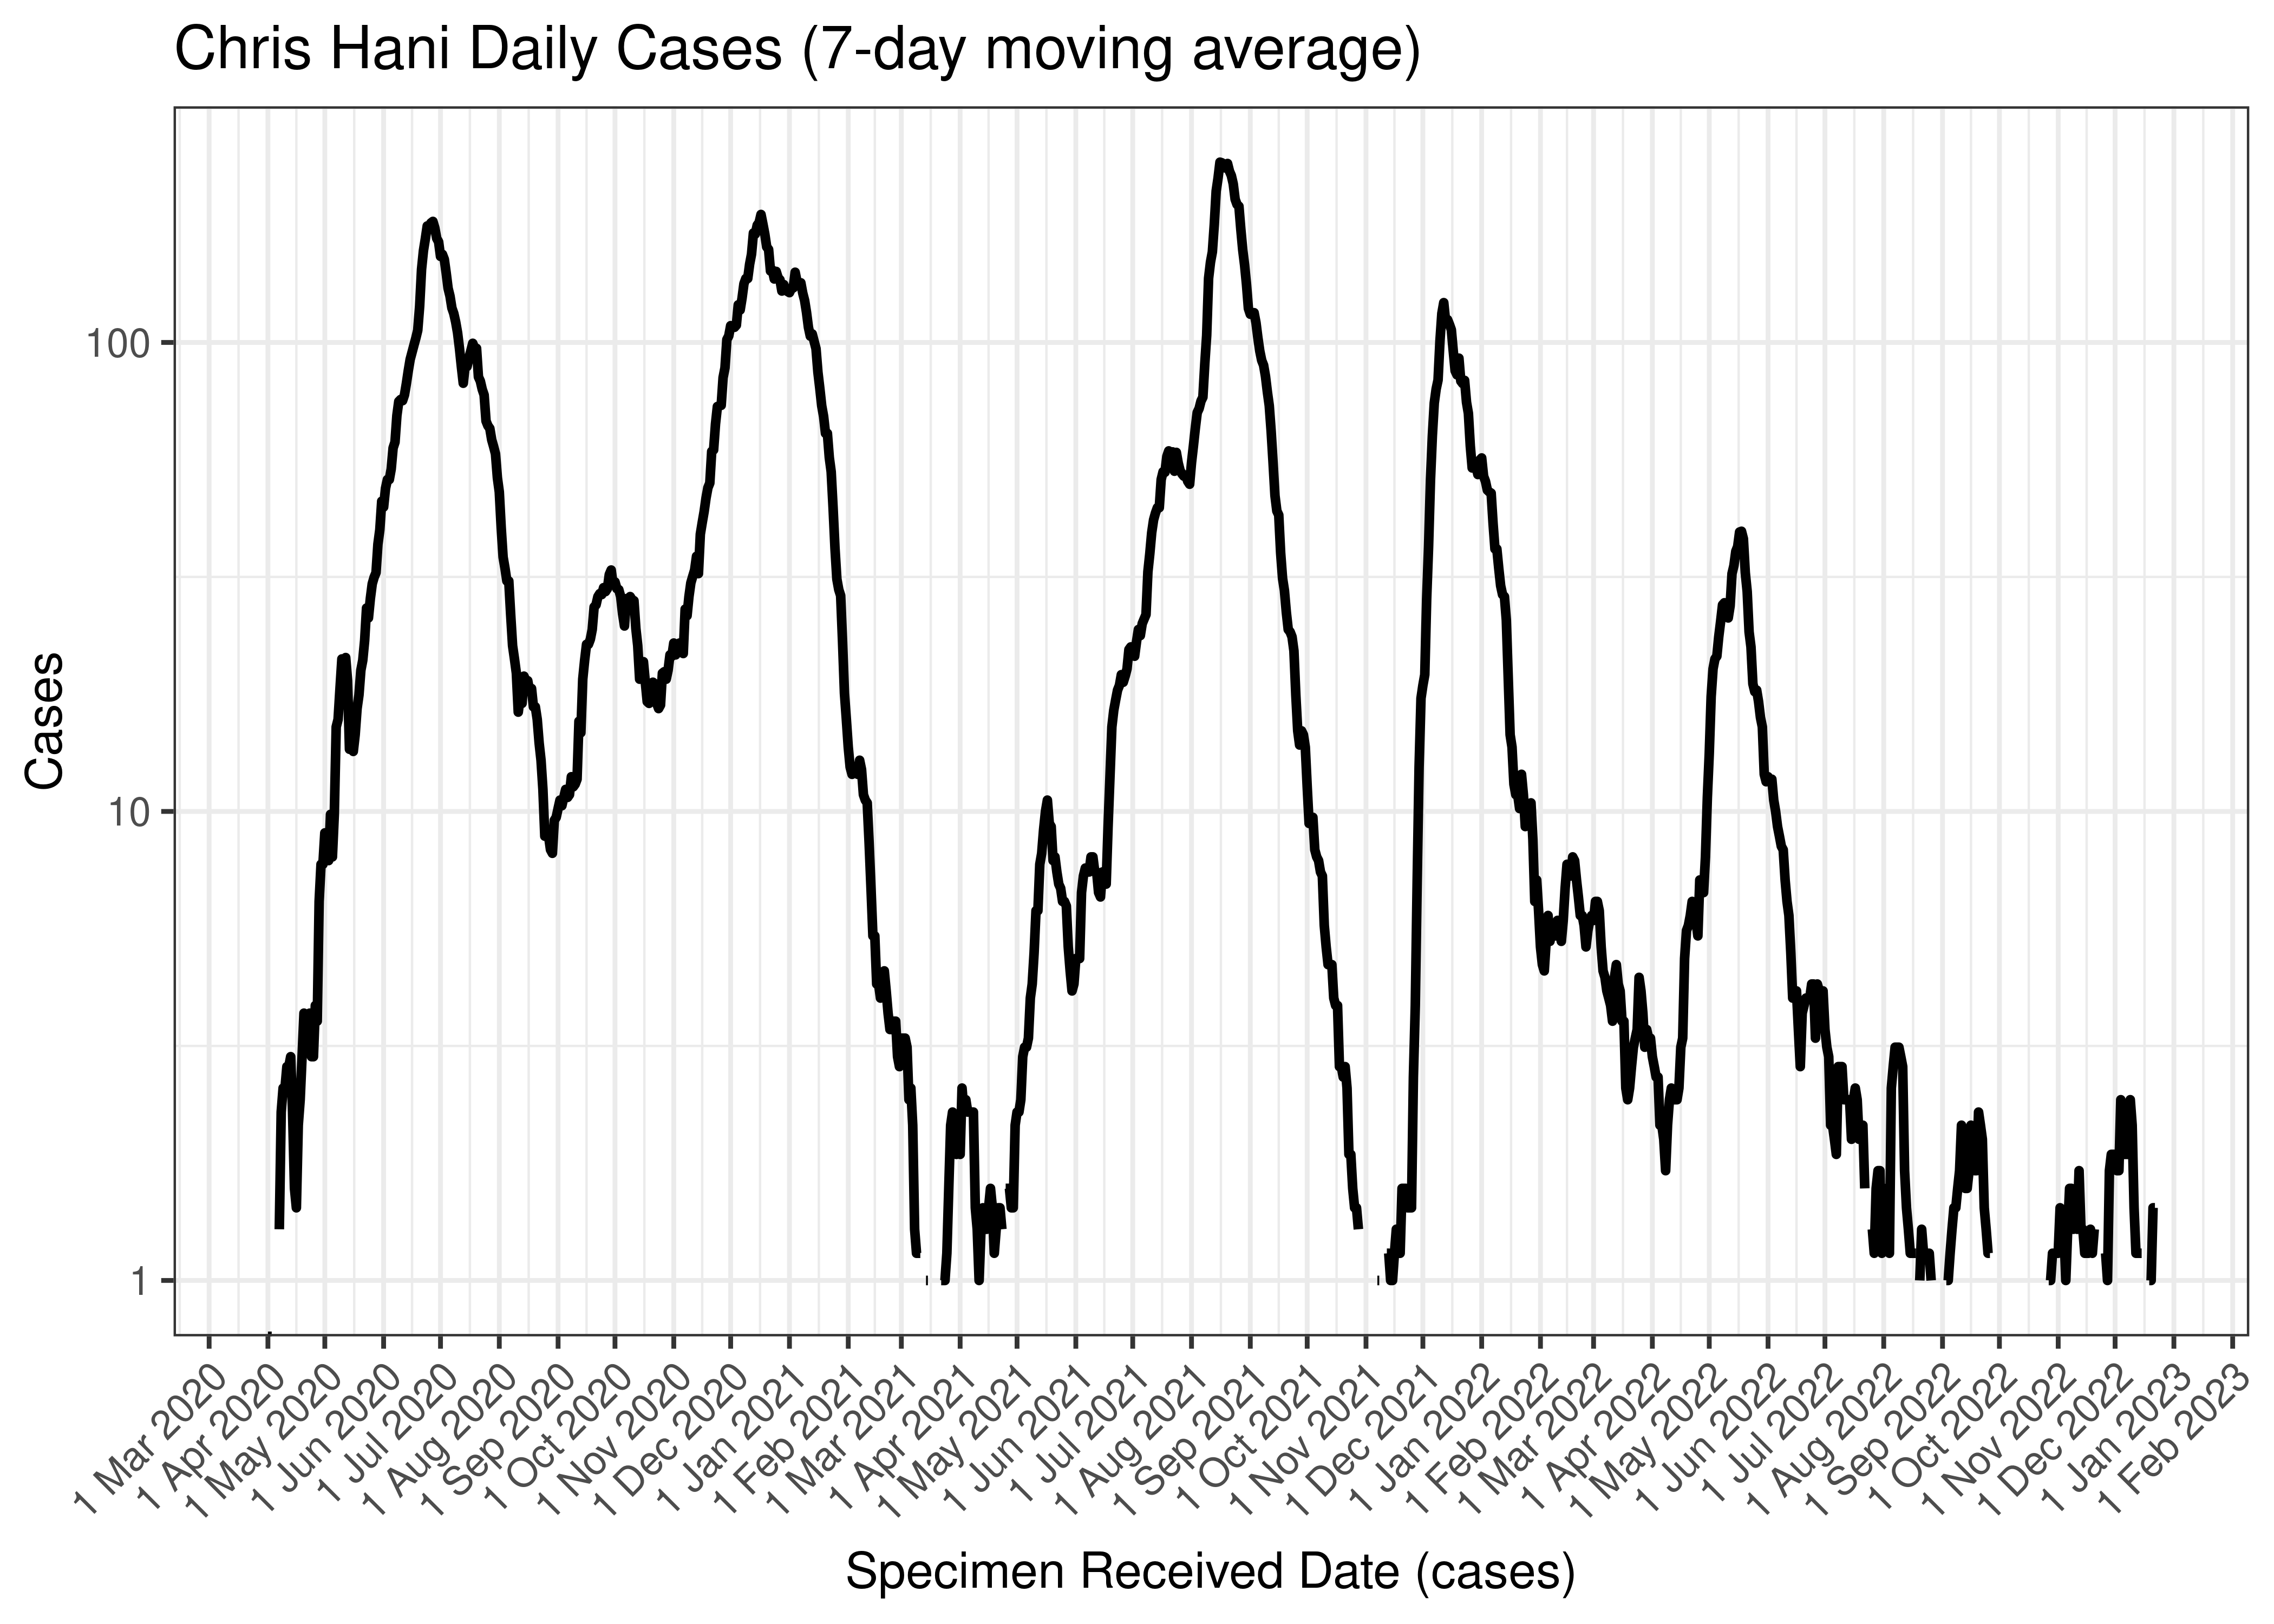
Chris Hani Daily Cases (7-day moving average)
Below the above chart is repeated for the last 30-days:
Chris Hani Daily Cases for Last 30-days (7-day moving average)
6.2.11.2 Reproduction Number
Below current (last weekly) reproduction number estimates are tabulated for Chris Hani.
| Count (Per Day) | Week Ending | Reproduction Number [95% Confidence Interval] | |
|---|---|---|---|
| Chris Hani | 1.4 | 2022-12-25 | 1.62 [0.80 - 2.73] |
Below the effective reproduction number for Chris Hani over the last 90 days are plotted together with a plot since start of the pandemic.
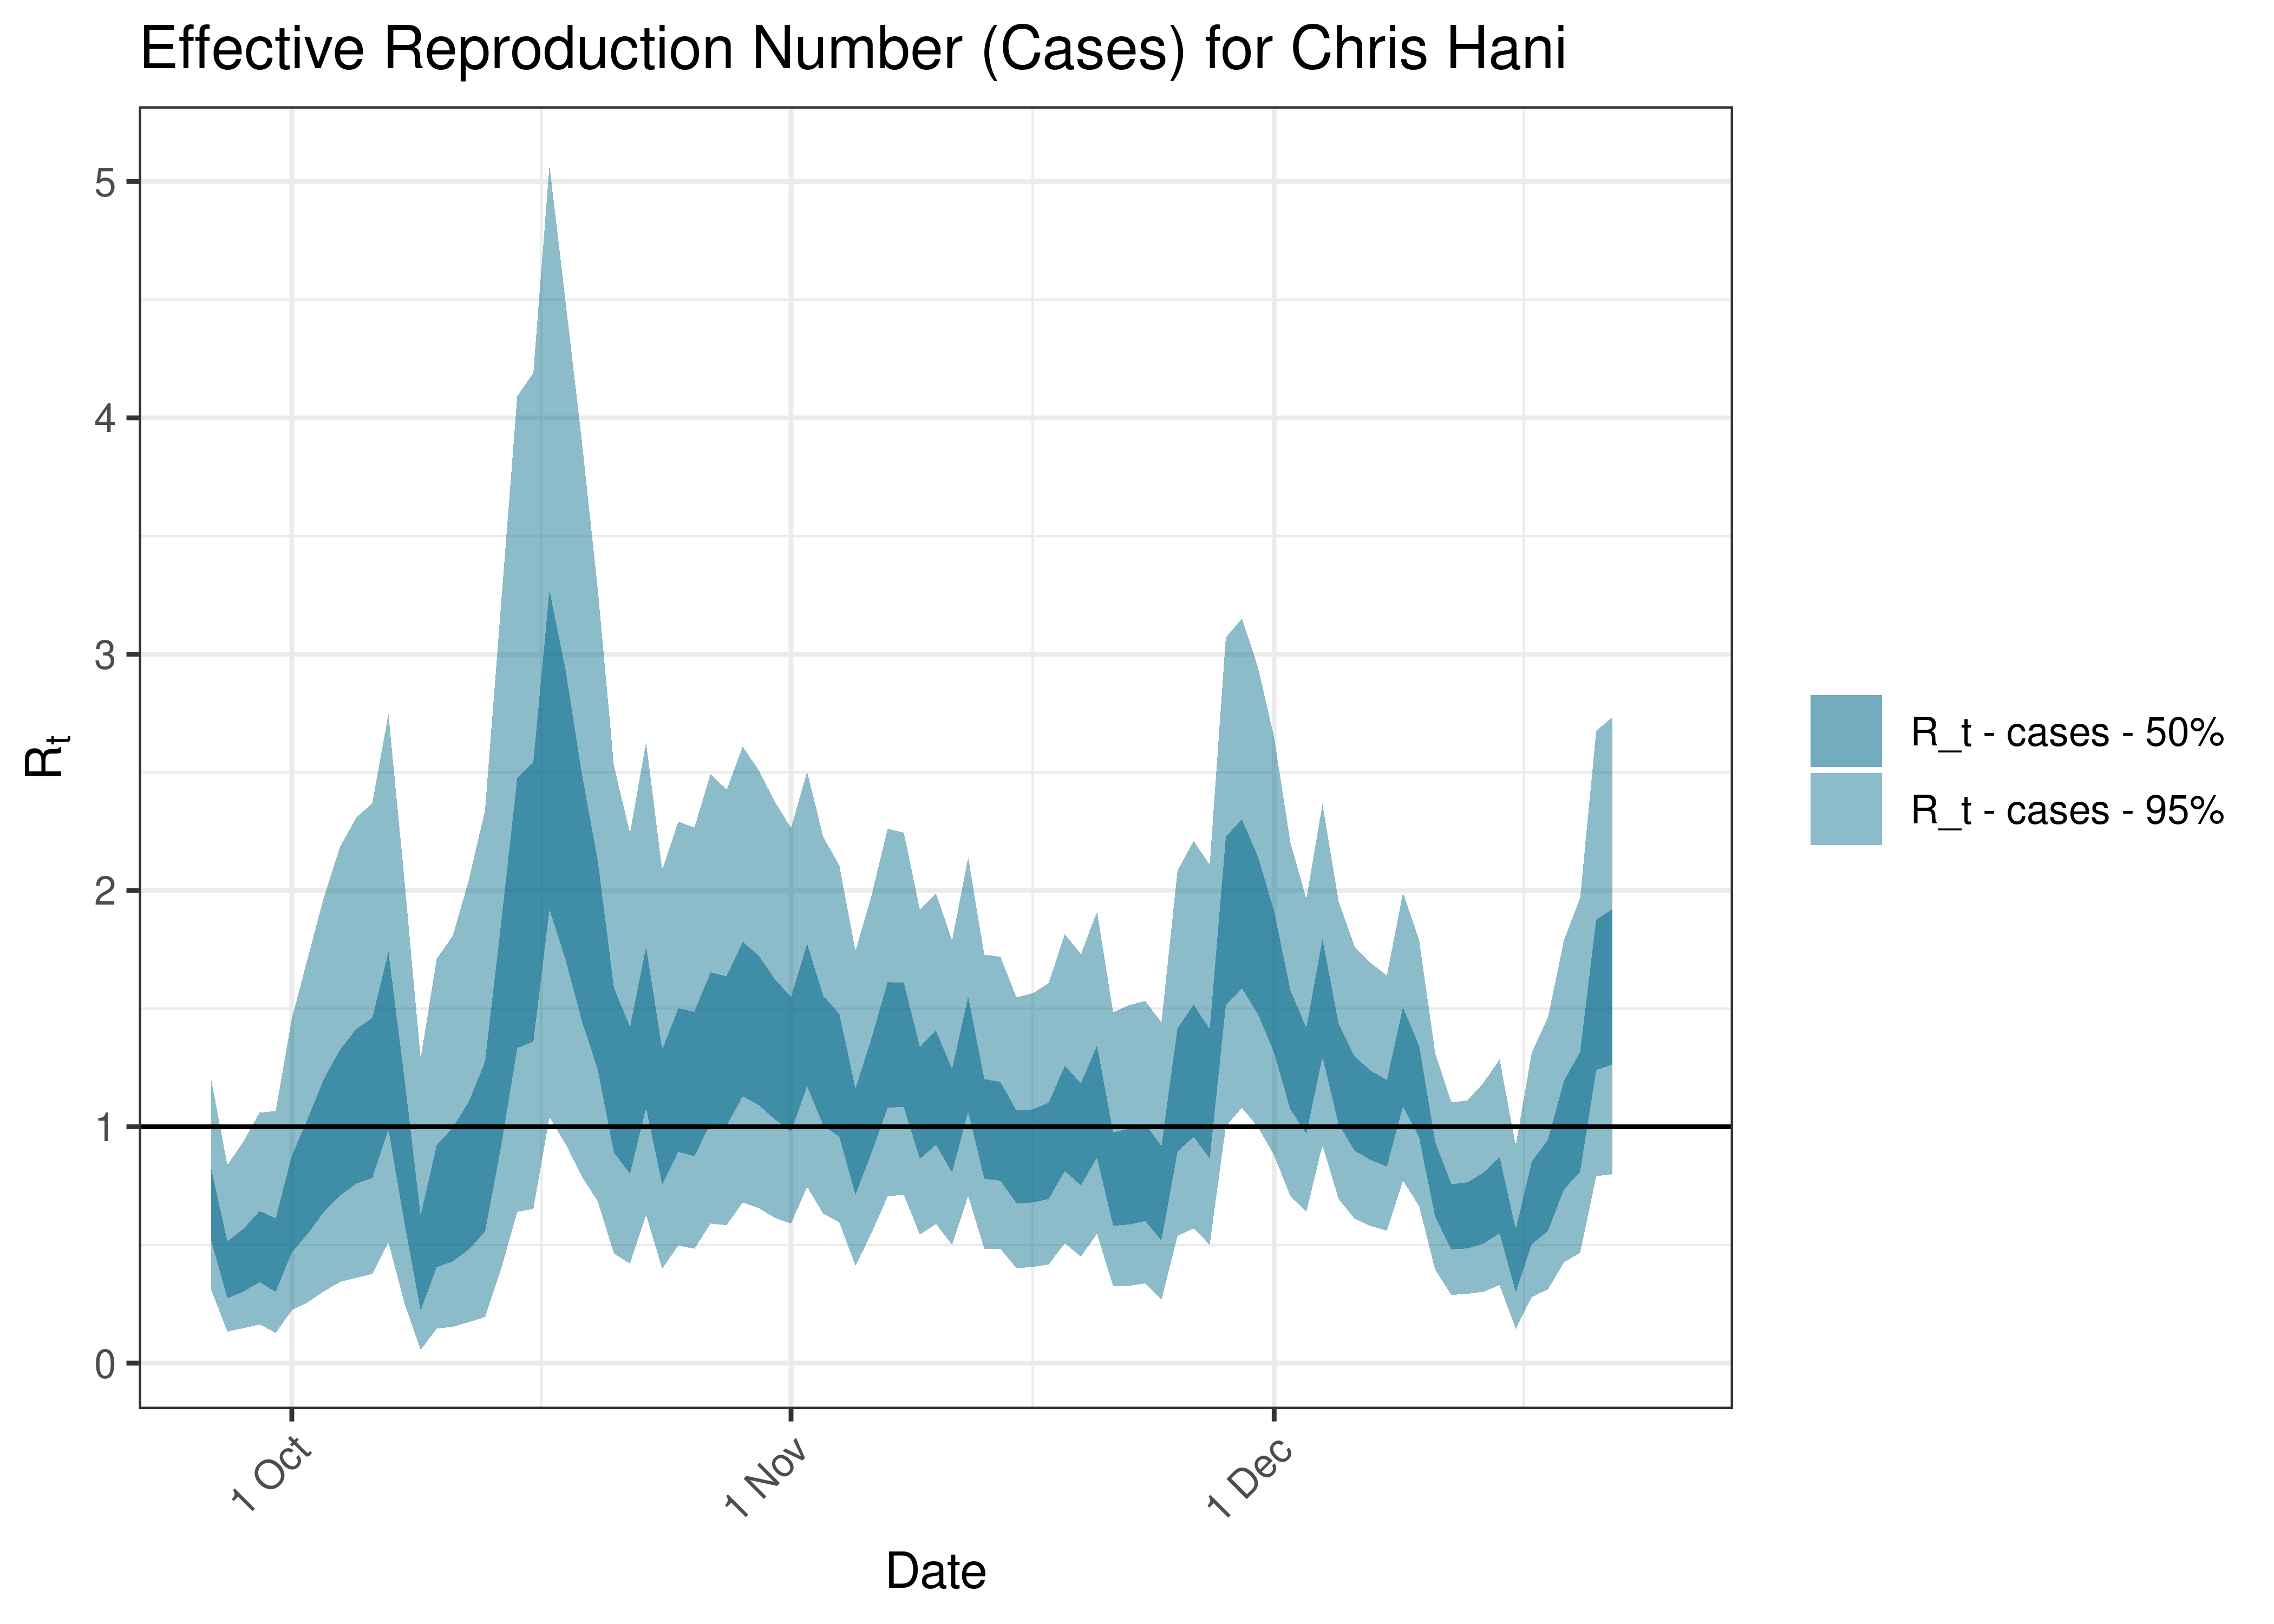
Estimated Effective Reproduction Number Based on Cases for Chris Hani over last 90 days
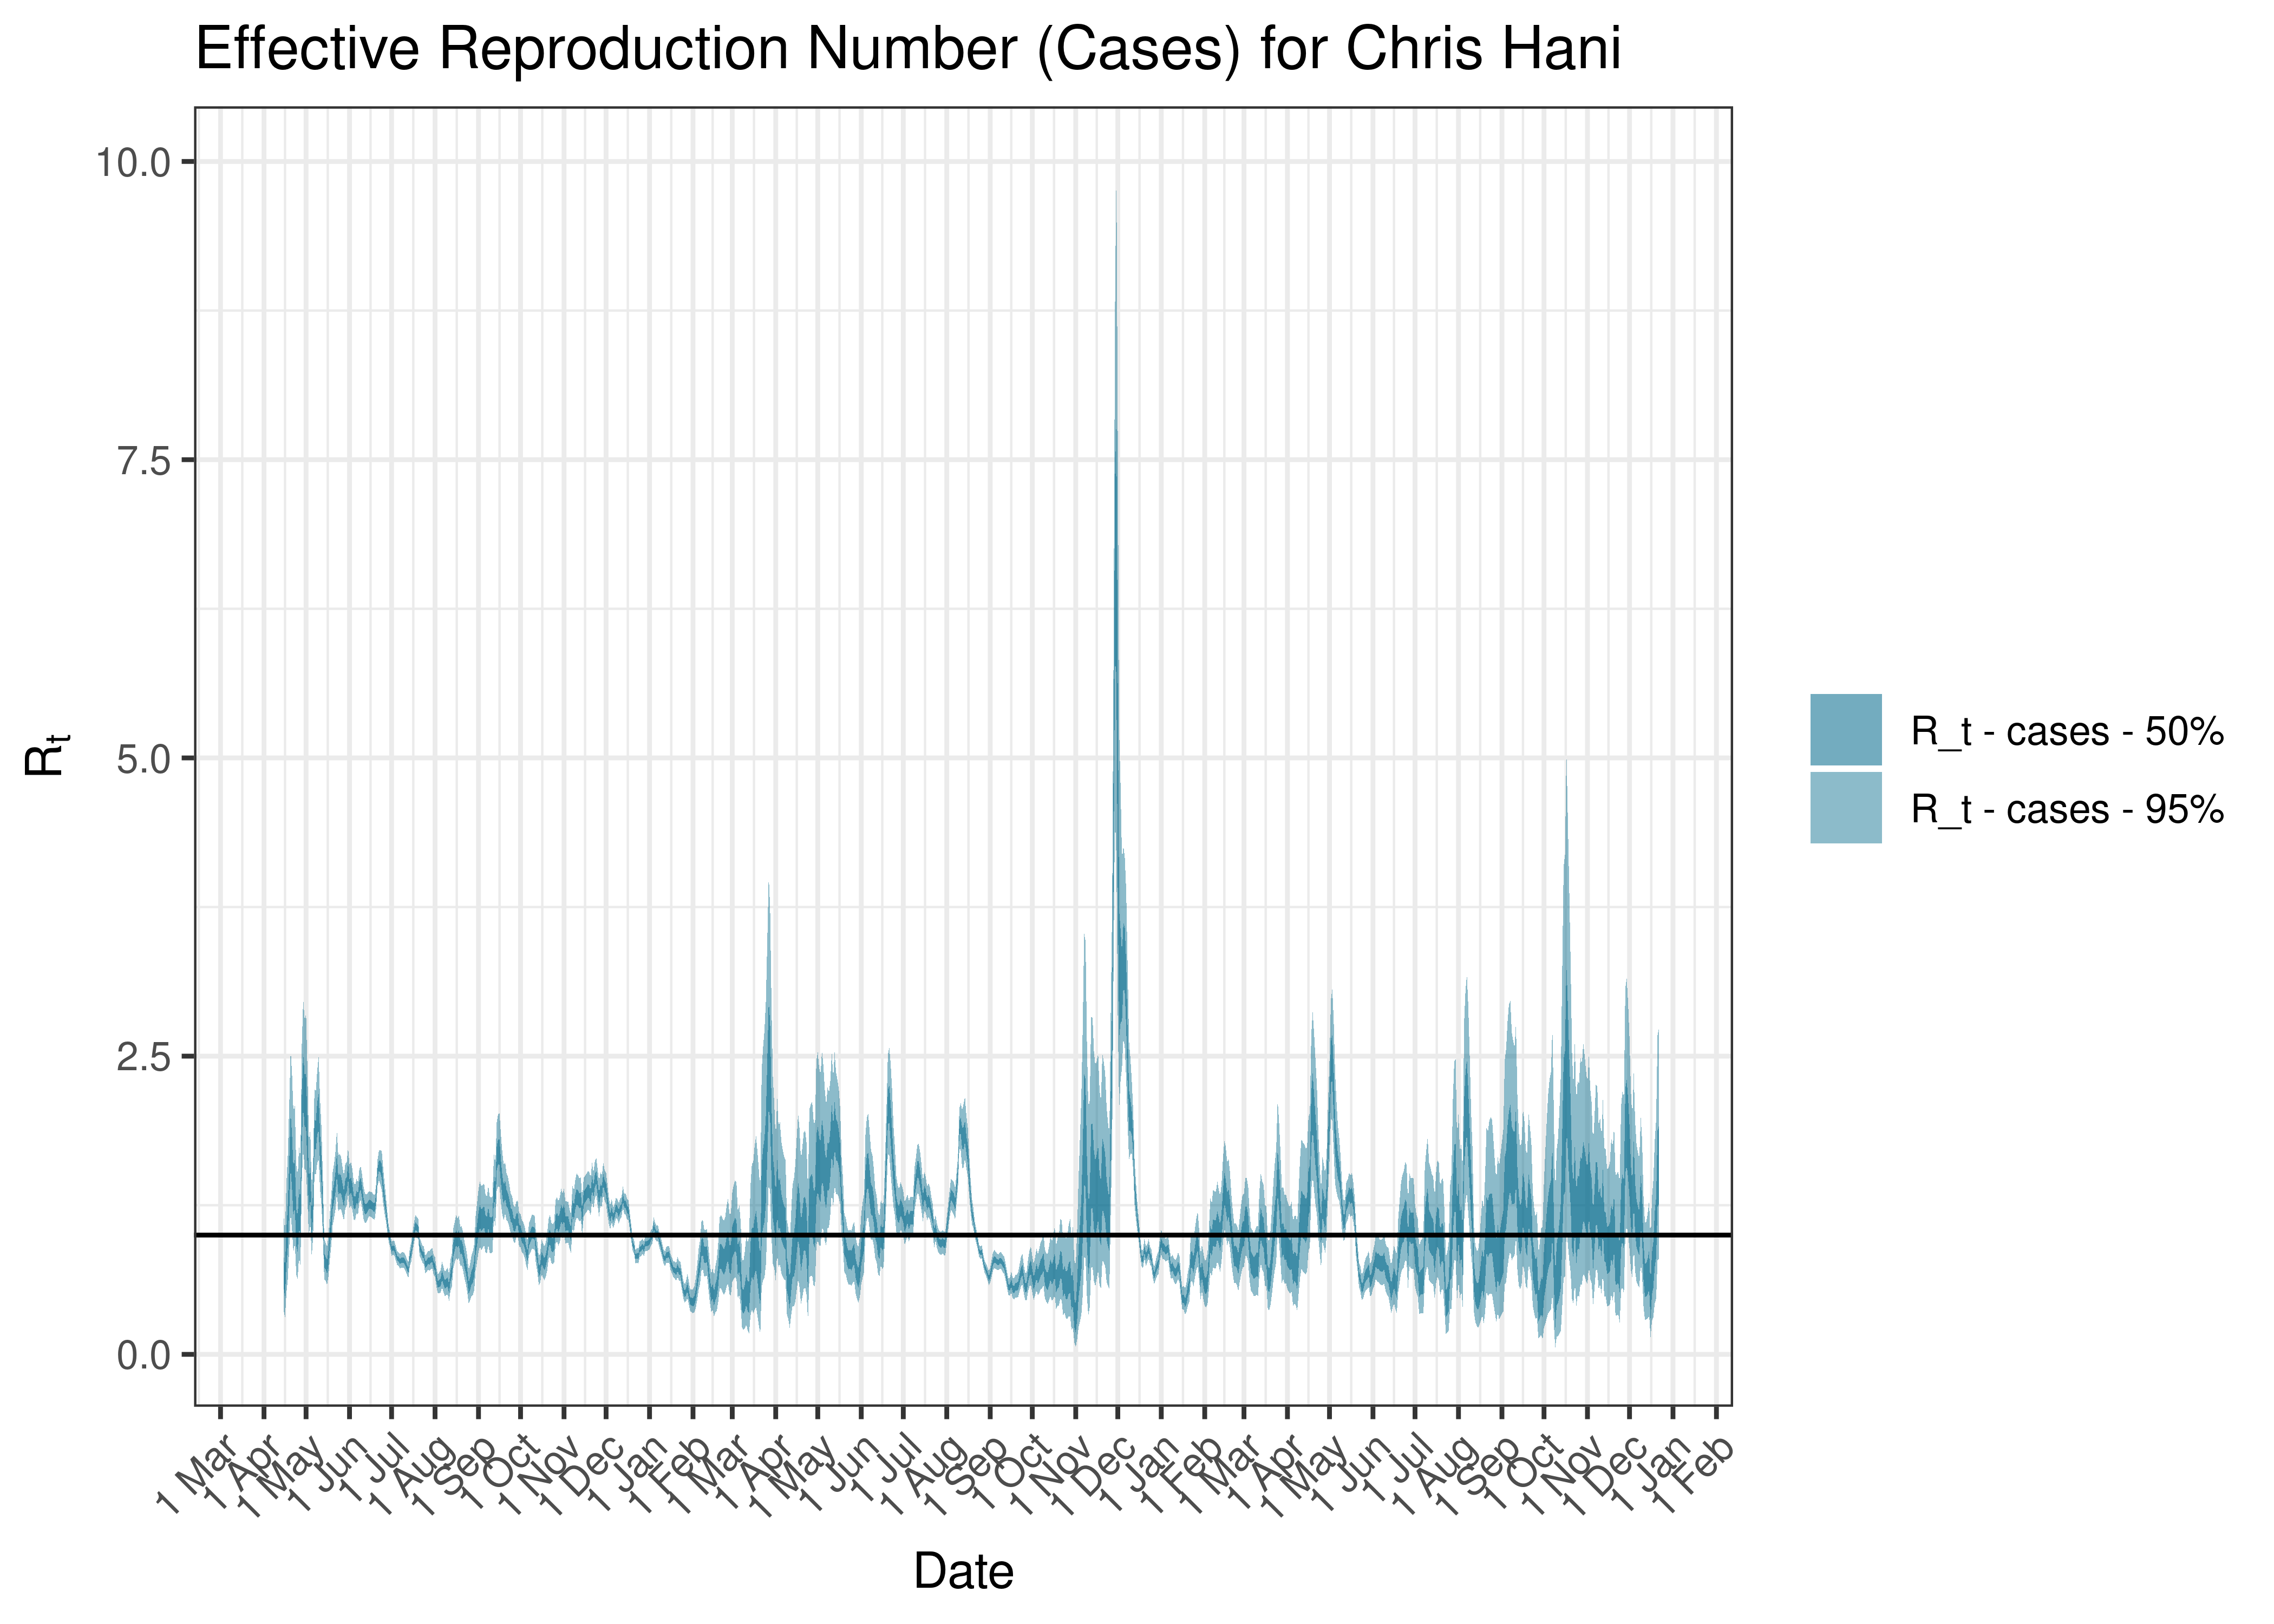
Estimated Effective Reproduction Number Based on Cases for Chris Hani since 1 April 2020
6.2.12 Joe Gqabi
6.2.12.1 Cases
Cases are tabulated by specimen received date below. Cases include estimates for late reporting in recent days as well as adjustments for any public holidays. A centred 7-day moving average is also shown. The peak daily cases in previous waves (as measured by the moving average) is also shown.
| Specimen Received Date | Cases | 7-day Moving Average | Comment |
|---|---|---|---|
| 2020-07-06 | 90 | 76 | Wave 1 Peak |
| 2021-01-07 | 98 | 114 | Wave 2 Peak |
| 2021-08-13 | 129 | 138 | Wave 3 Peak |
| 2021-12-12 | 9 | 64 | Wave 4 Peak |
| 2022-05-17 | 10 | 10 | Wave 5 Peak (to date) |
| 2022-05-19 | 11 | 10 | Wave 5 Peak (to date) |
Below a 7-day moving average daily case count are plotted for Joe Gqabi on a log scale since start of the epidemic:
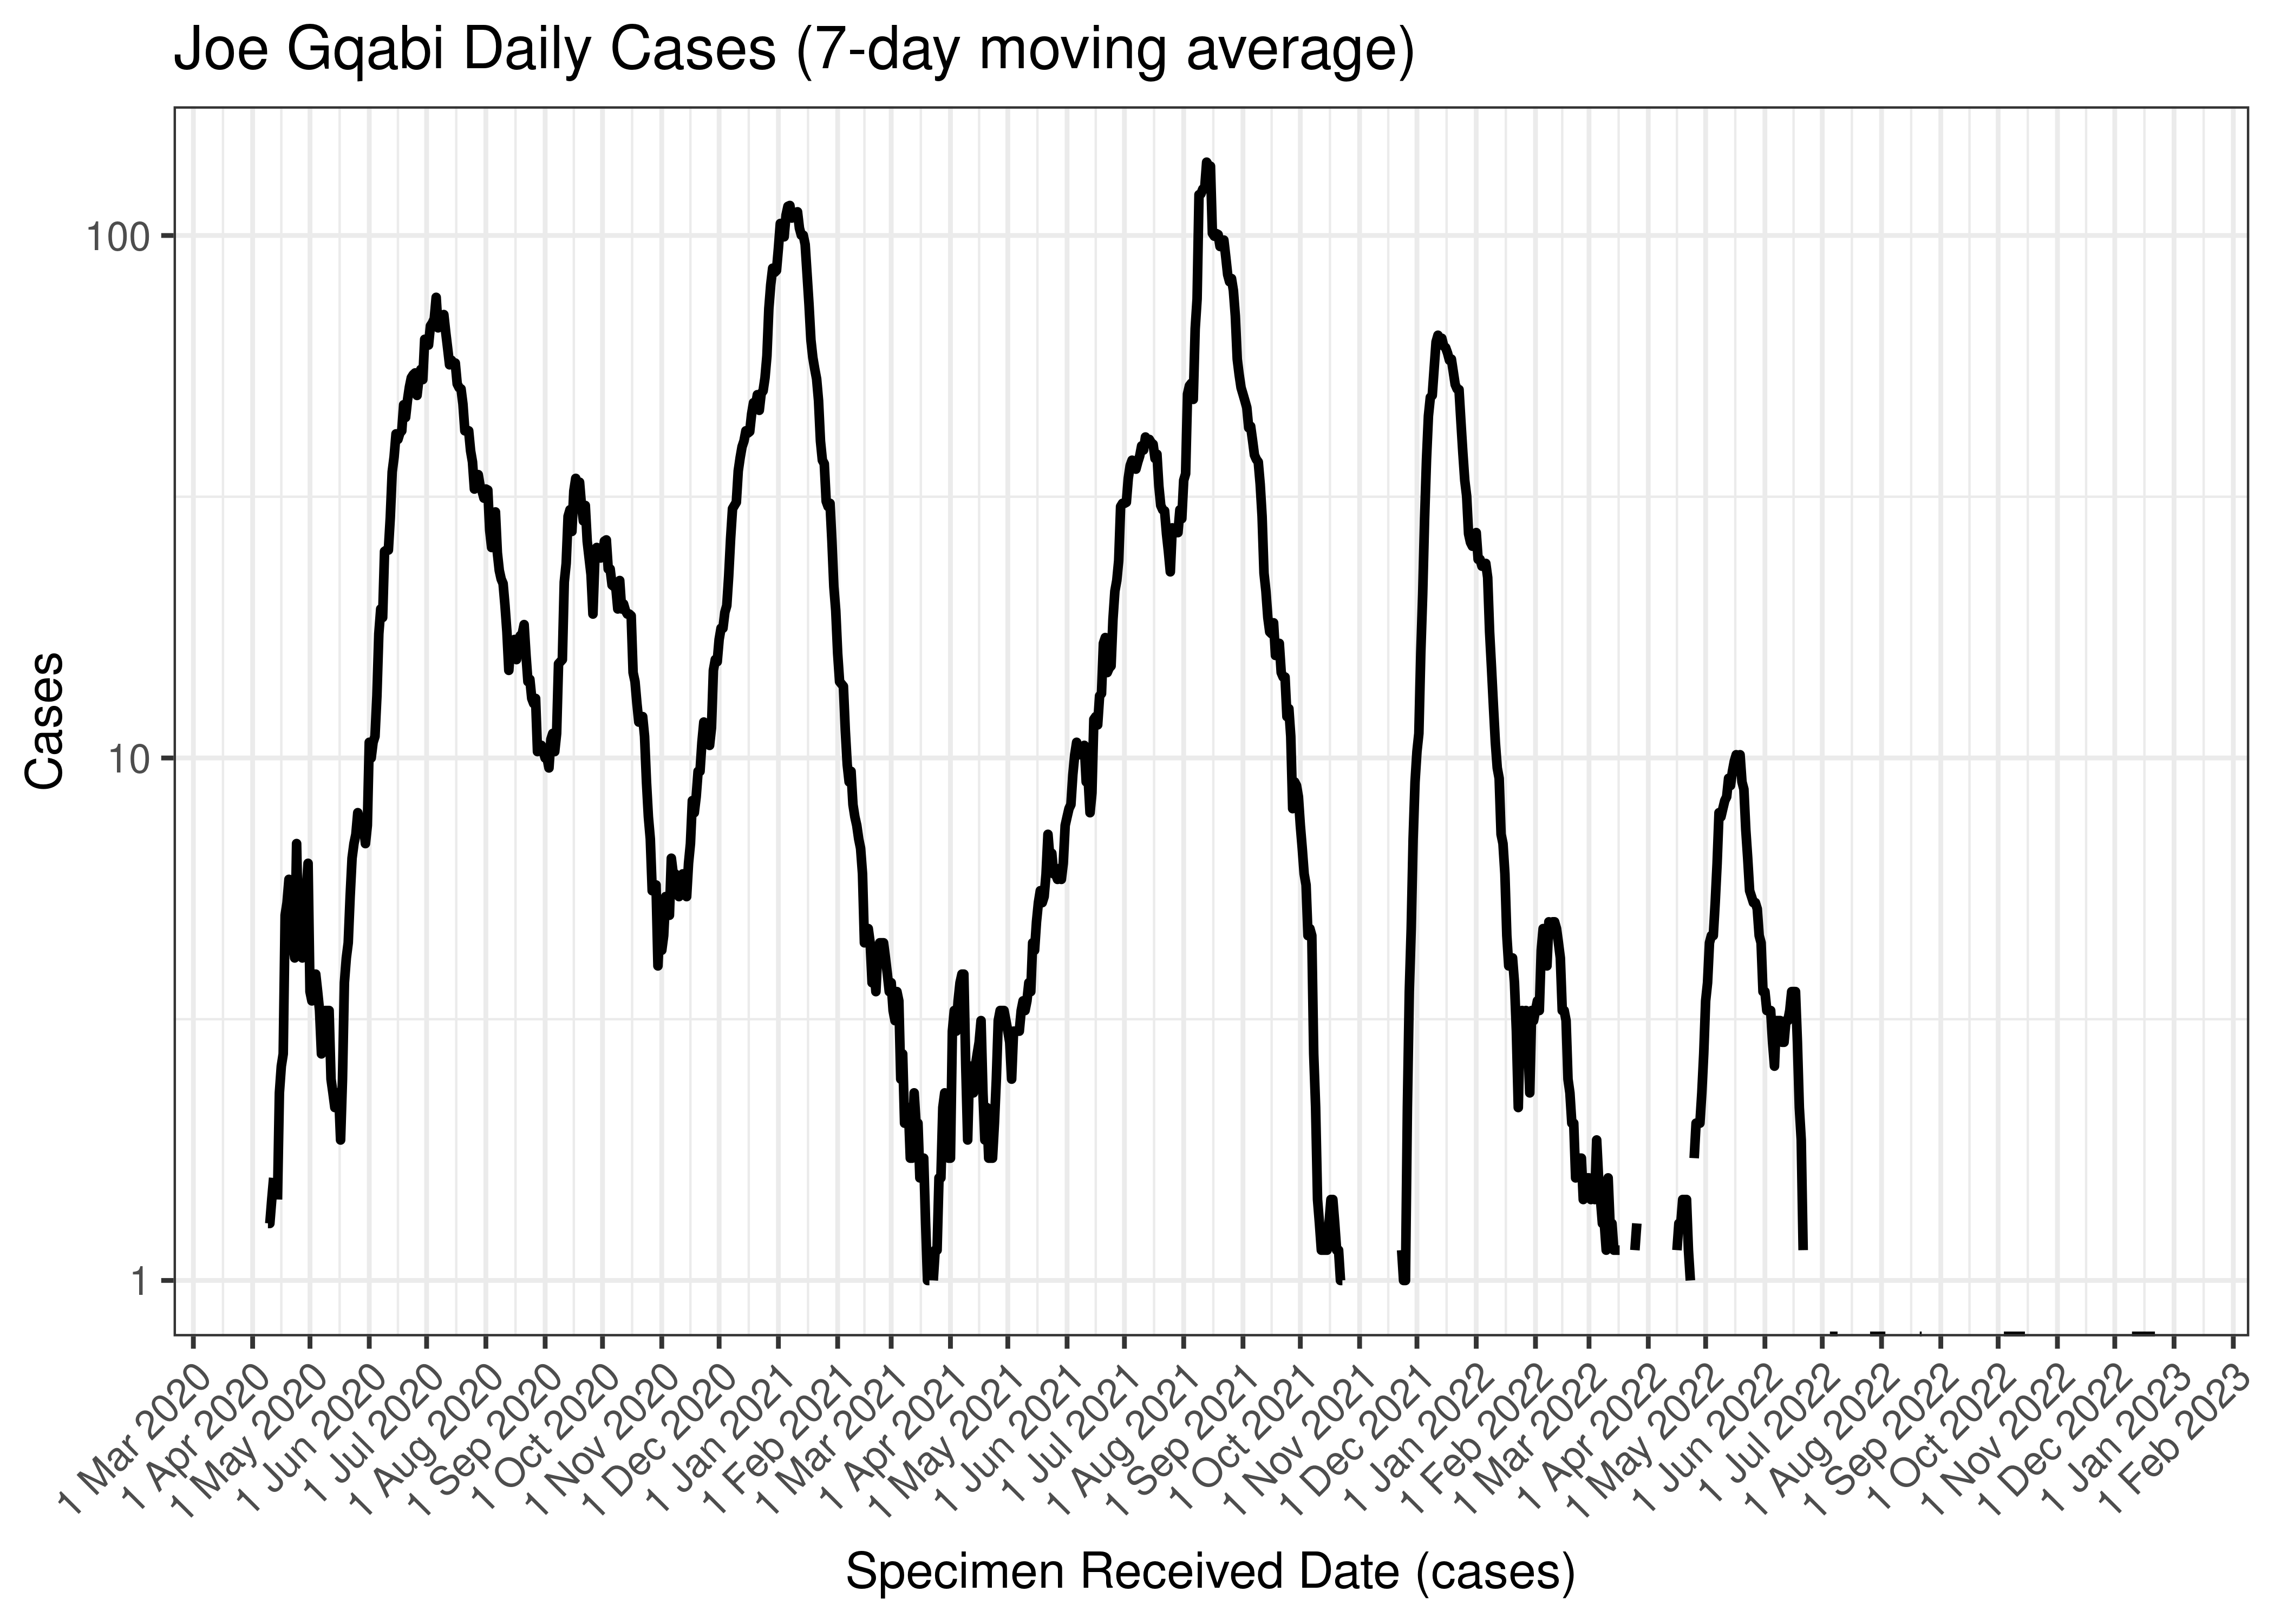
Joe Gqabi Daily Cases (7-day moving average)
Below the above chart is repeated for the last 30-days:
Joe Gqabi Daily Cases for Last 30-days (7-day moving average)
6.2.12.2 Reproduction Number
Below current (last weekly) reproduction number estimates are tabulated for Joe Gqabi.
| Count (Per Day) | Week Ending | Reproduction Number [95% Confidence Interval] | |
|---|---|---|---|
| Joe Gqabi | 0 | 2022-12-25 | 4.45 [0.11 - 16.47] |
Below the effective reproduction number for Joe Gqabi over the last 90 days are plotted together with a plot since start of the pandemic.
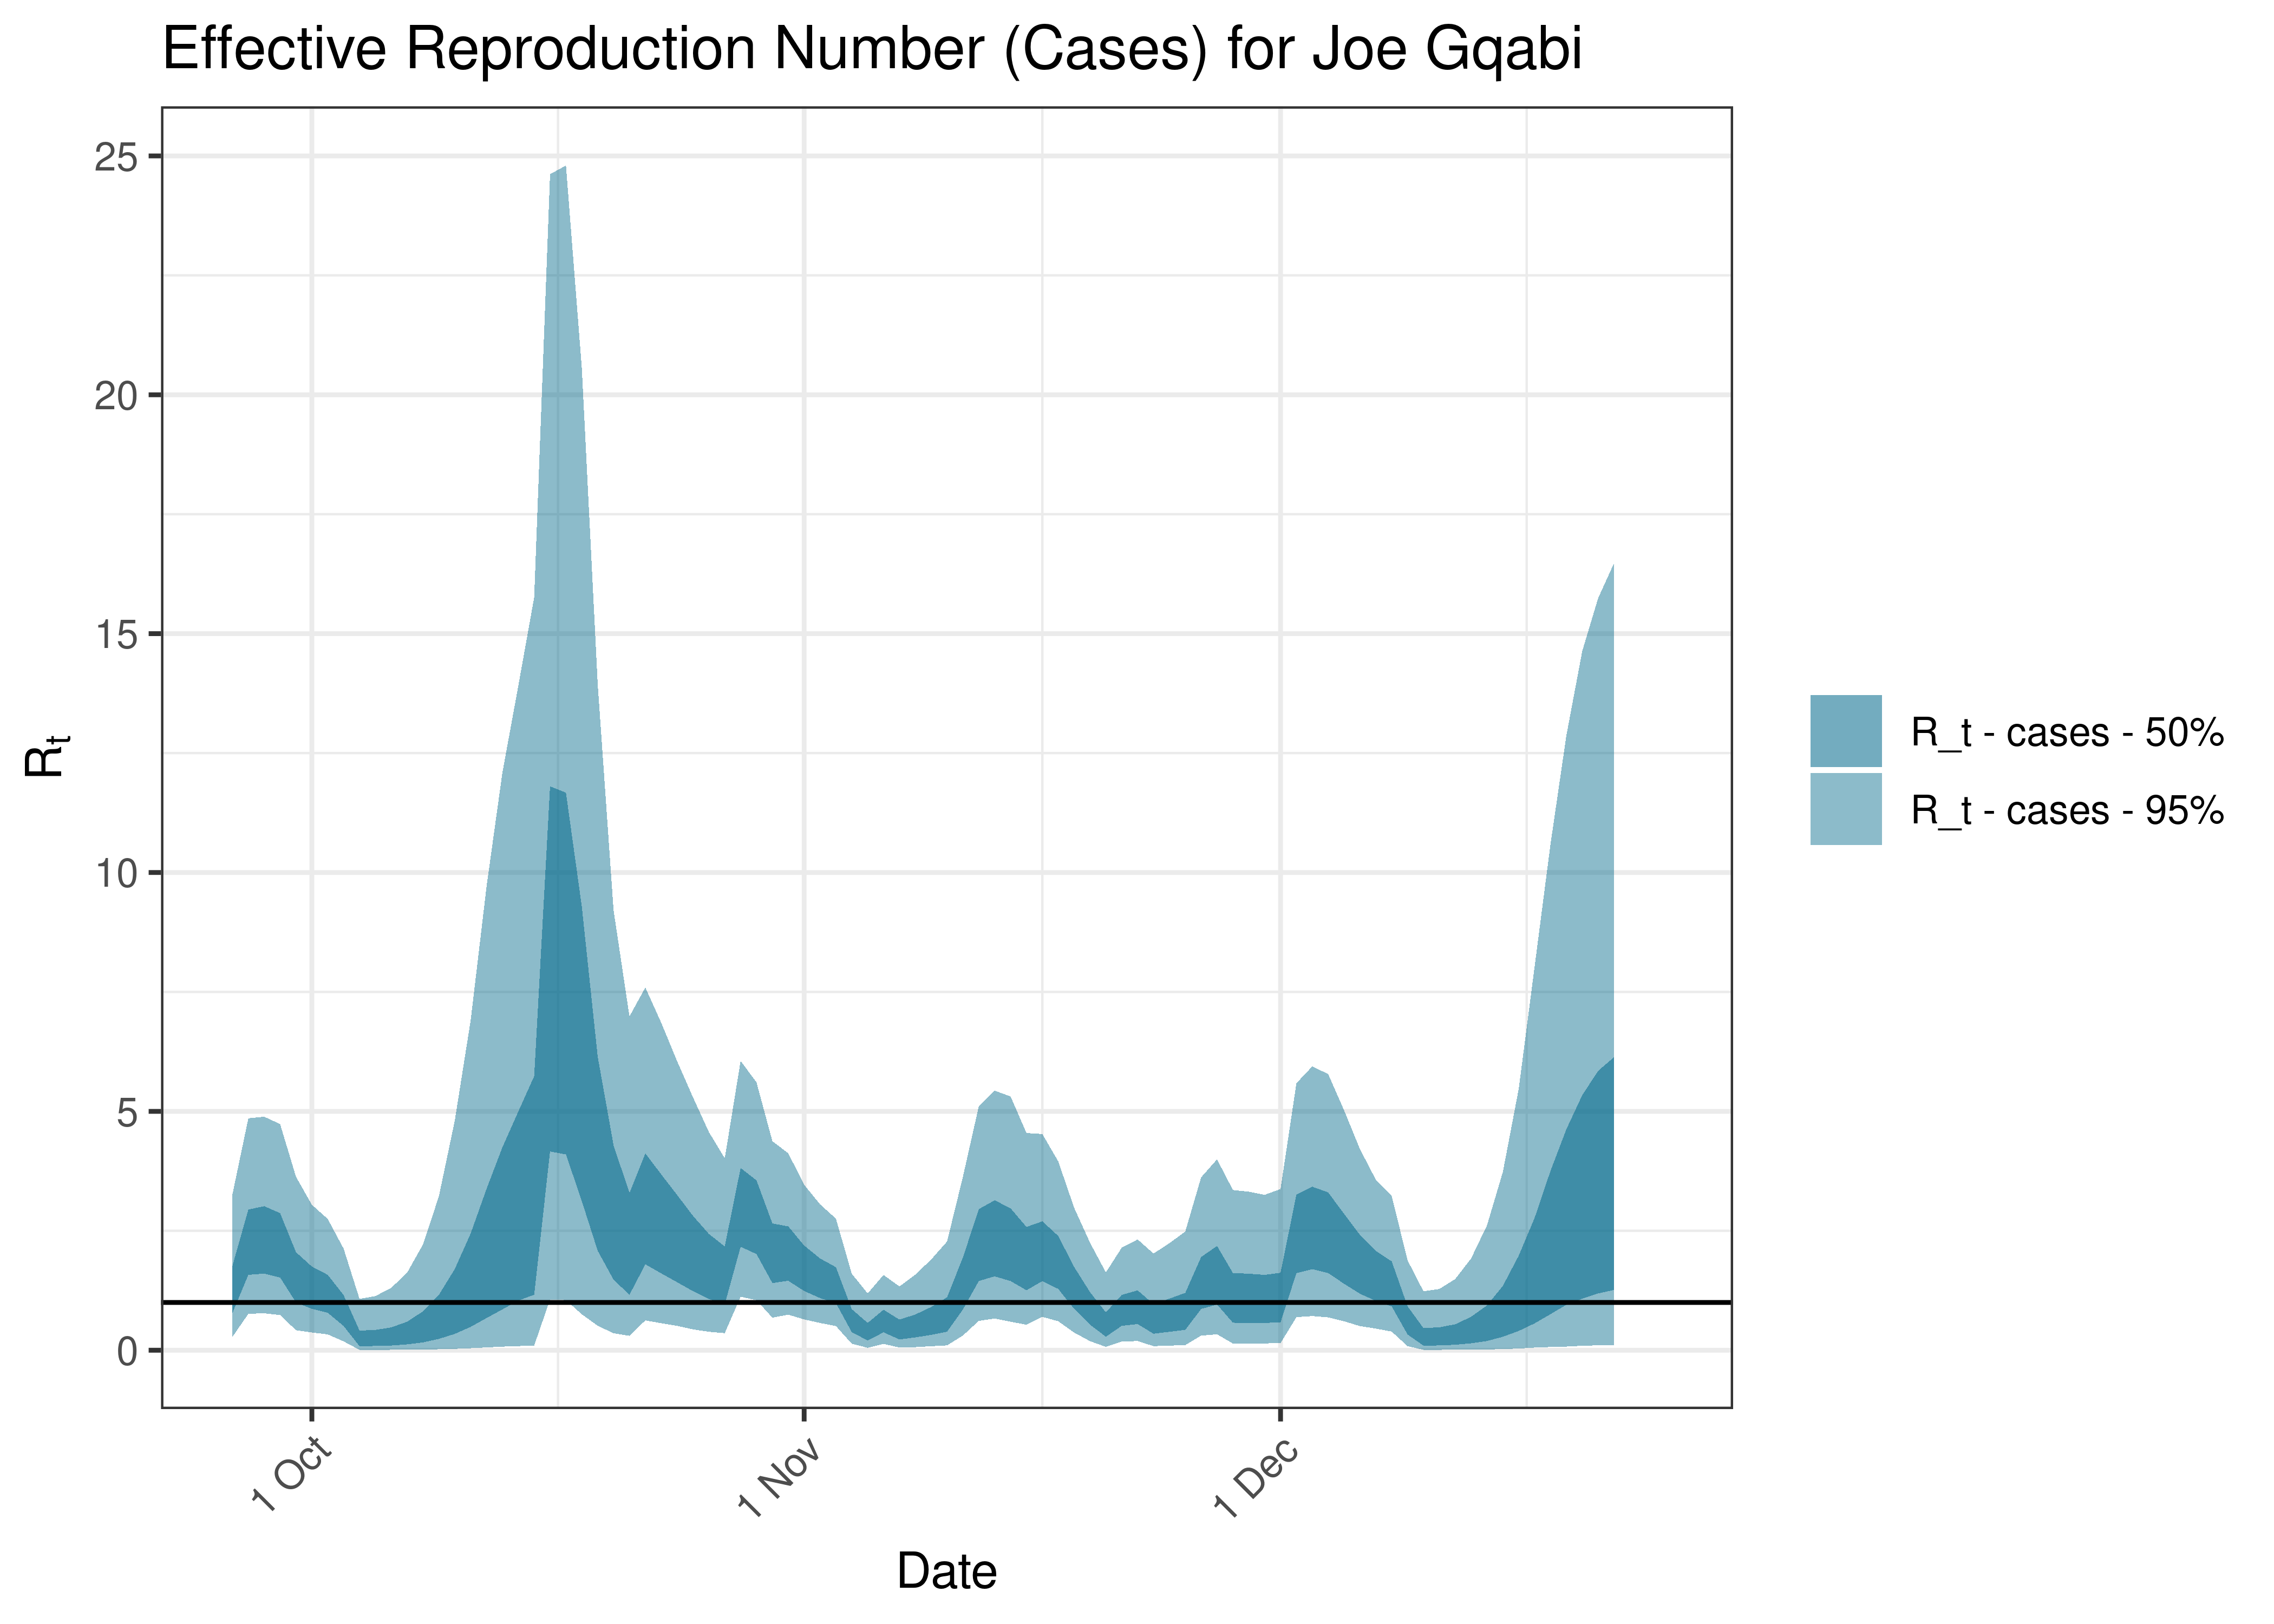
Estimated Effective Reproduction Number Based on Cases for Joe Gqabi over last 90 days
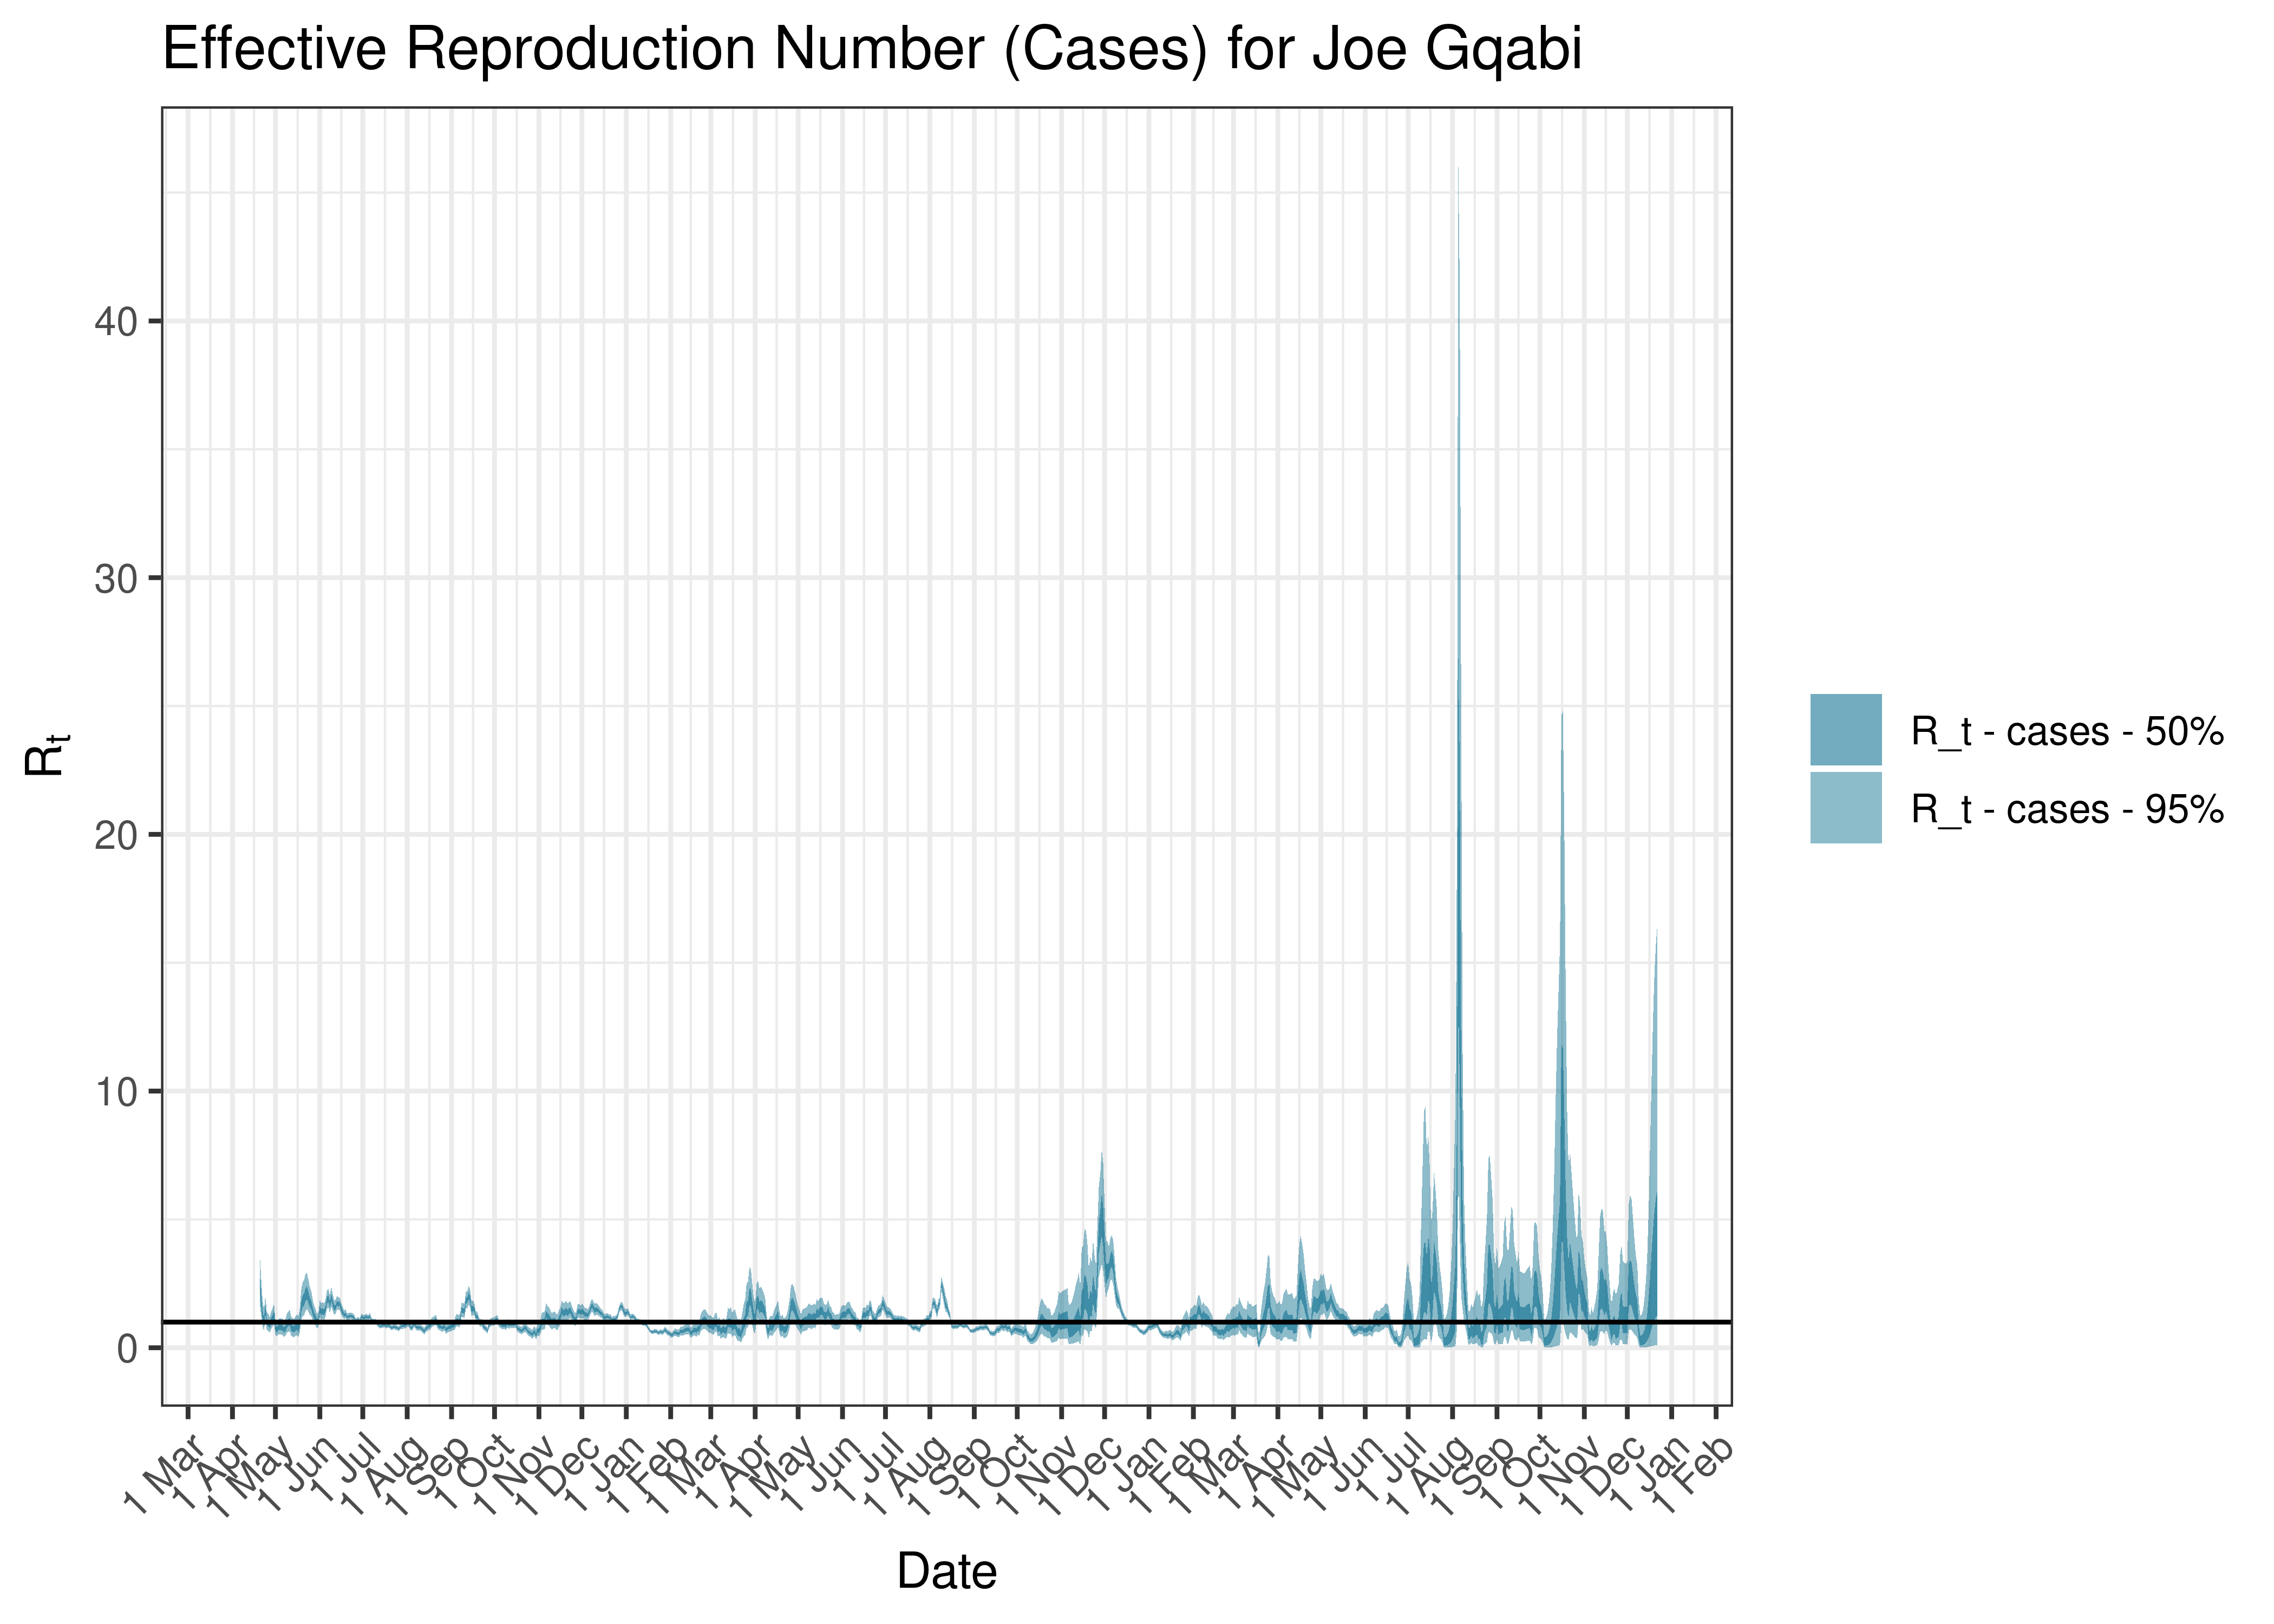
Estimated Effective Reproduction Number Based on Cases for Joe Gqabi since 1 April 2020
6.2.13 Nelson Mandela Bay Metro
6.2.13.1 Cases
Cases are tabulated by specimen received date below. Cases include estimates for late reporting in recent days as well as adjustments for any public holidays. A centred 7-day moving average is also shown. The peak daily cases in previous waves (as measured by the moving average) is also shown.
| Specimen Received Date | Cases | 7-day Moving Average | Comment |
|---|---|---|---|
| 2020-07-03 | 613 | 529 | Wave 1 Peak |
| 2020-11-17 | 821 | 709 | Wave 2 Peak |
| 2021-08-14 | 389 | 620 | Wave 3 Peak |
| 2021-12-24 | 777 | 794 | Wave 4 Peak |
| 2022-05-15 | 43 | 296 | Wave 5 Peak (to date) |
Below a 7-day moving average daily case count are plotted for Nelson Mandela Bay Metro on a log scale since start of the epidemic:
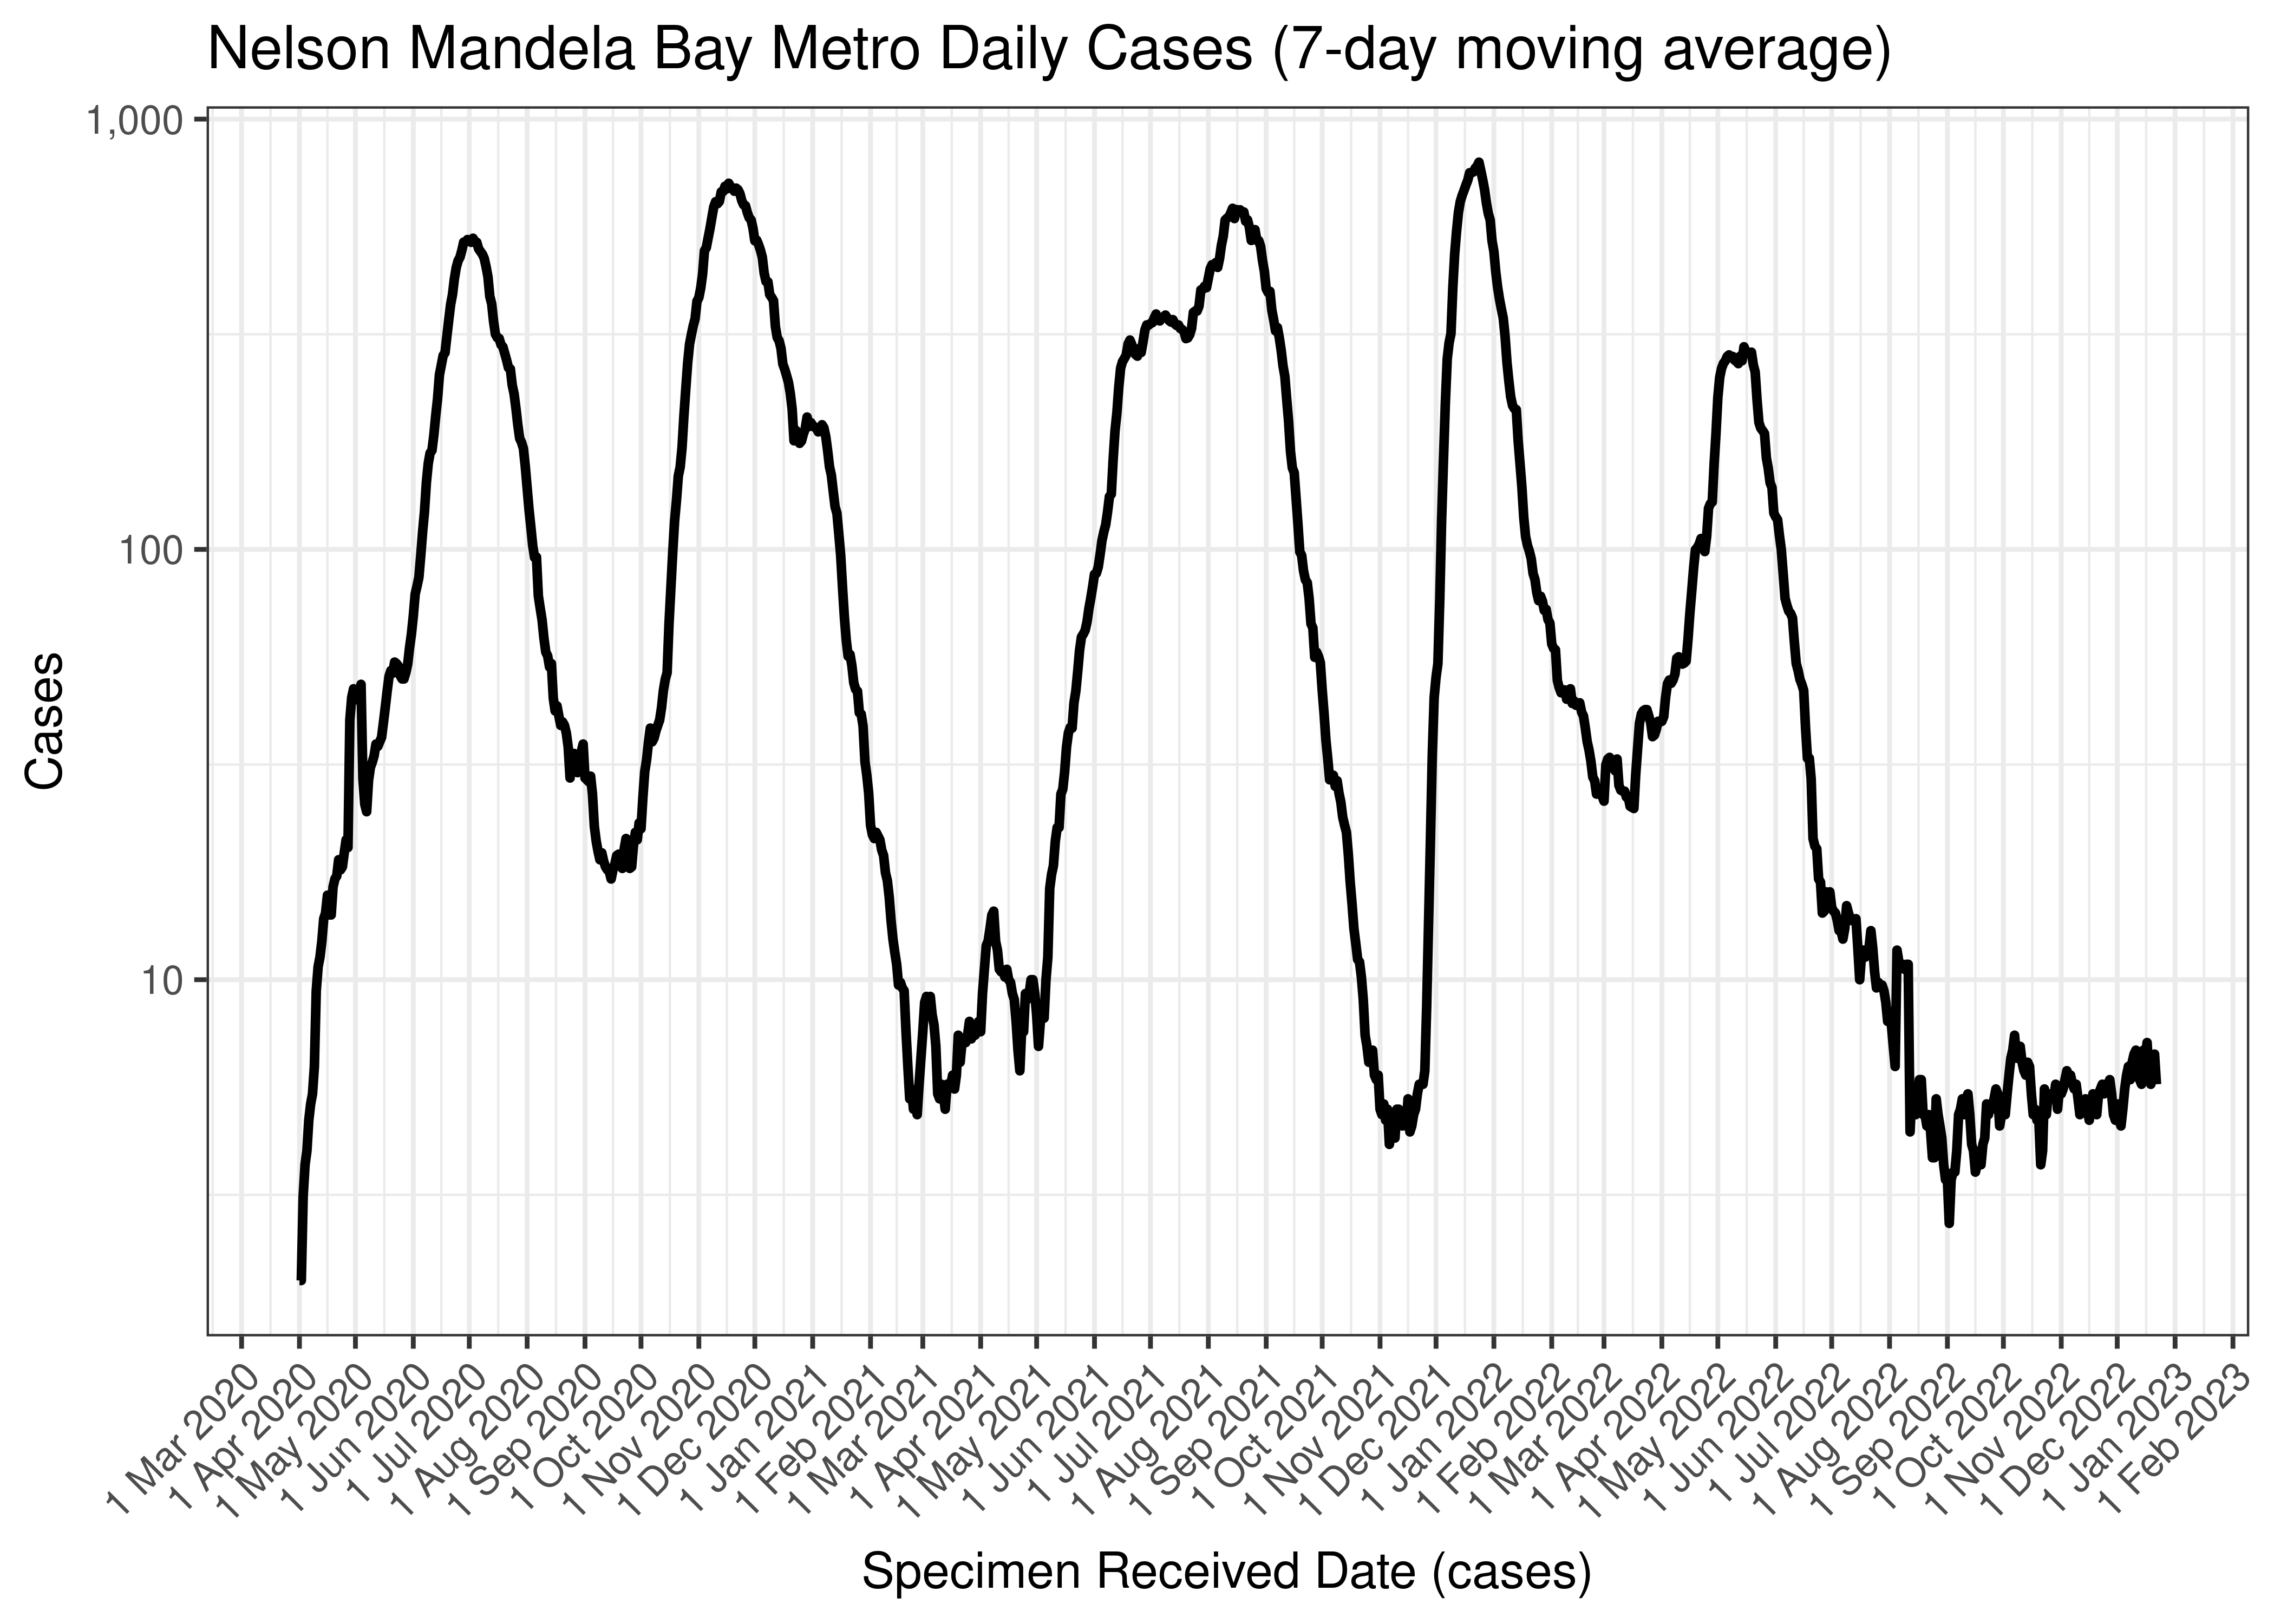
Nelson Mandela Bay Metro Daily Cases (7-day moving average)
Below the above chart is repeated for the last 30-days:
Nelson Mandela Bay Metro Daily Cases for Last 30-days (7-day moving average)
6.2.13.2 Excess Deaths
Excess deaths are tabulated by date of death below. A centred 7-day moving average is also shown. The peak daily deaths in previous waves (as measured by the moving average) is also shown.
| Specimen Received Date | Excess Deaths | 7-day Moving Average | Comment |
|---|---|---|---|
| 2020-07-15 | 40 | 40 | Wave 1 Peak |
| 2020-11-18 | 65 | 65 | Wave 2 Peak |
| 2021-09-01 | 31 | 31 | Wave 3 Peak |
| 2022-01-05 | 18 | 18 | Wave 4 Peak |
| 2022-05-04 | 10 | 10 | Wave 5 Peak (to date) |
| 2022-12-03 | -2 | 1 | |
| 2022-12-04 | 4 | 2 | |
| 2022-12-05 | 4 | 2 | |
| 2022-12-06 | 4 | 3 | |
| 2022-12-07 | 4 | 4 | |
| 2022-12-08 | 4 | NA | |
| 2022-12-09 | 4 | NA | |
| 2022-12-10 | 4 | NA |
Below a 7-day moving average daily excess deaths is plotted for Nelson Mandela Bay Metro on a log scale since start of the epidemic:
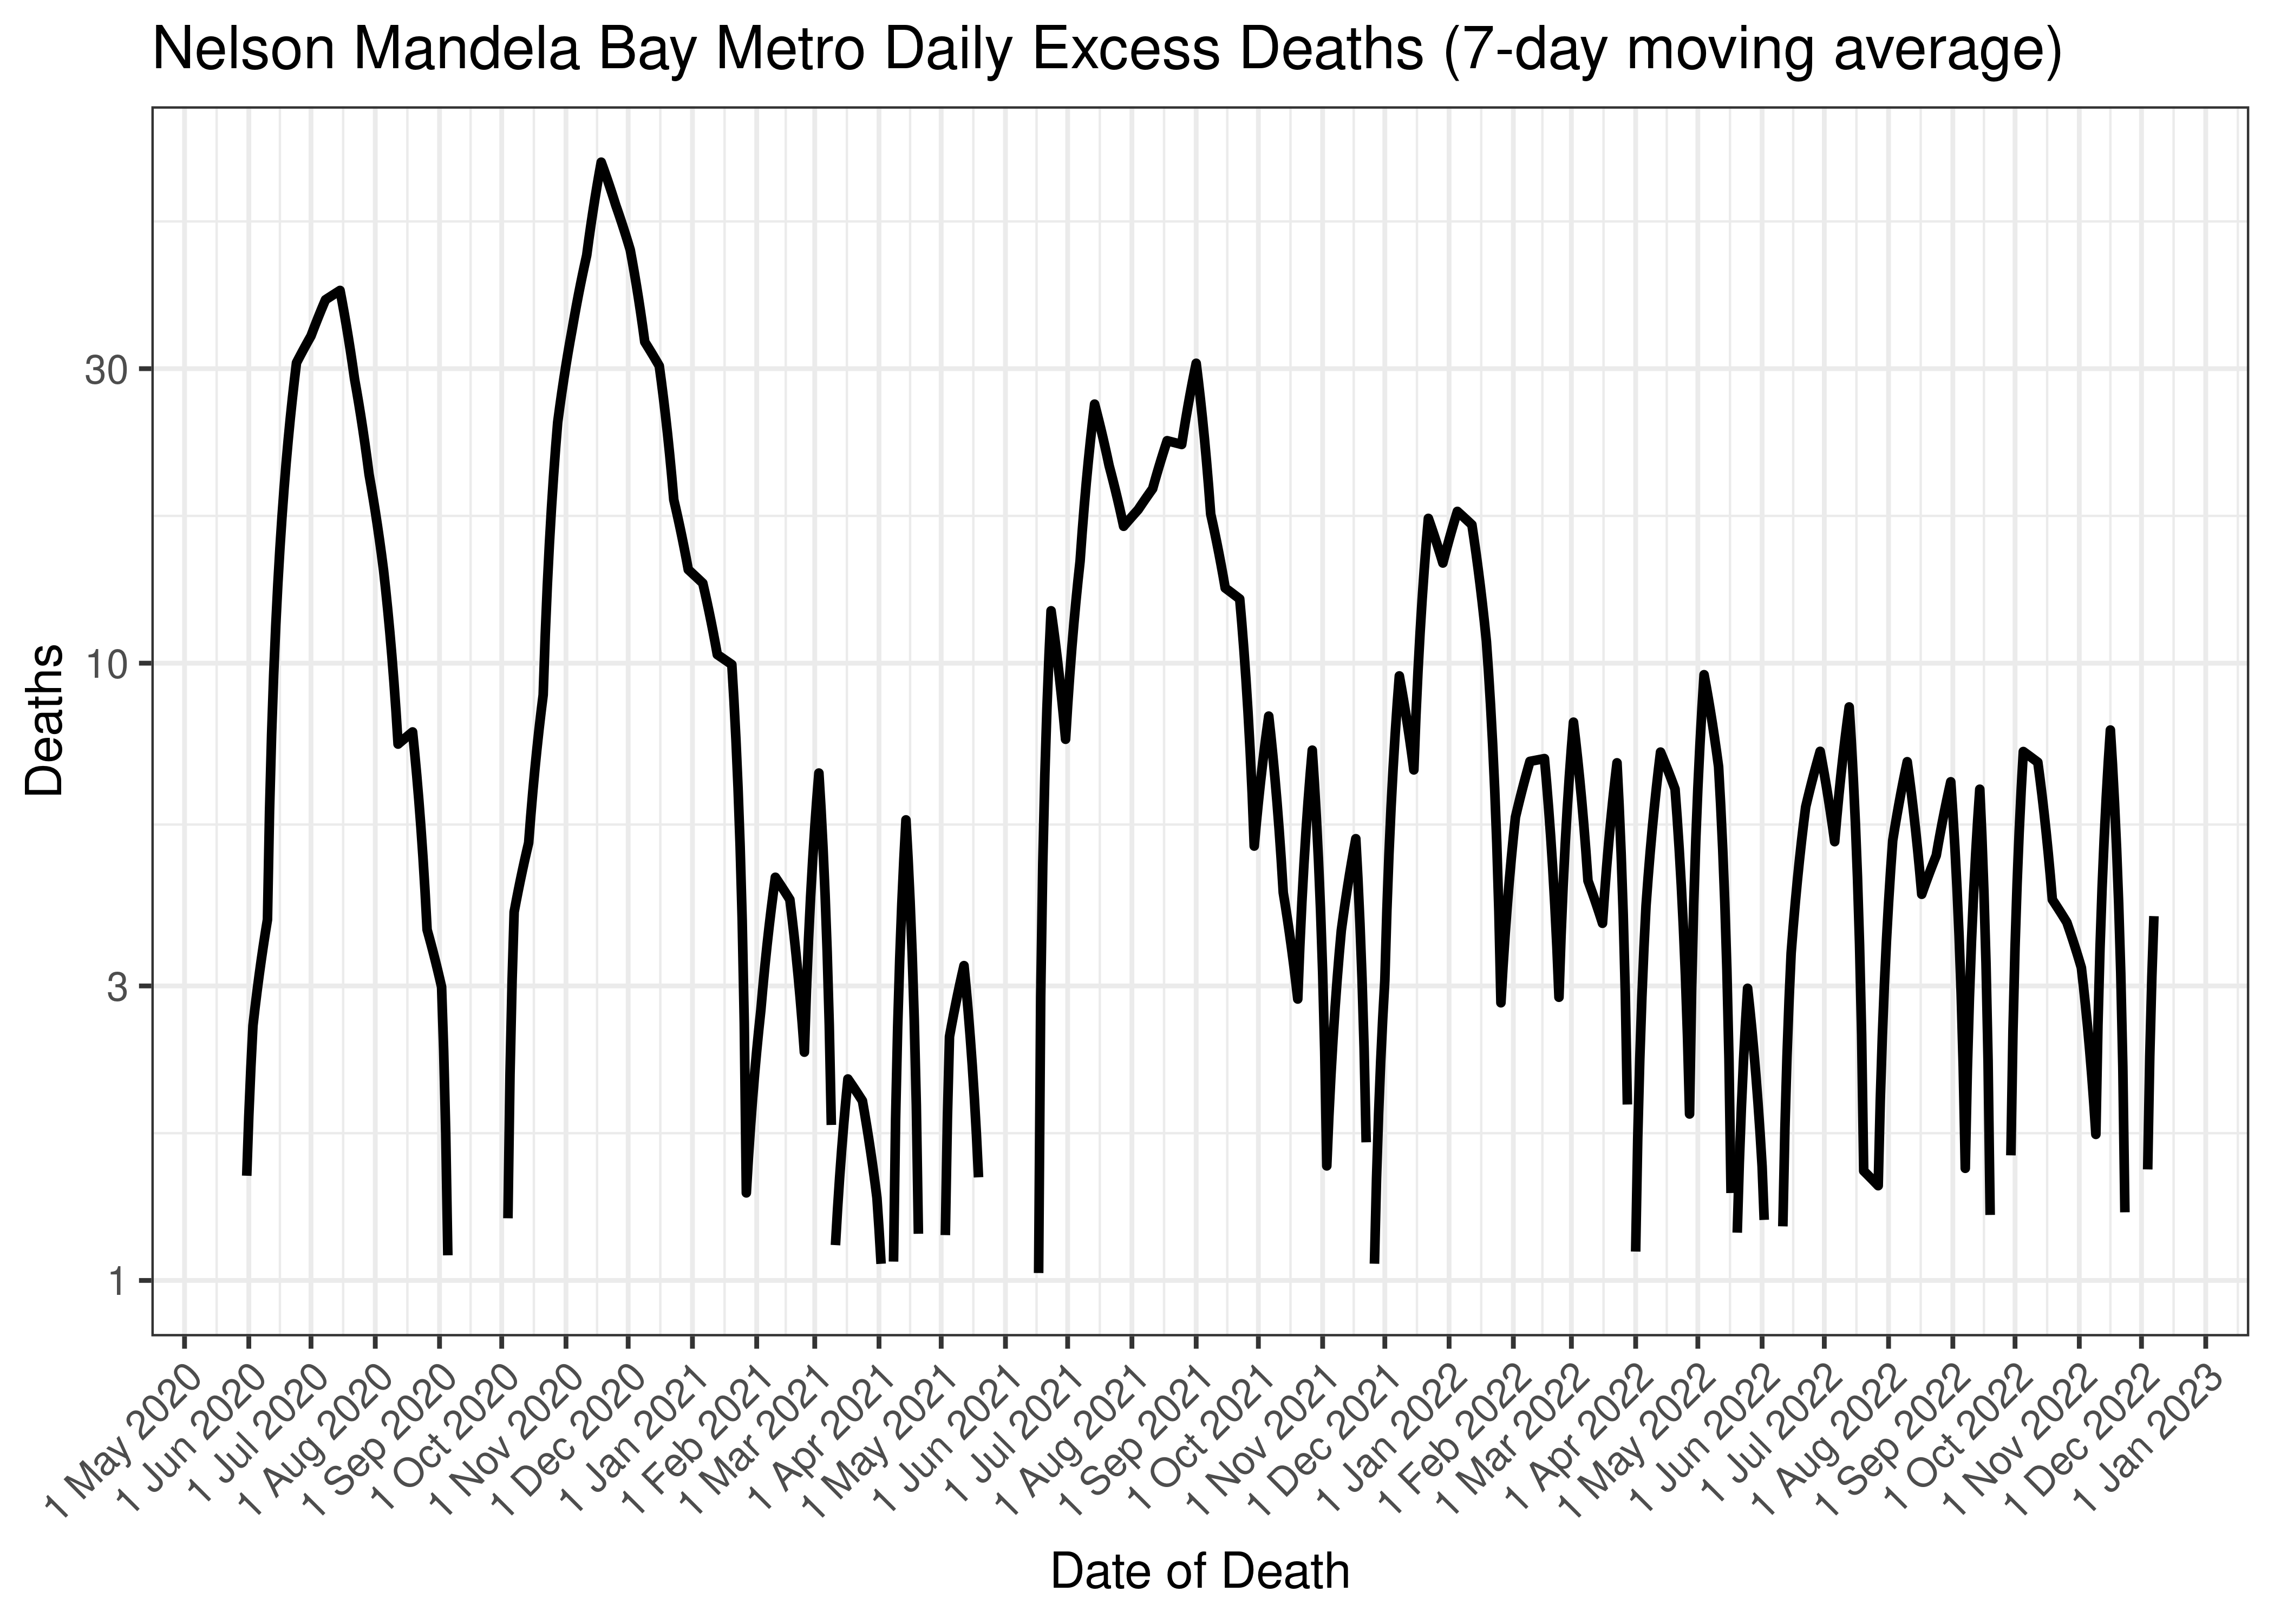
Nelson Mandela Bay Metro Daily Excess Deaths (7-day moving average)
Below the above chart is repeated for the last 30-days:
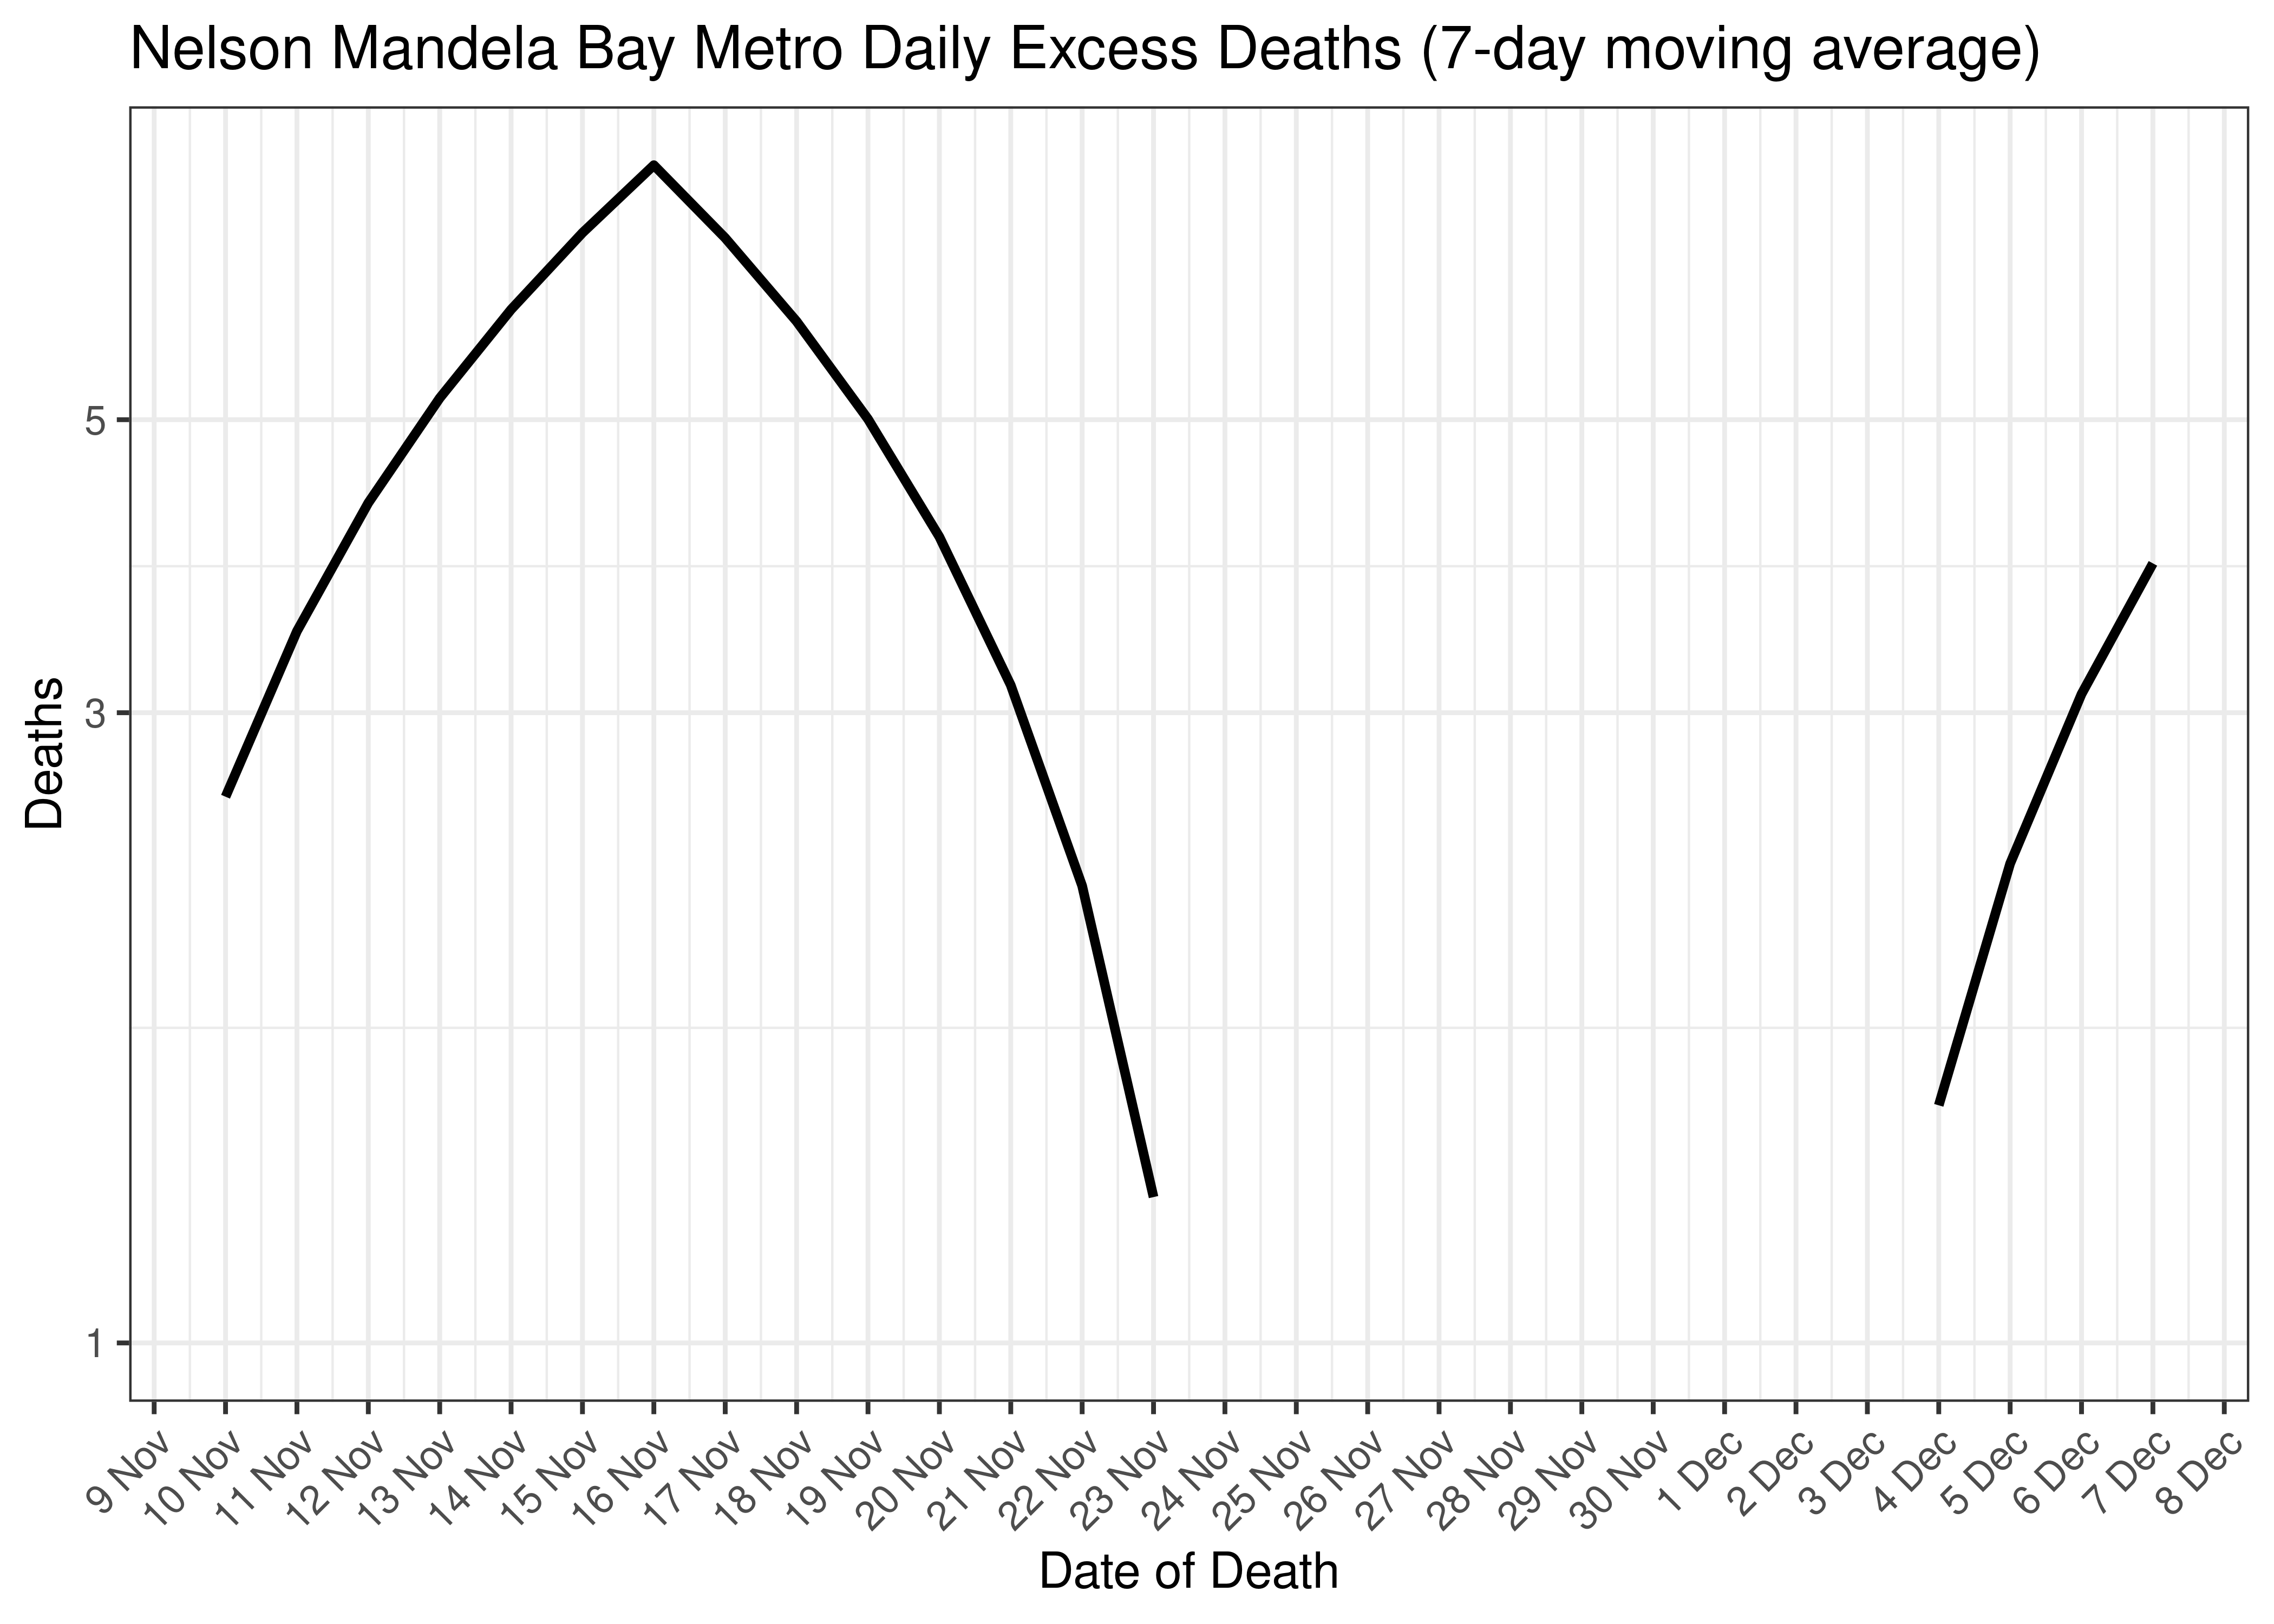
Nelson Mandela Bay Metro Excess Deaths for Last 30-days (7-day moving average)
6.2.13.3 Cases and Excess Deaths Combined
Below a 7-day moving average daily case count and estimated daily excess deaths are plotted for Nelson Mandela Bay Metro on a log scale since start of the epidemic:
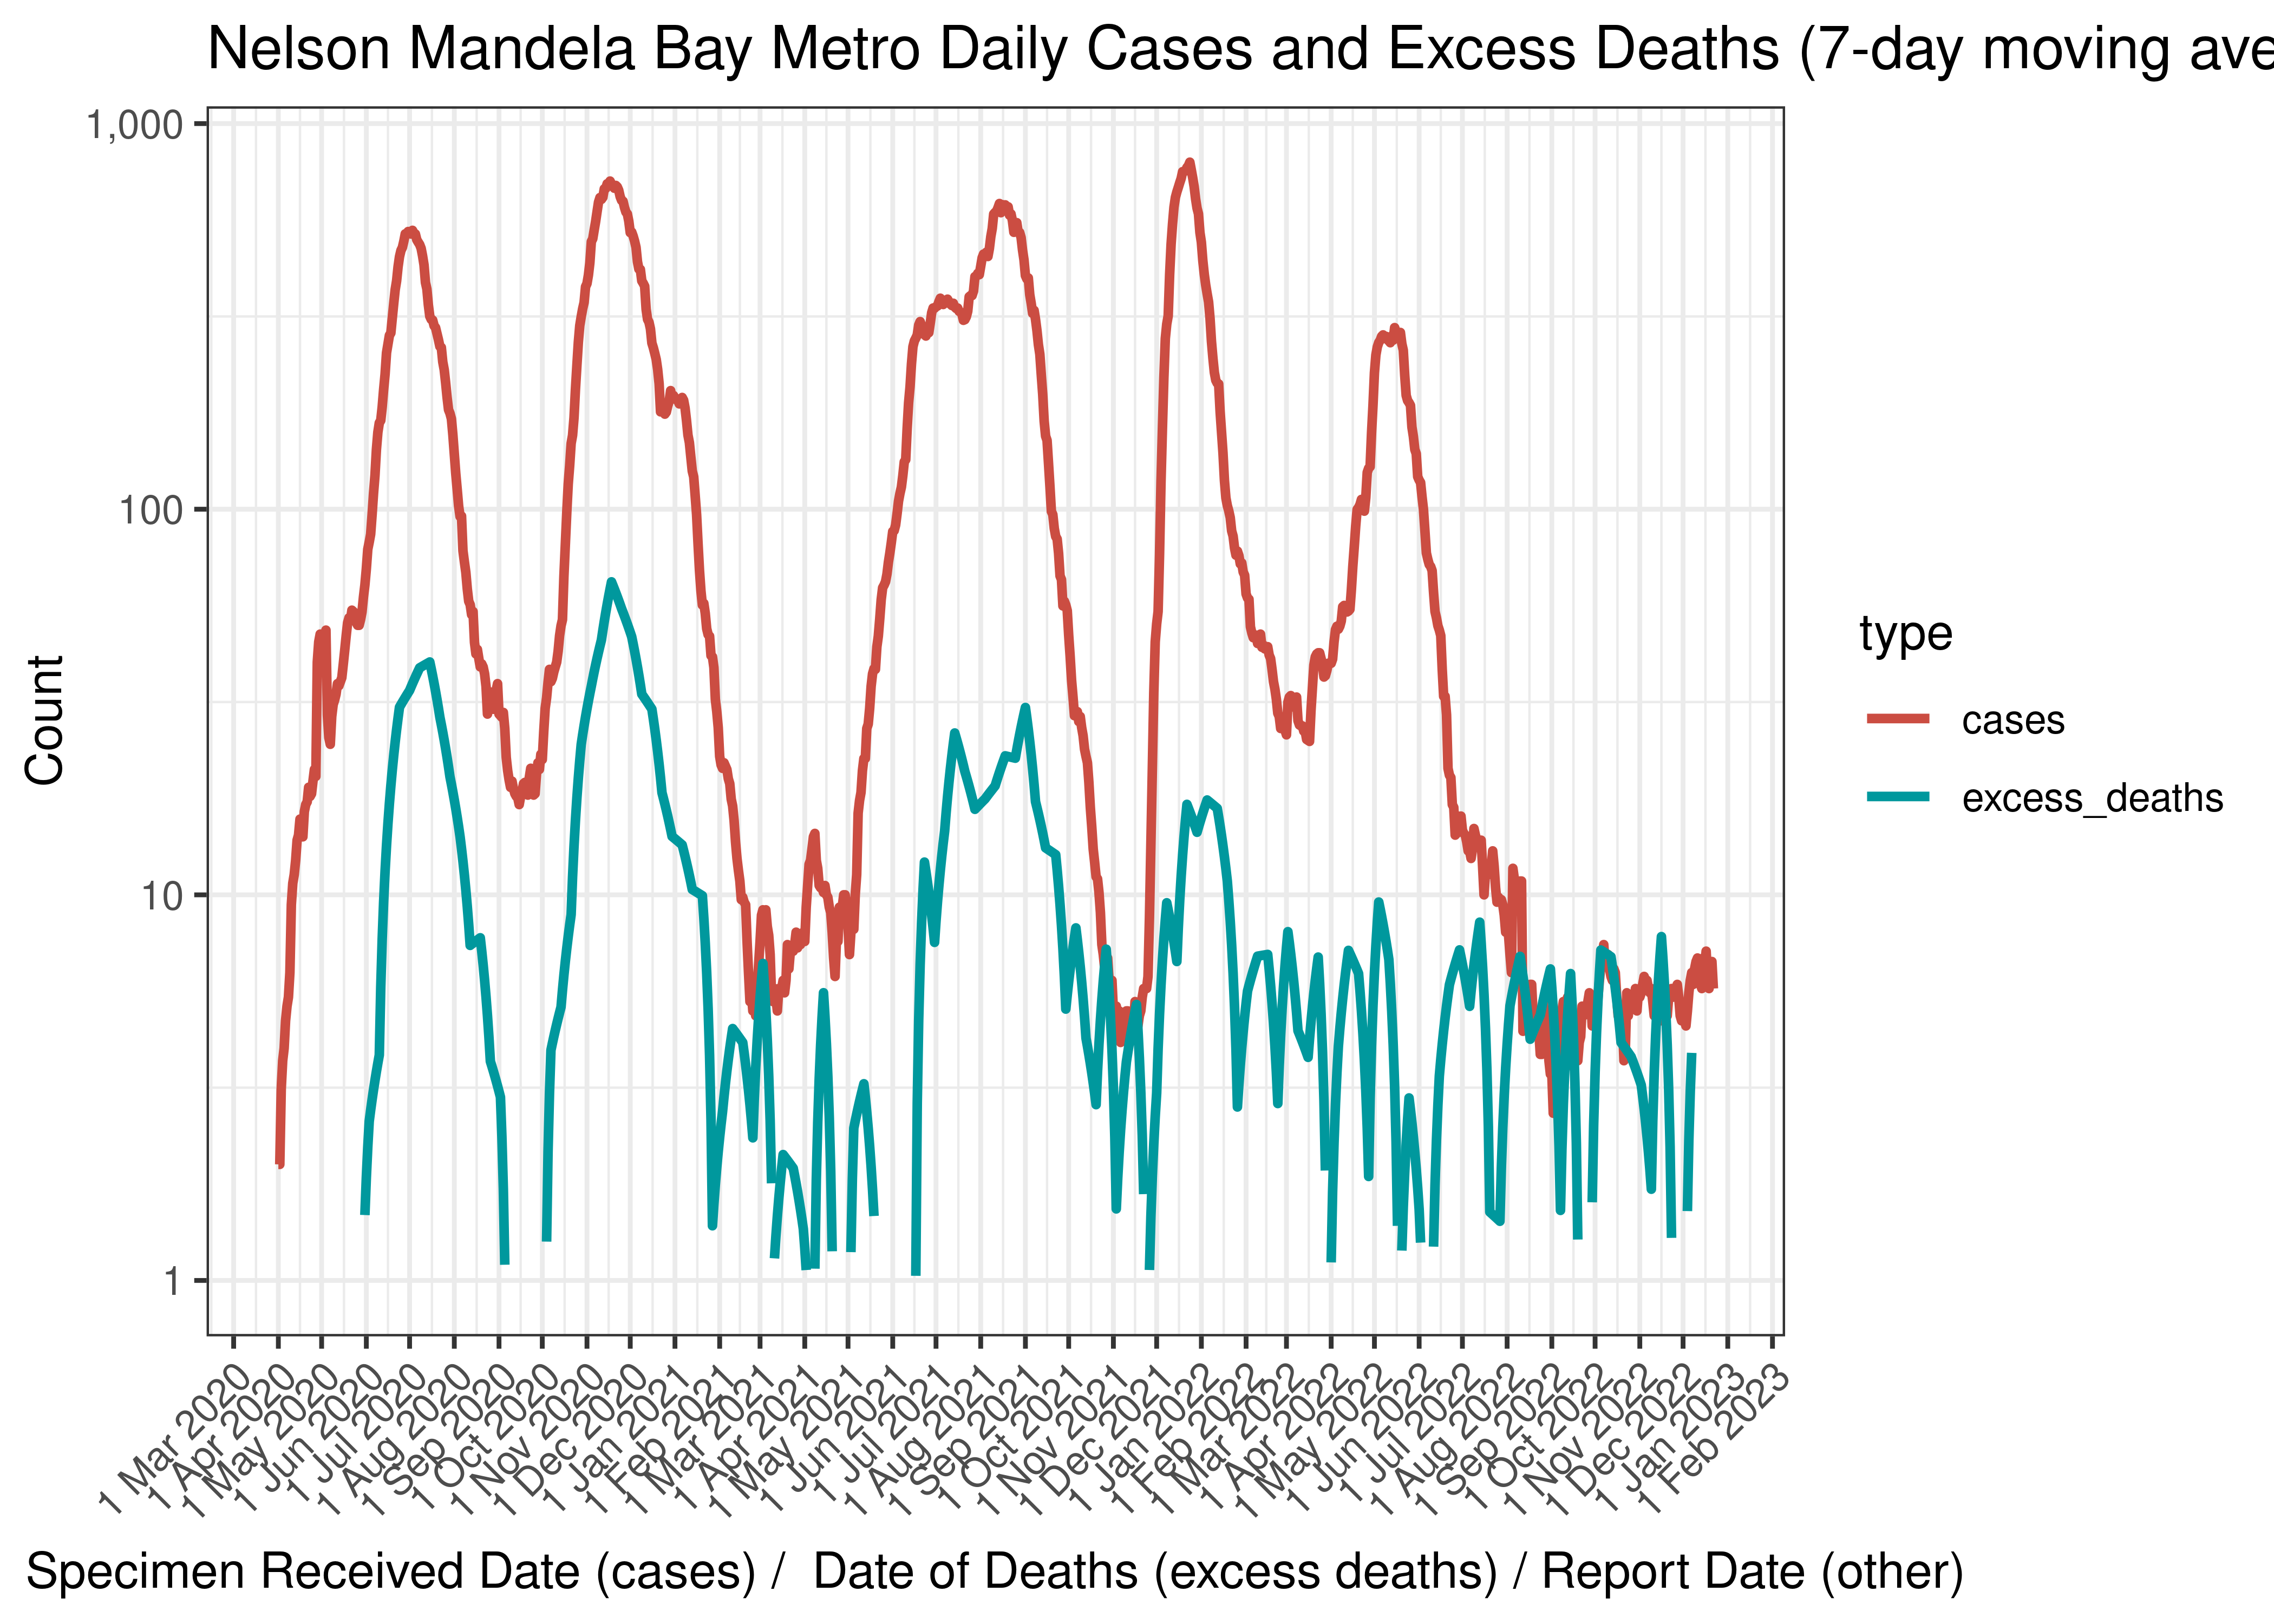
Nelson Mandela Bay Metro Daily Cases and Excess Deaths (7-day moving average)
Below the above chart is repeated for the last 30-days:
Nelson Mandela Bay Metro Daily Cases and Deaths (if available) for Last 30-days (7-day moving average)
6.2.13.4 Reproduction Number
Below current (last weekly) reproduction number estimates are tabulated for Nelson Mandela Bay Metro.
| Count (Per Day) | Week Ending | Reproduction Number [95% Confidence Interval] | |
|---|---|---|---|
| Nelson Mandela Bay Metro | 5.7 | 2022-12-25 | 0.92 [0.66 - 1.22] |
Below the effective reproduction number for Nelson Mandela Bay Metro over the last 90 days are plotted together with a plot since start of the pandemic.
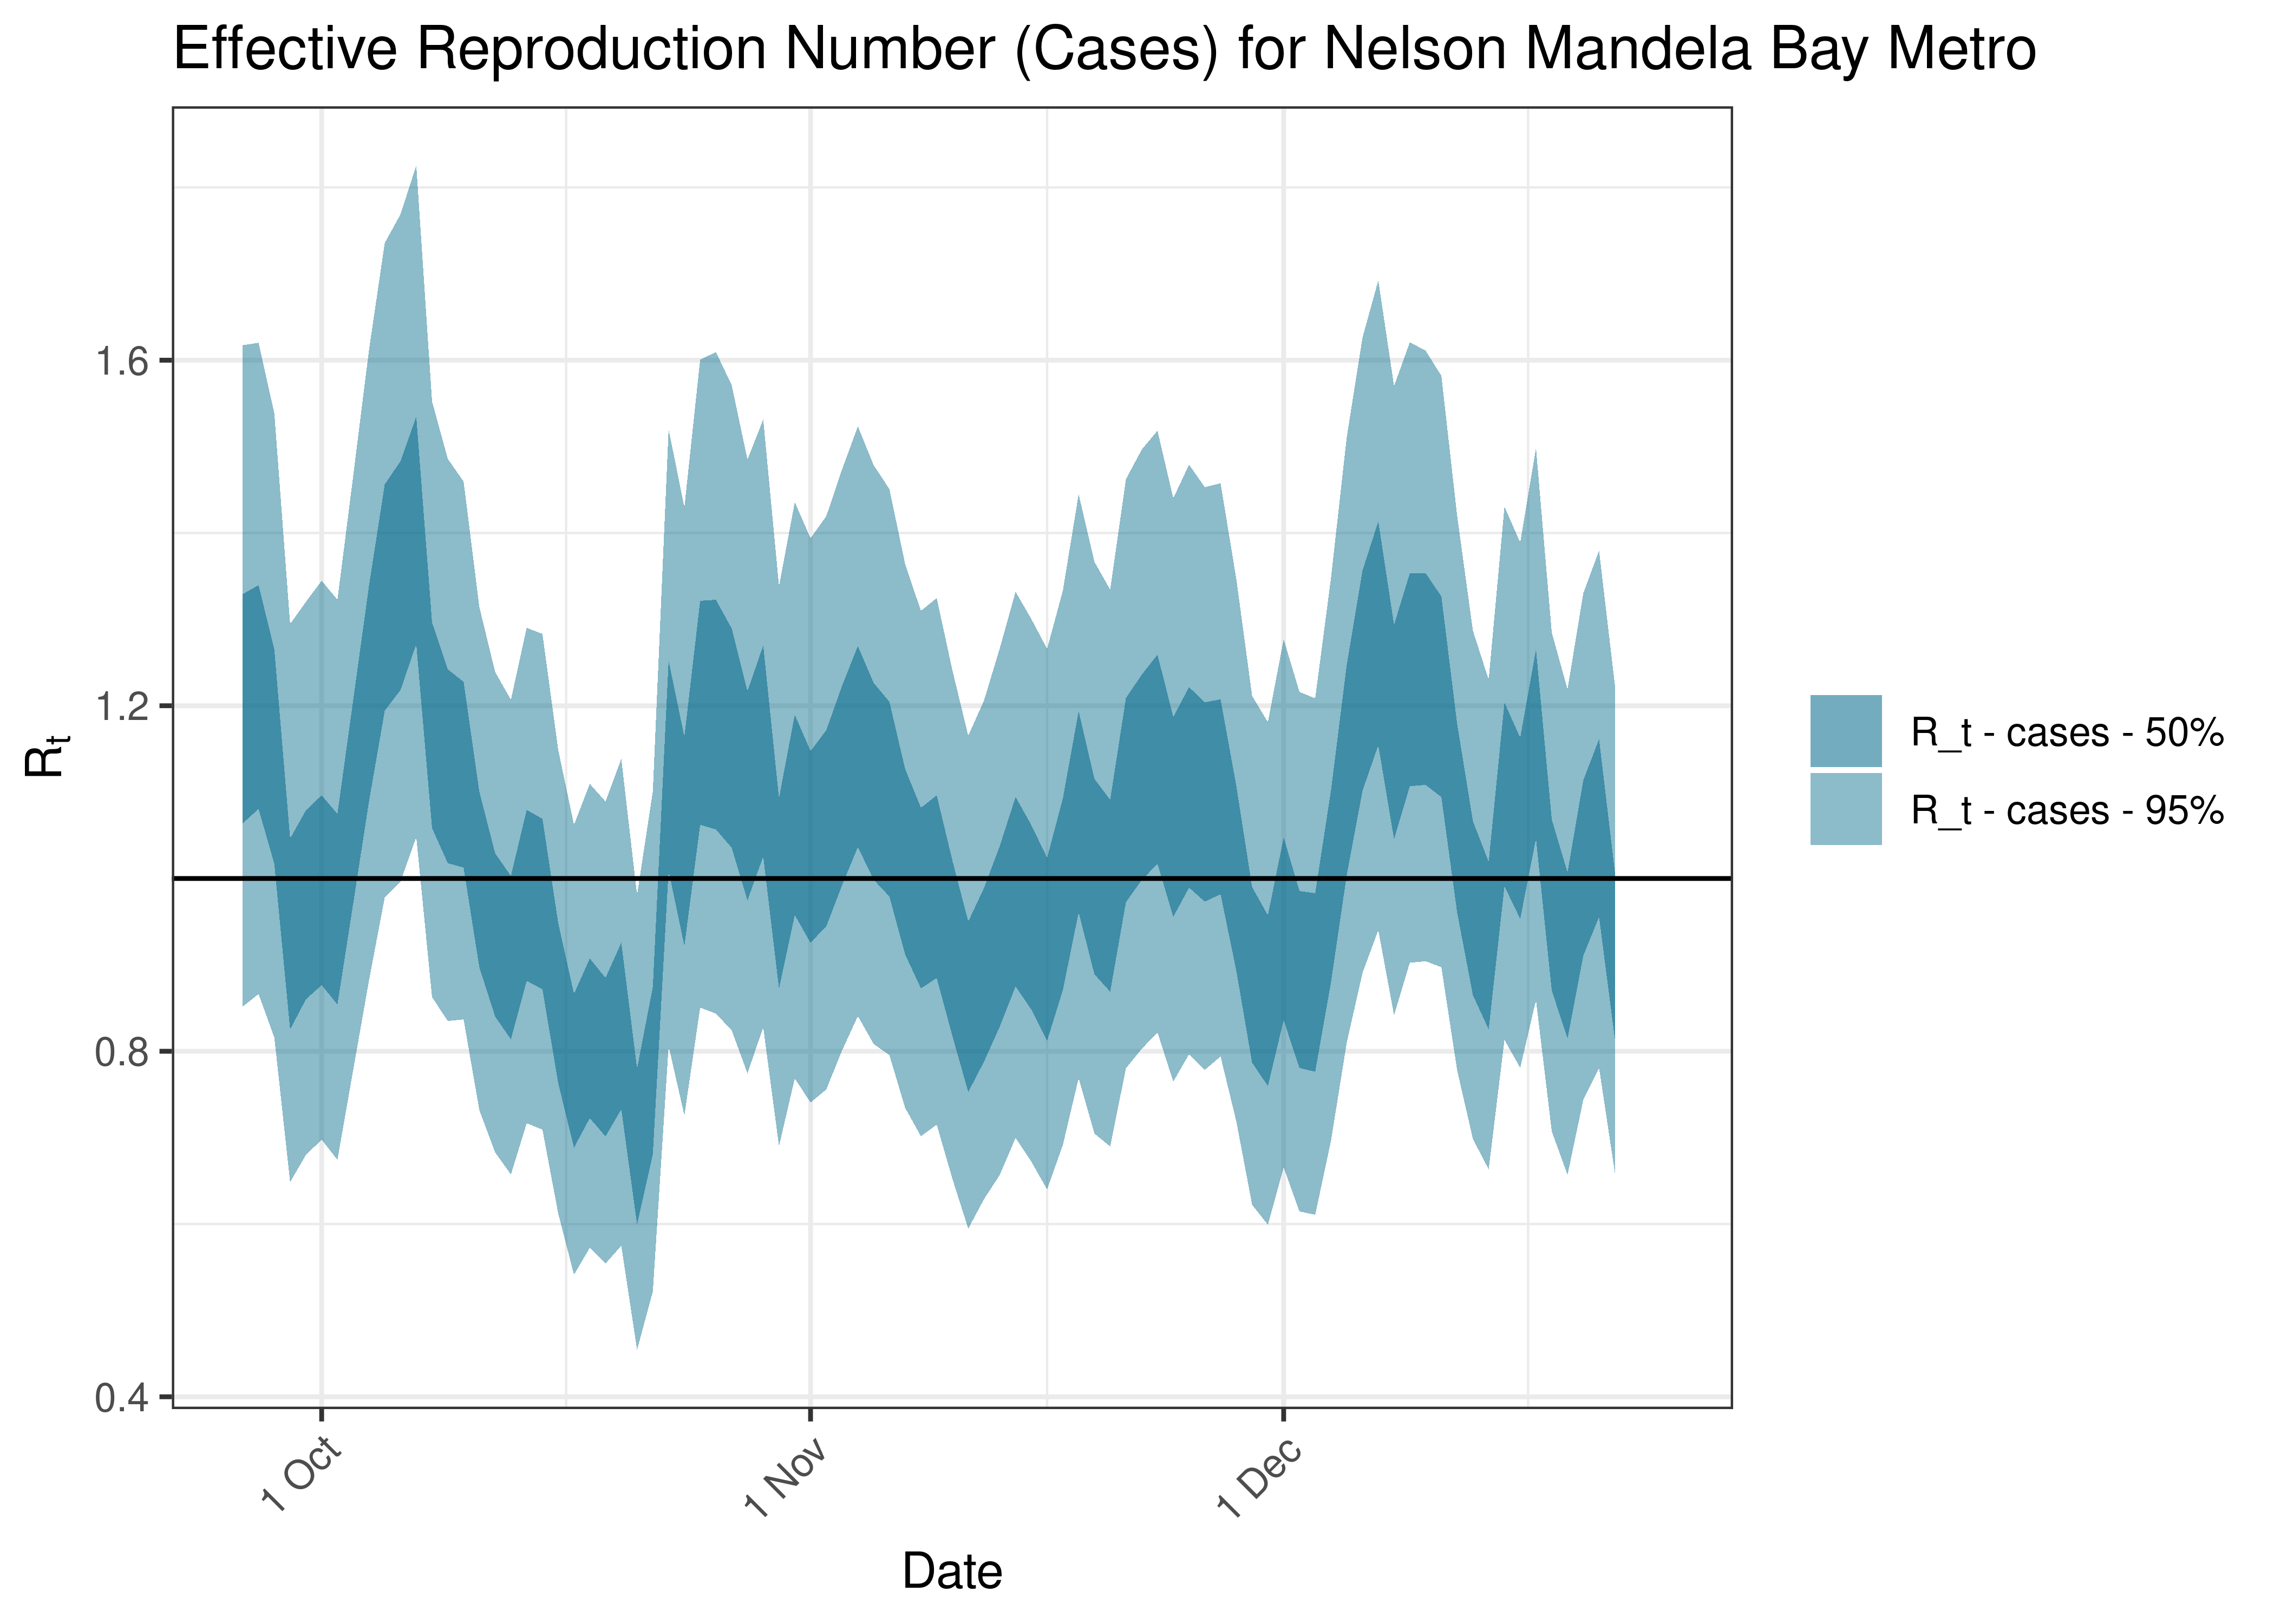
Estimated Effective Reproduction Number Based on Cases for Nelson Mandela Bay Metro over last 90 days
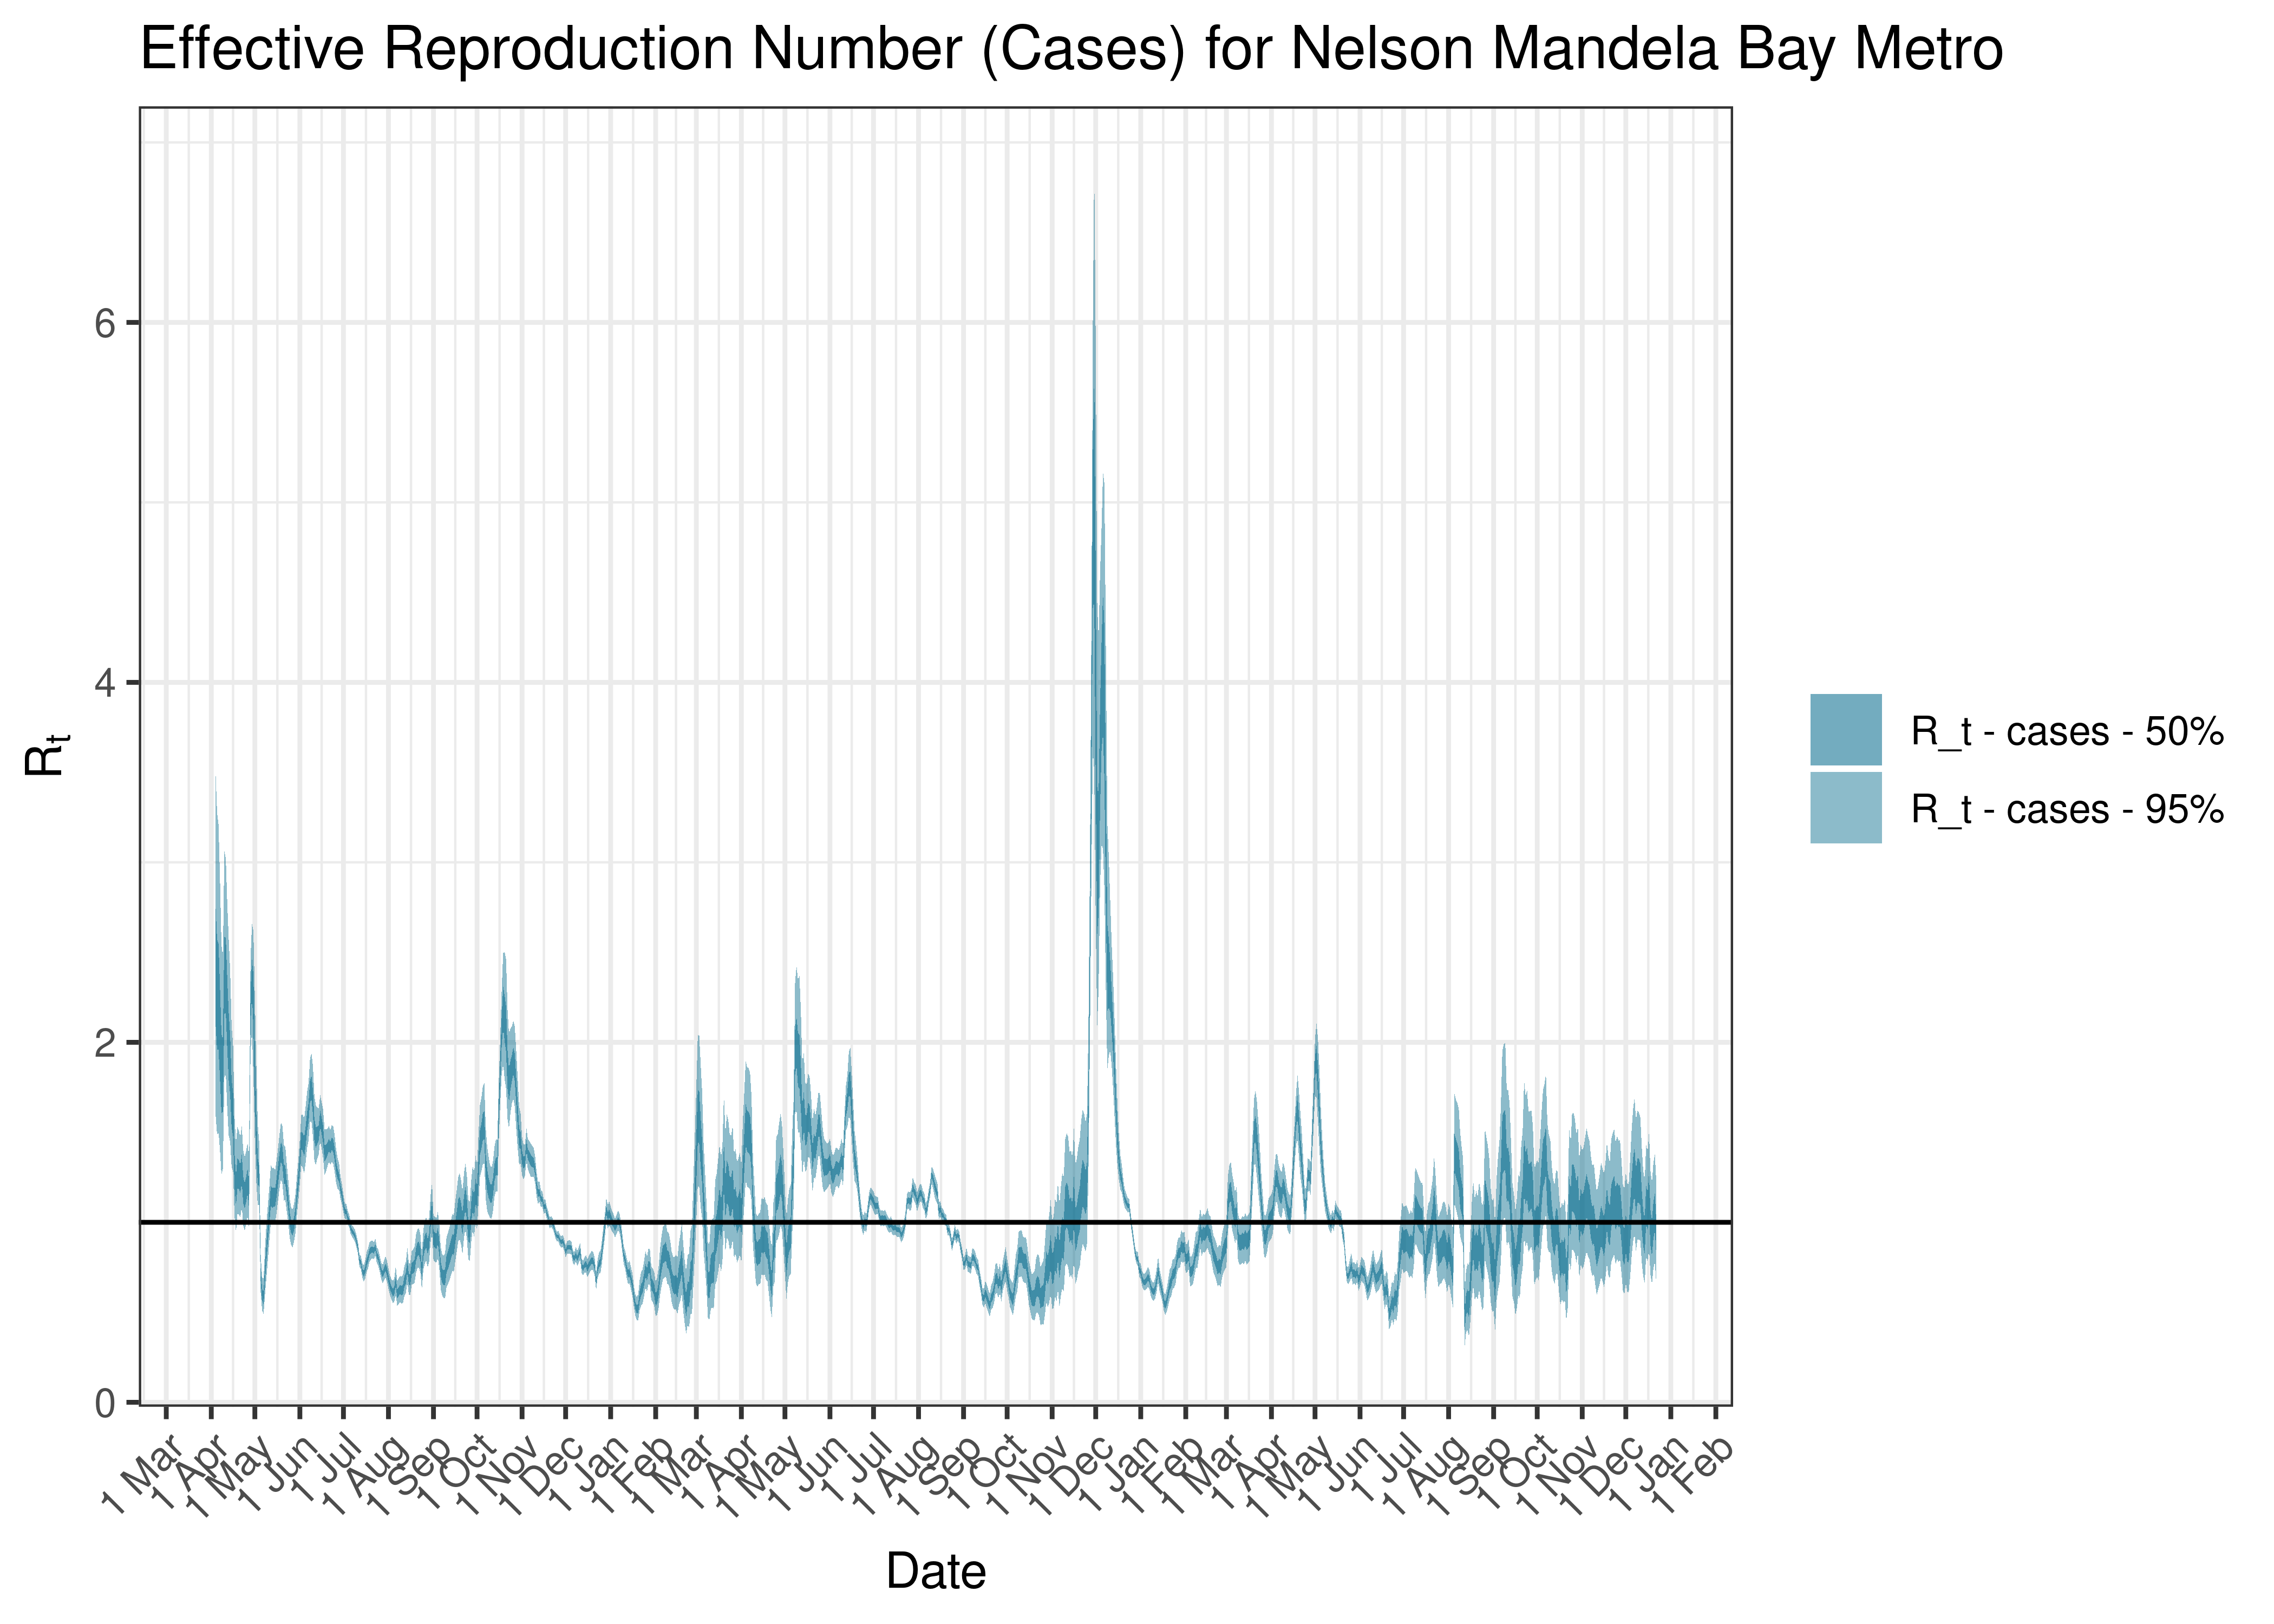
Estimated Effective Reproduction Number Based on Cases for Nelson Mandela Bay Metro since 1 April 2020
6.2.14 O R Tambo
6.2.14.1 Cases
Cases are tabulated by specimen received date below. Cases include estimates for late reporting in recent days as well as adjustments for any public holidays. A centred 7-day moving average is also shown. The peak daily cases in previous waves (as measured by the moving average) is also shown.
| Specimen Received Date | Cases | 7-day Moving Average | Comment |
|---|---|---|---|
| 2020-07-03 | 405 | 310 | Wave 1 Peak |
| 2020-12-15 | 270 | 231 | Wave 2 Peak |
| 2021-08-19 | 101 | 101 | Wave 3 Peak |
| 2021-12-13 | 177 | 123 | Wave 4 Peak |
| 2022-05-15 | 2 | 7 | Wave 5 Peak (to date) |
Below a 7-day moving average daily case count are plotted for O R Tambo on a log scale since start of the epidemic:
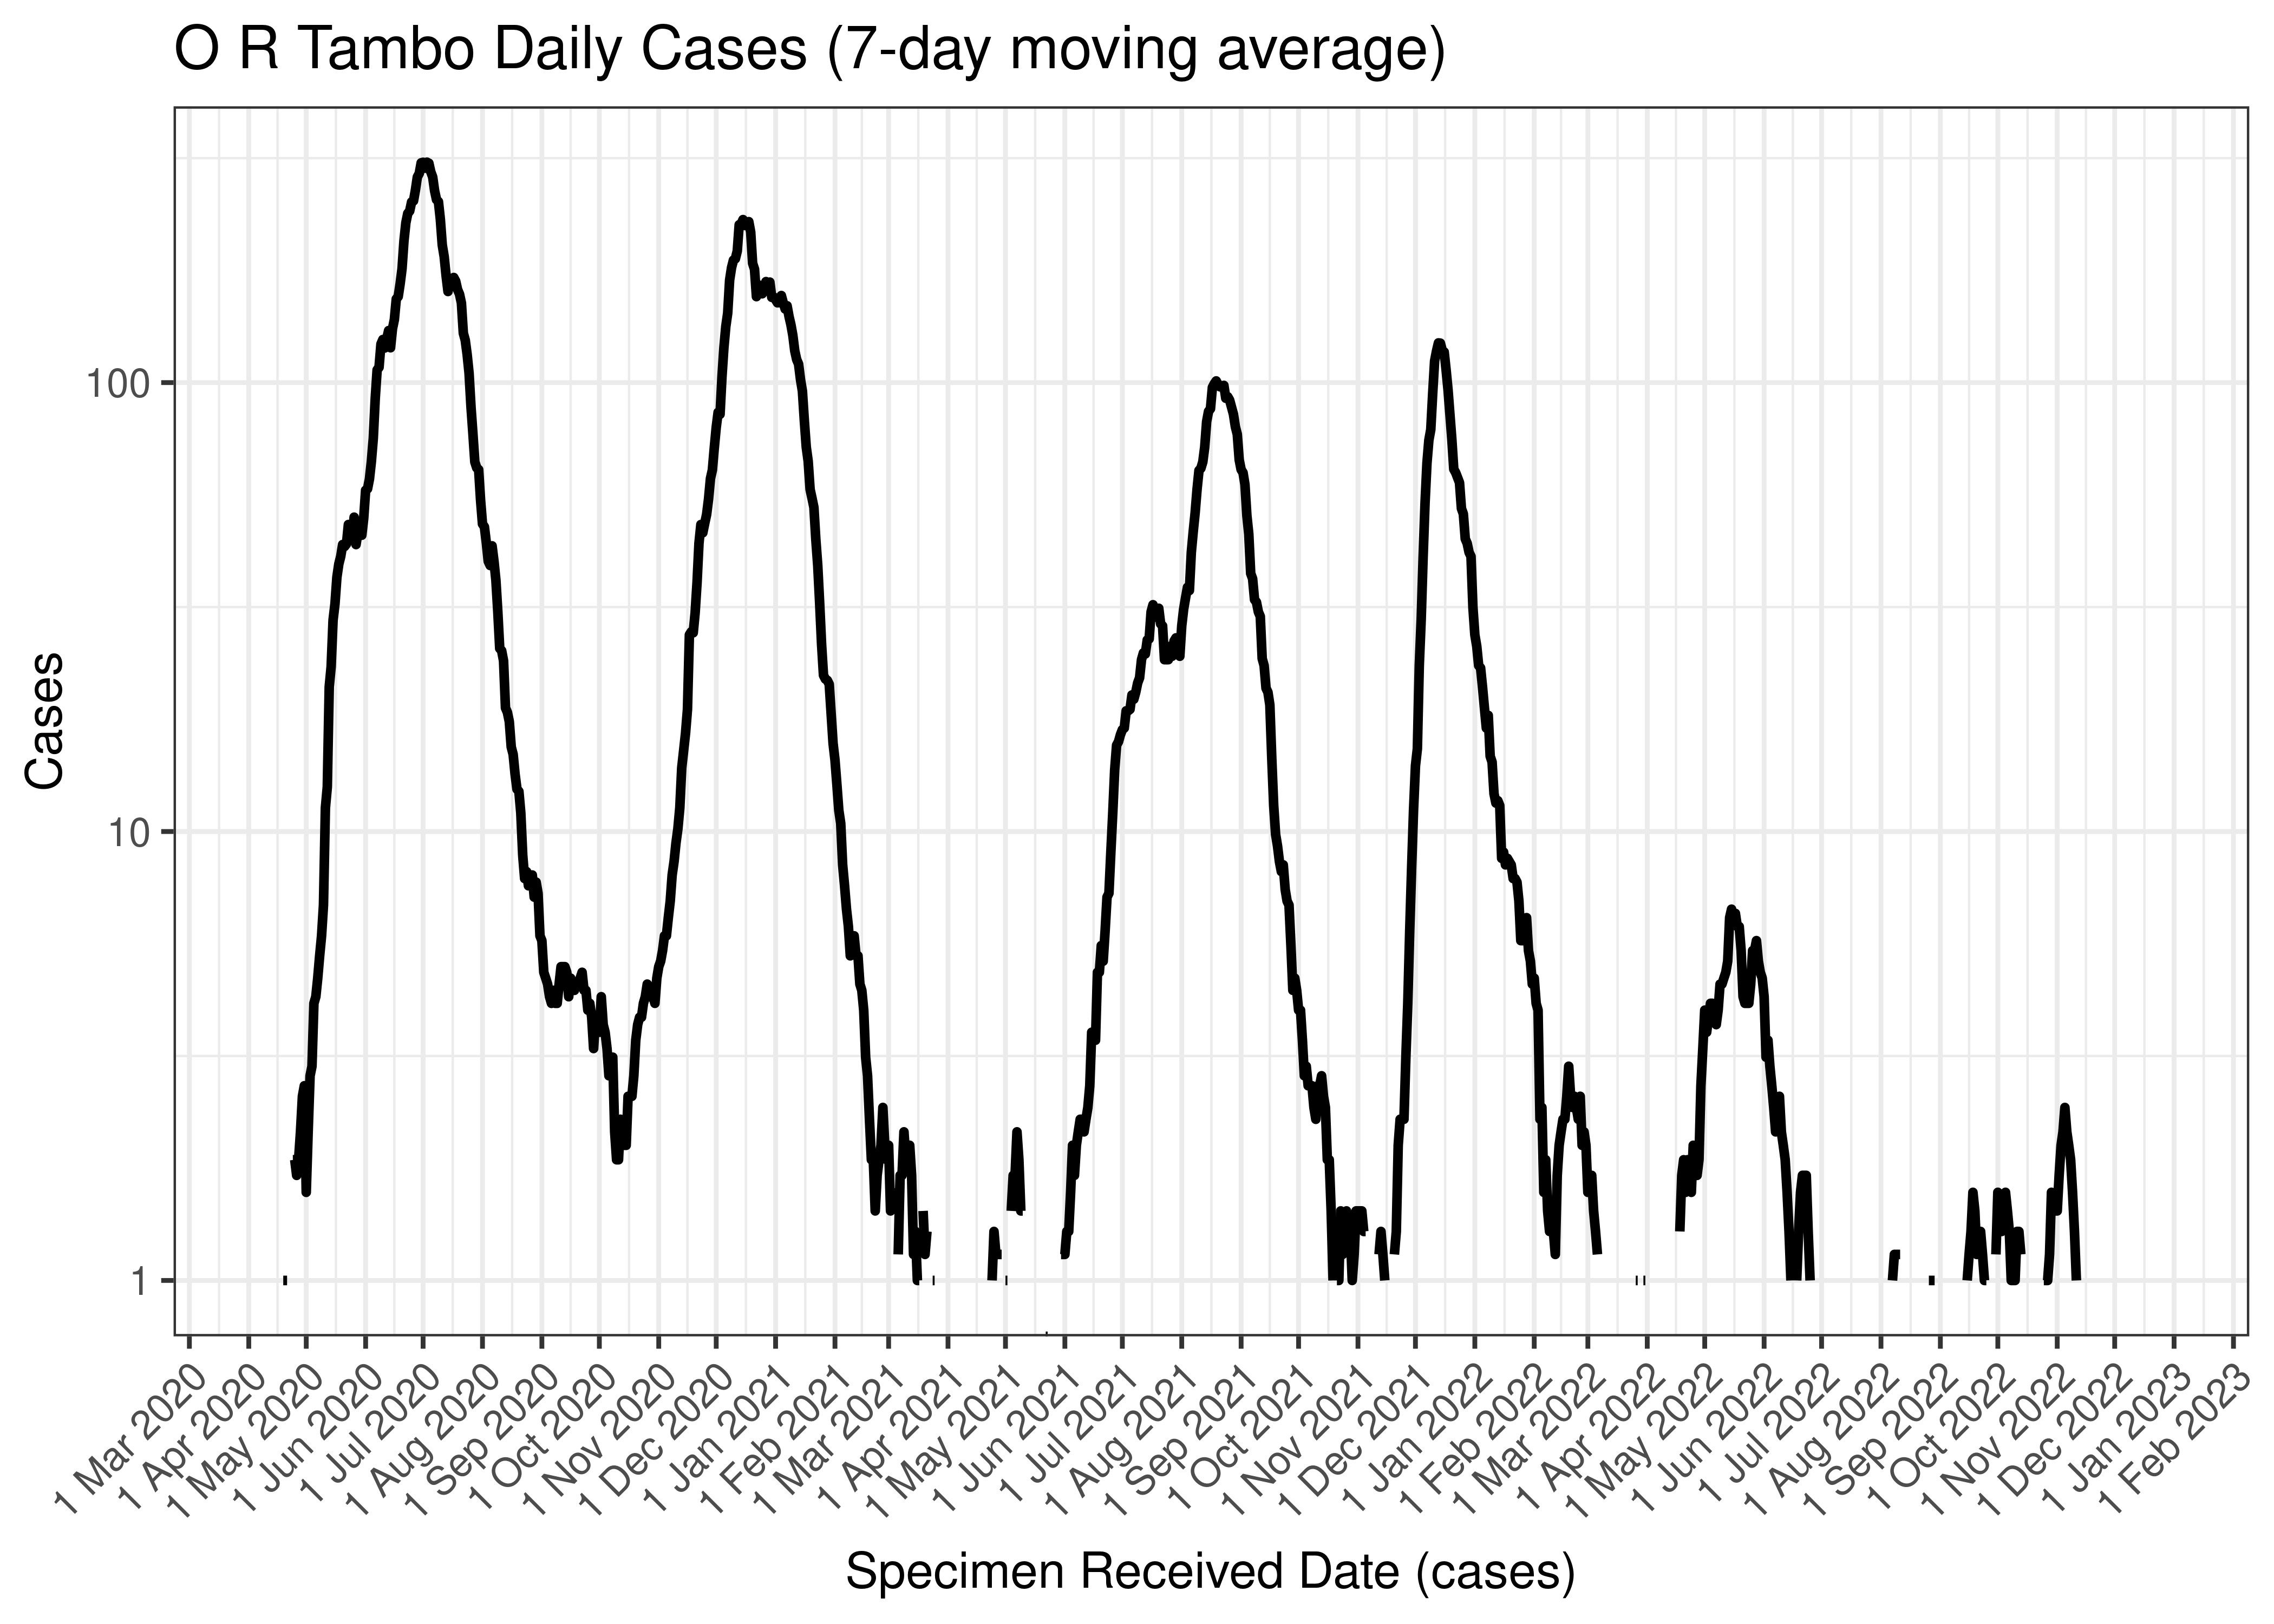
O R Tambo Daily Cases (7-day moving average)
Below the above chart is repeated for the last 30-days:

O R Tambo Daily Cases for Last 30-days (7-day moving average)
6.2.14.2 Reproduction Number
Below current (last weekly) reproduction number estimates are tabulated for O R Tambo.
| Count (Per Day) | Week Ending | Reproduction Number [95% Confidence Interval] | |
|---|---|---|---|
| O R Tambo | 0.6 | 2022-12-25 | 0.98 [0.31 - 2.01] |
Below the effective reproduction number for O R Tambo over the last 90 days are plotted together with a plot since start of the pandemic.
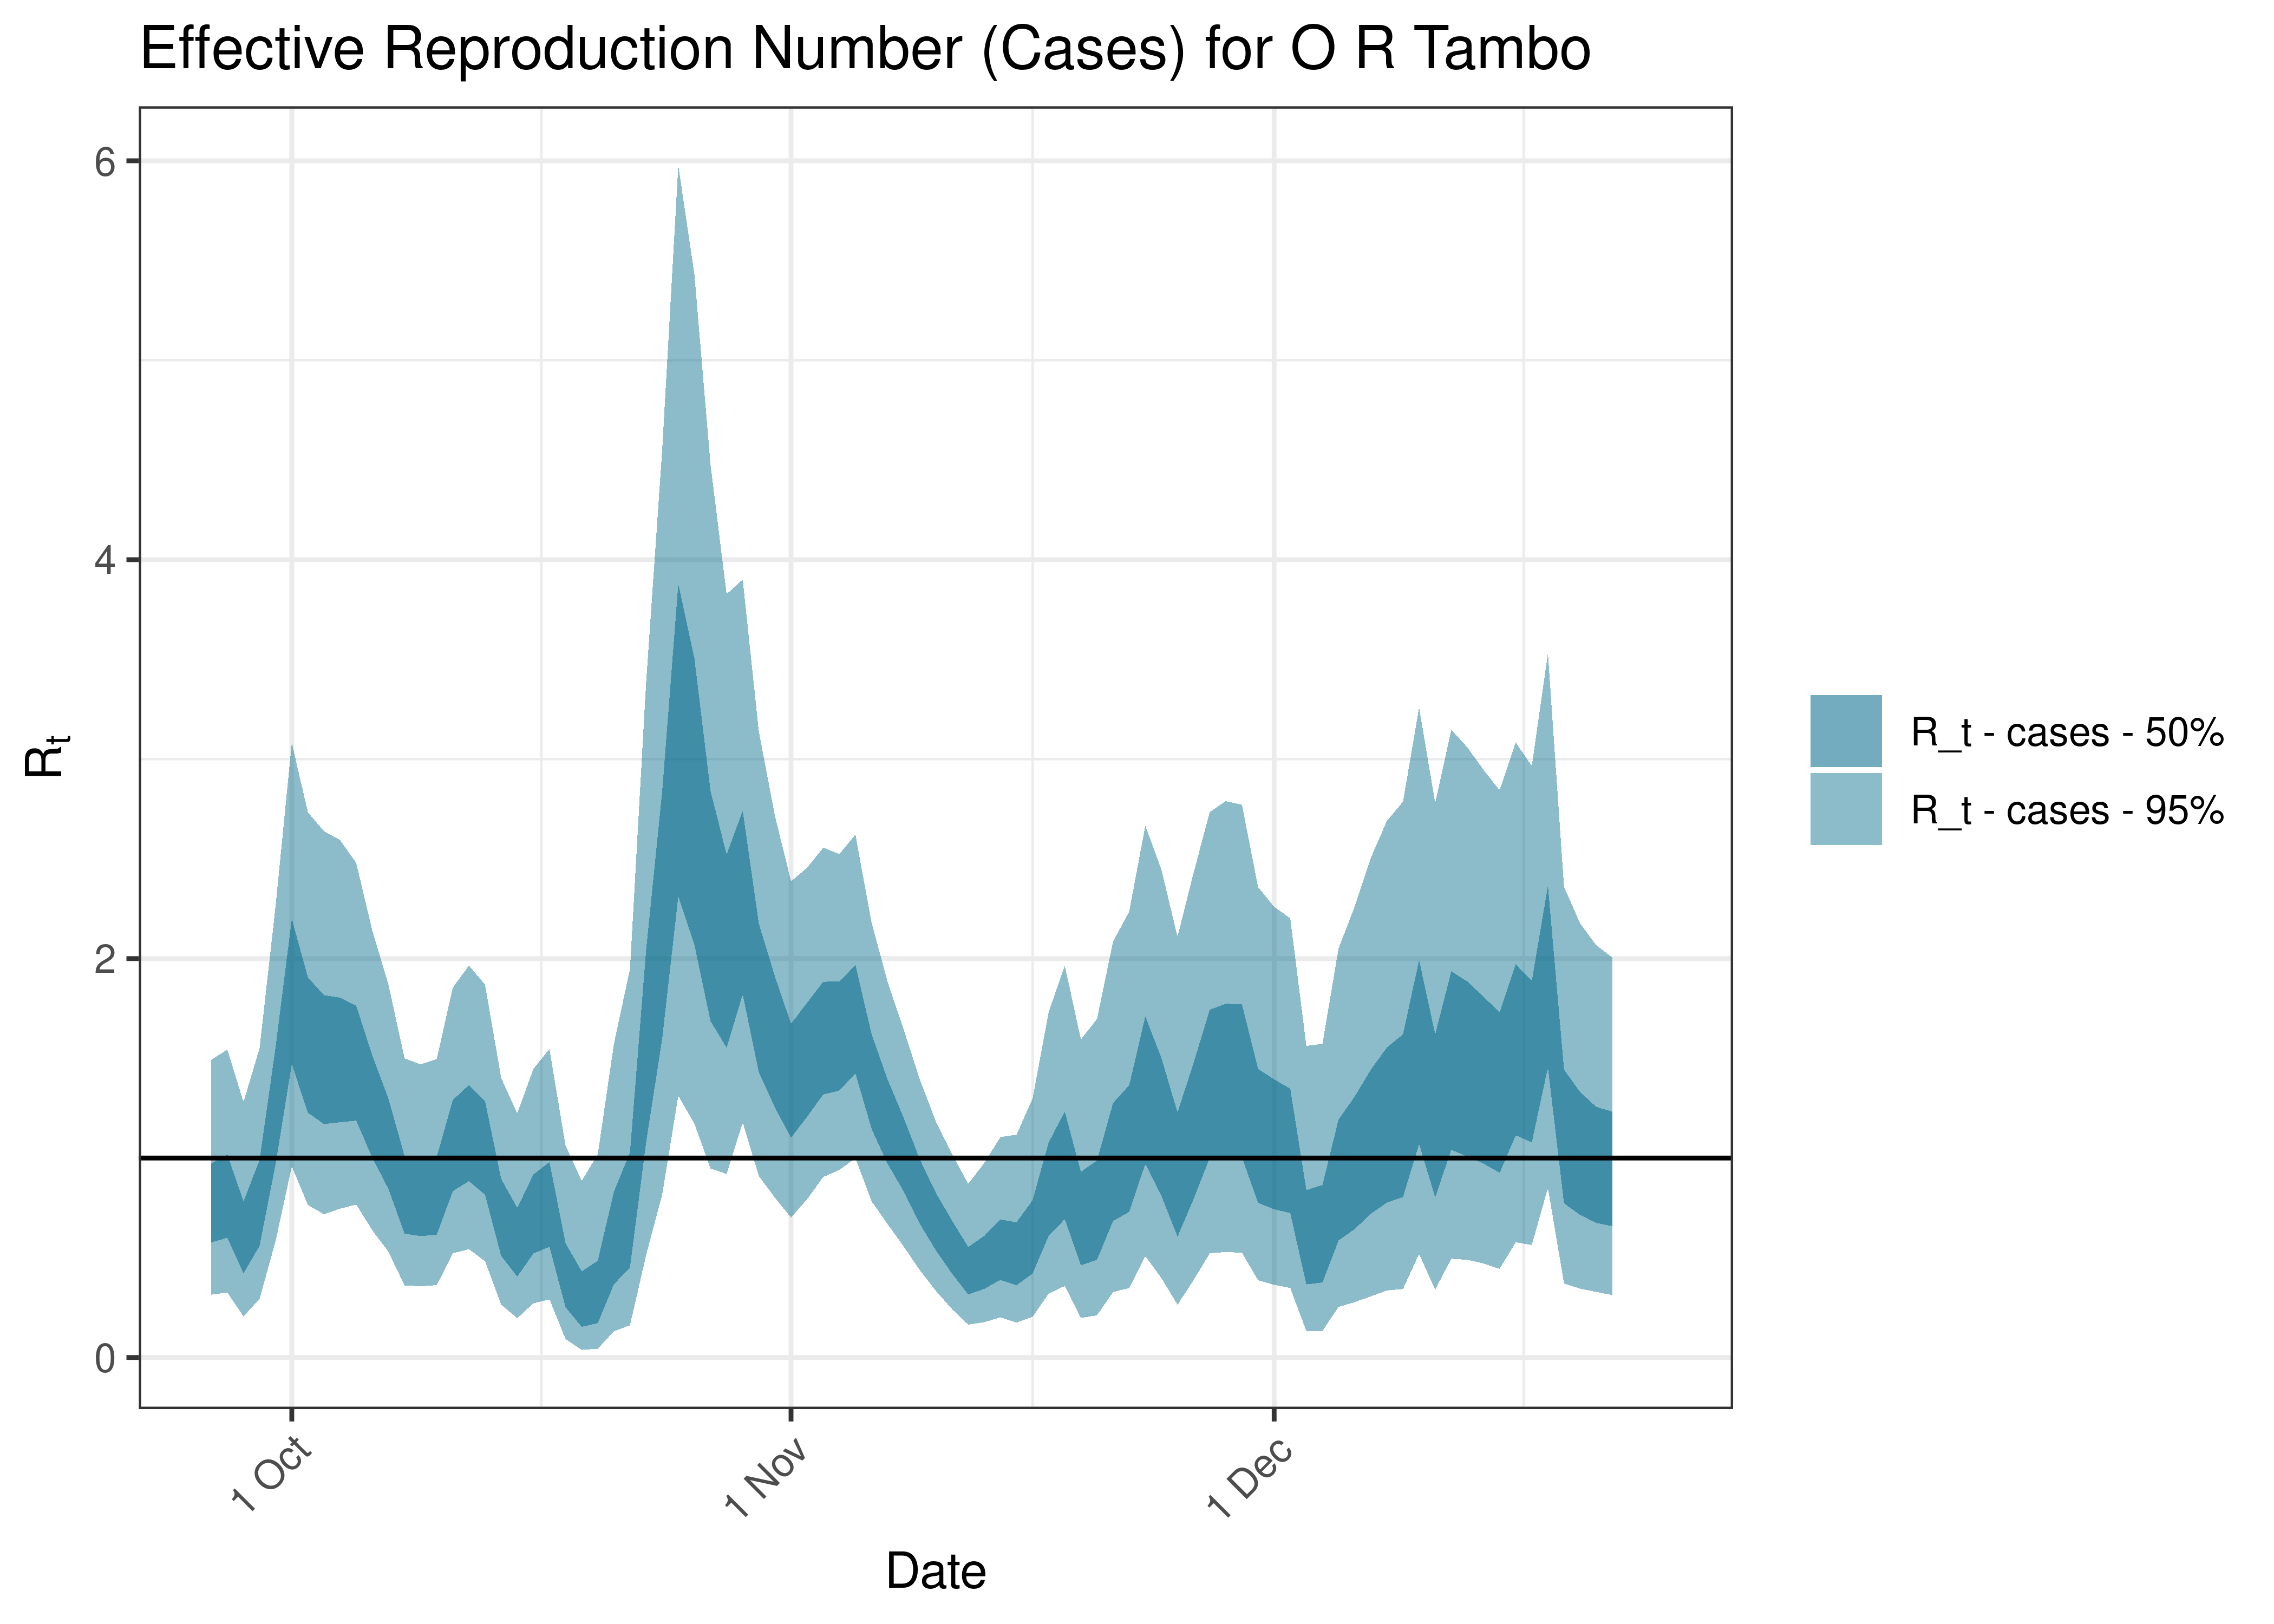
Estimated Effective Reproduction Number Based on Cases for O R Tambo over last 90 days
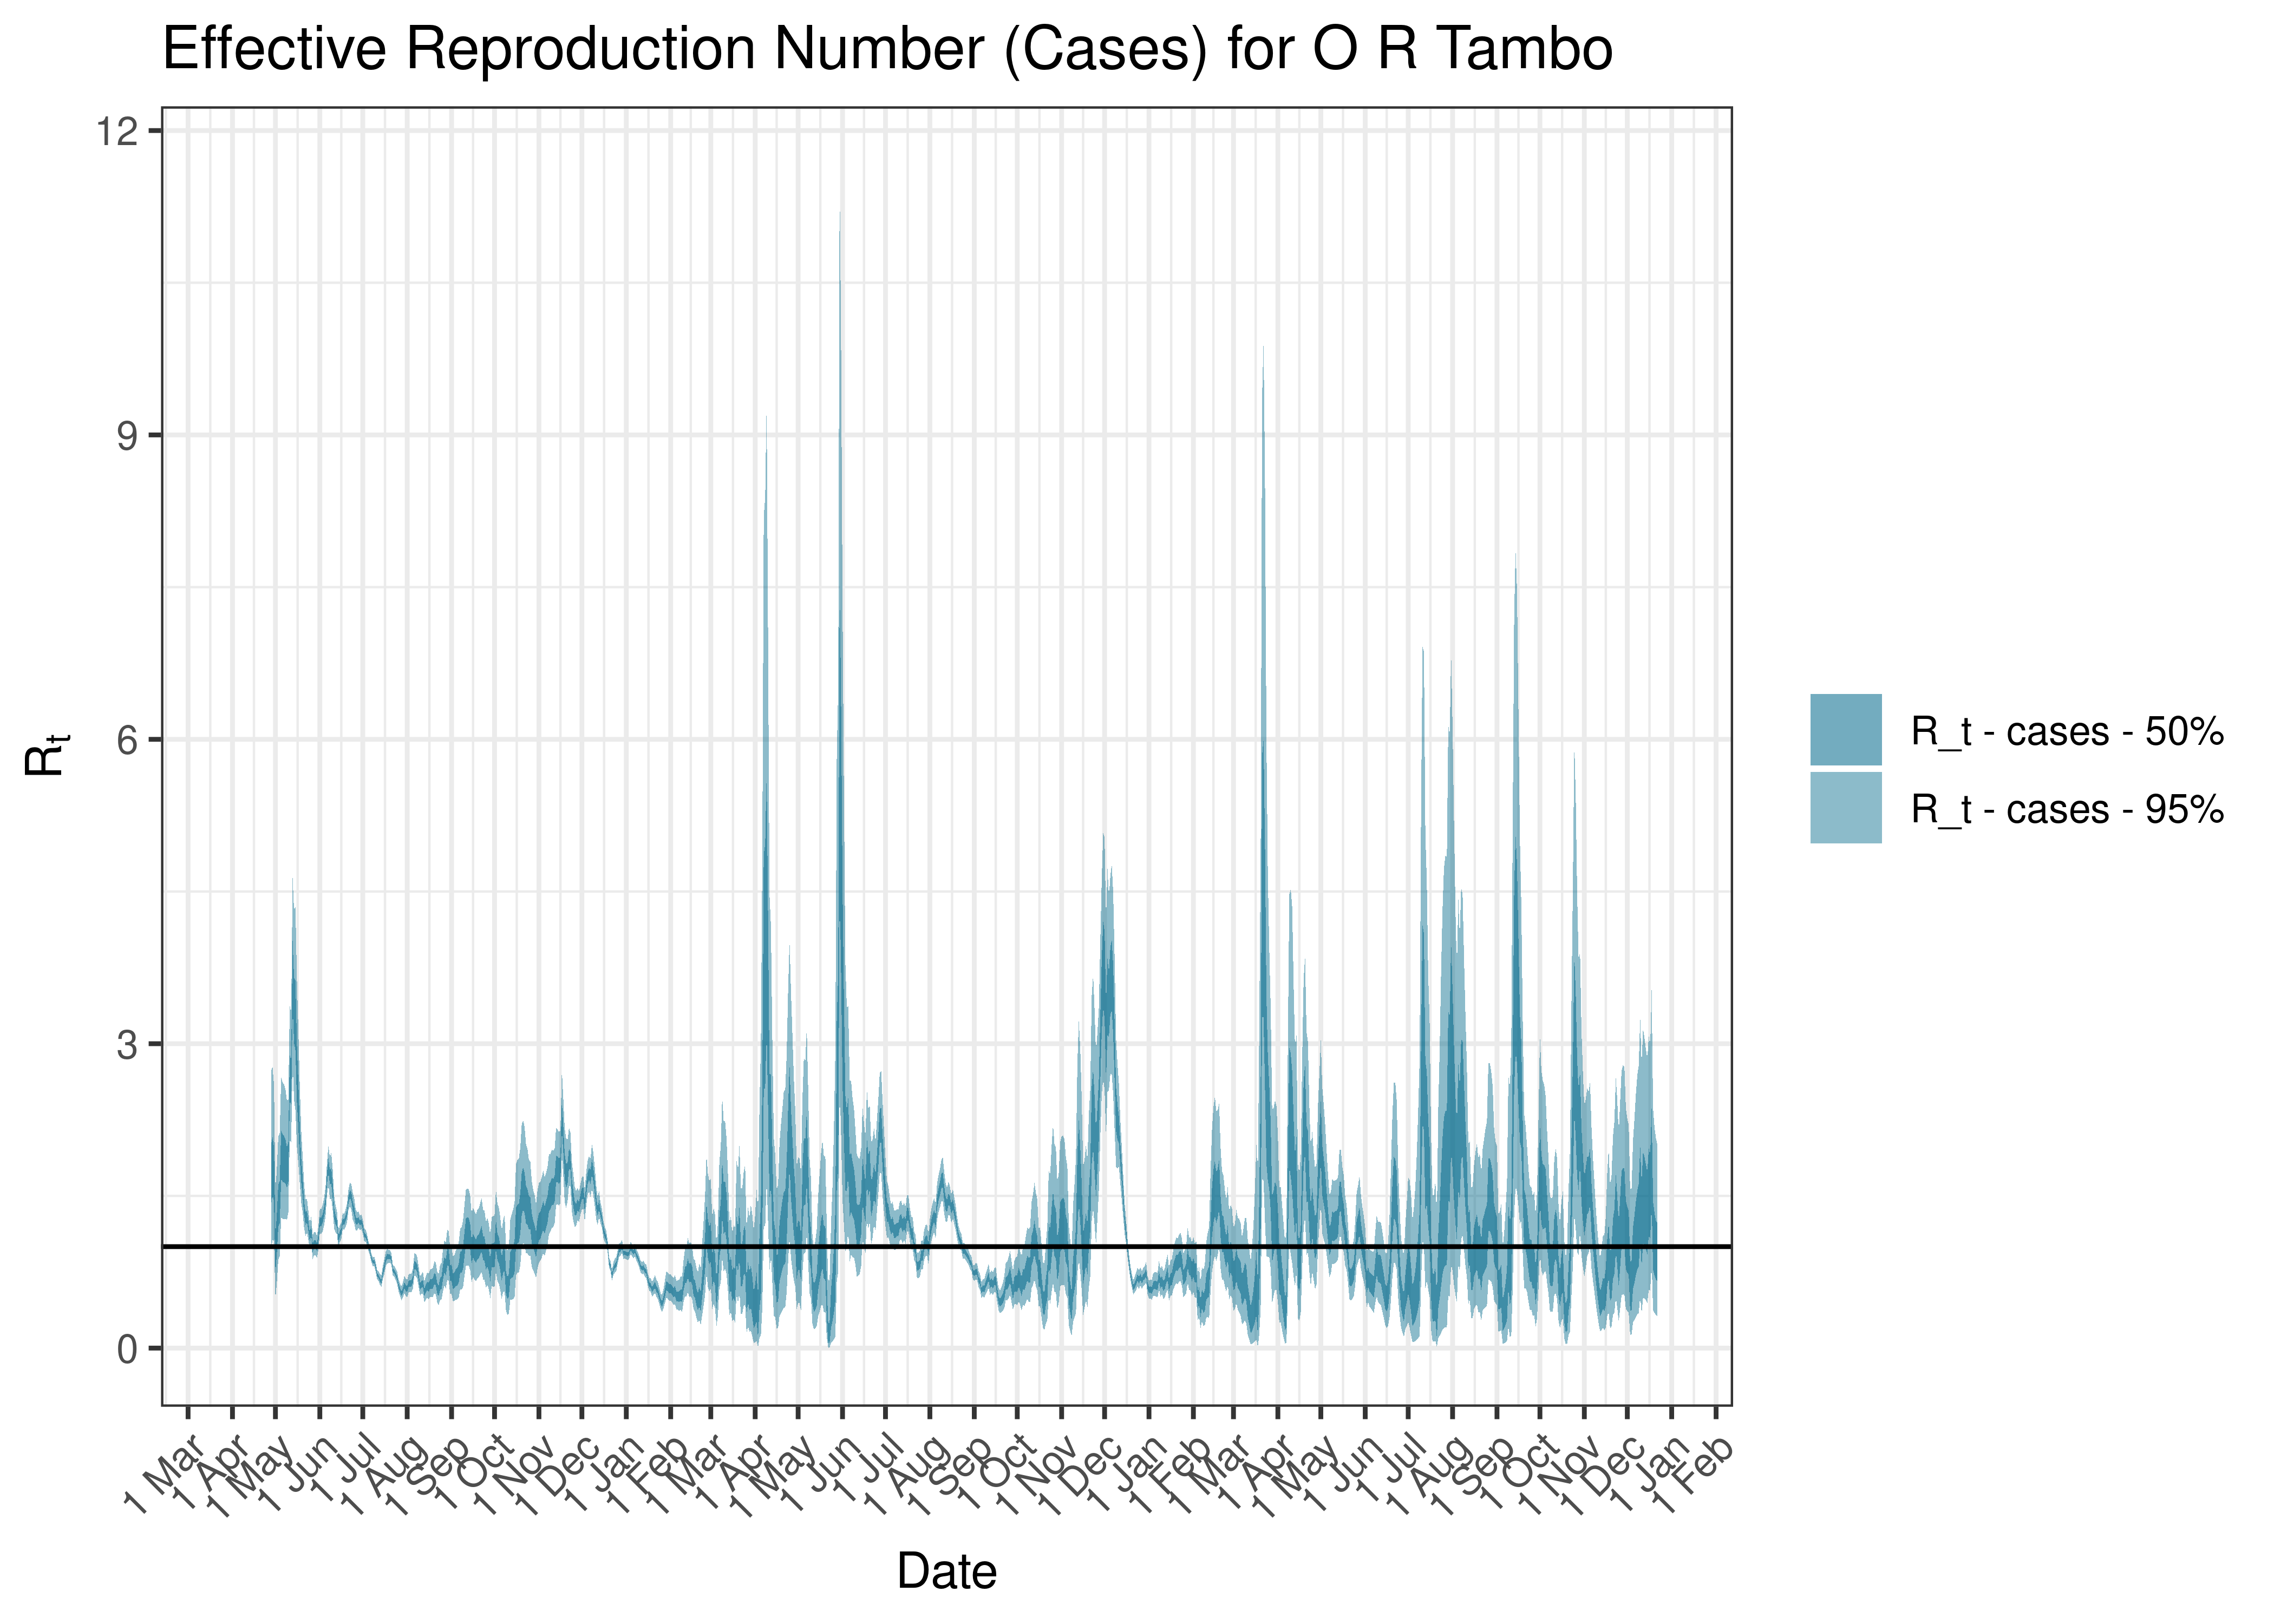
Estimated Effective Reproduction Number Based on Cases for O R Tambo since 1 April 2020
6.2.15 Sarah Baartman
6.2.15.1 Cases
Cases are tabulated by specimen received date below. Cases include estimates for late reporting in recent days as well as adjustments for any public holidays. A centred 7-day moving average is also shown. The peak daily cases in previous waves (as measured by the moving average) is also shown.
| Specimen Received Date | Cases | 7-day Moving Average | Comment |
|---|---|---|---|
| 2020-06-27 | 66 | 131 | Wave 1 Peak |
| 2020-11-21 | 169 | 287 | Wave 2 Peak |
| 2021-08-16 | 214 | 285 | Wave 3 Peak |
| 2021-12-20 | 292 | 251 | Wave 4 Peak |
| 2022-05-07 | 14 | 62 | Wave 5 Peak (to date) |
Below a 7-day moving average daily case count are plotted for Sarah Baartman on a log scale since start of the epidemic:
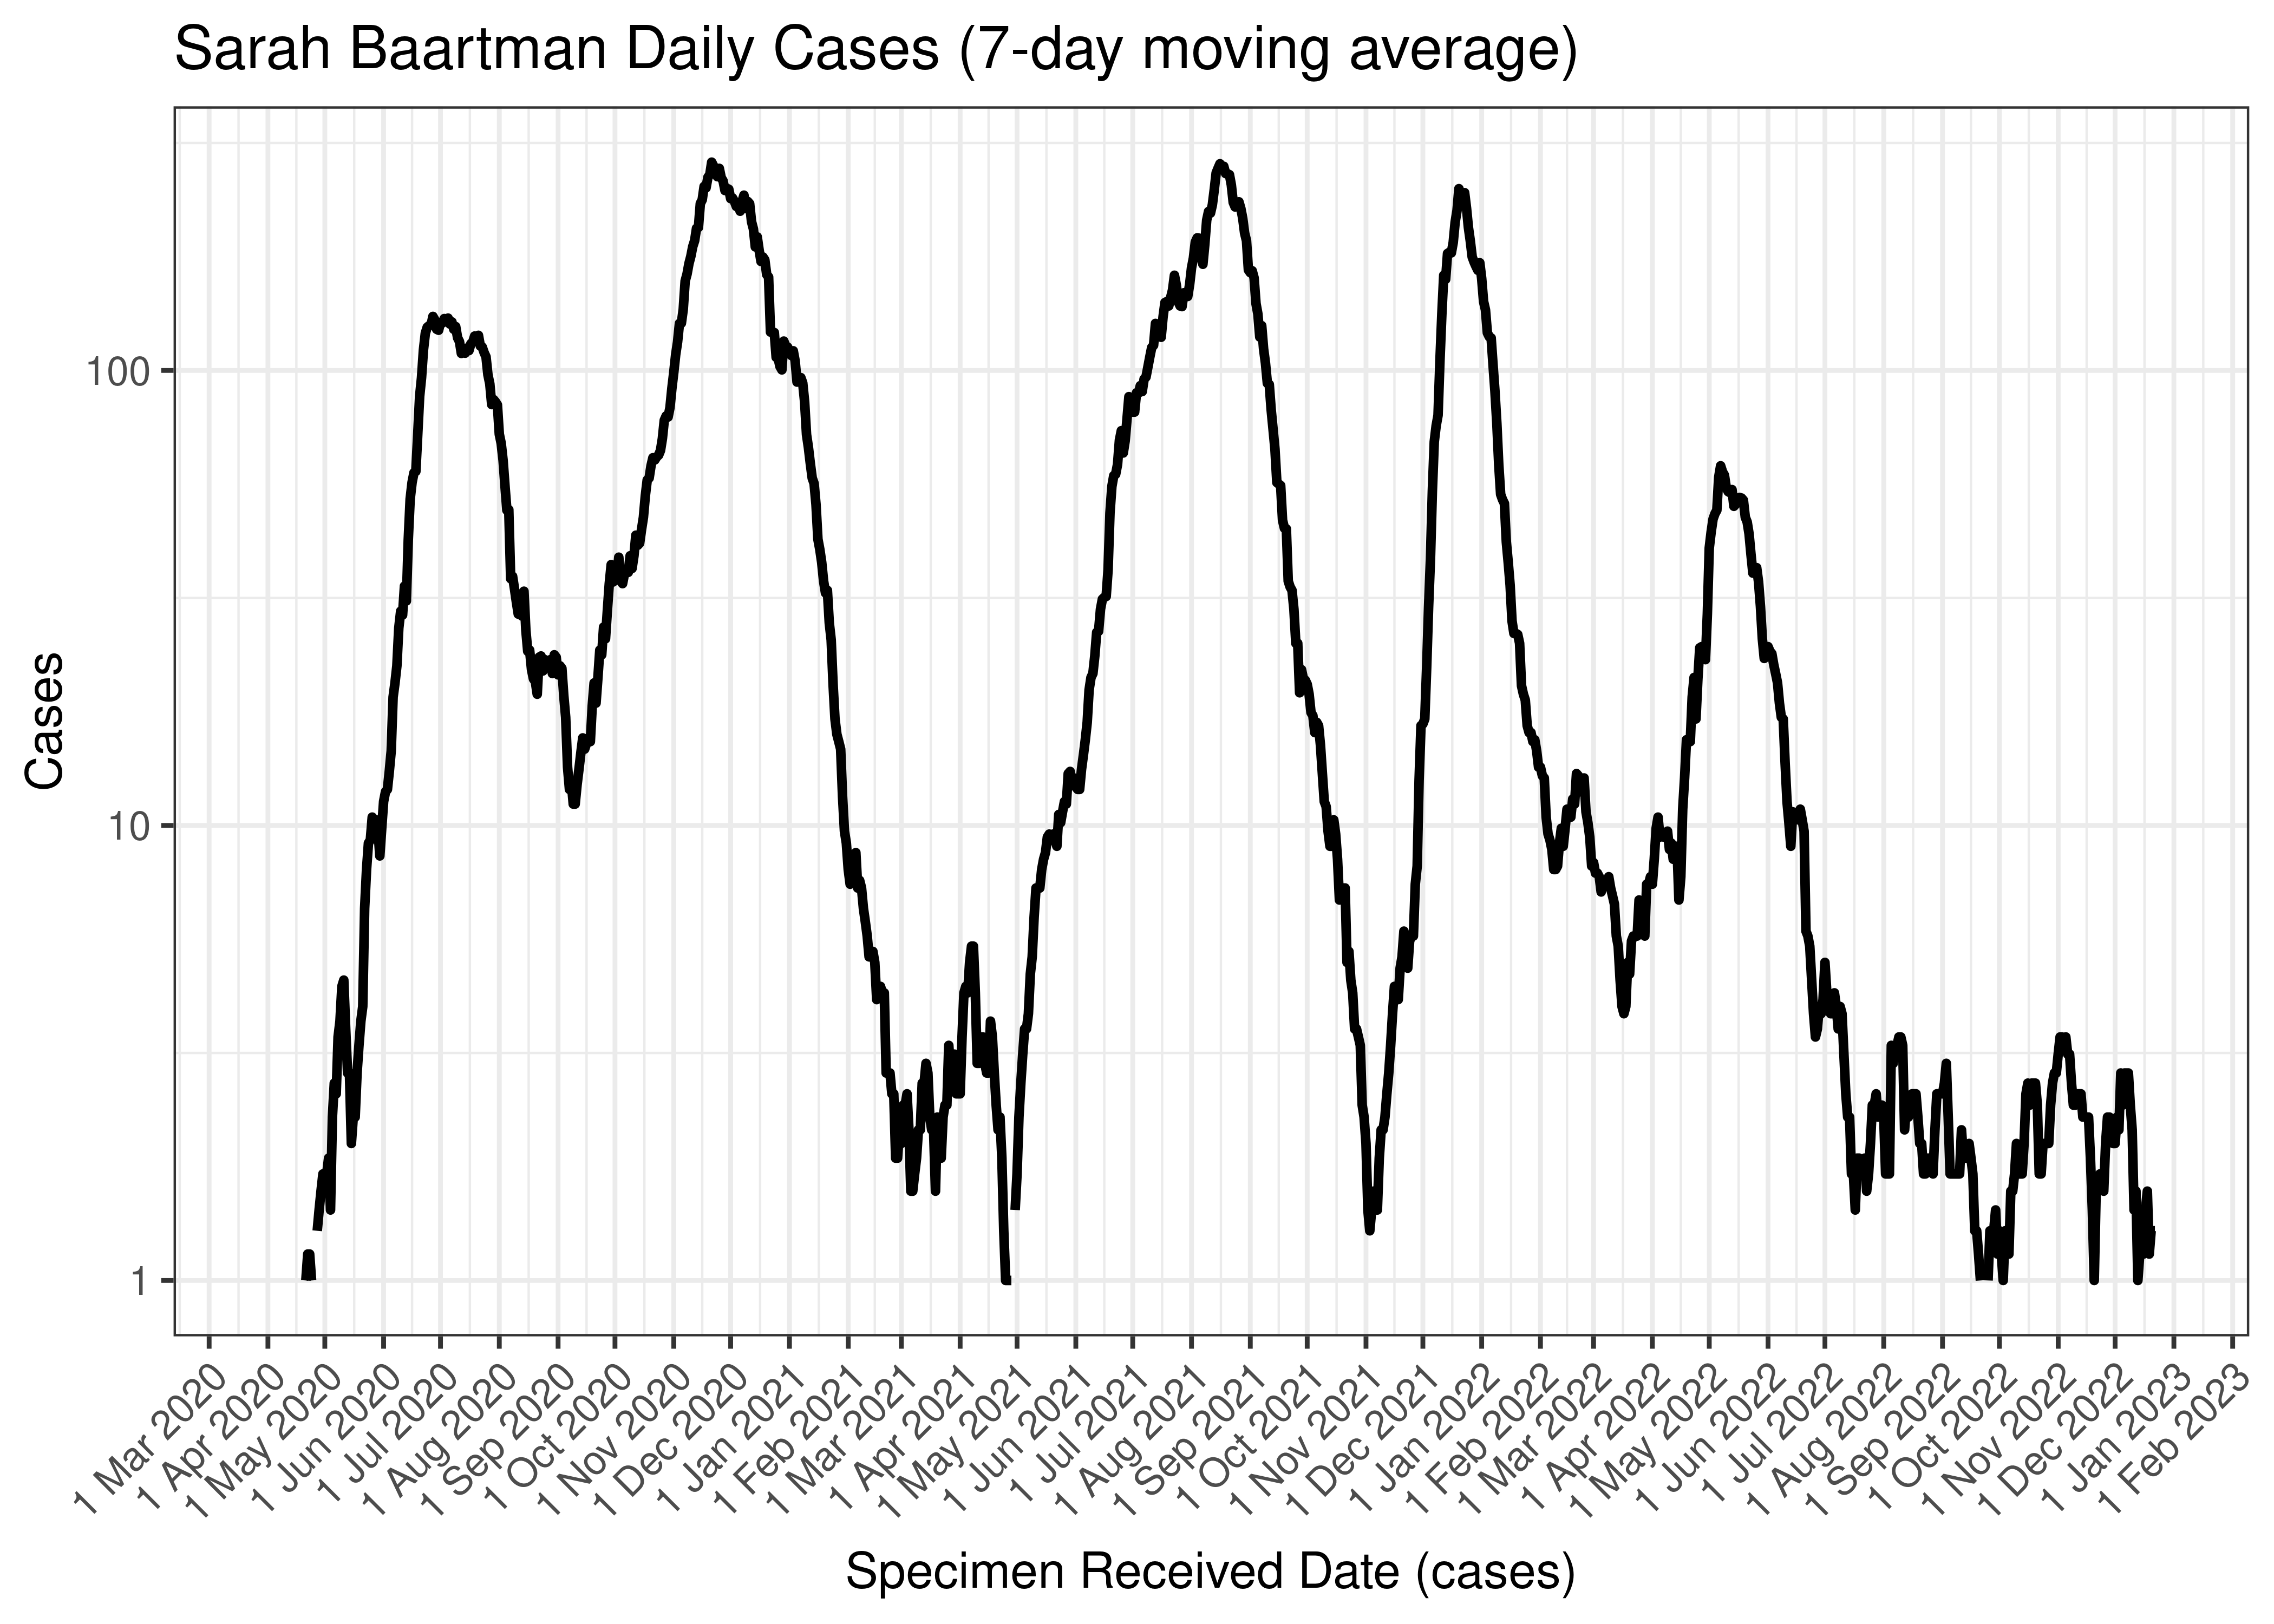
Sarah Baartman Daily Cases (7-day moving average)
Below the above chart is repeated for the last 30-days:

Sarah Baartman Daily Cases for Last 30-days (7-day moving average)
6.2.15.2 Reproduction Number
Below current (last weekly) reproduction number estimates are tabulated for Sarah Baartman.
| Count (Per Day) | Week Ending | Reproduction Number [95% Confidence Interval] | |
|---|---|---|---|
| Sarah Baartman | 1.3 | 2022-12-25 | 1.06 [0.51 - 1.81] |
Below the effective reproduction number for Sarah Baartman over the last 90 days are plotted together with a plot since start of the pandemic.
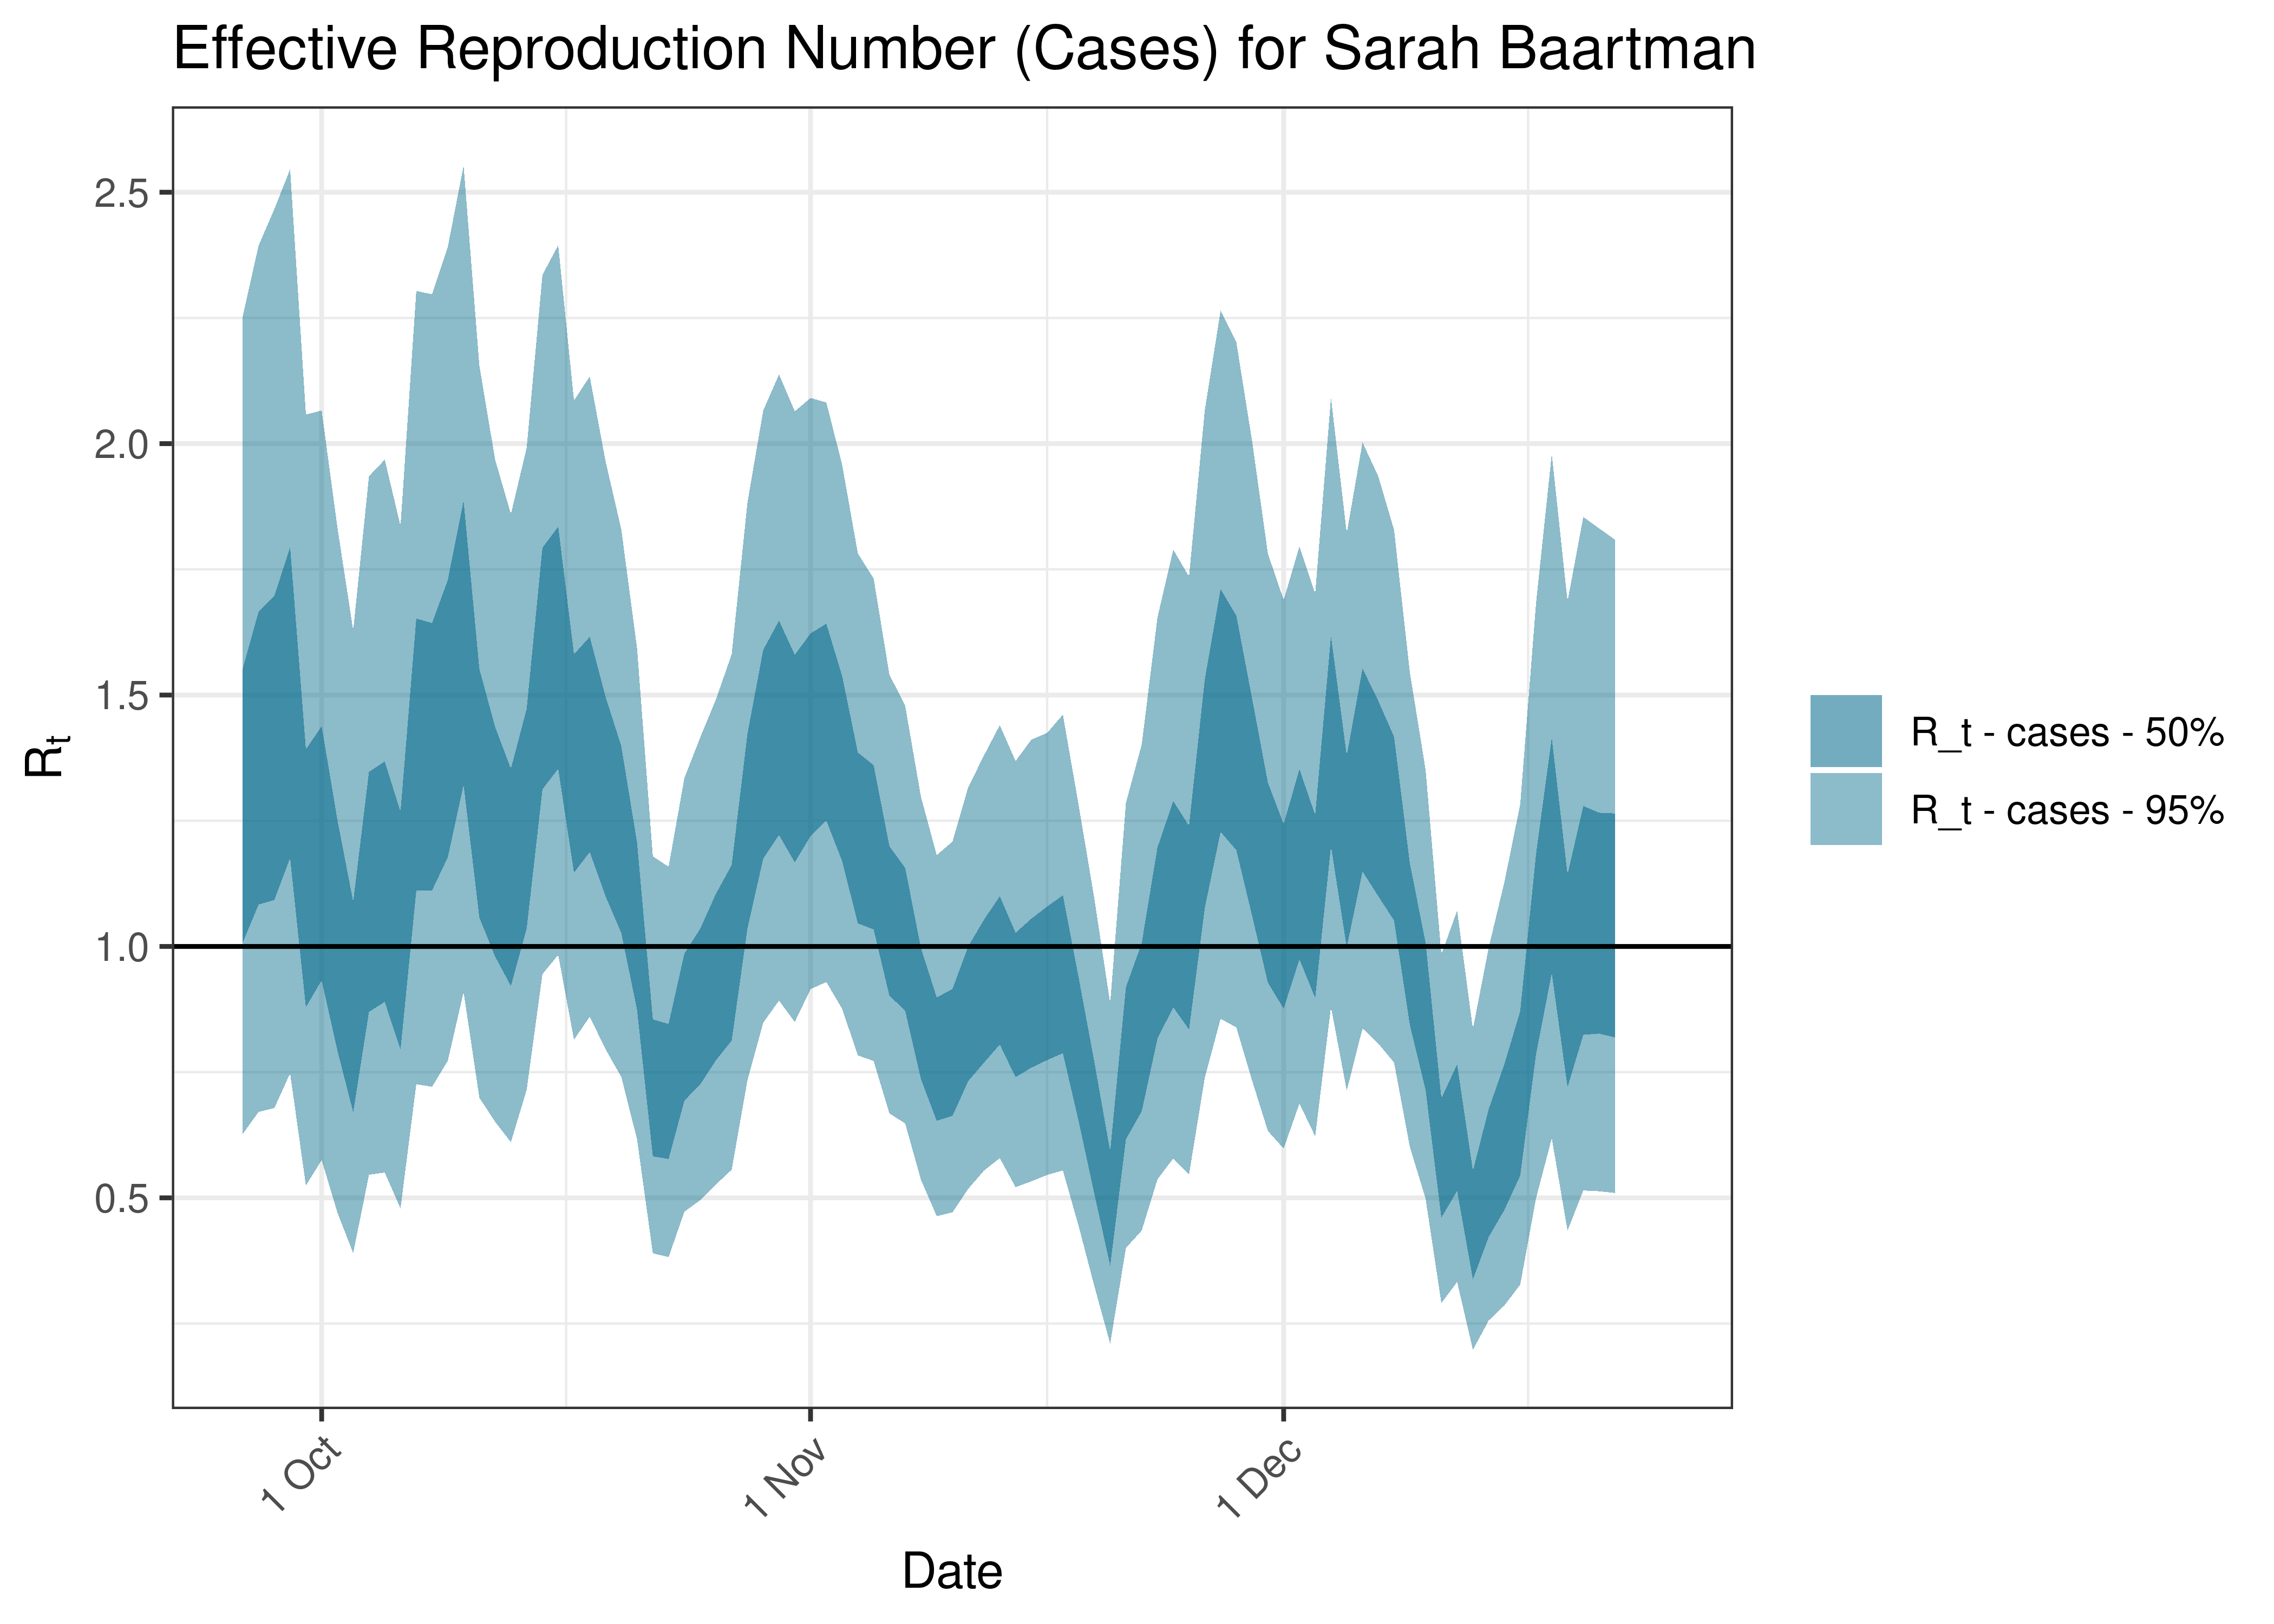
Estimated Effective Reproduction Number Based on Cases for Sarah Baartman over last 90 days
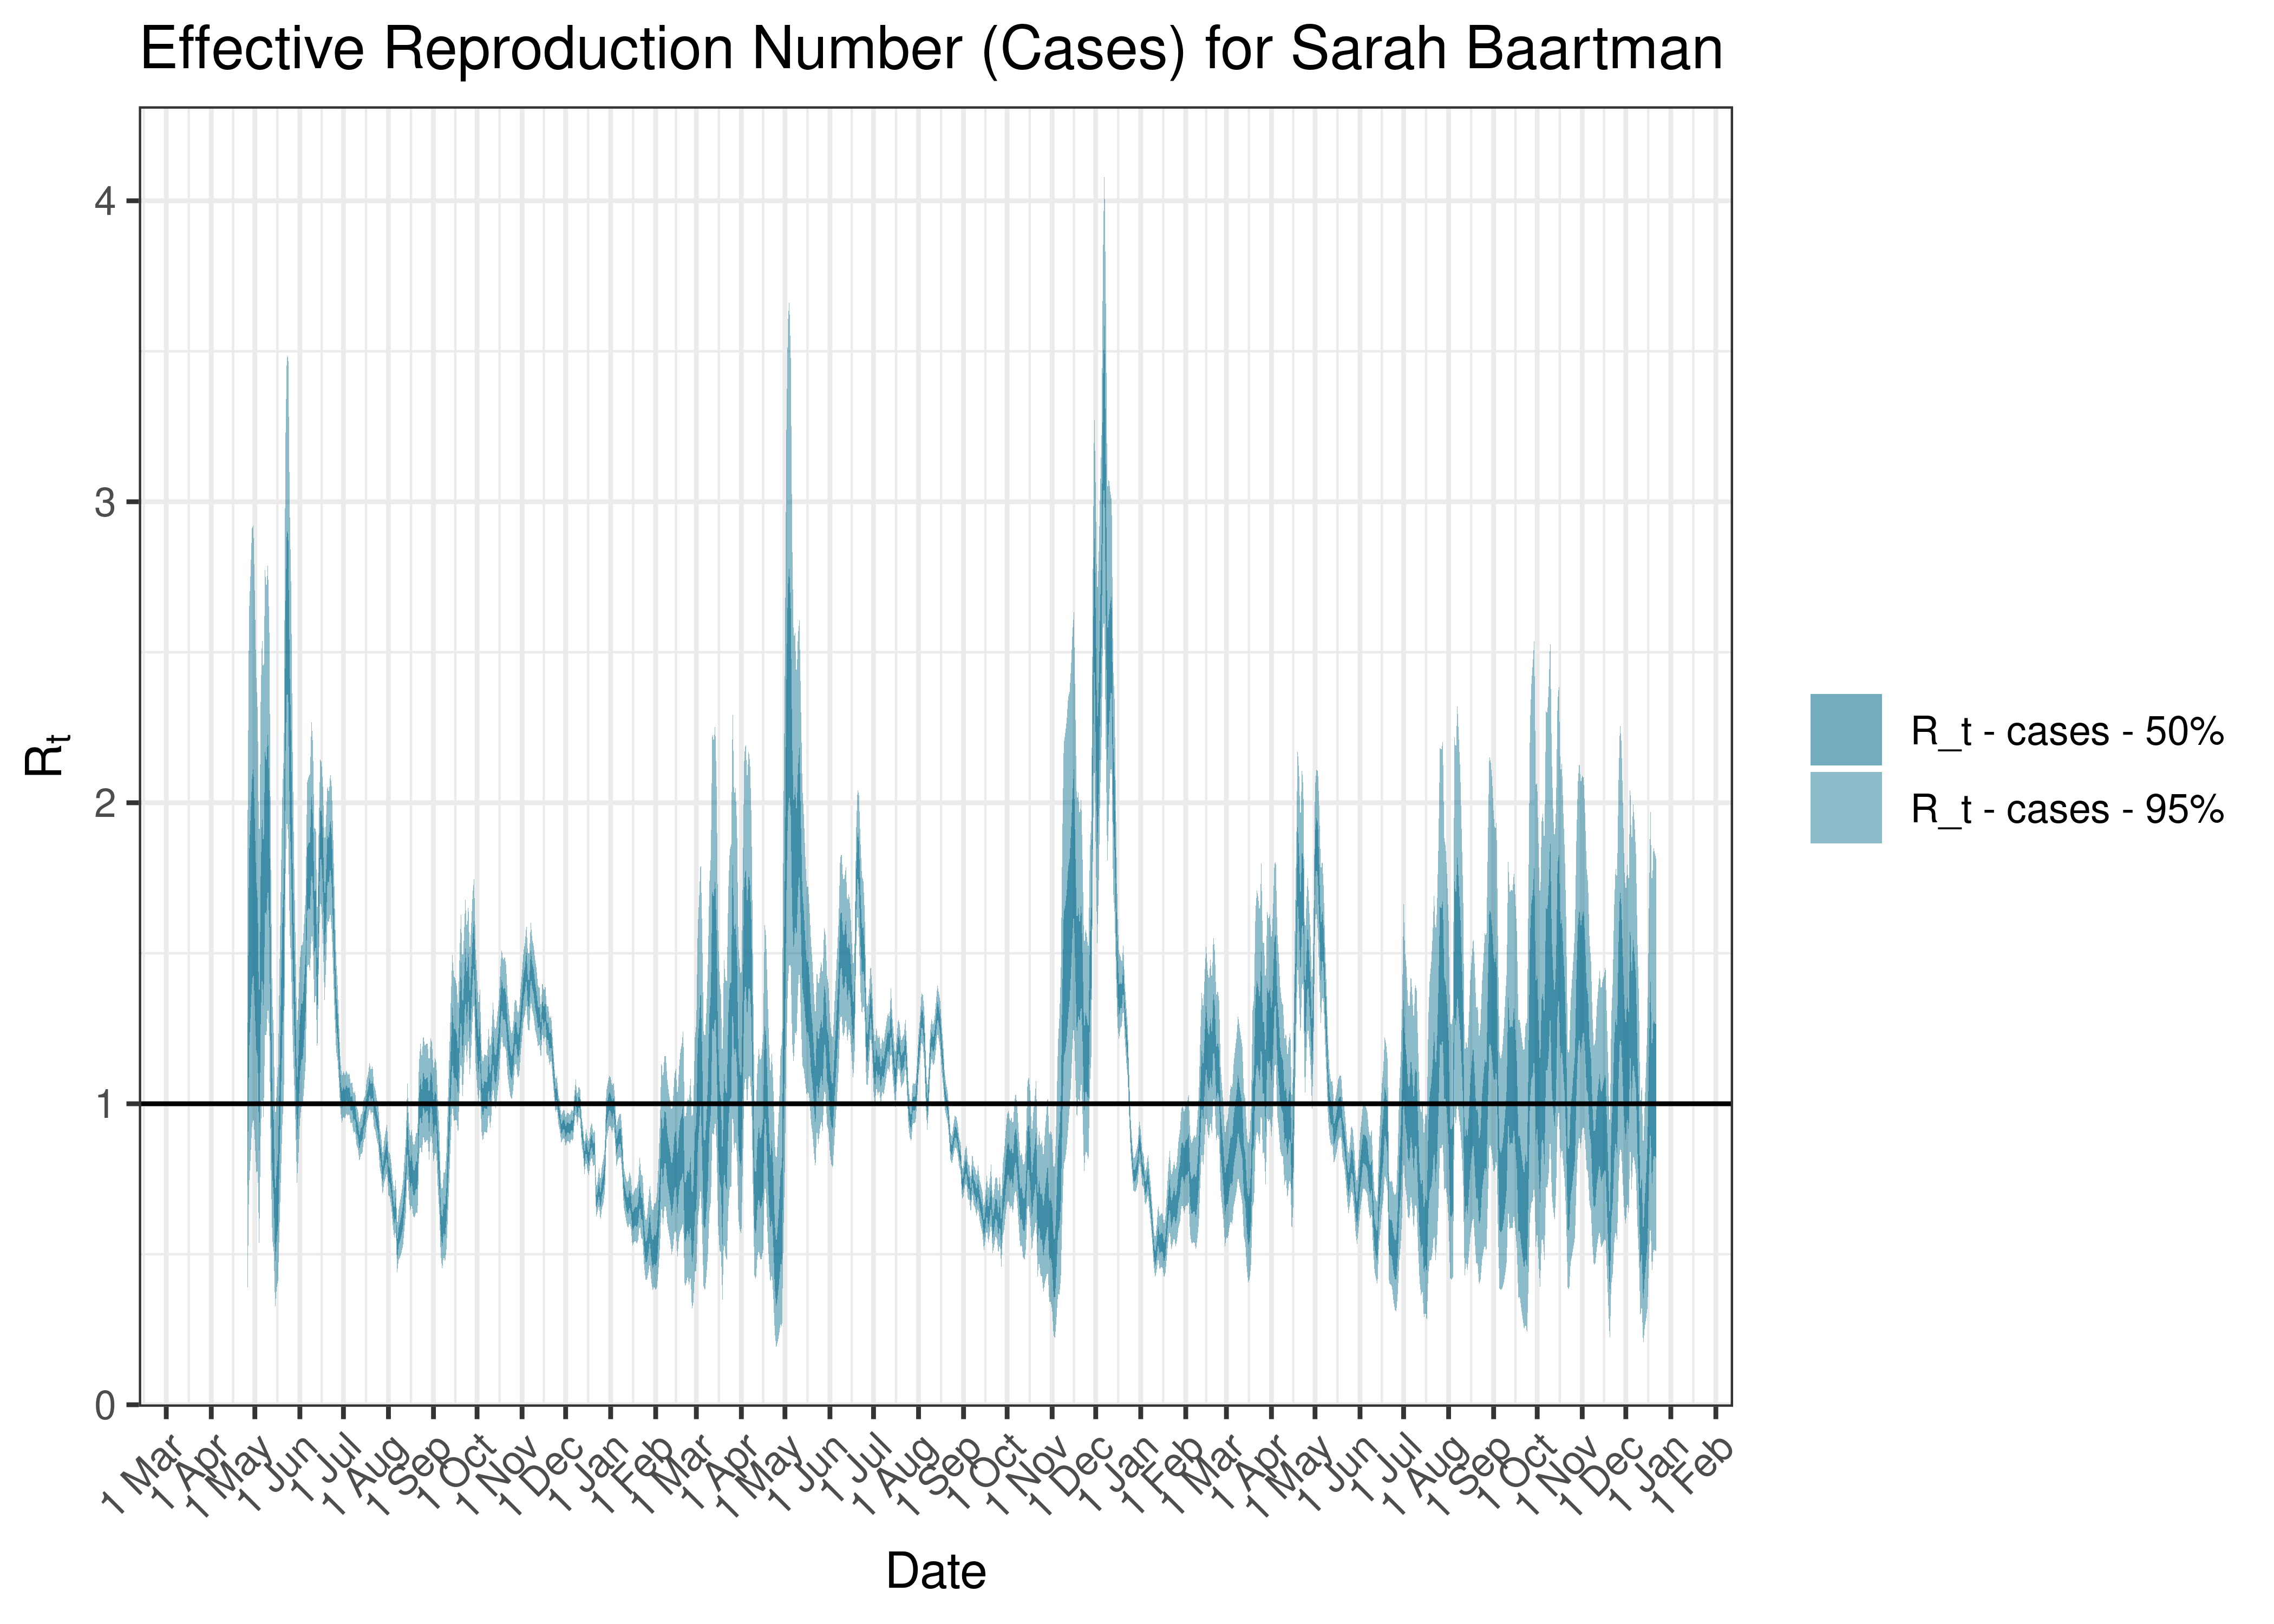
Estimated Effective Reproduction Number Based on Cases for Sarah Baartman since 1 April 2020
6.3 Free State
6.3.1 Cases
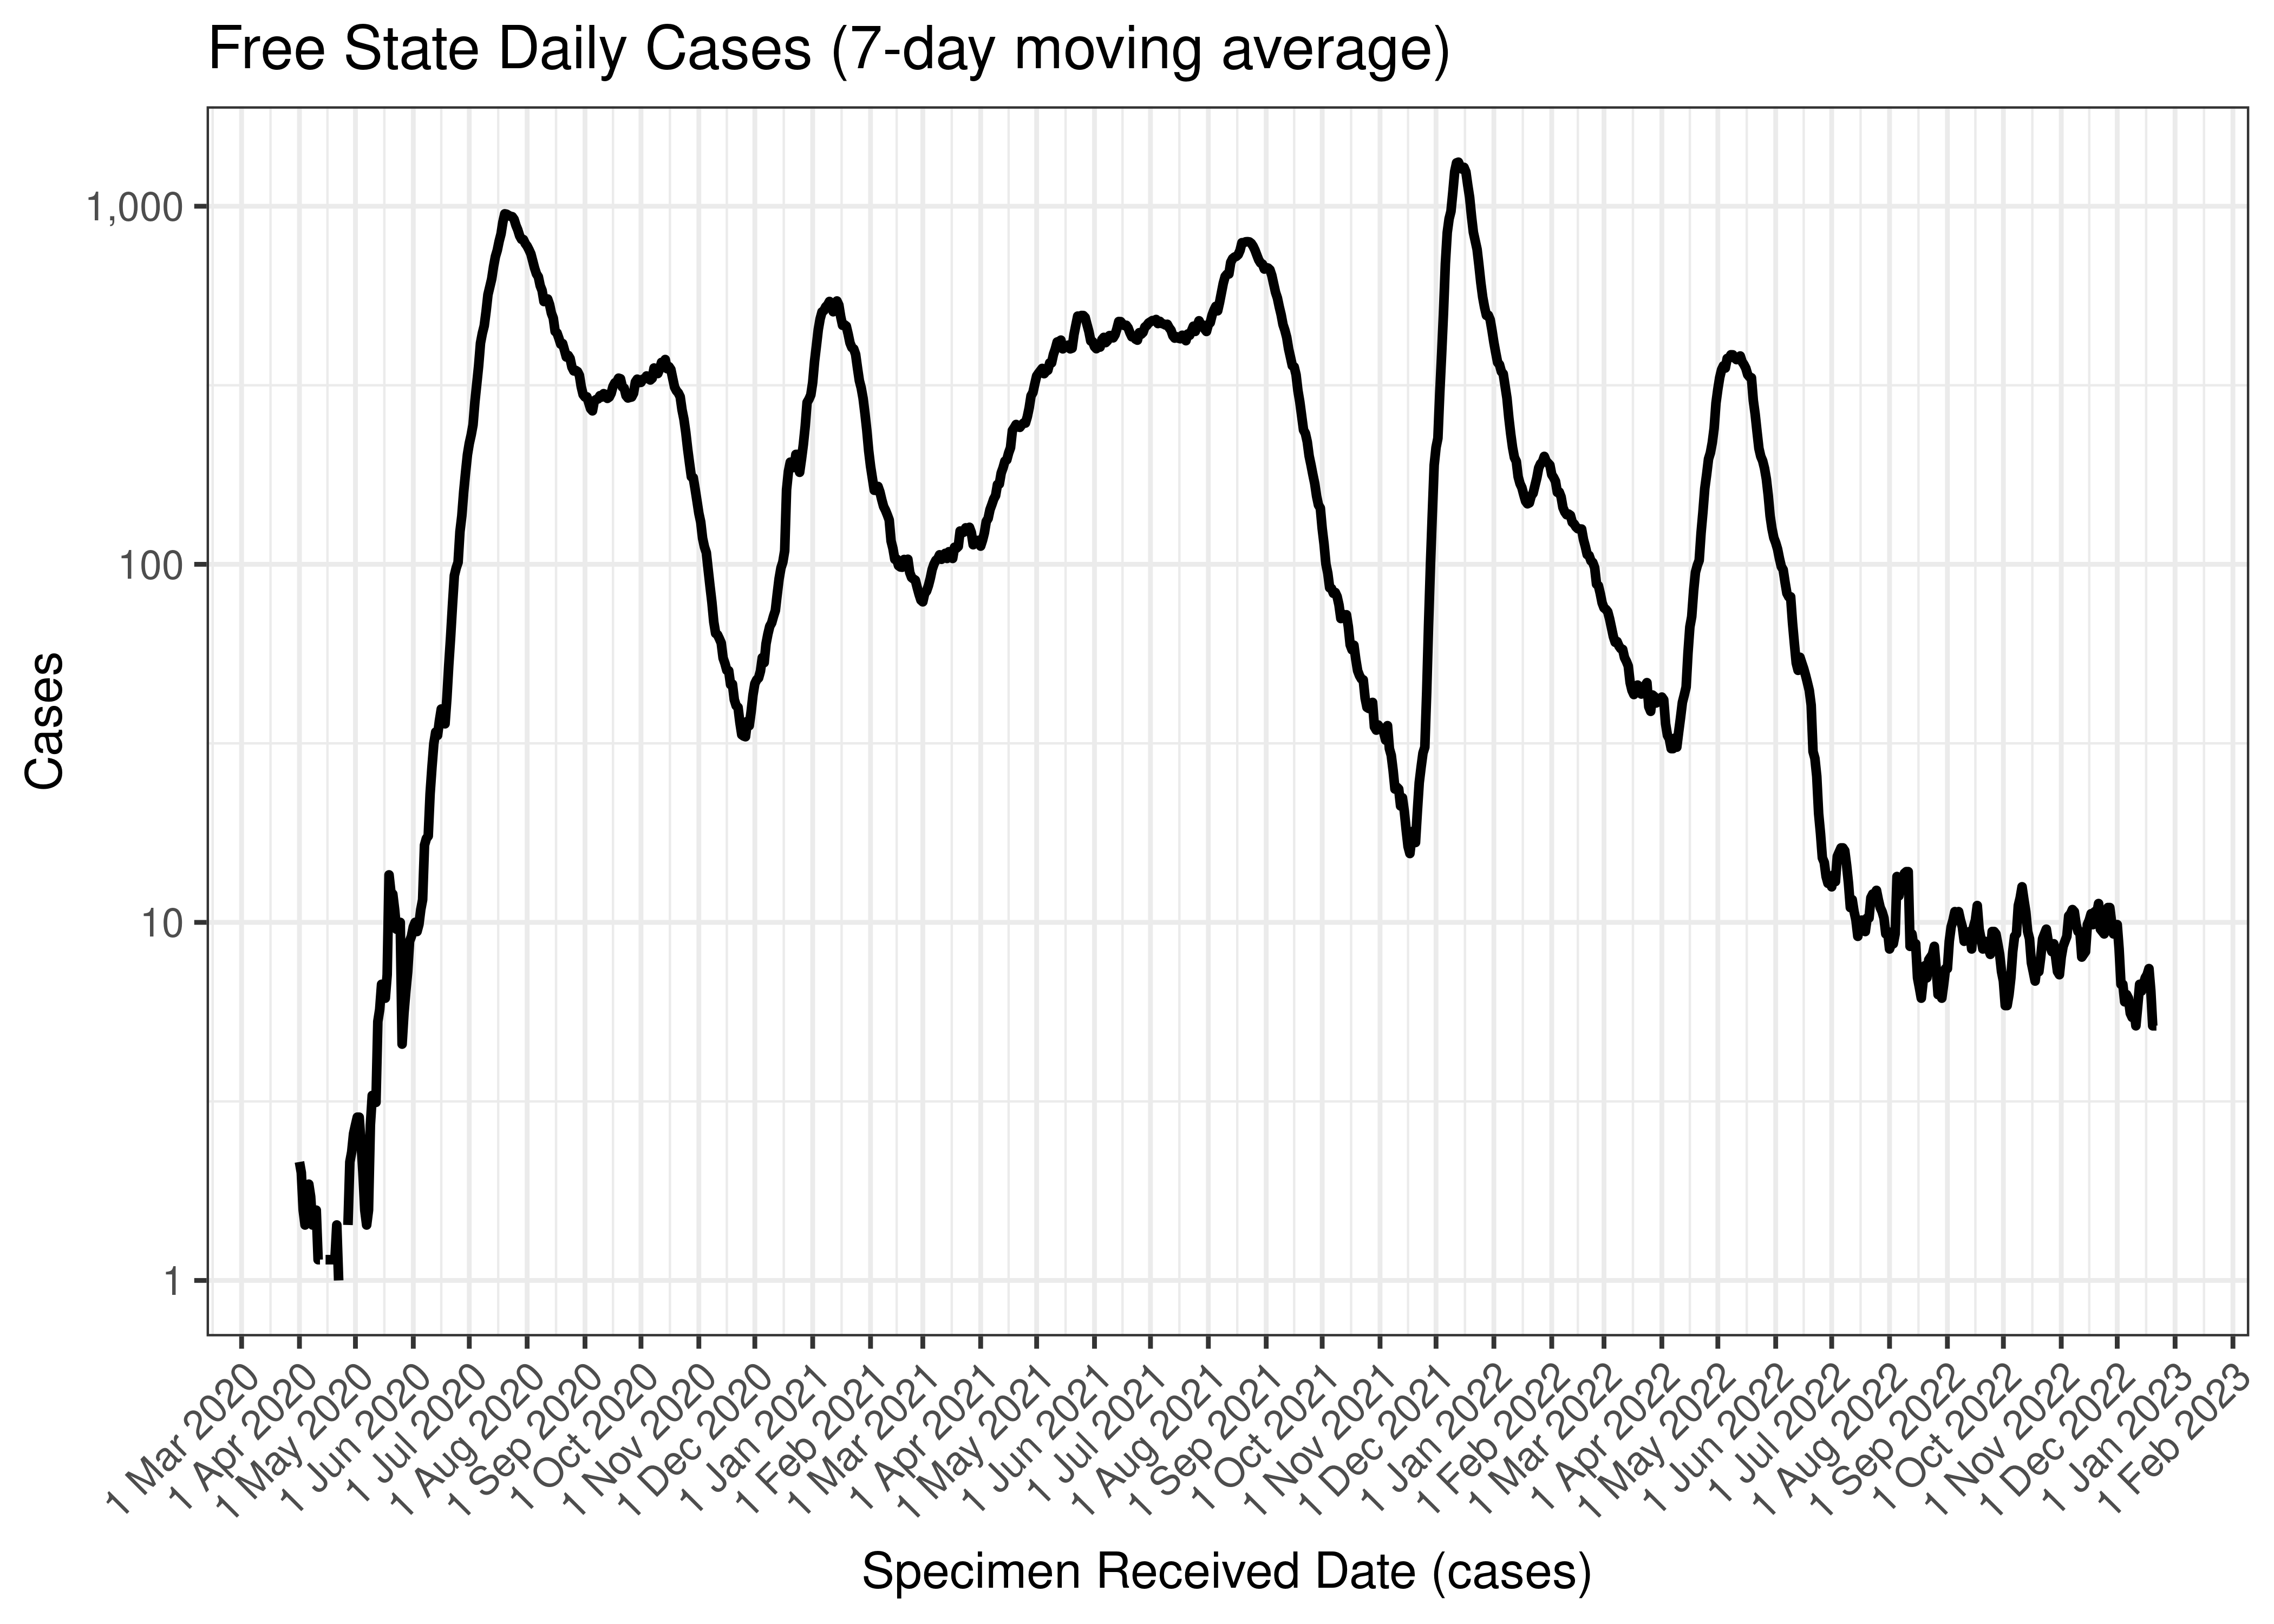
Cases are tabulated by specimen received date below. Cases include estimates for late reporting in recent days as well as adjustments for any public holidays. A centred 7-day moving average is also shown. The peak daily cases in previous waves (as measured by the moving average) is also shown.
| Specimen Received Date | Cases | 7-day Moving Average | Comment |
|---|---|---|---|
| 2020-07-20 | 985 | 952 | Wave 1 Peak |
| 2021-01-14 | 539 | 544 | Wave 2 Peak |
| 2021-08-22 | 482 | 796 | Wave 3 Peak |
| 2021-12-13 | 1,535 | 1,327 | Wave 4 Peak |
| 2022-05-08 | 115 | 385 | Wave 5 Peak (to date) |
Below a 7-day moving average daily case count is plotted for Free State on a log scale since start of the epidemic:
Free State Daily Cases (7-day moving average)
Below the above chart is repeated for the last 30-days:

Free State Daily Cases for Last 30-days (7-day moving average)
Below a 7-day moving average daily case count is plotted for Free State by district municipality on a log scale since start of the epidemic:
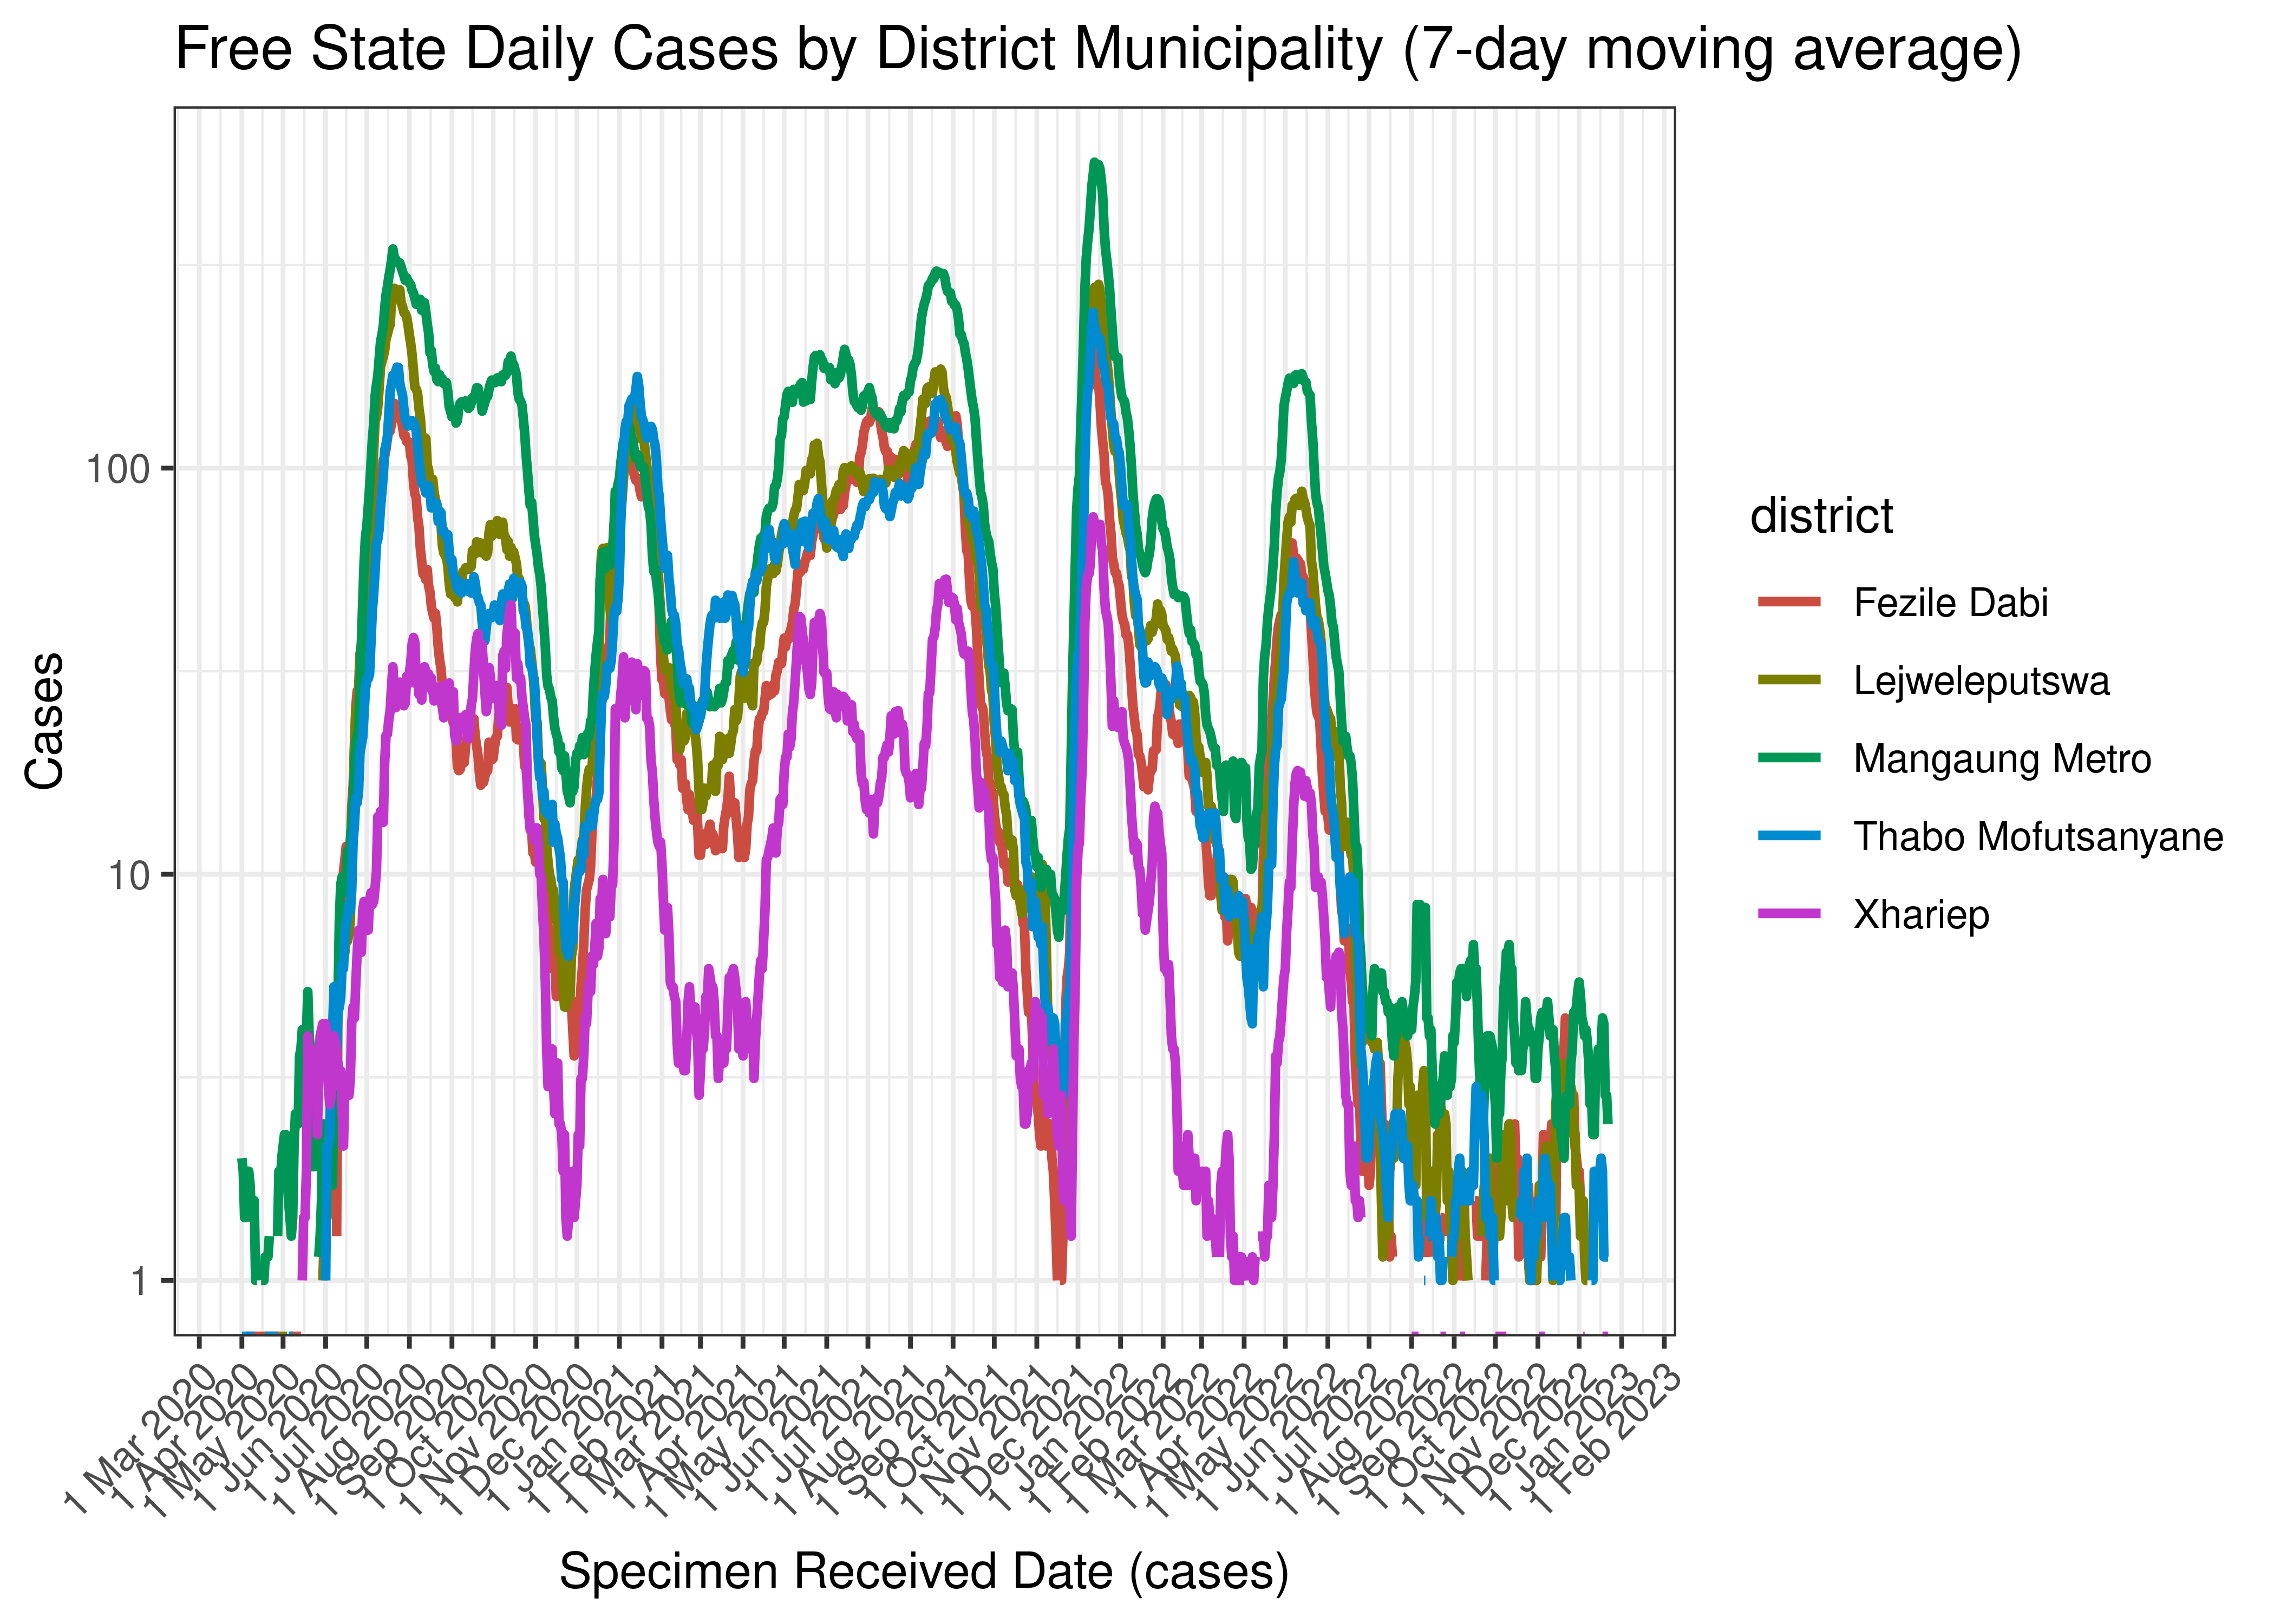
Free State Daily Cases by District Municipality (7-day moving average)
Below the above chart is repeated for the last 30-days:

Free State Daily Cases for Last 30-days by District Municipality (7-day moving average)
6.3.2 Hospital Admissions
Hospital admissions are tabulated by reported date below. The peak daily admissions in previous waves (as measured by the moving average) is also shown.
| Reported Date | Hospital Admissions | 7-day Moving Average | Comment |
|---|---|---|---|
| 2020-07-31 | 77 | 116 | Wave 1 Peak |
| 2021-01-24 | 30 | 236 | Wave 2 Peak |
| 2021-08-23 | 132 | 106 | Wave 3 Peak |
| 2021-12-18 | 30 | 90 | Wave 4 Peak |
| 2022-05-17 | 57 | 41 | Wave 5 Peak (to date) |
| 2022-12-16 | 0 | 1 | |
| 2022-12-17 | 1 | 1 | |
| 2022-12-18 | 1 | 2 | |
| 2022-12-19 | 1 | 1 | |
| 2022-12-20 | 1 | 1 | |
| 2022-12-21 | 3 | NA | |
| 2022-12-22 | 2 | NA | |
| 2022-12-23 | 0 | NA |
Below a 7-day moving average daily hospital admissions count is plotted for Free State on a log scale since start of the epidemic:
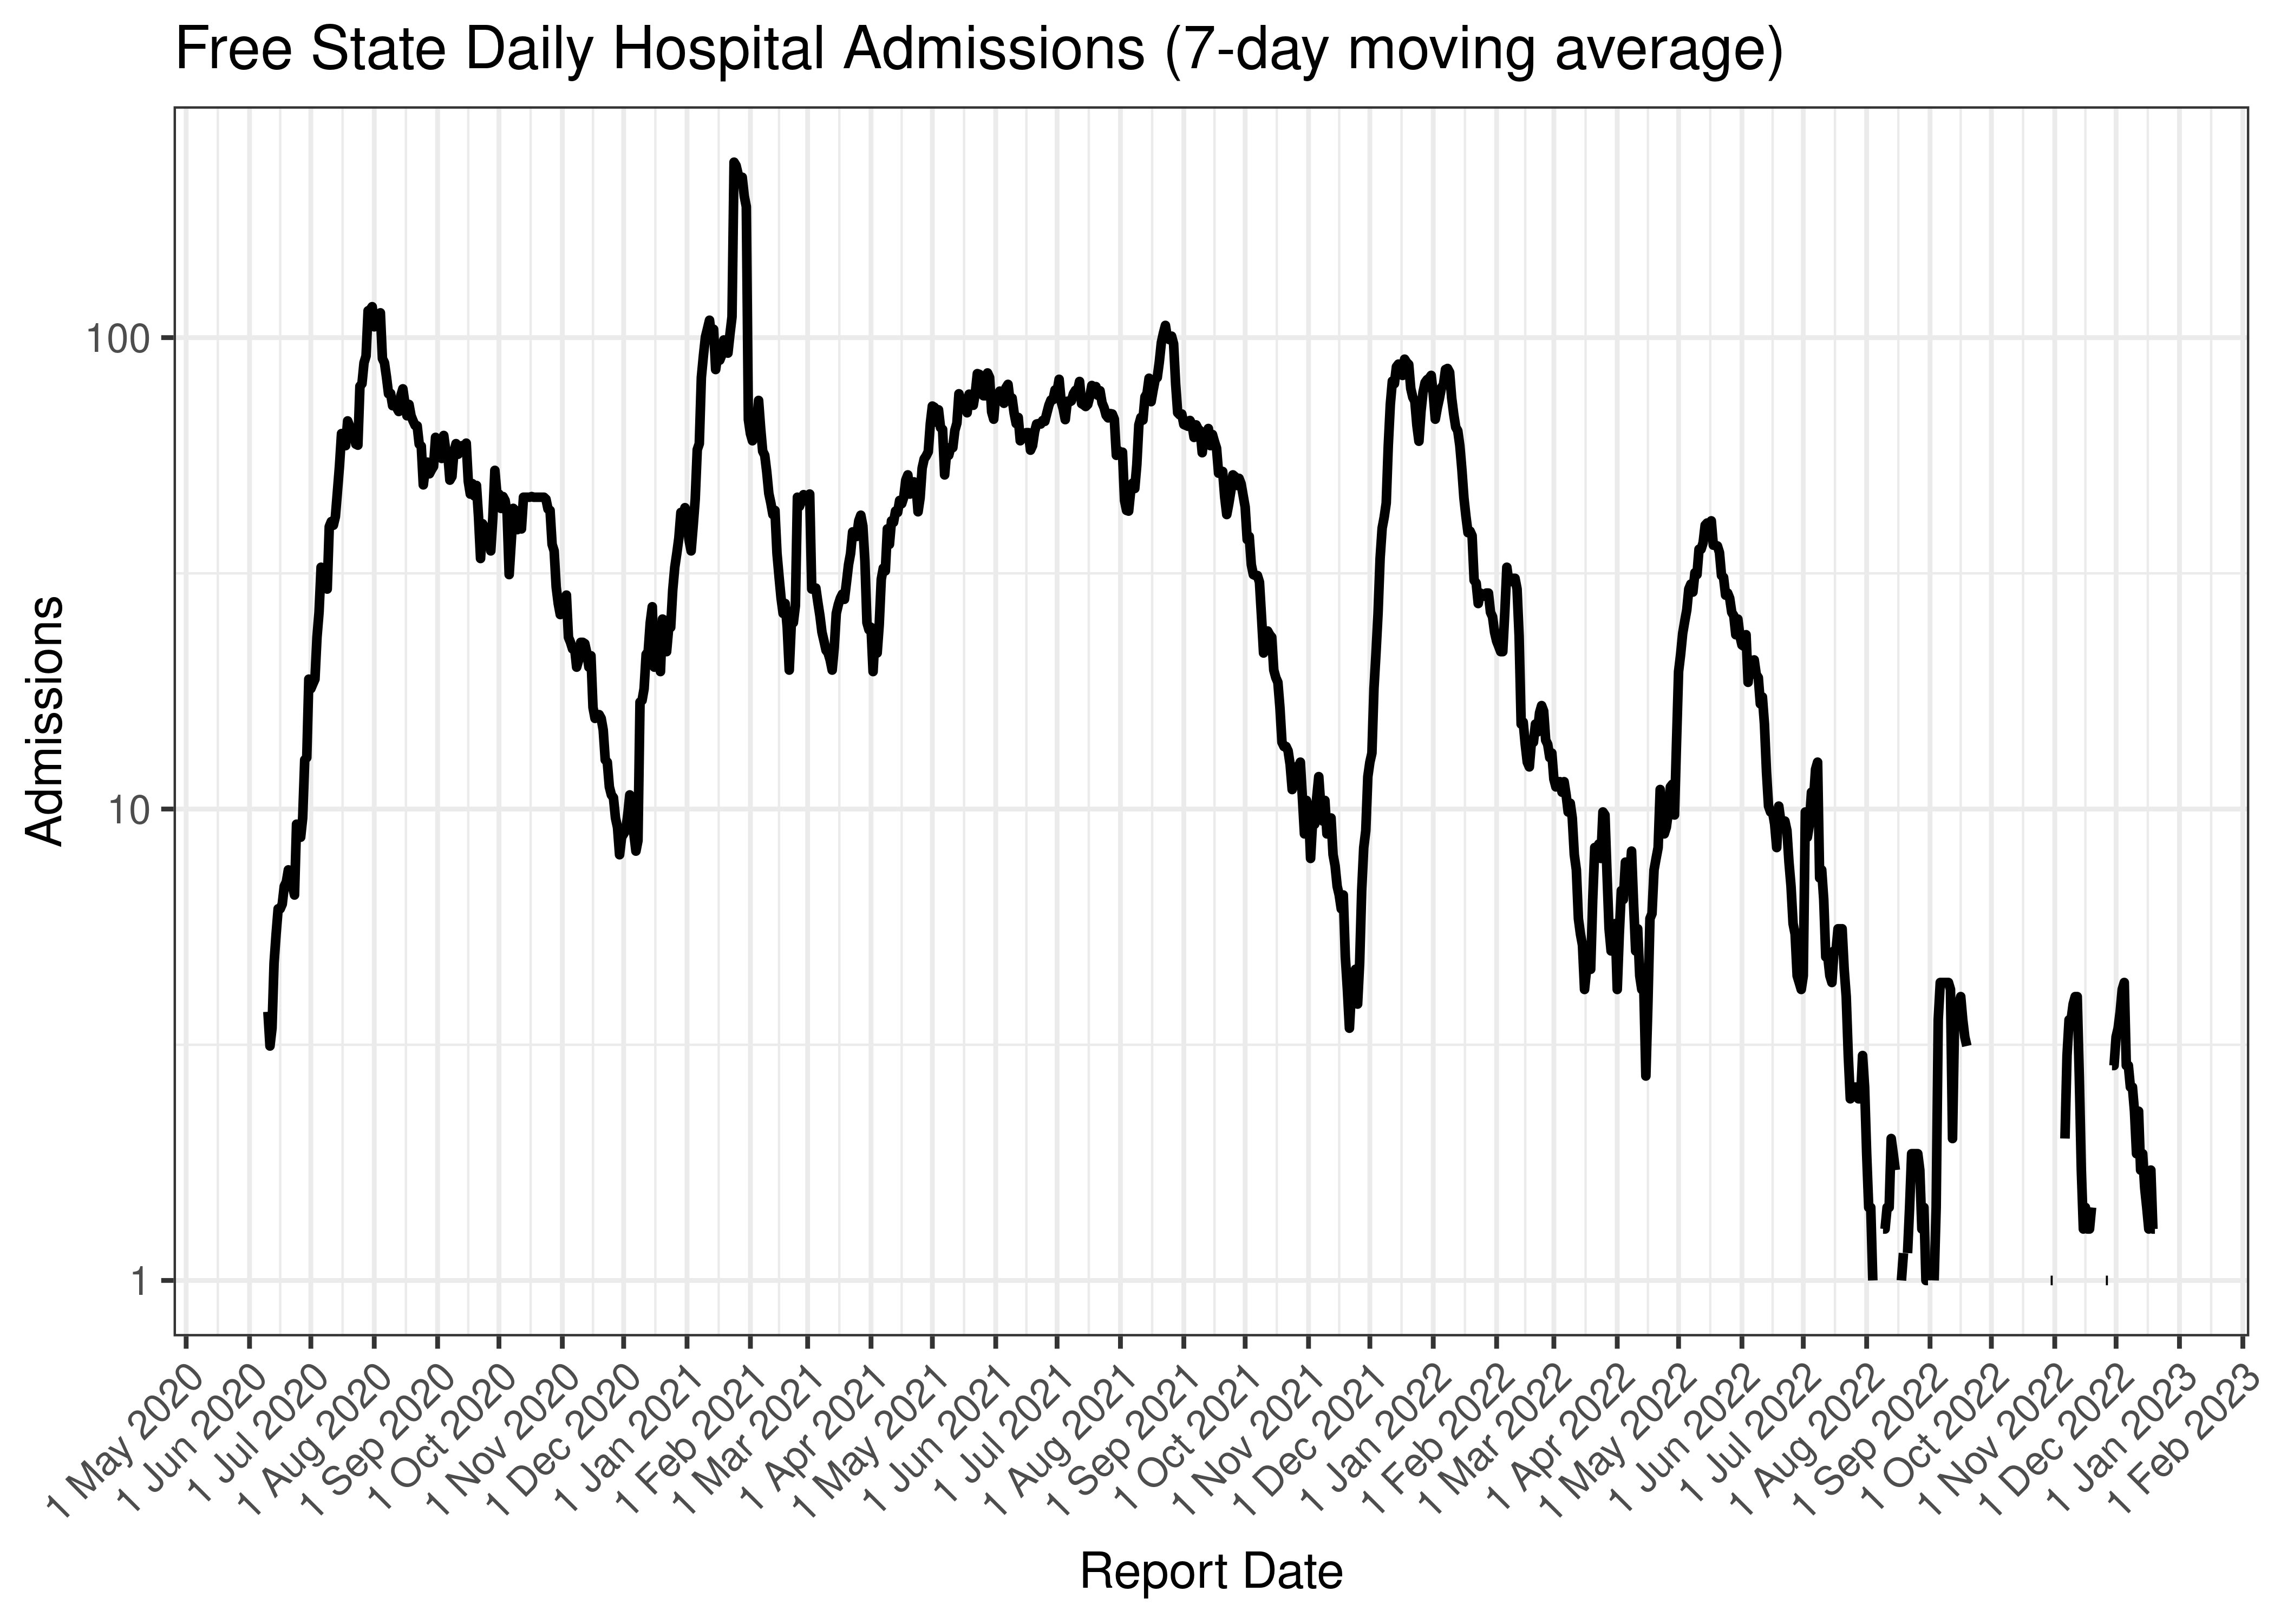
Free State Daily Hospital Admissions (7-day moving average)
Below the above chart is repeated for the last 30-days:
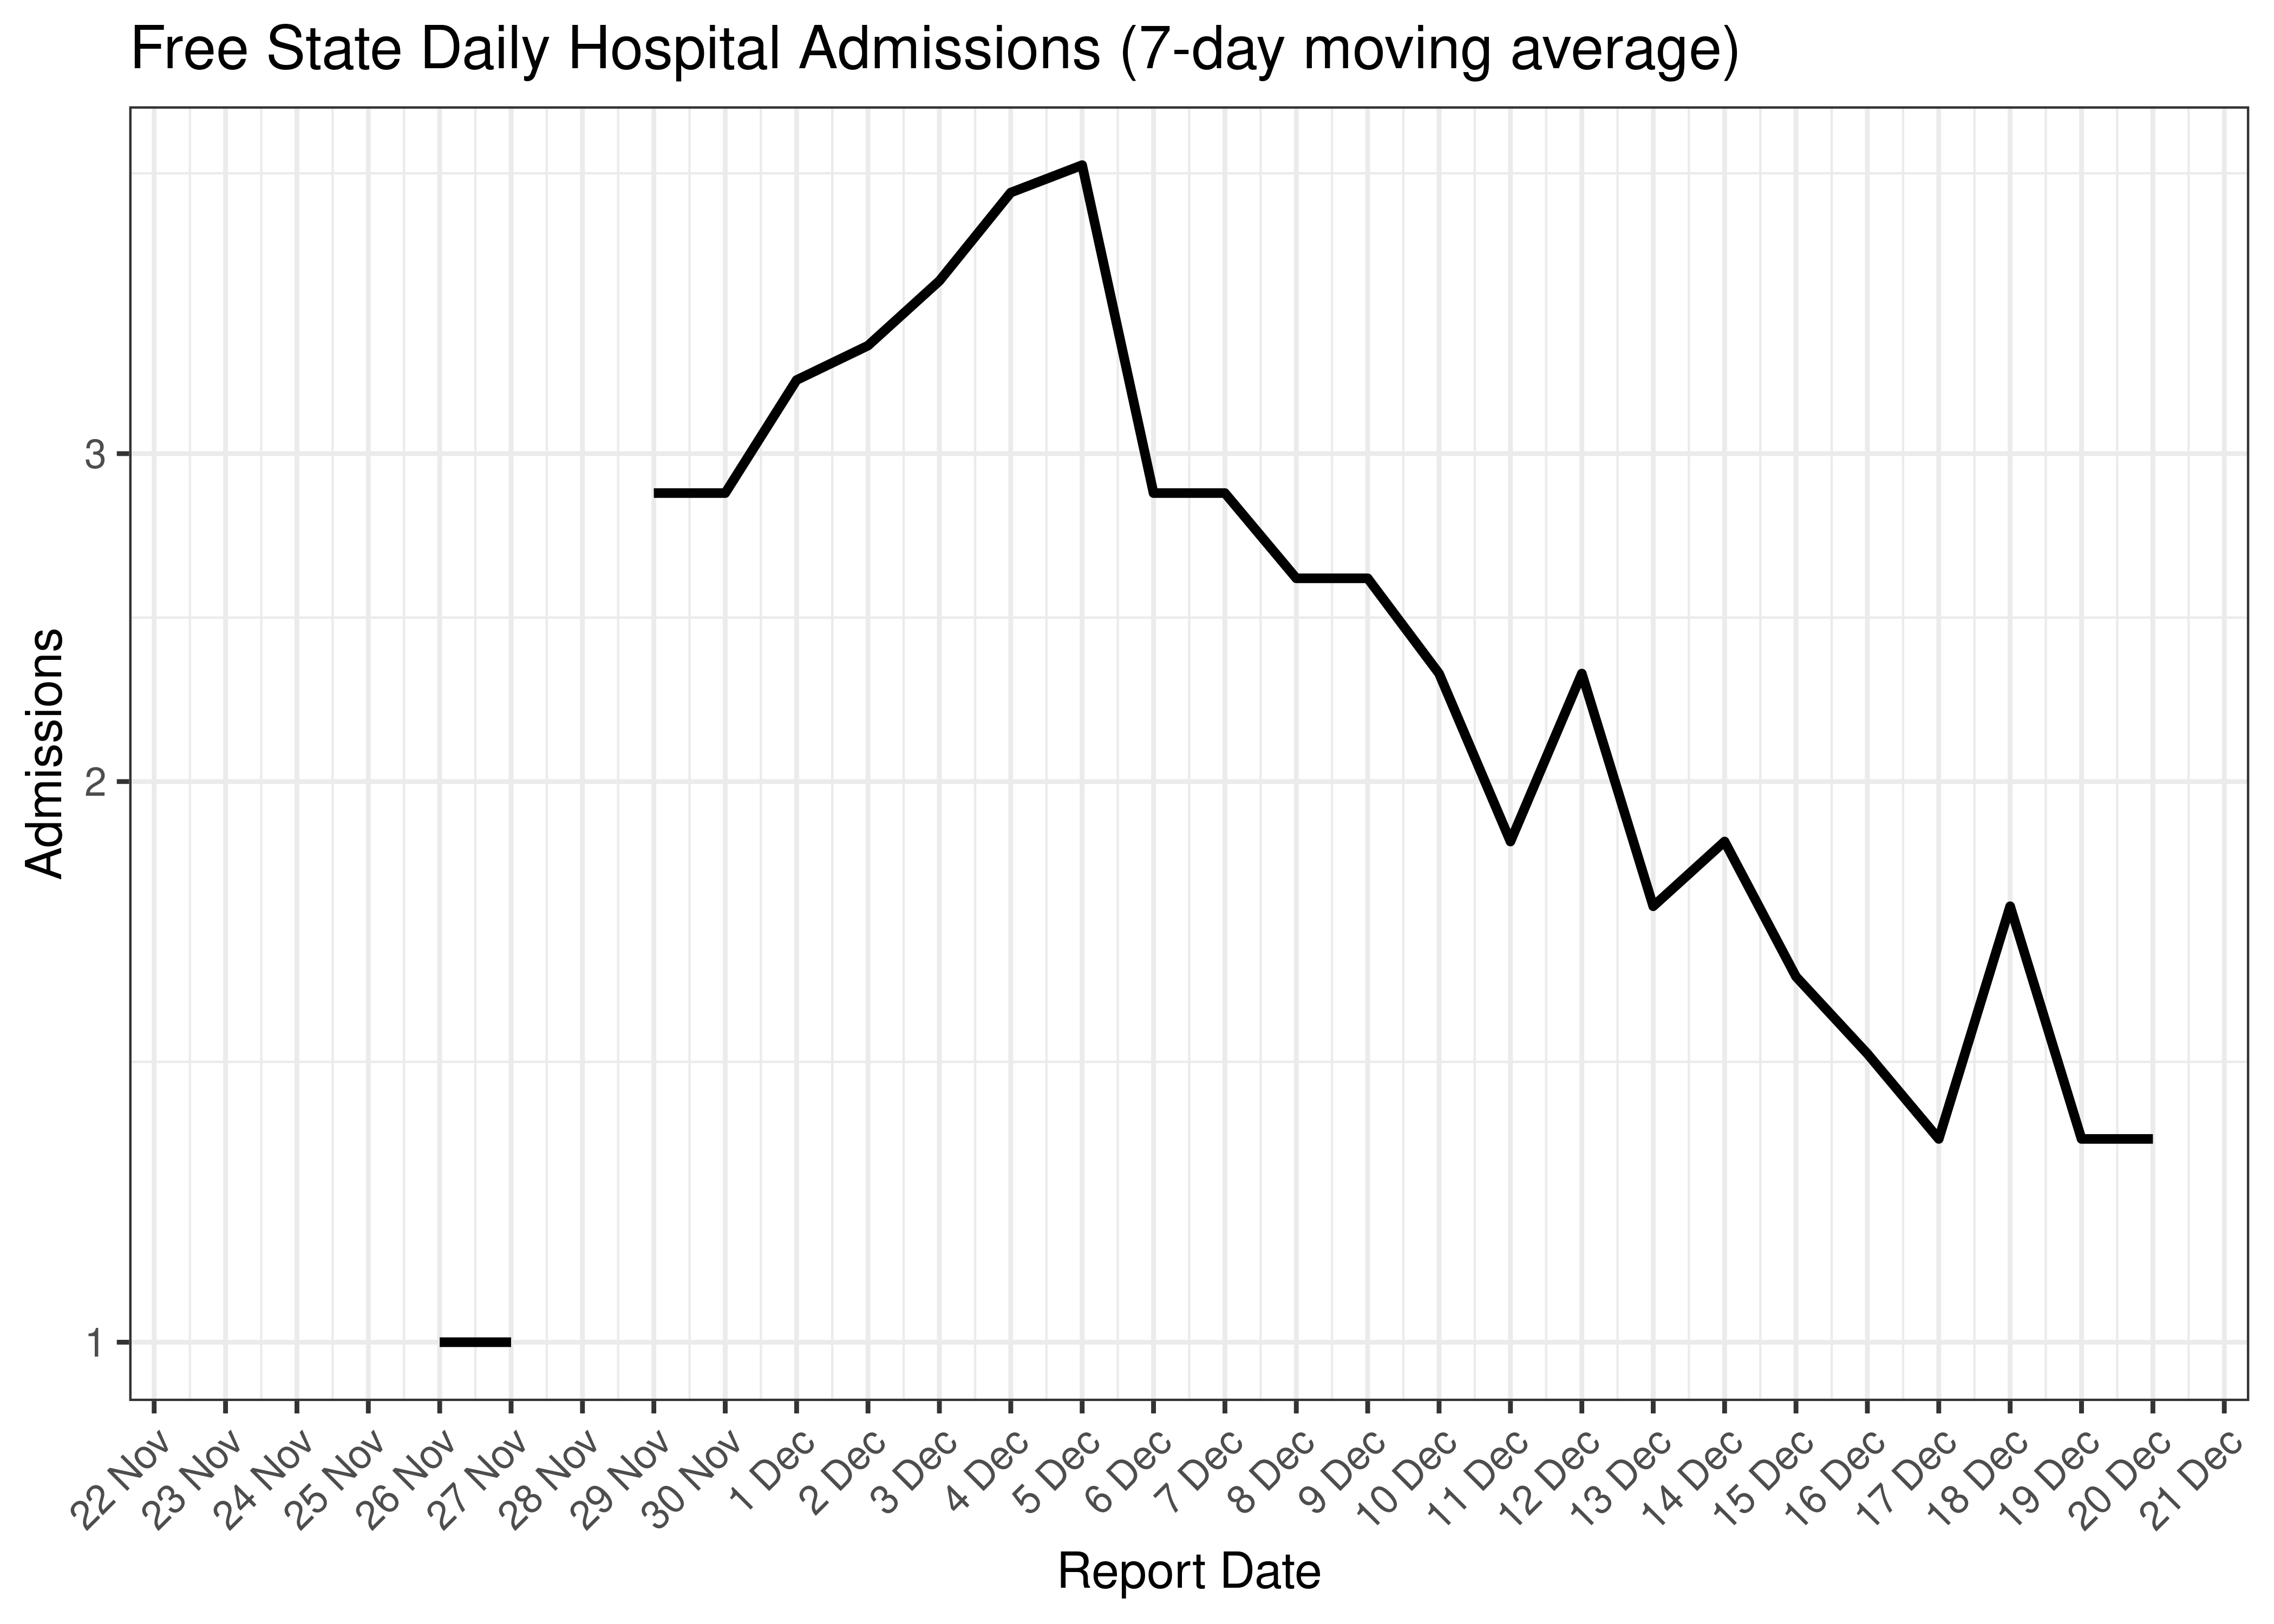
Free State Daily Hospital Admissions for Last 30-days (7-day moving average)
6.3.3 Hospital Deaths
Hospital deaths are tabulated by reported date below. The peak daily deaths in previous waves (as measured by the moving average) is also shown.
Note that hospital deaths underestimates total COVID-19 deaths in South Africa.
| Reported Date | Hospital Deaths | 7-day Moving Average | Comment |
|---|---|---|---|
| 2020-07-30 | 18 | 24 | Wave 1 Peak |
| 2021-01-25 | 45 | 34 | Wave 2 Peak |
| 2021-06-20 | 4 | 29 | Wave 3 Peak |
| 2021-12-31 | 14 | 11 | Wave 4 Peak |
| 2022-06-09 | 6 | 3 | Wave 5 Peak (to date) |
| 2022-12-16 | 0 | 0 | |
| 2022-12-17 | 0 | 0 | |
| 2022-12-18 | 0 | 0 | |
| 2022-12-19 | 0 | 0 | |
| 2022-12-20 | 0 | 0 | |
| 2022-12-21 | 1 | NA | |
| 2022-12-22 | 0 | NA | |
| 2022-12-23 | 0 | NA |
Below a 7-day moving average daily hospital deaths count is plotted for Free State on a log scale since start of the epidemic:
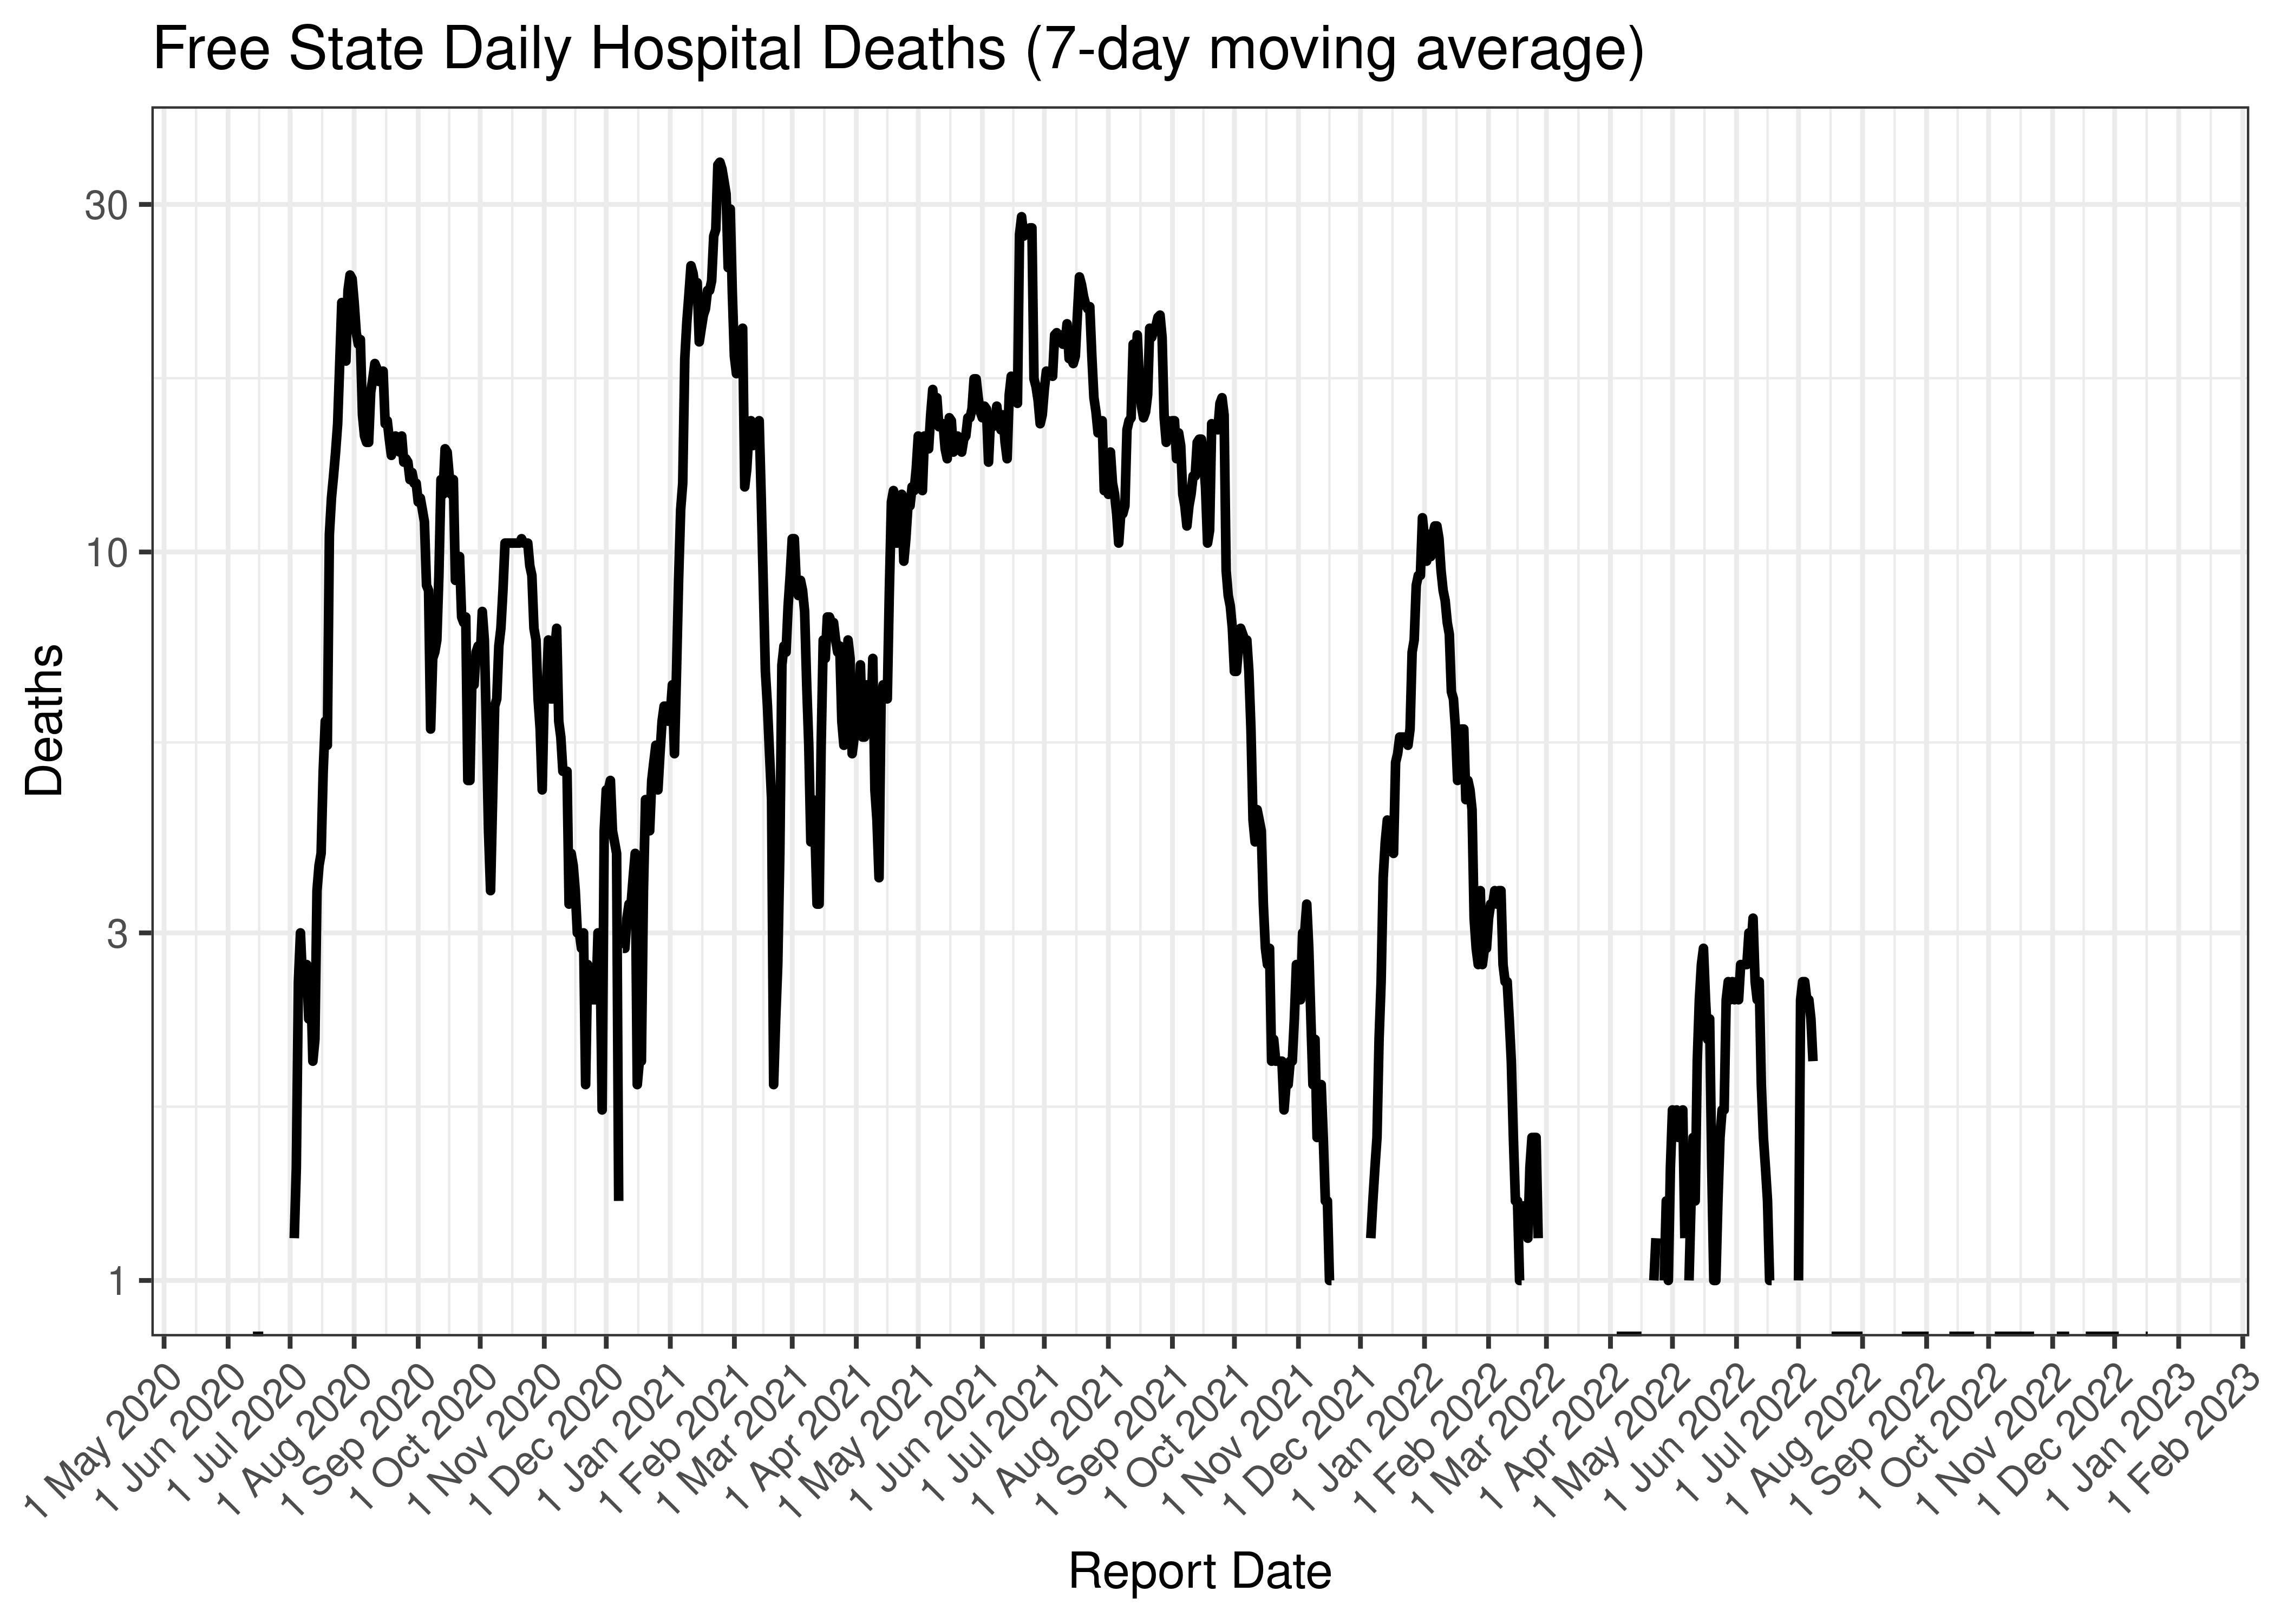
Free State Daily Hospital Deaths (7-day moving average)
Below the above chart is repeated for the last 30-days:
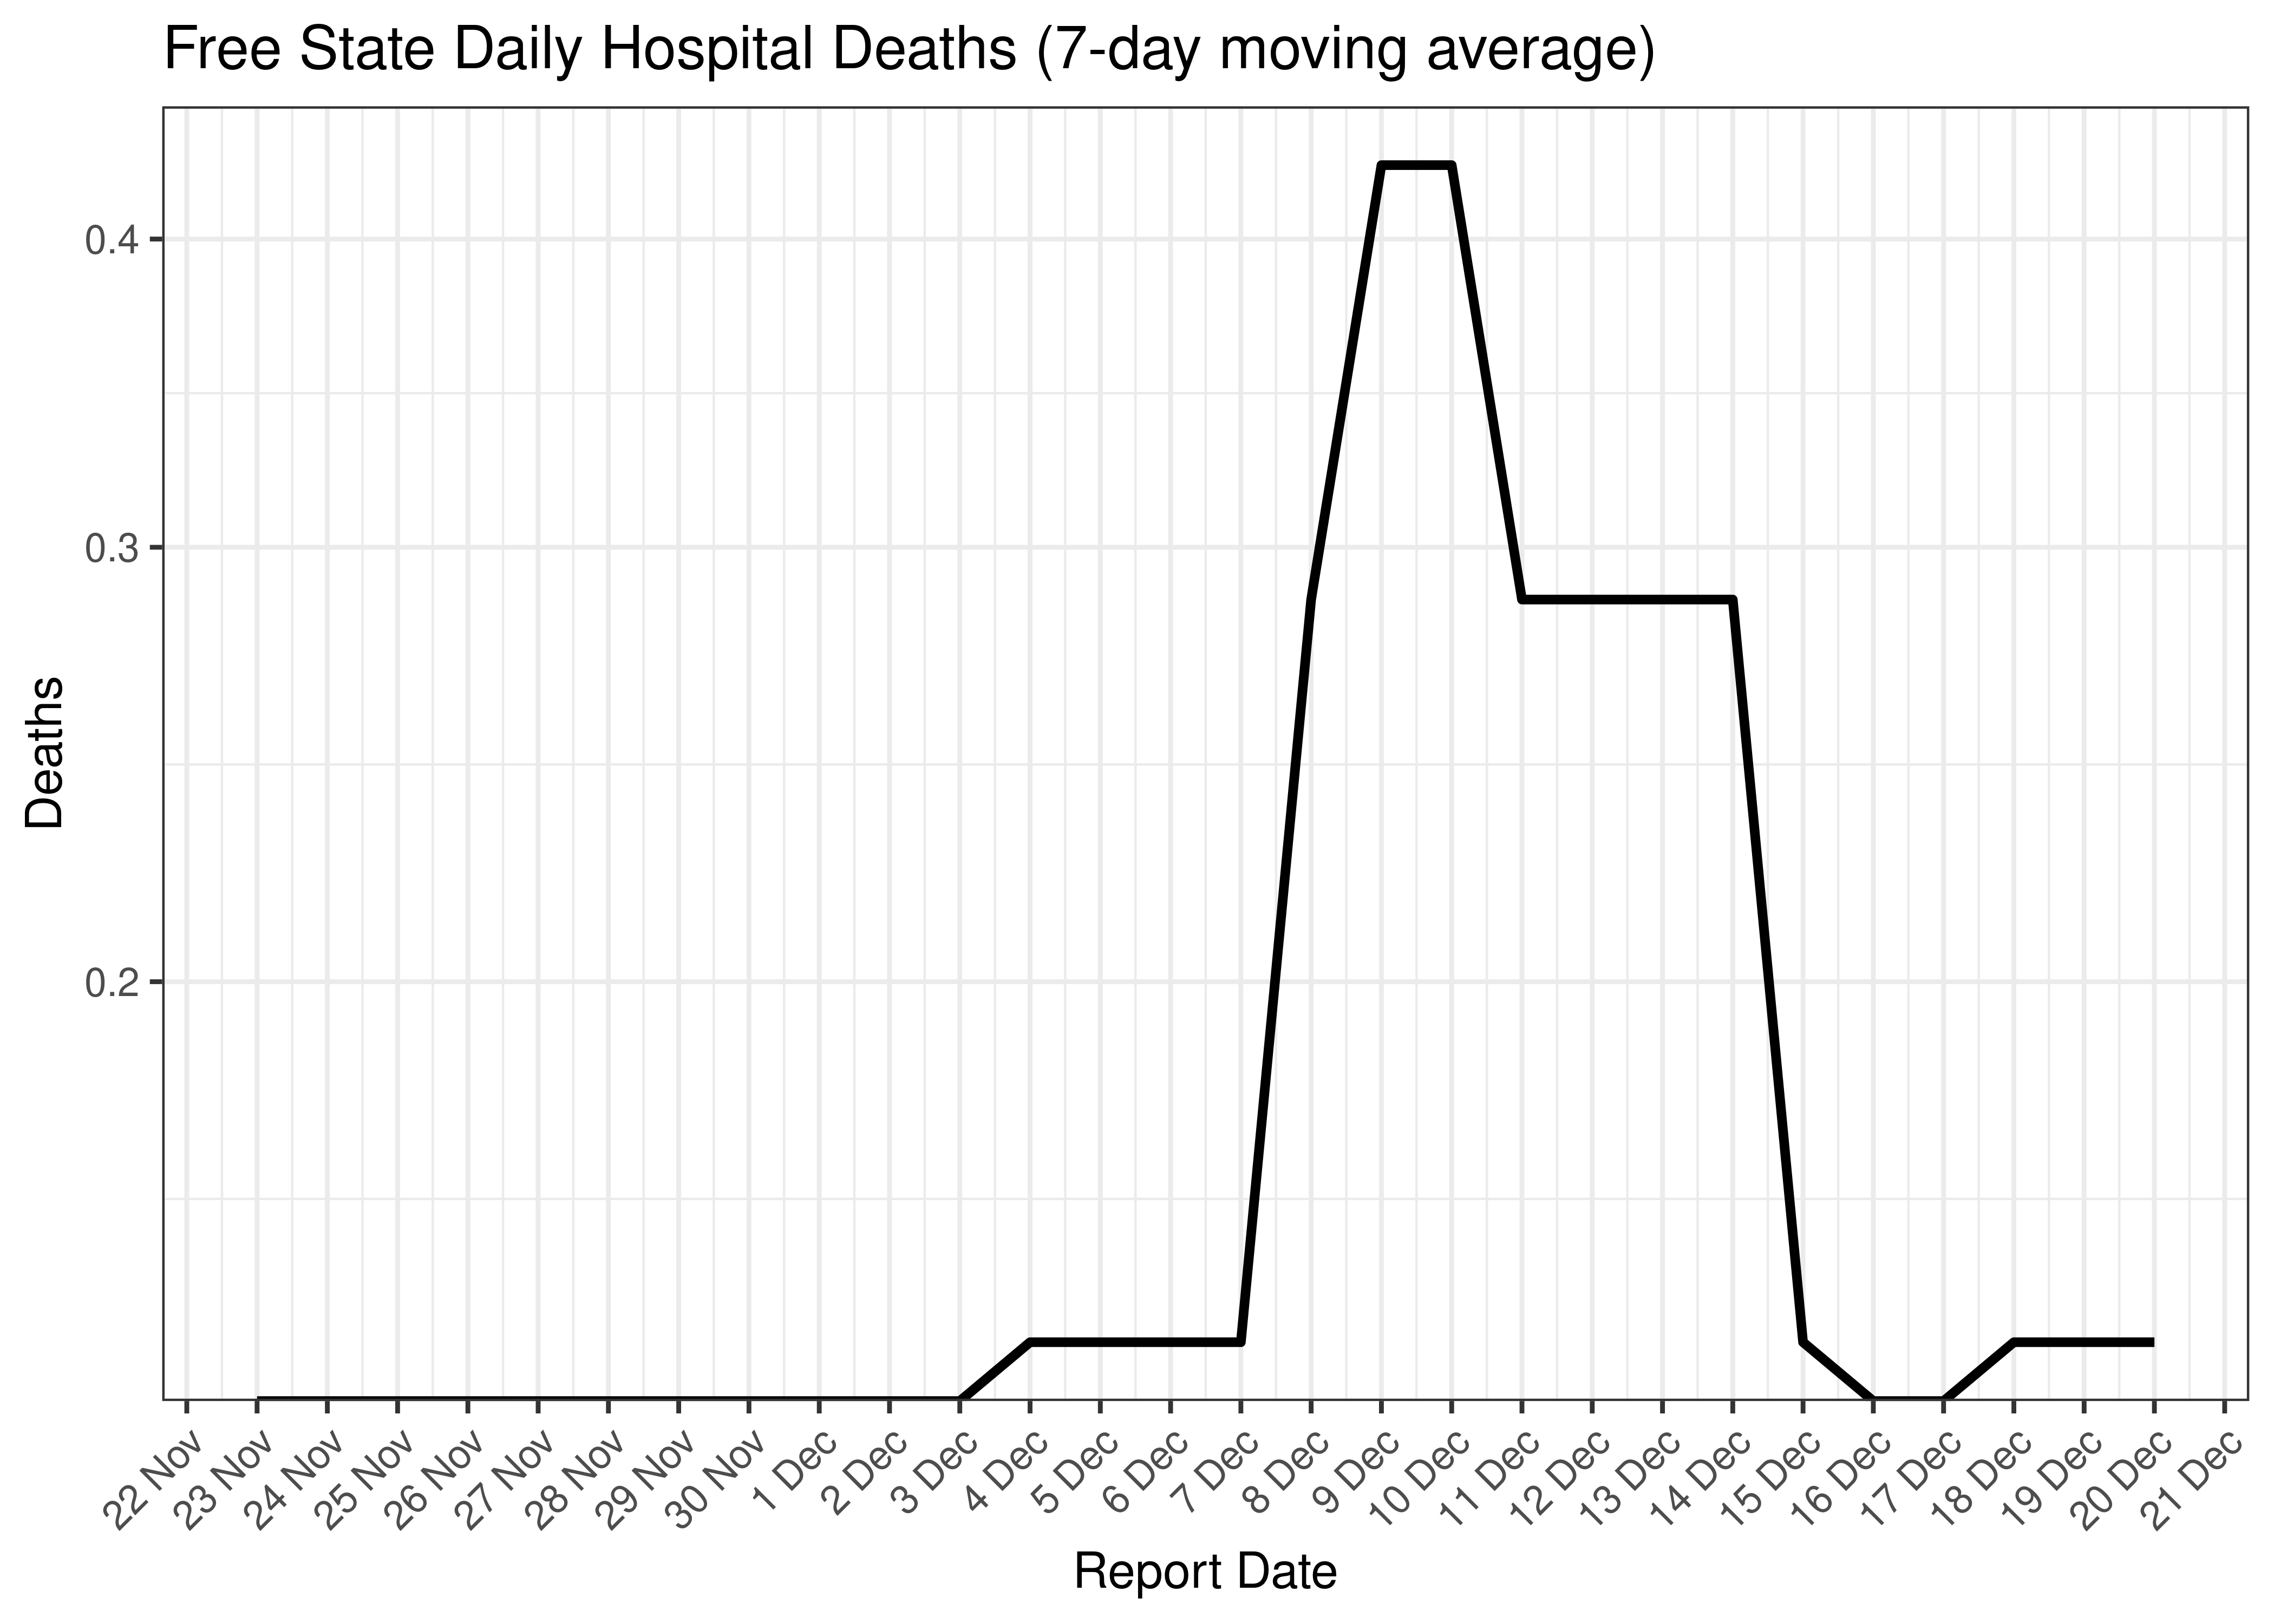
Free State Daily Hospital Deaths for Last 30-days (7-day moving average)
6.3.4 Excess Deaths
Excess deaths are tabulated by date of death below. The peak daily deaths in previous waves (as measured by the moving average) is also shown.
| Date of Death | Excess Deaths | 7-day Moving Average | Comment |
|---|---|---|---|
| 2020-07-29 | 78 | 78 | Wave 1 Peak |
| 2021-01-20 | 70 | 70 | Wave 2 Peak |
| 2021-07-28 | 66 | 66 | Wave 3 Peak |
| 2022-01-12 | 25 | 25 | Wave 4 Peak |
| 2022-05-25 | 23 | 23 | Wave 5 Peak (to date) |
| 2022-12-03 | 4 | 2 | |
| 2022-12-04 | 0 | 2 | |
| 2022-12-05 | 0 | 1 | |
| 2022-12-06 | 0 | 0 | |
| 2022-12-07 | 0 | 0 | |
| 2022-12-08 | 0 | NA | |
| 2022-12-09 | 0 | NA | |
| 2022-12-10 | 0 | NA |
Below a 7-day moving average daily excess deaths count is plotted for Free State on a log scale since start of the epidemic:
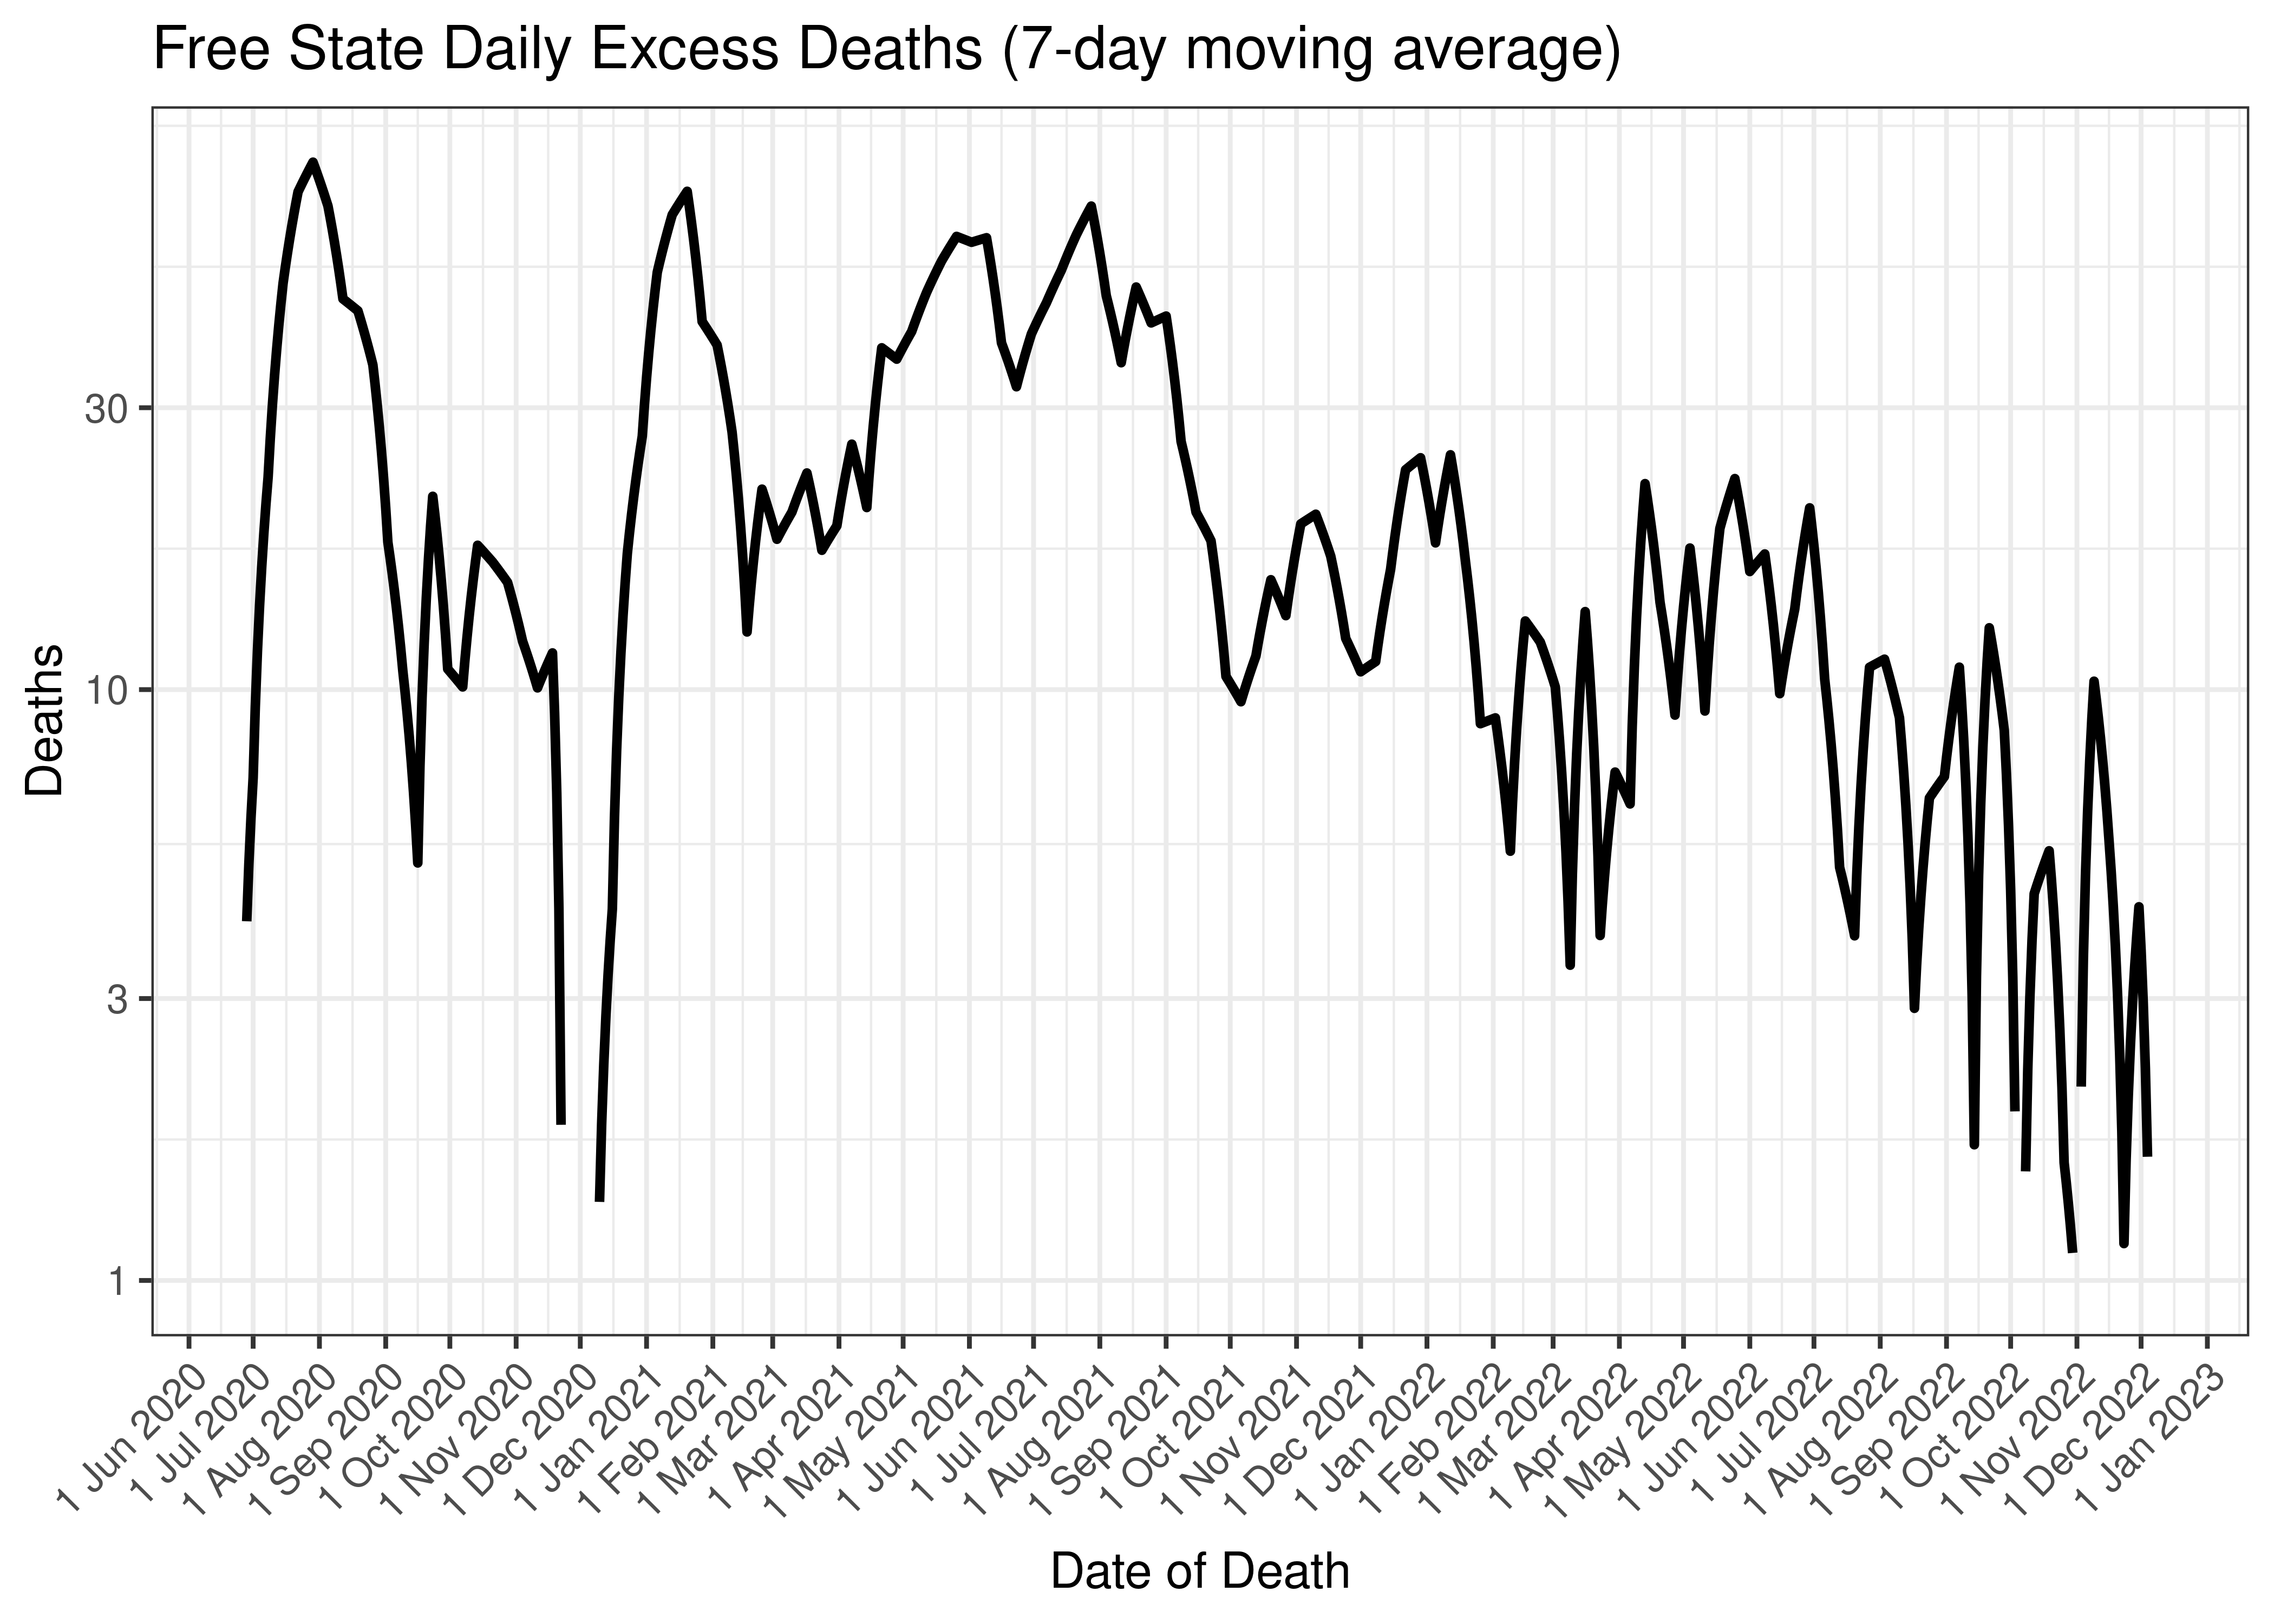
Free State Daily Excess Deaths (7-day moving average)
Below the above chart is repeated for the last 30-days:
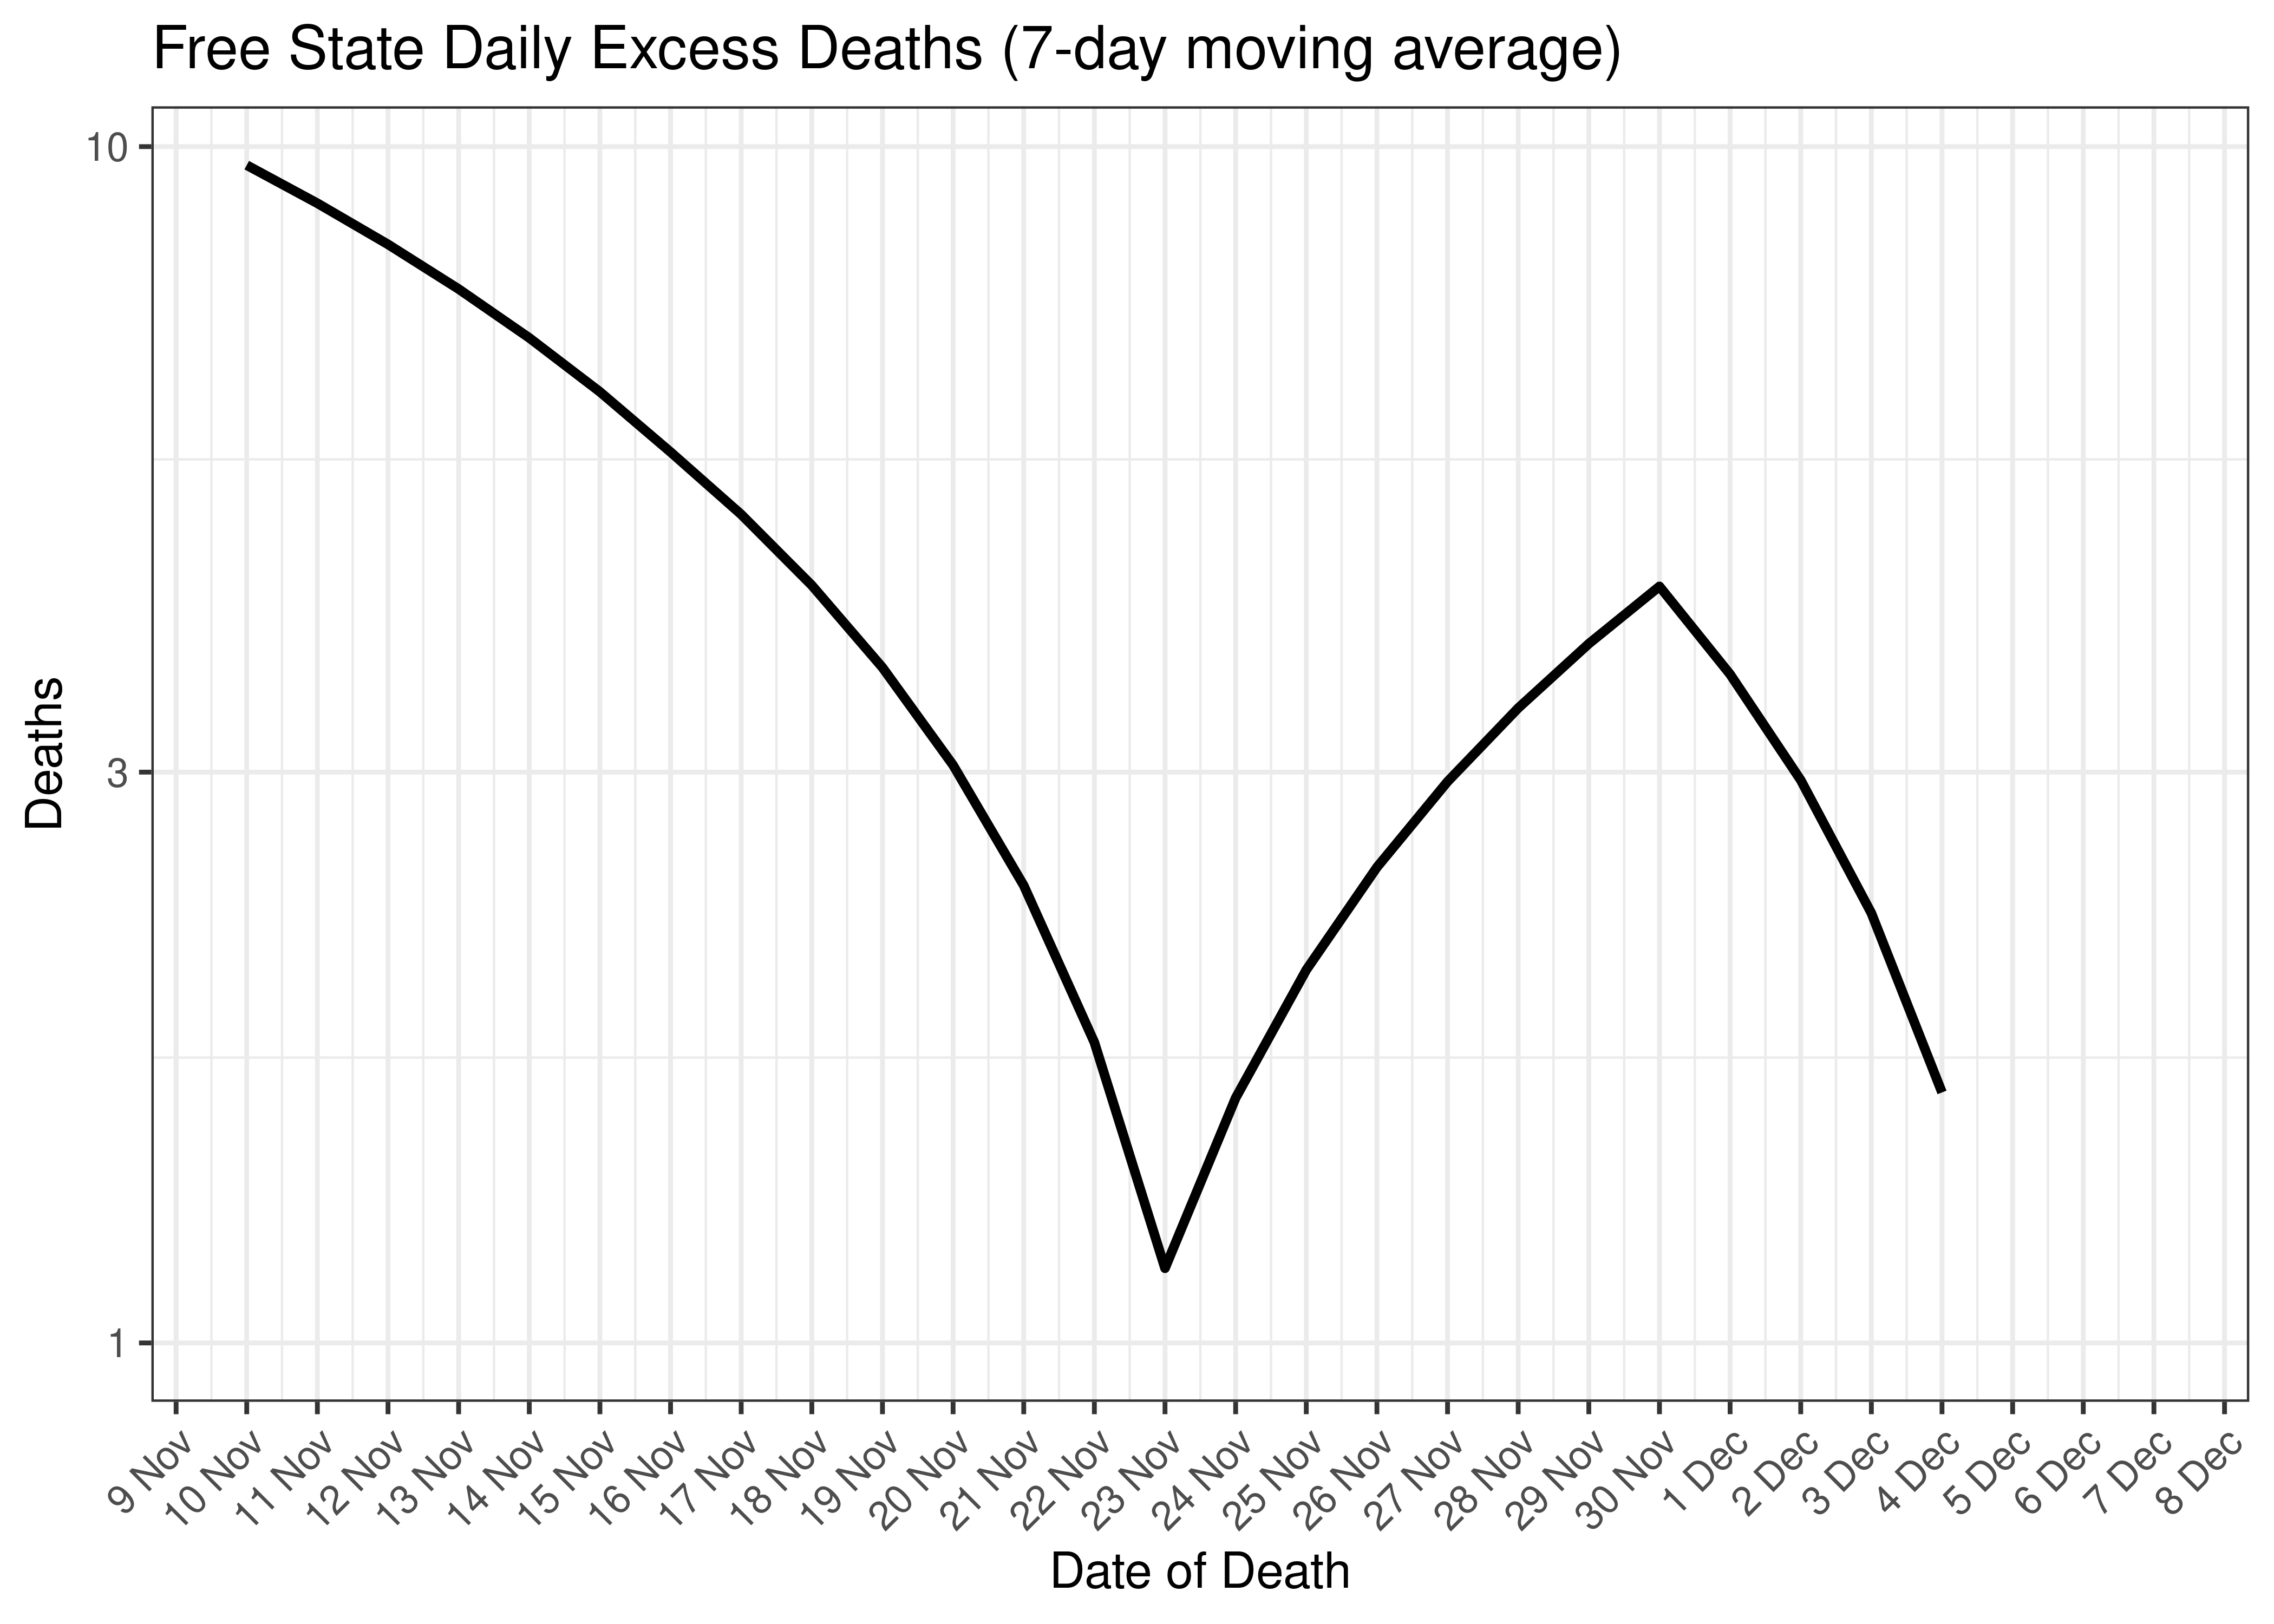
Free State Daily Excess Deaths for Last 30-days (7-day moving average)
6.3.5 Cases, Admissions and Deaths Combined
Below a 7-day moving average daily case, admission and excess death counts are plotted for Free State on a log scale since start of the epidemic. Note admissions and excess deaths are plotted by reported date, whereas cases are plotted by specimen received date.
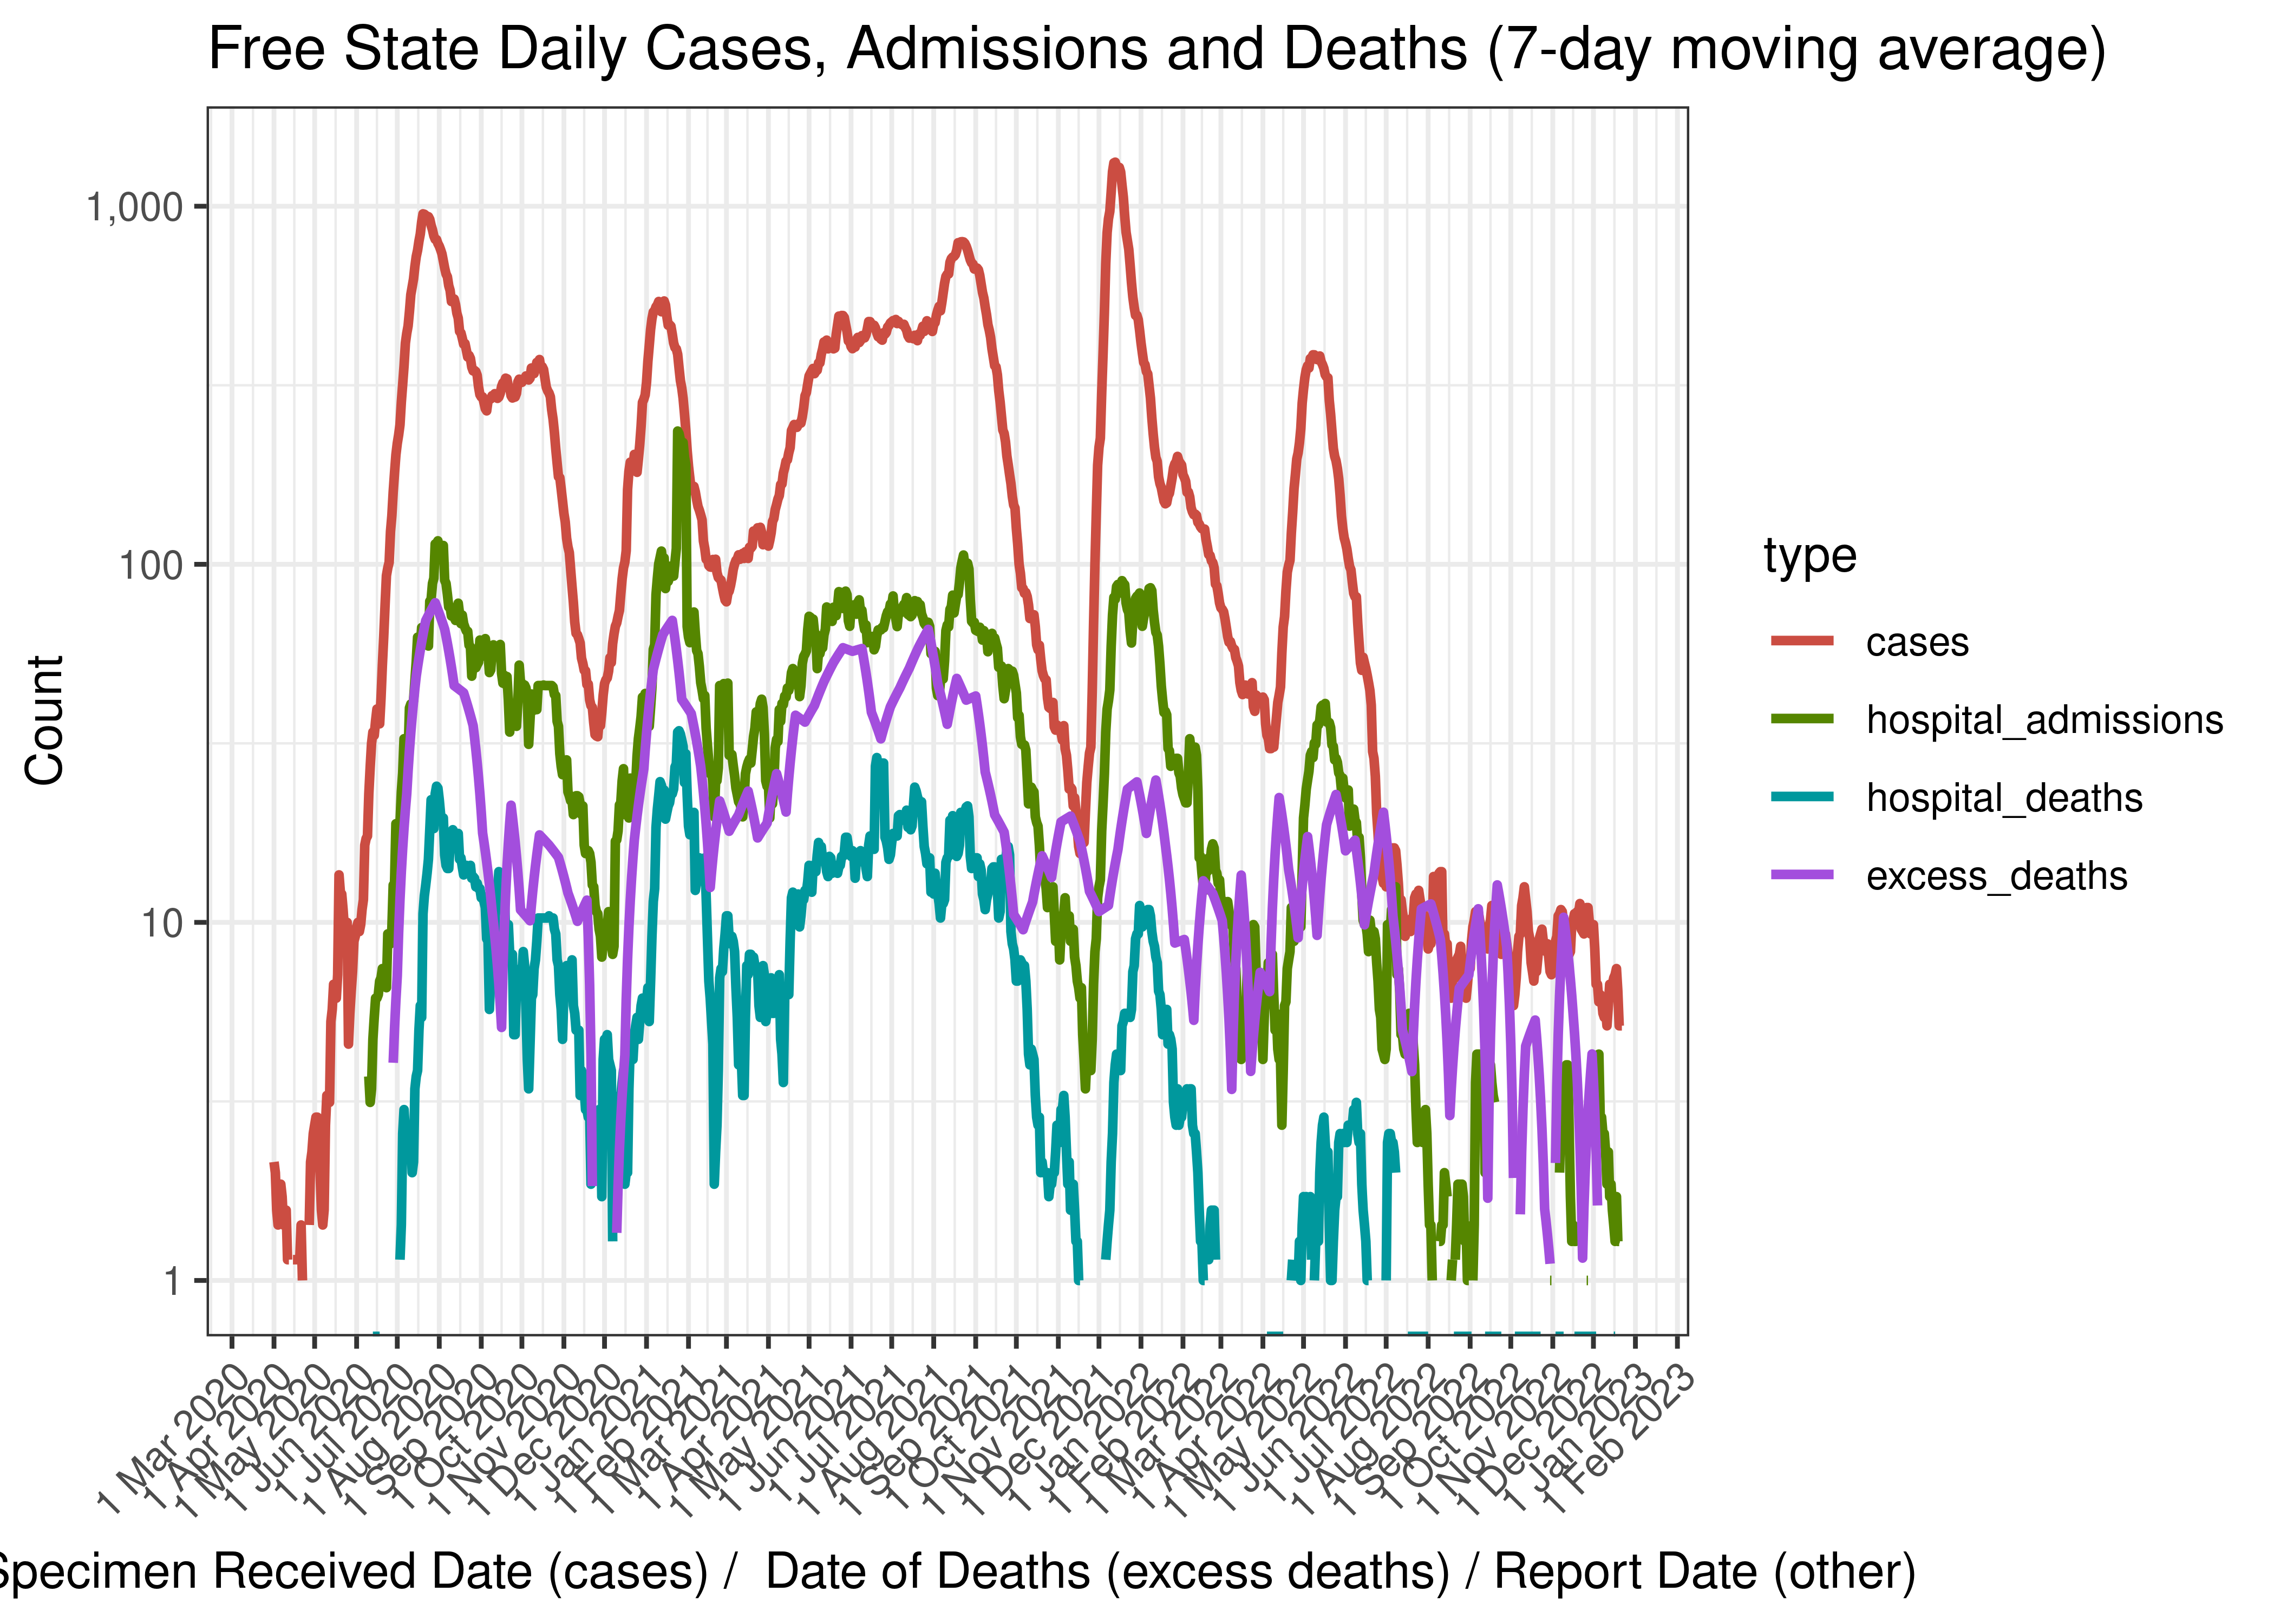
Free State Daily Cases, Admissions and Deaths (7-day moving average)
Below the above chart is repeated for the last 30-days:
Free State Daily Cases, Admissions and Deaths for Last 30-days (7-day moving average)
6.3.6 Crude Ratios per Wave
Below crude rations are calculated between the waves. It’s based on the following starting dates:
- Wave 1 started on 2020-01-01.
- Wave 2 started on 2020-10-01.
- Wave 3 started on 2021-04-01.
- Wave 4 started on 2021-11-01.
- Wave 5 started on 2022-04-01.
Below crude ratios are tabulated and plotted. These ratios are:
- Case admissions ratio calculated as admissions divided by cases.
- Case fatality ratio calculated as hospital deaths divided by cases (Note that COVID-19 deaths are under-reported by a significant factor in South Africa).
- Case excess deaths ratio calculated as excess deaths divided by cases.
- Hospital fatality ratio calculated as hospital deaths divided by admissions (Note that COVID-19 deaths are under-reported by a significant factor in South Africa).
- Death reporting ratio calculated as hospital deaths divided by excess deaths.
| Wave | Case Admission Ratio | Case Fatality Ratio | Case Excess Deaths Ratio | Hospital Fatality Ratio | Death Reporting Ratio | |
|---|---|---|---|---|---|---|
| Free State | Wave 1 | 12.1% | 2.21% | 7.13% | 18.3% | 31.0% |
| Free State | Wave 2 | 23.2% | 4.77% | 11.03% | 20.6% | 43.3% |
| Free State | Wave 3 | 15.4% | 3.53% | 9.75% | 23.0% | 36.2% |
| Free State | Wave 4 | 12.0% | 1.16% | 5.38% | 9.7% | 21.7% |
| Free State | Wave 5 | 12.8% | 1.06% | 15.32% | 8.3% | 6.9% |
Below the rations above are plotted graphically:
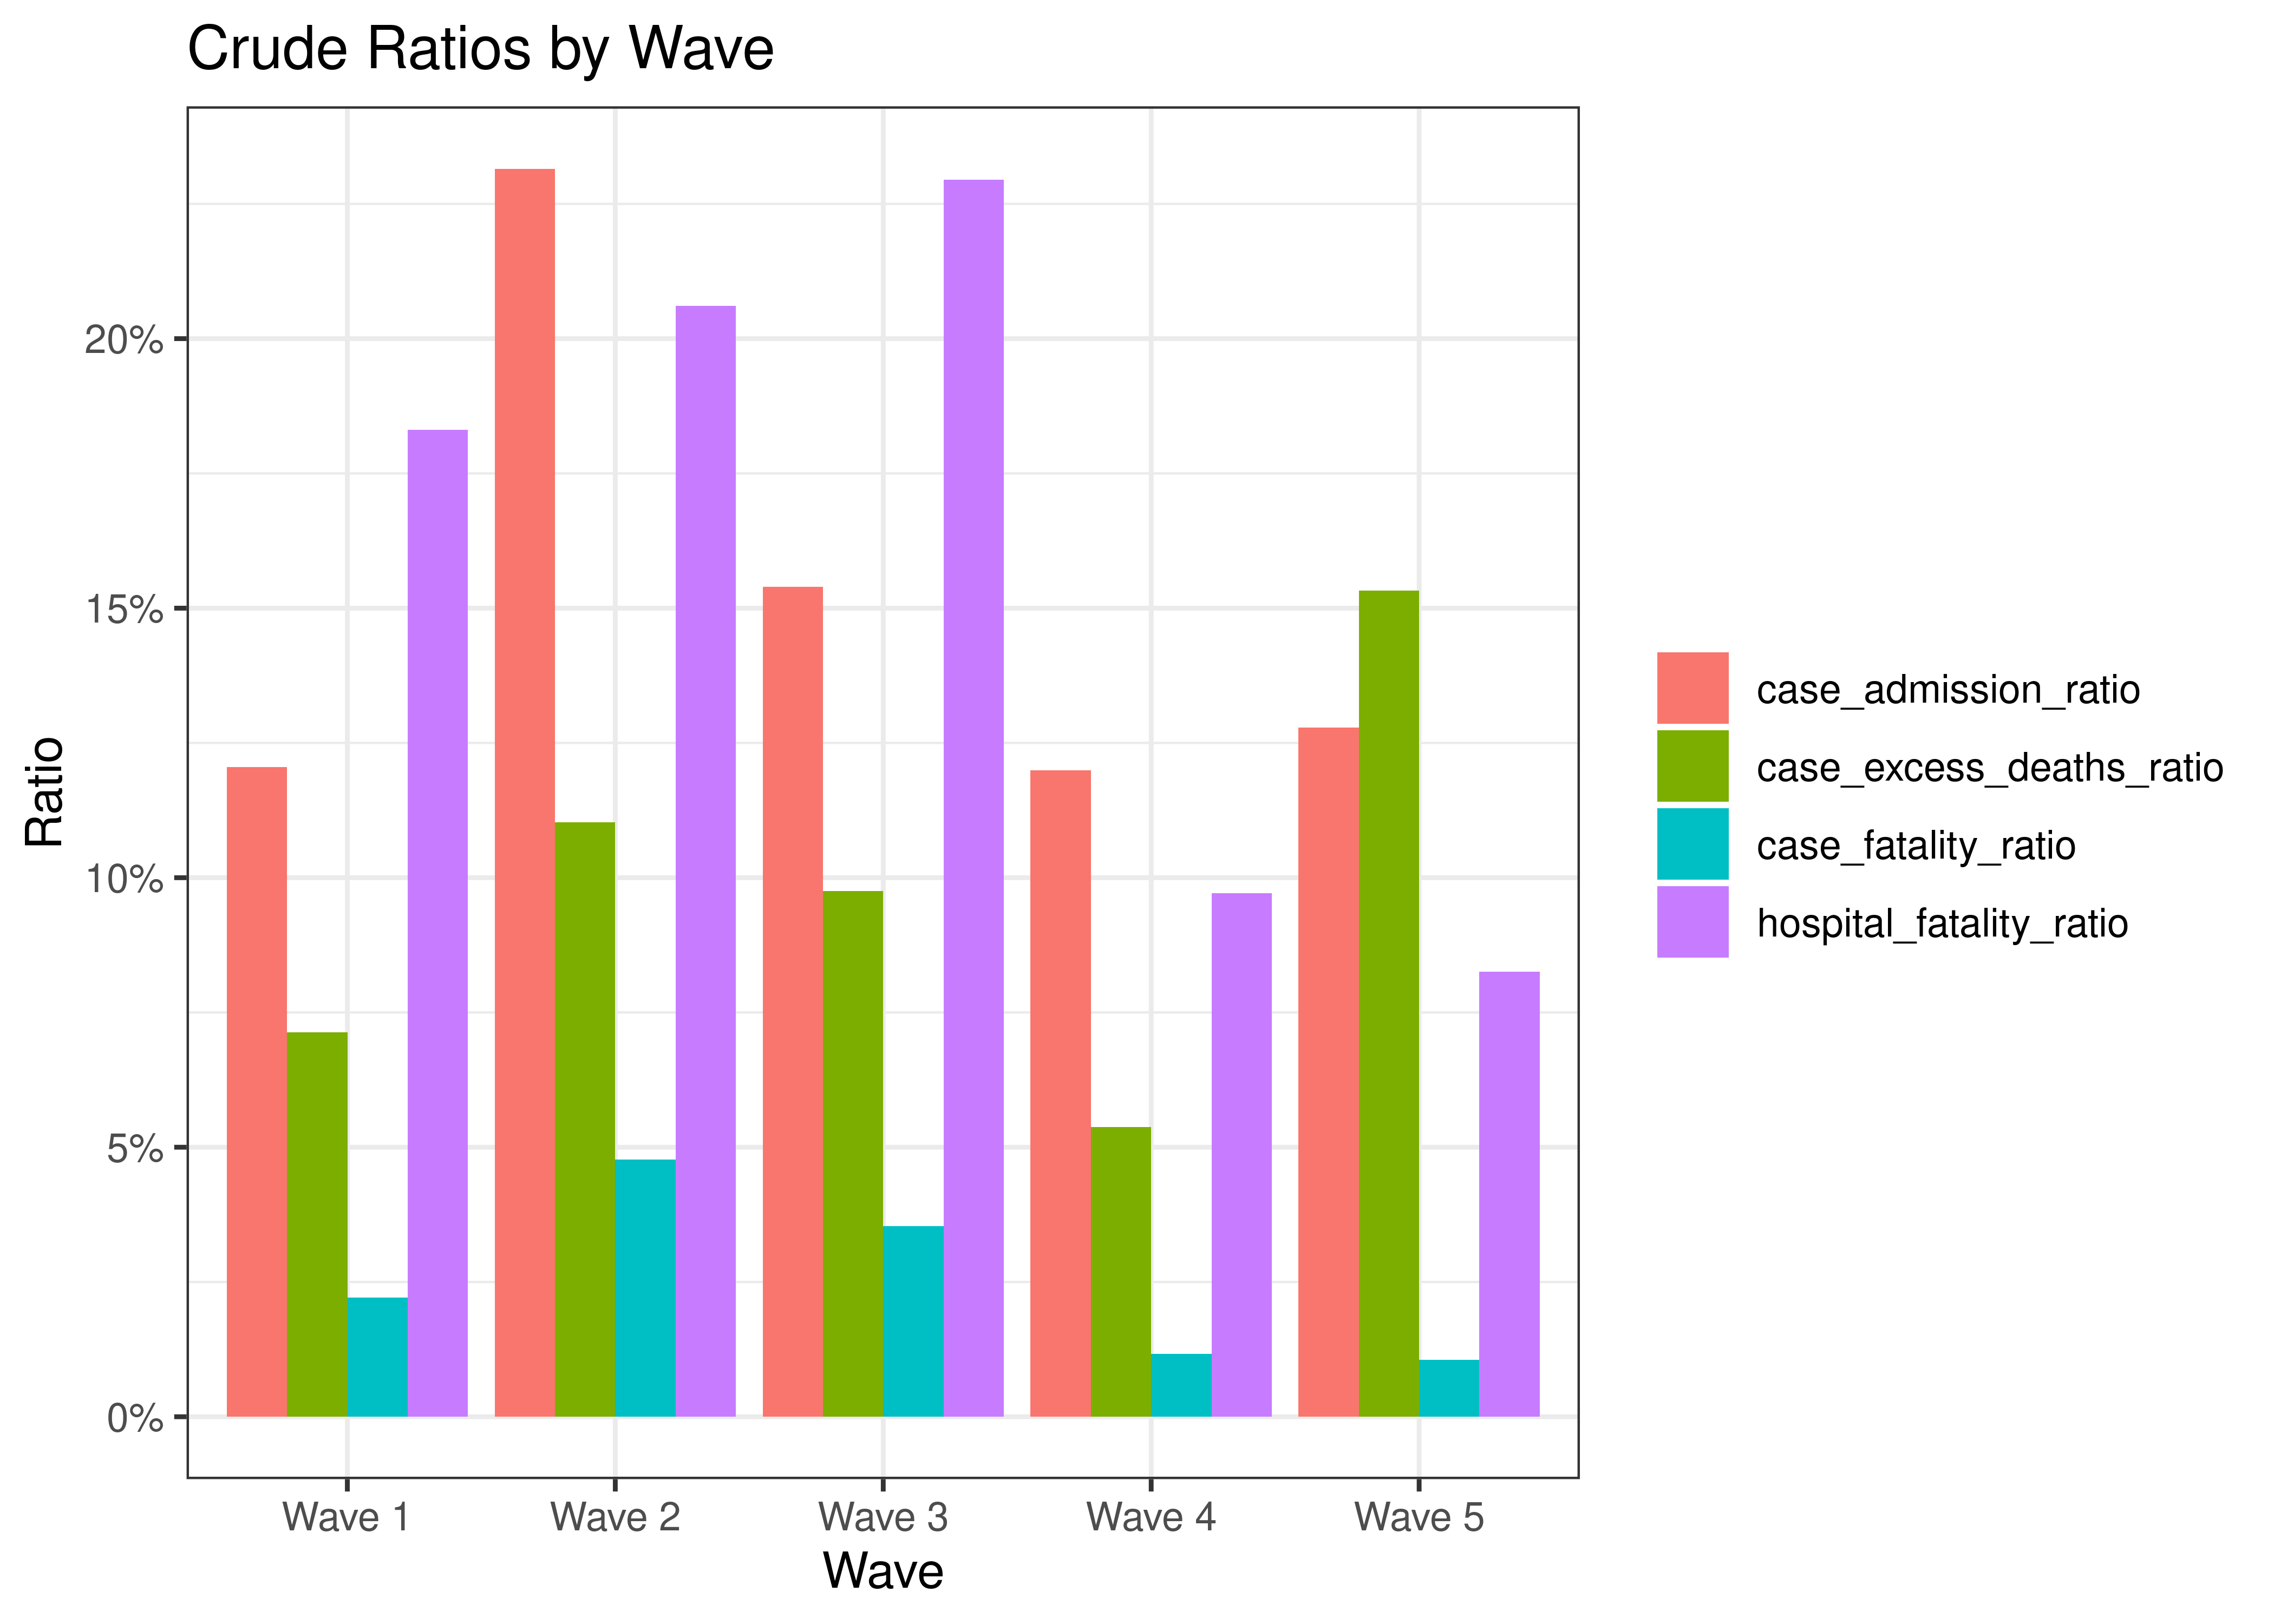
Crude Ratios by Wave
6.3.7 Reproduction Number
Below current (last weekly) effective reproduction number estimates are tabulated for Free State and by district municipality.
| Type | Count (Per Day) | Week Ending | Reproduction Number [95% Confidence Interval] | |
|---|---|---|---|---|
| Free State | cases | 5.1 | 2022-12-25 | 0.79 [0.55 - 1.06] |
| Free State | hospital_admissions | 1.3 | 2022-12-23 | 0.84 [0.41 - 1.46] |
| District Municipality | Type | Count (Per Day) | Week Ending | Reproduction Number [95% Confidence Interval] |
|---|---|---|---|---|
| Fezile Dabi | cases | 0.3 | 2022-12-25 | 0.75 [0.15 - 1.82] |
| Lejweleputswa | cases | 1.3 | 2022-12-25 | 2.17 [1.03 - 3.74] |
| Mangaung Metro | cases | 2.4 | 2022-12-25 | 0.68 [0.40 - 1.03] |
| Thabo Mofutsanyane | cases | 1.1 | 2022-12-25 | 0.79 [0.36 - 1.39] |
| Xhariep | cases | 0.0 | 2022-12-25 | 0.83 [0.02 - 3.10] |
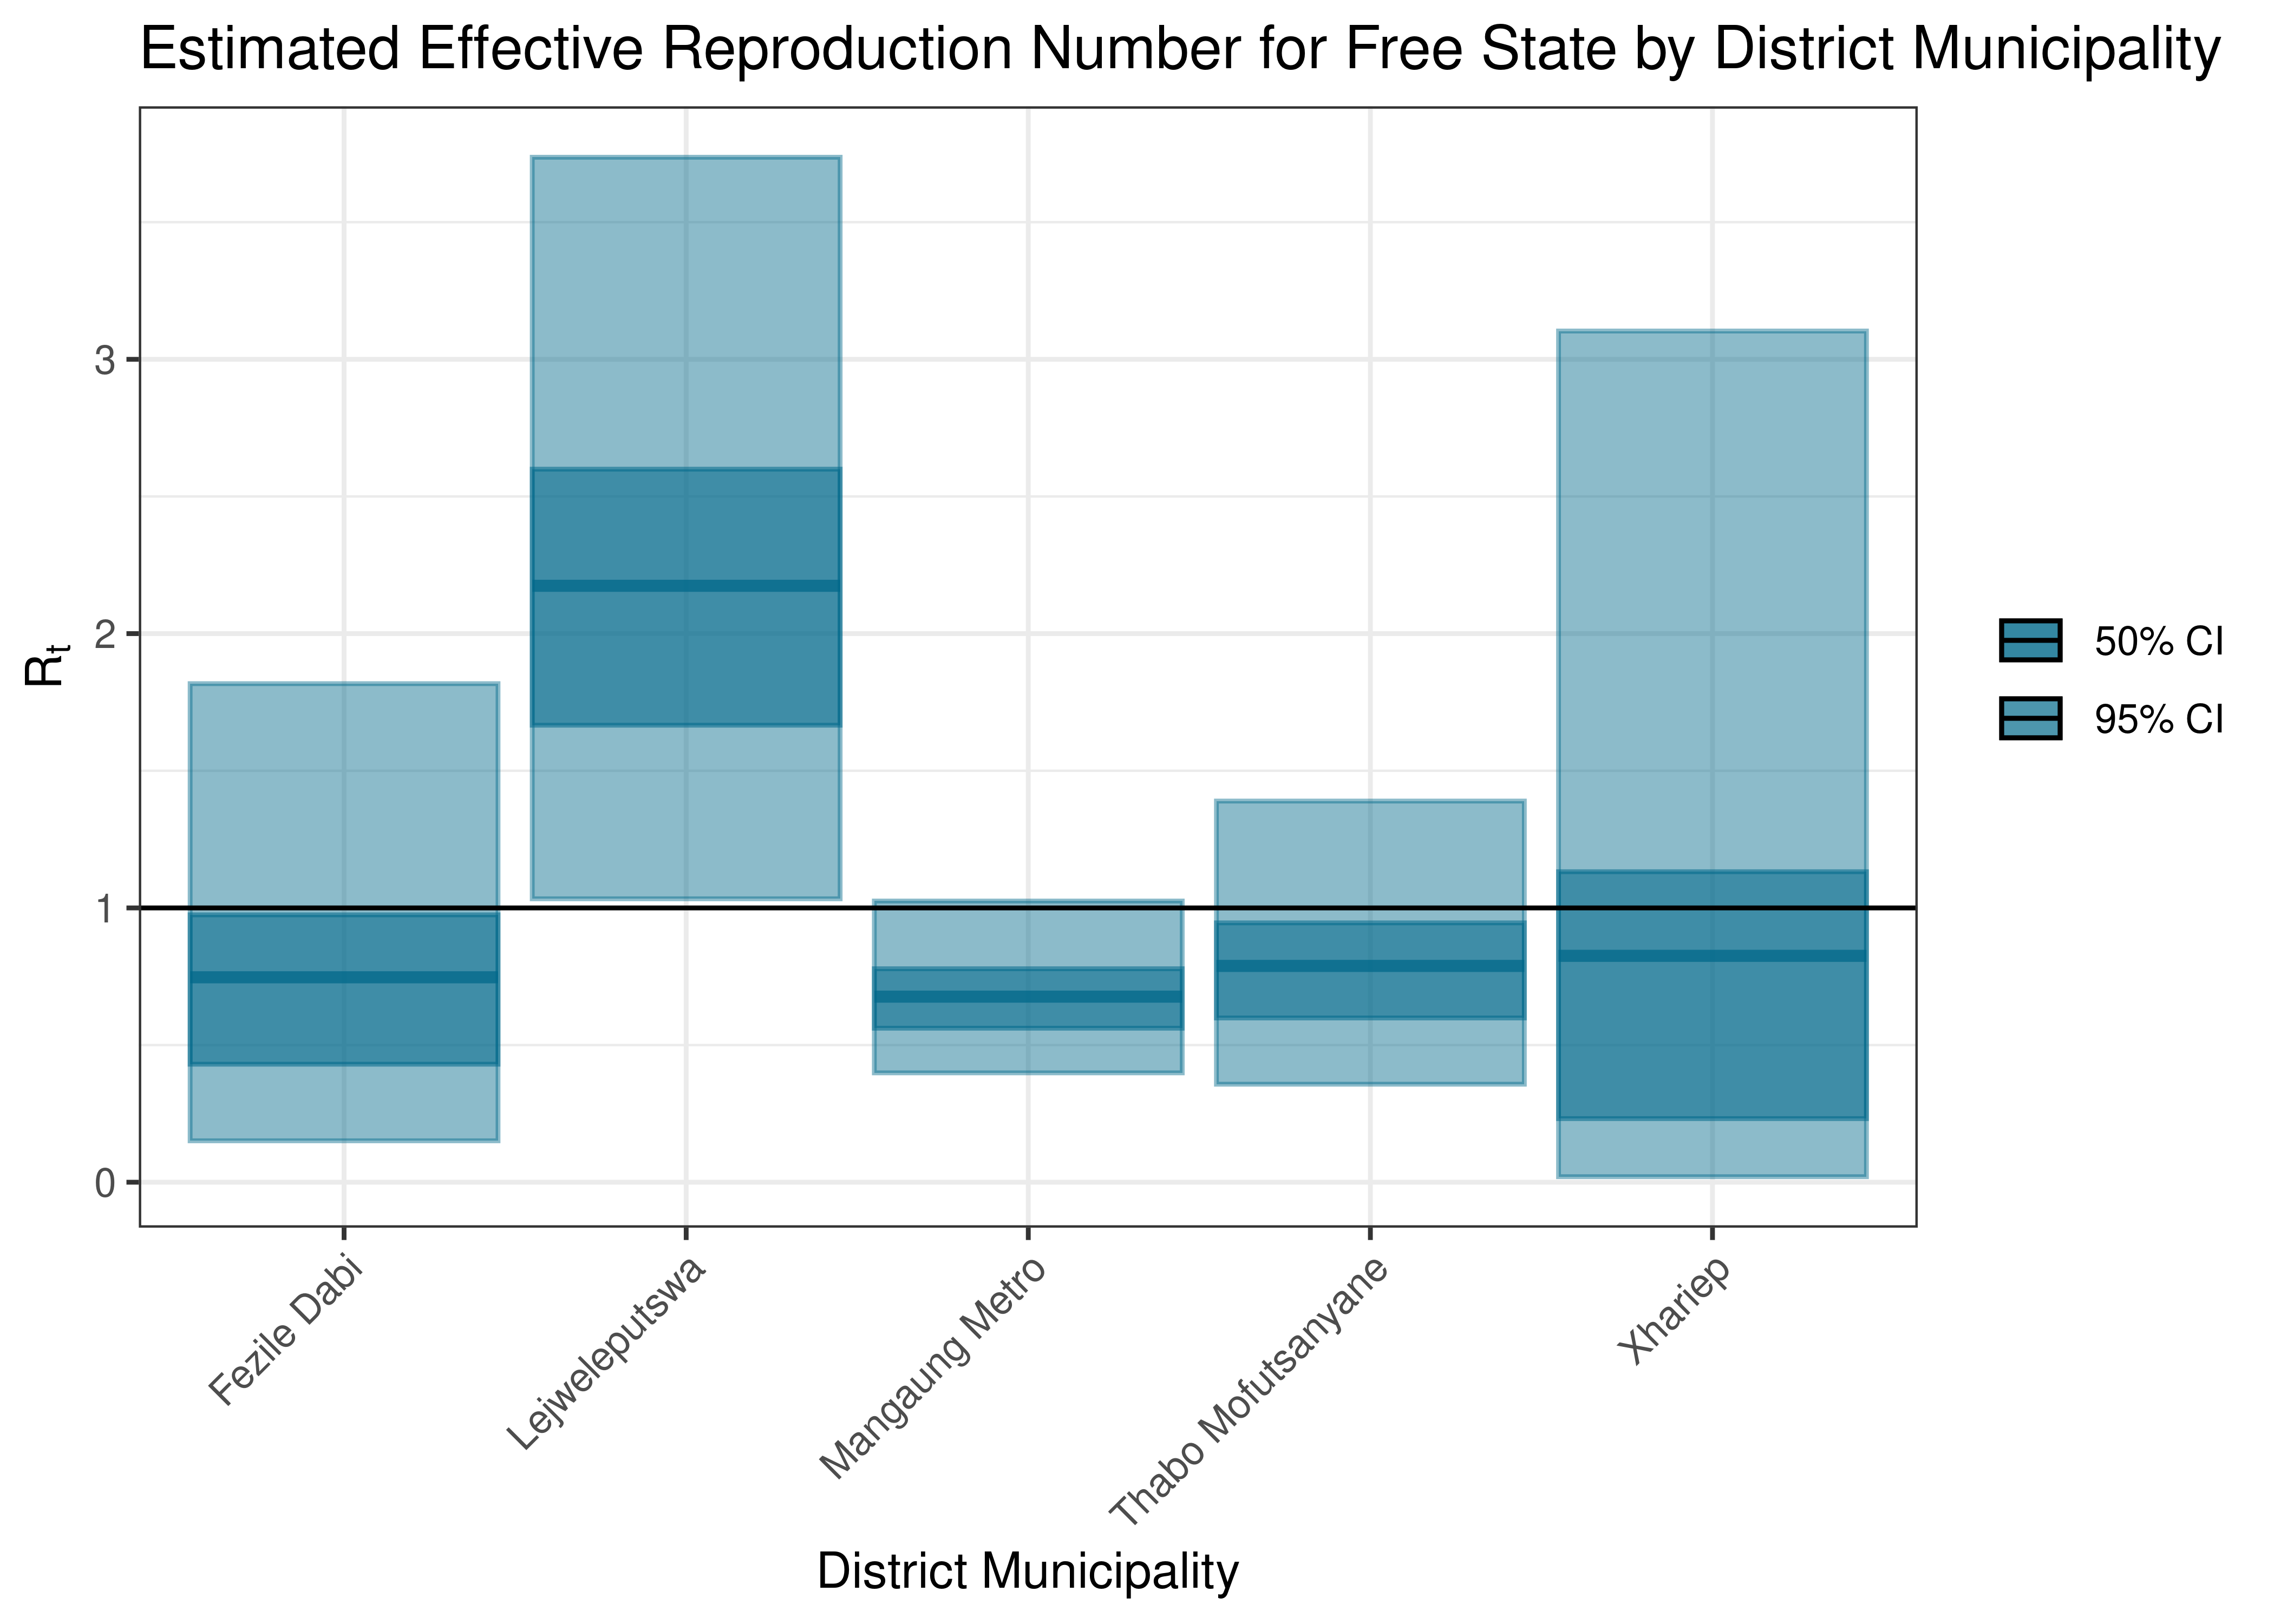
Estimated Effective Reproduction Number for Free State by District Municipality
Below the effective reproduction number for Free State over the last 90 days are plotted together with a plot since start of the pandemic.
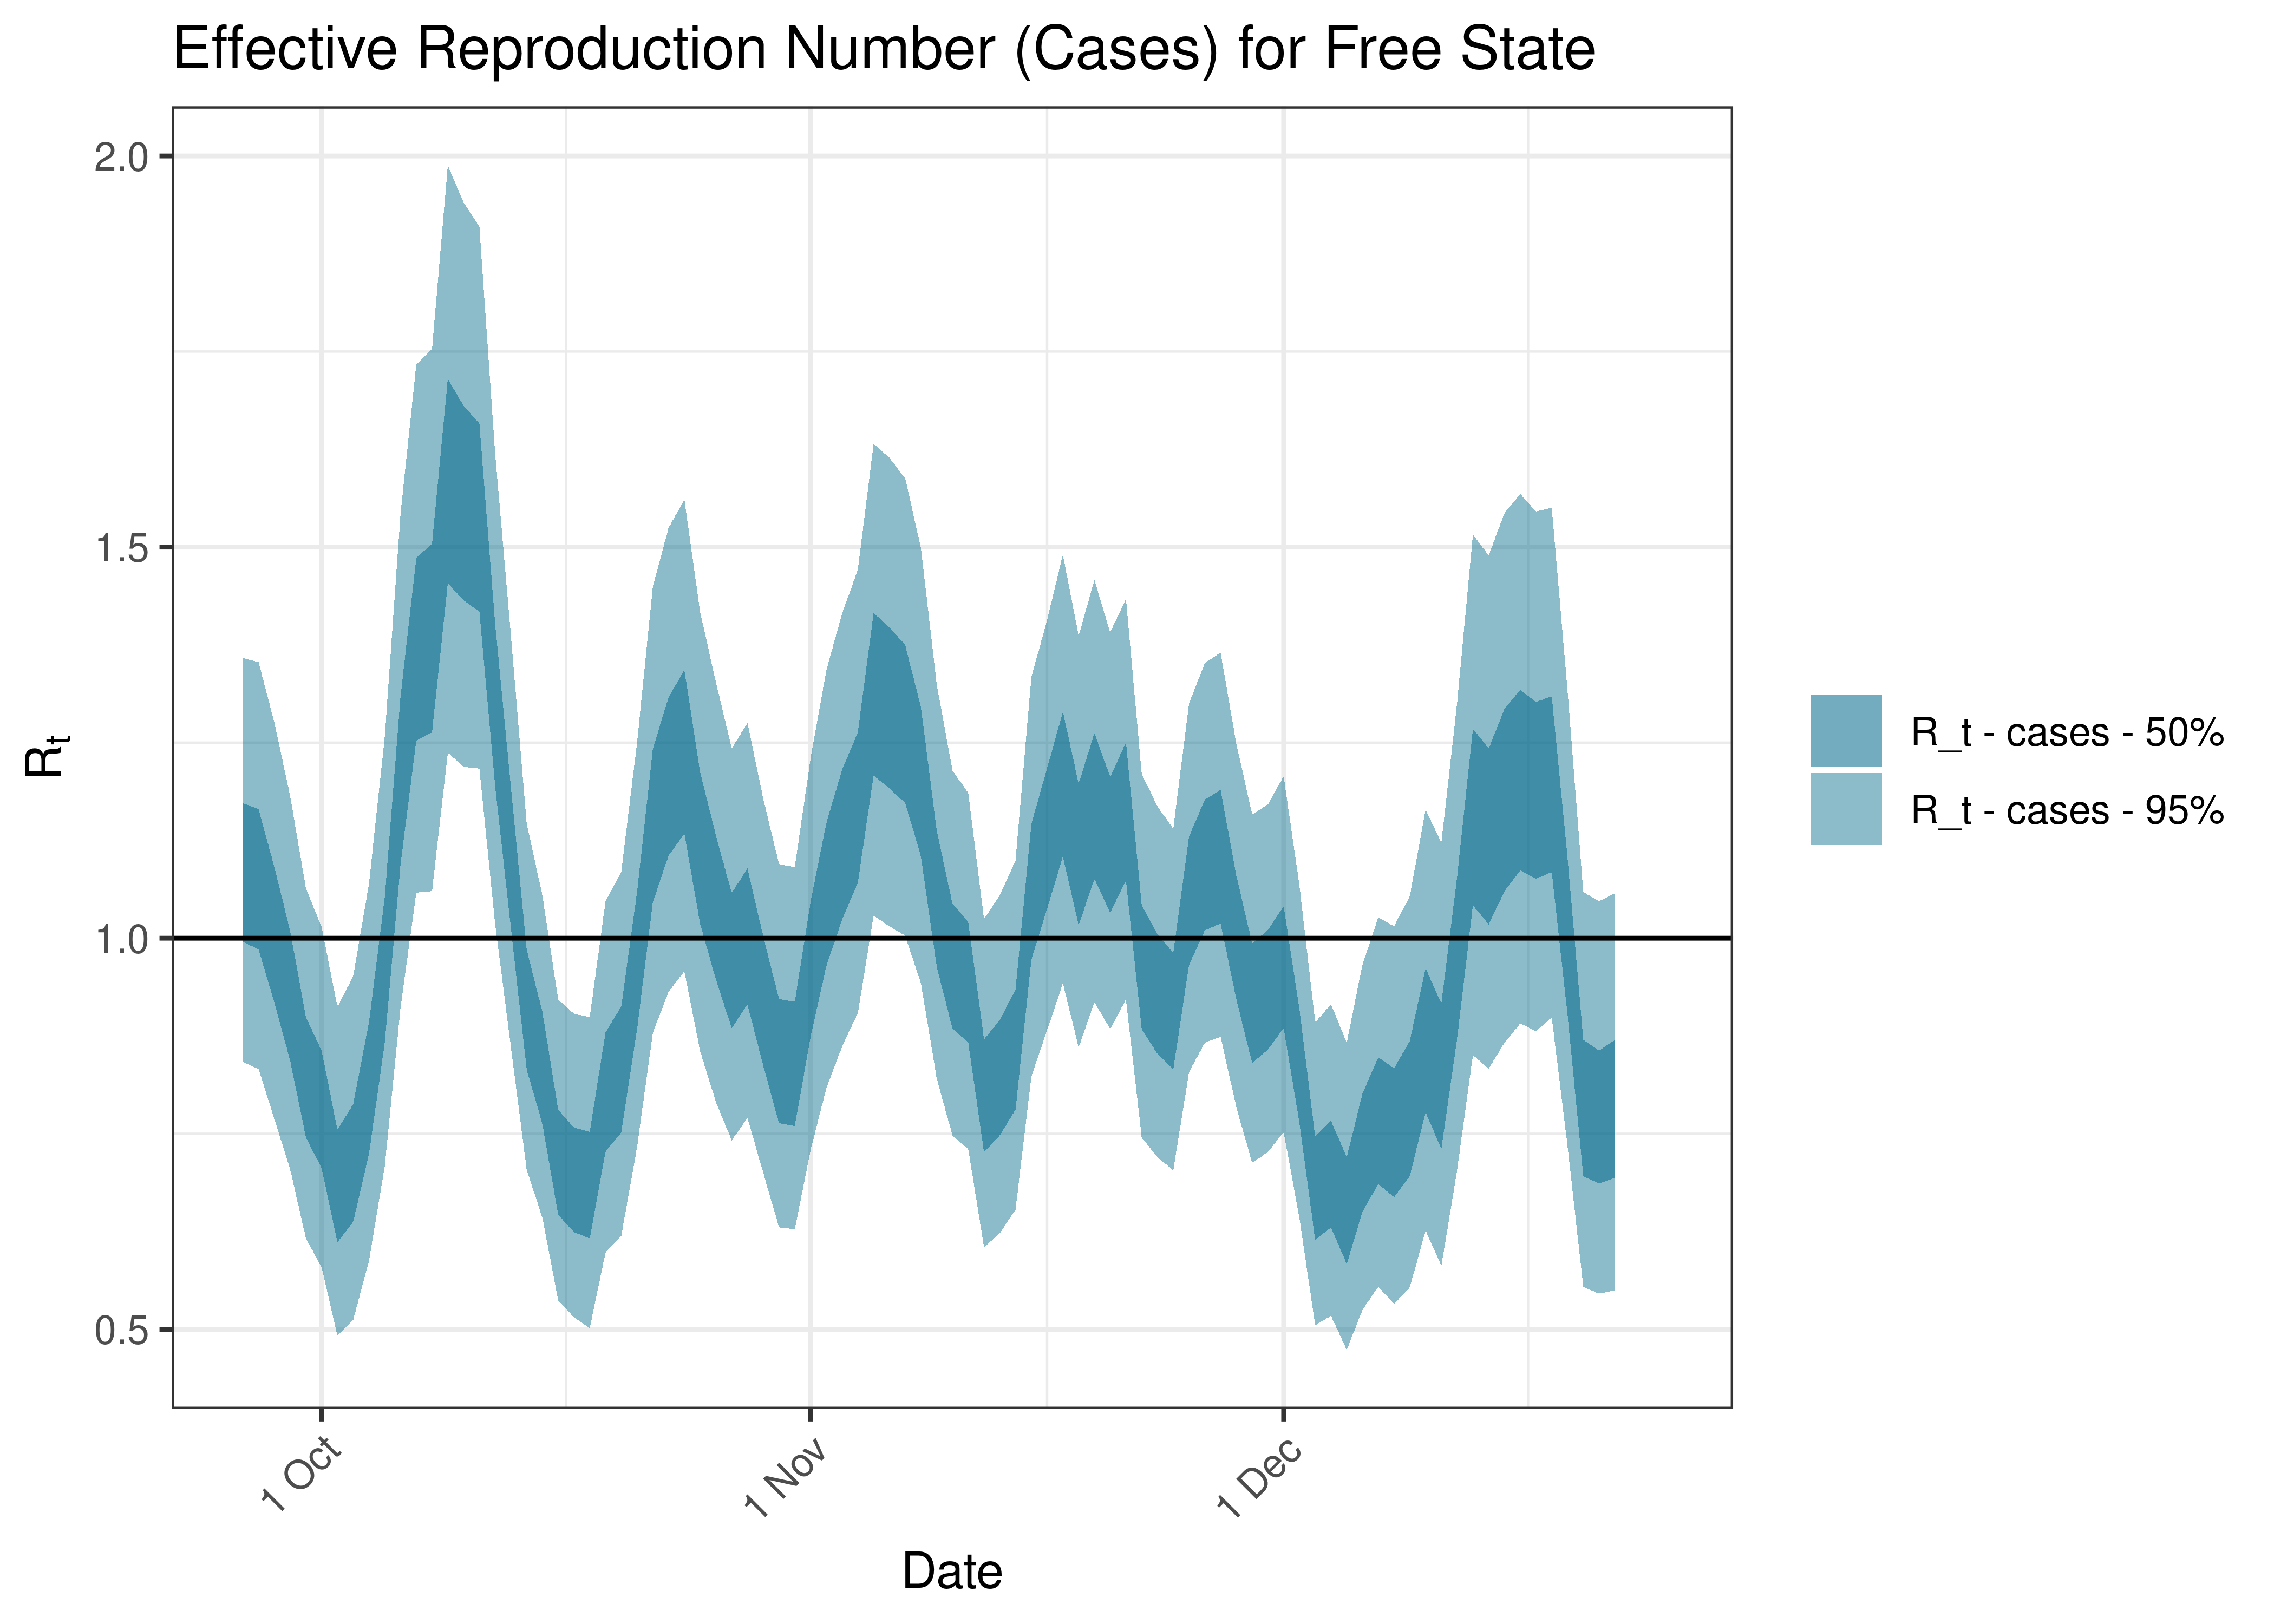
Estimated Effective Reproduction Number Based on Cases for Free State over last 90 days
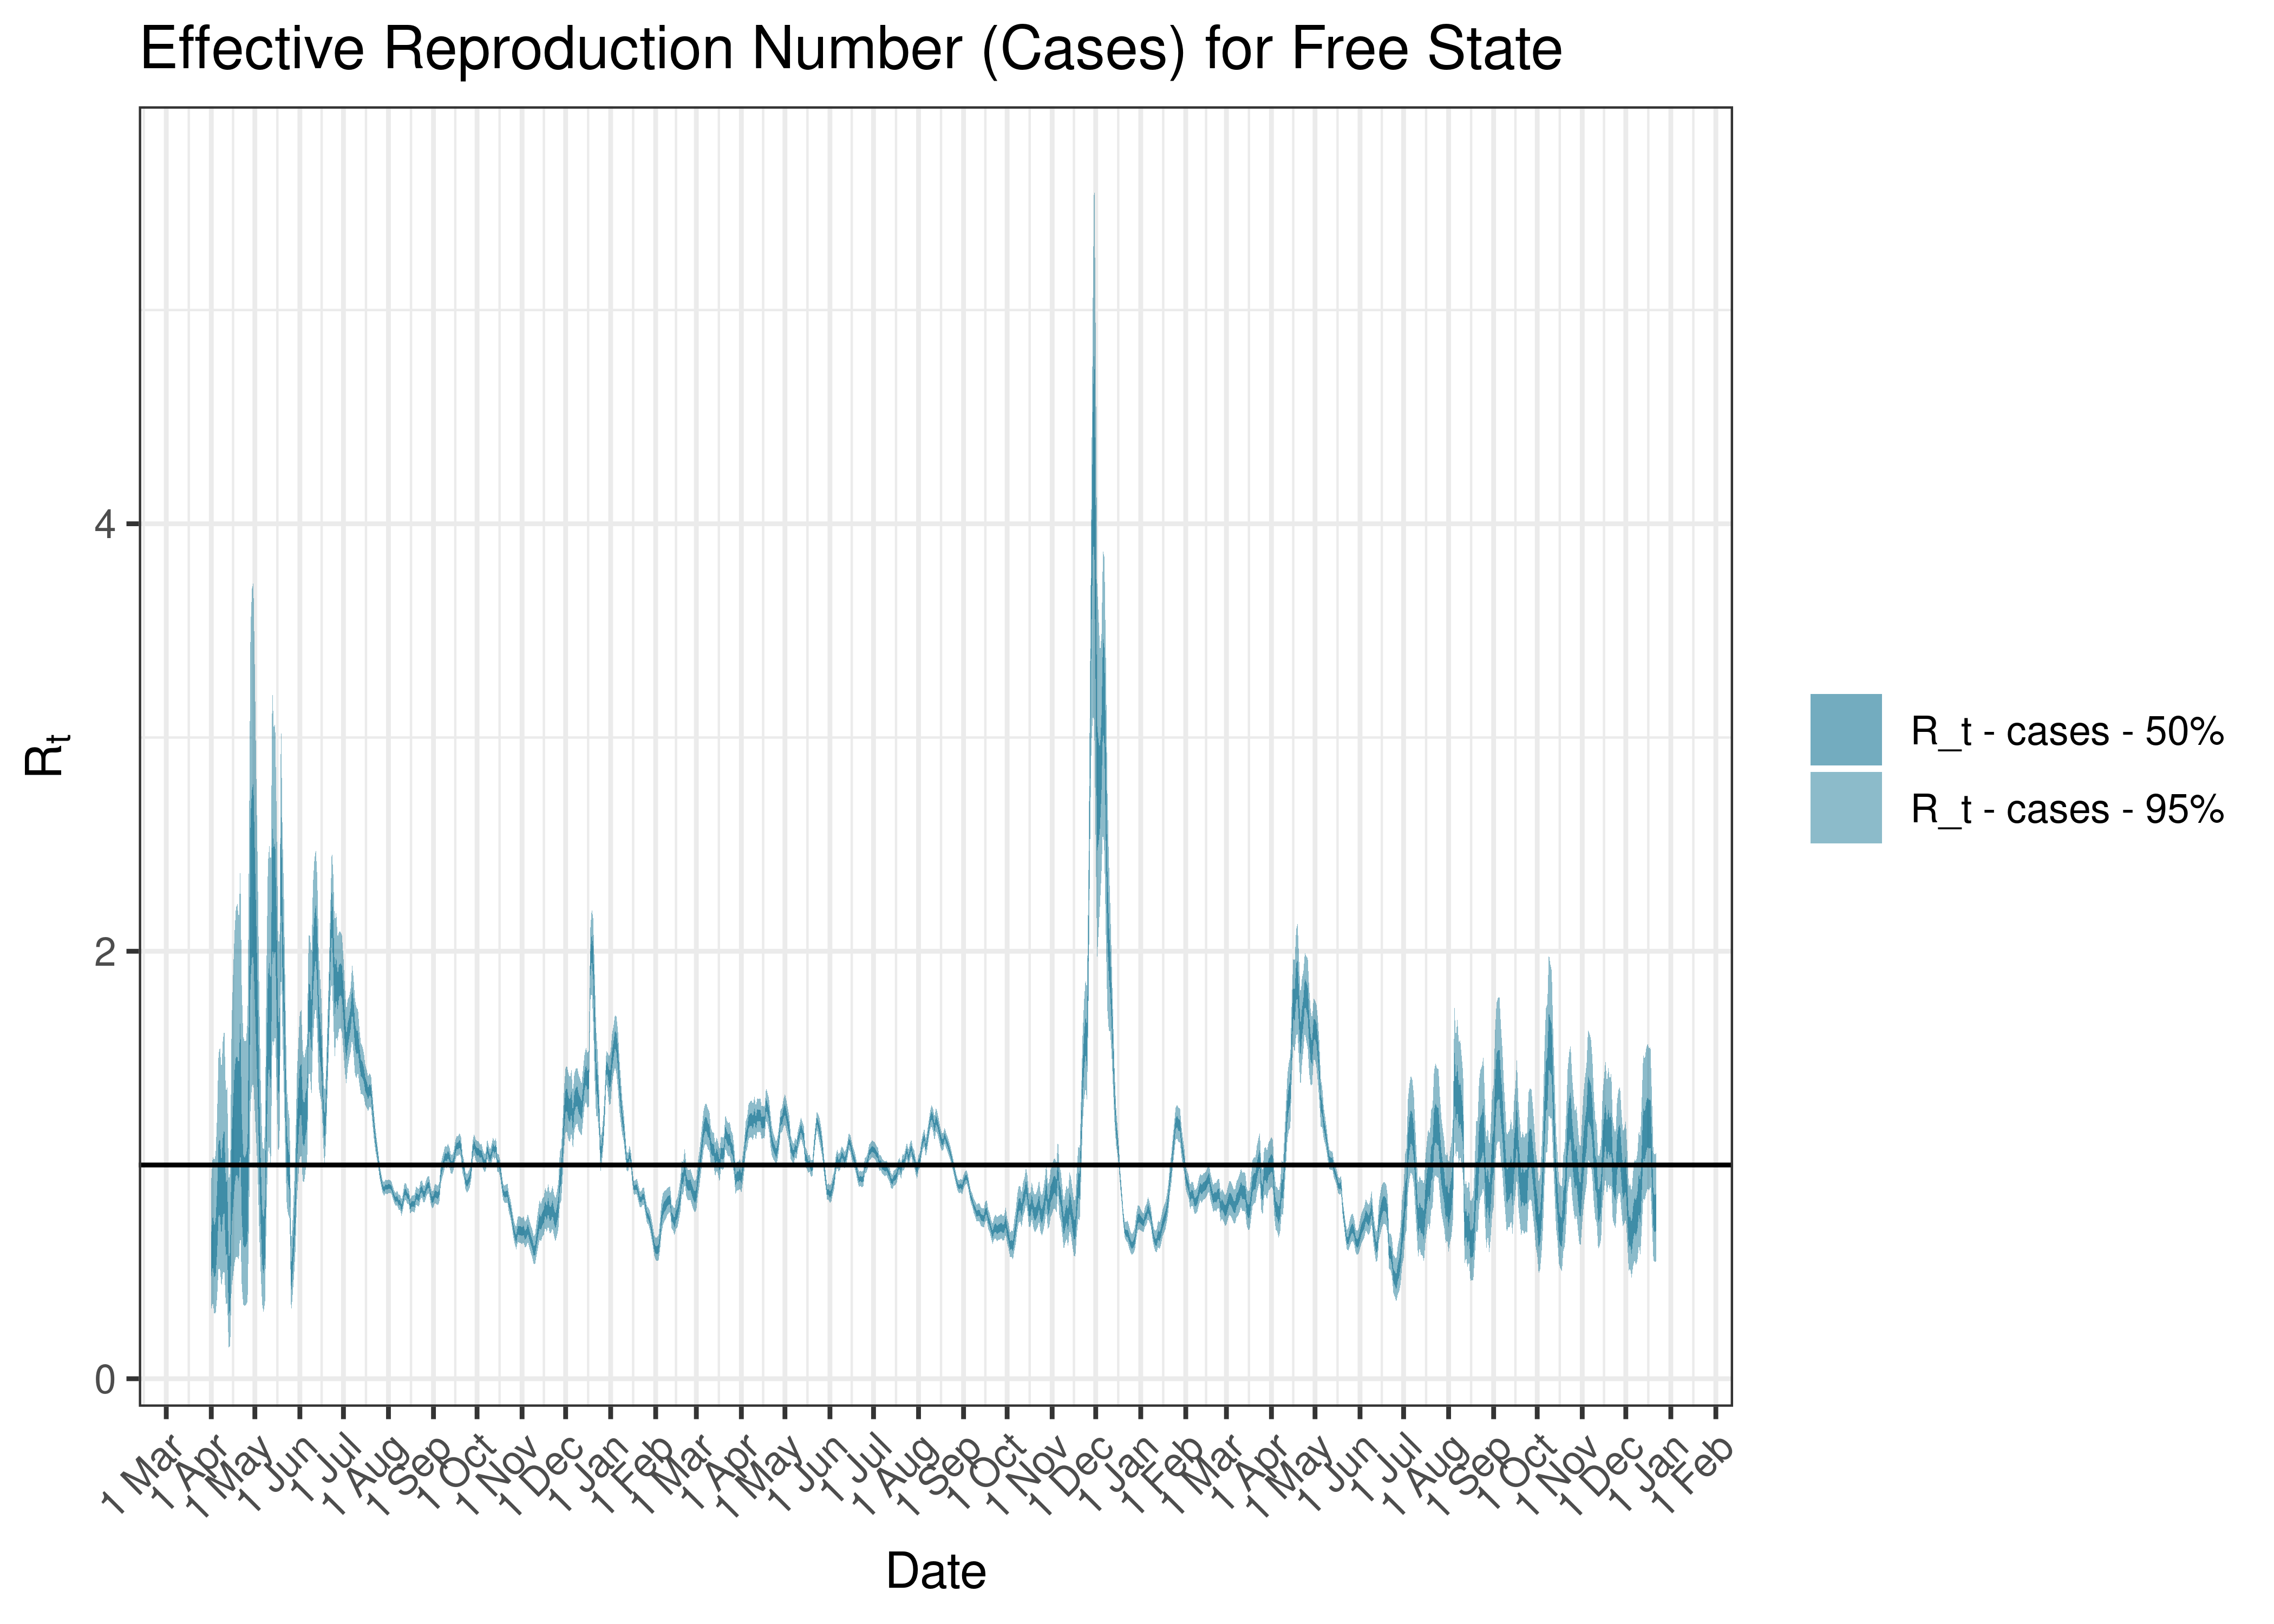
Estimated Effective Reproduction Number Based on Cases for Free State since 1 April 2020
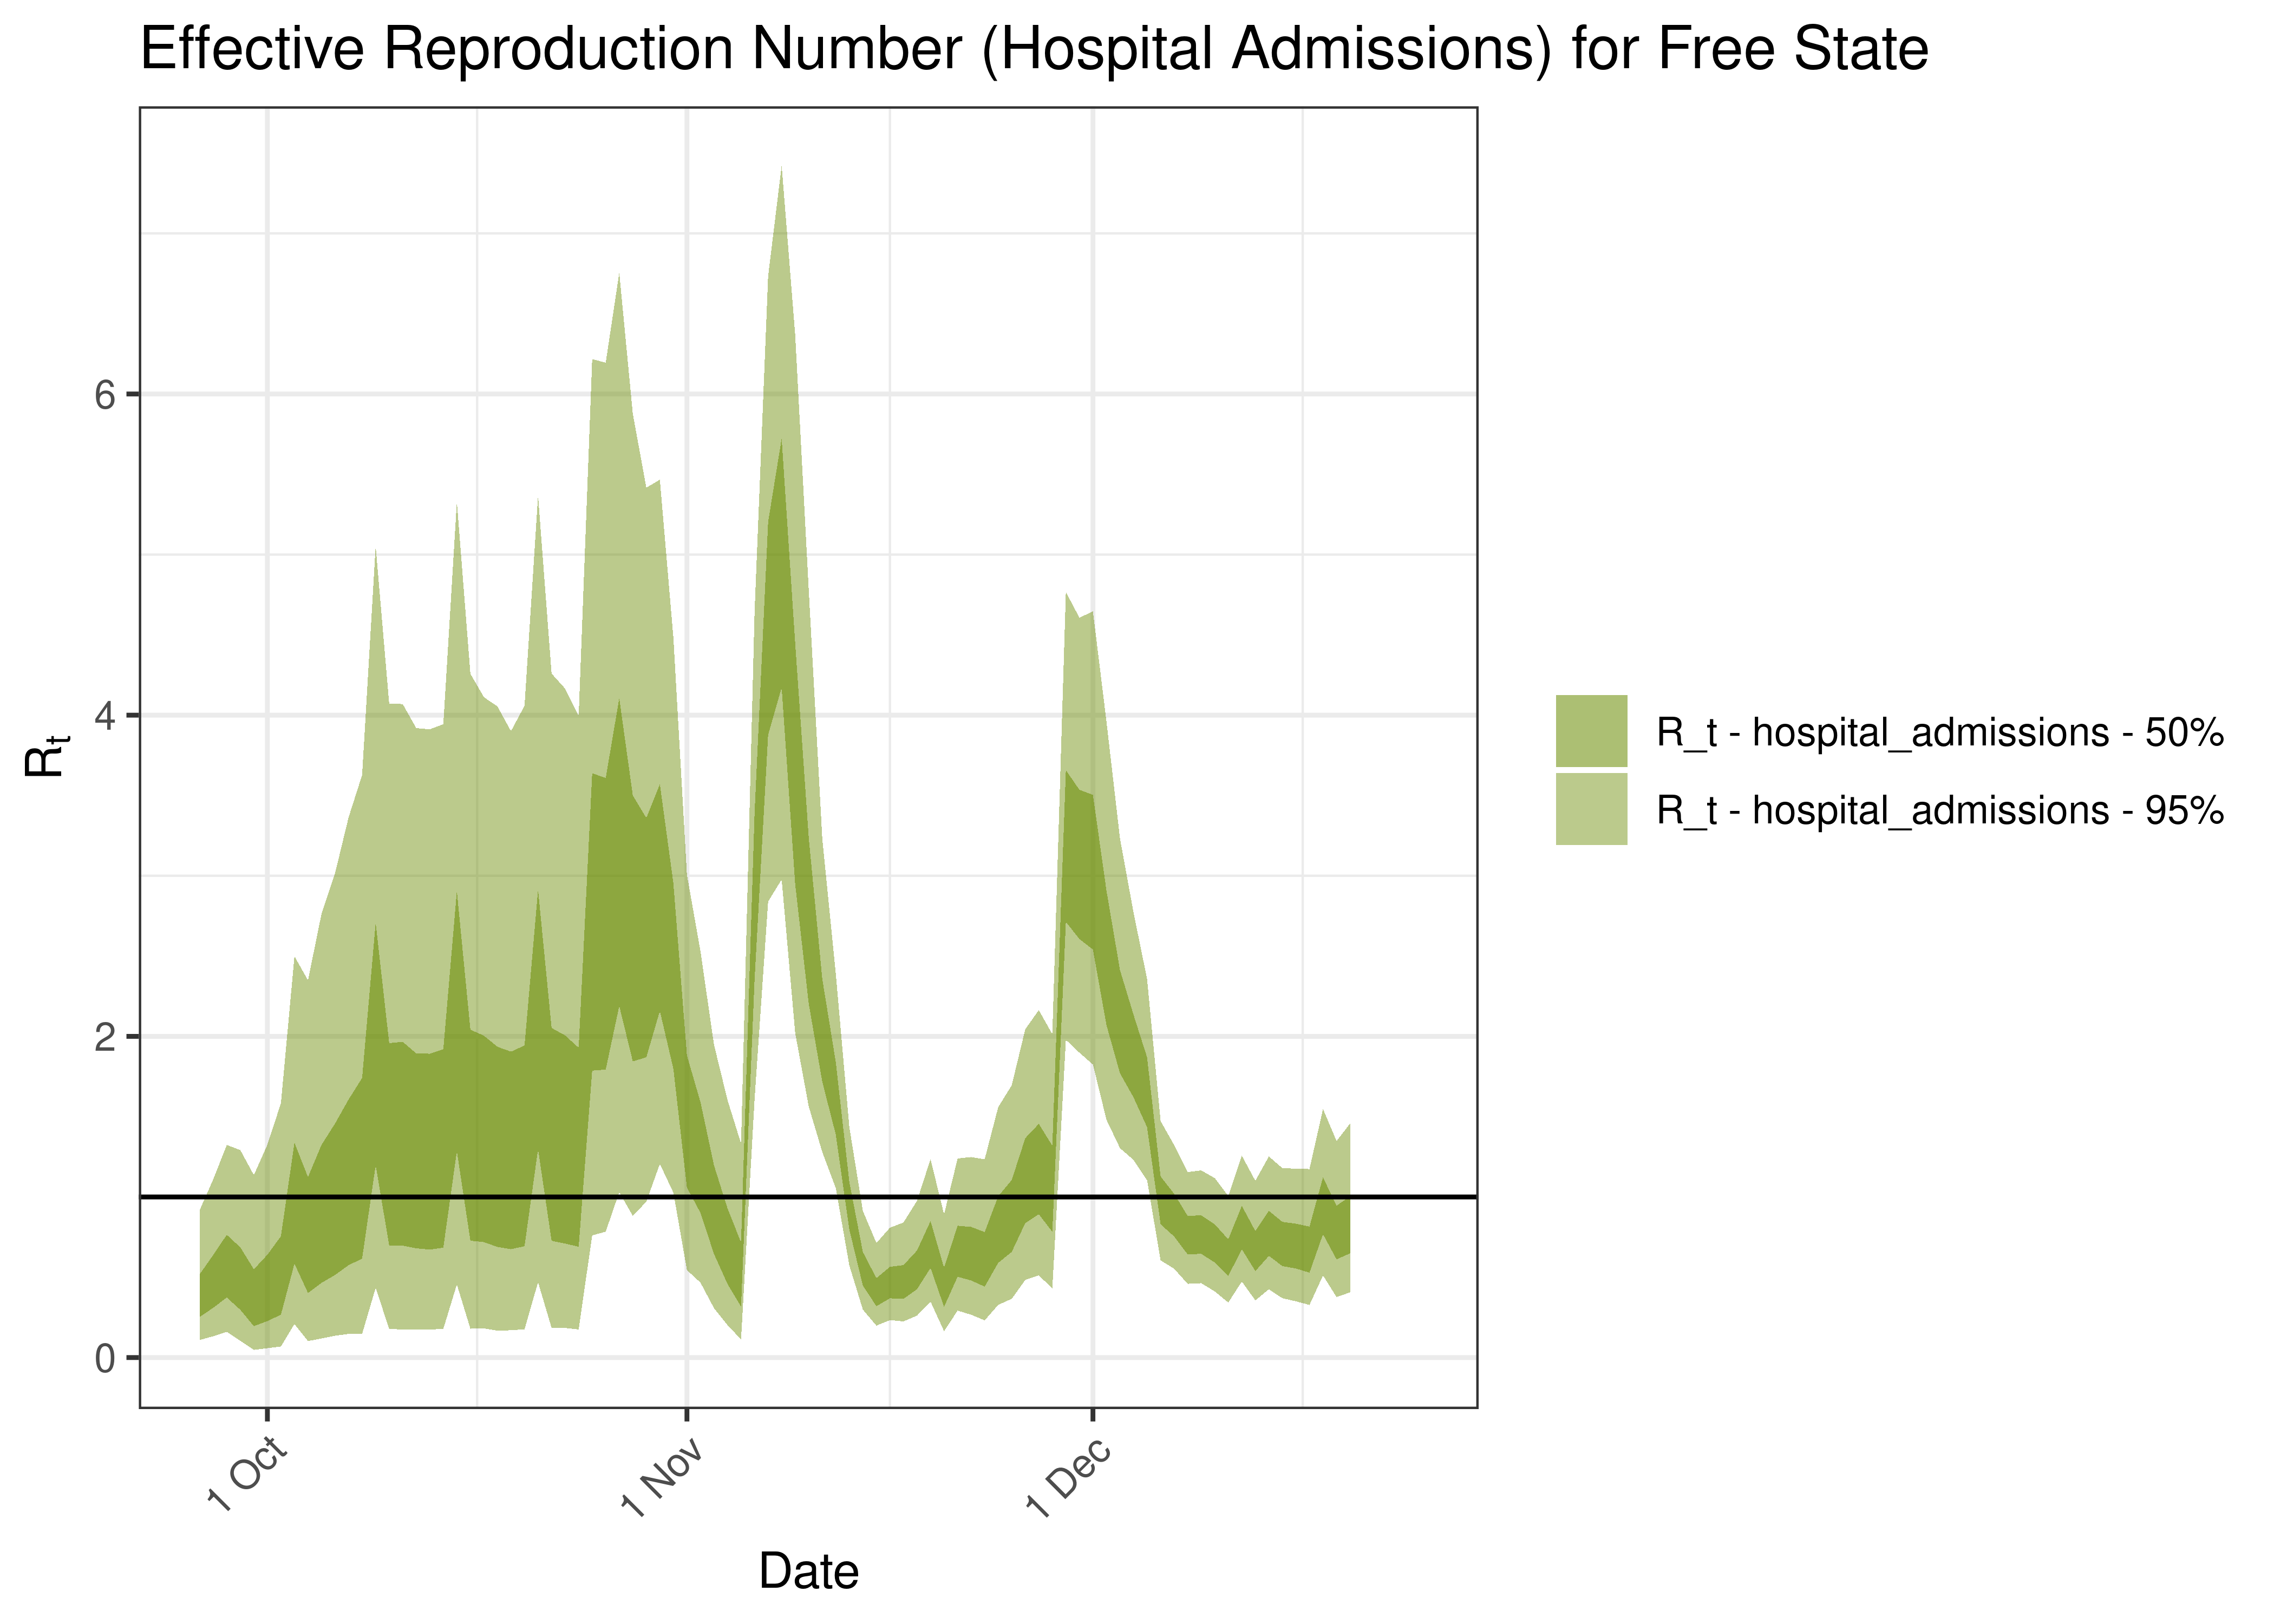
Estimated Effective Reproduction Number Based on Hospital Admissions for Free State over last 90 days
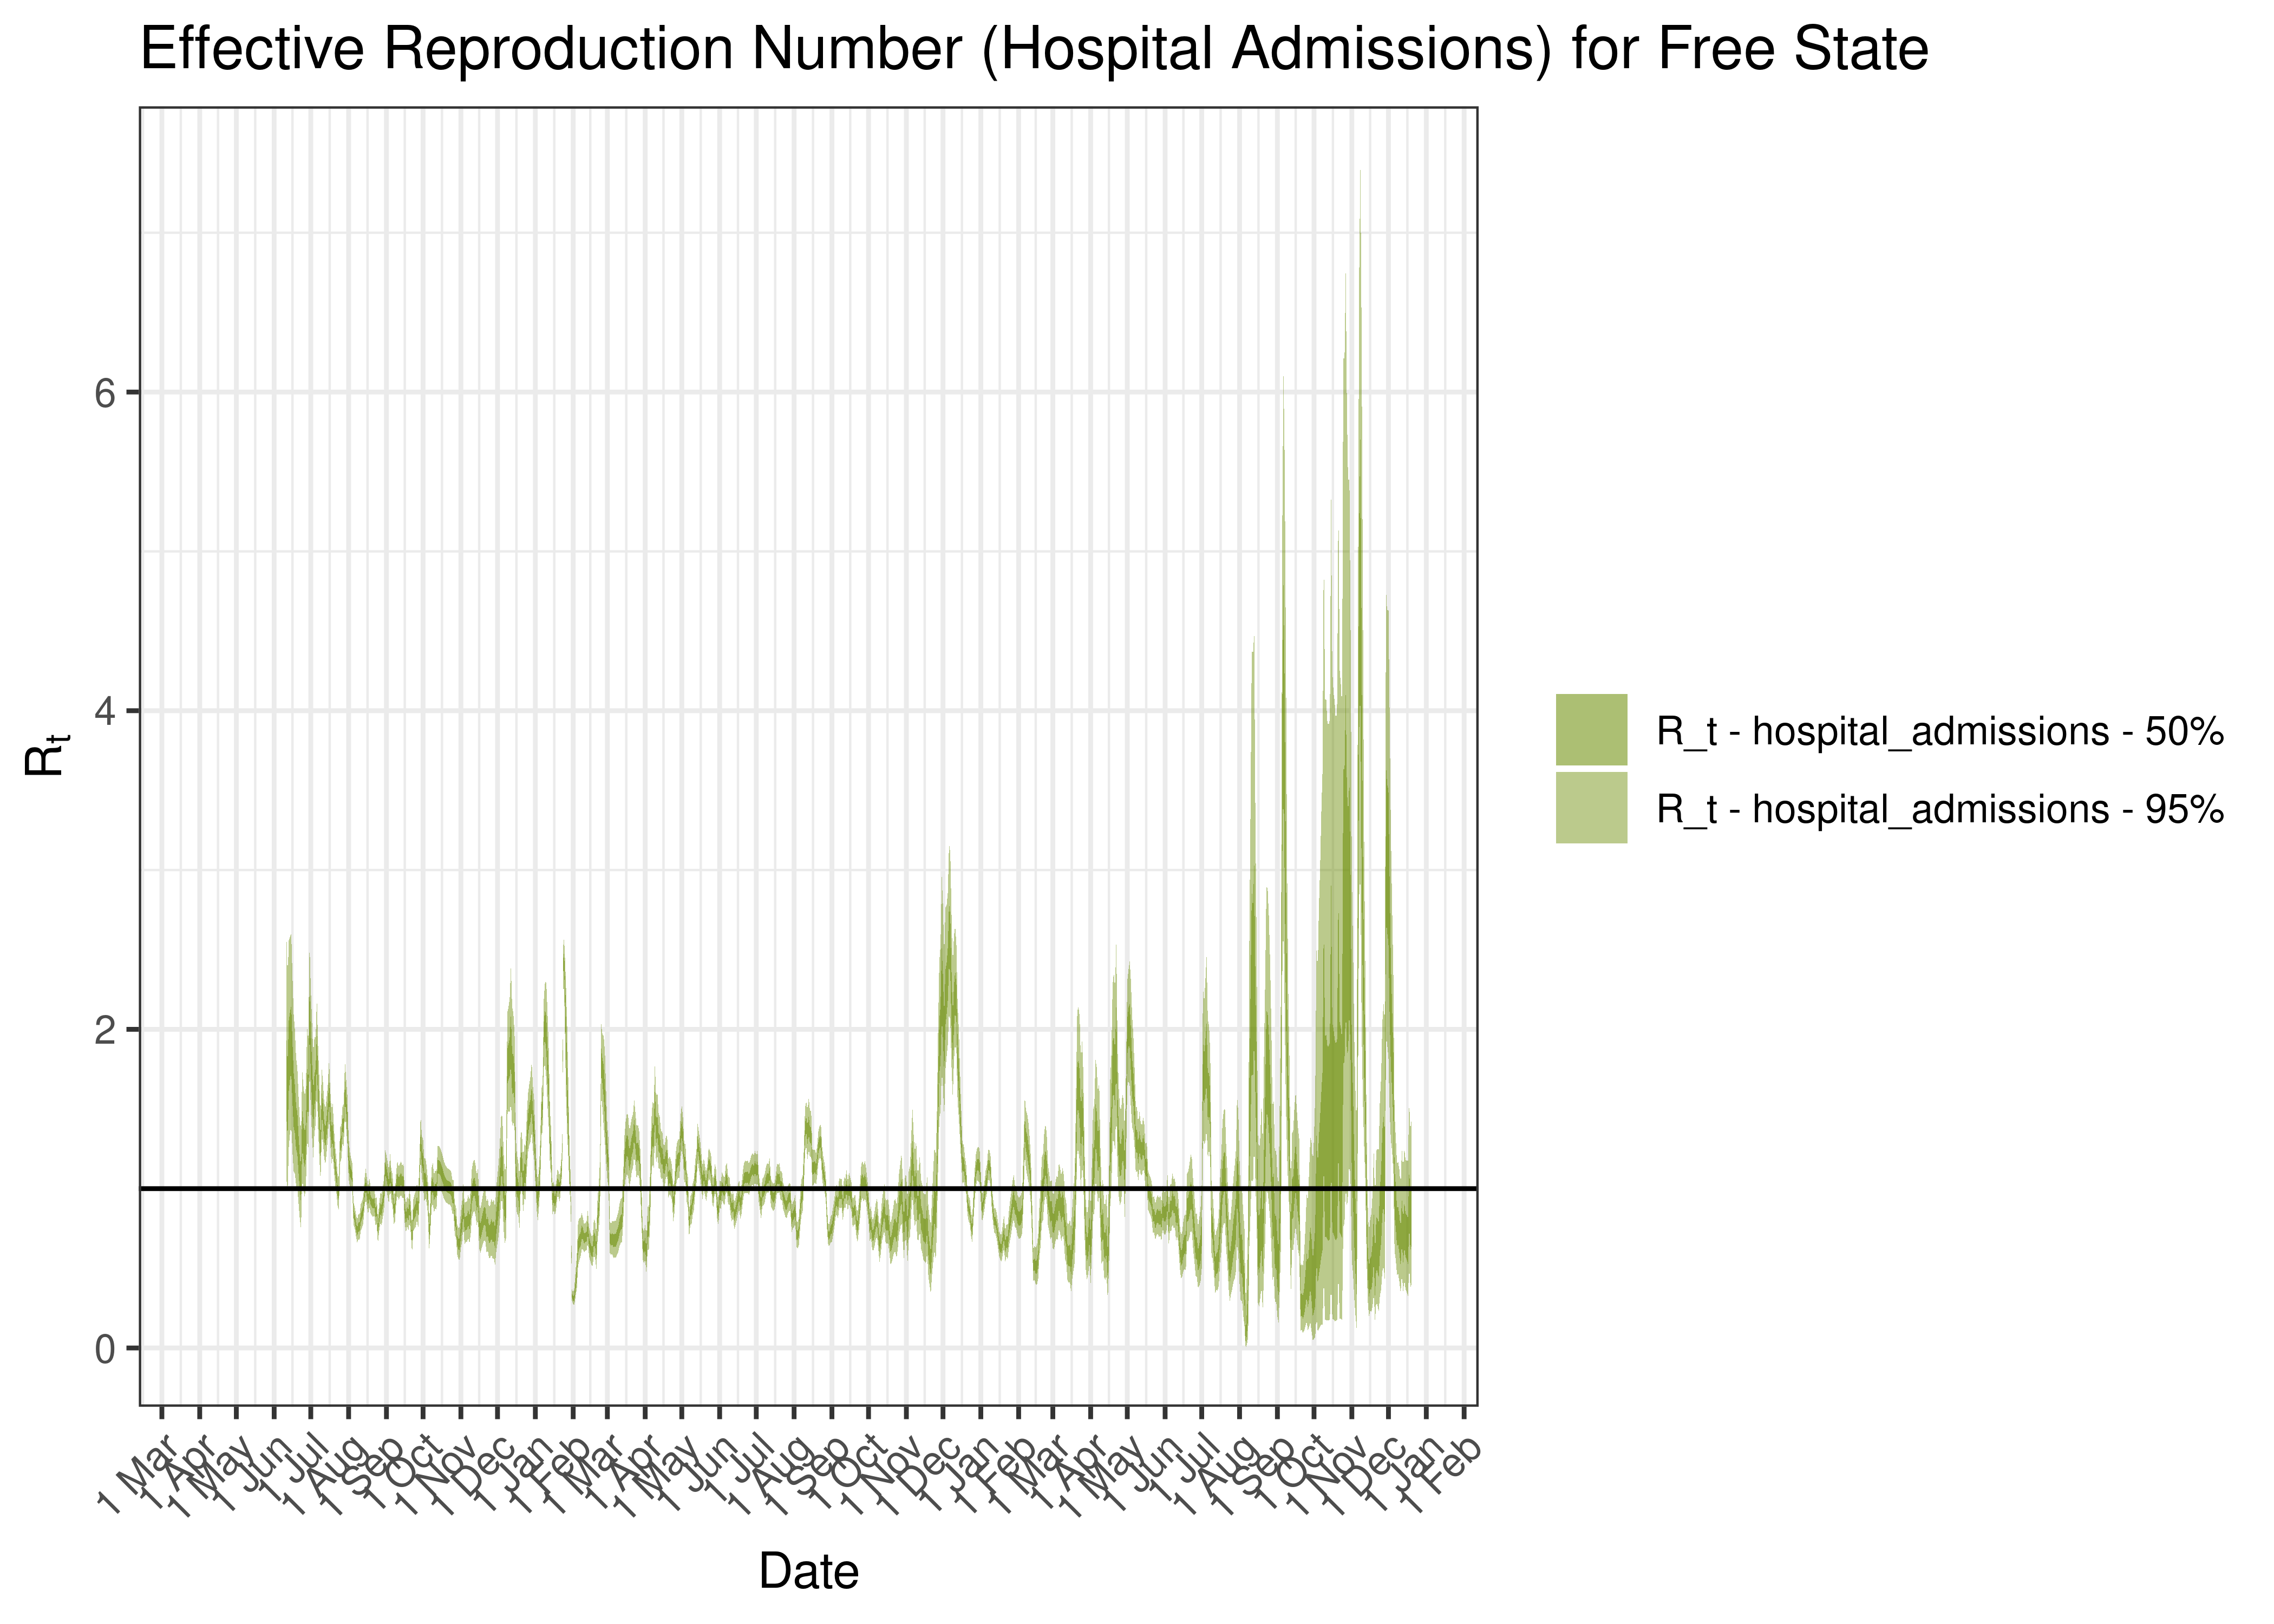
Estimated Effective Reproduction Number Based on Hospital Admissions for Free State since 1 April 2020
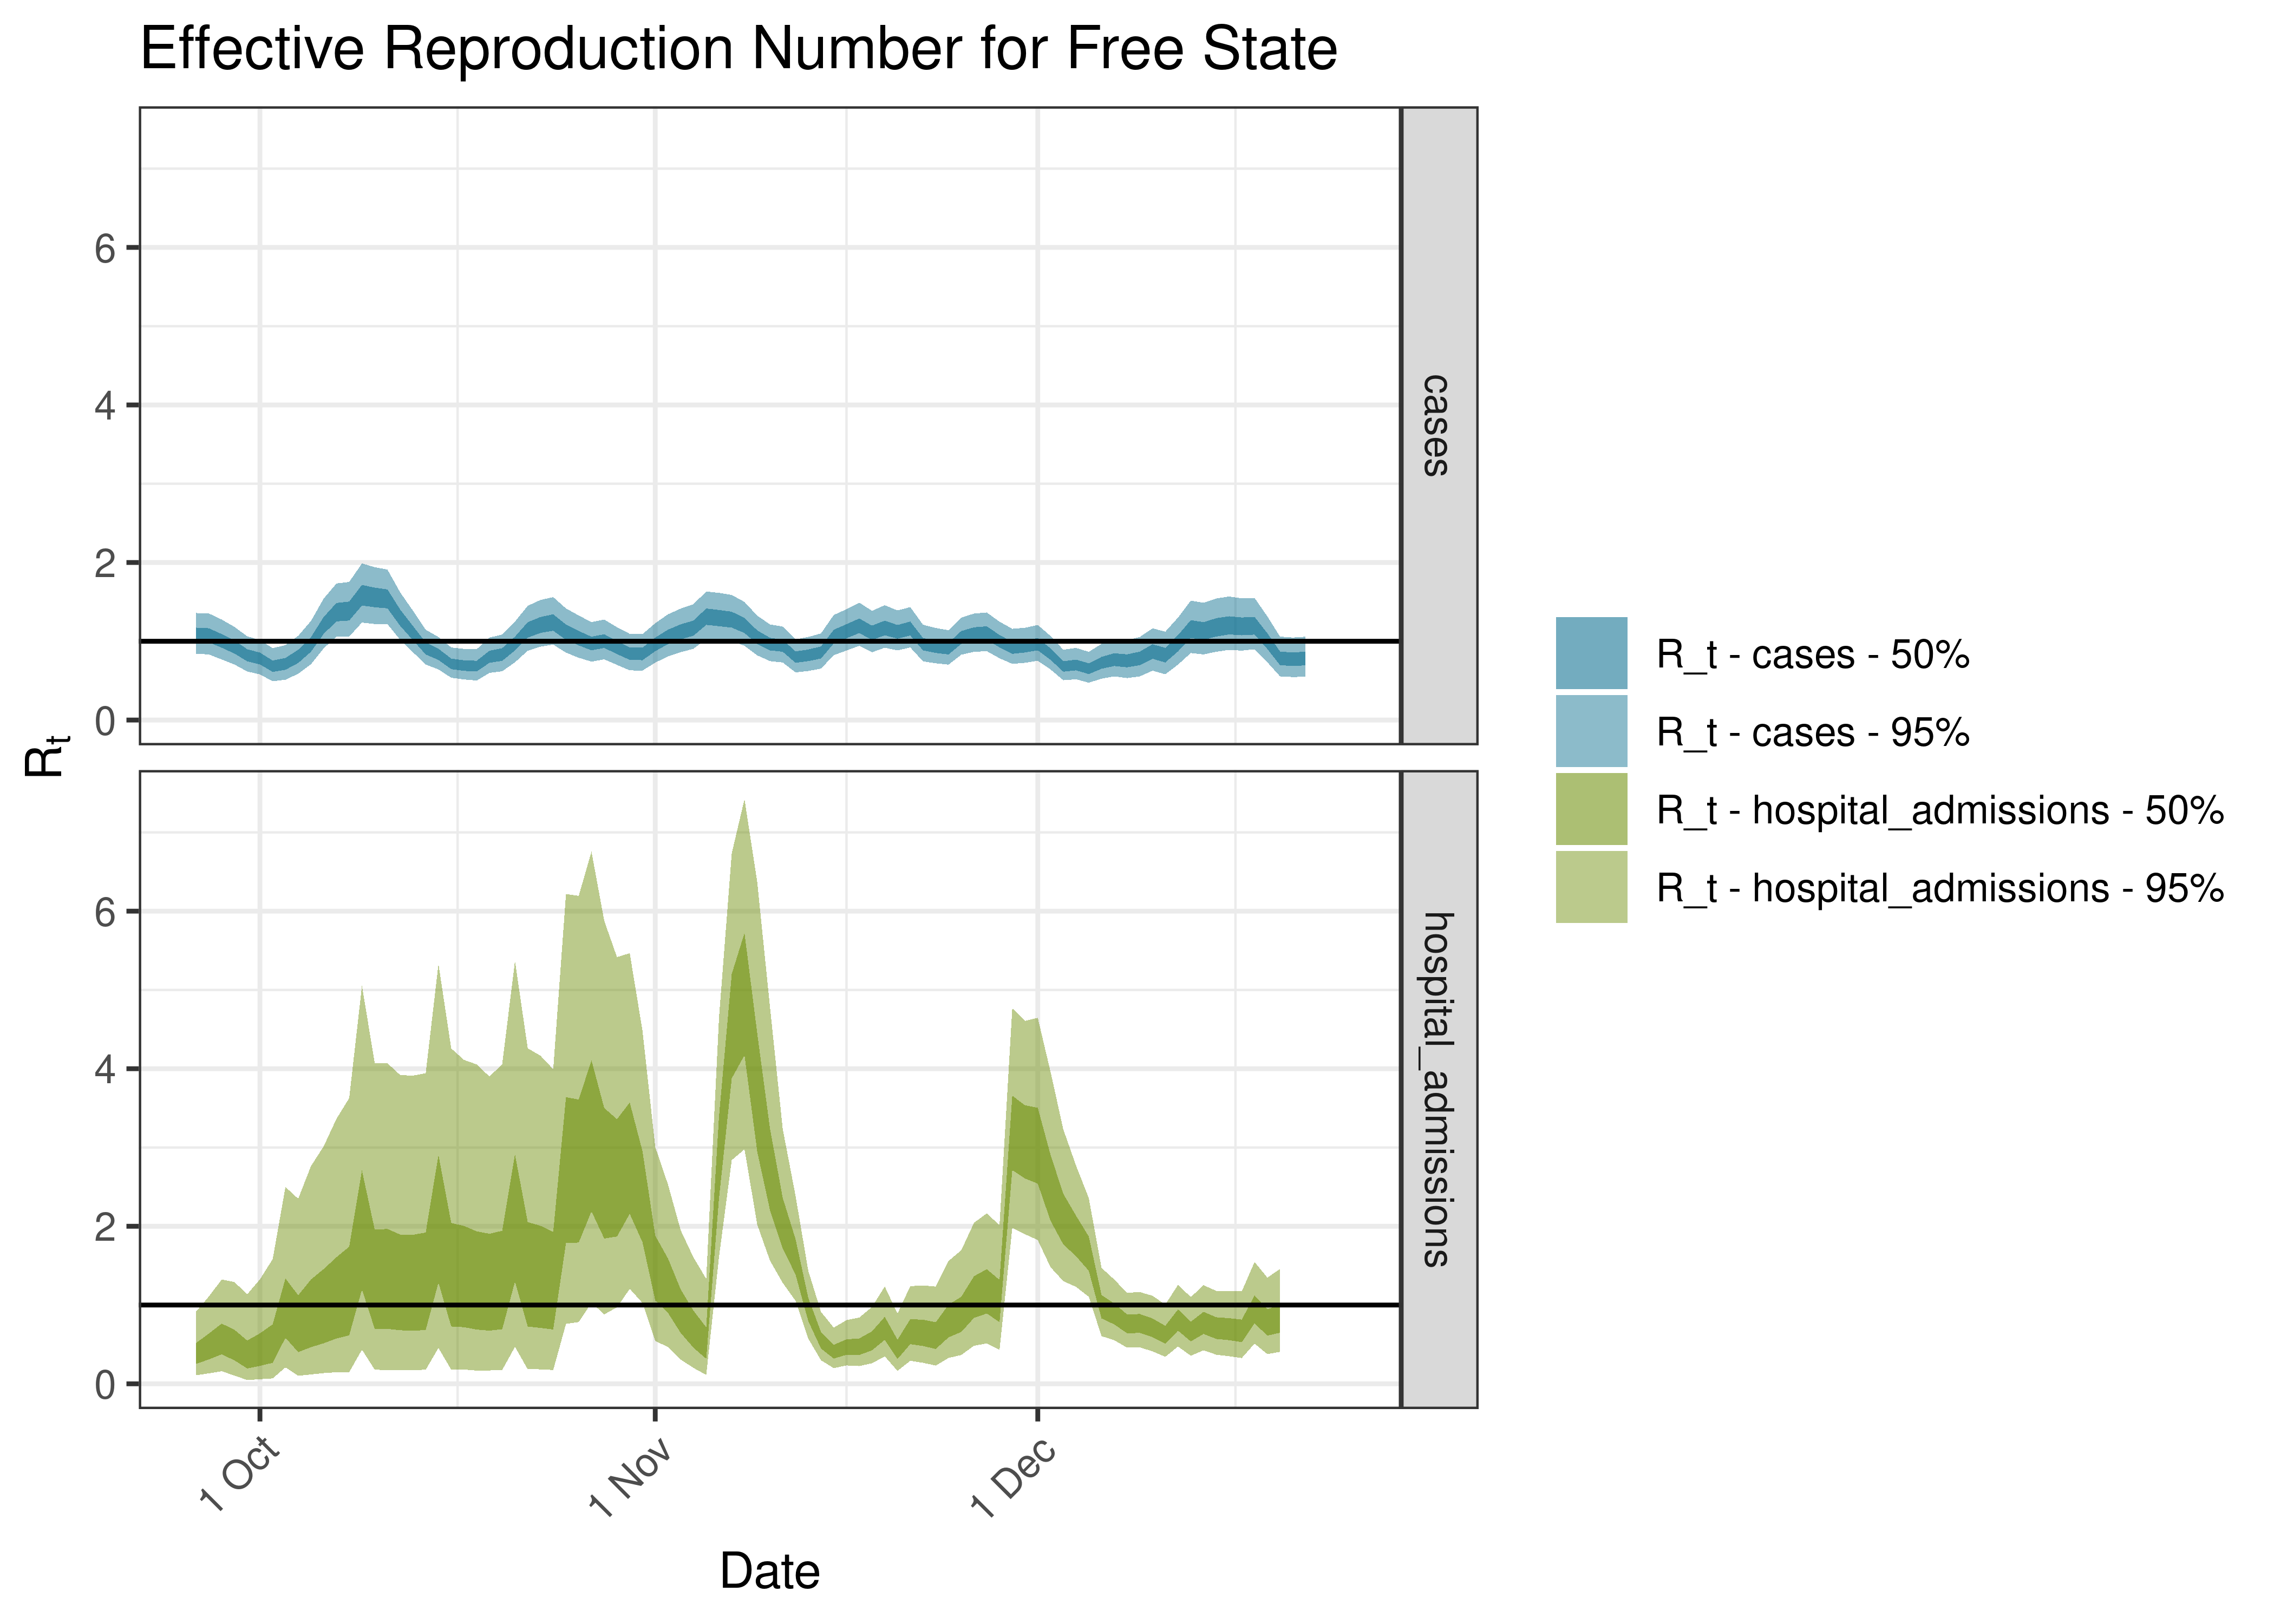
Estimated Effective Reproduction Number for Free State over last 90 days
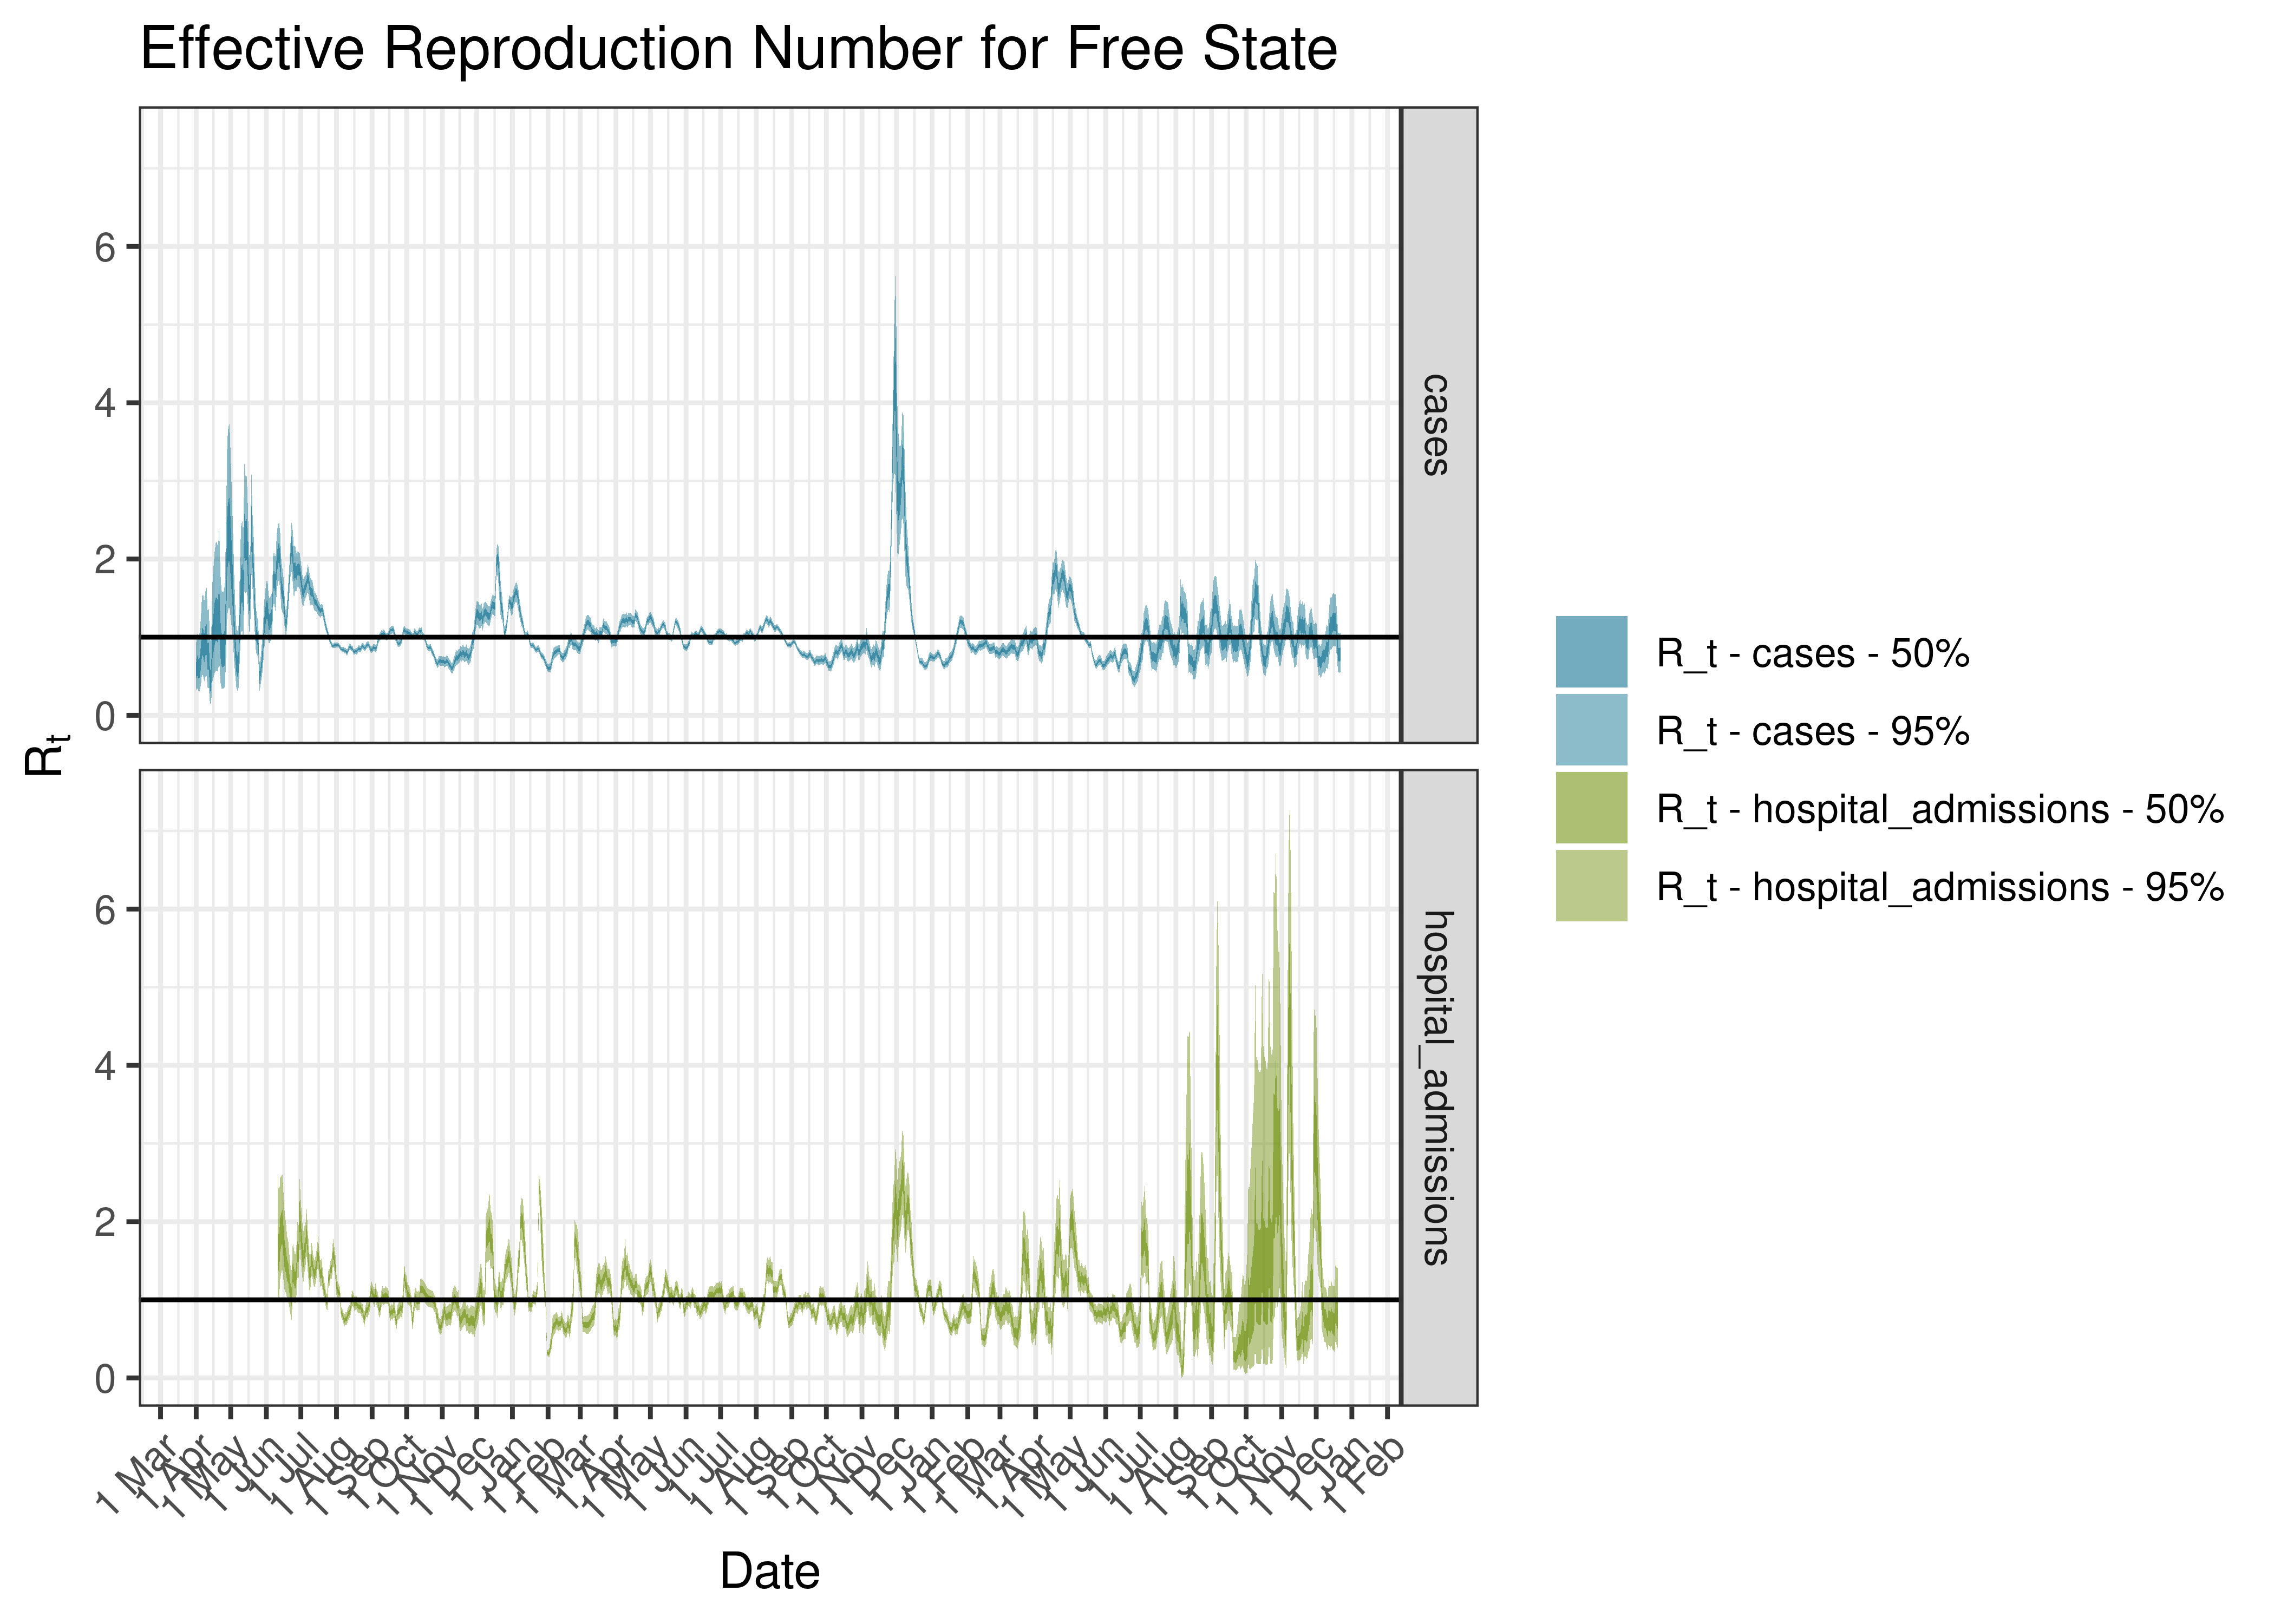
Estimated Effective Reproduction Number for Free State since 1 April 2020
6.3.8 Fezile Dabi
6.3.8.1 Cases
Cases are tabulated by specimen received date below. Cases include estimates for late reporting in recent days as well as adjustments for any public holidays. A centred 7-day moving average is also shown. The peak daily cases in previous waves (as measured by the moving average) is also shown.
| Specimen Received Date | Cases | 7-day Moving Average | Comment |
|---|---|---|---|
| 2020-07-21 | 144 | 144 | Wave 1 Peak |
| 2021-01-07 | 171 | 122 | Wave 2 Peak |
| 2021-07-04 | 25 | 140 | Wave 3 Peak |
| 2021-12-11 | 106 | 217 | Wave 4 Peak |
| 2022-05-06 | 55 | 65 | Wave 5 Peak (to date) |
Below a 7-day moving average daily case count are plotted for Fezile Dabi on a log scale since start of the epidemic:
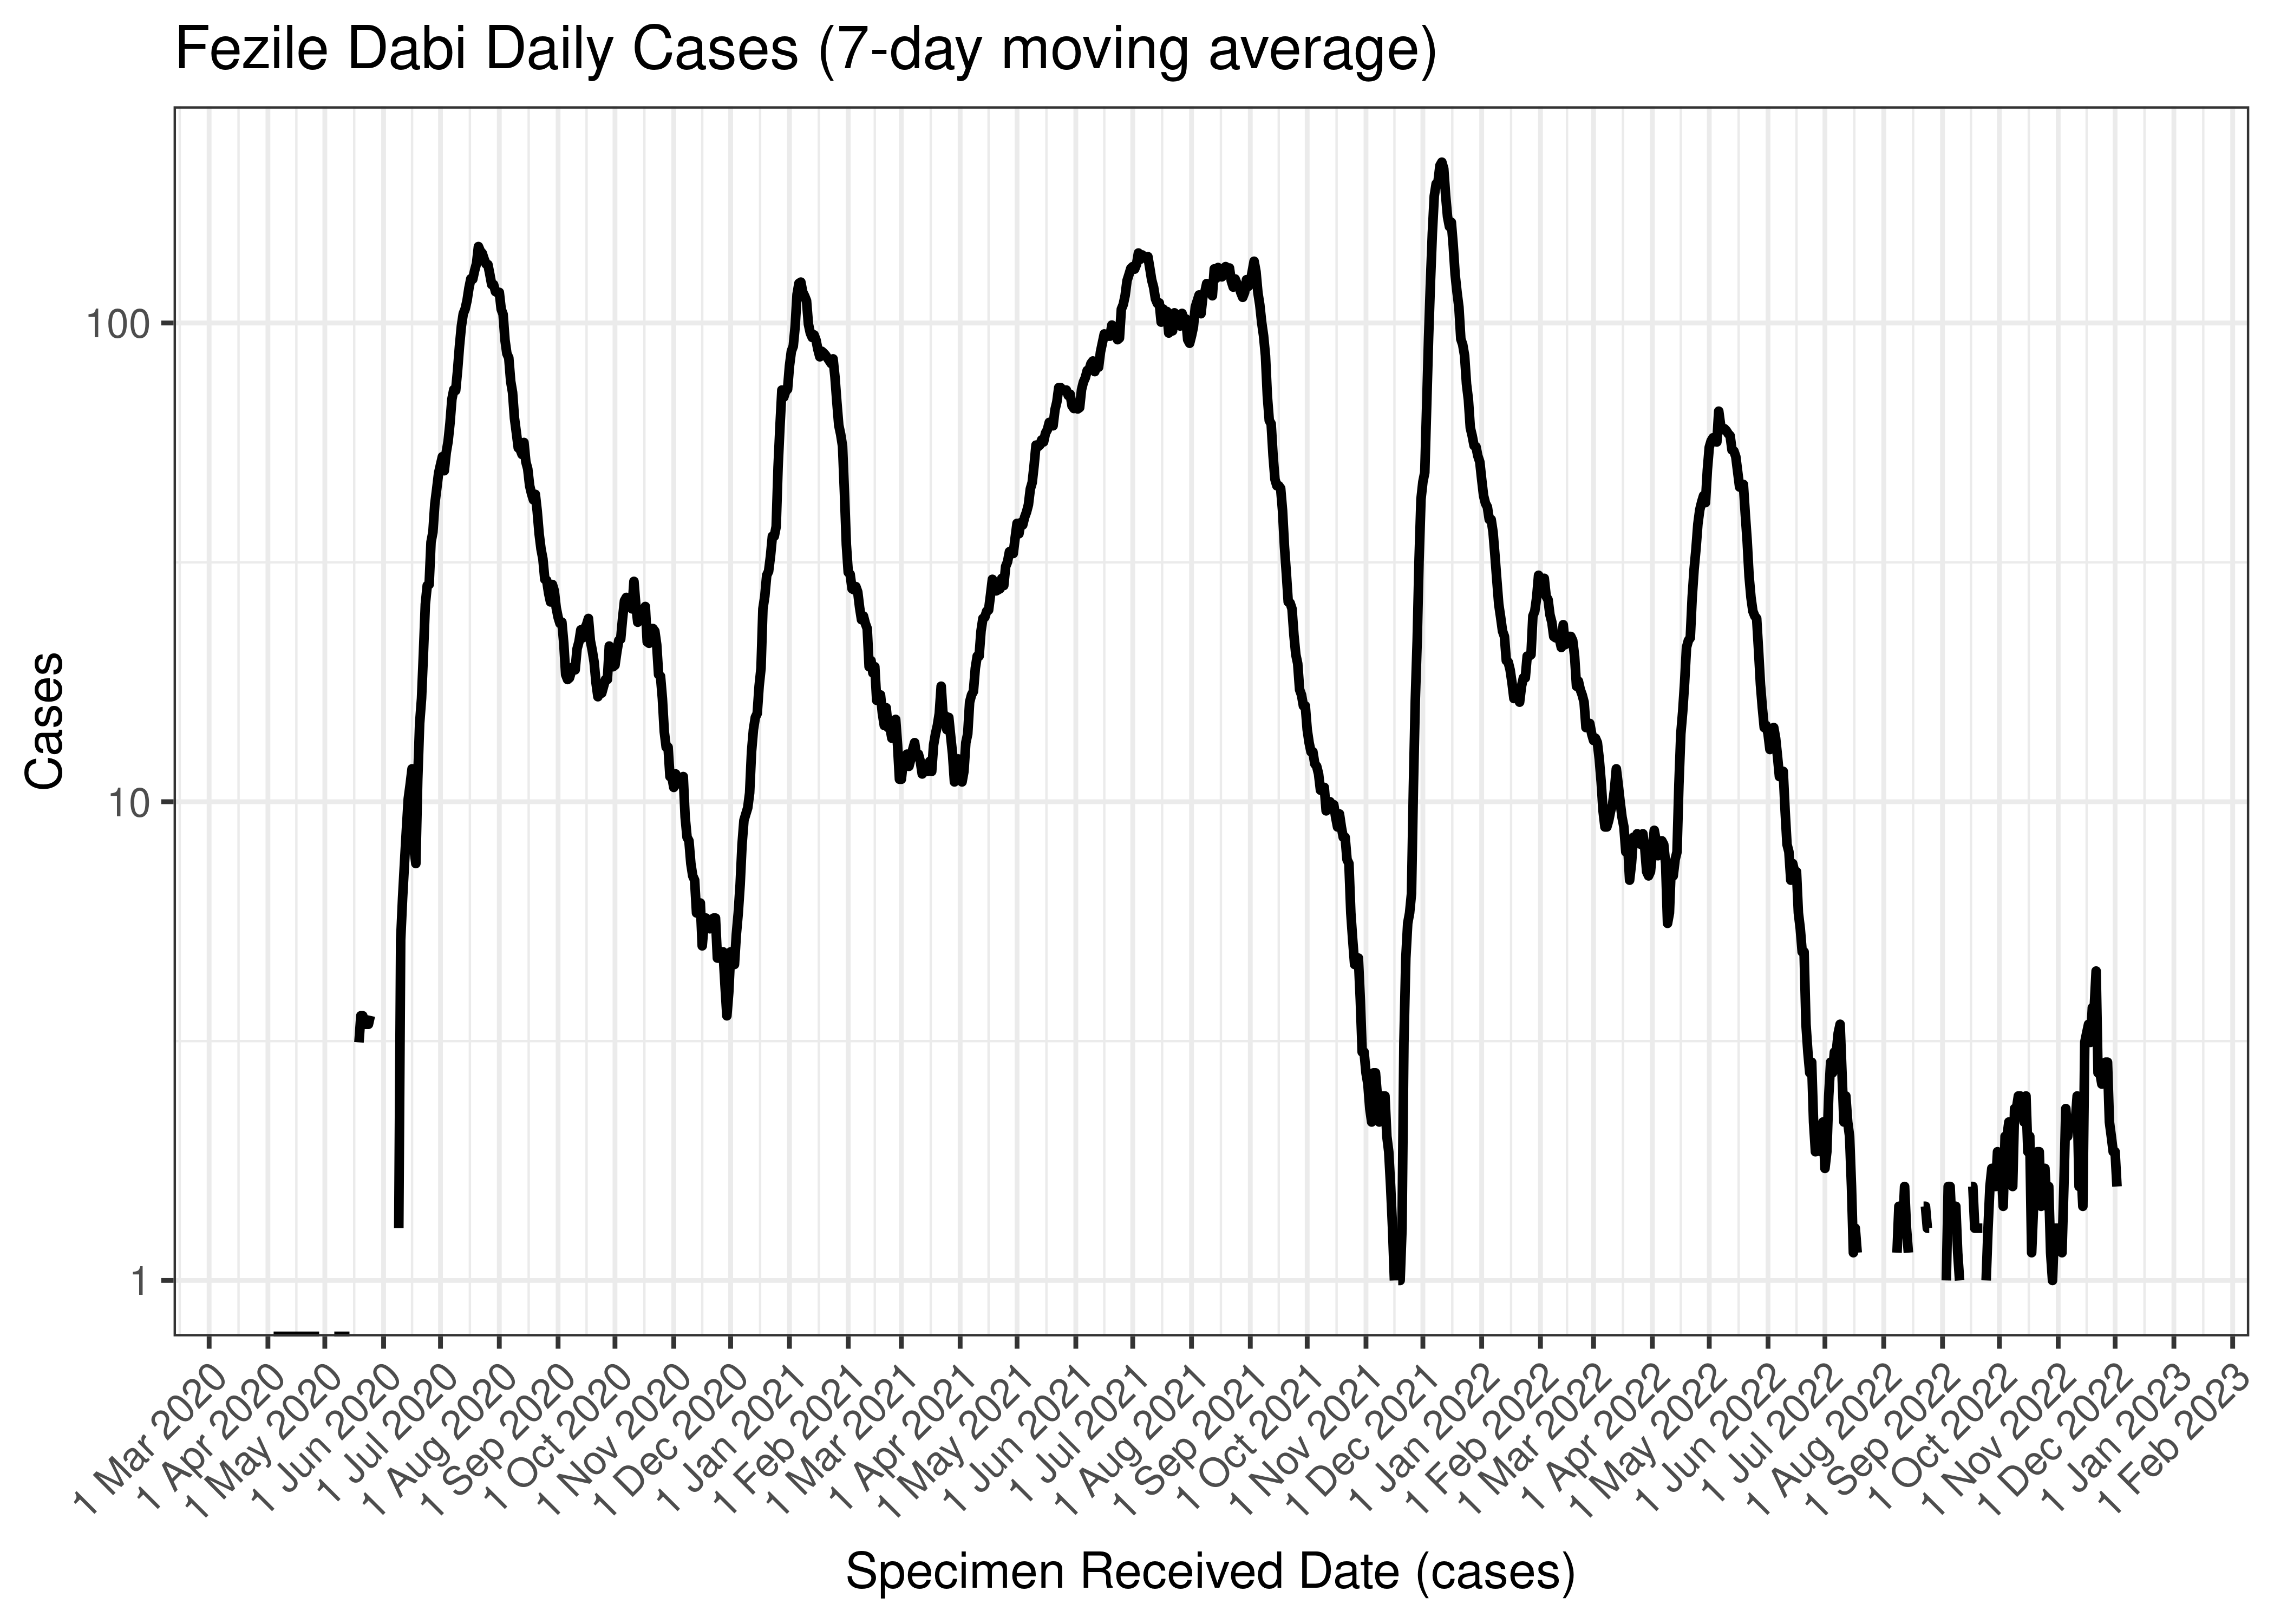
Fezile Dabi Daily Cases (7-day moving average)
Below the above chart is repeated for the last 30-days:

Fezile Dabi Daily Cases for Last 30-days (7-day moving average)
6.3.8.2 Reproduction Number
Below current (last weekly) reproduction number estimates are tabulated for Fezile Dabi.
| Count (Per Day) | Week Ending | Reproduction Number [95% Confidence Interval] | |
|---|---|---|---|
| Fezile Dabi | 0.3 | 2022-12-25 | 0.75 [0.15 - 1.82] |
Below the effective reproduction number for Fezile Dabi over the last 90 days are plotted together with a plot since start of the pandemic.
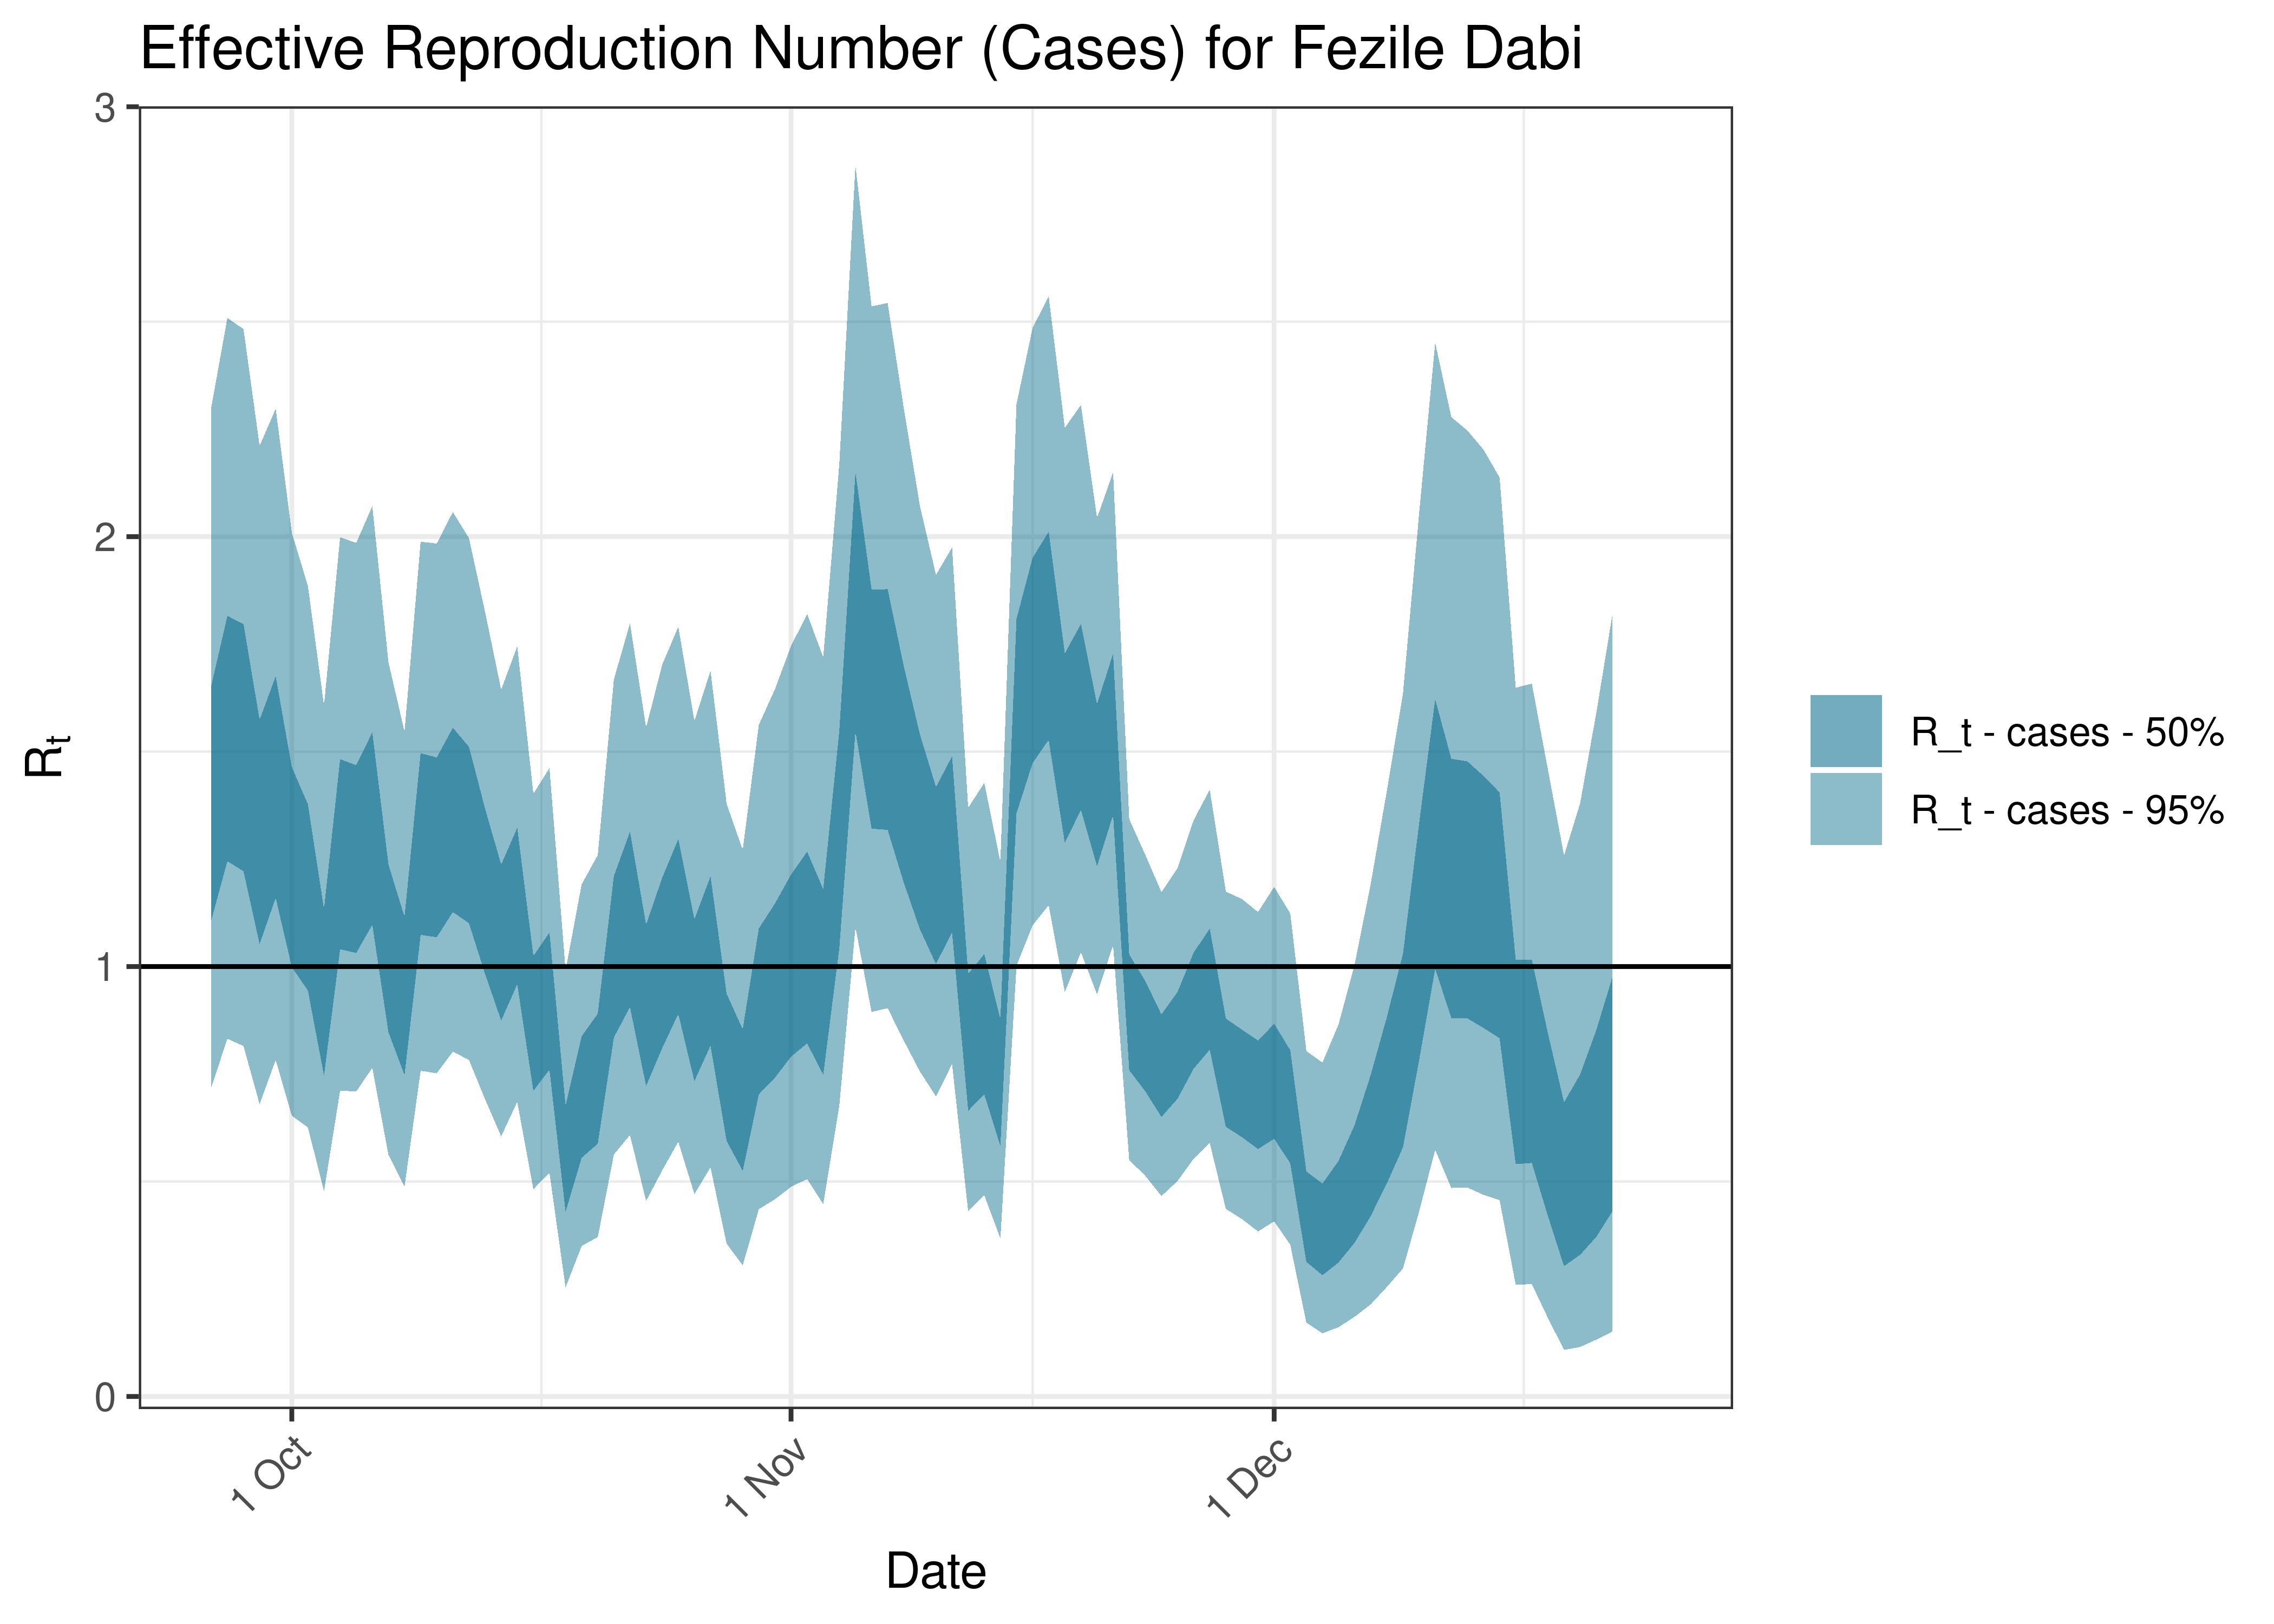
Estimated Effective Reproduction Number Based on Cases for Fezile Dabi over last 90 days

Estimated Effective Reproduction Number Based on Cases for Fezile Dabi since 1 April 2020
6.3.9 Lejweleputswa
6.3.9.1 Cases
Cases are tabulated by specimen received date below. Cases include estimates for late reporting in recent days as well as adjustments for any public holidays. A centred 7-day moving average is also shown. The peak daily cases in previous waves (as measured by the moving average) is also shown.
| Specimen Received Date | Cases | 7-day Moving Average | Comment |
|---|---|---|---|
| 2020-07-21 | 320 | 277 | Wave 1 Peak |
| 2021-01-14 | 154 | 140 | Wave 2 Peak |
| 2021-08-23 | 199 | 175 | Wave 3 Peak |
| 2021-12-16 | 357 | 283 | Wave 4 Peak |
| 2022-05-13 | 72 | 88 | Wave 5 Peak (to date) |
Below a 7-day moving average daily case count are plotted for Lejweleputswa on a log scale since start of the epidemic:
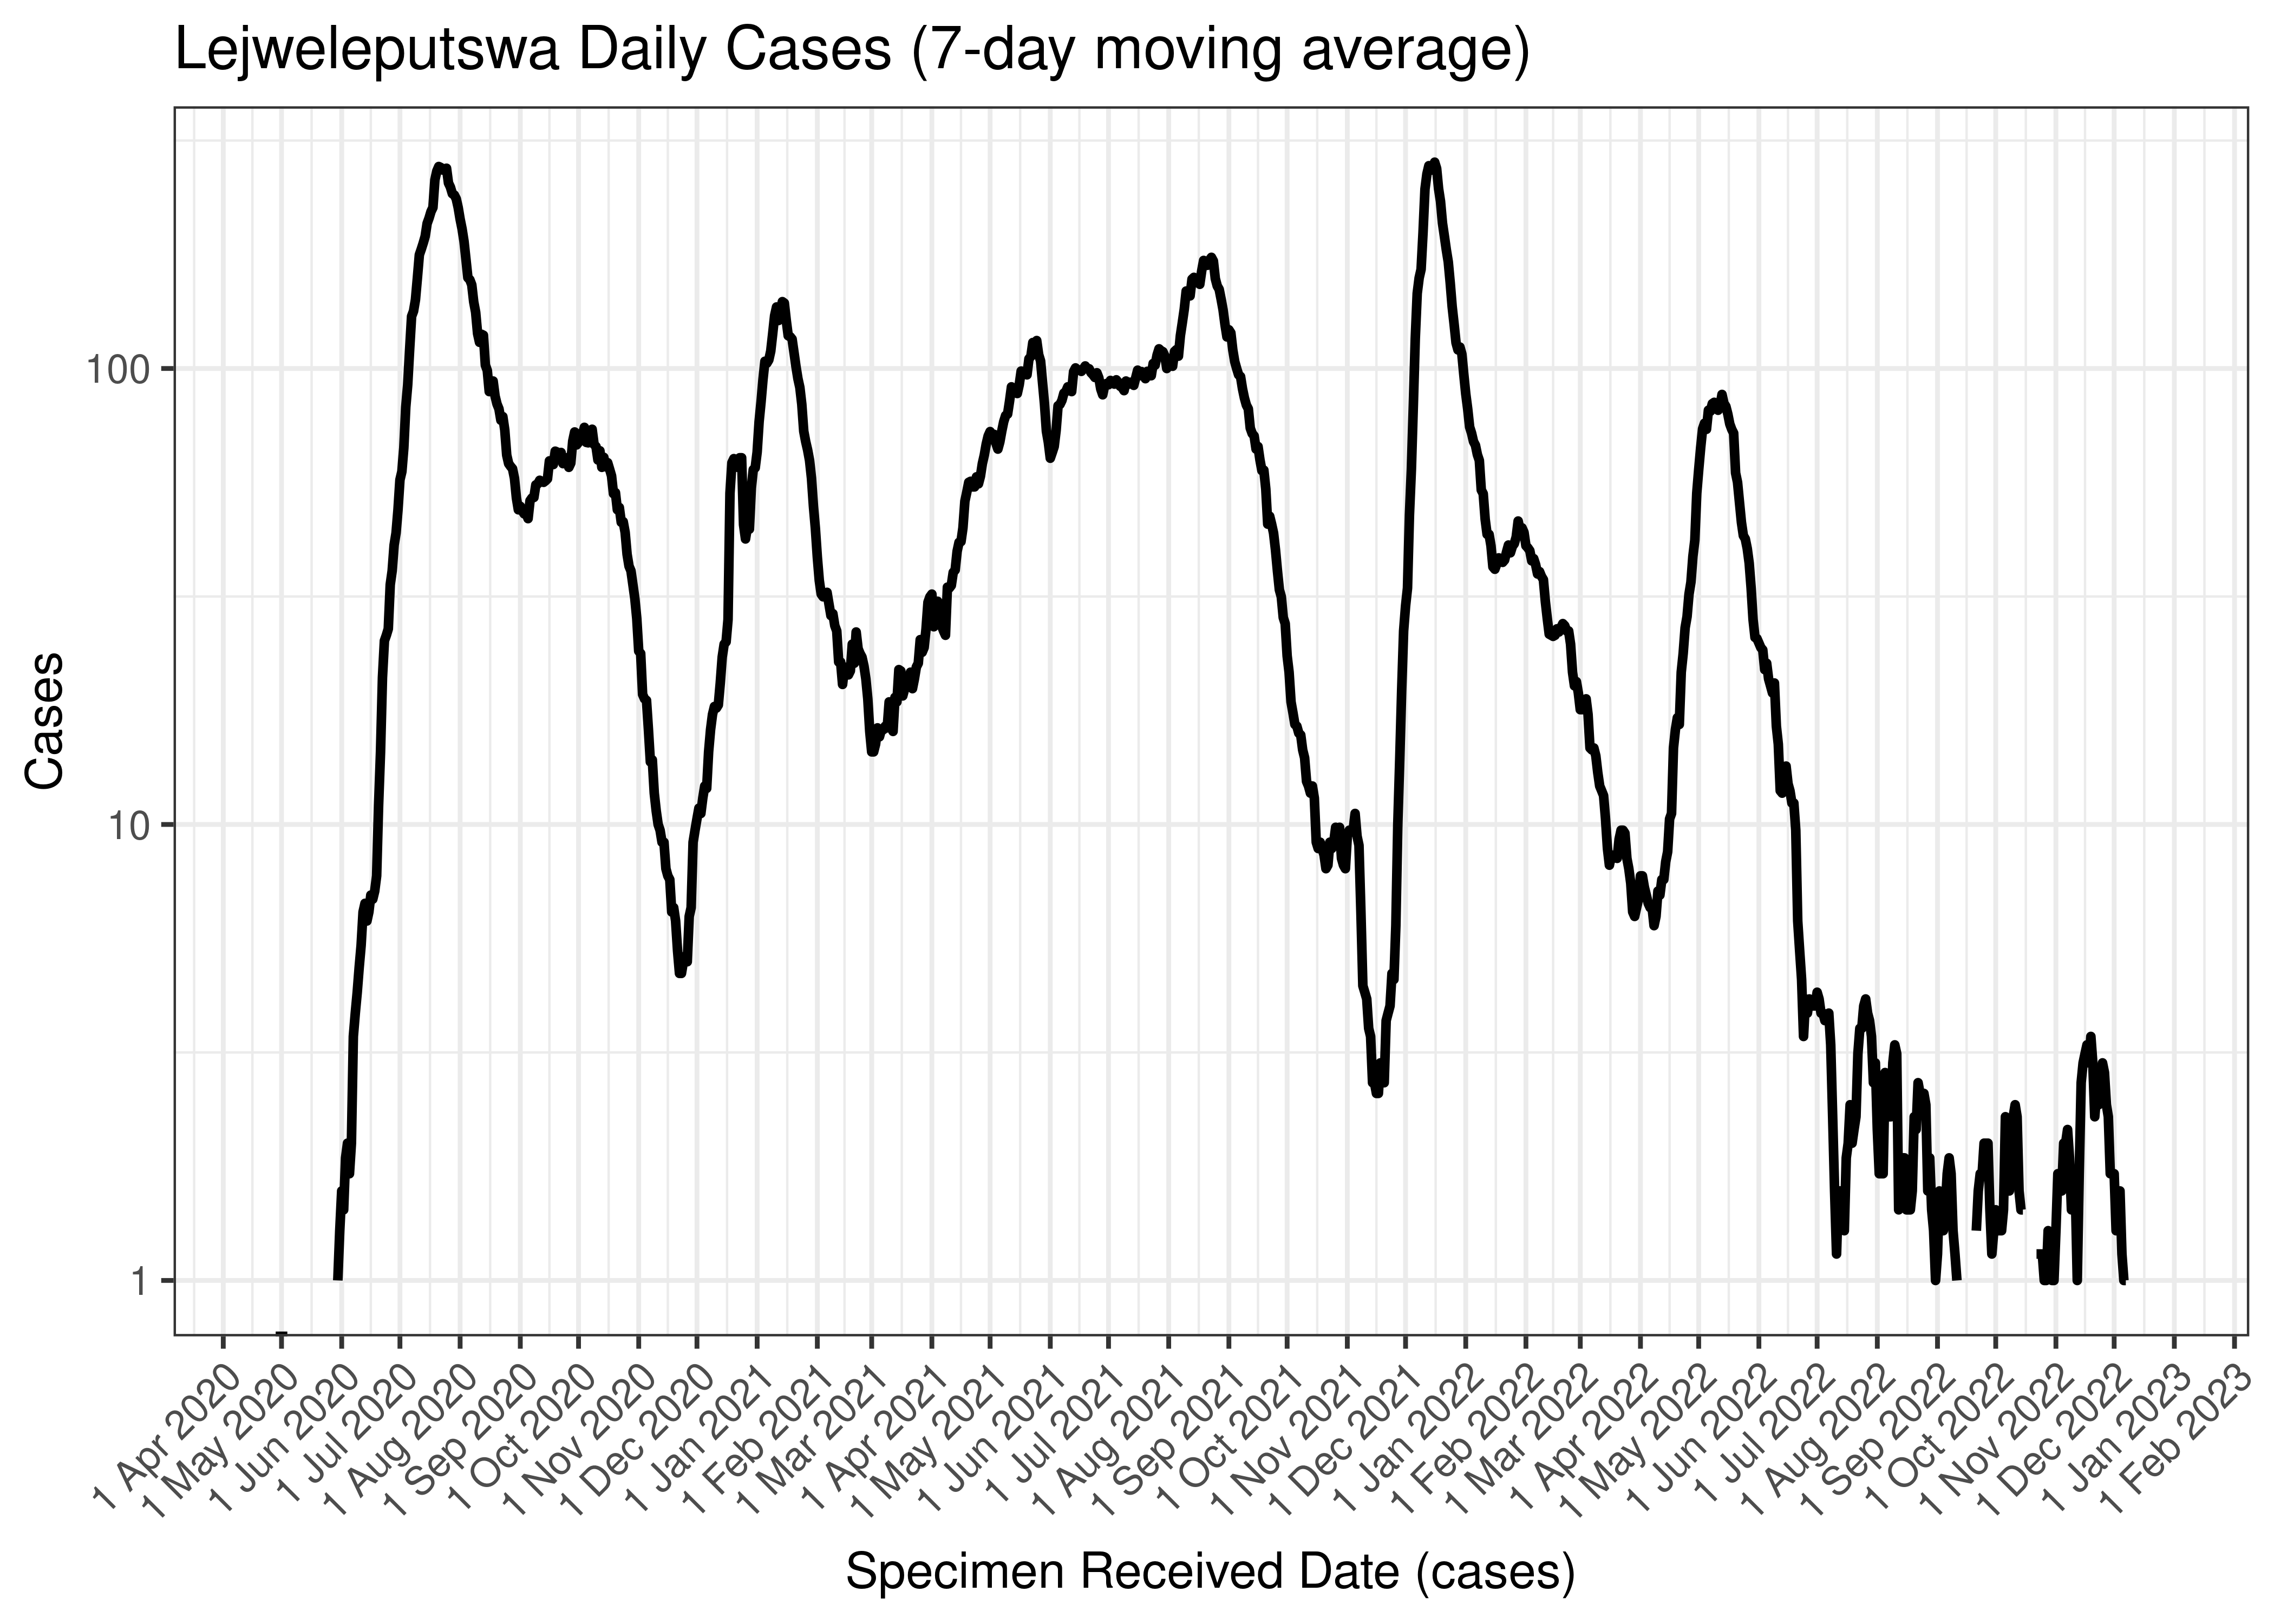
Lejweleputswa Daily Cases (7-day moving average)
Below the above chart is repeated for the last 30-days:

Lejweleputswa Daily Cases for Last 30-days (7-day moving average)
6.3.9.2 Reproduction Number
Below current (last weekly) reproduction number estimates are tabulated for Lejweleputswa.
| Count (Per Day) | Week Ending | Reproduction Number [95% Confidence Interval] | |
|---|---|---|---|
| Lejweleputswa | 1.3 | 2022-12-25 | 2.17 [1.03 - 3.74] |
Below the effective reproduction number for Lejweleputswa over the last 90 days are plotted together with a plot since start of the pandemic.
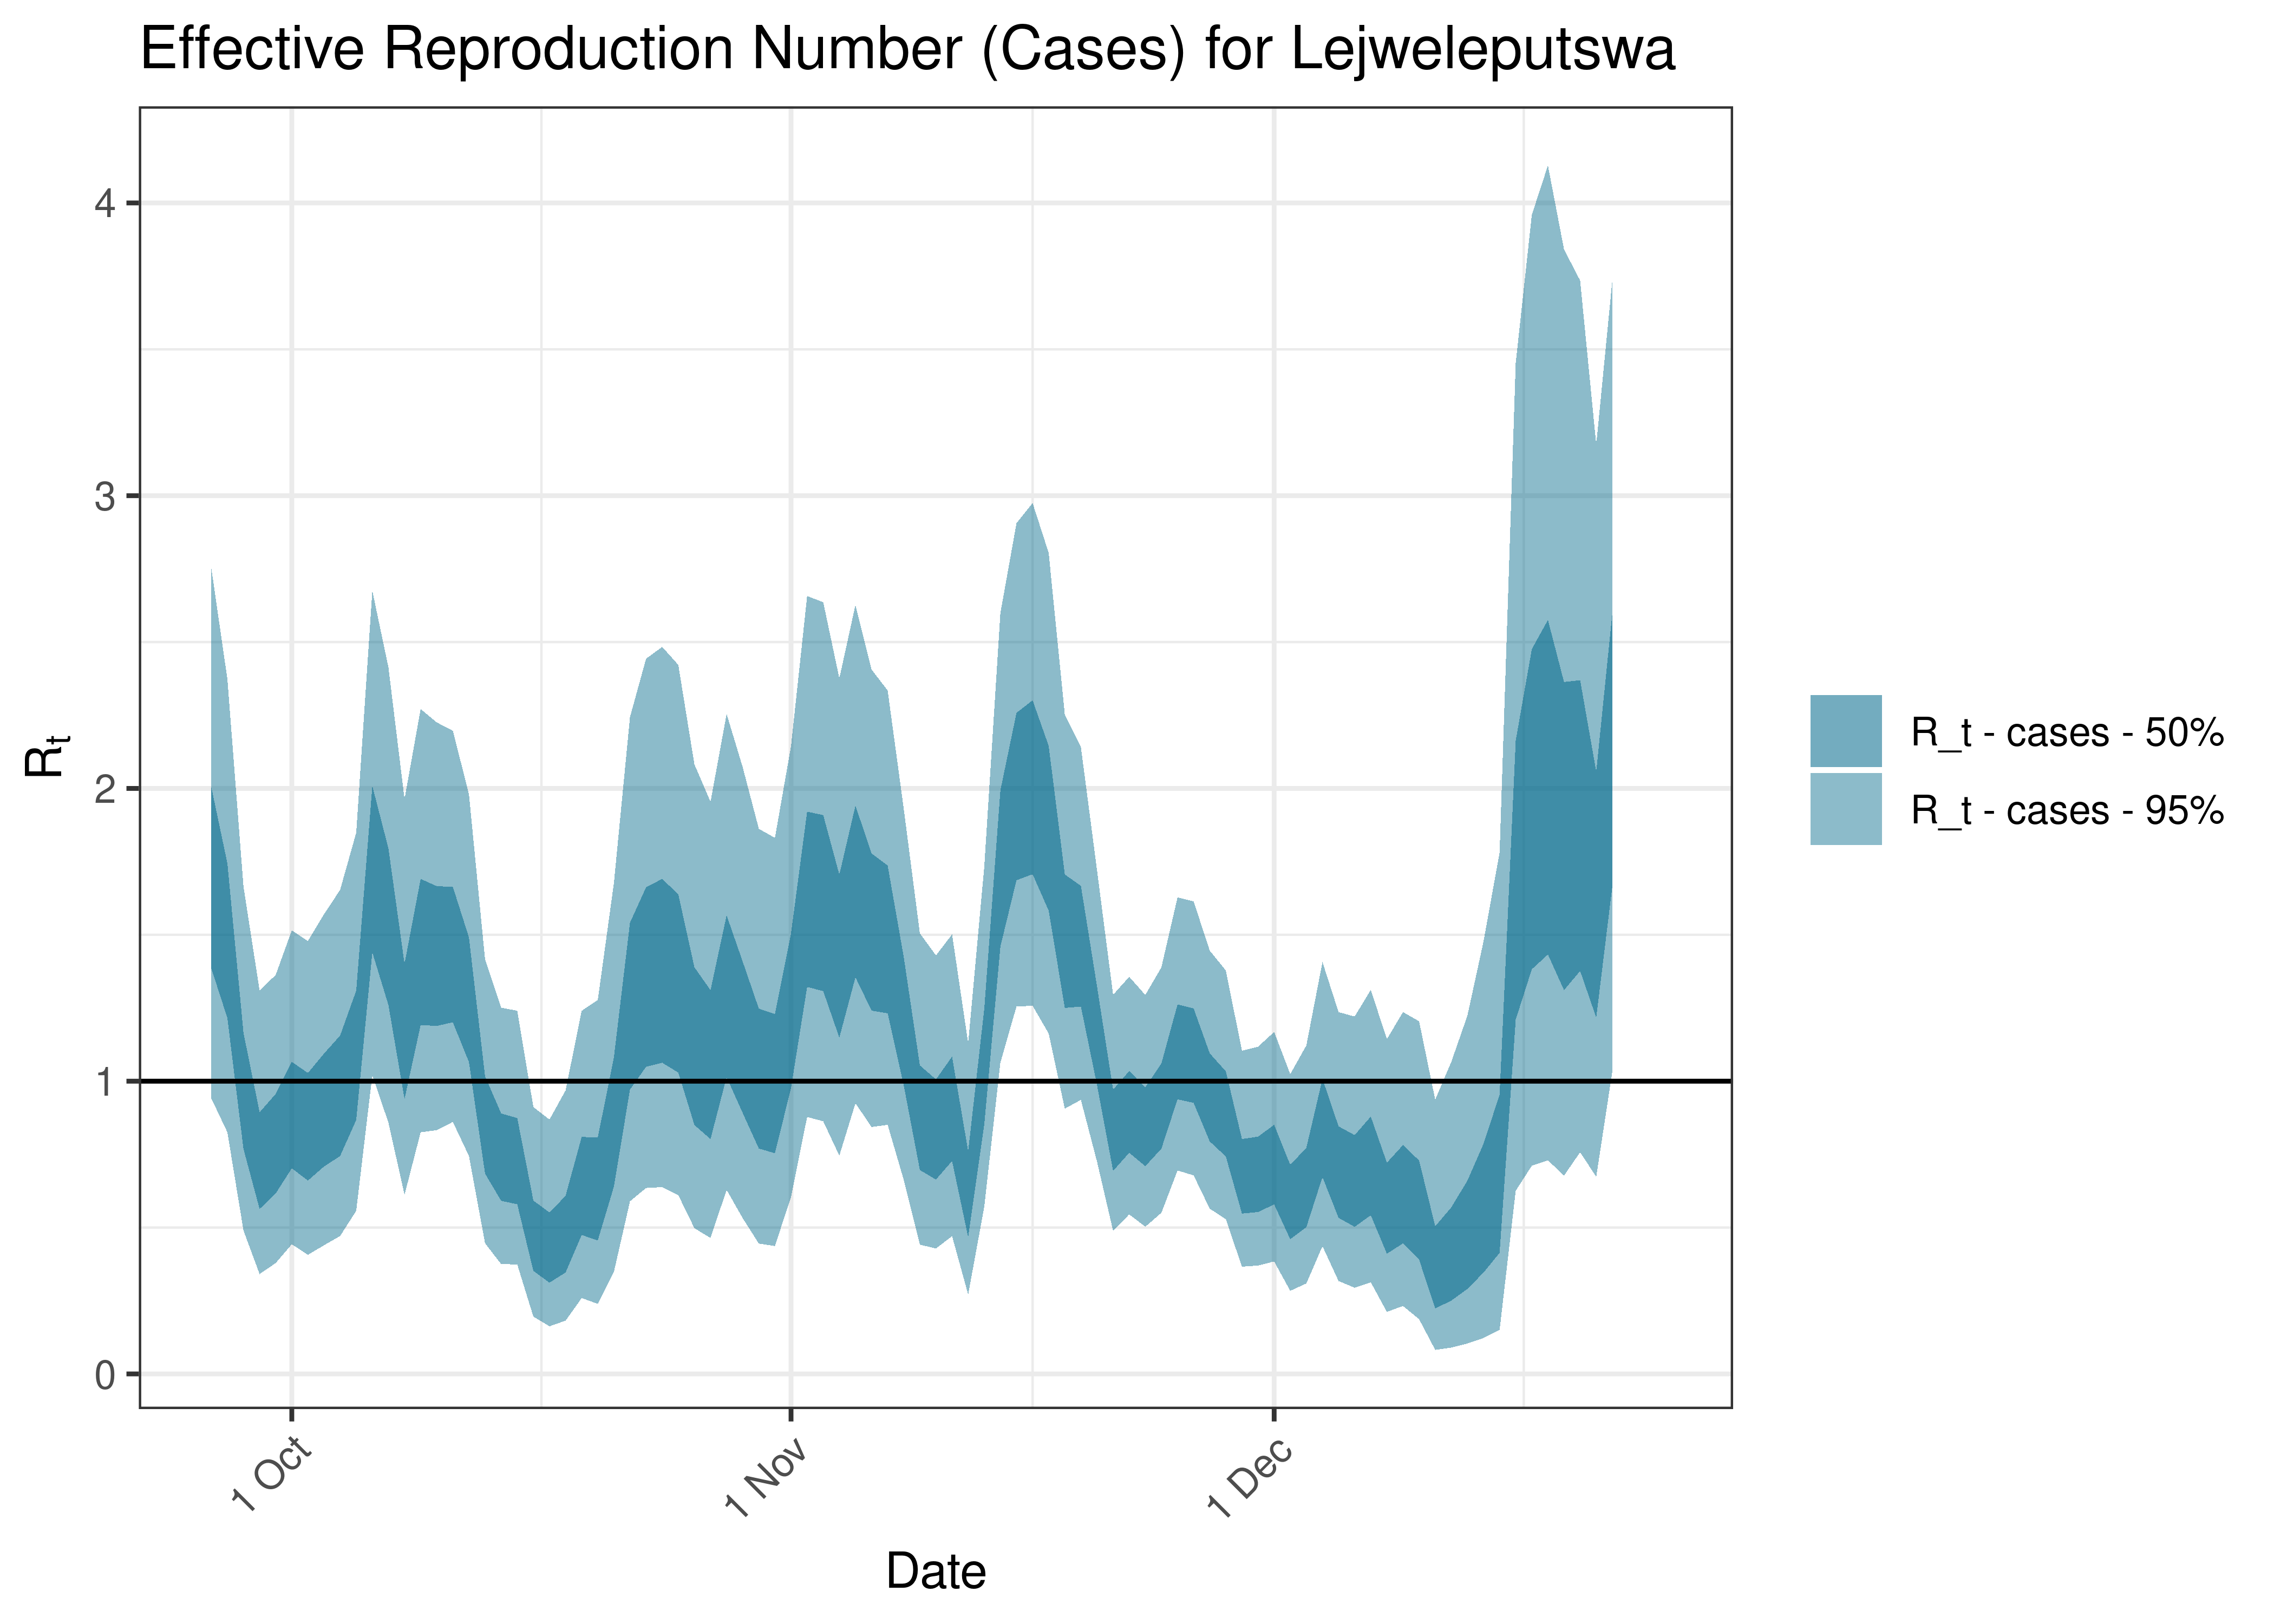
Estimated Effective Reproduction Number Based on Cases for Lejweleputswa over last 90 days
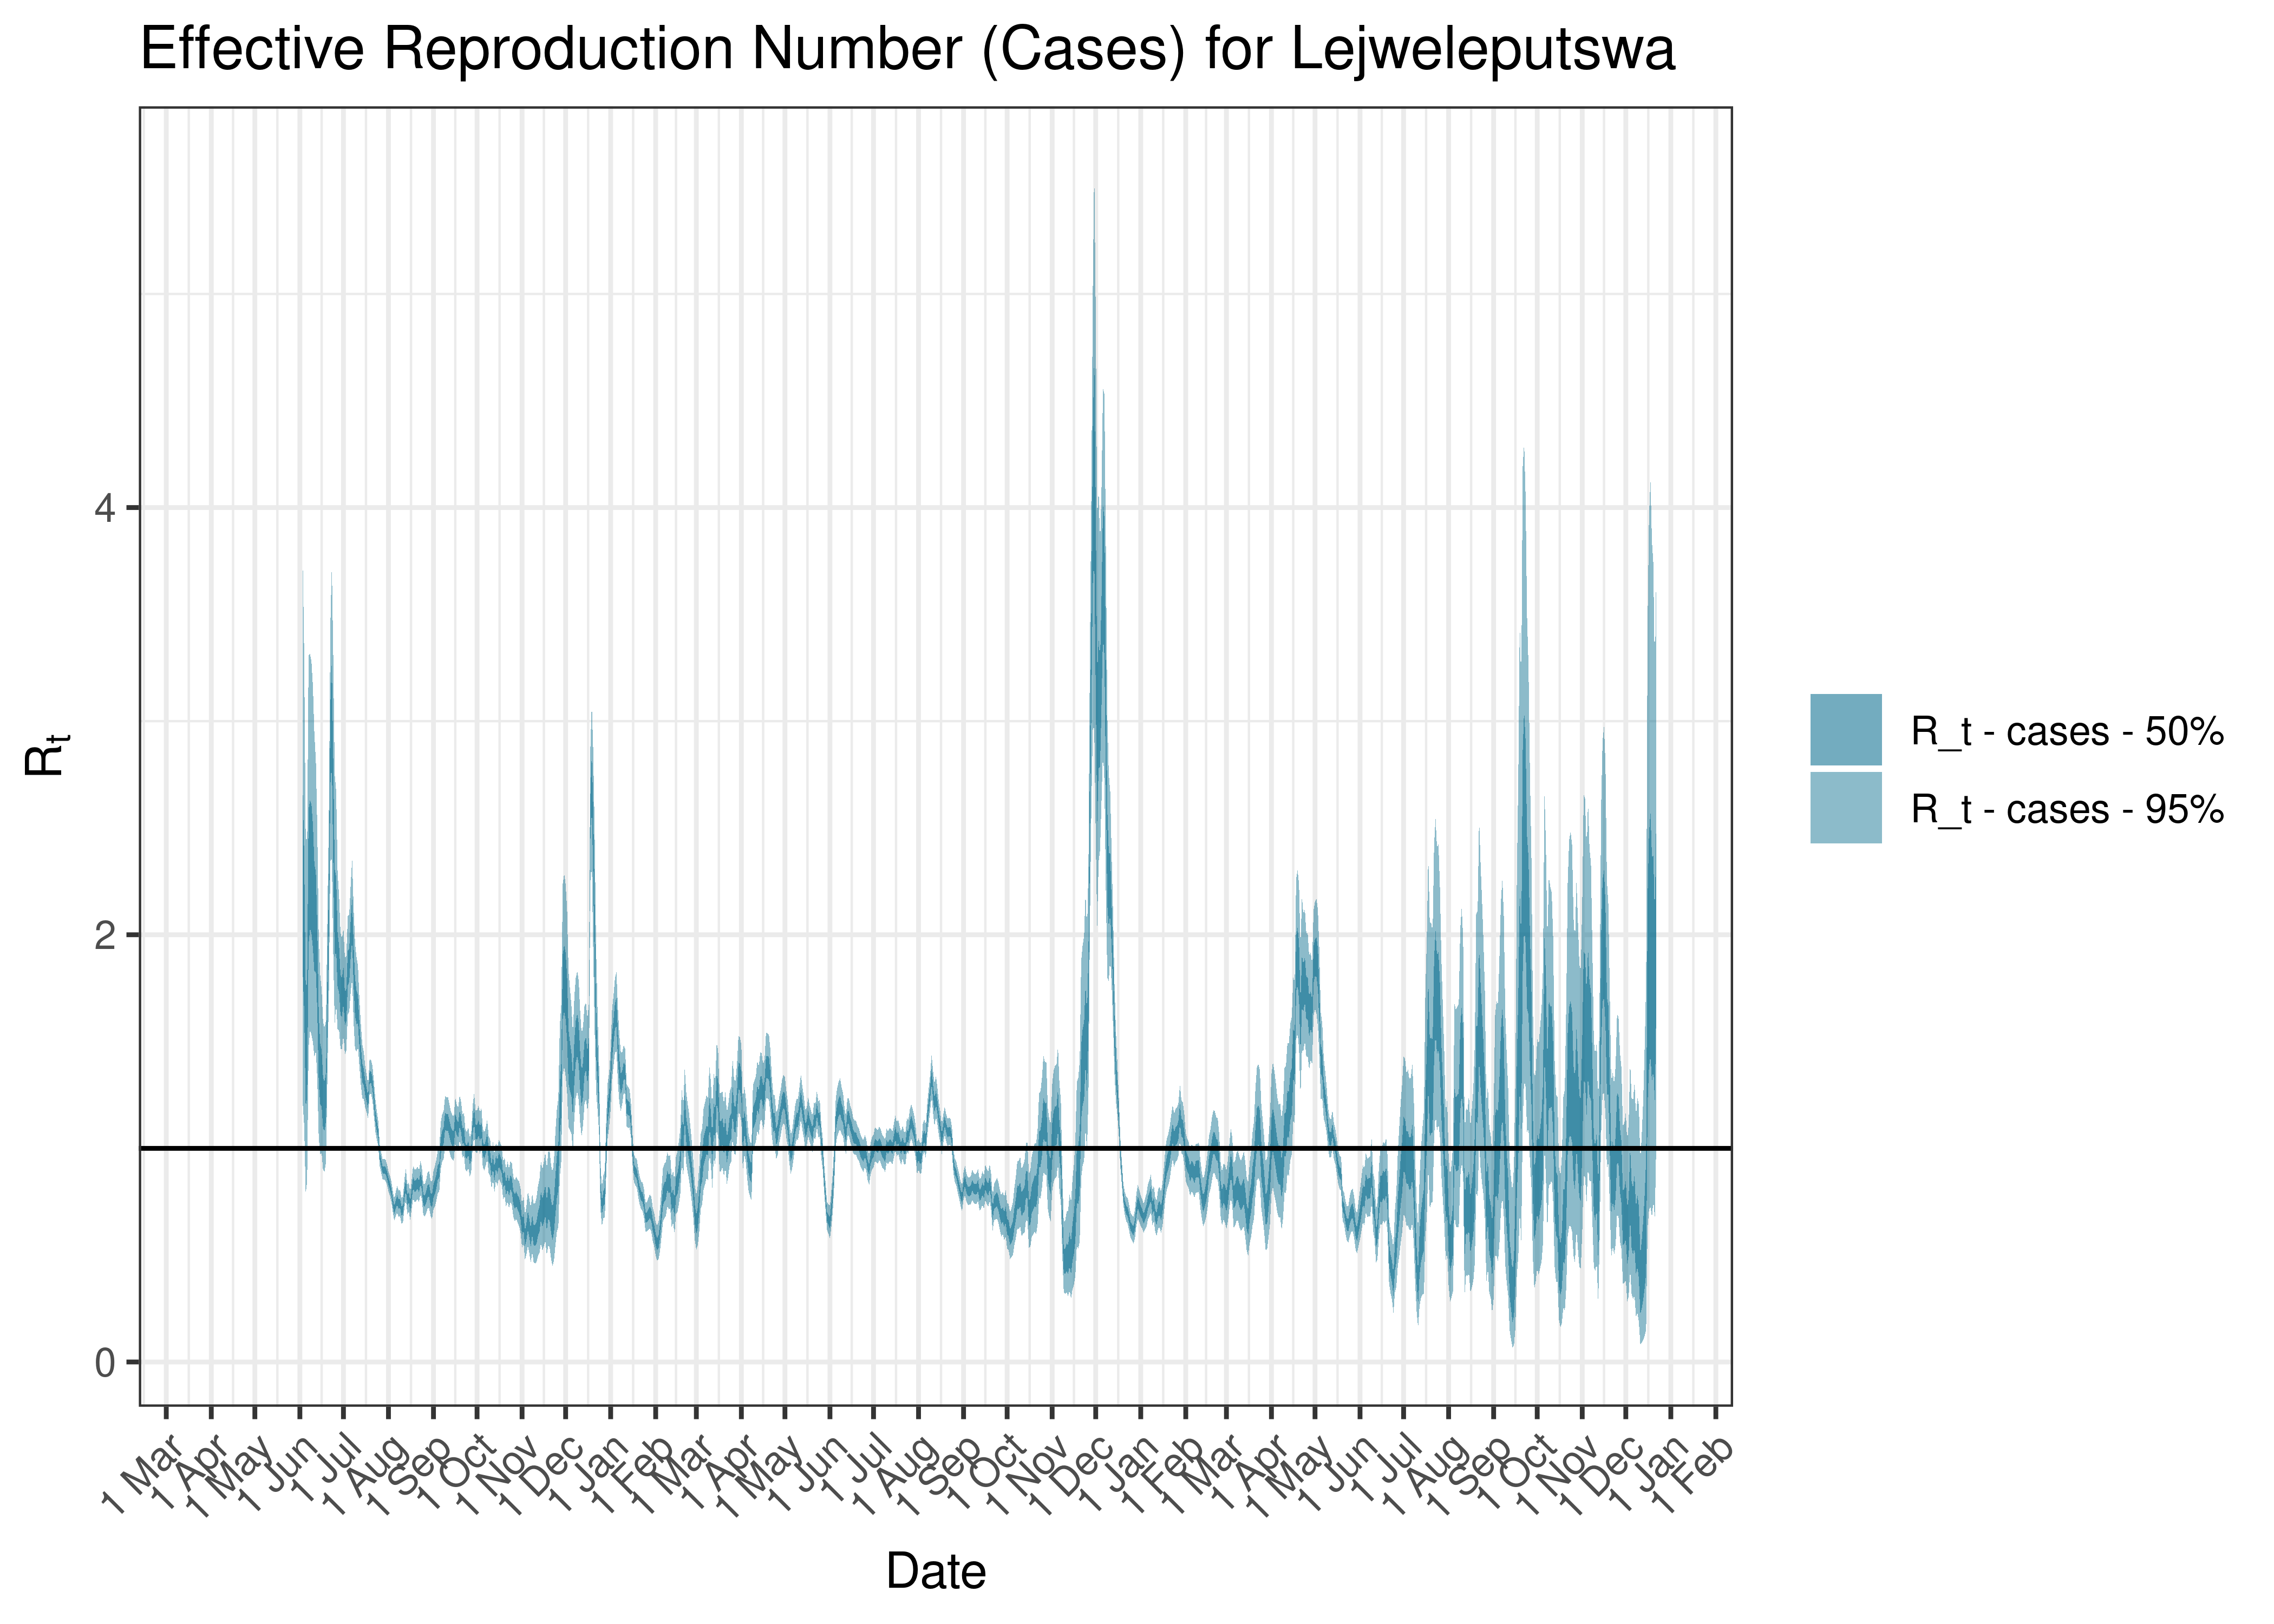
Estimated Effective Reproduction Number Based on Cases for Lejweleputswa since 1 April 2020
6.3.10 Mangaung Metro
6.3.10.1 Cases
Cases are tabulated by specimen received date below. Cases include estimates for late reporting in recent days as well as adjustments for any public holidays. A centred 7-day moving average is also shown. The peak daily cases in previous waves (as measured by the moving average) is also shown.
| Specimen Received Date | Cases | 7-day Moving Average | Comment |
|---|---|---|---|
| 2020-07-20 | 363 | 346 | Wave 1 Peak |
| 2020-10-14 | 217 | 189 | Wave 2 Peak |
| 2021-08-20 | 321 | 306 | Wave 3 Peak |
| 2021-12-13 | 588 | 567 | Wave 4 Peak |
| 2022-05-13 | 145 | 171 | Wave 5 Peak (to date) |
Below a 7-day moving average daily case count are plotted for Mangaung Metro on a log scale since start of the epidemic:
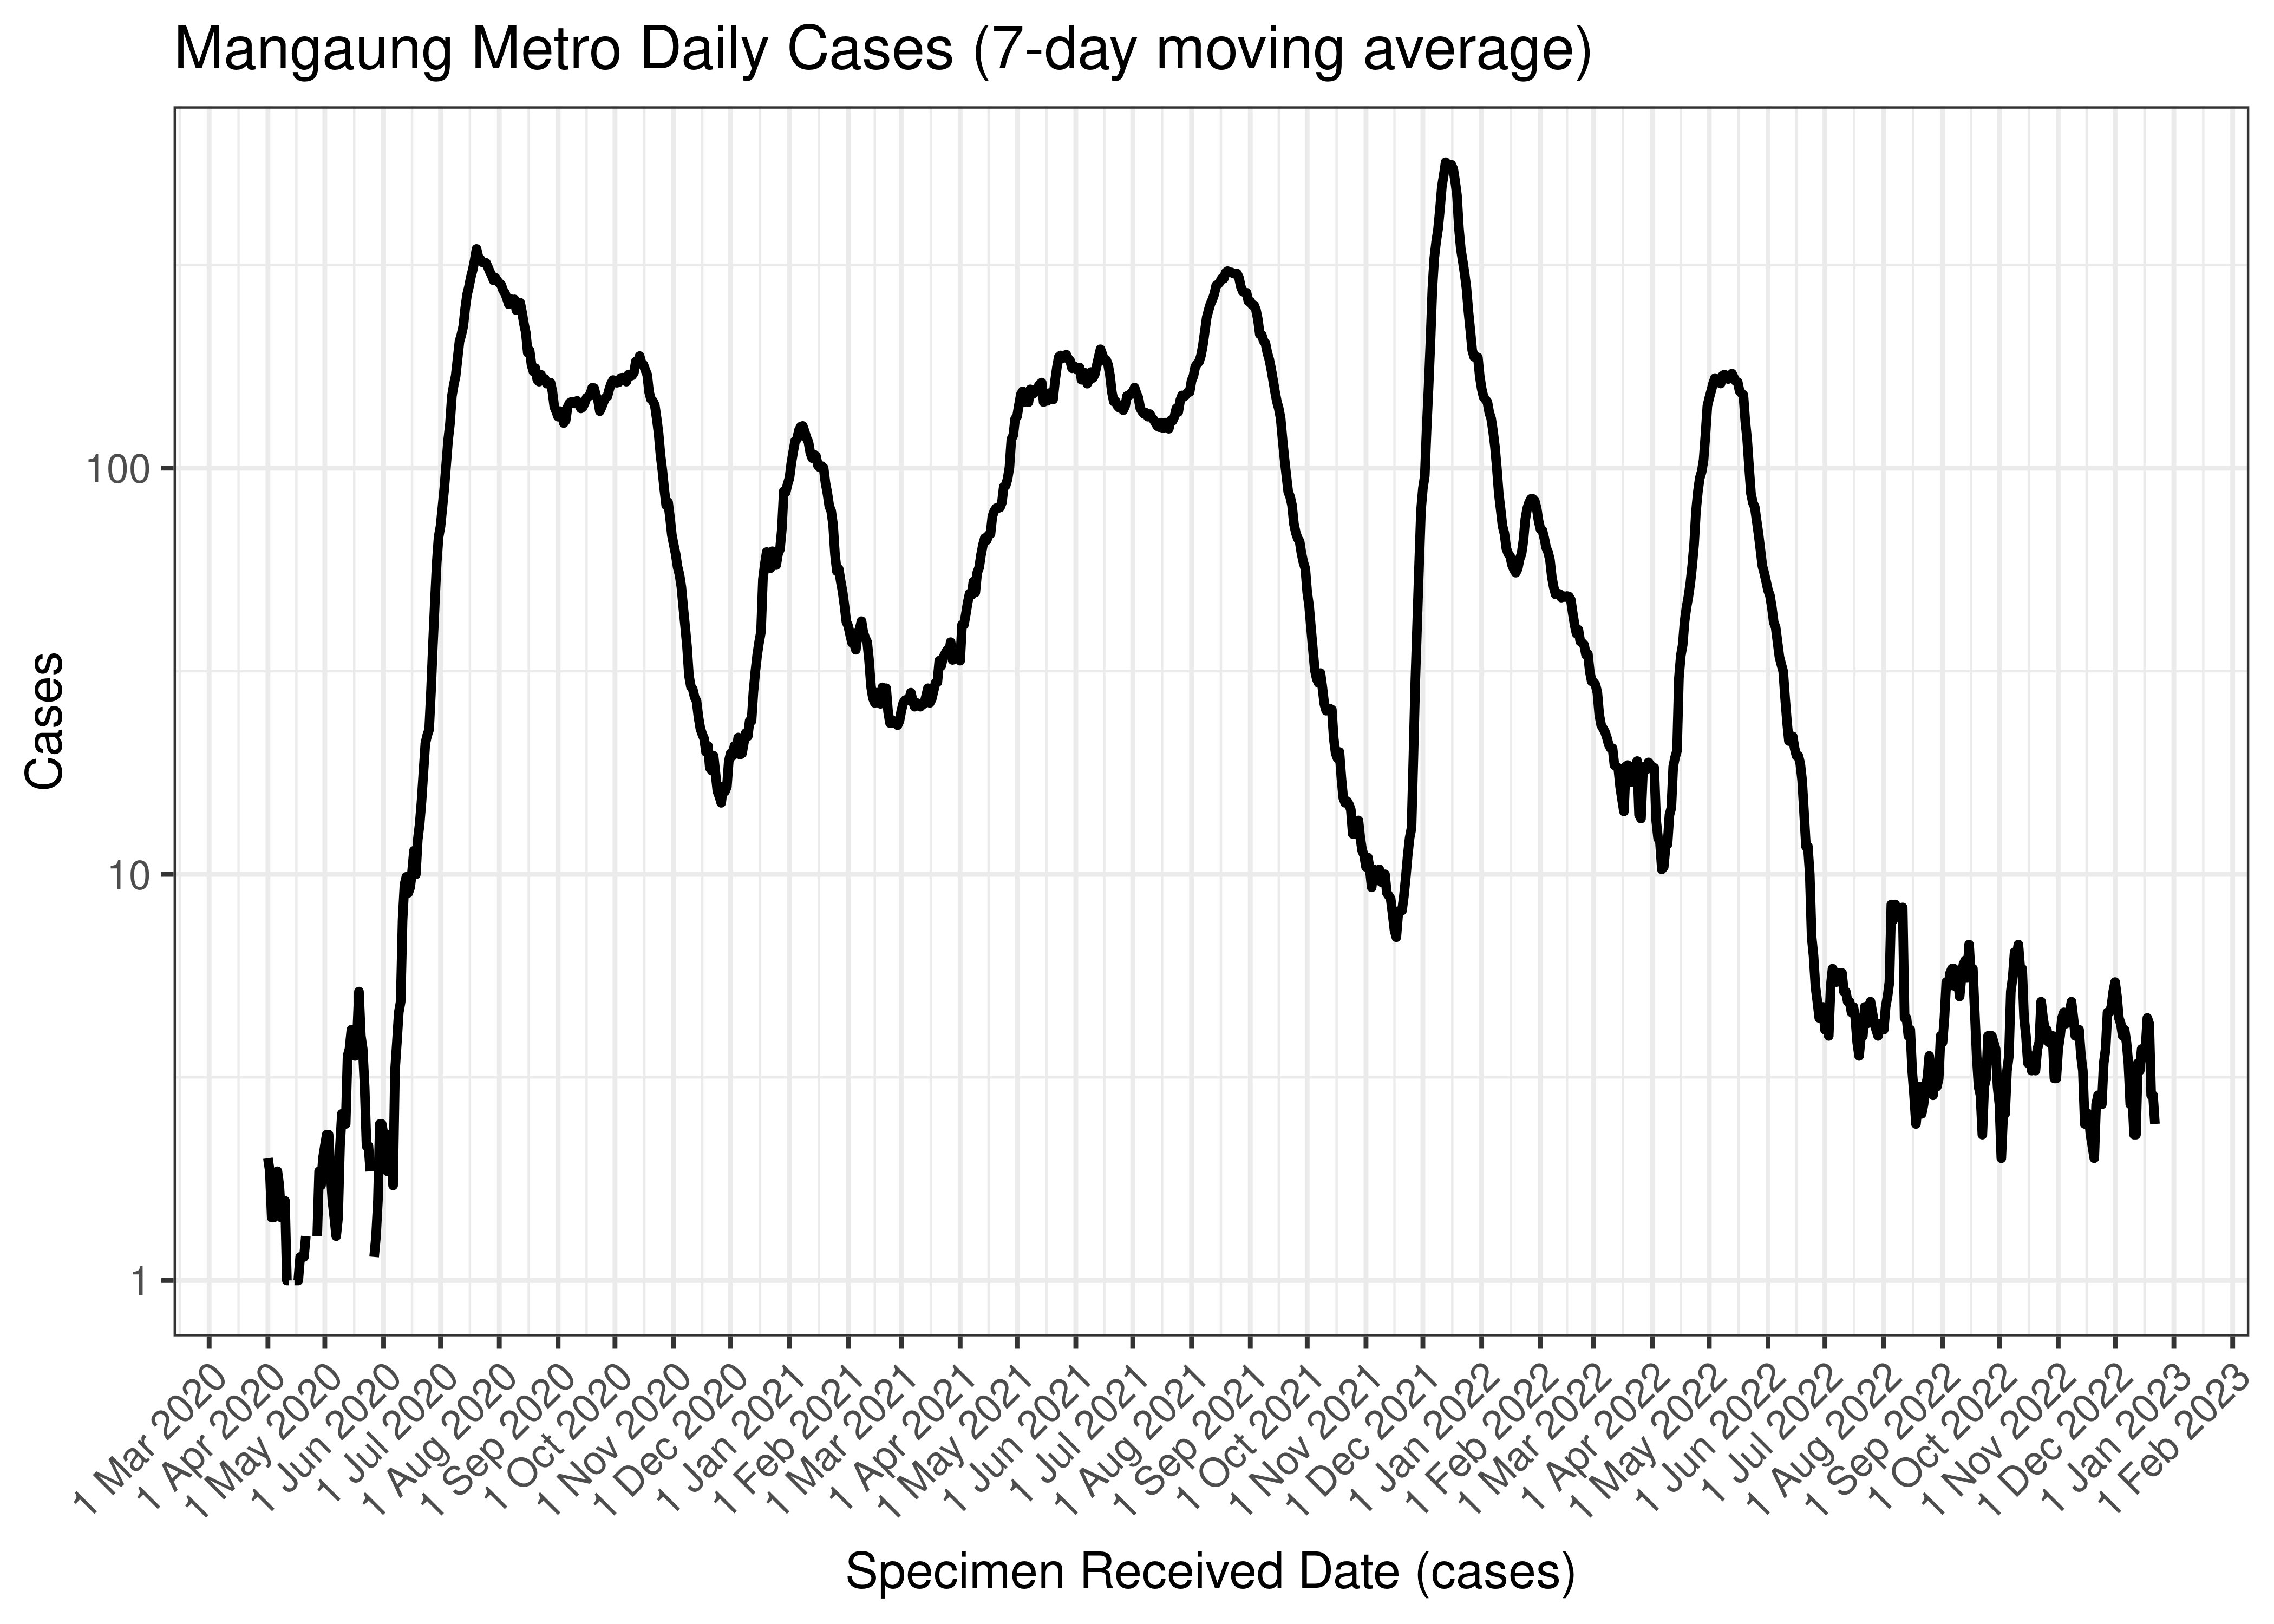
Mangaung Metro Daily Cases (7-day moving average)
Below the above chart is repeated for the last 30-days:

Mangaung Metro Daily Cases for Last 30-days (7-day moving average)
6.3.10.2 Excess Deaths
Excess deaths are tabulated by date of death below. A centred 7-day moving average is also shown. The peak daily deaths in previous waves (as measured by the moving average) is also shown.
| Specimen Received Date | Excess Deaths | 7-day Moving Average | Comment |
|---|---|---|---|
| 2020-08-19 | 18 | 18 | Wave 1 Peak |
| 2021-01-20 | 15 | 15 | Wave 2 Peak |
| 2021-06-09 | 17 | 17 | Wave 3 Peak |
| 2021-12-29 | 14 | 14 | Wave 4 Peak |
| 2022-09-07 | 13 | 13 | Wave 5 Peak (to date) |
| 2022-12-03 | 4 | 4 | |
| 2022-12-04 | 3 | 3 | |
| 2022-12-05 | 3 | 3 | |
| 2022-12-06 | 3 | 3 | |
| 2022-12-07 | 3 | 3 | |
| 2022-12-08 | 3 | NA | |
| 2022-12-09 | 3 | NA | |
| 2022-12-10 | 3 | NA |
Below a 7-day moving average daily excess deaths is plotted for Mangaung Metro on a log scale since start of the epidemic:
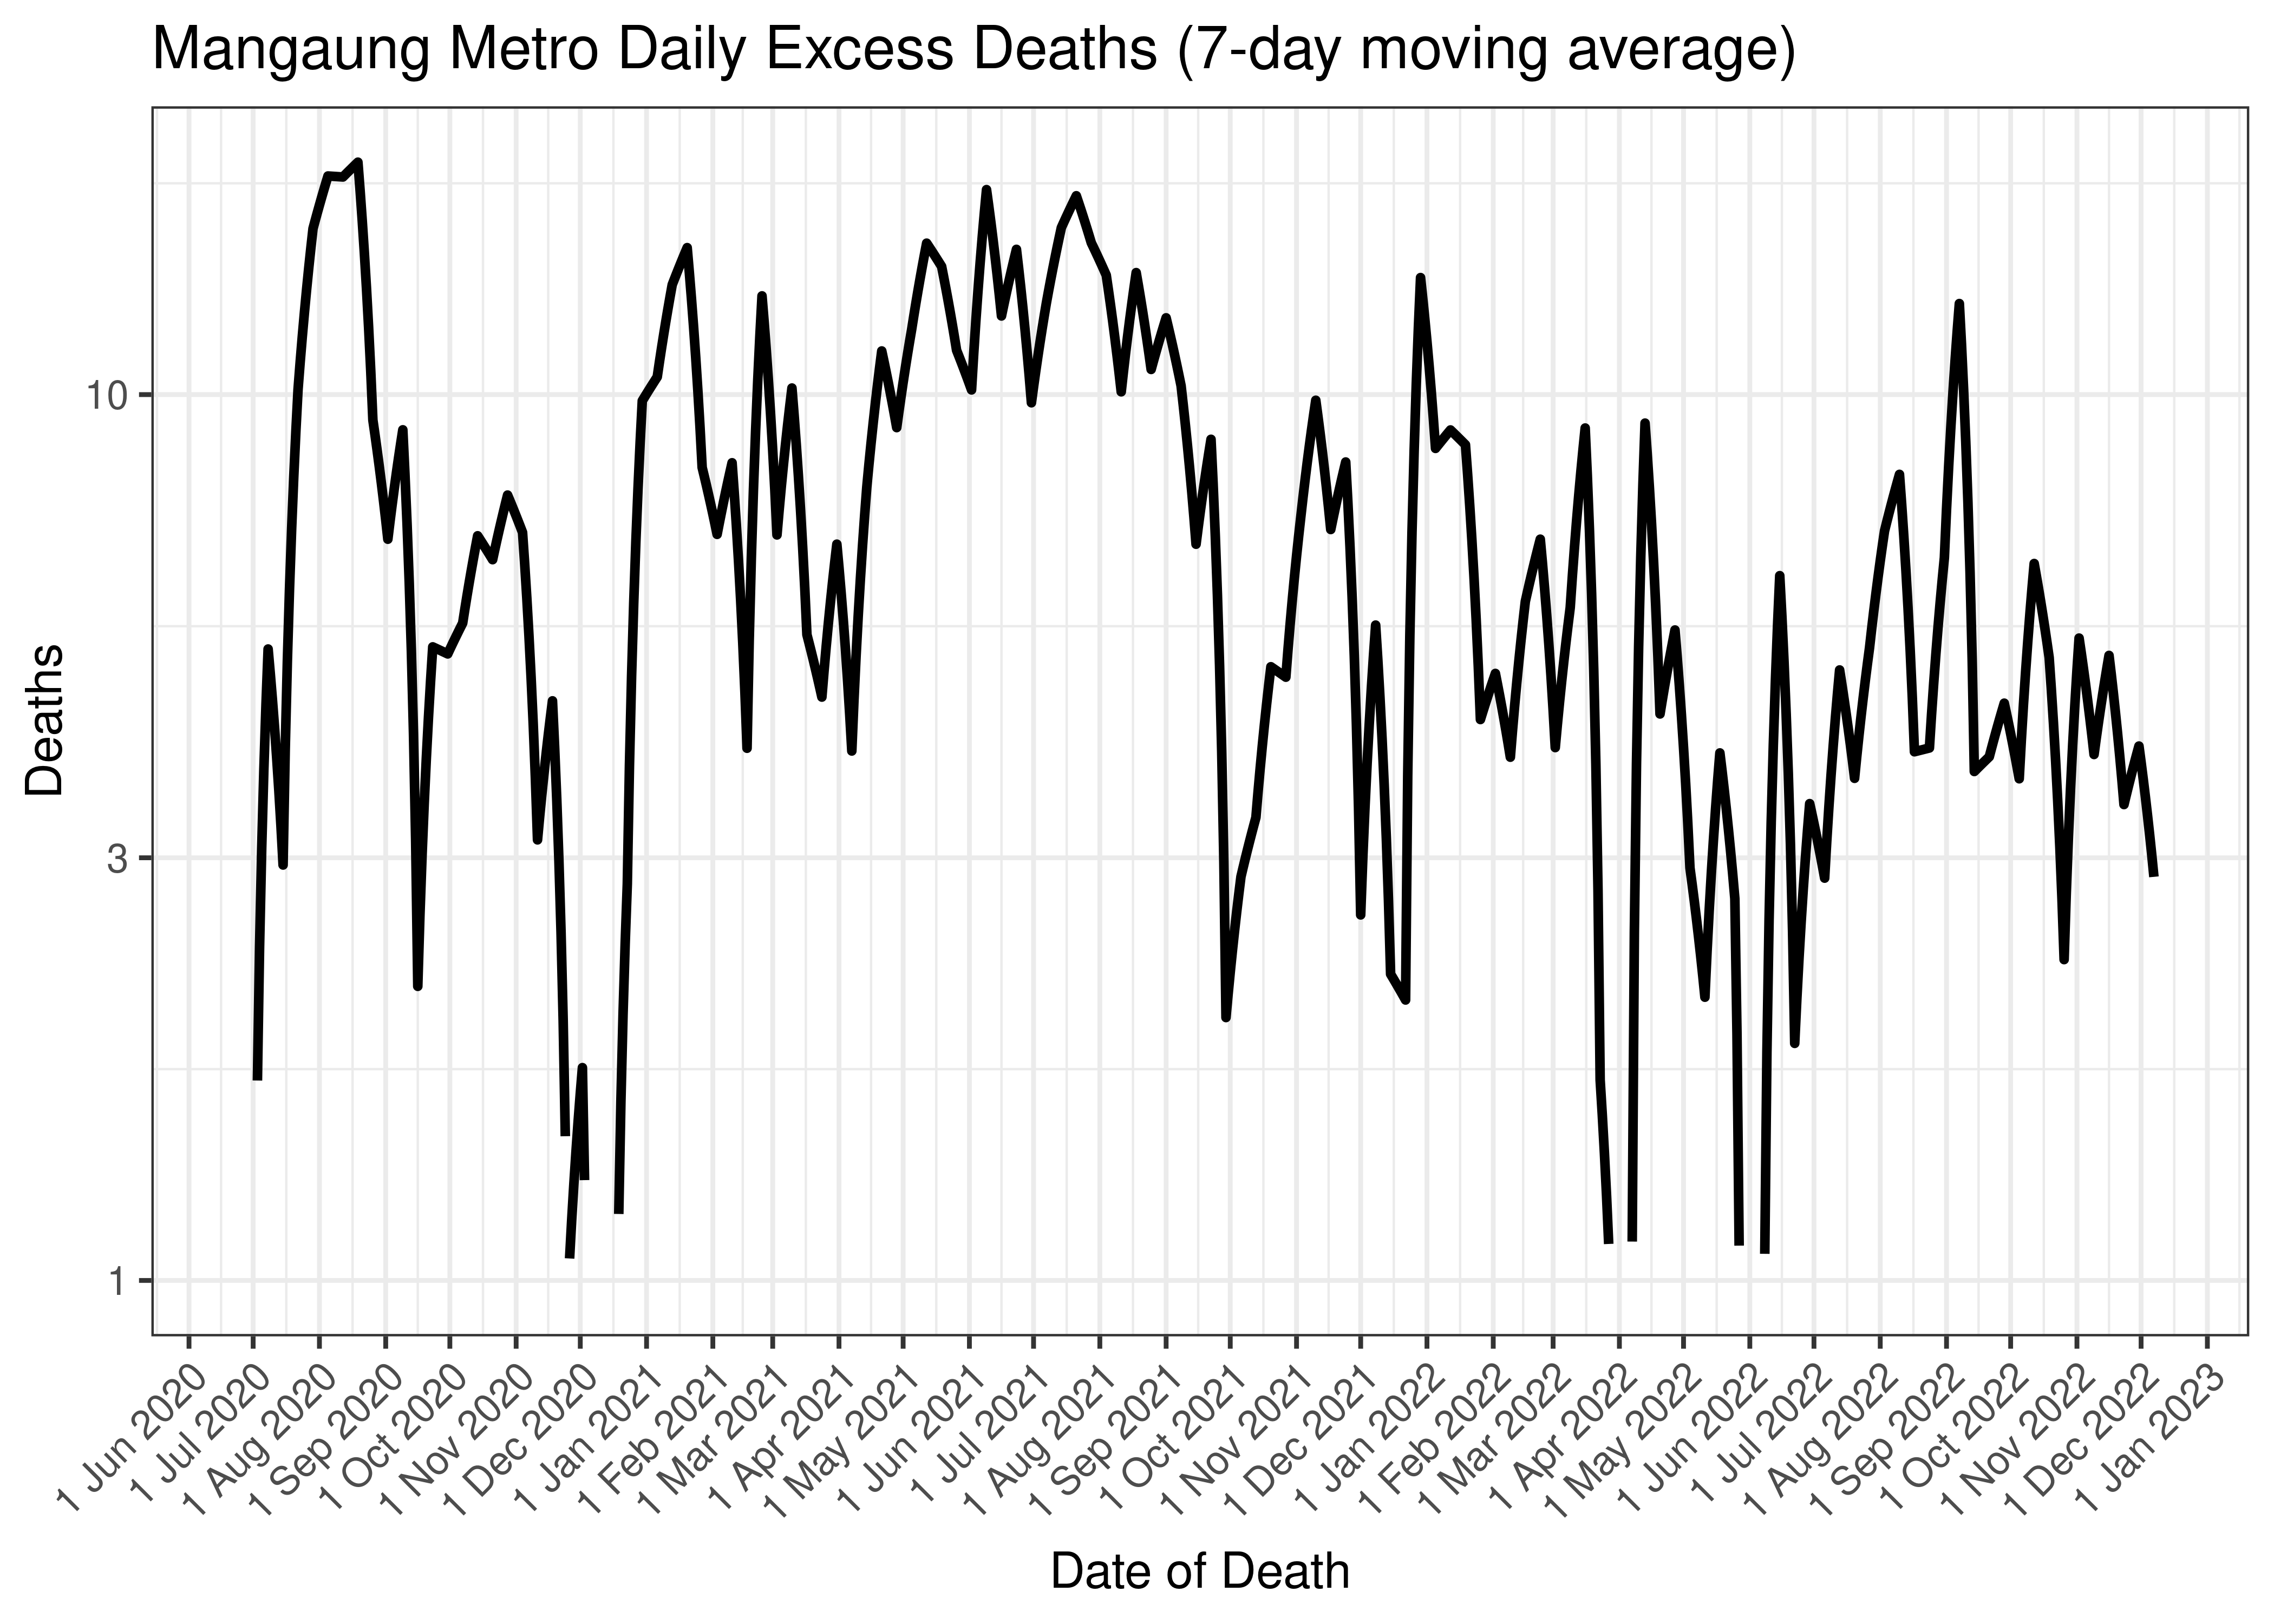
Mangaung Metro Daily Excess Deaths (7-day moving average)
Below the above chart is repeated for the last 30-days:
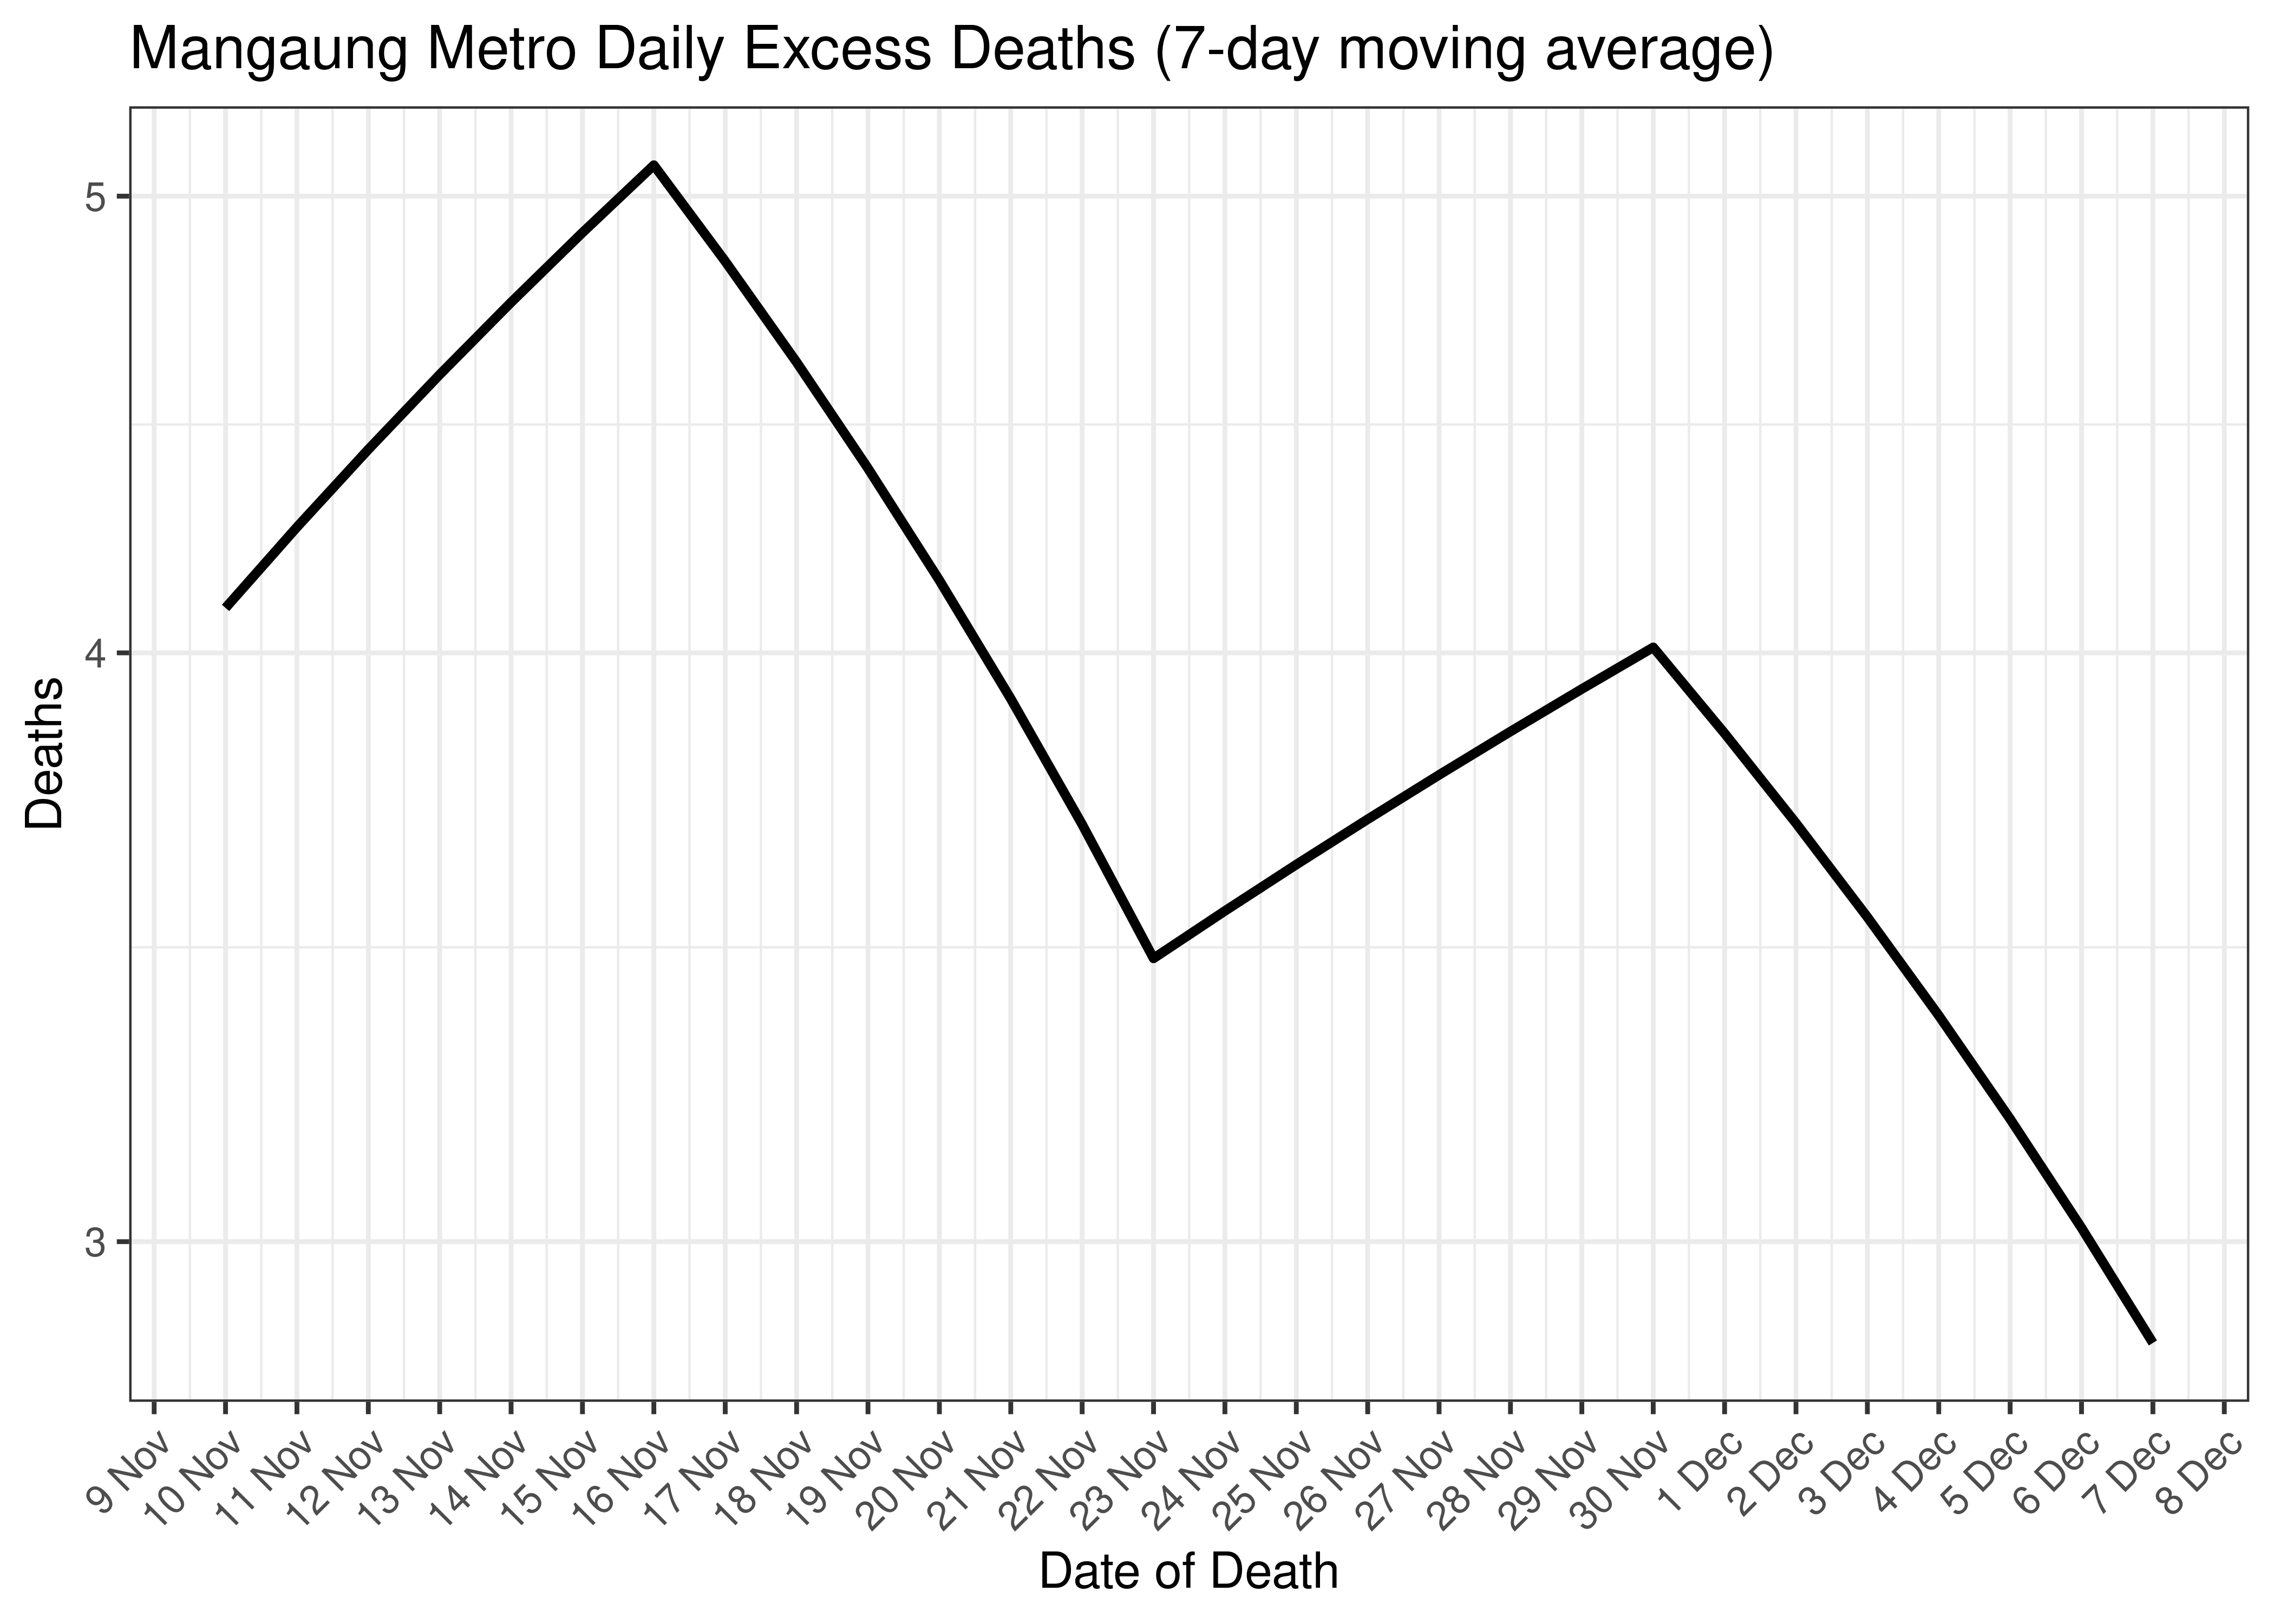
Mangaung Metro Excess Deaths for Last 30-days (7-day moving average)
6.3.10.3 Cases and Excess Deaths Combined
Below a 7-day moving average daily case count and estimated daily excess deaths are plotted for Mangaung Metro on a log scale since start of the epidemic:
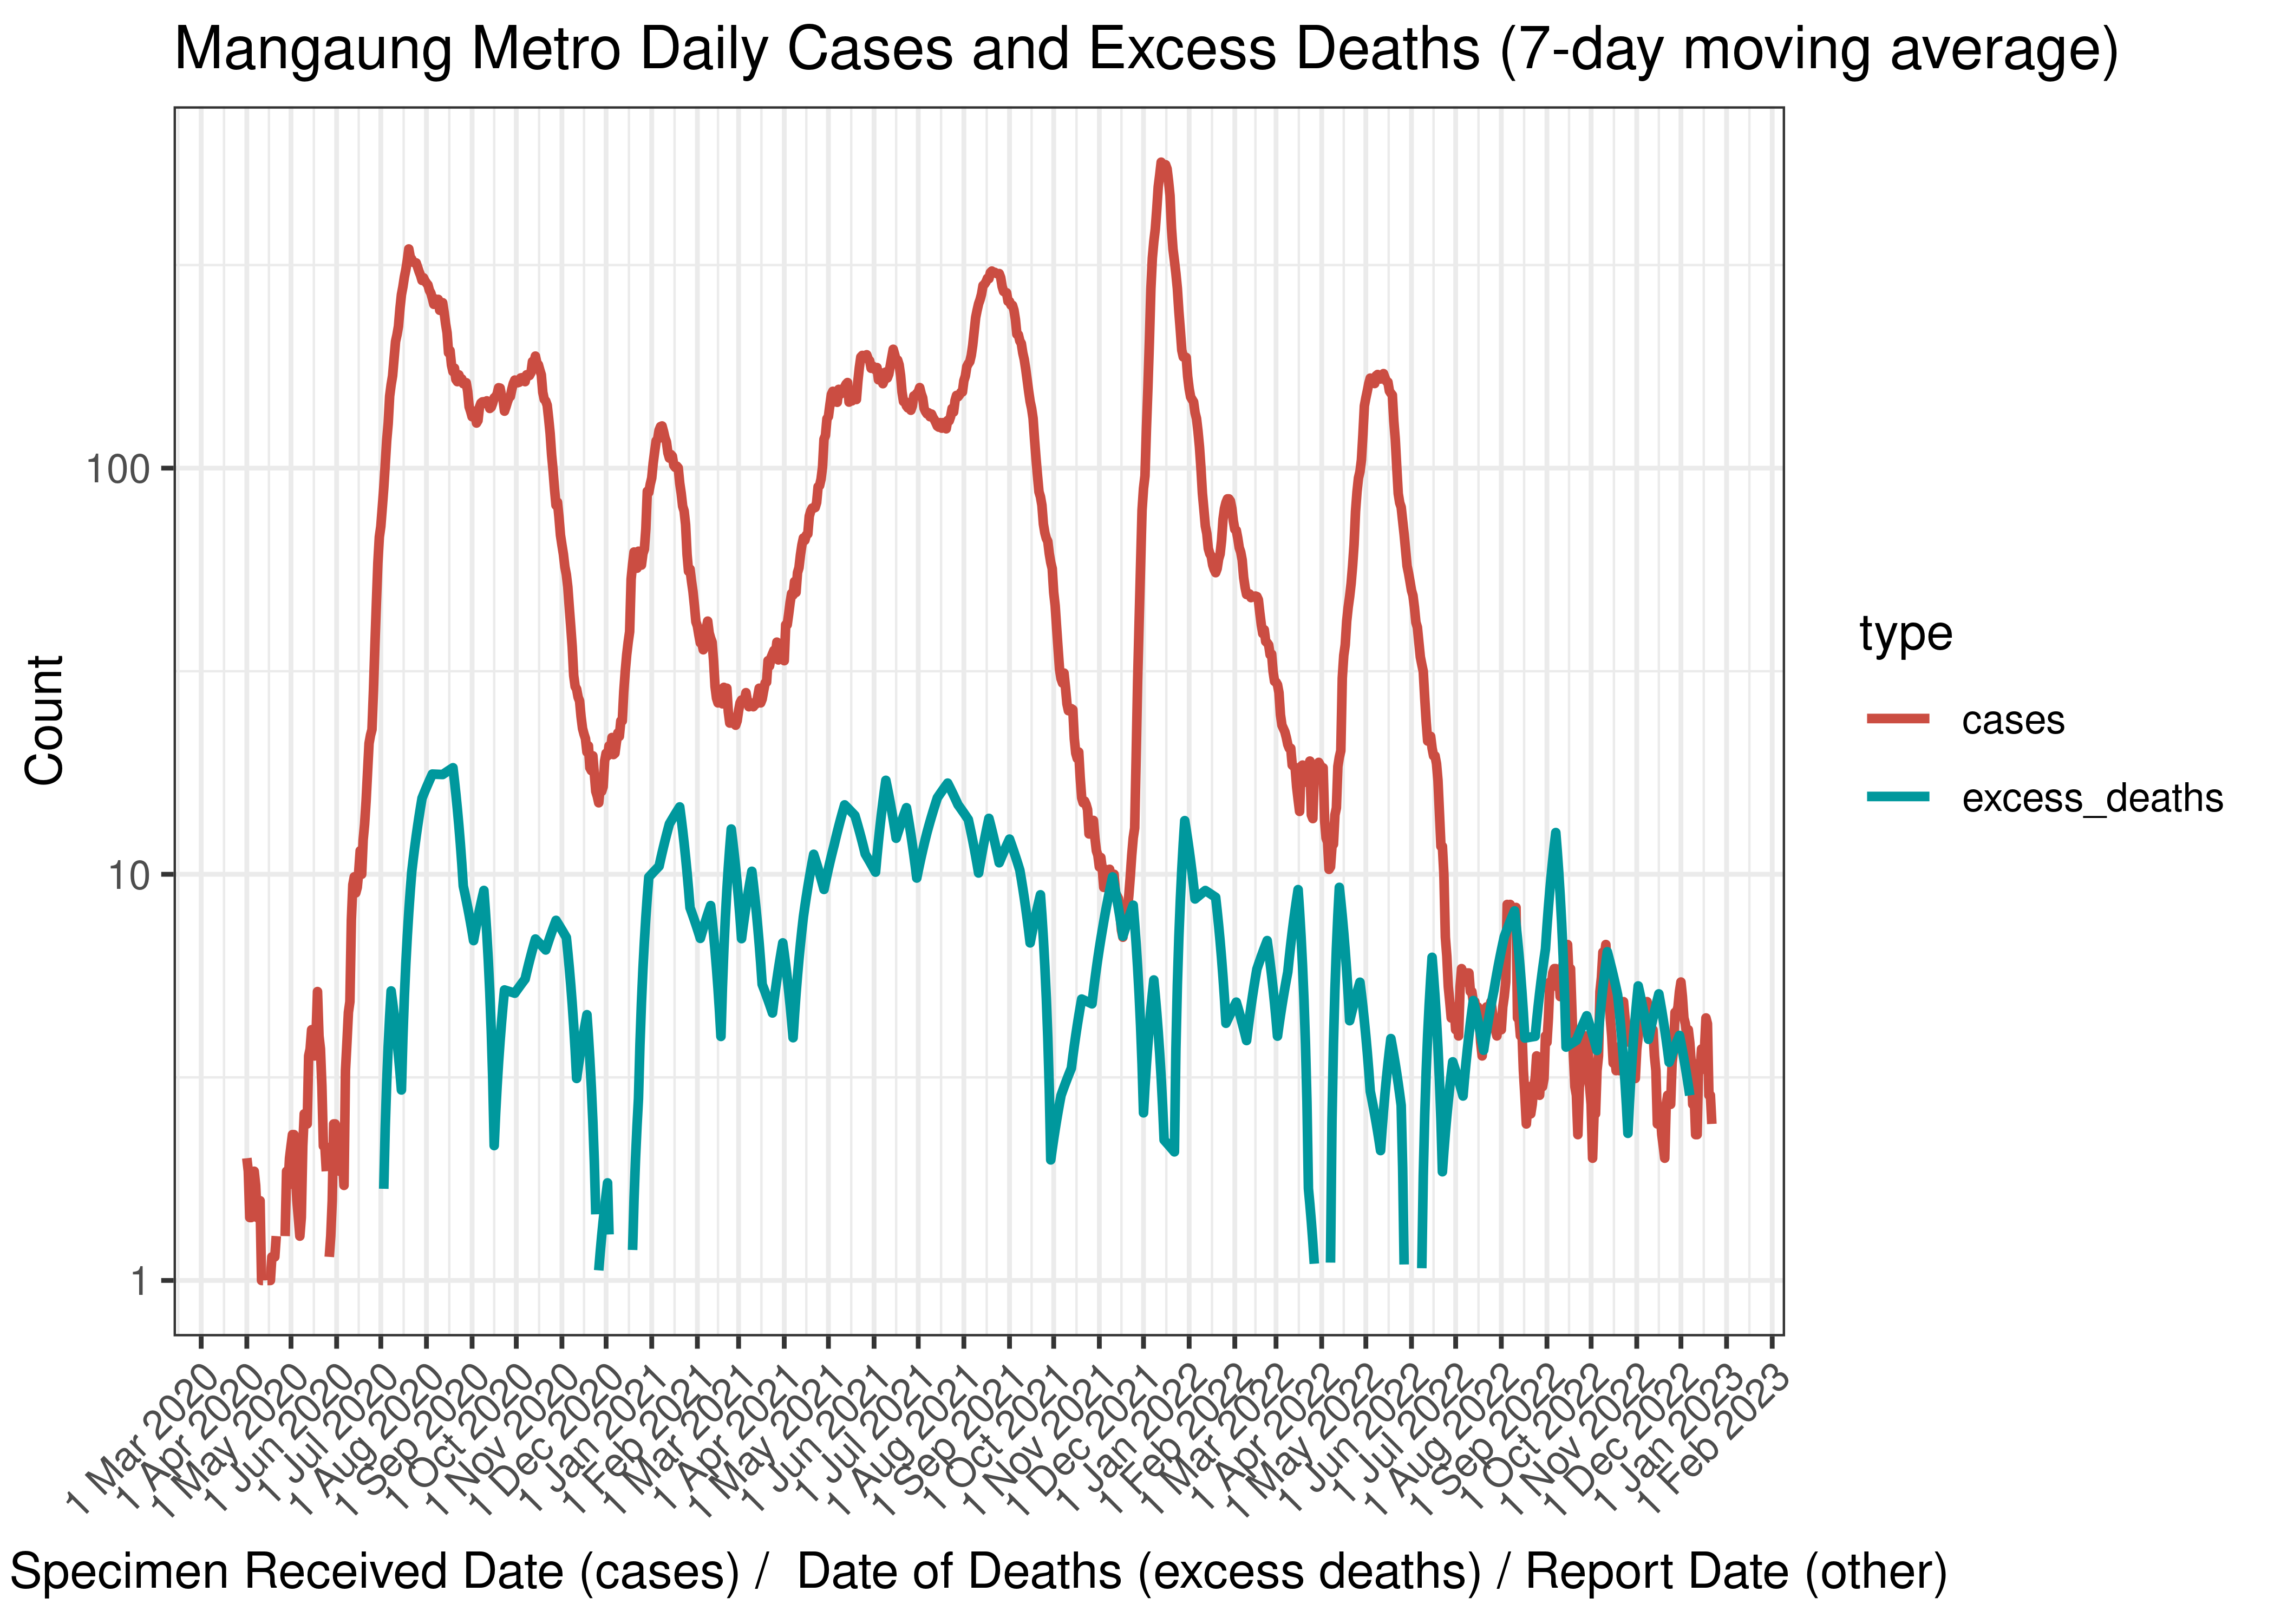
Mangaung Metro Daily Cases and Excess Deaths (7-day moving average)
Below the above chart is repeated for the last 30-days:
Mangaung Metro Daily Cases and Deaths (if available) for Last 30-days (7-day moving average)
6.3.10.4 Reproduction Number
Below current (last weekly) reproduction number estimates are tabulated for Mangaung Metro.
| Count (Per Day) | Week Ending | Reproduction Number [95% Confidence Interval] | |
|---|---|---|---|
| Mangaung Metro | 2.4 | 2022-12-25 | 0.68 [0.40 - 1.03] |
Below the effective reproduction number for Mangaung Metro over the last 90 days are plotted together with a plot since start of the pandemic.
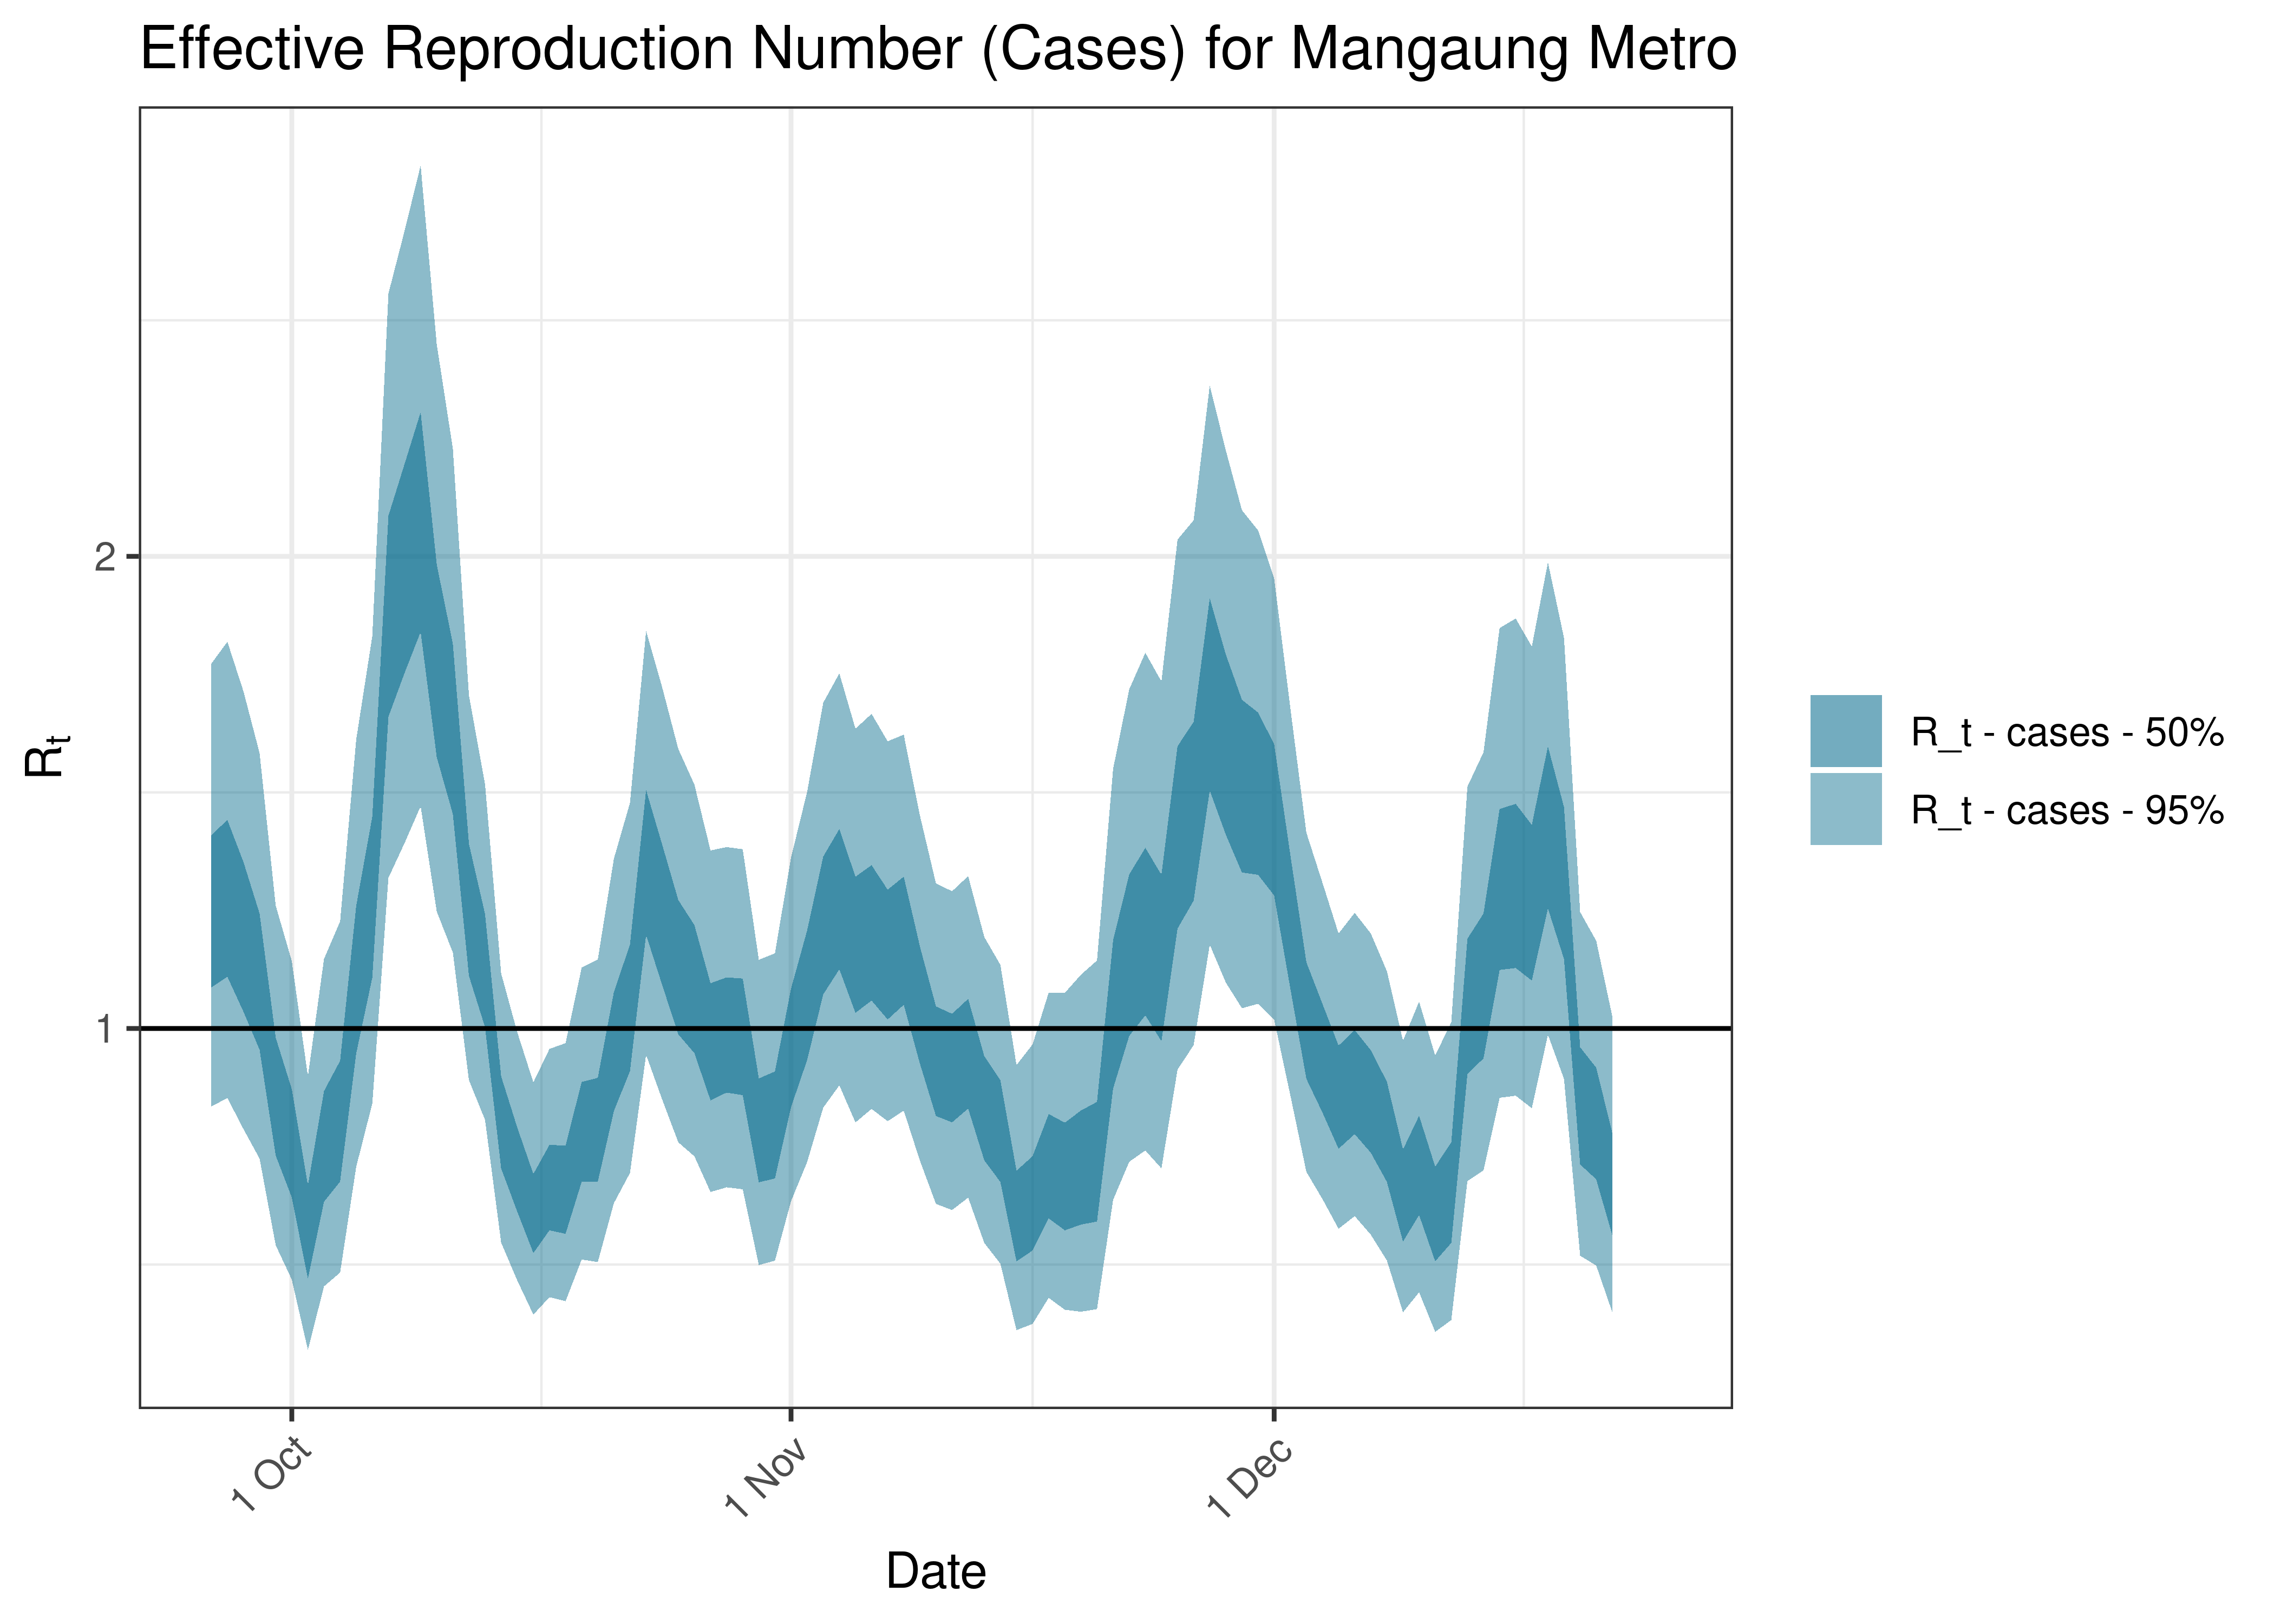
Estimated Effective Reproduction Number Based on Cases for Mangaung Metro over last 90 days
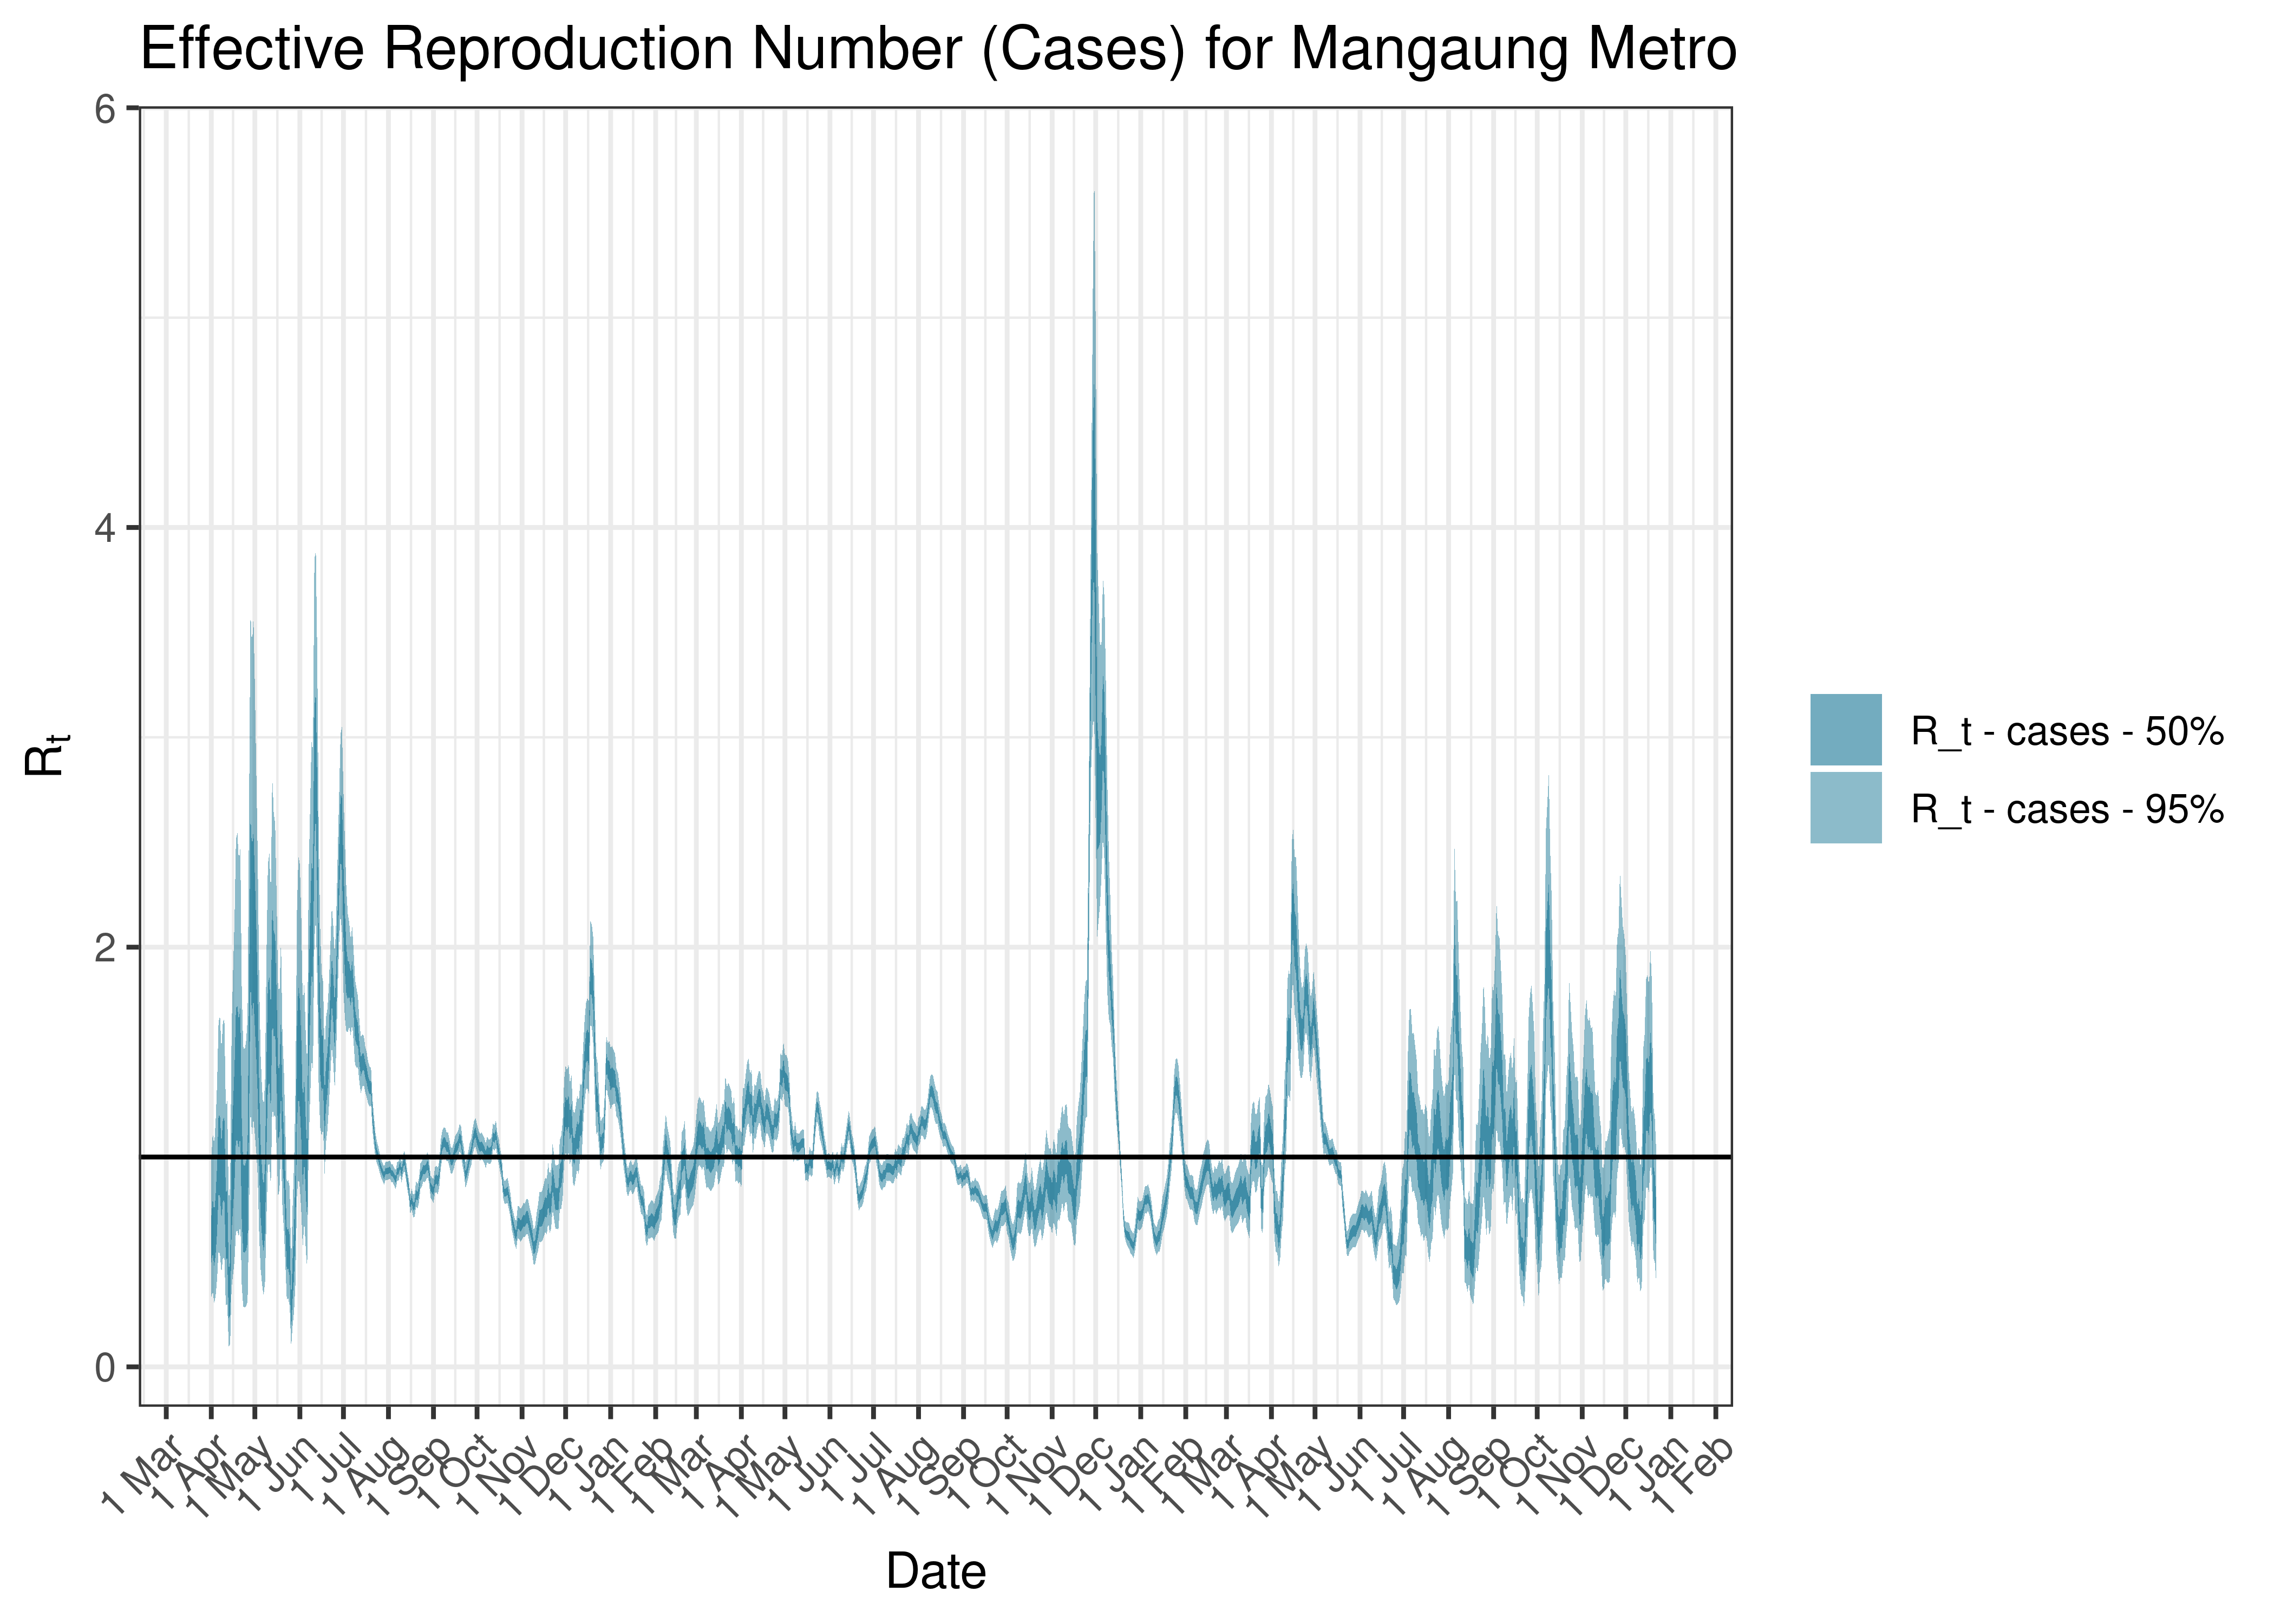
Estimated Effective Reproduction Number Based on Cases for Mangaung Metro since 1 April 2020
6.3.11 Thabo Mofutsanyane
6.3.11.1 Cases
Cases are tabulated by specimen received date below. Cases include estimates for late reporting in recent days as well as adjustments for any public holidays. A centred 7-day moving average is also shown. The peak daily cases in previous waves (as measured by the moving average) is also shown.
| Specimen Received Date | Cases | 7-day Moving Average | Comment |
|---|---|---|---|
| 2020-07-23 | 187 | 177 | Wave 1 Peak |
| 2021-01-14 | 165 | 168 | Wave 2 Peak |
| 2021-08-23 | 148 | 147 | Wave 3 Peak |
| 2021-12-12 | 71 | 242 | Wave 4 Peak |
| 2022-05-07 | 14 | 59 | Wave 5 Peak (to date) |
Below a 7-day moving average daily case count are plotted for Thabo Mofutsanyane on a log scale since start of the epidemic:
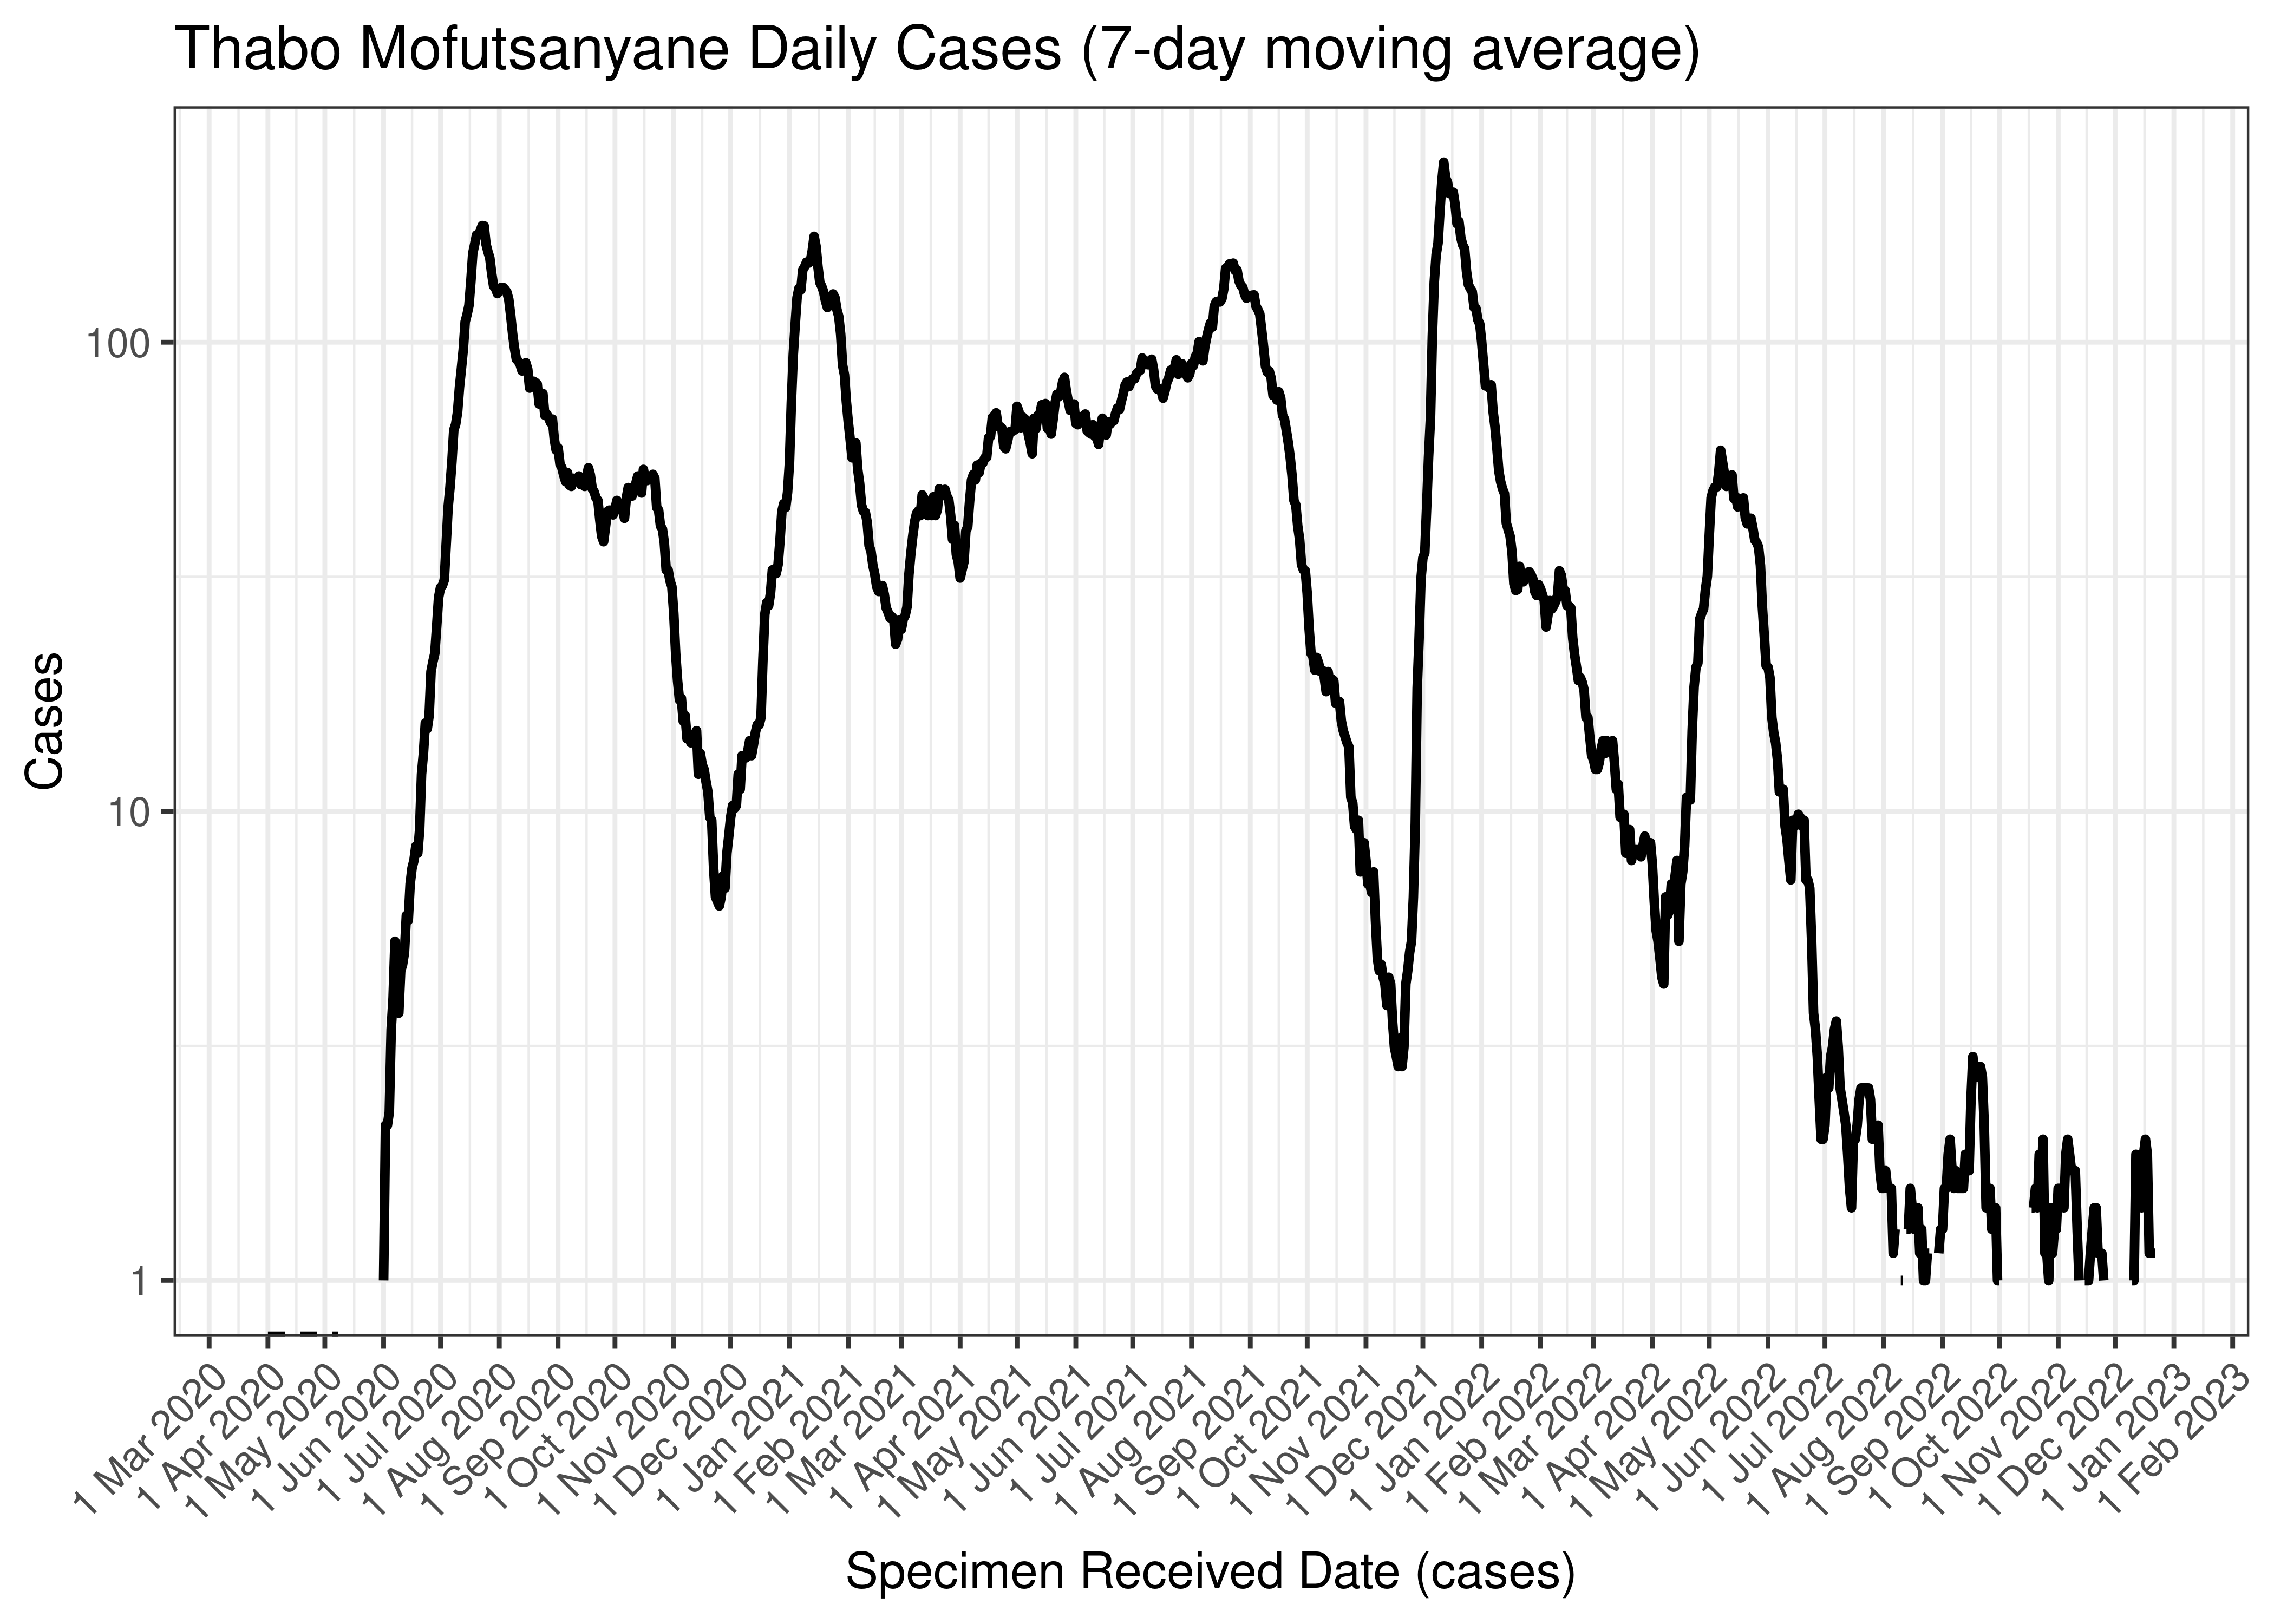
Thabo Mofutsanyane Daily Cases (7-day moving average)
Below the above chart is repeated for the last 30-days:
Thabo Mofutsanyane Daily Cases for Last 30-days (7-day moving average)
6.3.11.2 Reproduction Number
Below current (last weekly) reproduction number estimates are tabulated for Thabo Mofutsanyane.
| Count (Per Day) | Week Ending | Reproduction Number [95% Confidence Interval] | |
|---|---|---|---|
| Thabo Mofutsanyane | 1.1 | 2022-12-25 | 0.79 [0.36 - 1.39] |
Below the effective reproduction number for Thabo Mofutsanyane over the last 90 days are plotted together with a plot since start of the pandemic.
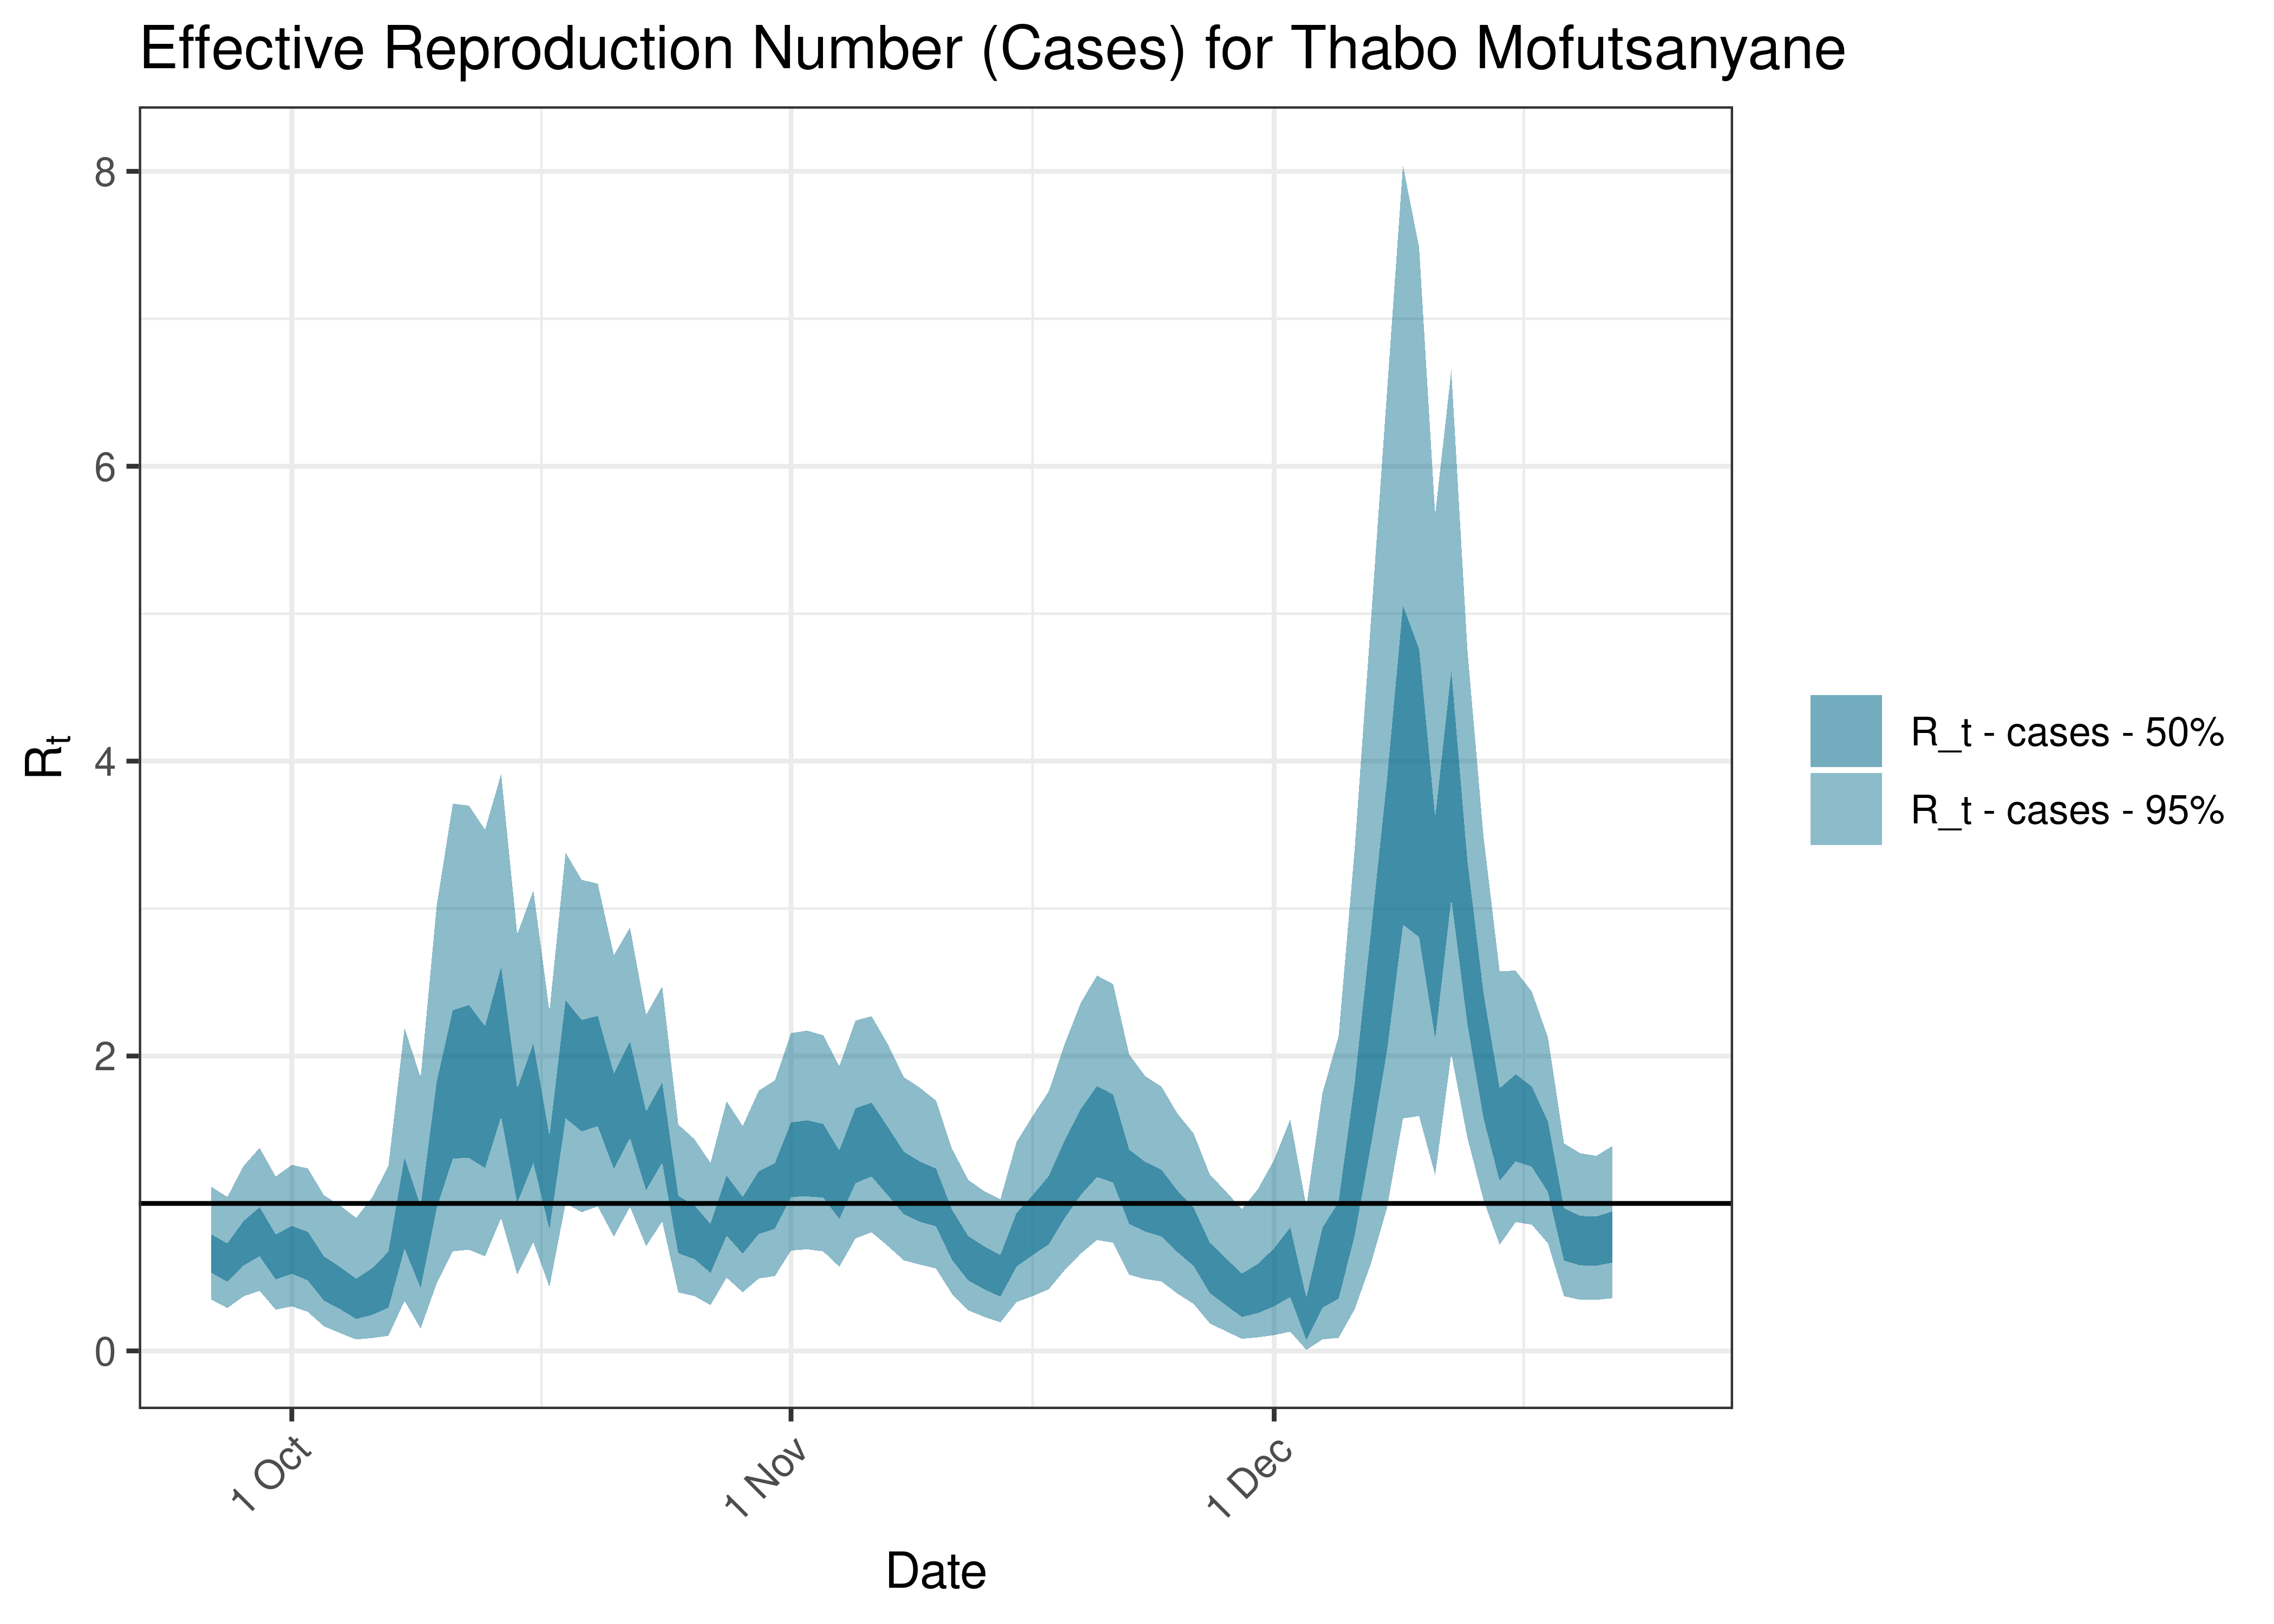
Estimated Effective Reproduction Number Based on Cases for Thabo Mofutsanyane over last 90 days
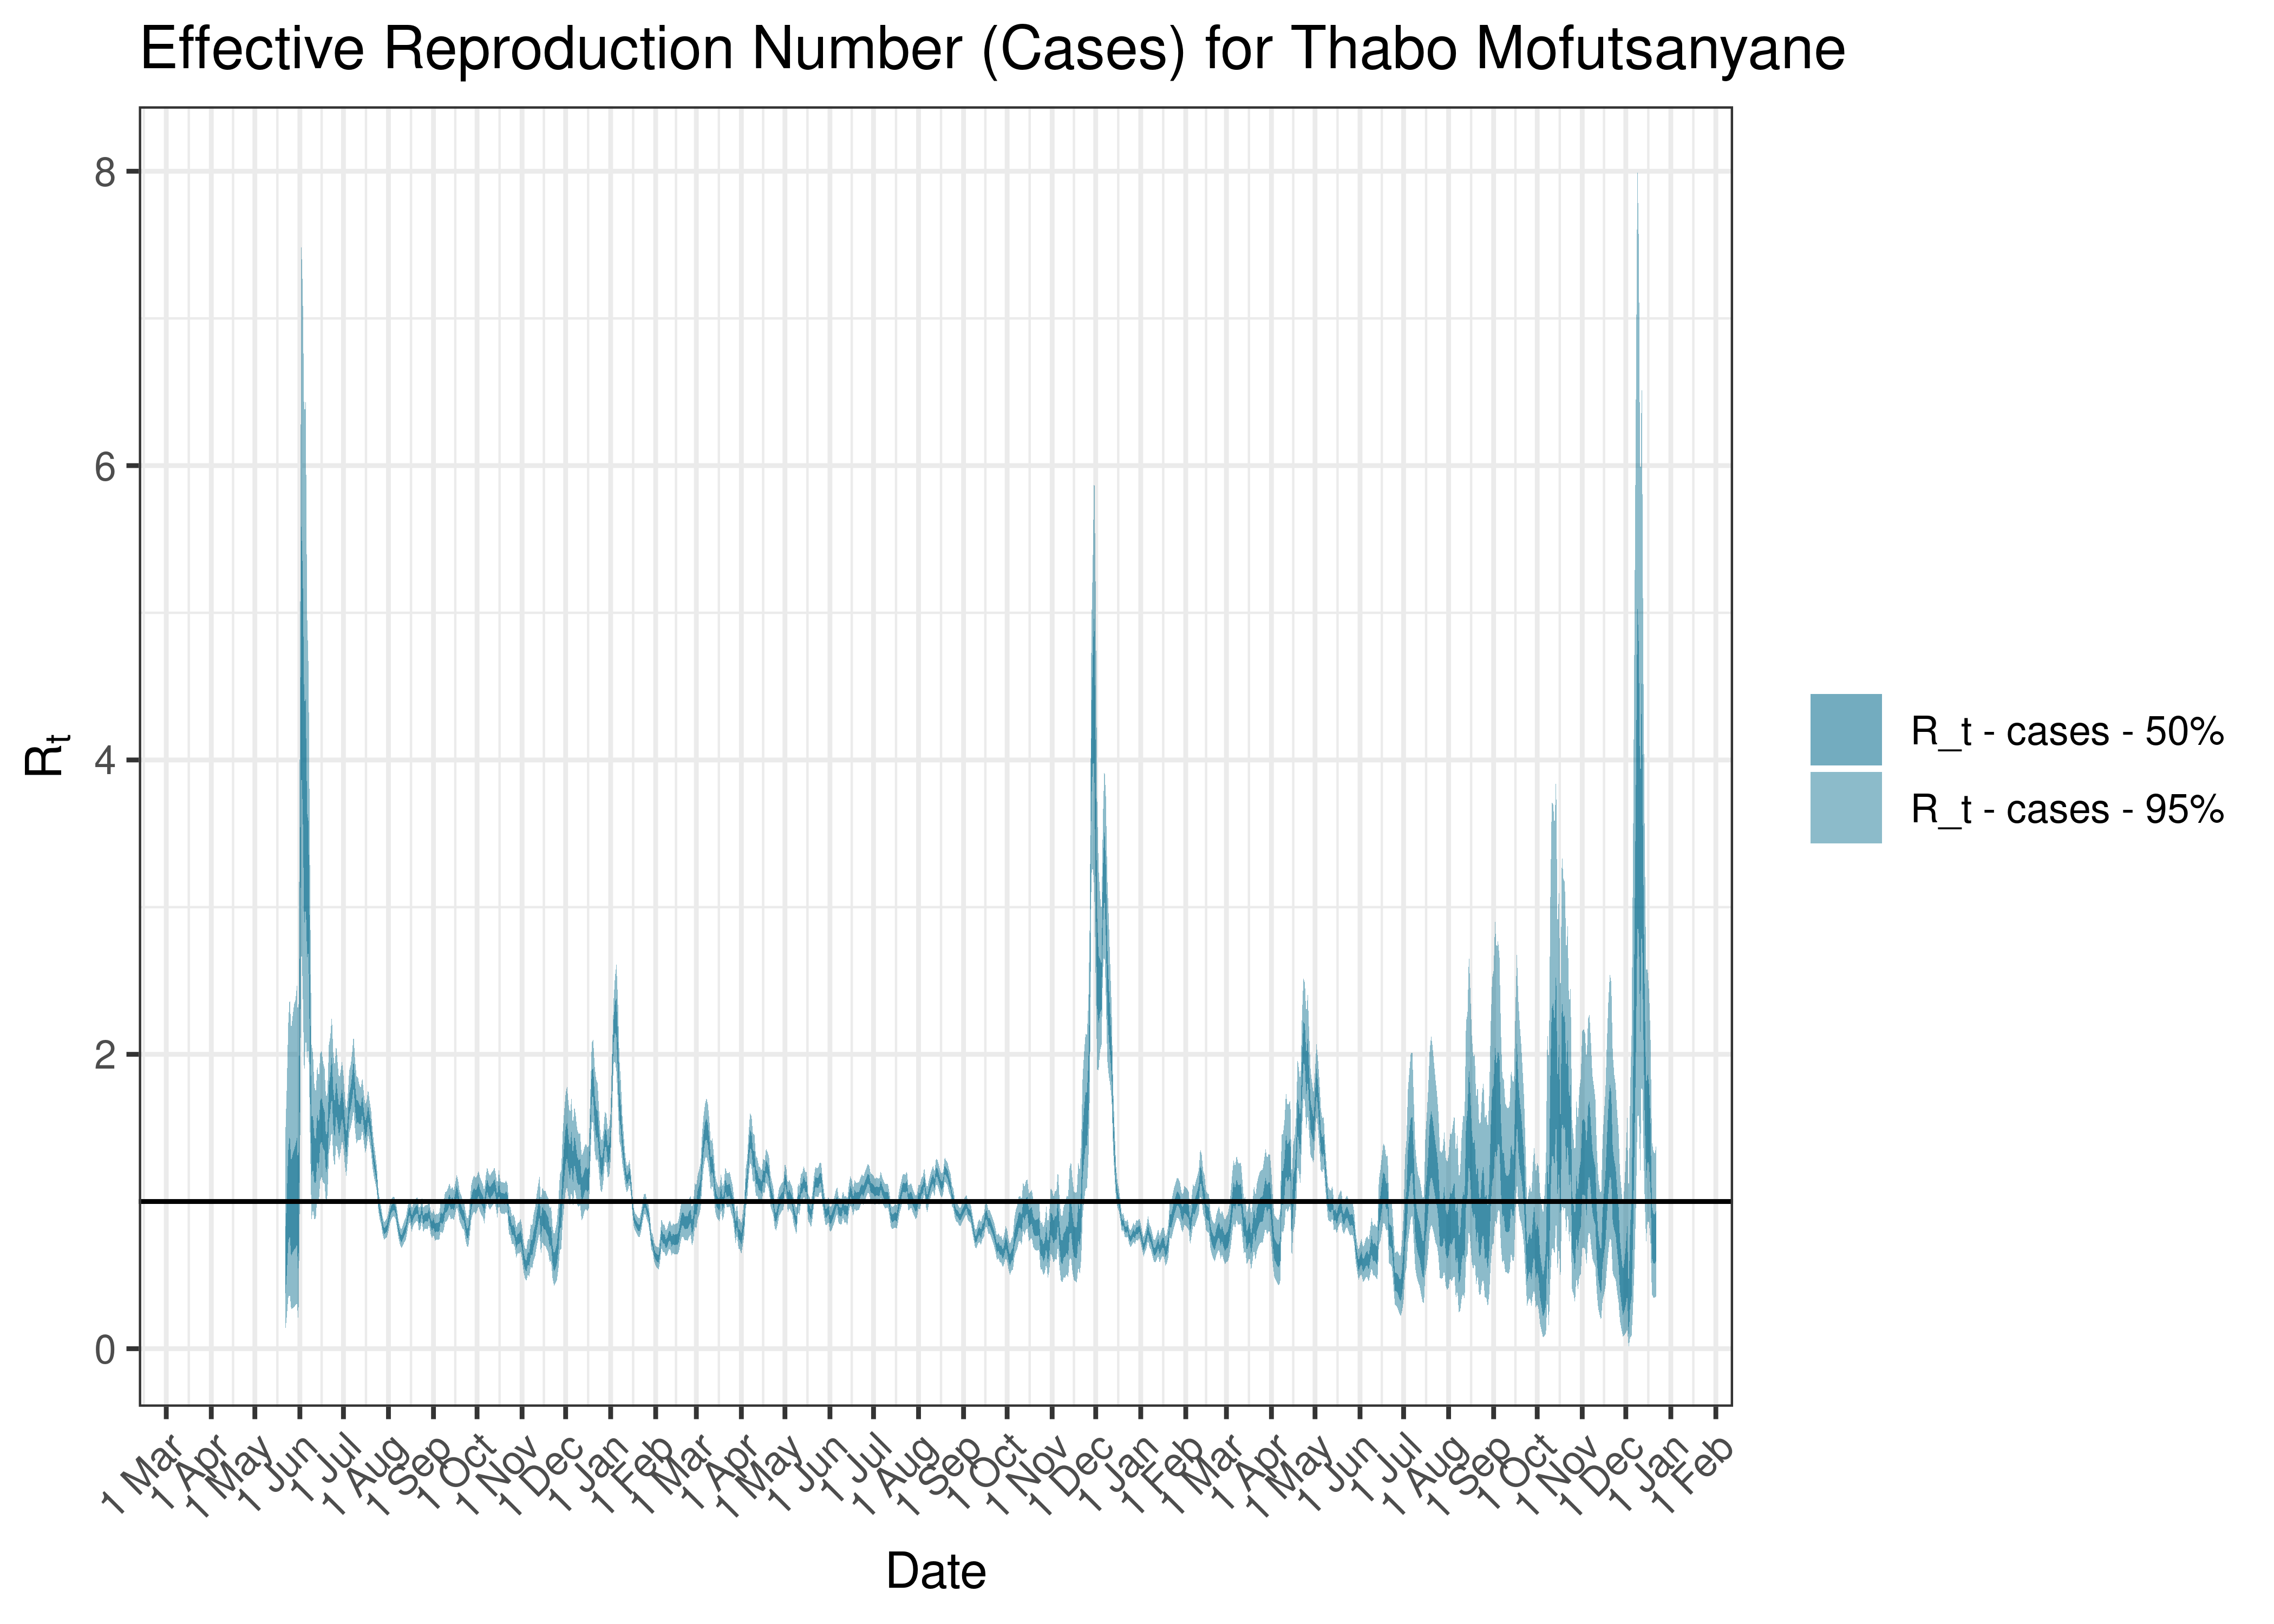
Estimated Effective Reproduction Number Based on Cases for Thabo Mofutsanyane since 1 April 2020
6.3.12 Xhariep
6.3.12.1 Cases
Cases are tabulated by specimen received date below. Cases include estimates for late reporting in recent days as well as adjustments for any public holidays. A centred 7-day moving average is also shown. The peak daily cases in previous waves (as measured by the moving average) is also shown.
| Specimen Received Date | Cases | 7-day Moving Average | Comment |
|---|---|---|---|
| 2020-09-20 | 33 | 39 | Wave 1 Peak |
| 2020-10-14 | 77 | 46 | Wave 2 Peak |
| 2021-08-27 | 49 | 53 | Wave 3 Peak |
| 2021-12-12 | 7 | 76 | Wave 4 Peak |
| 2022-05-10 | 28 | 18 | Wave 5 Peak (to date) |
Below a 7-day moving average daily case count are plotted for Xhariep on a log scale since start of the epidemic:
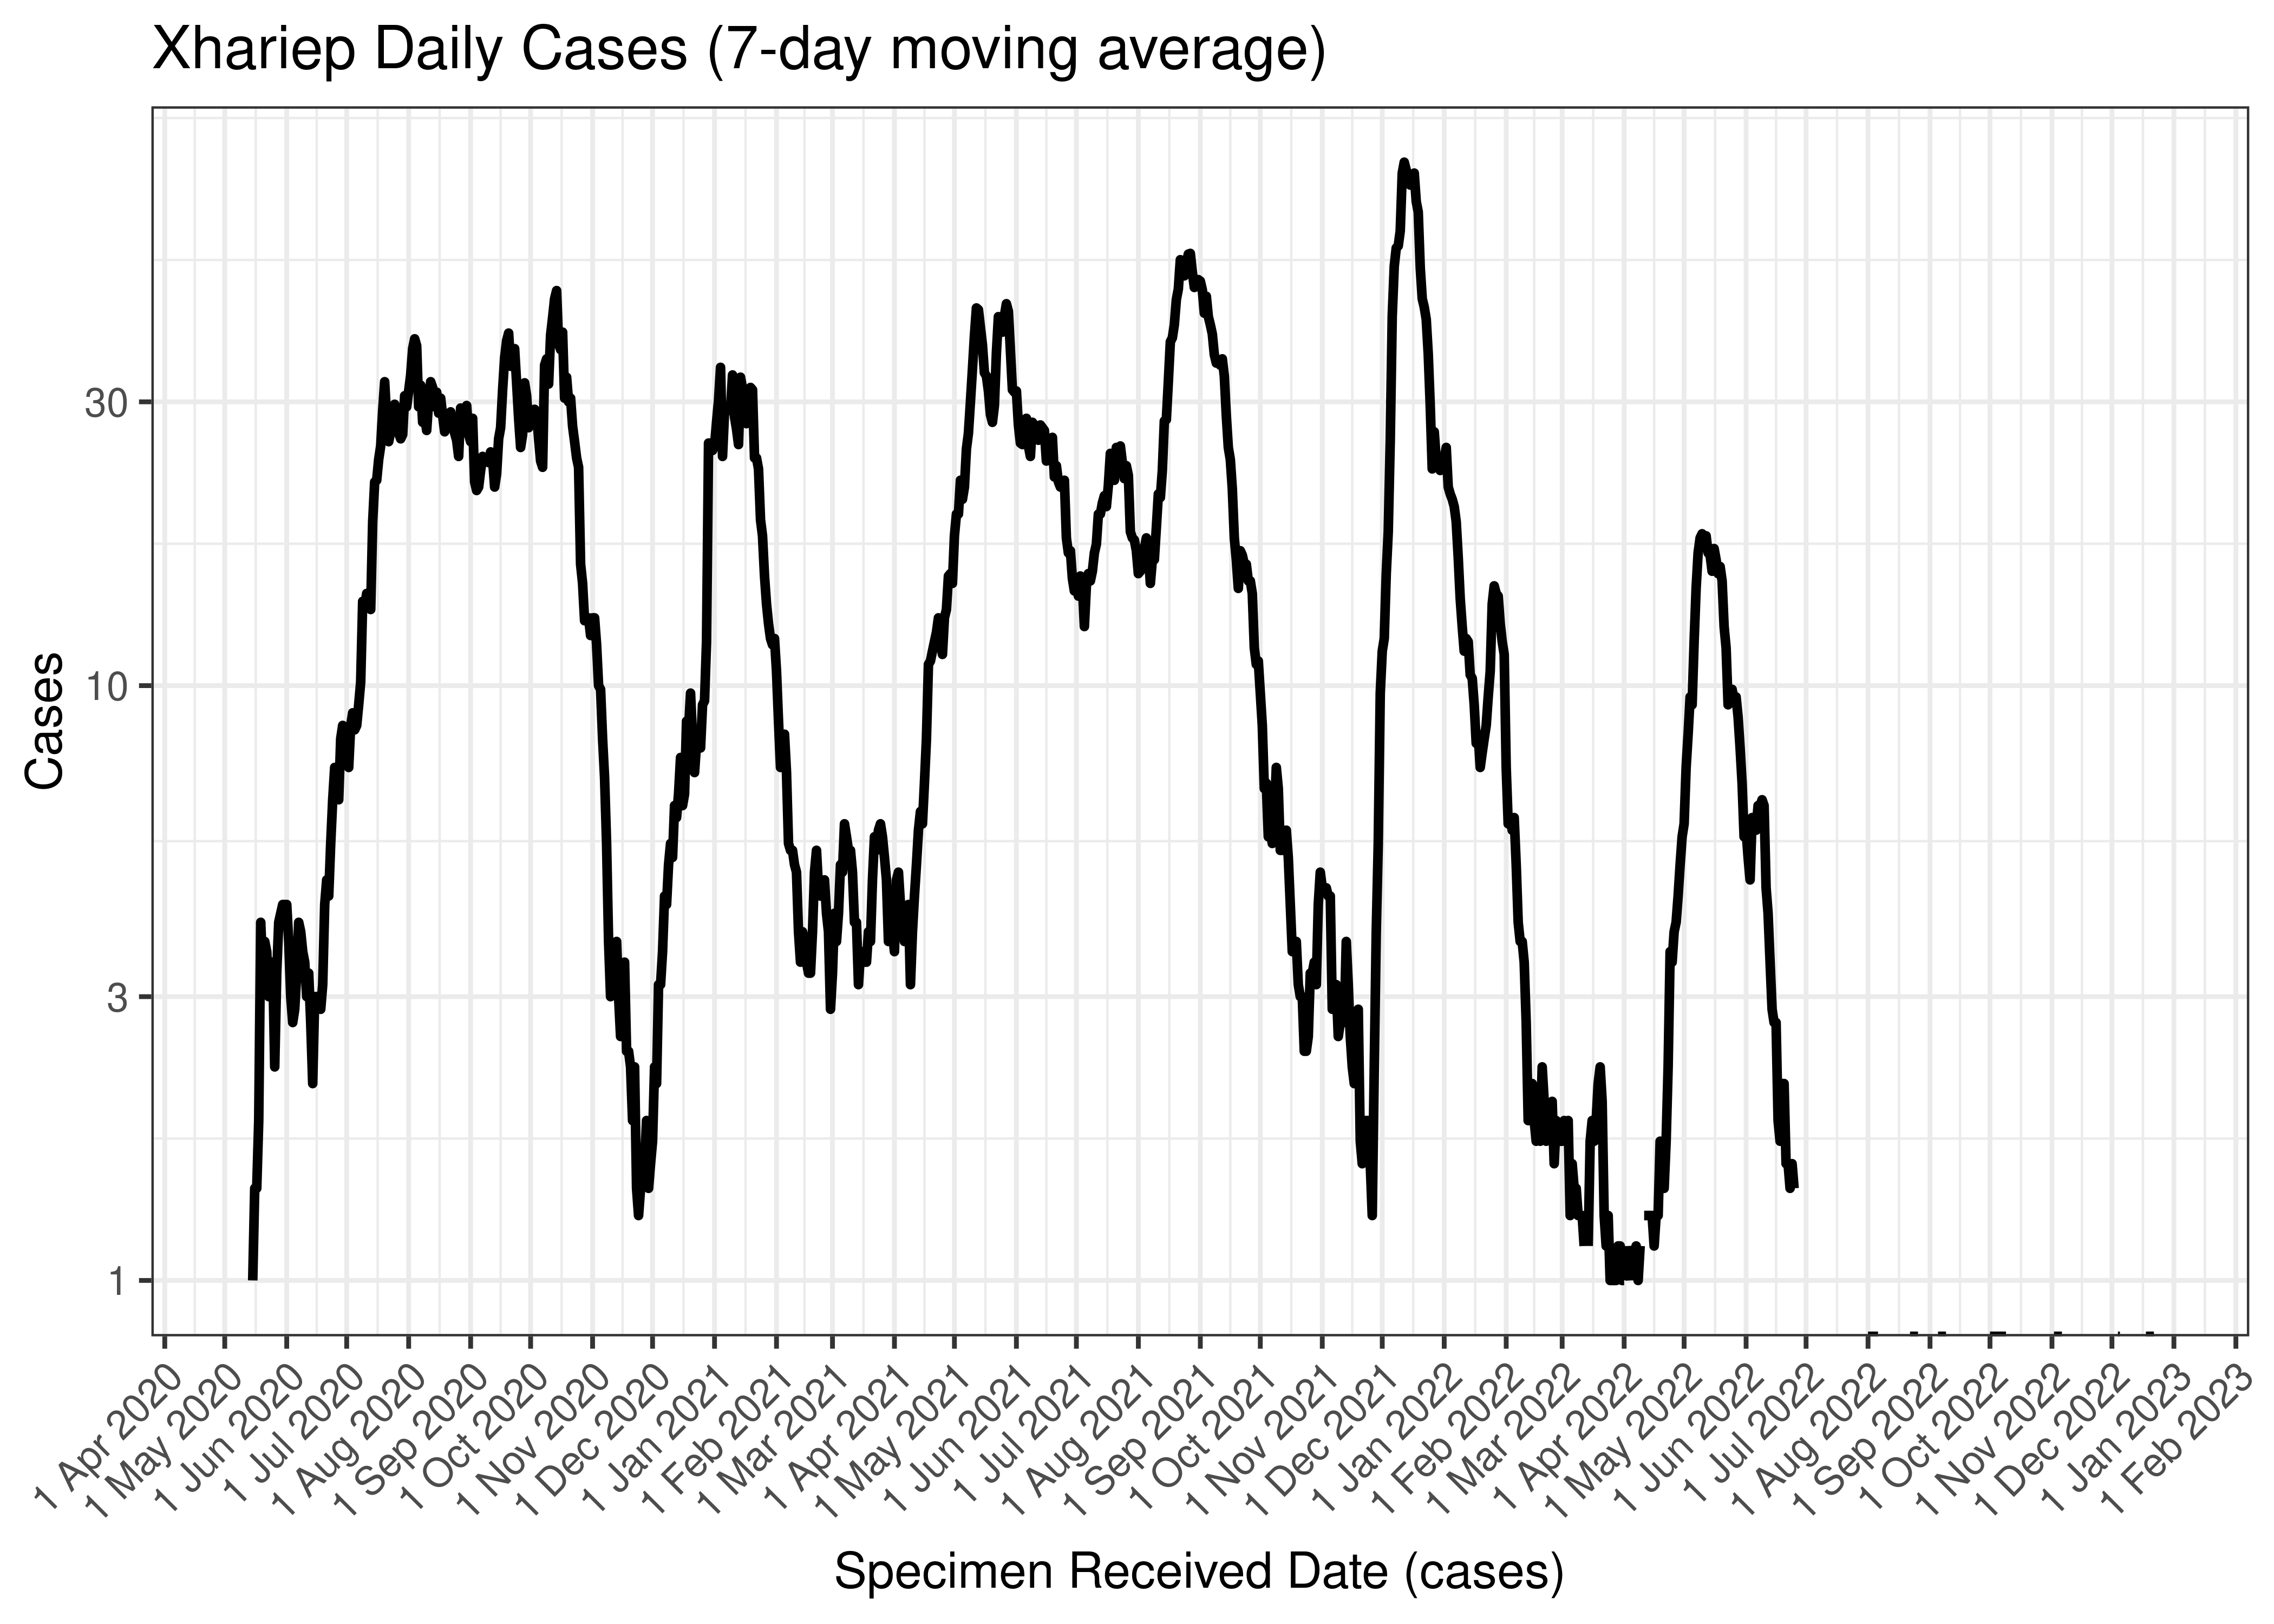
Xhariep Daily Cases (7-day moving average)
Below the above chart is repeated for the last 30-days:

Xhariep Daily Cases for Last 30-days (7-day moving average)
6.3.12.2 Reproduction Number
Below current (last weekly) reproduction number estimates are tabulated for Xhariep.
| Count (Per Day) | Week Ending | Reproduction Number [95% Confidence Interval] | |
|---|---|---|---|
| Xhariep | 0 | 2022-12-25 | 0.83 [0.02 - 3.10] |
Below the effective reproduction number for Xhariep over the last 90 days are plotted together with a plot since start of the pandemic.
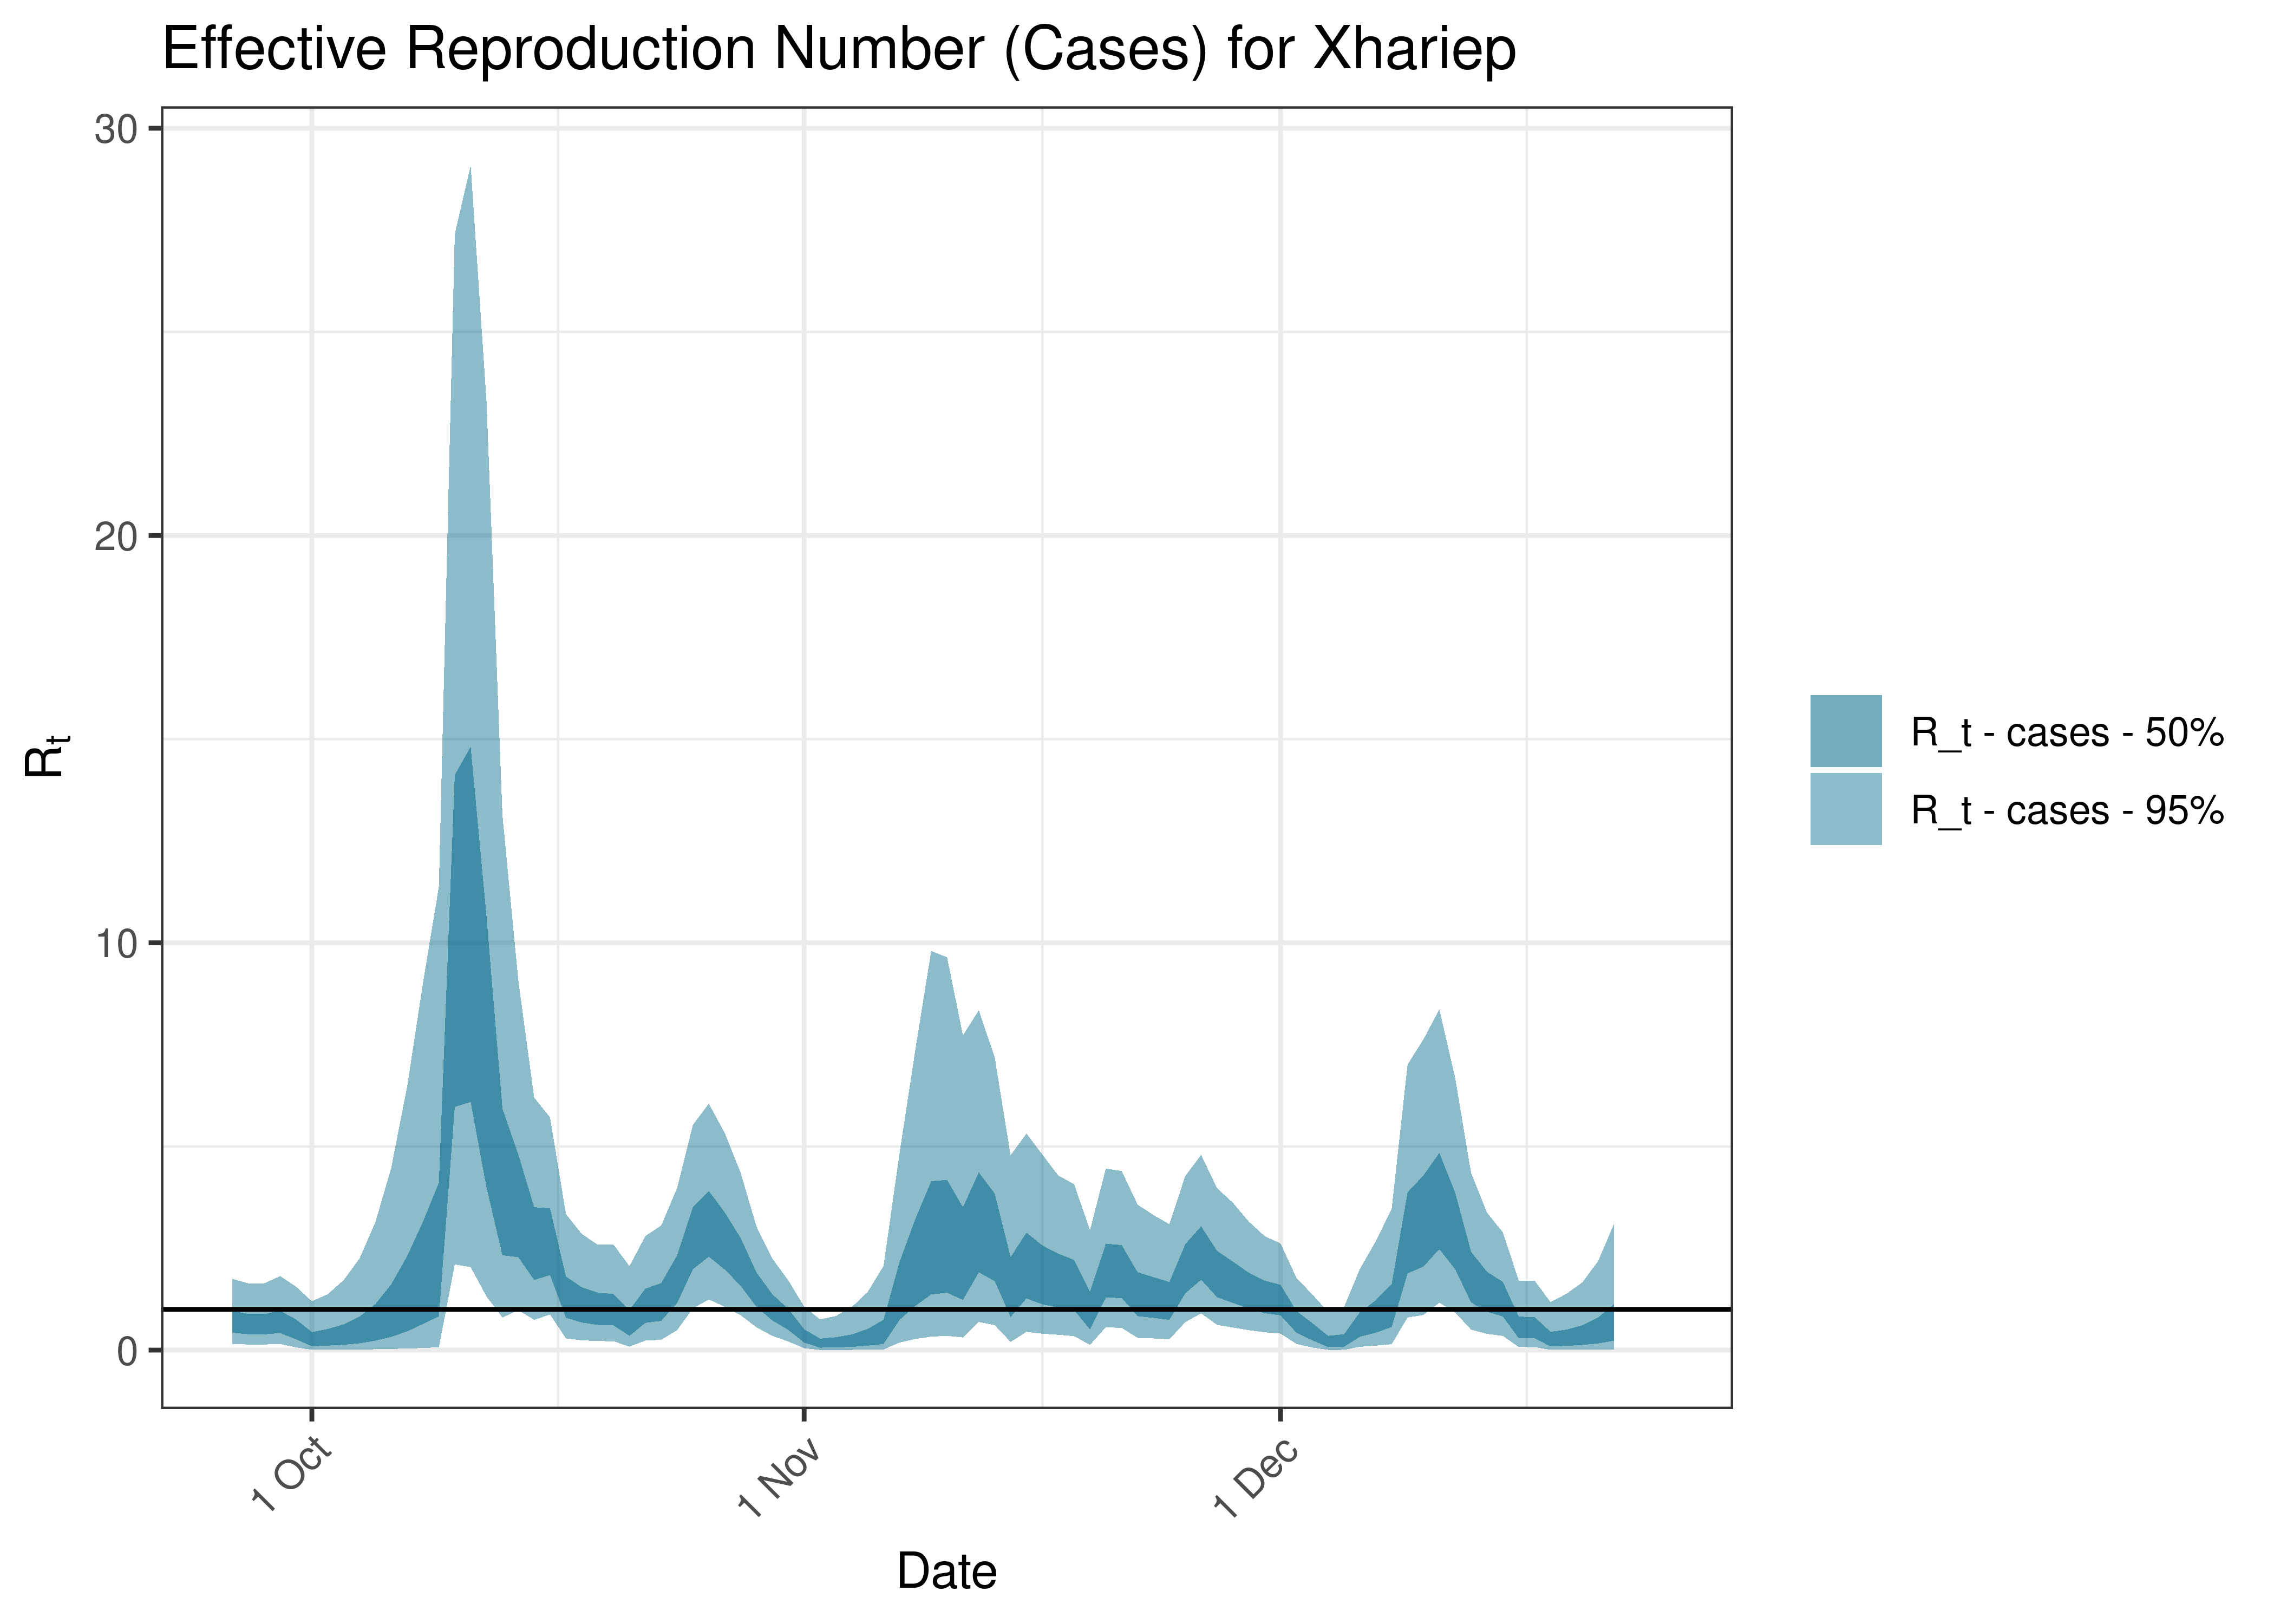
Estimated Effective Reproduction Number Based on Cases for Xhariep over last 90 days
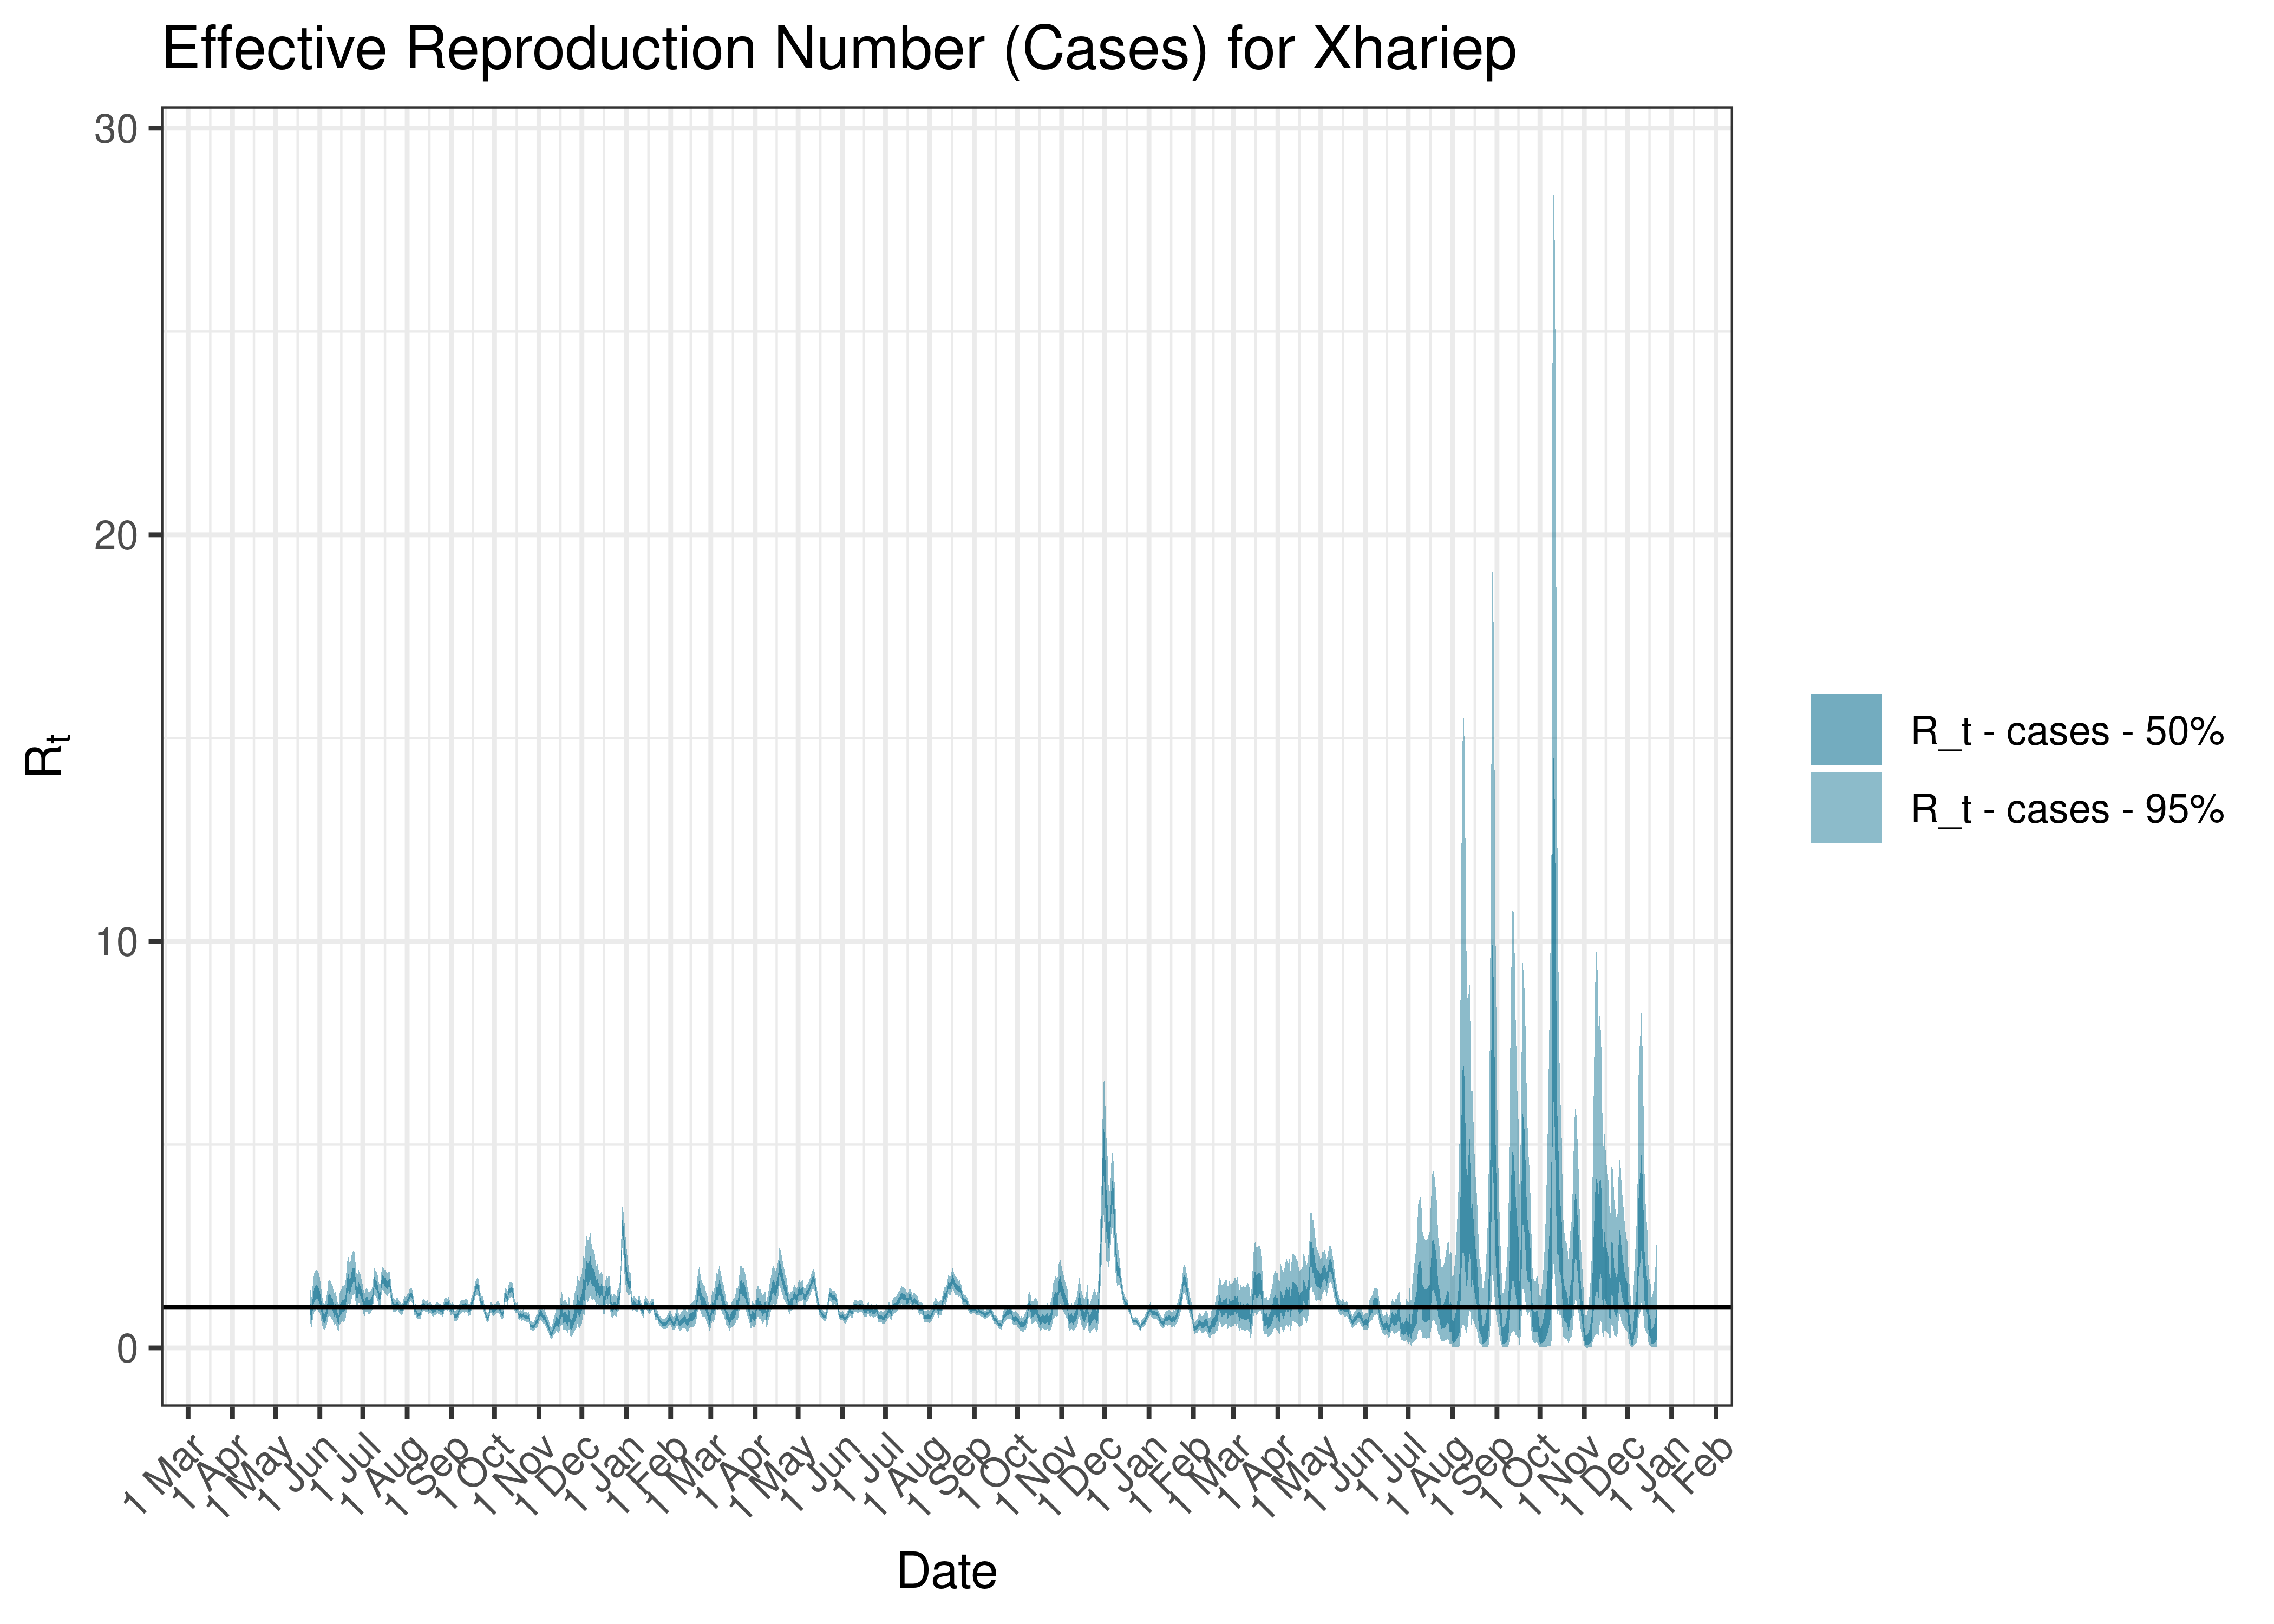
Estimated Effective Reproduction Number Based on Cases for Xhariep since 1 April 2020
6.4 Gauteng
6.4.1 Cases
Cases are tabulated by specimen received date below. Cases include estimates for late reporting in recent days as well as adjustments for any public holidays. A centred 7-day moving average is also shown. The peak daily cases in previous waves (as measured by the moving average) is also shown.
| Specimen Received Date | Cases | 7-day Moving Average | Comment |
|---|---|---|---|
| 2020-07-10 | 5,681 | 4,761 | Wave 1 Peak |
| 2021-01-06 | 6,186 | 5,282 | Wave 2 Peak |
| 2021-06-30 | 14,515 | 11,252 | Wave 3 Peak |
| 2021-12-06 | 11,793 | 10,120 | Wave 4 Peak |
| 2022-05-06 | 3,323 | 3,122 | Wave 5 Peak (to date) |
Below a 7-day moving average daily case count is plotted for Gauteng on a log scale since start of the epidemic:
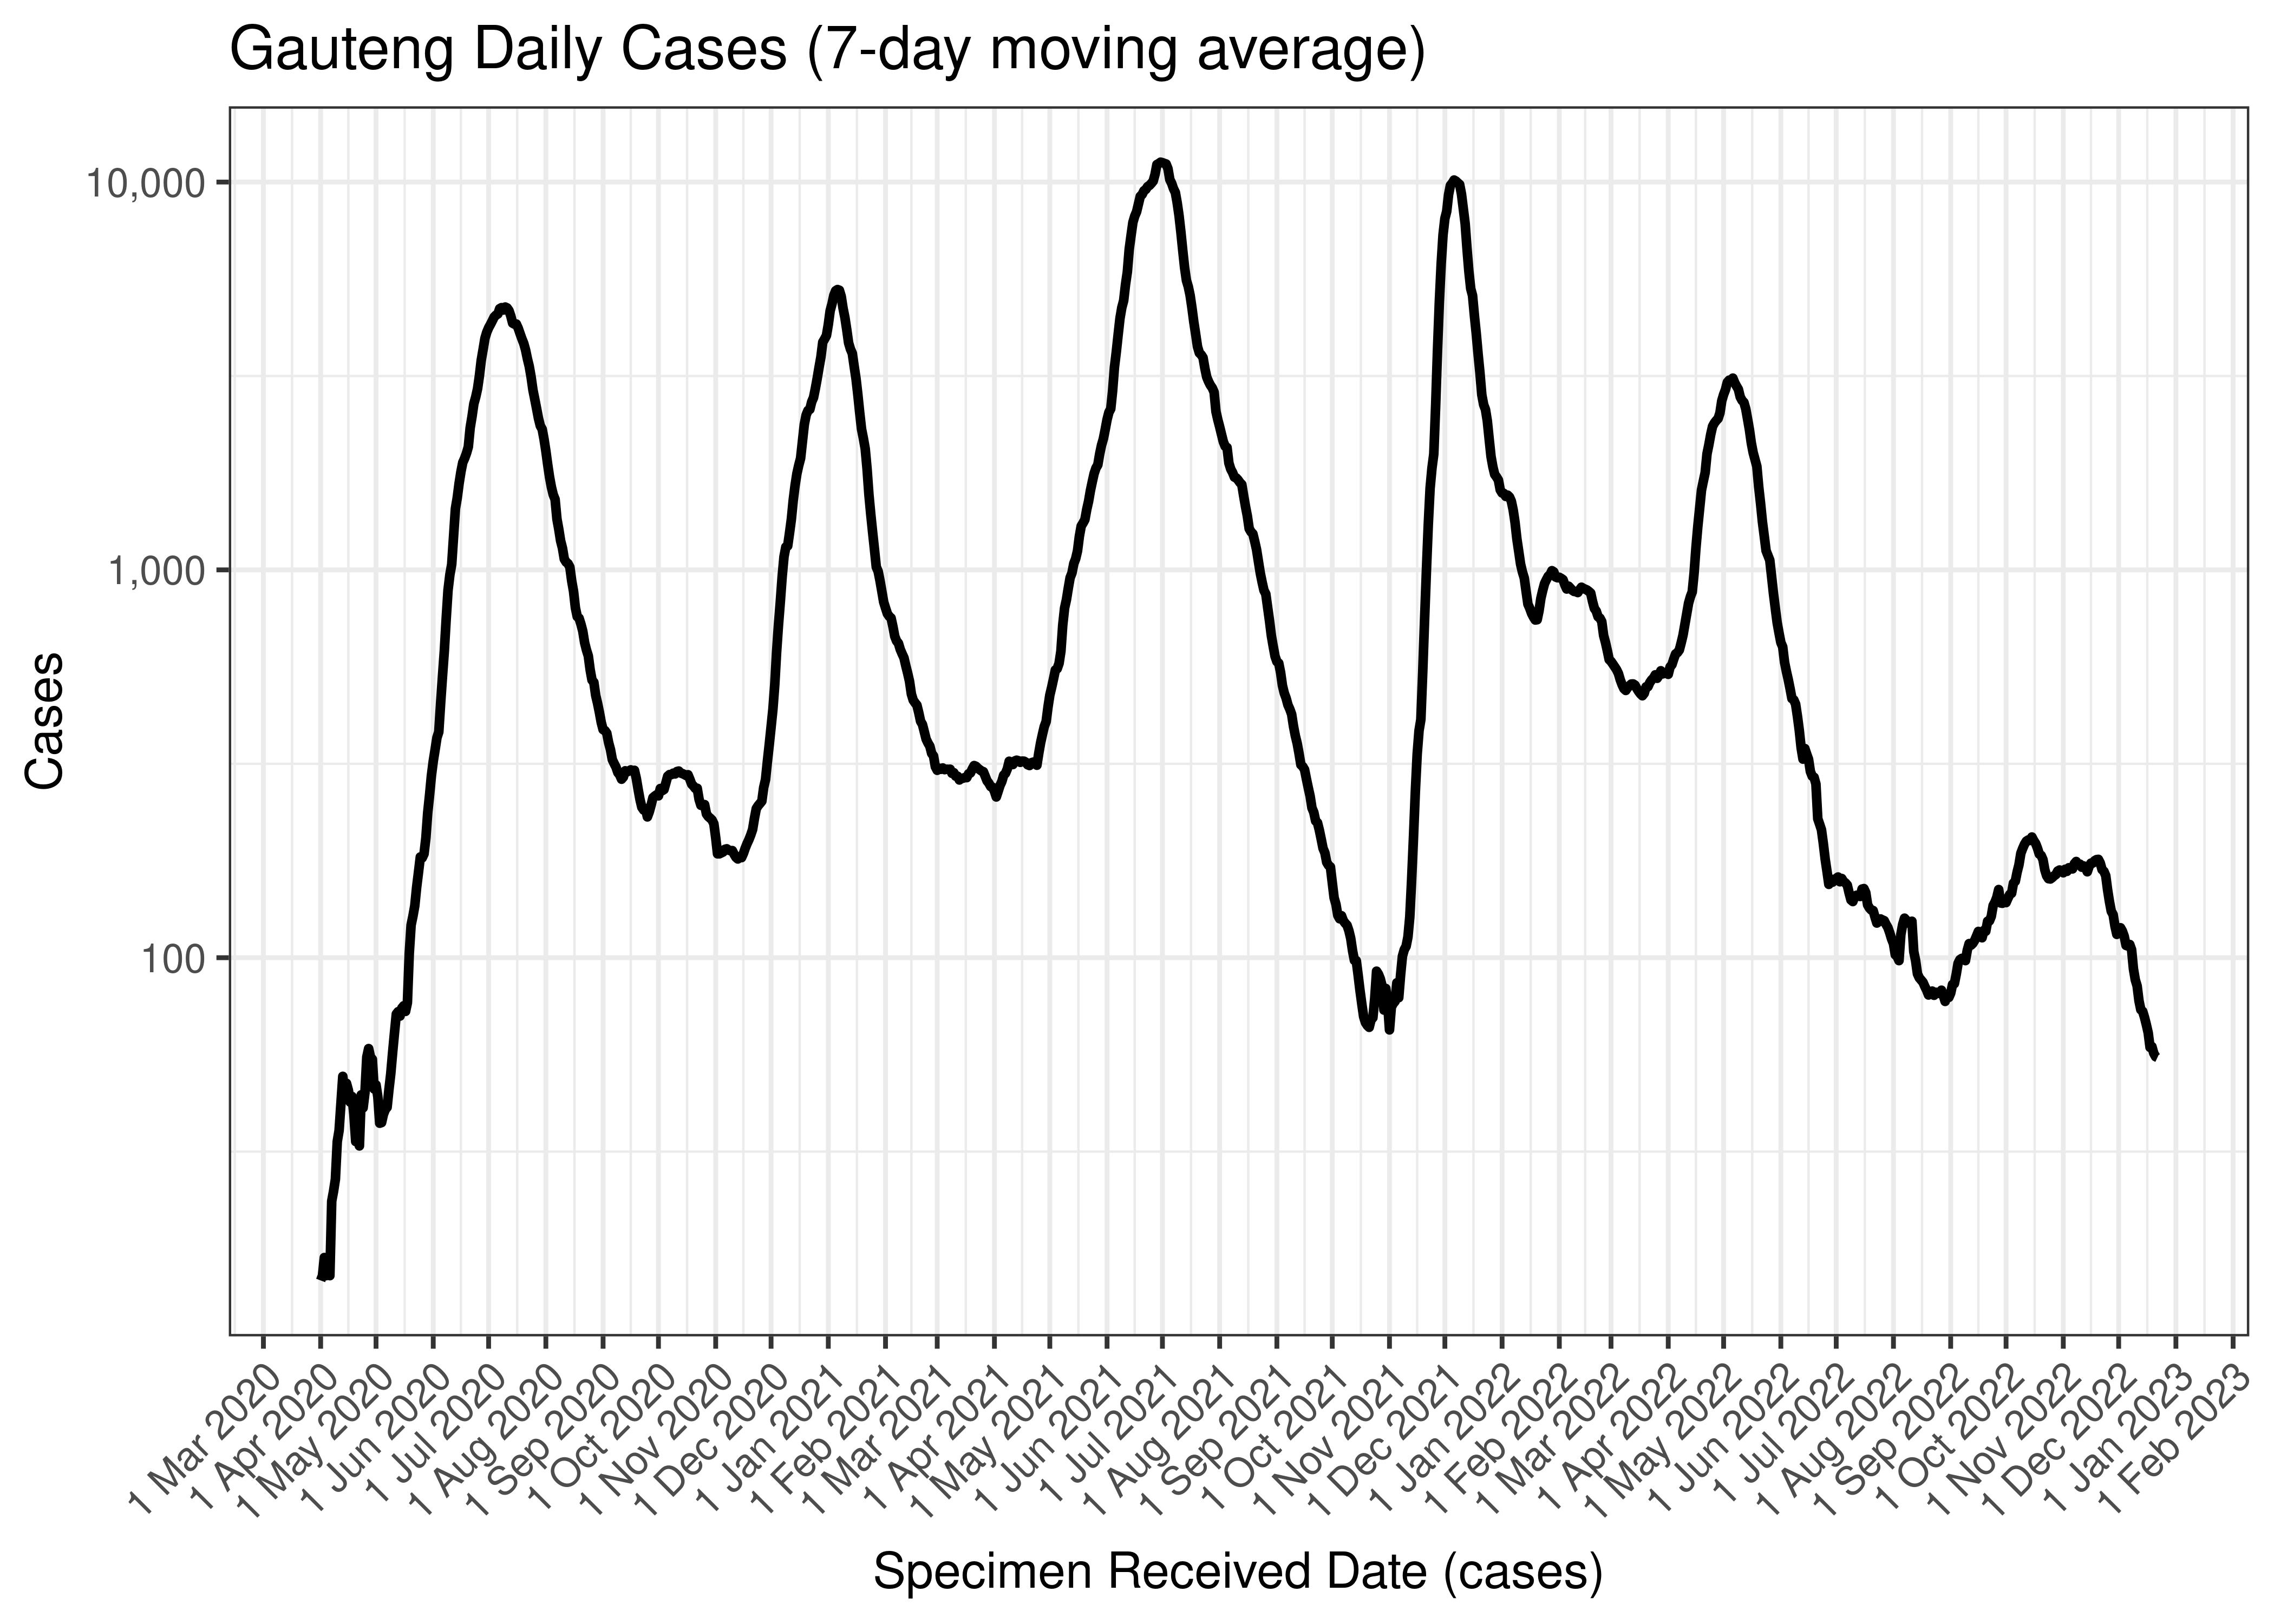
Gauteng Daily Cases (7-day moving average)
Below the above chart is repeated for the last 30-days:

Gauteng Daily Cases for Last 30-days (7-day moving average)
Below a 7-day moving average daily case count is plotted for Gauteng by district municipality on a log scale since start of the epidemic:
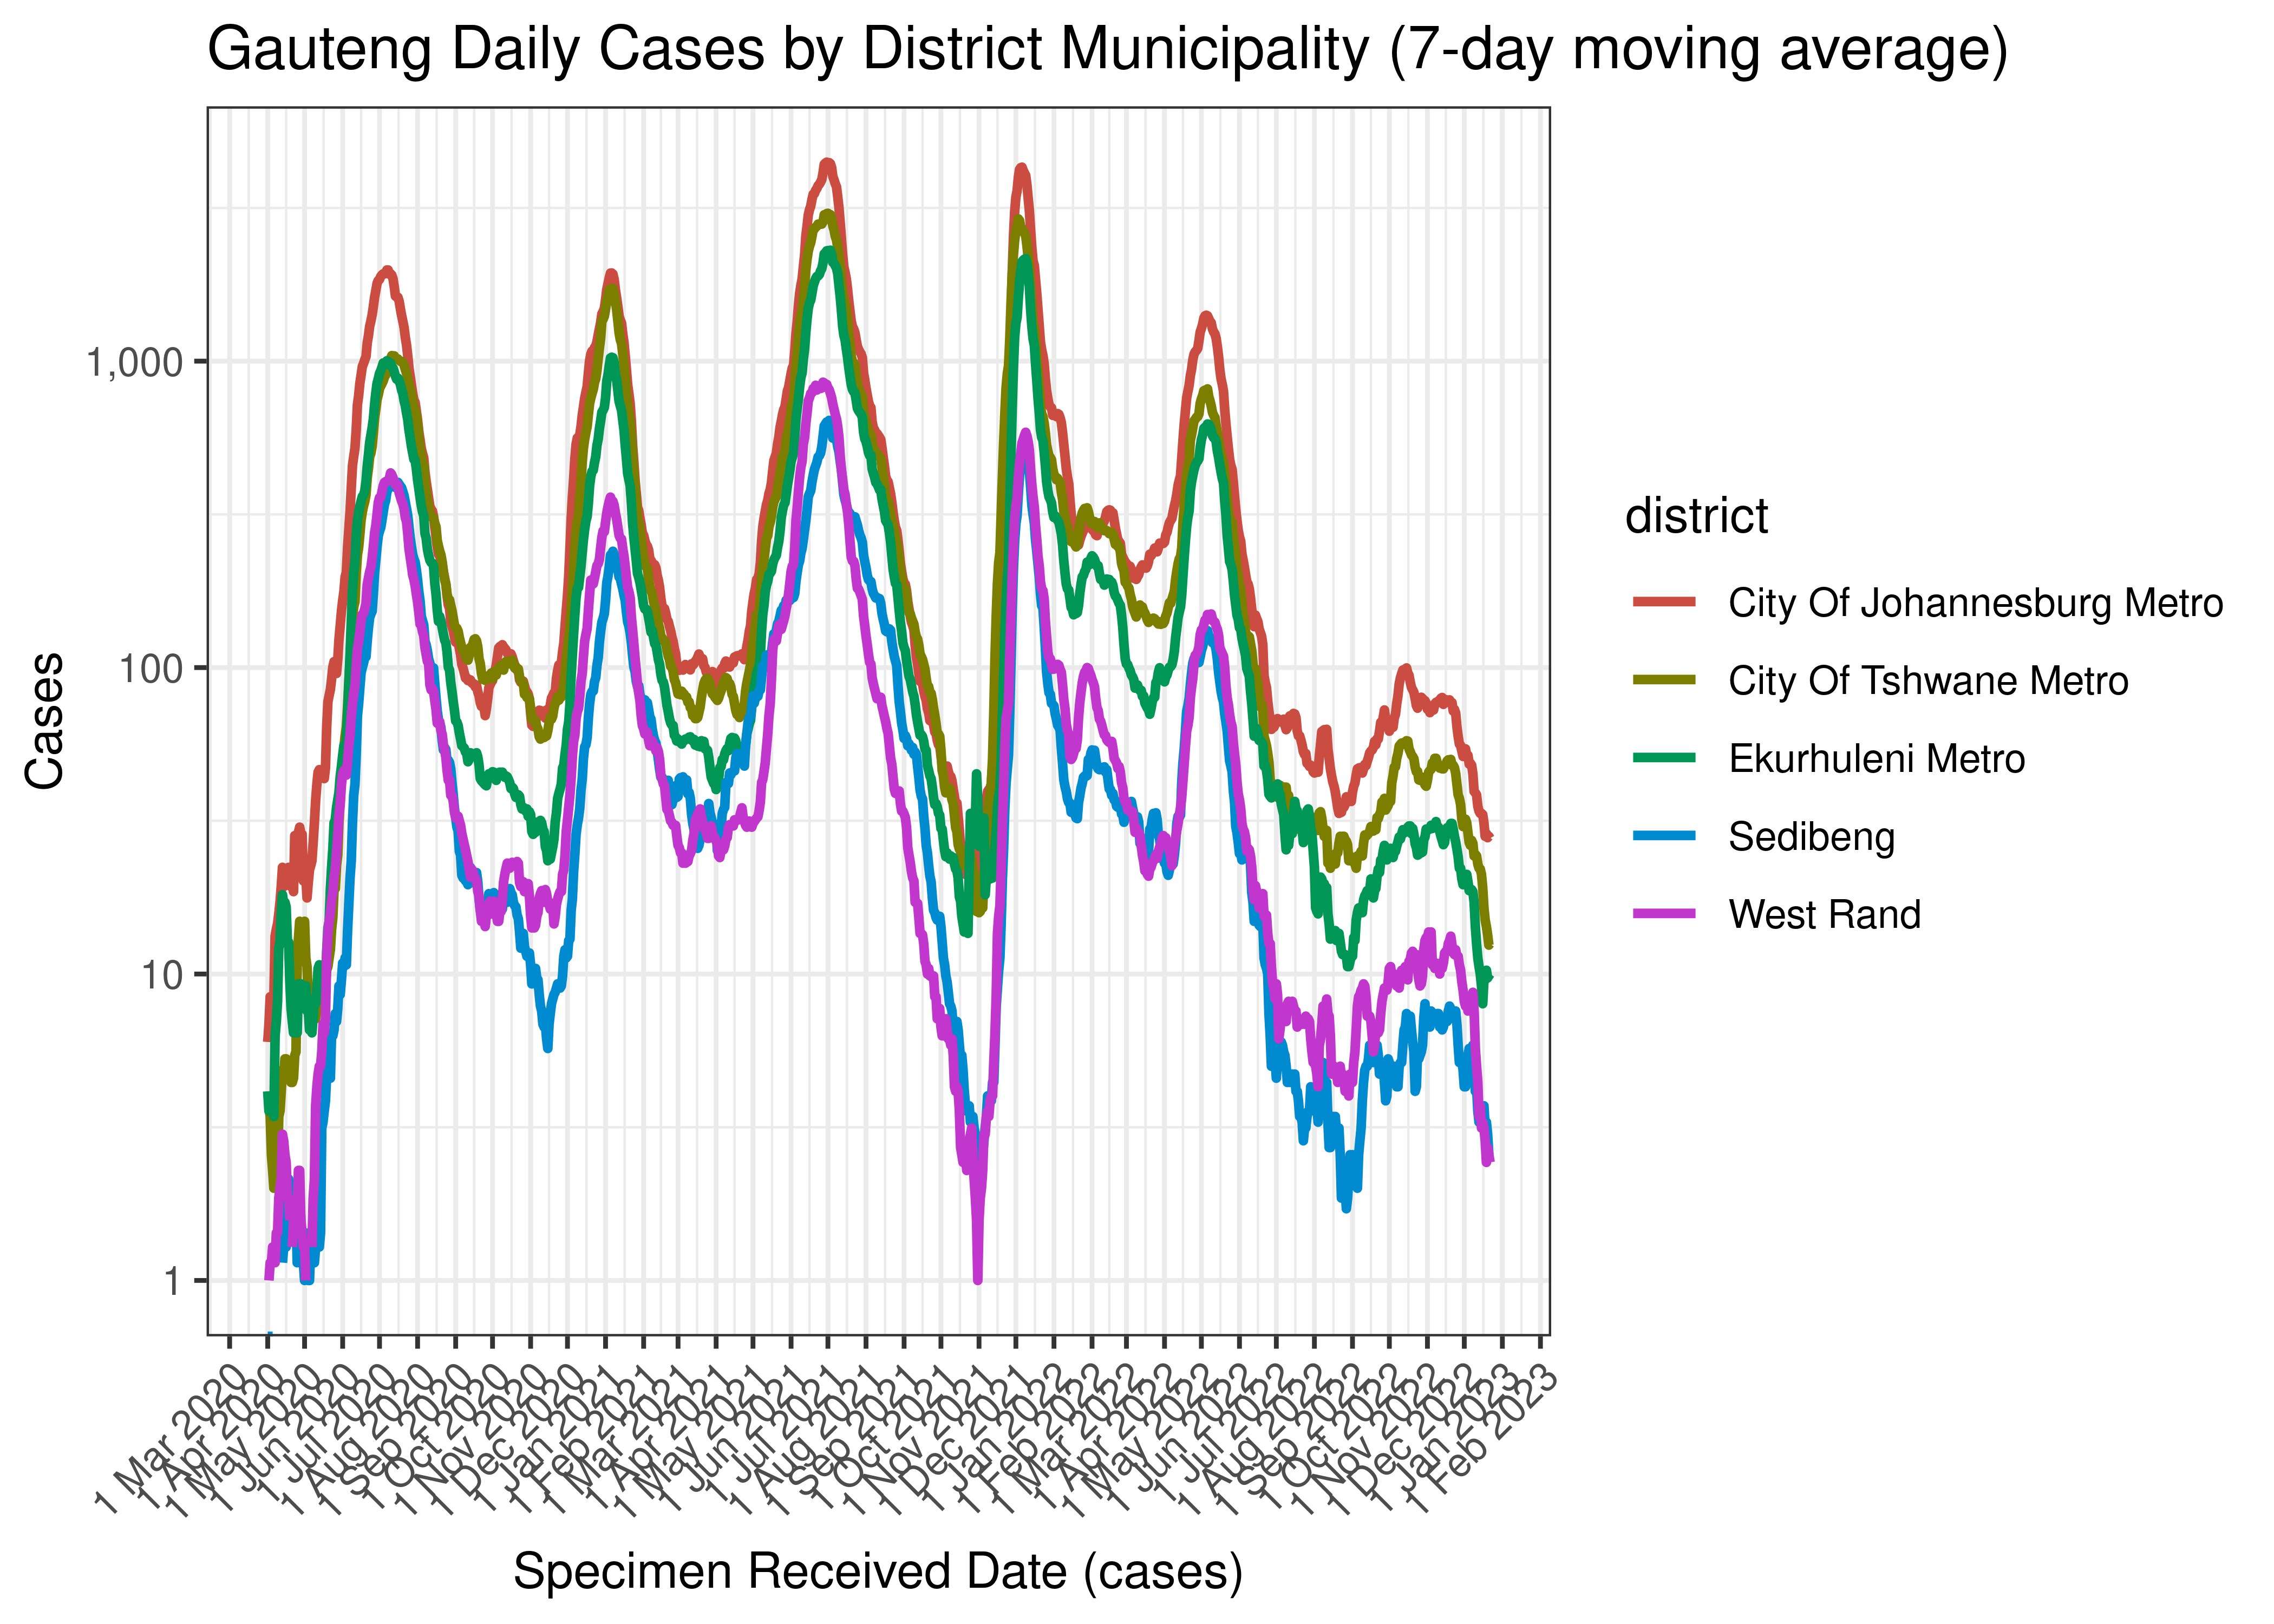
Gauteng Daily Cases by District Municipality (7-day moving average)
Below the above chart is repeated for the last 30-days:
Gauteng Daily Cases for Last 30-days by District Municipality (7-day moving average)
6.4.2 Hospital Admissions
Hospital admissions are tabulated by reported date below. The peak daily admissions in previous waves (as measured by the moving average) is also shown.
| Reported Date | Hospital Admissions | 7-day Moving Average | Comment |
|---|---|---|---|
| 2020-07-30 | 240 | 490 | Wave 1 Peak |
| 2020-10-08 | 126 | 1,311 | Wave 2 Peak |
| 2021-07-04 | 494 | 925 | Wave 3 Peak |
| 2021-12-12 | 102 | 512 | Wave 4 Peak |
| 2022-05-11 | 294 | 451 | Wave 5 Peak (to date) |
| 2022-12-16 | 0 | 11 | |
| 2022-12-17 | 5 | 8 | |
| 2022-12-18 | 5 | 7 | |
| 2022-12-19 | 4 | 6 | |
| 2022-12-20 | 13 | 7 | |
| 2022-12-21 | 6 | NA | |
| 2022-12-22 | 10 | NA | |
| 2022-12-23 | 4 | NA |
Below a 7-day moving average daily hospital admissions count is plotted for Gauteng on a log scale since start of the epidemic:
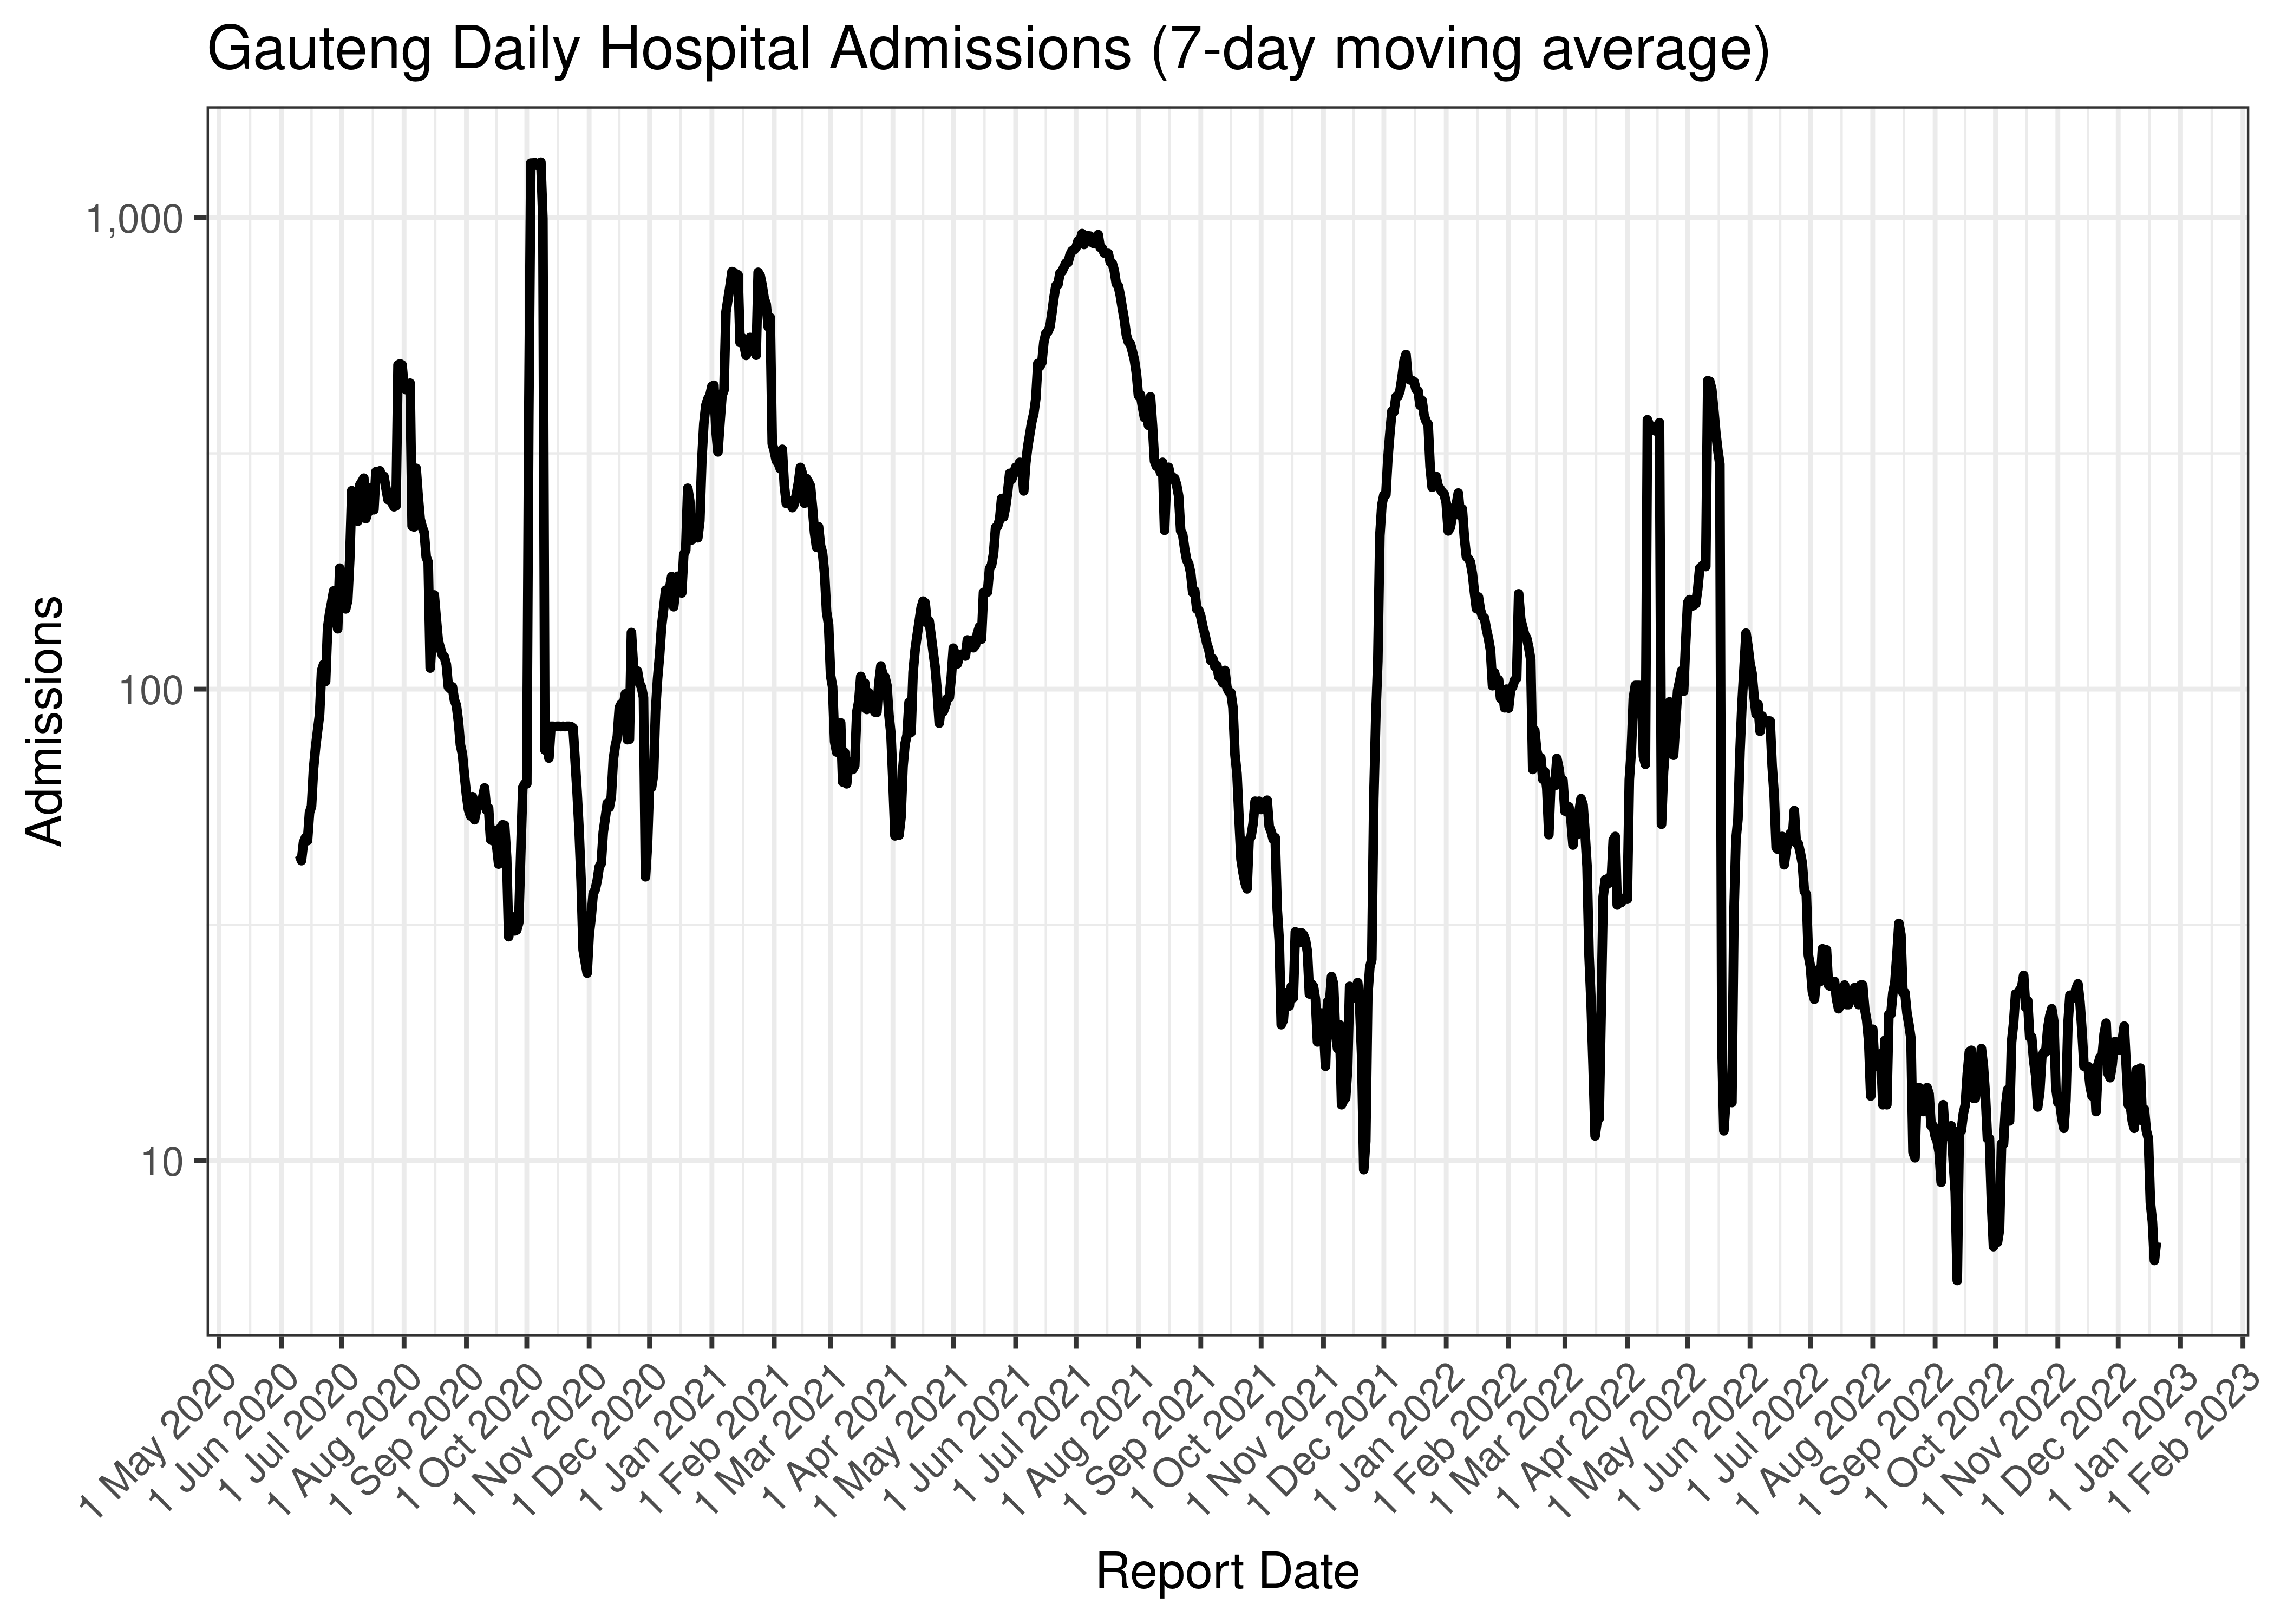
Gauteng Daily Hospital Admissions (7-day moving average)
Below the above chart is repeated for the last 30-days:
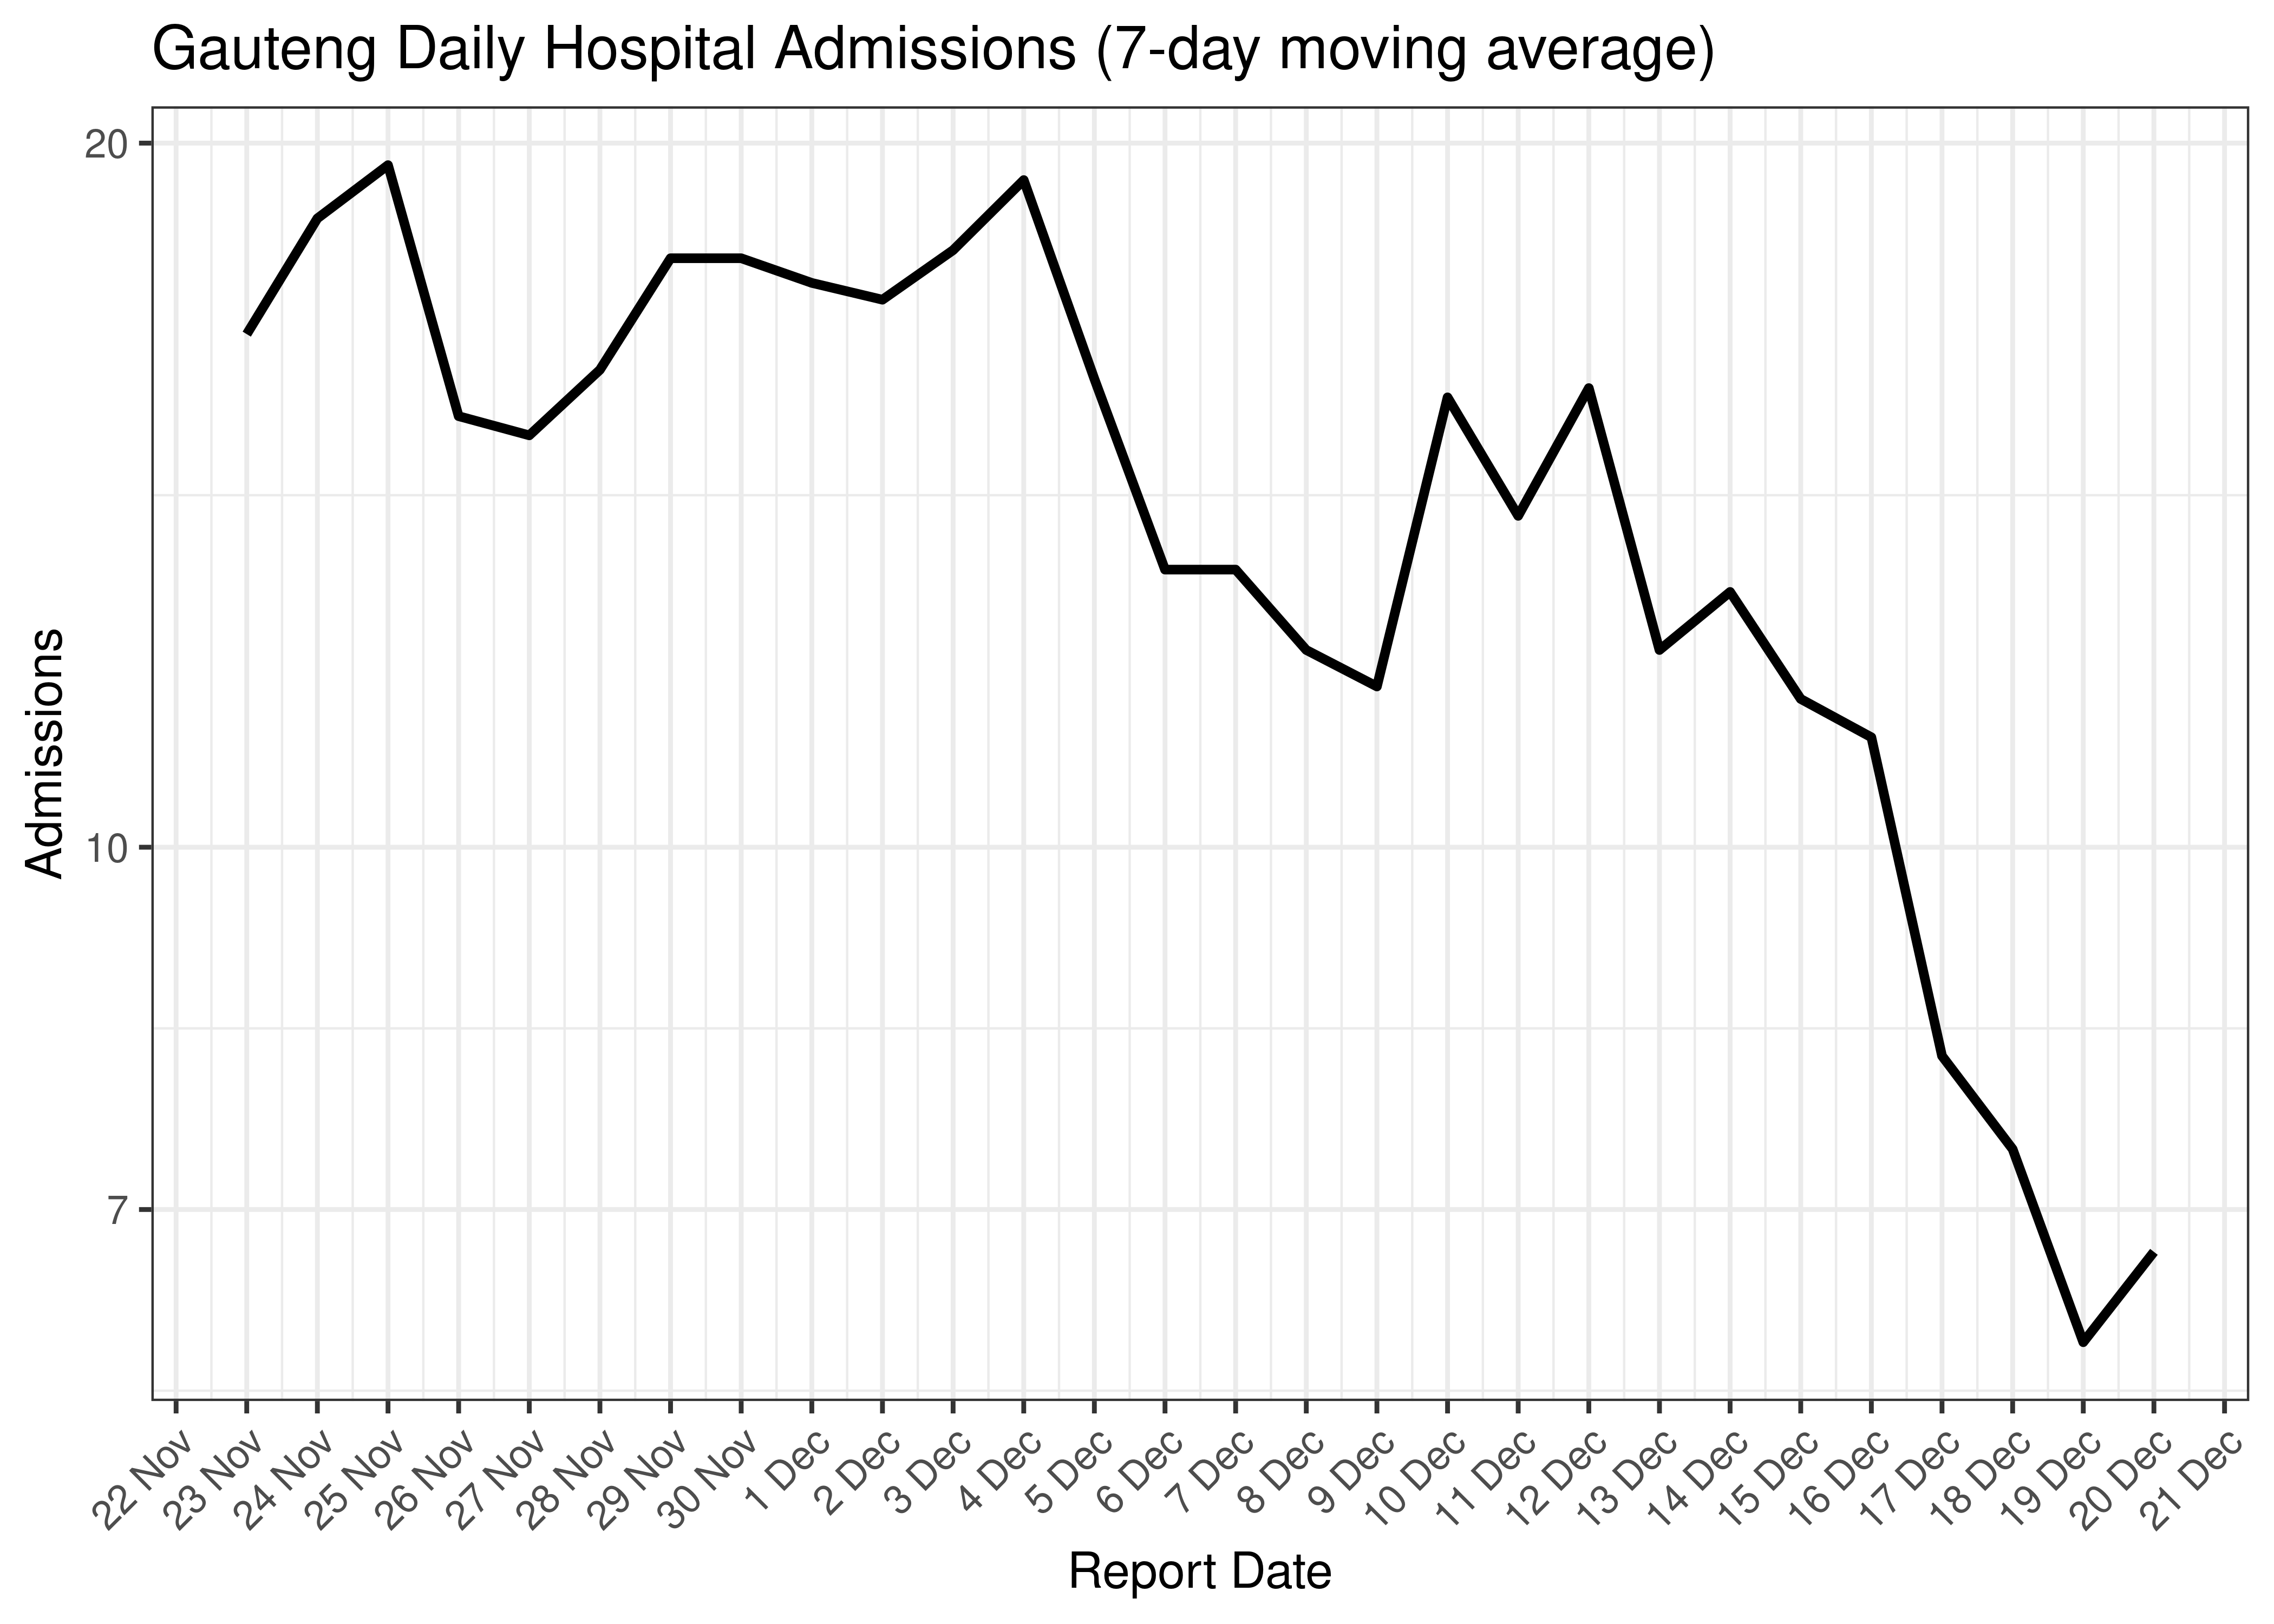
Gauteng Daily Hospital Admissions for Last 30-days (7-day moving average)
6.4.3 Hospital Deaths
Hospital deaths are tabulated by reported date below. The peak daily deaths in previous waves (as measured by the moving average) is also shown.
Note that hospital deaths underestimates total COVID-19 deaths in South Africa.
| Reported Date | Hospital Deaths | 7-day Moving Average | Comment |
|---|---|---|---|
| 2020-08-02 | 32 | 63 | Wave 1 Peak |
| 2021-01-14 | 136 | 155 | Wave 2 Peak |
| 2021-06-25 | 149 | 244 | Wave 3 Peak |
| 2022-01-09 | 6 | 33 | Wave 4 Peak |
| 2022-04-17 | 1 | 50 | Wave 5 Peak (to date) |
| 2022-12-16 | 0 | 1 | |
| 2022-12-17 | 1 | 1 | |
| 2022-12-18 | 0 | 1 | |
| 2022-12-19 | 1 | 0 | |
| 2022-12-20 | 0 | 1 | |
| 2022-12-21 | 1 | NA | |
| 2022-12-22 | 0 | NA | |
| 2022-12-23 | 1 | NA |
Below a 7-day moving average daily hospital deaths count is plotted for Gauteng on a log scale since start of the epidemic:
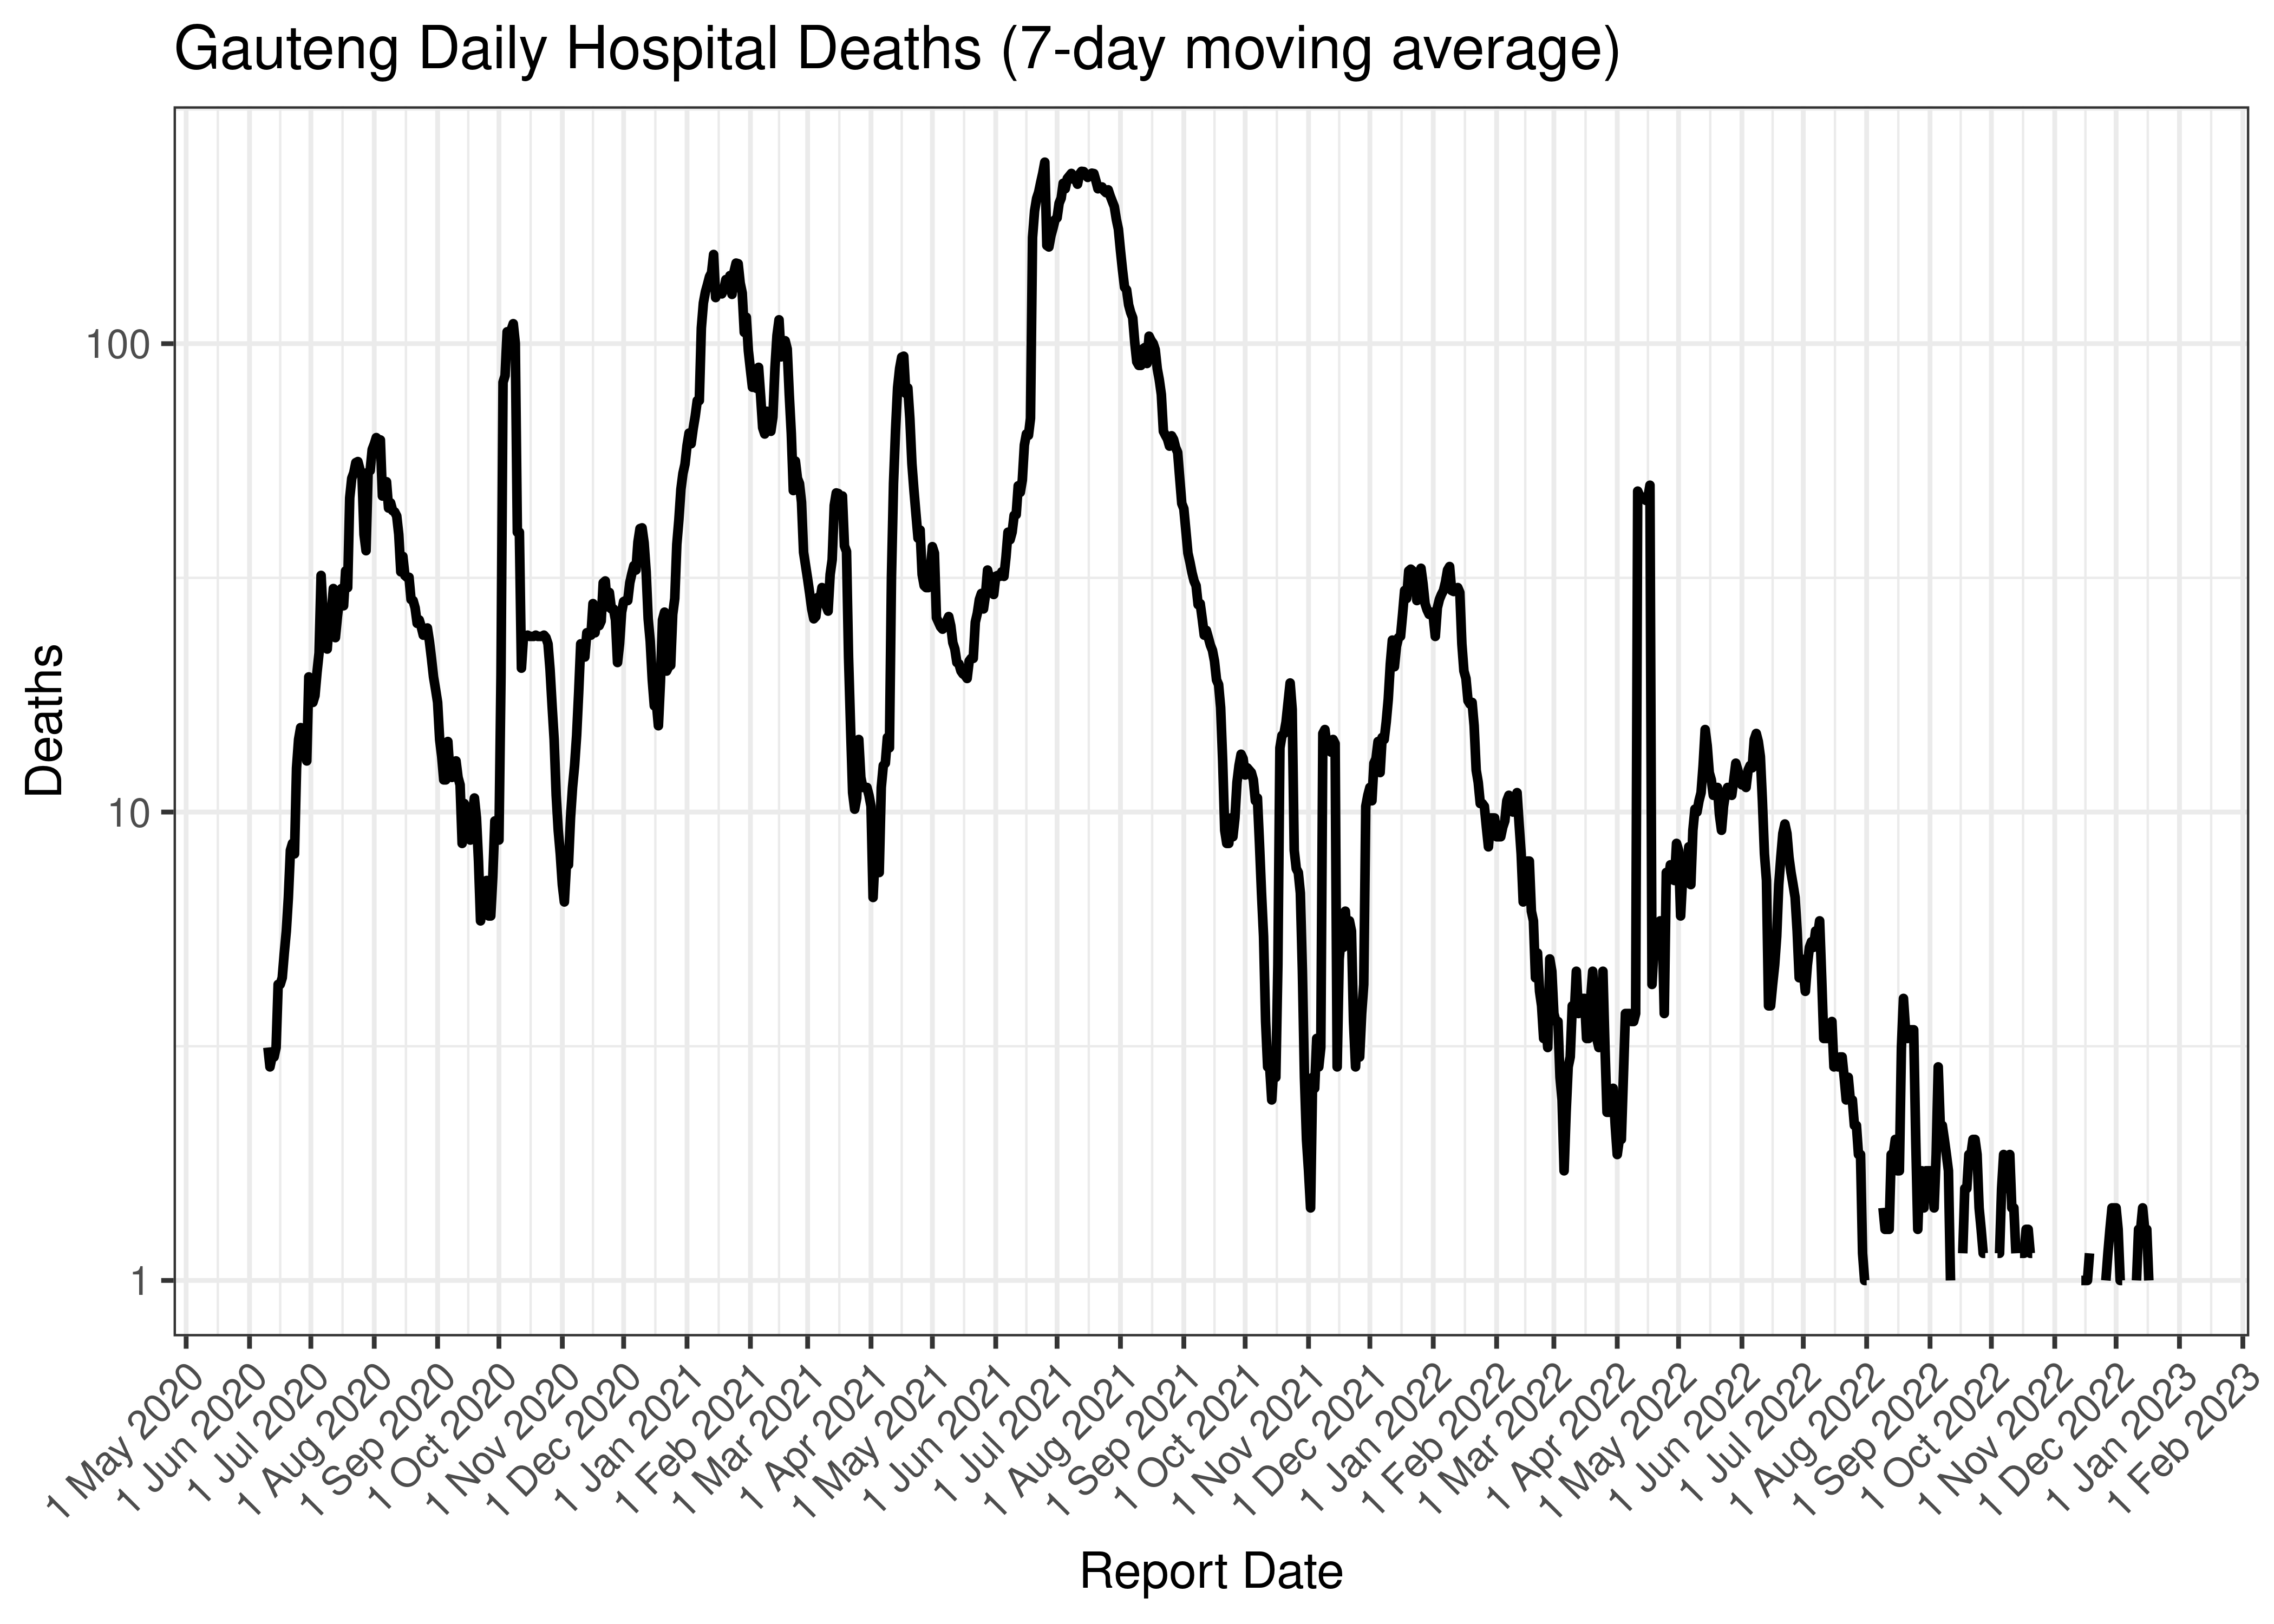
Gauteng Daily Hospital Deaths (7-day moving average)
Below the above chart is repeated for the last 30-days:
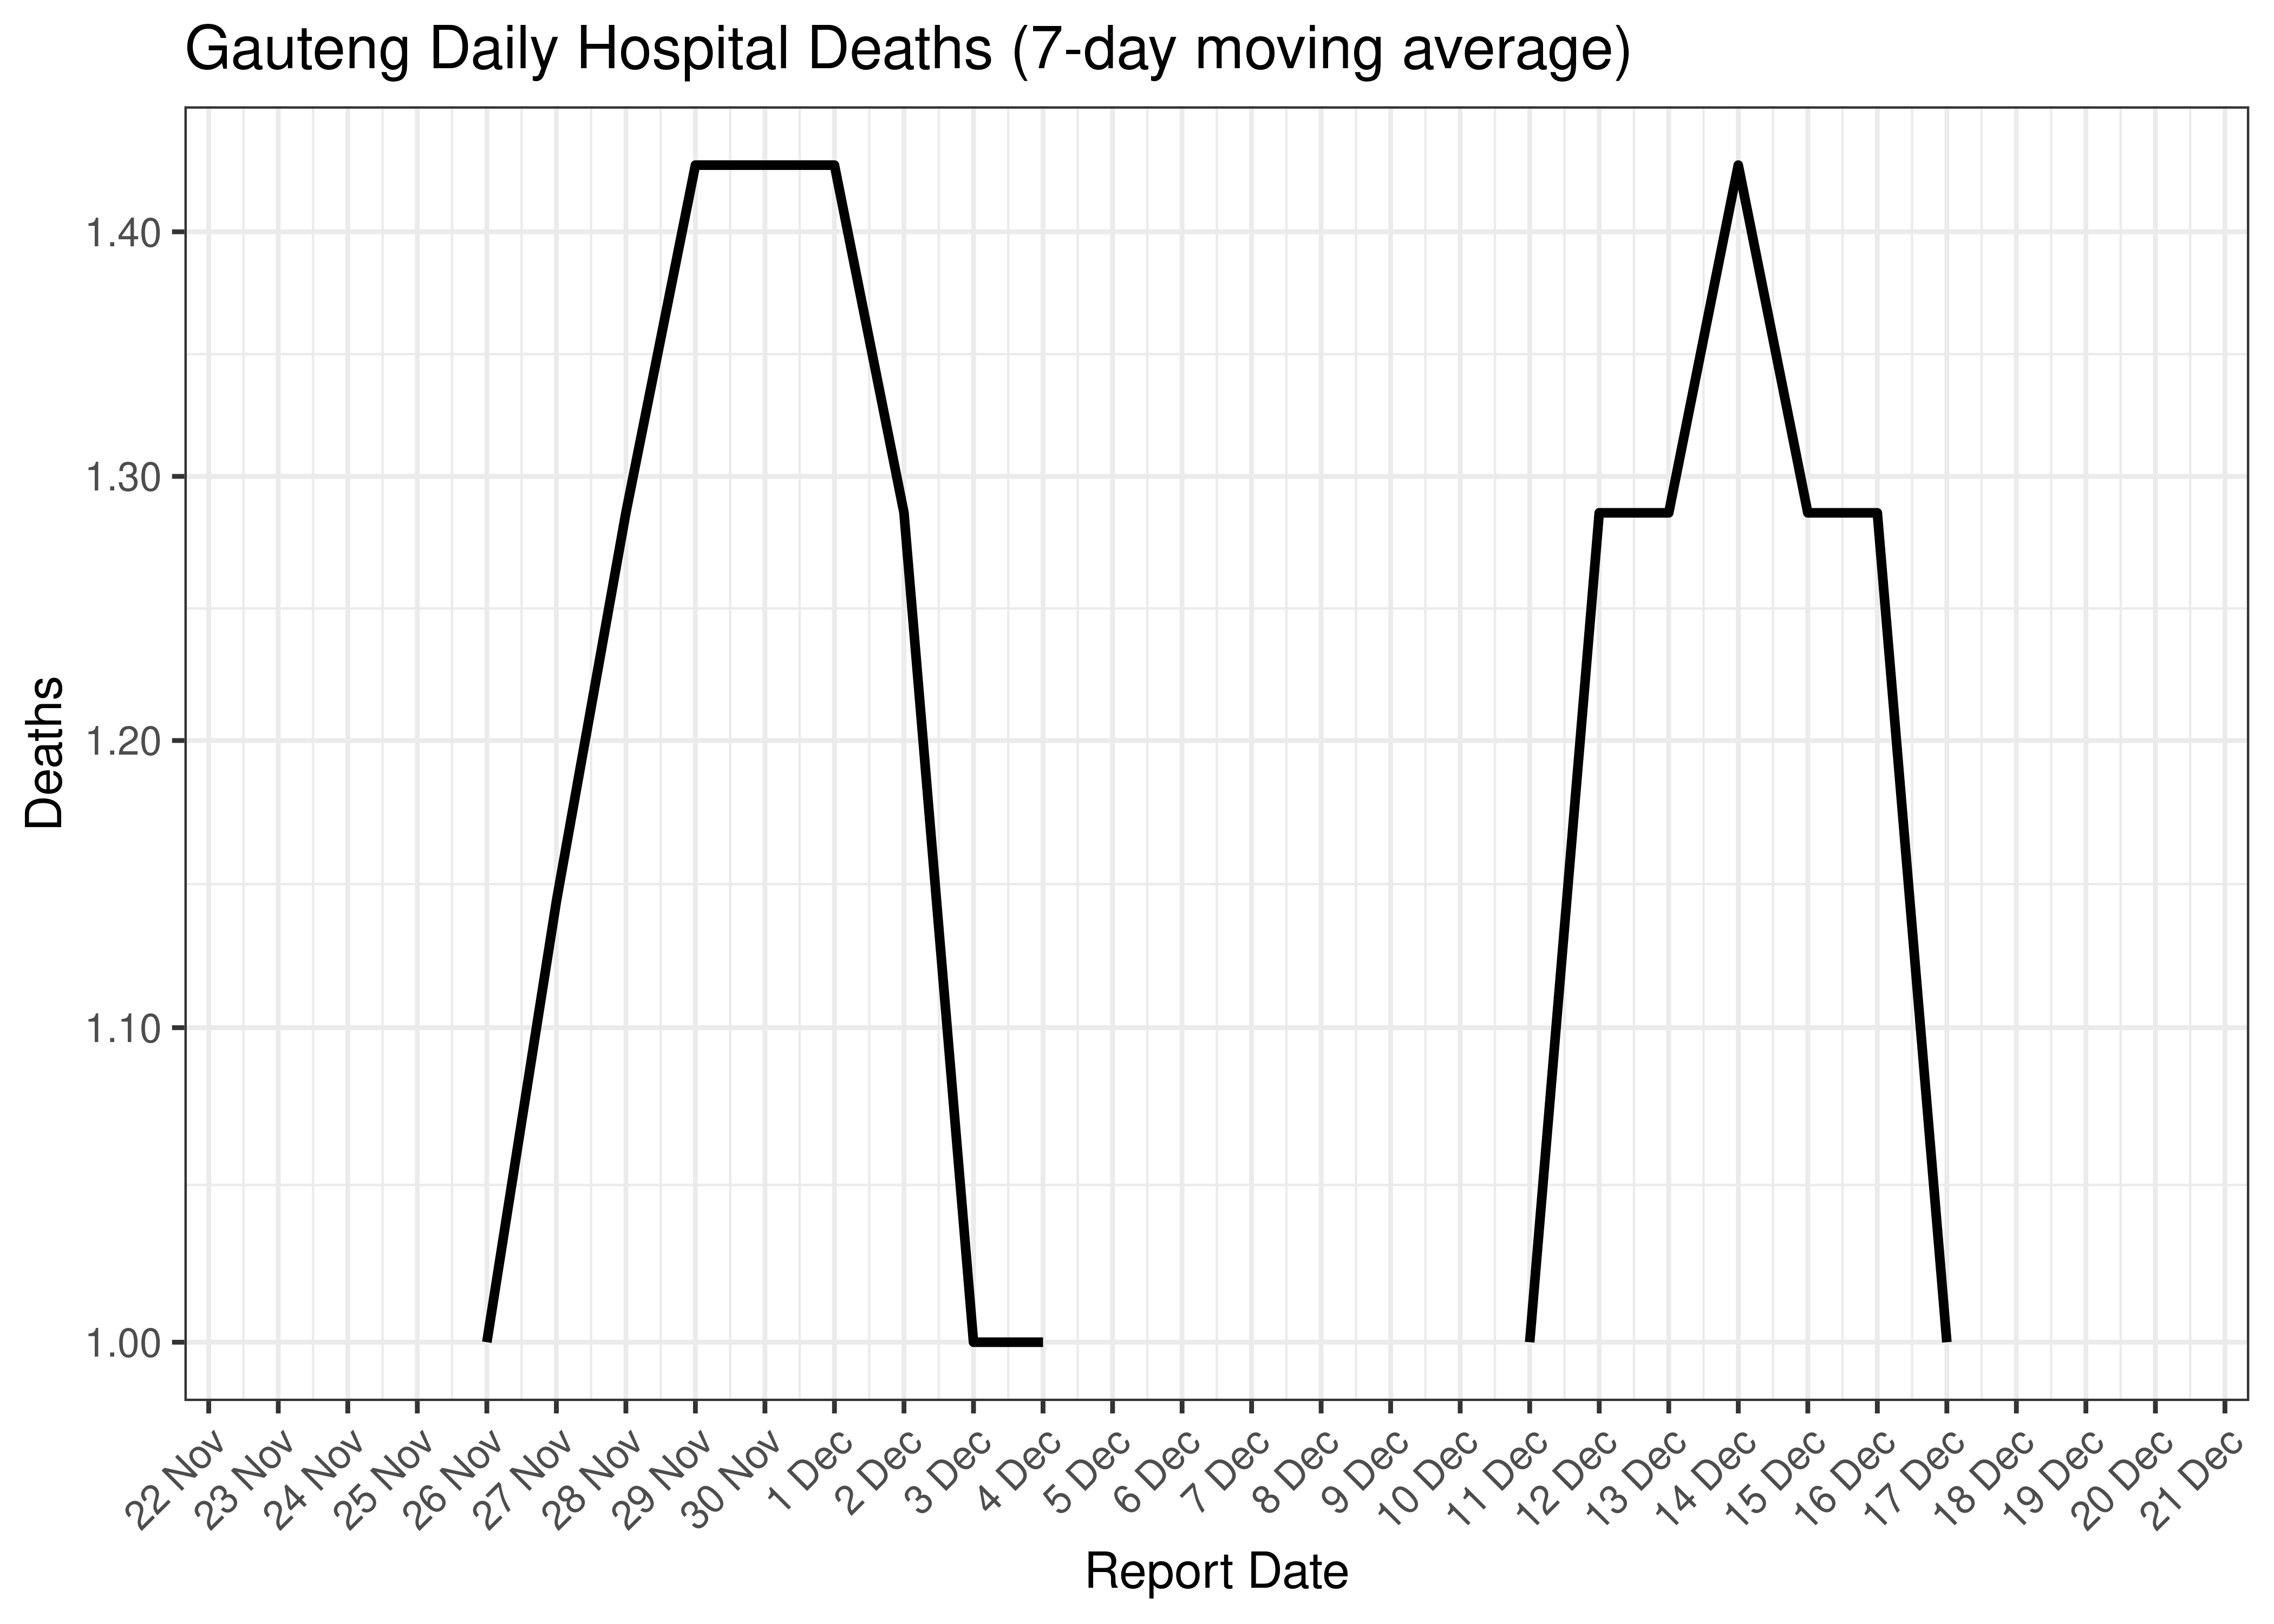
Gauteng Daily Hospital Deaths for Last 30-days (7-day moving average)
6.4.4 Excess Deaths
Excess deaths are tabulated by date of death below. The peak daily deaths in previous waves (as measured by the moving average) is also shown.
| Date of Death | Excess Deaths | 7-day Moving Average | Comment |
|---|---|---|---|
| 2020-07-15 | 318 | 318 | Wave 1 Peak |
| 2021-01-13 | 312 | 312 | Wave 2 Peak |
| 2021-07-07 | 546 | 546 | Wave 3 Peak |
| 2021-12-15 | 86 | 86 | Wave 4 Peak |
| 2022-05-11 | 68 | 68 | Wave 5 Peak (to date) |
| 2022-12-03 | 13 | 10 | |
| 2022-12-04 | 6 | 9 | |
| 2022-12-05 | 6 | 8 | |
| 2022-12-06 | 6 | 7 | |
| 2022-12-07 | 6 | 6 | |
| 2022-12-08 | 6 | NA | |
| 2022-12-09 | 6 | NA | |
| 2022-12-10 | 6 | NA |
Below a 7-day moving average daily excess deaths count is plotted for Gauteng on a log scale since start of the epidemic:
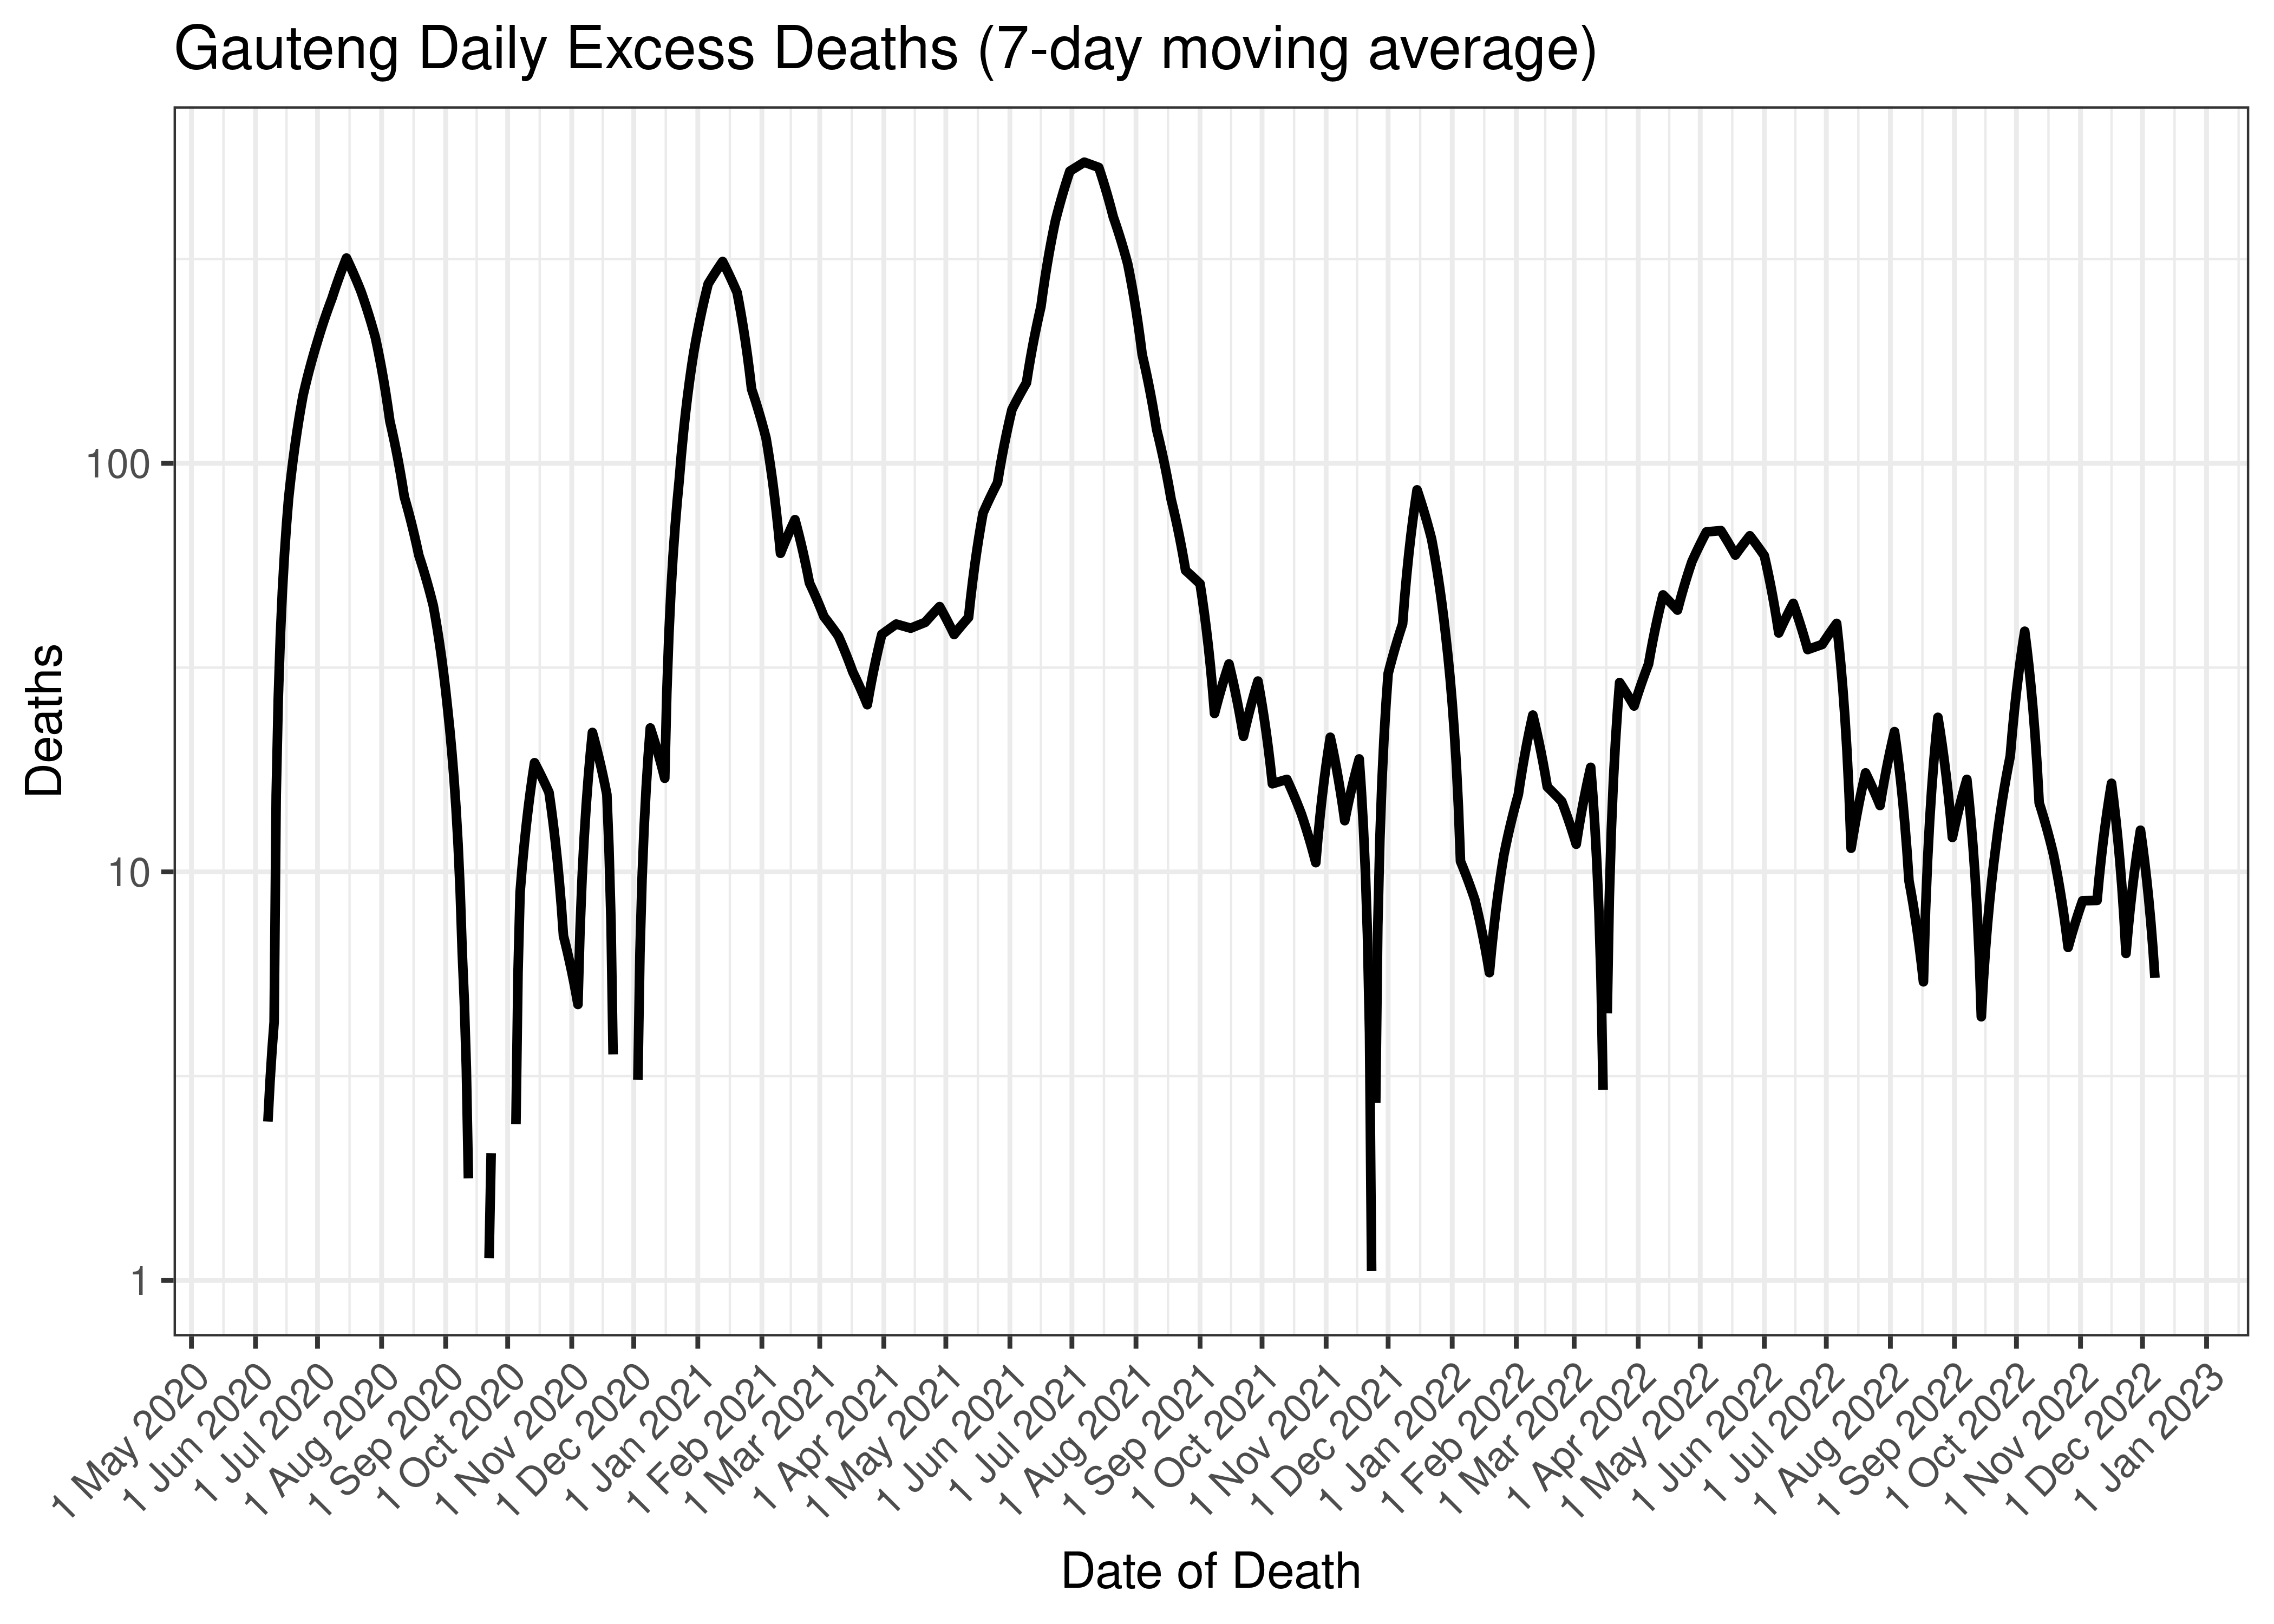
Gauteng Daily Excess Deaths (7-day moving average)
Below the above chart is repeated for the last 30-days:
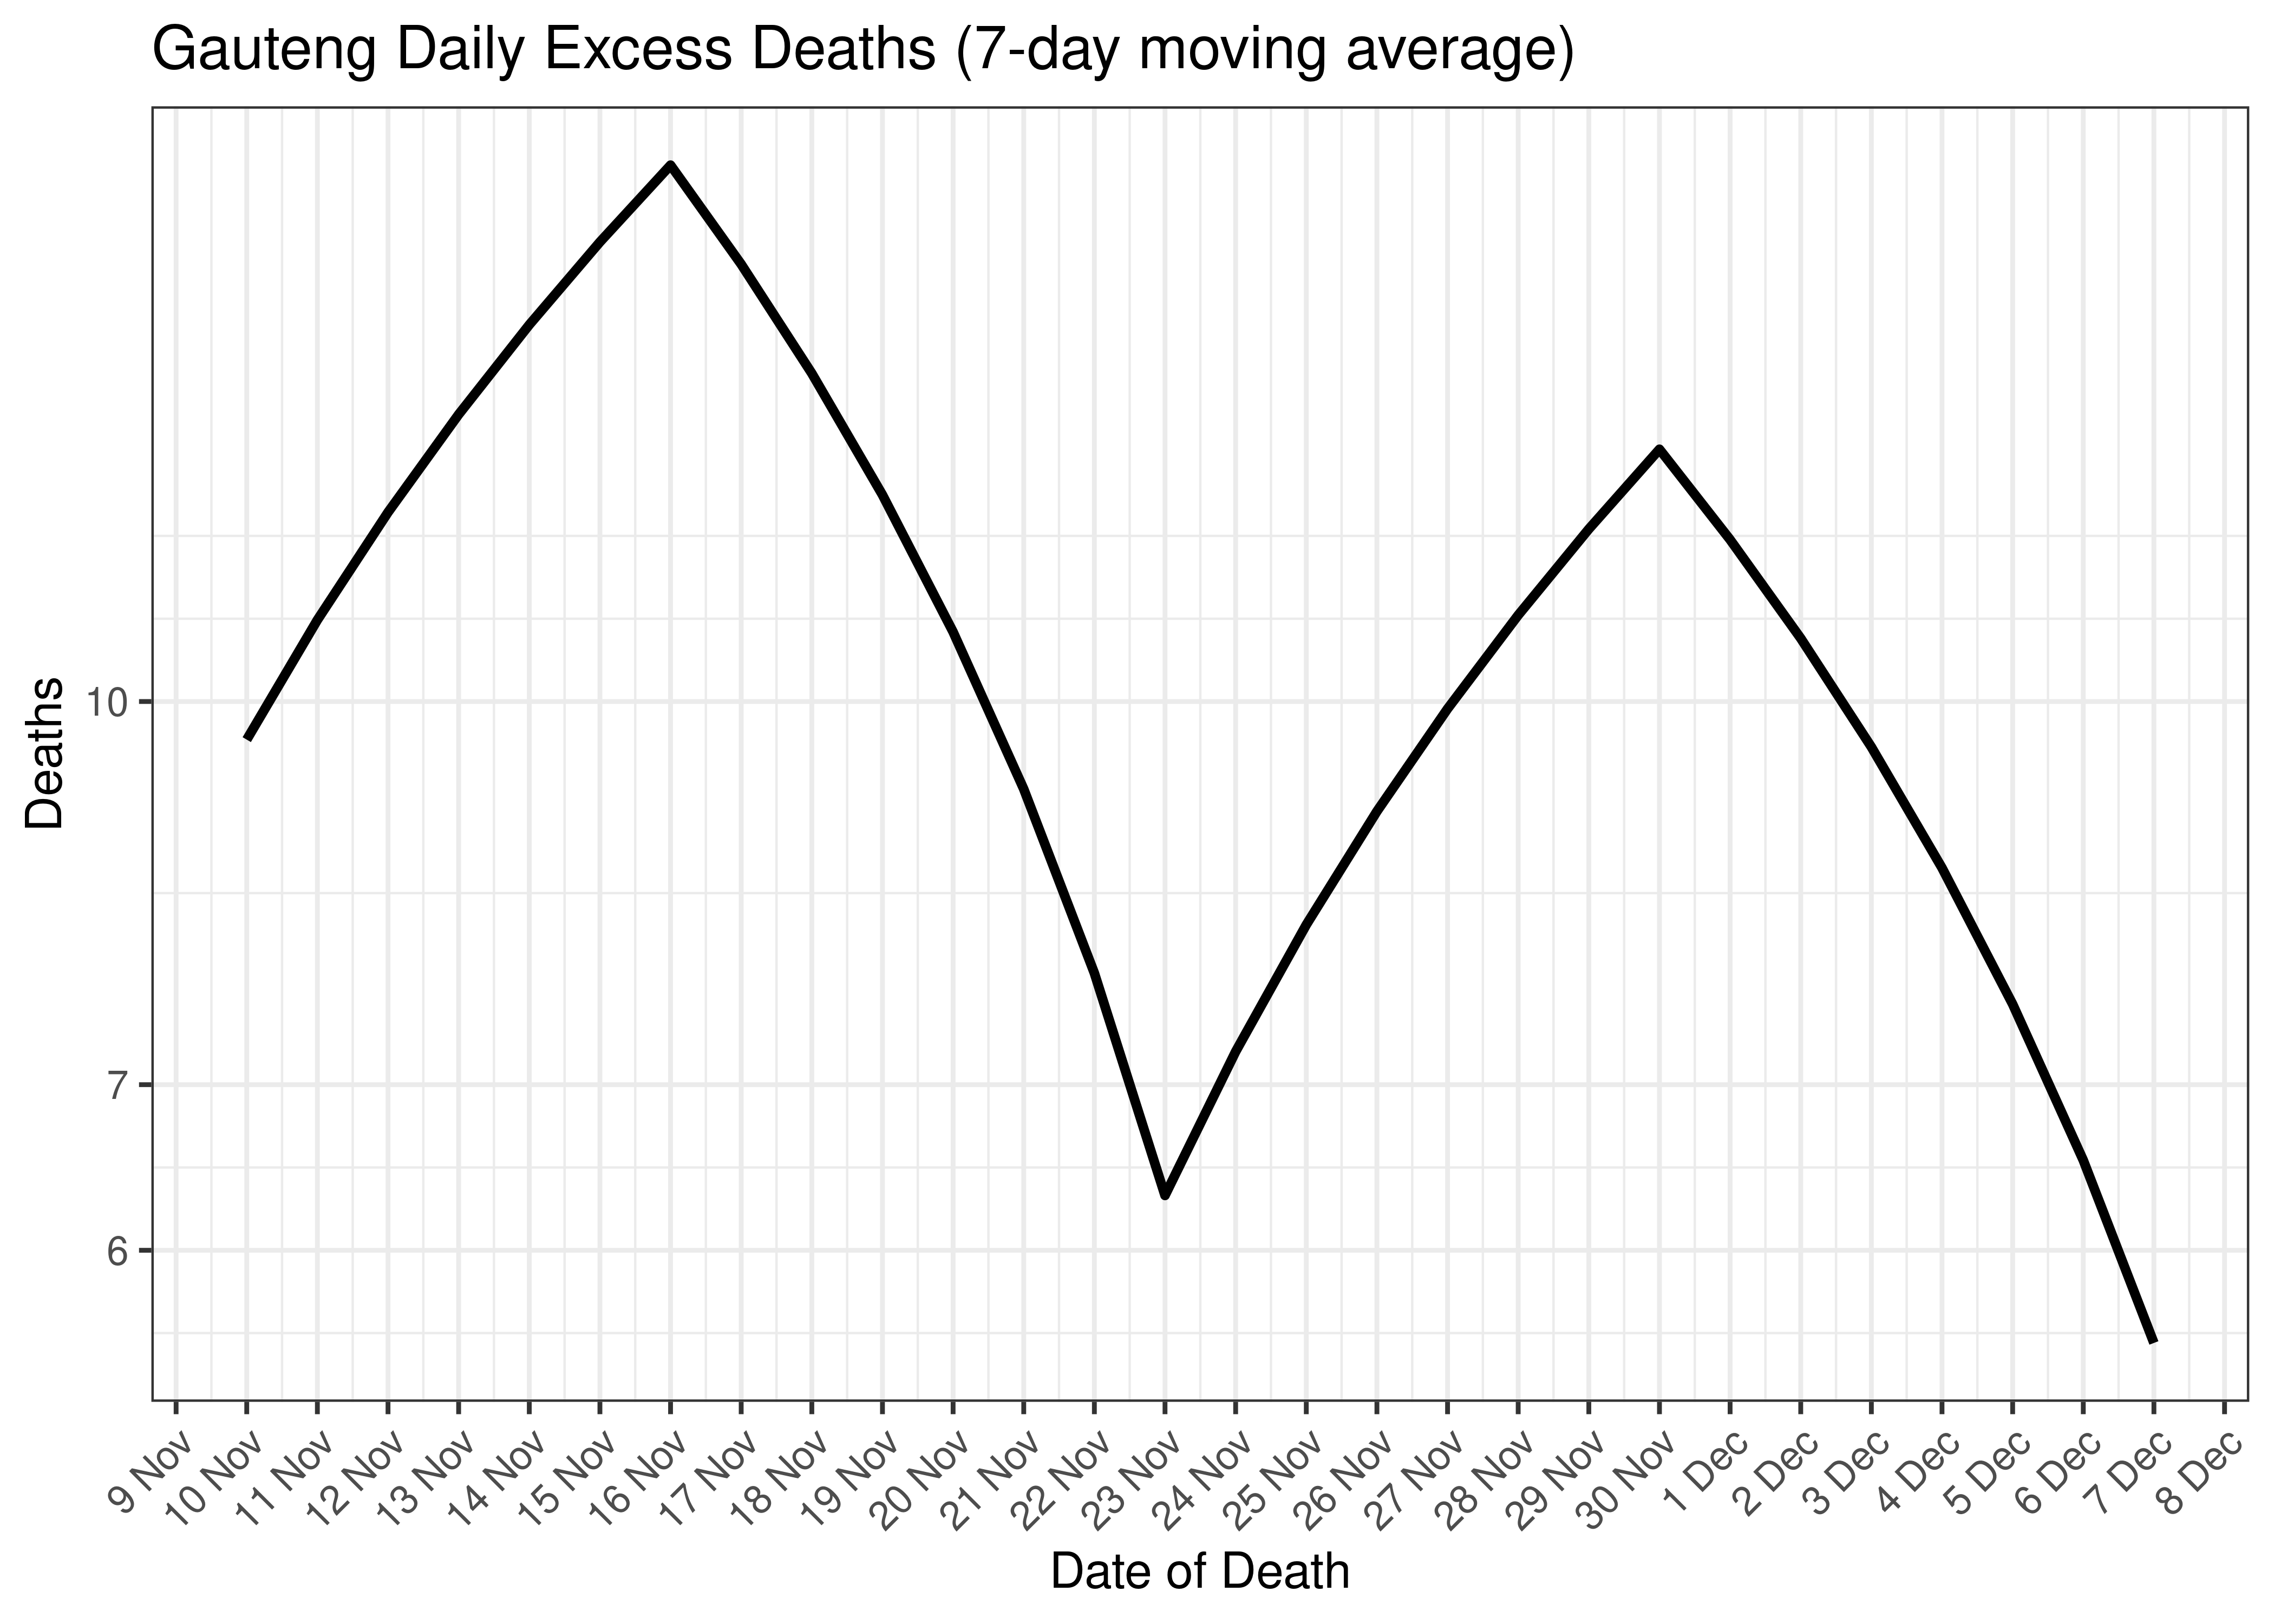
Gauteng Daily Excess Deaths for Last 30-days (7-day moving average)
6.4.5 Cases, Admissions and Deaths Combined
Below a 7-day moving average daily case, admission and excess death counts are plotted for Gauteng on a log scale since start of the epidemic. Note admissions and excess deaths are plotted by reported date, whereas cases are plotted by specimen received date.
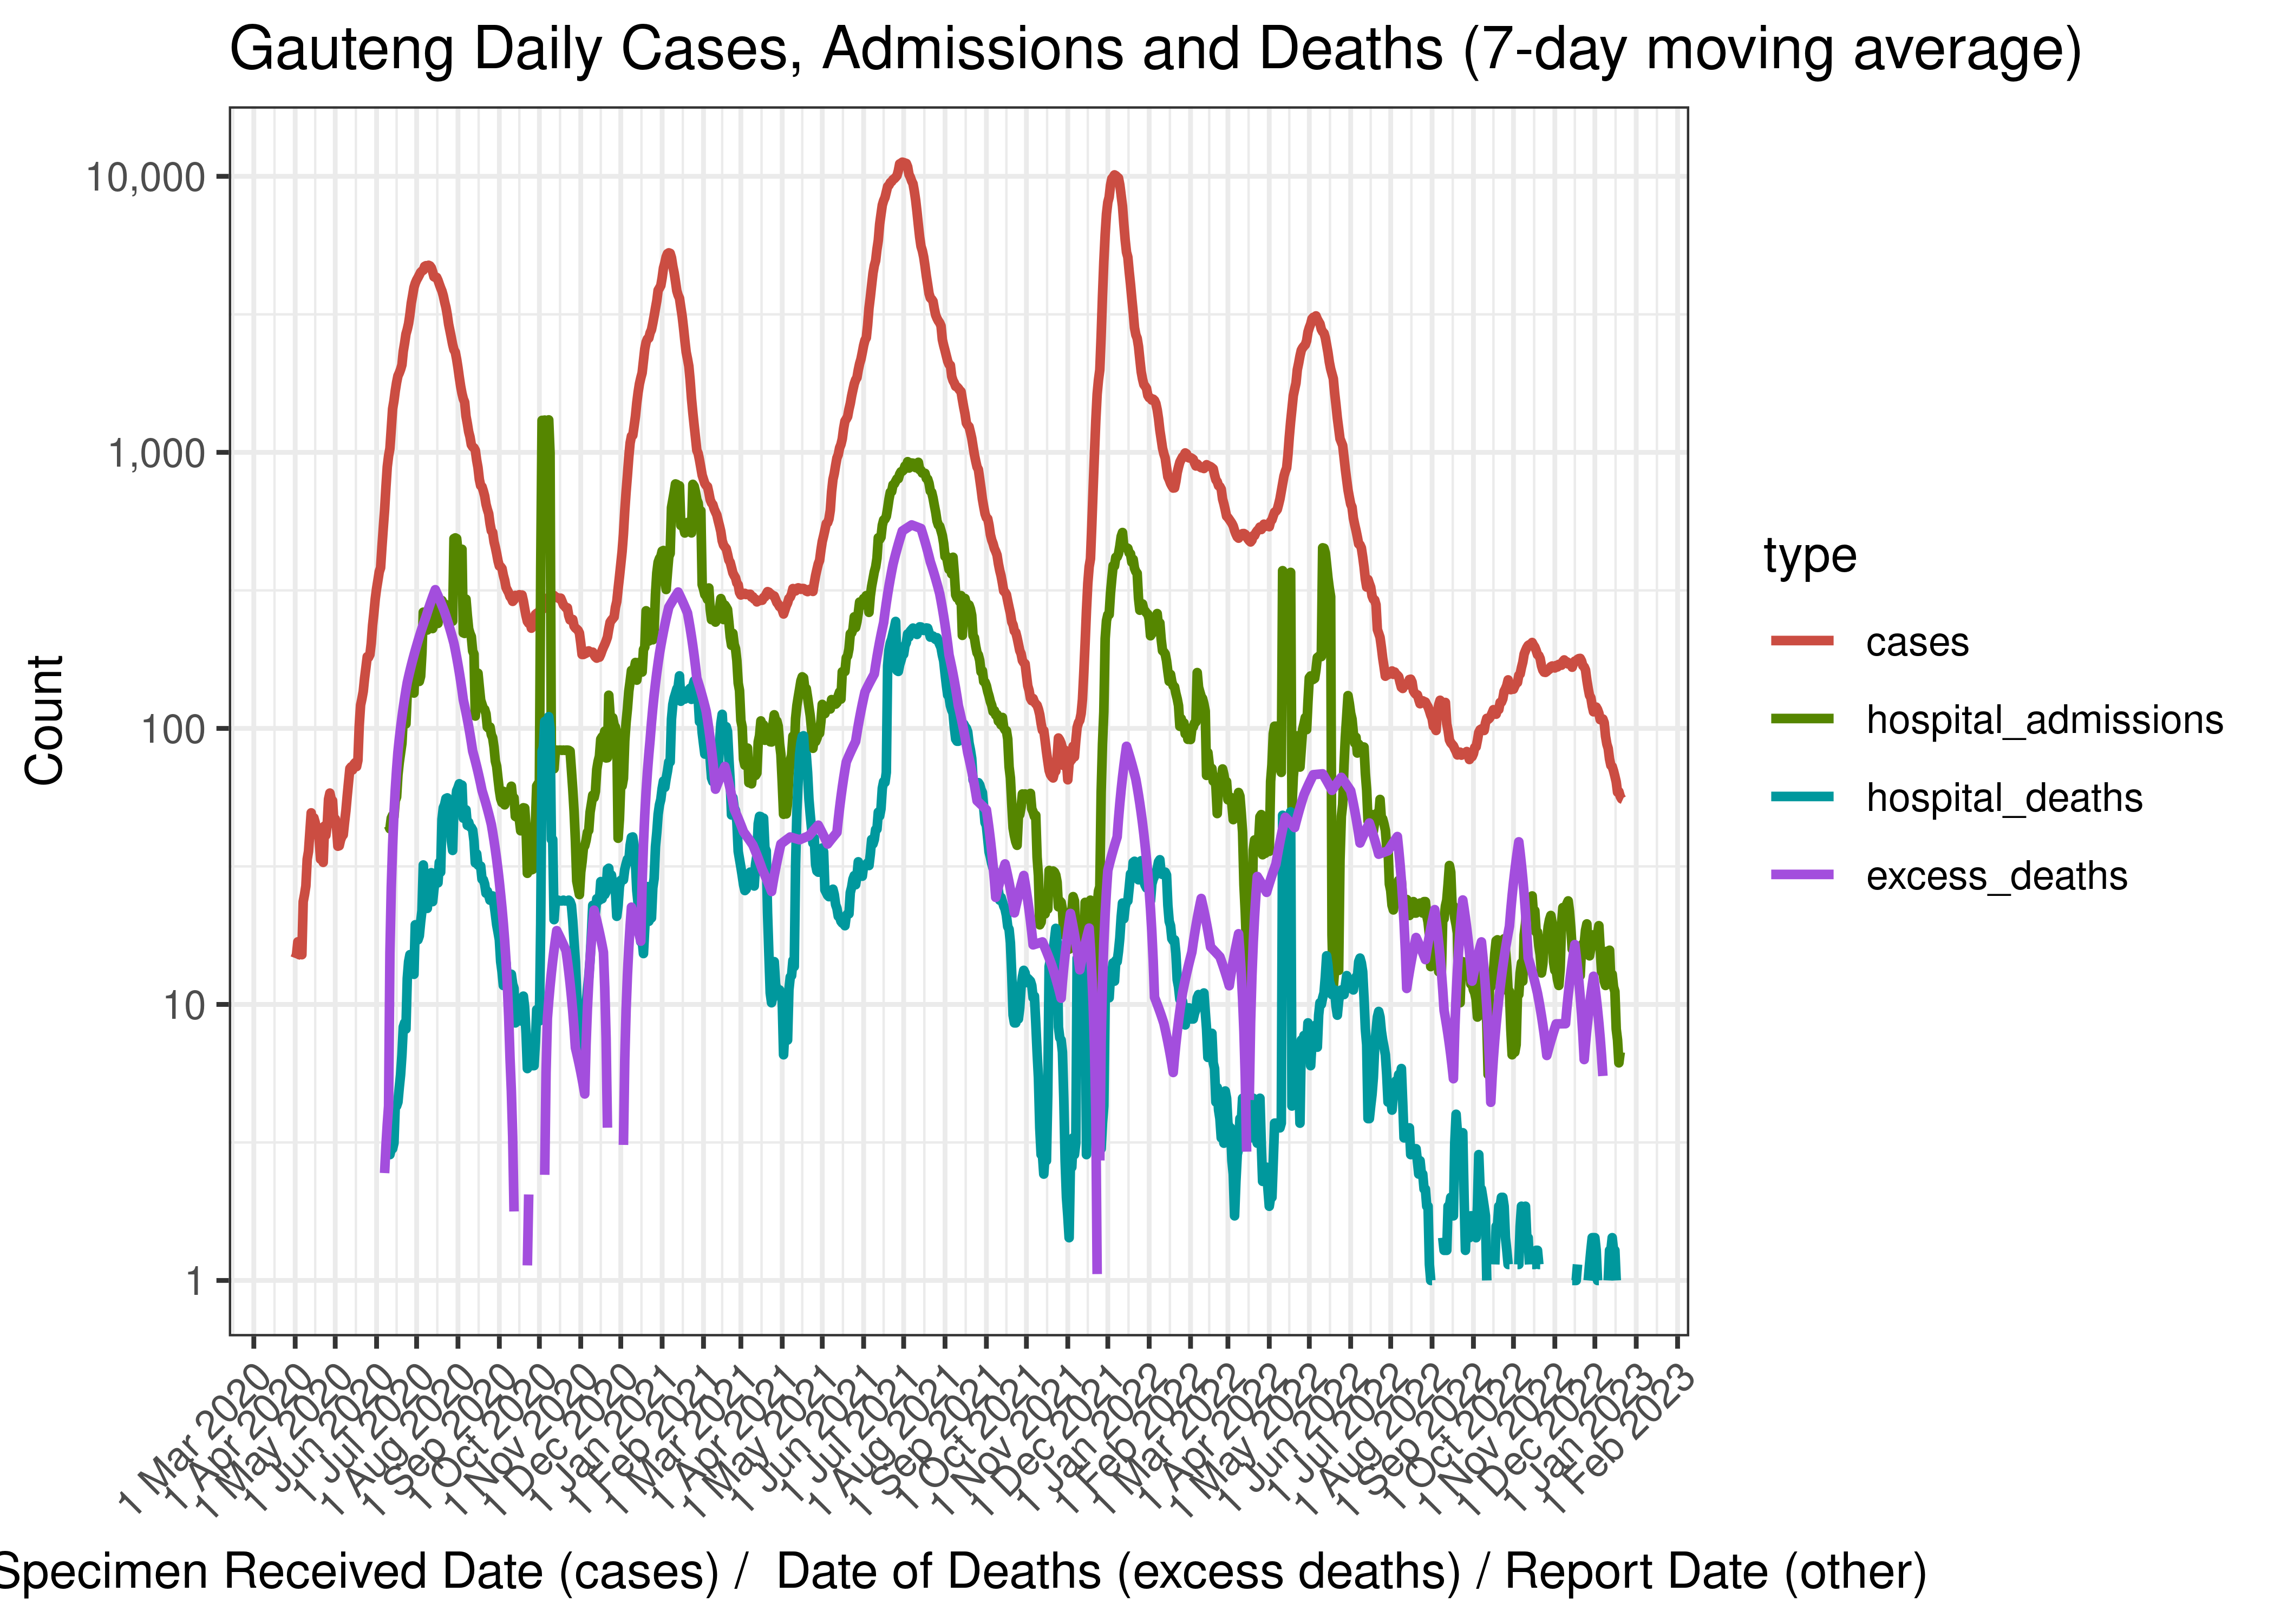
Gauteng Daily Cases, Admissions and Deaths (7-day moving average)
Below the above chart is repeated for the last 30-days:
Gauteng Daily Cases, Admissions and Deaths for Last 30-days (7-day moving average)
6.4.6 Crude Ratios per Wave
Below crude rations are calculated between the waves. It’s based on the following starting dates:
- Wave 1 started on 2020-01-01.
- Wave 2 started on 2020-10-01.
- Wave 3 started on 2021-04-01.
- Wave 4 started on 2021-11-01.
- Wave 5 started on 2022-04-01.
Below crude ratios are tabulated and plotted. These ratios are:
- Case admissions ratio calculated as admissions divided by cases.
- Case fatality ratio calculated as hospital deaths divided by cases (Note that COVID-19 deaths are under-reported by a significant factor in South Africa).
- Case excess deaths ratio calculated as excess deaths divided by cases.
- Hospital fatality ratio calculated as hospital deaths divided by admissions (Note that COVID-19 deaths are under-reported by a significant factor in South Africa).
- Death reporting ratio calculated as hospital deaths divided by excess deaths.
| Wave | Case Admission Ratio | Case Fatality Ratio | Case Excess Deaths Ratio | Hospital Fatality Ratio | Death Reporting Ratio | |
|---|---|---|---|---|---|---|
| Gauteng | Wave 1 | 8.1% | 1.24% | 5.81% | 15.4% | 21.4% |
| Gauteng | Wave 2 | 23.9% | 4.76% | 6.64% | 19.9% | 71.7% |
| Gauteng | Wave 3 | 12.0% | 3.07% | 5.97% | 25.5% | 51.5% |
| Gauteng | Wave 4 | 7.6% | 0.66% | 1.22% | 8.6% | 54.1% |
| Gauteng | Wave 5 | 10.5% | 0.95% | 5.12% | 9.0% | 18.5% |
Below the rations above are plotted graphically:
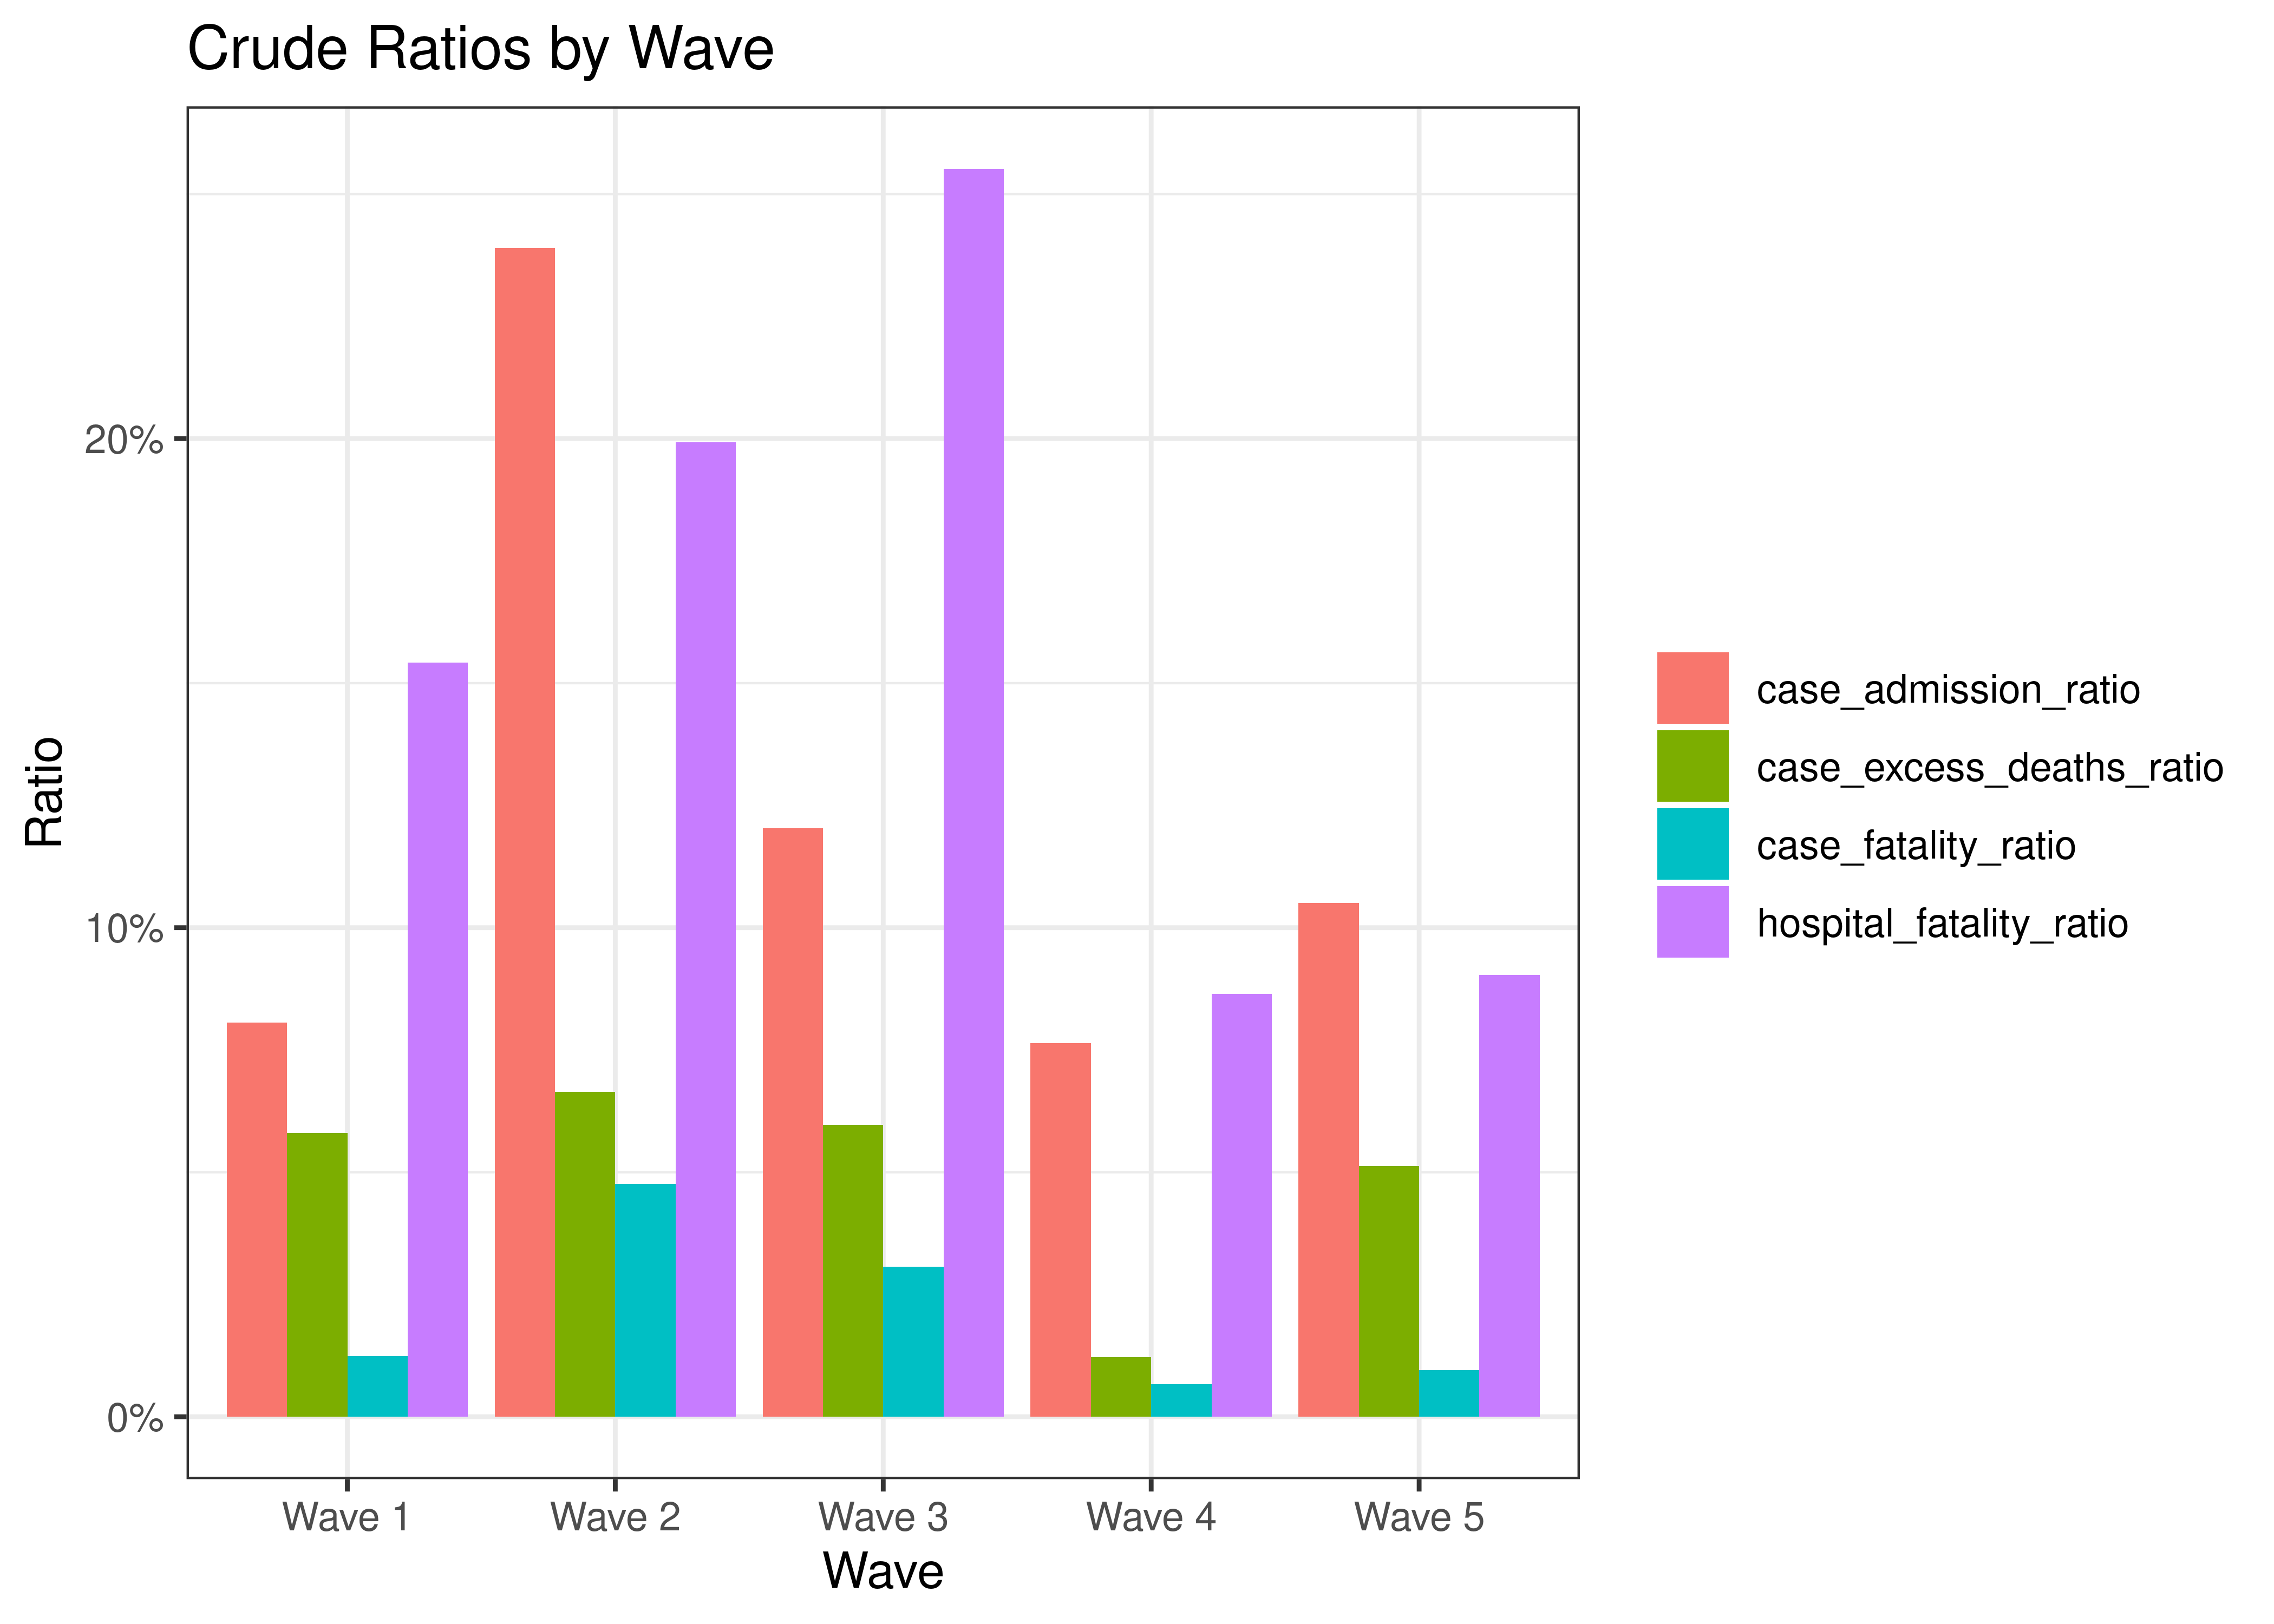
Crude Ratios by Wave
6.4.7 Reproduction Number
Below current (last weekly) effective reproduction number estimates are tabulated for Gauteng and by district municipality.
| Type | Count (Per Day) | Week Ending | Reproduction Number [95% Confidence Interval] | |
|---|---|---|---|---|
| Gauteng | cases | 55.3 | 2022-12-25 | 0.86 [0.77 - 0.95] |
| Gauteng | hospital_admissions | 6.7 | 2022-12-23 | 0.61 [0.44 - 0.81] |
| District Municipality | Type | Count (Per Day) | Week Ending | Reproduction Number [95% Confidence Interval] |
|---|---|---|---|---|
| City Of Johannesburg Metro | cases | 27.7 | 2022-12-25 | 0.90 [0.77 - 1.03] |
| City Of Tshwane Metro | cases | 12.6 | 2022-12-25 | 0.73 [0.58 - 0.91] |
| Ekurhuleni Metro | cases | 10.0 | 2022-12-25 | 1.04 [0.81 - 1.31] |
| Sedibeng | cases | 2.6 | 2022-12-25 | 0.79 [0.48 - 1.19] |
| West Rand | cases | 2.4 | 2022-12-25 | 0.82 [0.48 - 1.25] |
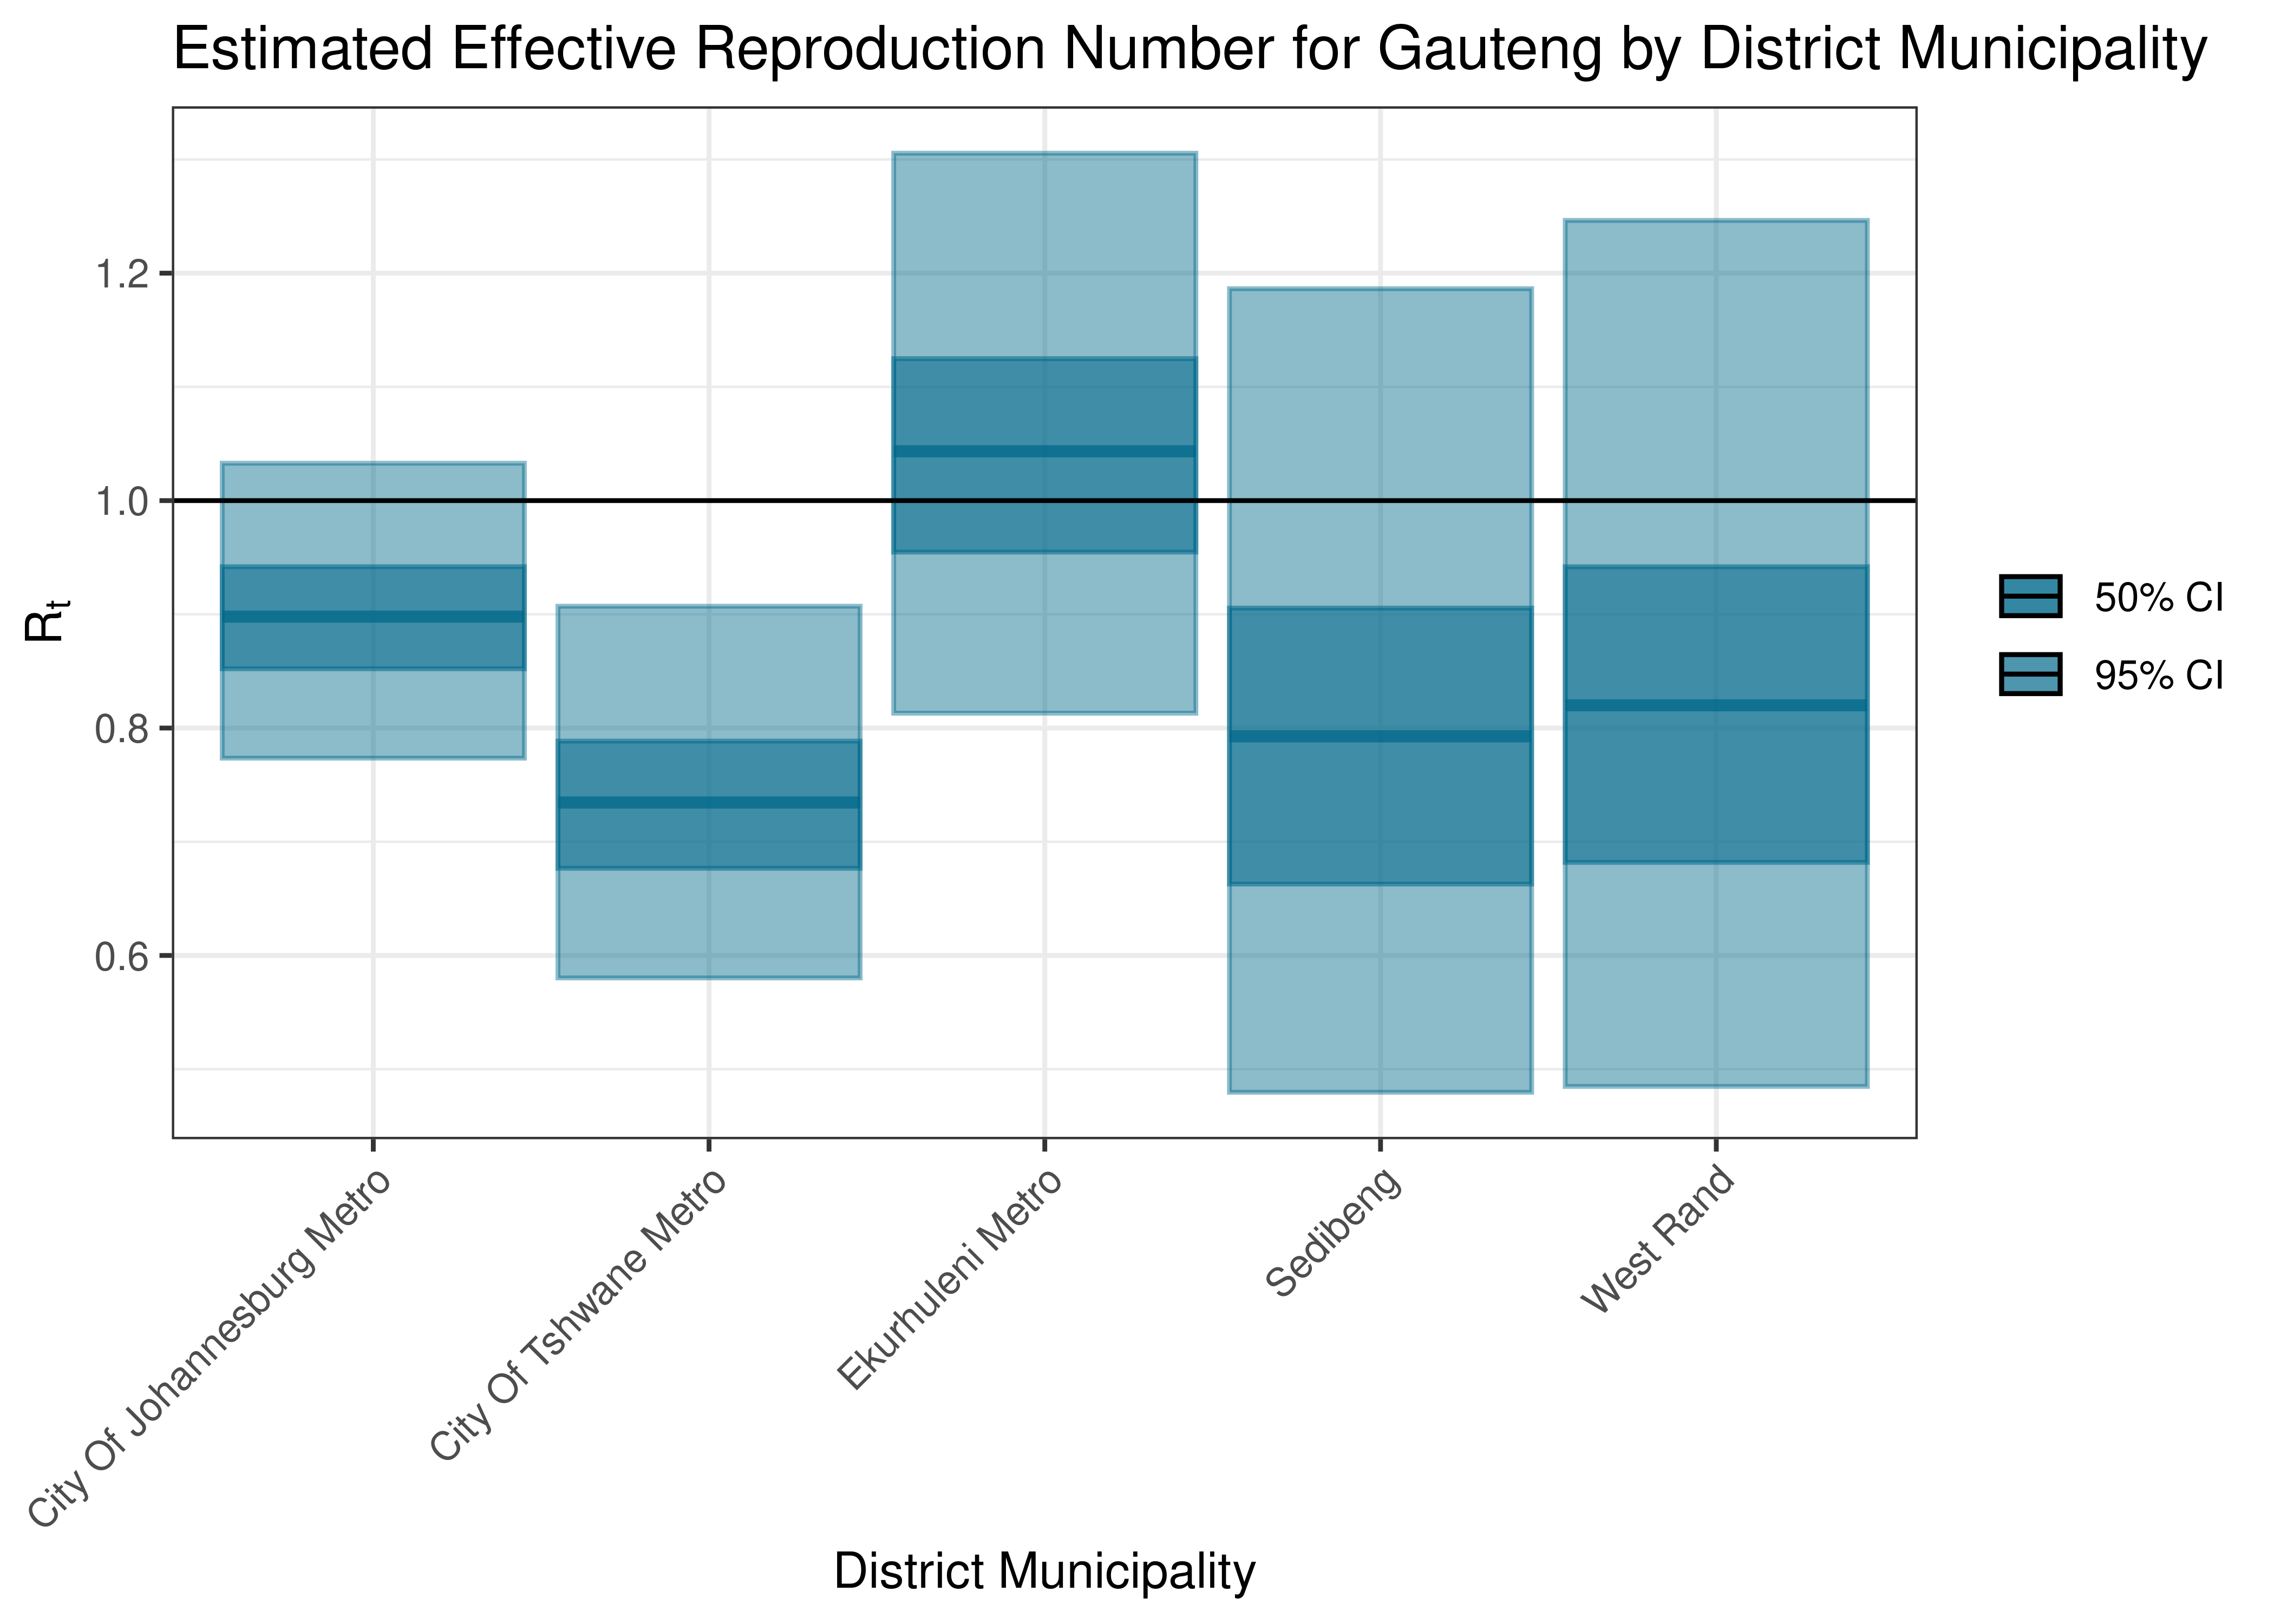
Estimated Effective Reproduction Number for Gauteng by District Municipality
Below the effective reproduction number for Gauteng over the last 90 days are plotted together with a plot since start of the pandemic.
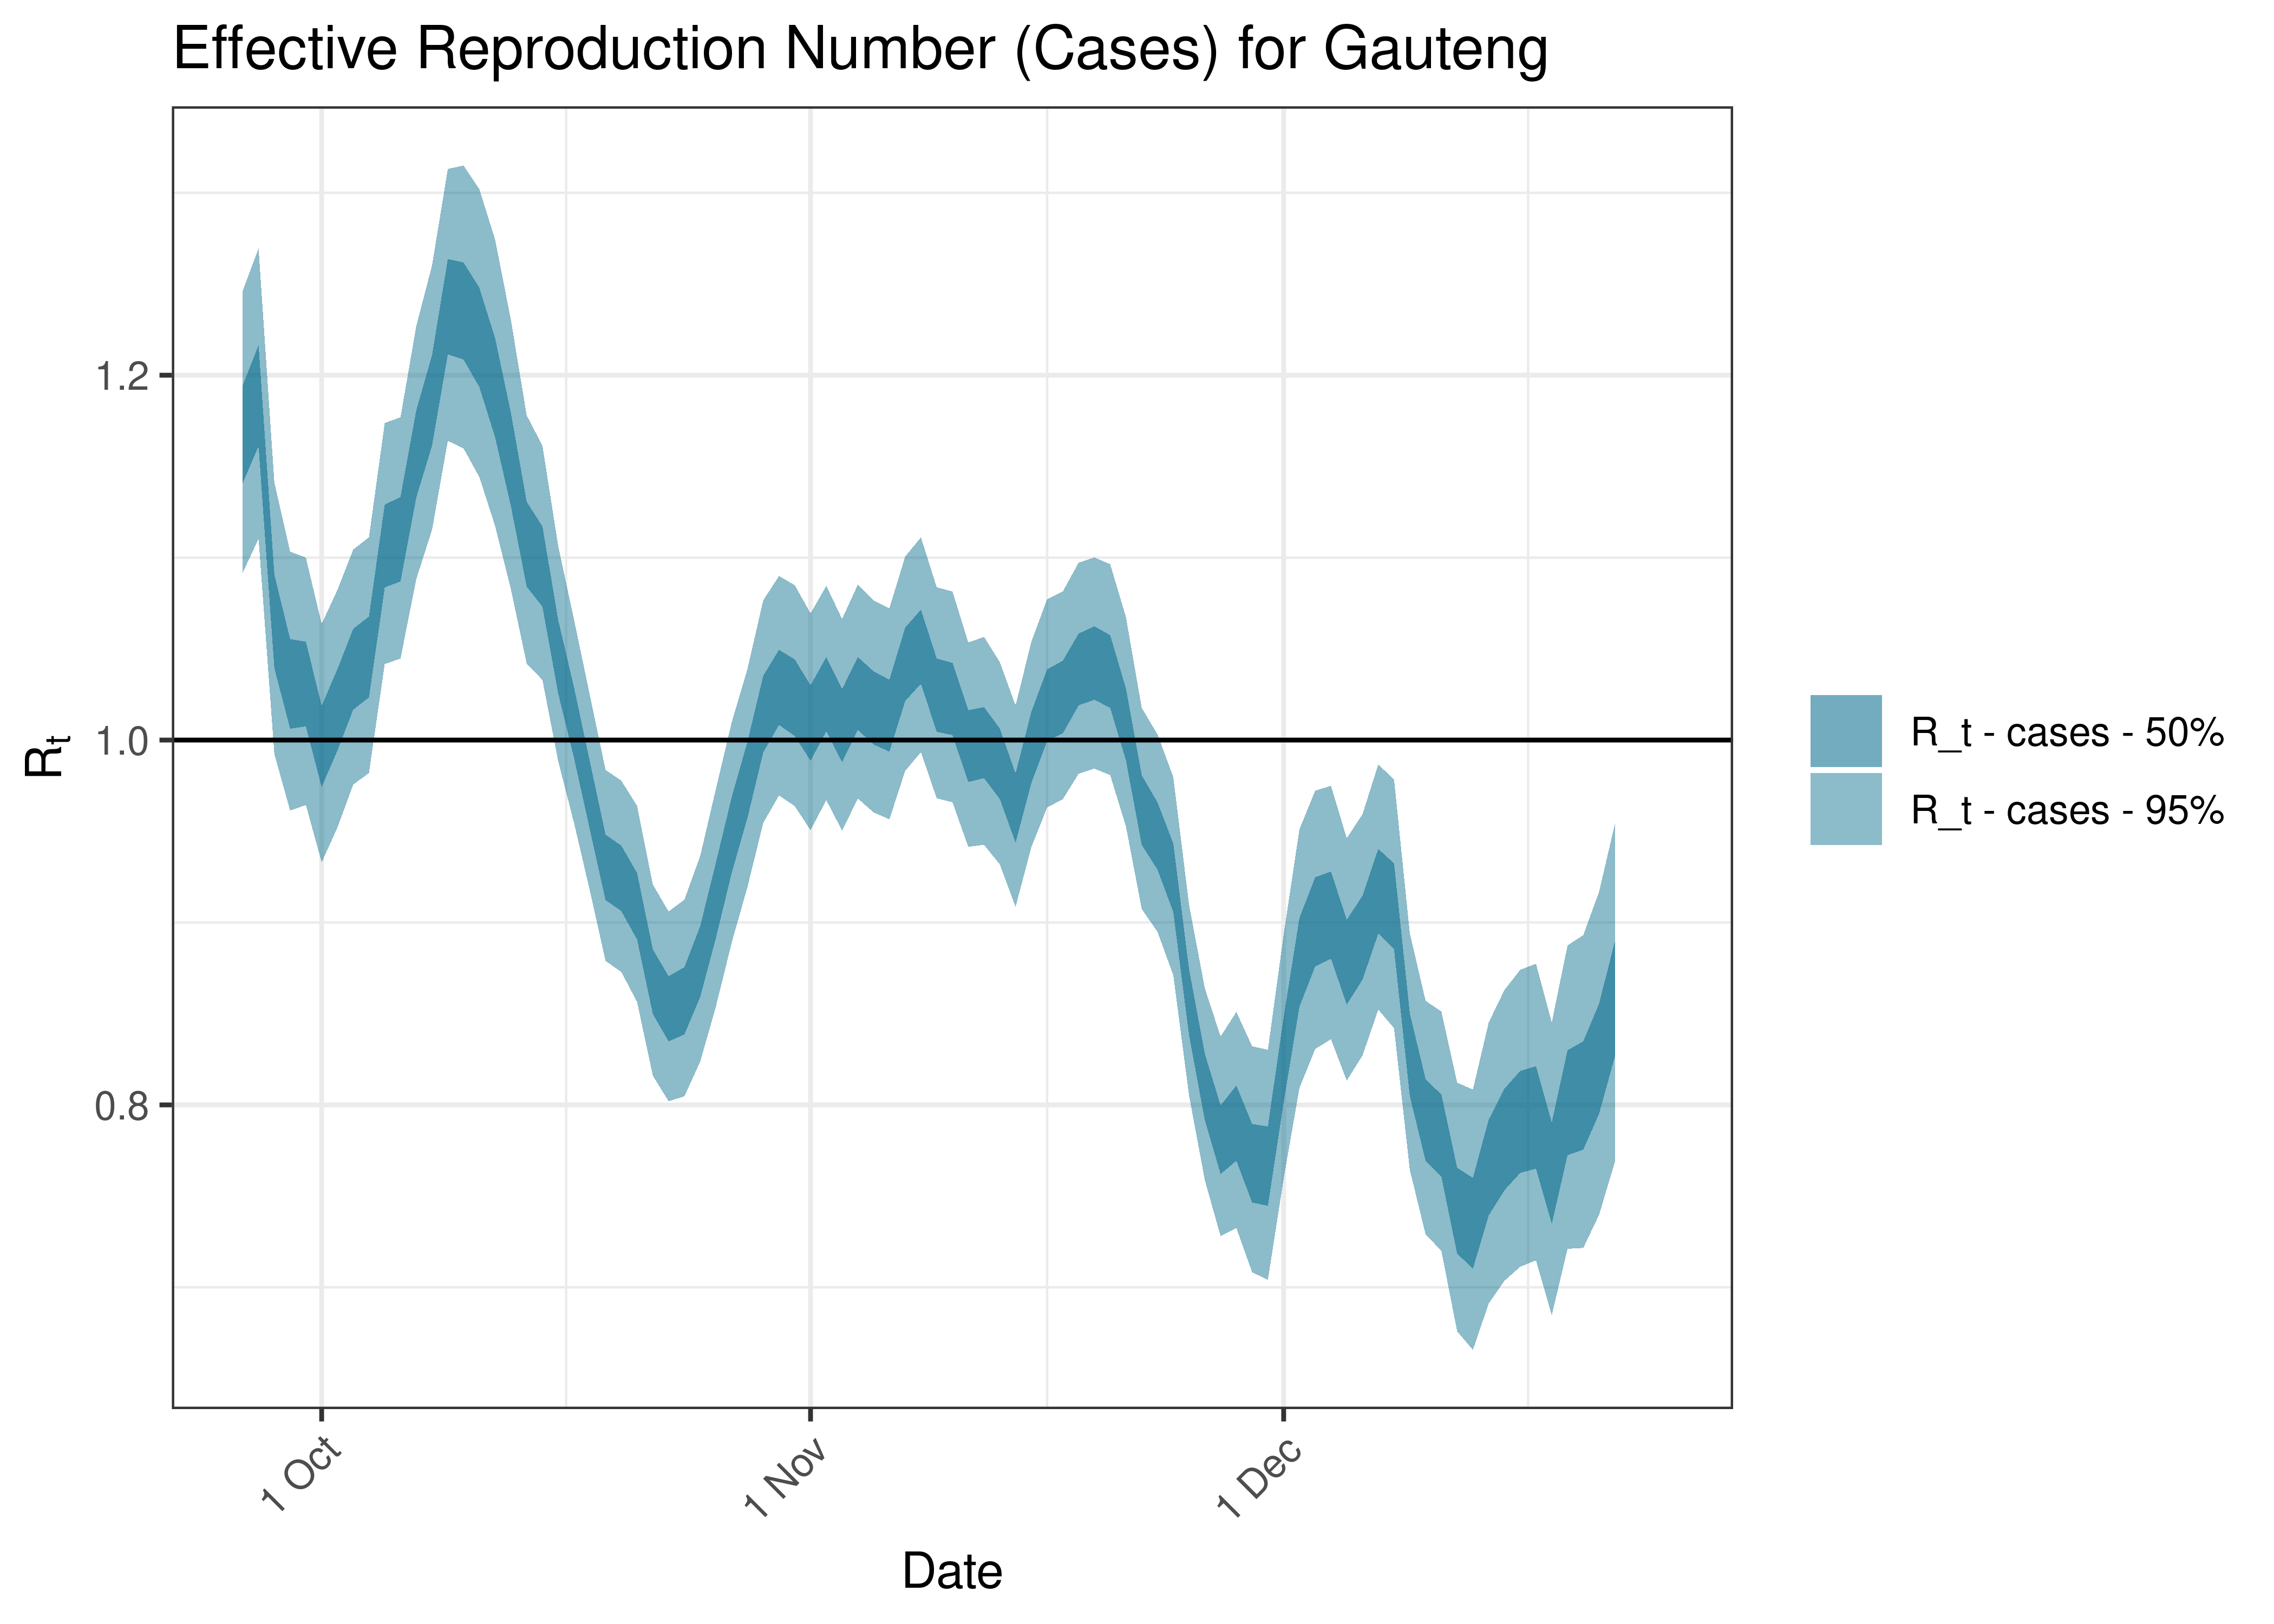
Estimated Effective Reproduction Number Based on Cases for Gauteng over last 90 days
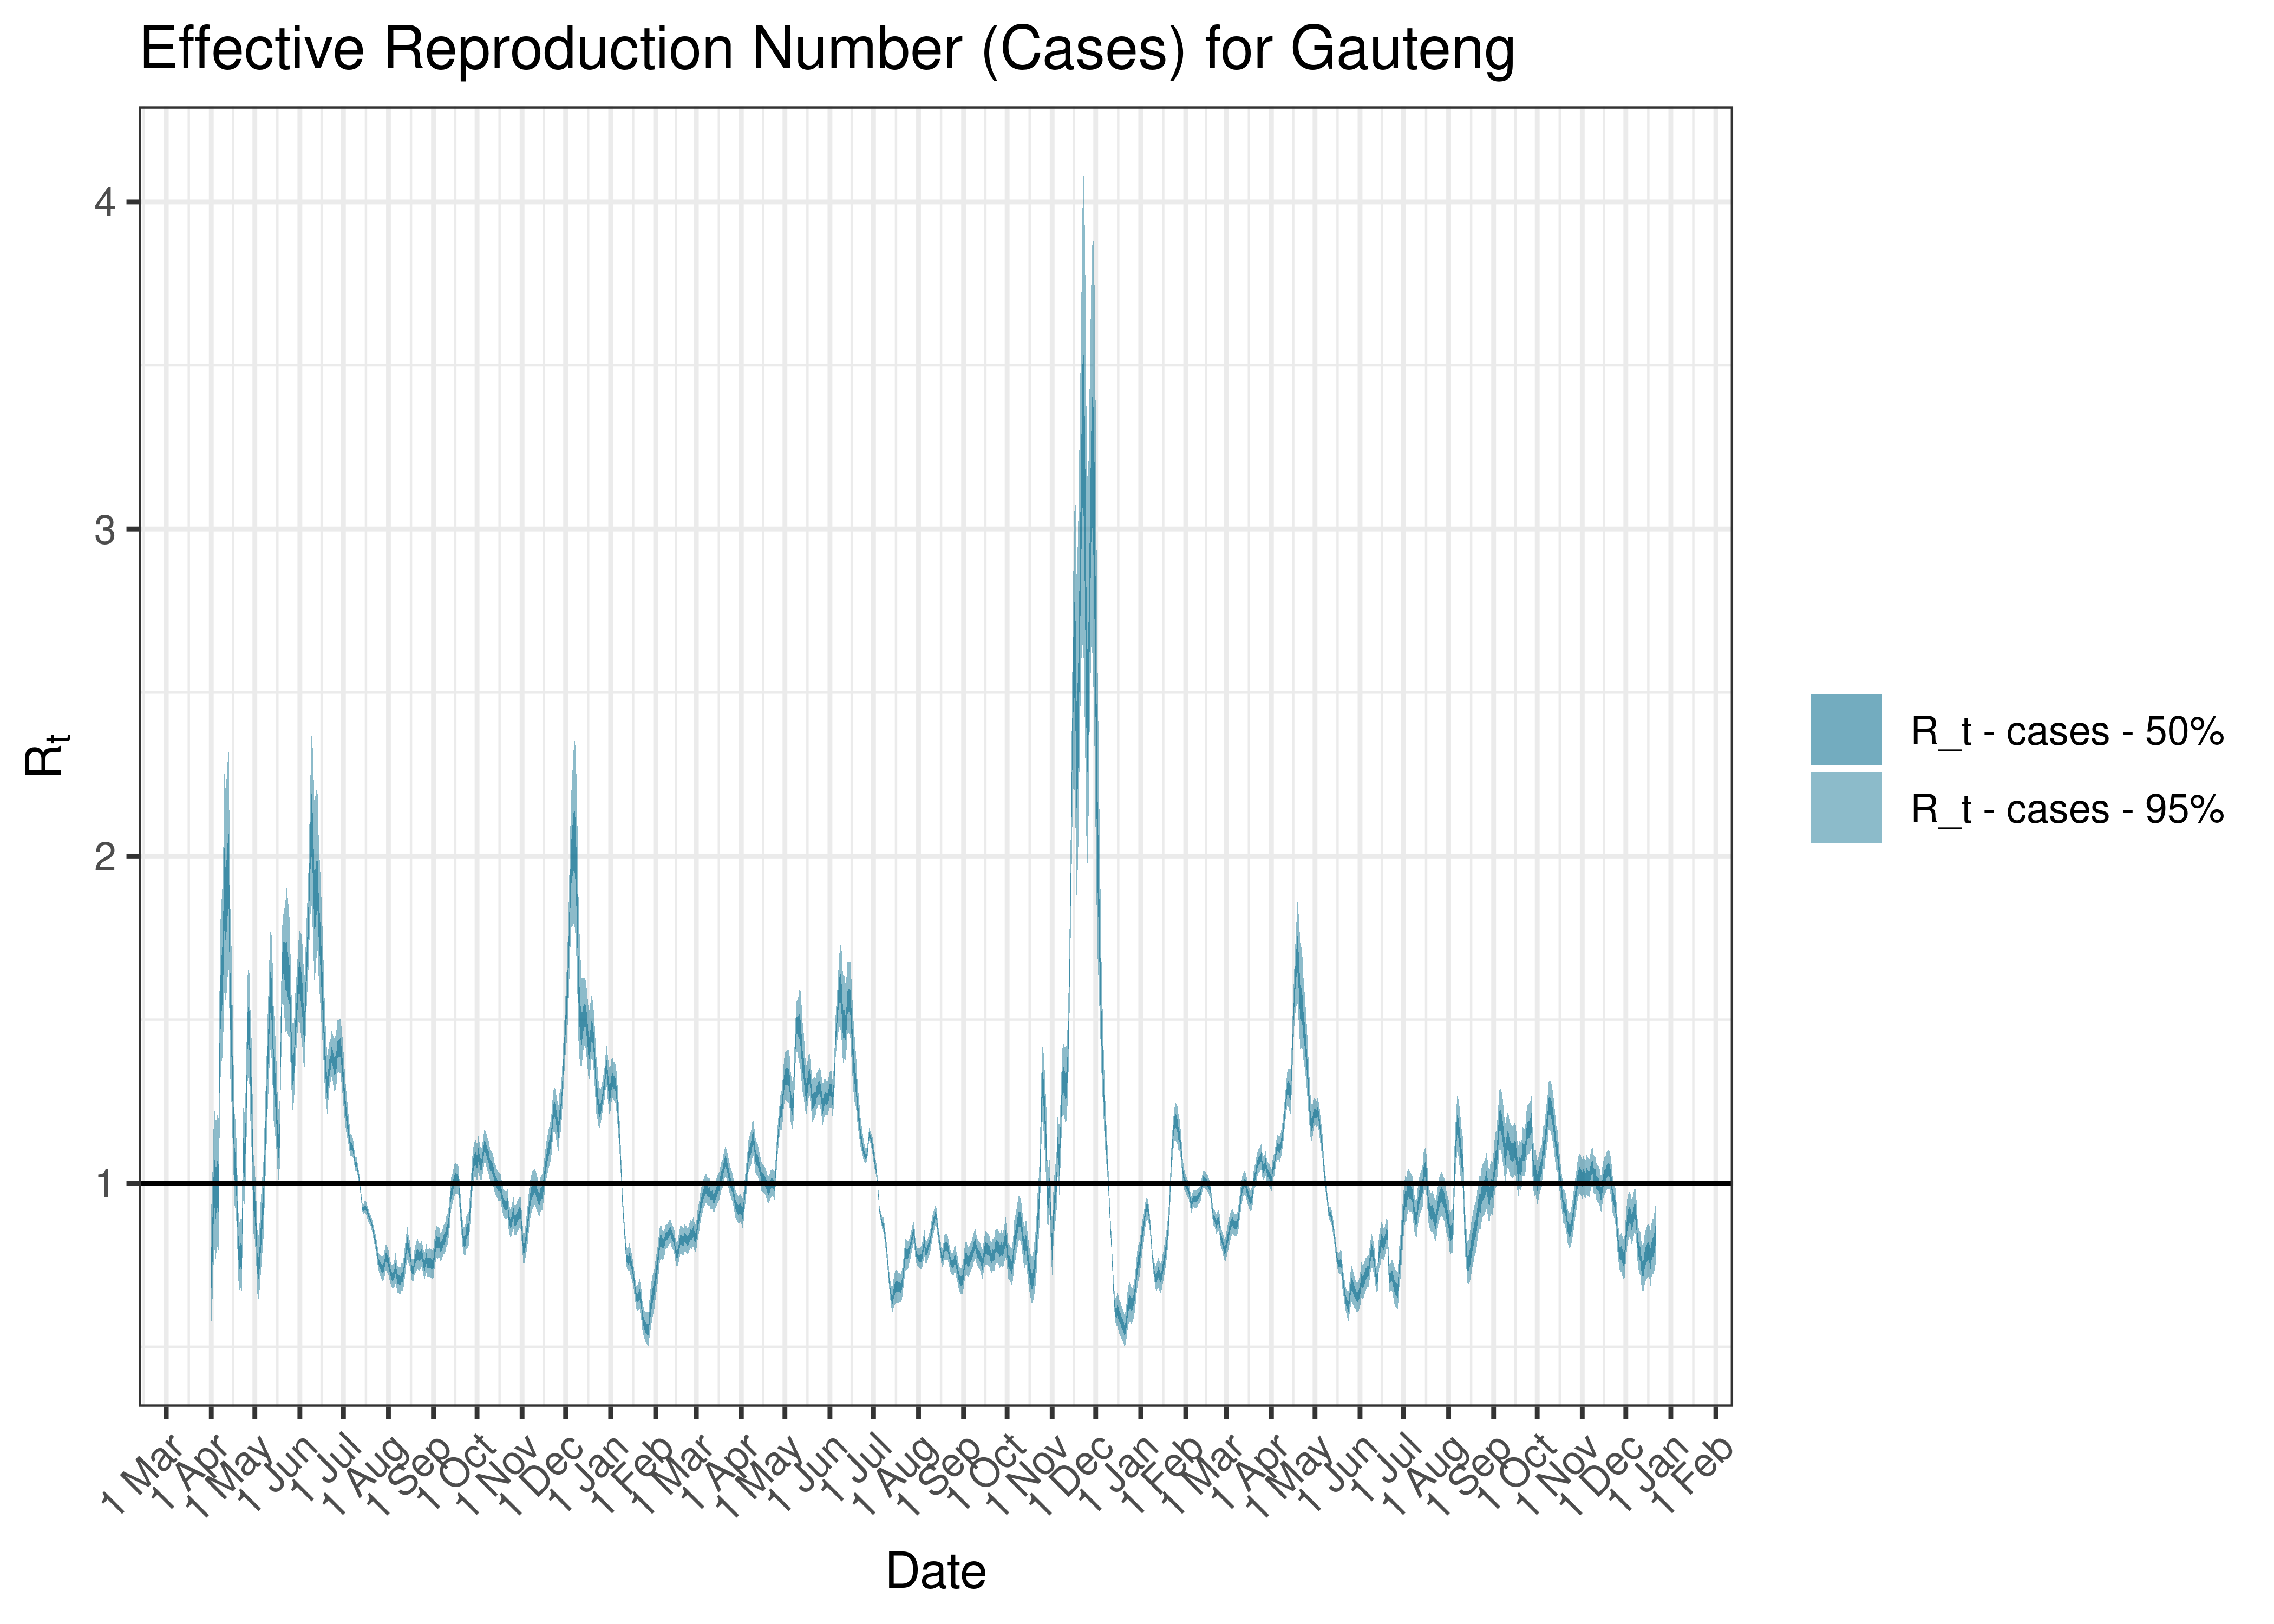
Estimated Effective Reproduction Number Based on Cases for Gauteng since 1 April 2020
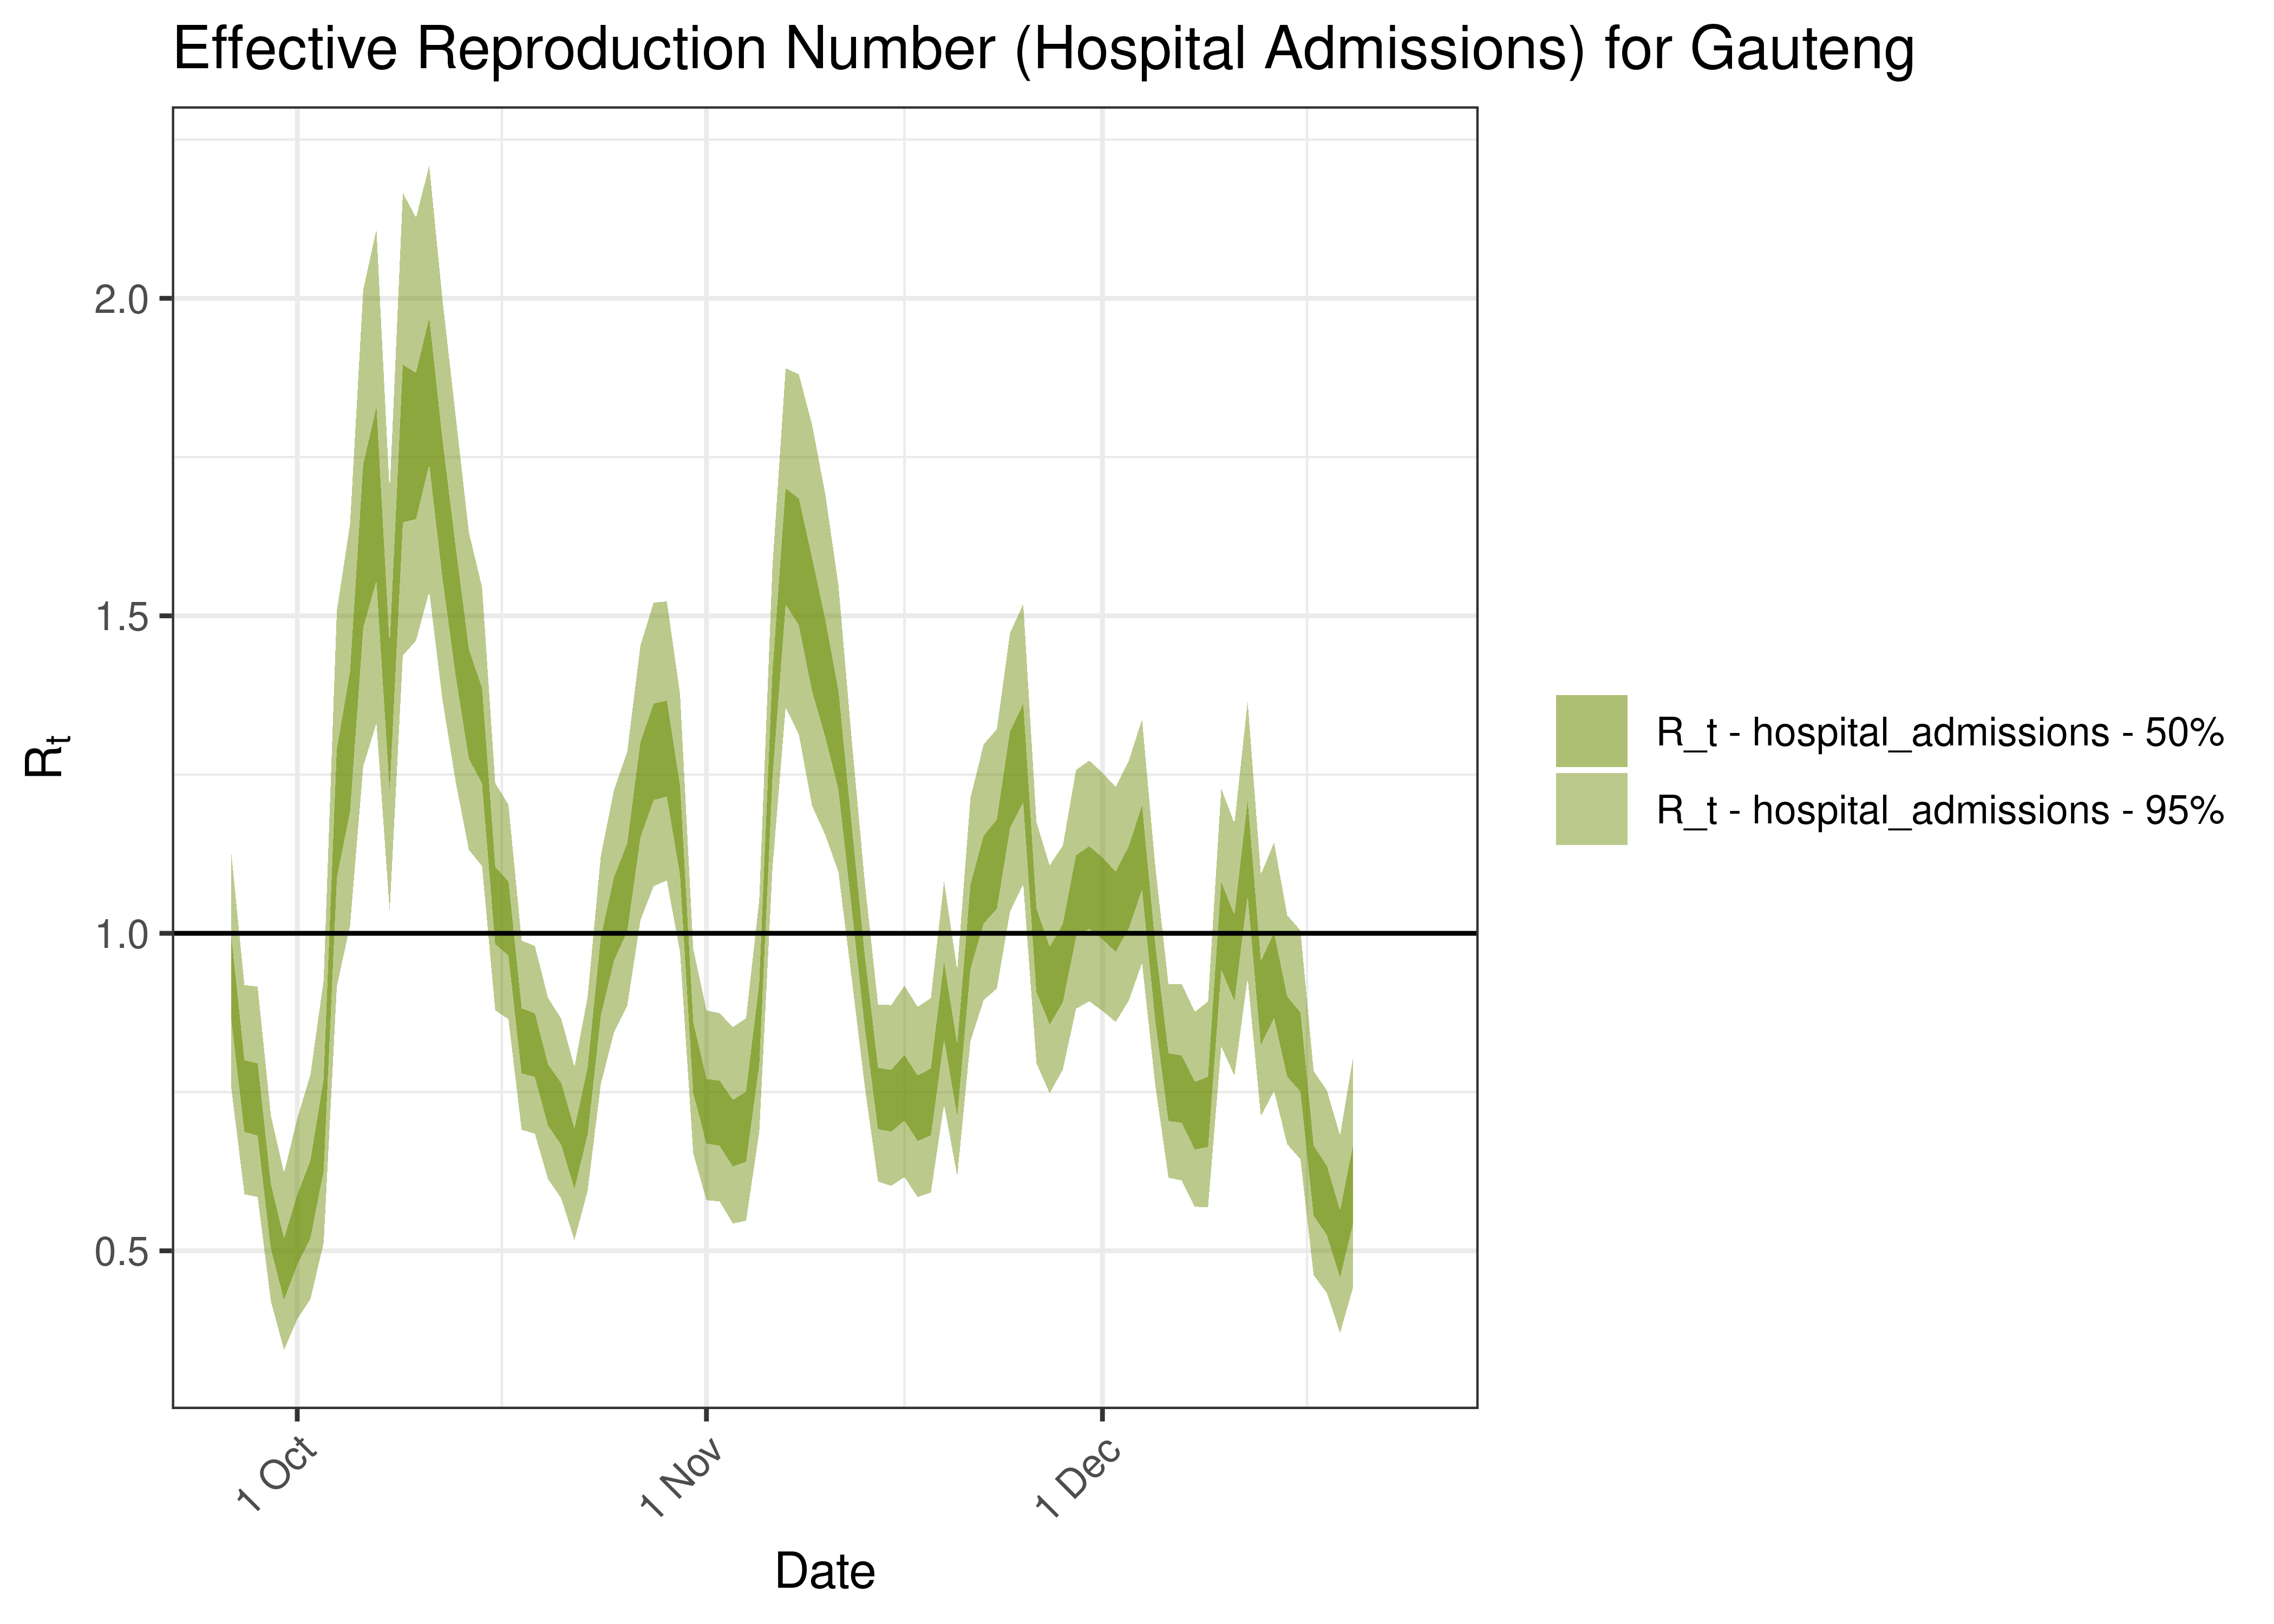
Estimated Effective Reproduction Number Based on Hospital Admissions for Gauteng over last 90 days
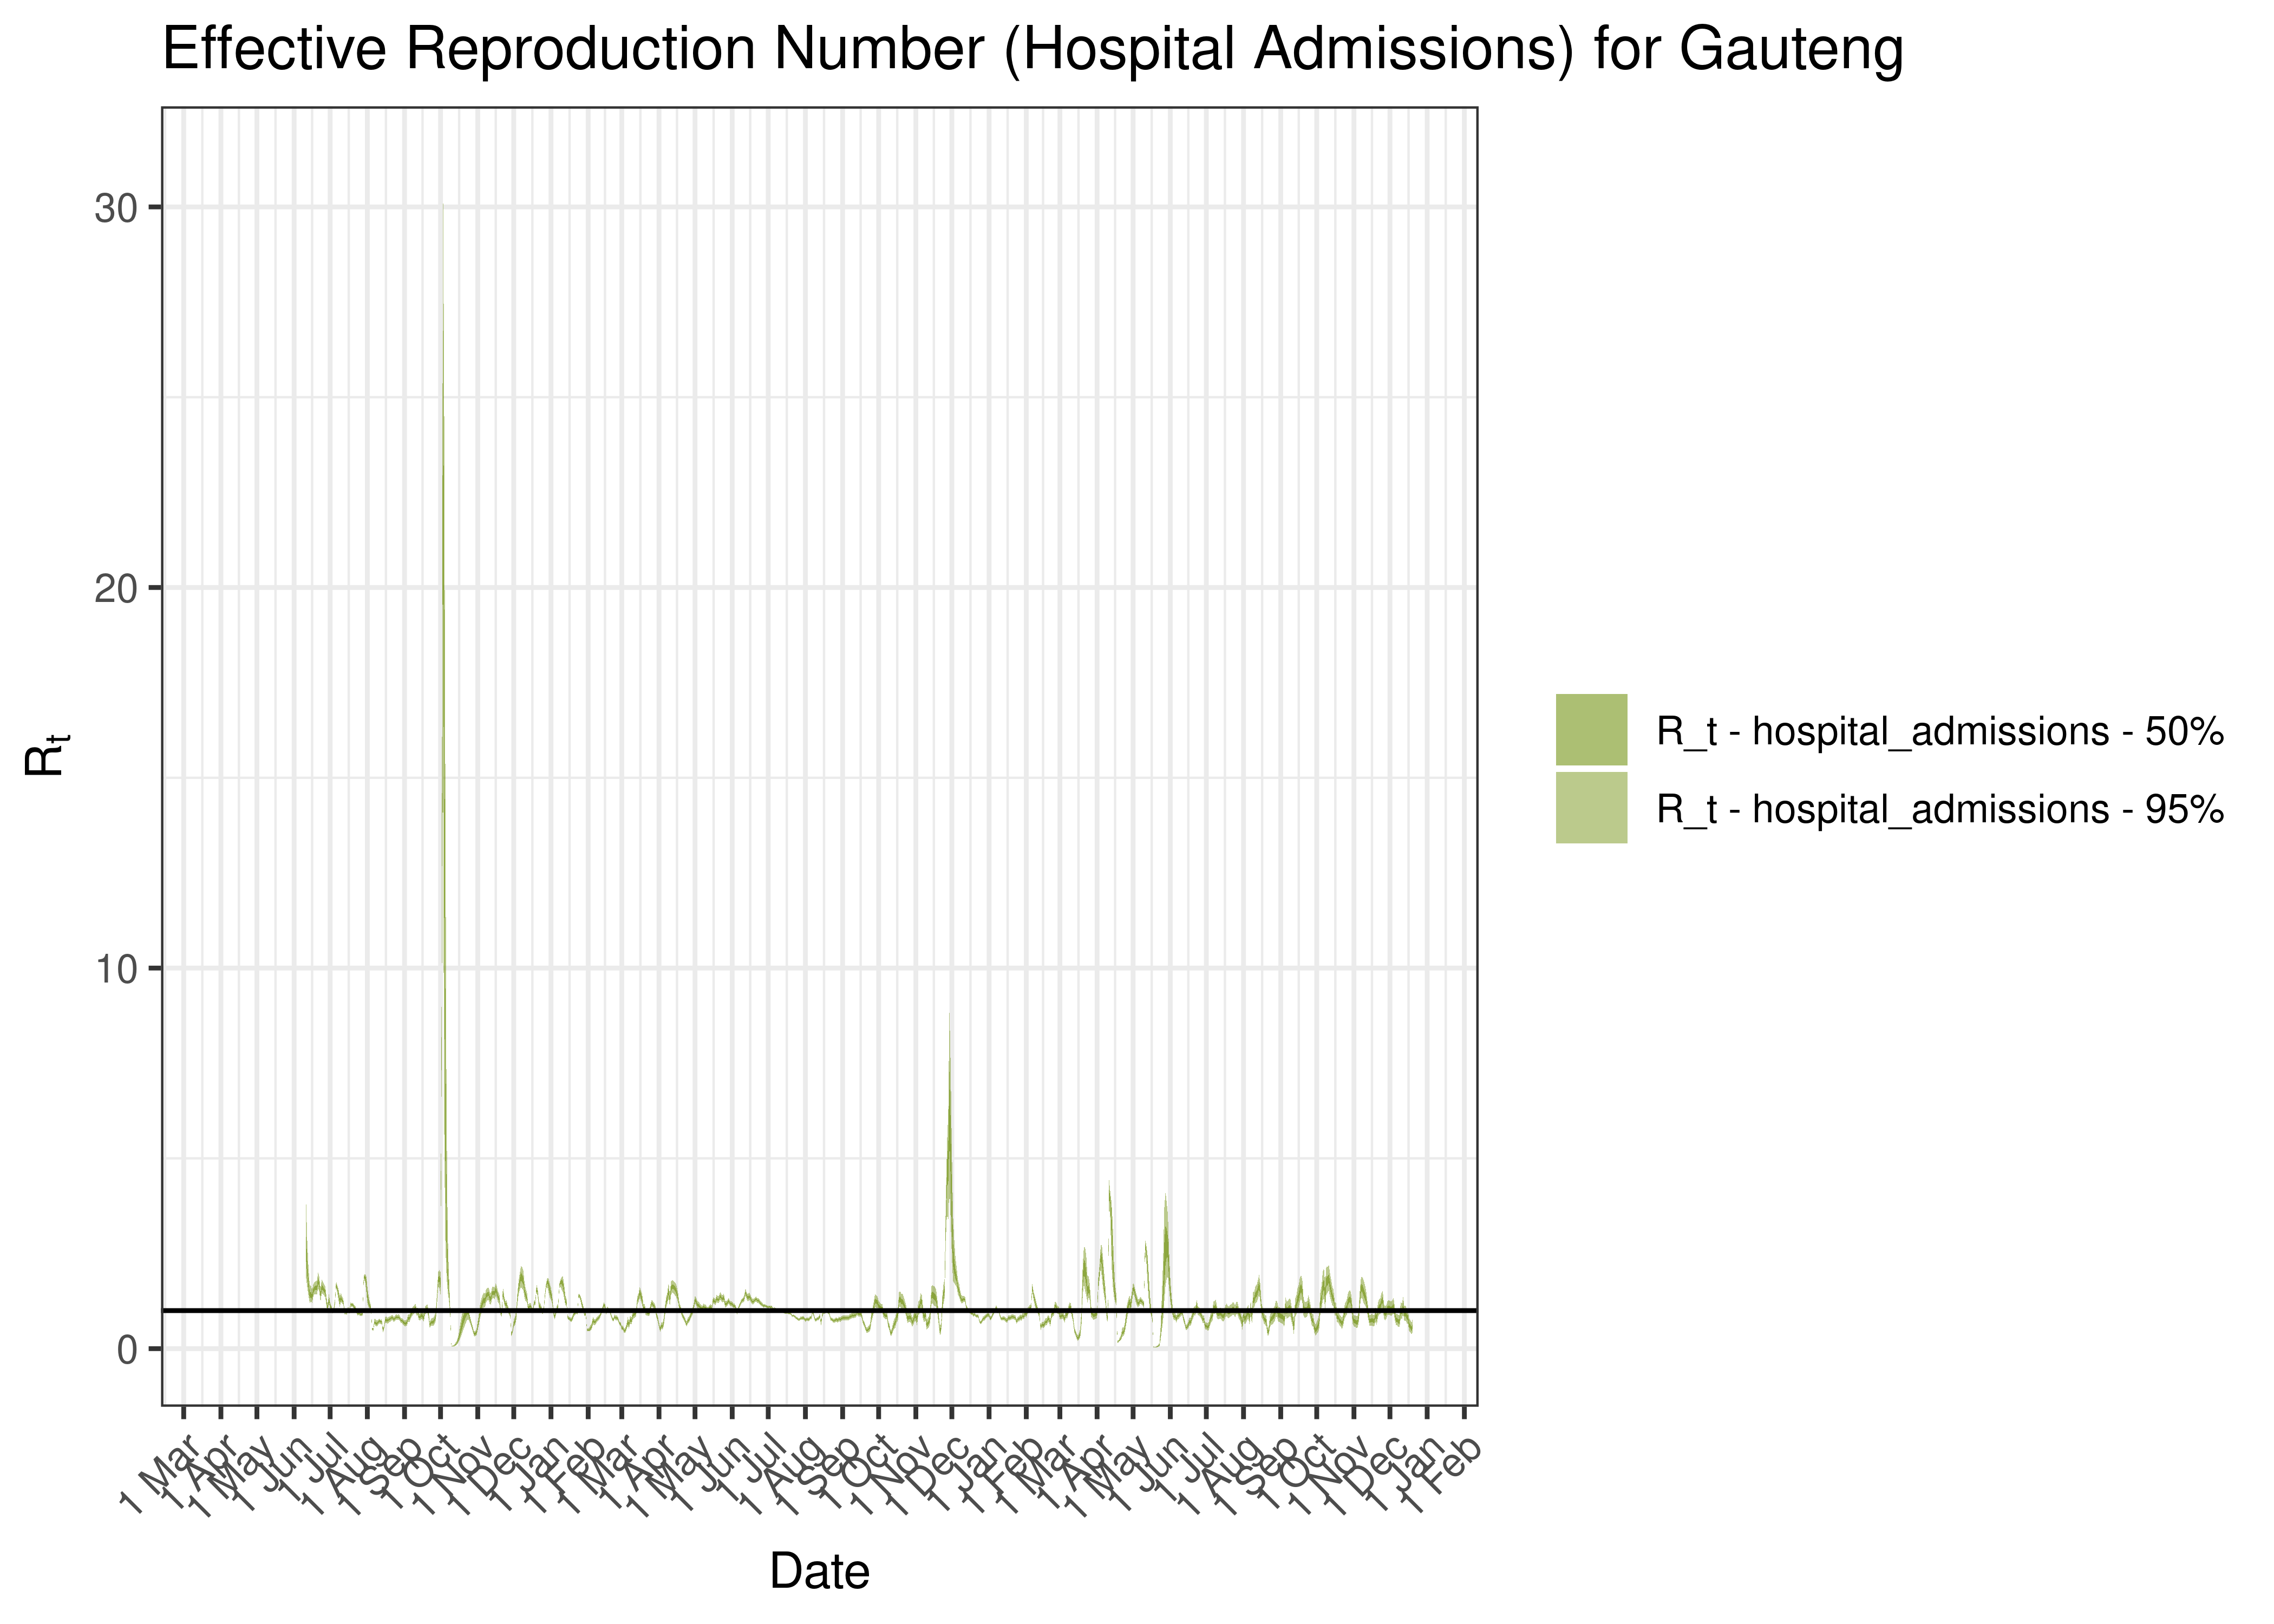
Estimated Effective Reproduction Number Based on Hospital Admissions for Gauteng since 1 April 2020
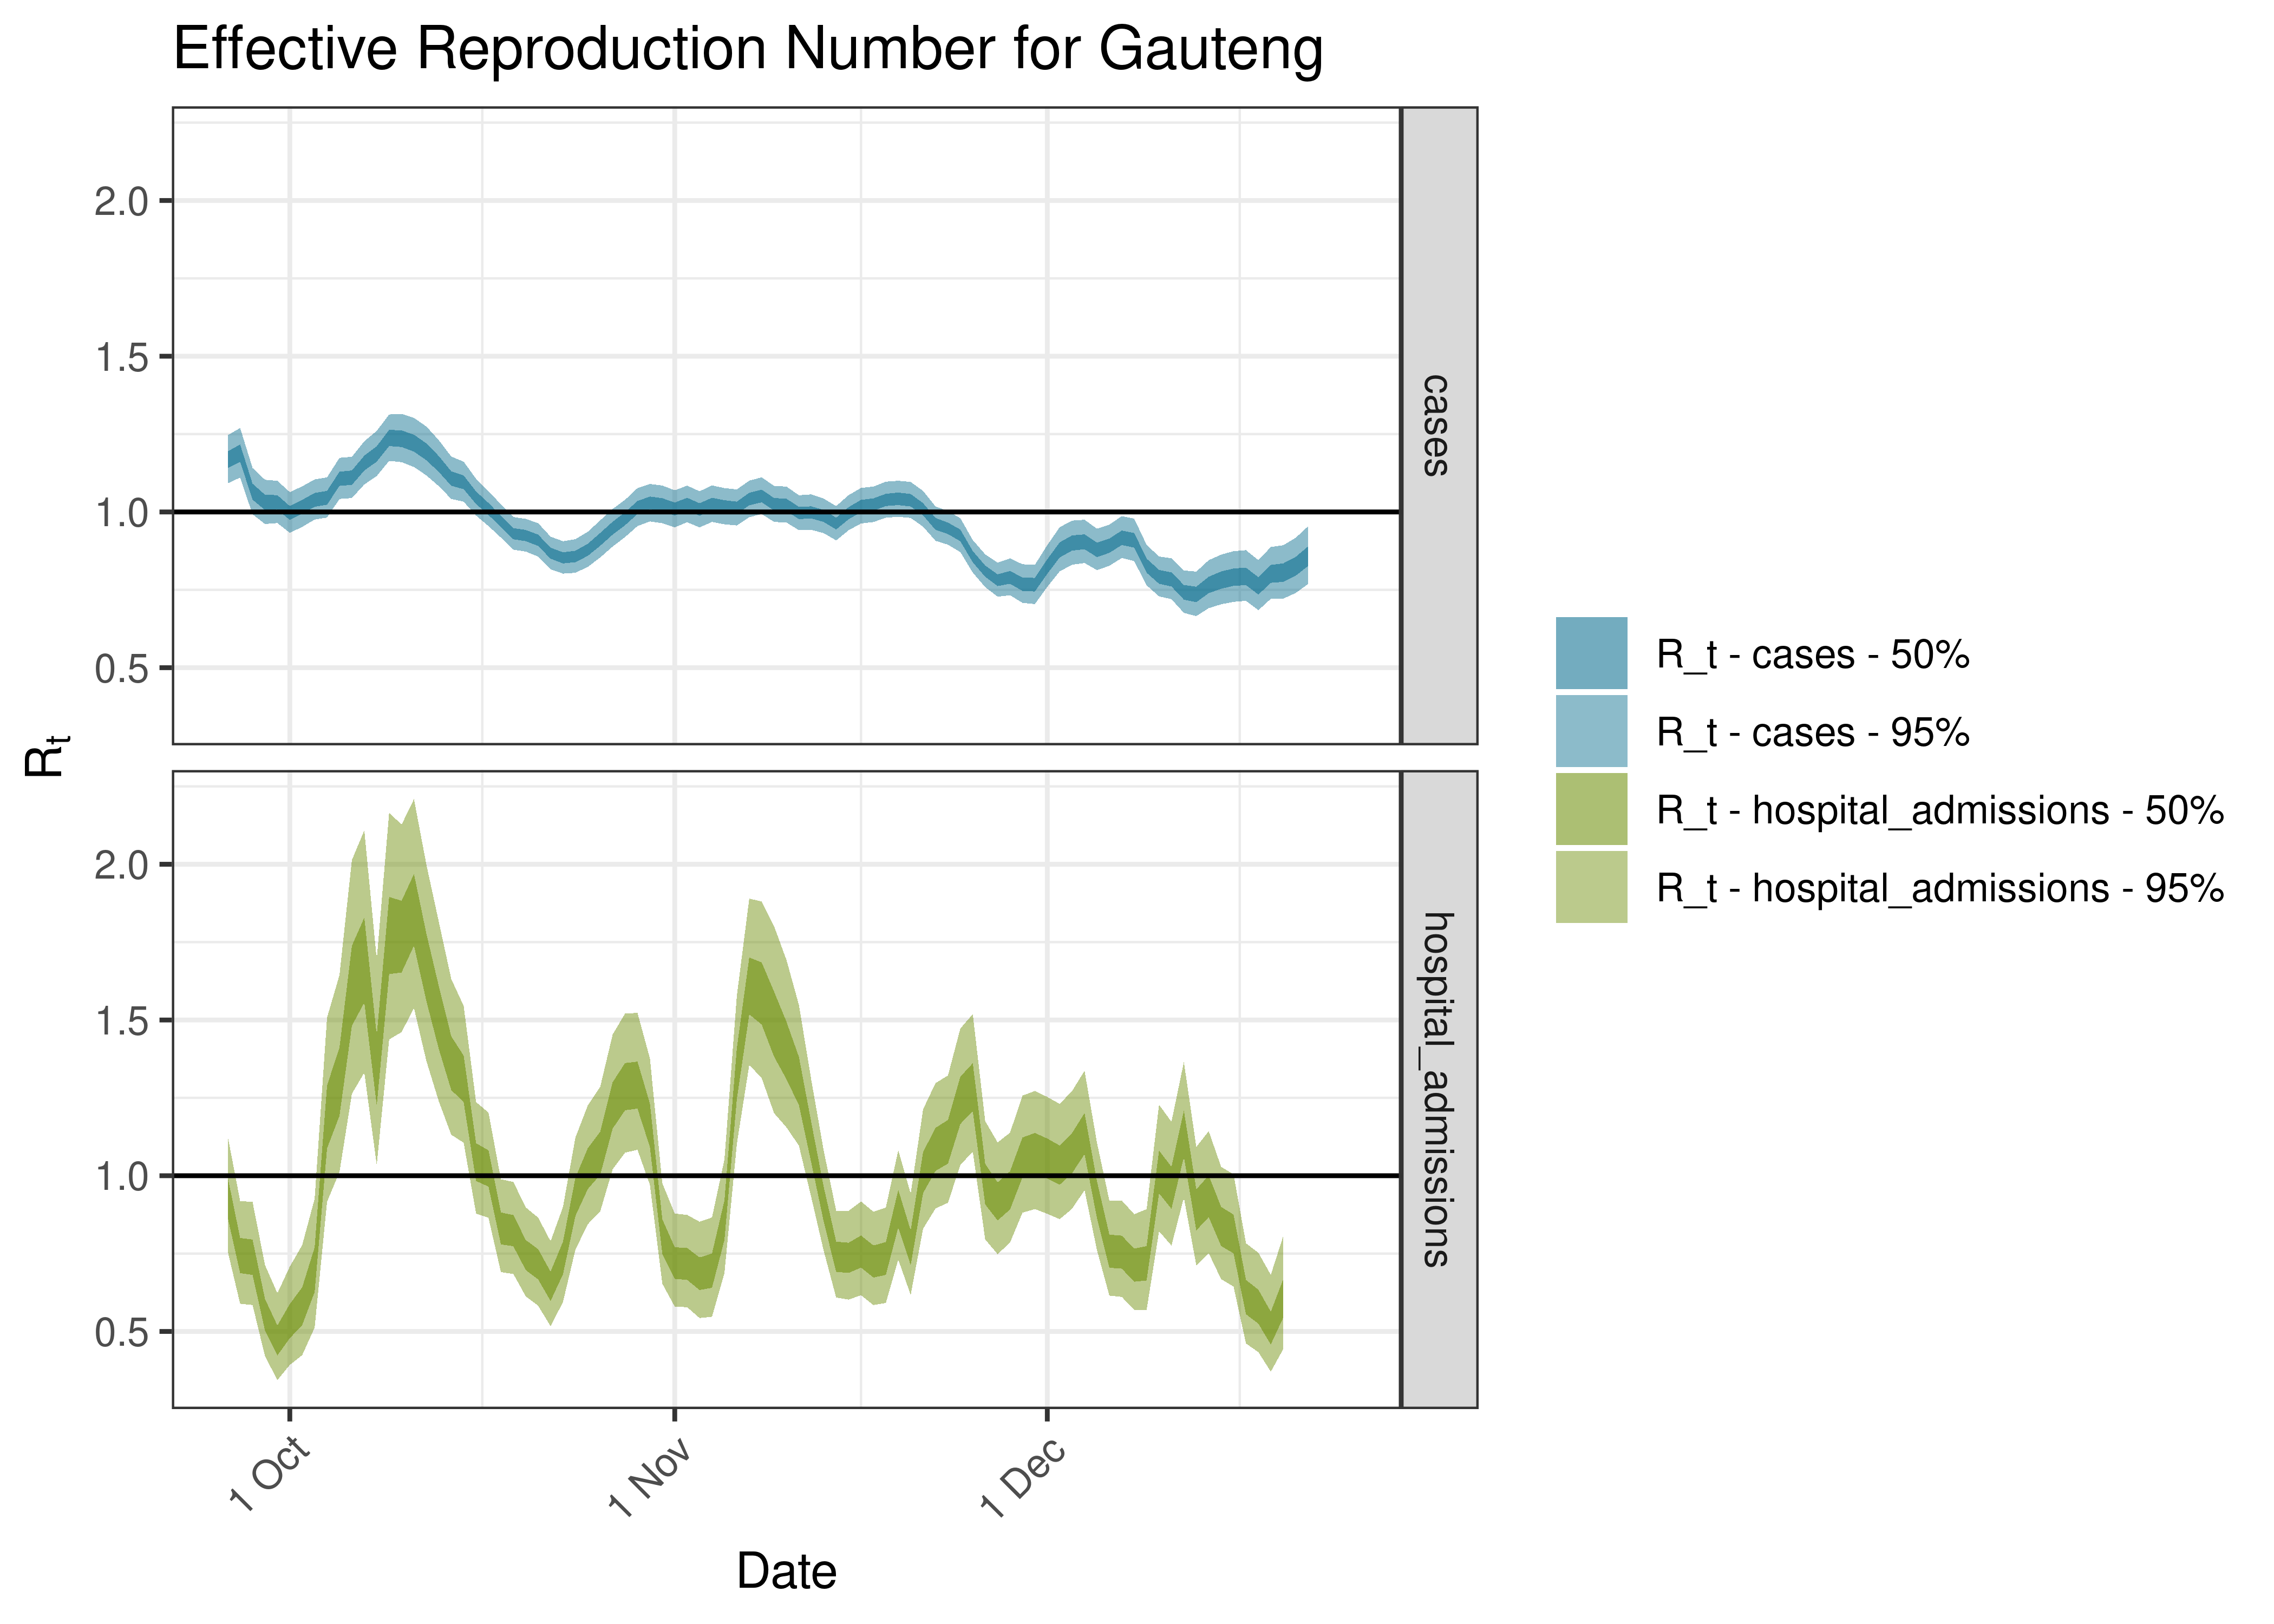
Estimated Effective Reproduction Number for Gauteng over last 90 days
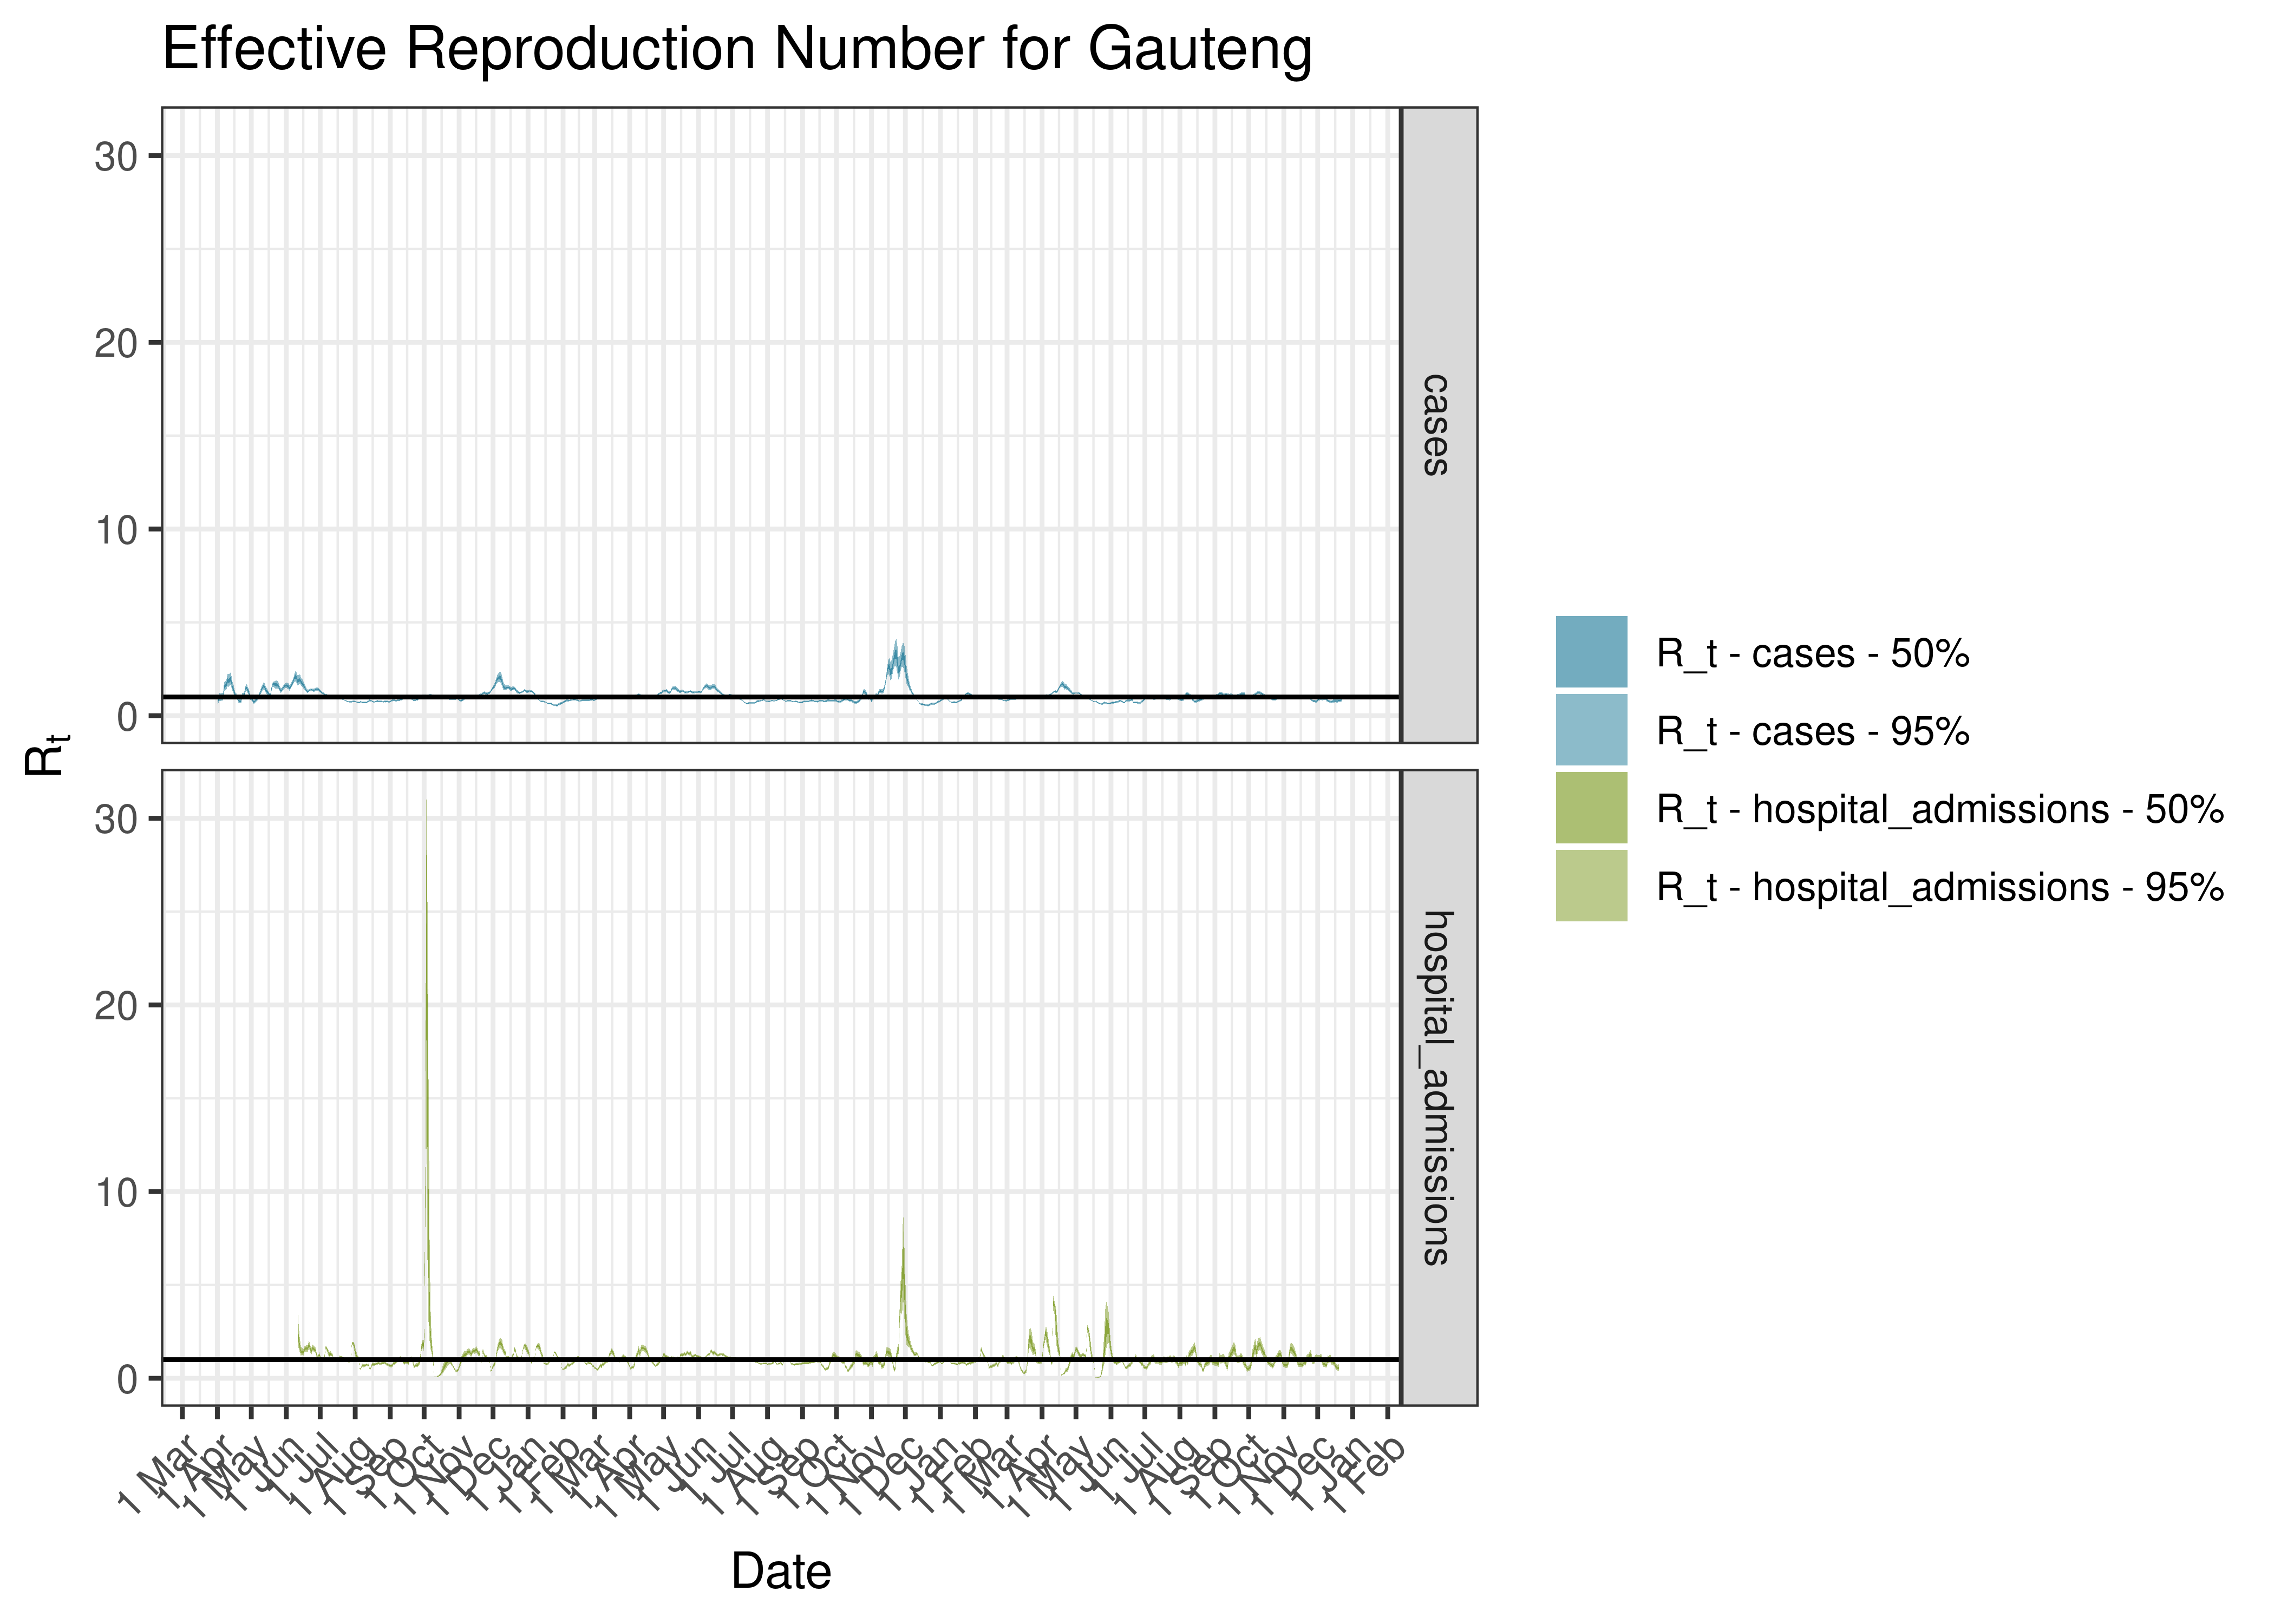
Estimated Effective Reproduction Number for Gauteng since 1 April 2020
6.4.8 City Of Johannesburg Metro
6.4.8.1 Cases
Cases are tabulated by specimen received date below. Cases include estimates for late reporting in recent days as well as adjustments for any public holidays. A centred 7-day moving average is also shown. The peak daily cases in previous waves (as measured by the moving average) is also shown.
| Specimen Received Date | Cases | 7-day Moving Average | Comment |
|---|---|---|---|
| 2020-07-08 | 2,214 | 1,983 | Wave 1 Peak |
| 2021-01-06 | 2,296 | 1,939 | Wave 2 Peak |
| 2021-06-30 | 5,770 | 4,459 | Wave 3 Peak |
| 2021-12-06 | 4,947 | 4,294 | Wave 4 Peak |
| 2022-05-05 | 1,555 | 1,412 | Wave 5 Peak (to date) |
Below a 7-day moving average daily case count are plotted for City Of Johannesburg Metro on a log scale since start of the epidemic:
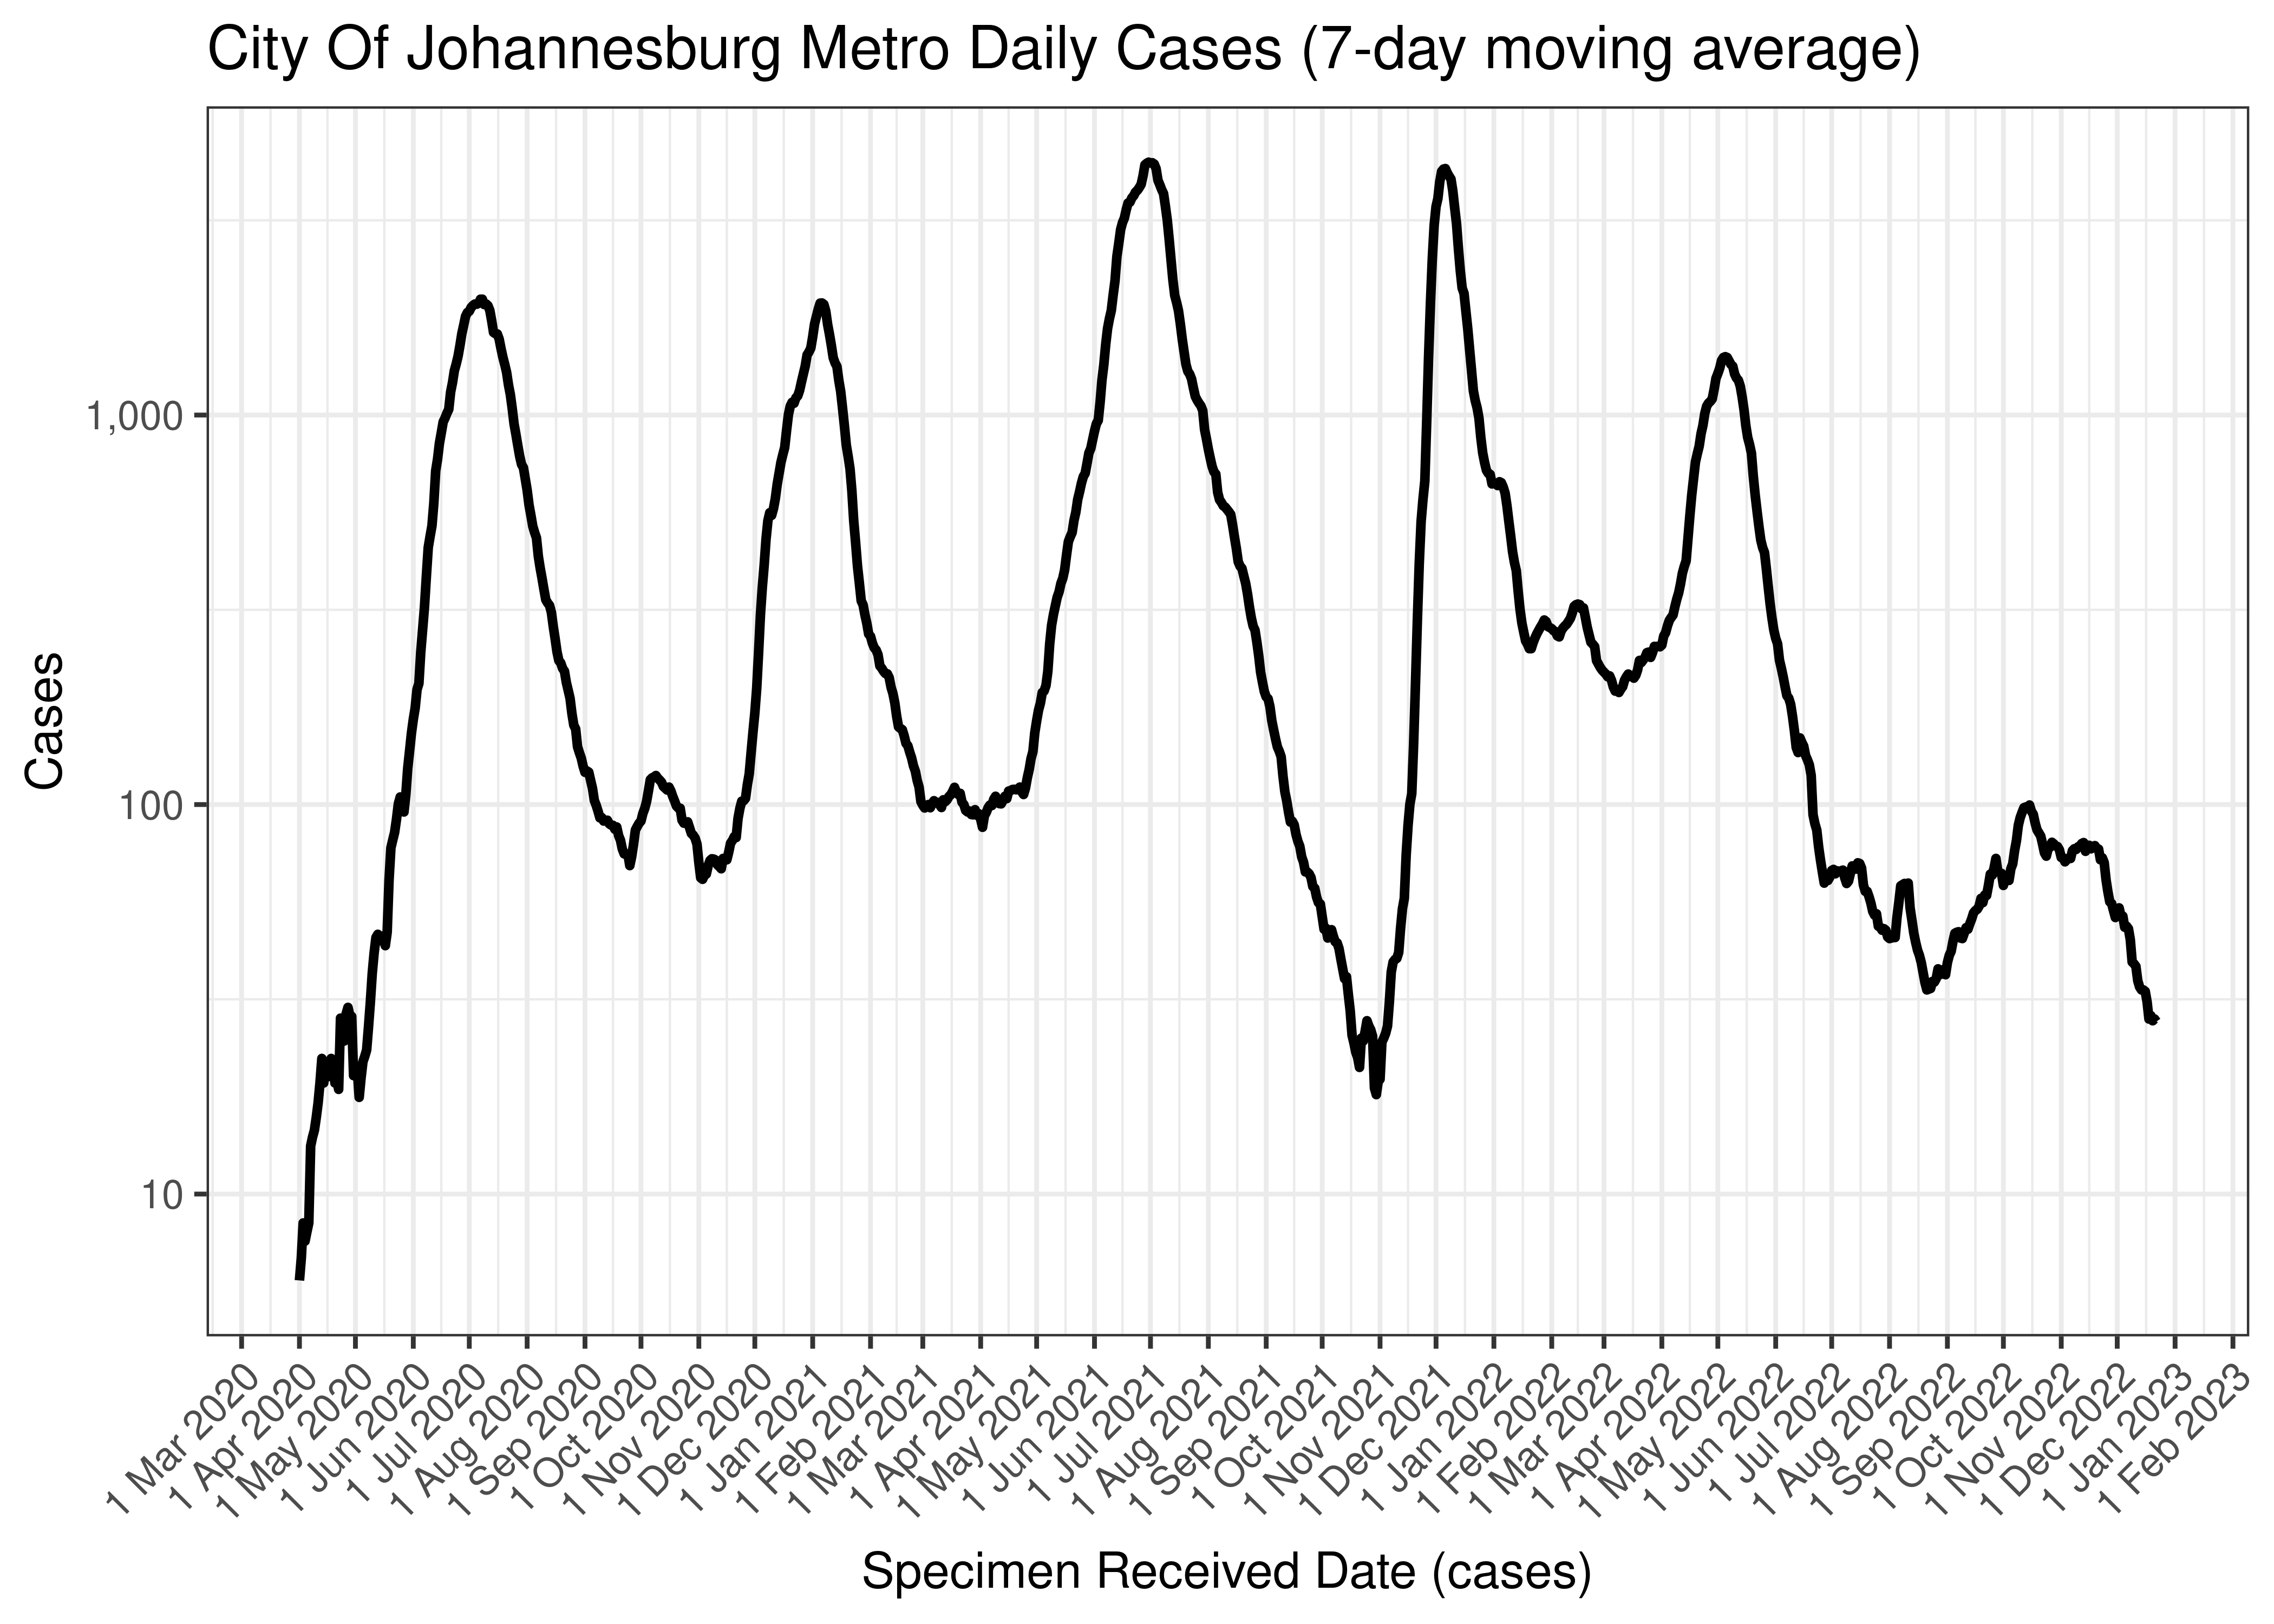
City Of Johannesburg Metro Daily Cases (7-day moving average)
Below the above chart is repeated for the last 30-days:
City Of Johannesburg Metro Daily Cases for Last 30-days (7-day moving average)
6.4.8.2 Excess Deaths
Excess deaths are tabulated by date of death below. A centred 7-day moving average is also shown. The peak daily deaths in previous waves (as measured by the moving average) is also shown.
| Specimen Received Date | Excess Deaths | 7-day Moving Average | Comment |
|---|---|---|---|
| 2020-07-15 | 113 | 113 | Wave 1 Peak |
| 2021-01-13 | 96 | 96 | Wave 2 Peak |
| 2021-07-07 | 207 | 207 | Wave 3 Peak |
| 2021-12-15 | 29 | 29 | Wave 4 Peak |
| 2022-05-11 | 28 | 28 | Wave 5 Peak (to date) |
| 2022-12-03 | 4 | 5 | |
| 2022-12-04 | 6 | 5 | |
| 2022-12-05 | 6 | 6 | |
| 2022-12-06 | 6 | 6 | |
| 2022-12-07 | 6 | 6 | |
| 2022-12-08 | 6 | NA | |
| 2022-12-09 | 6 | NA | |
| 2022-12-10 | 6 | NA |
Below a 7-day moving average daily excess deaths is plotted for City Of Johannesburg Metro on a log scale since start of the epidemic:
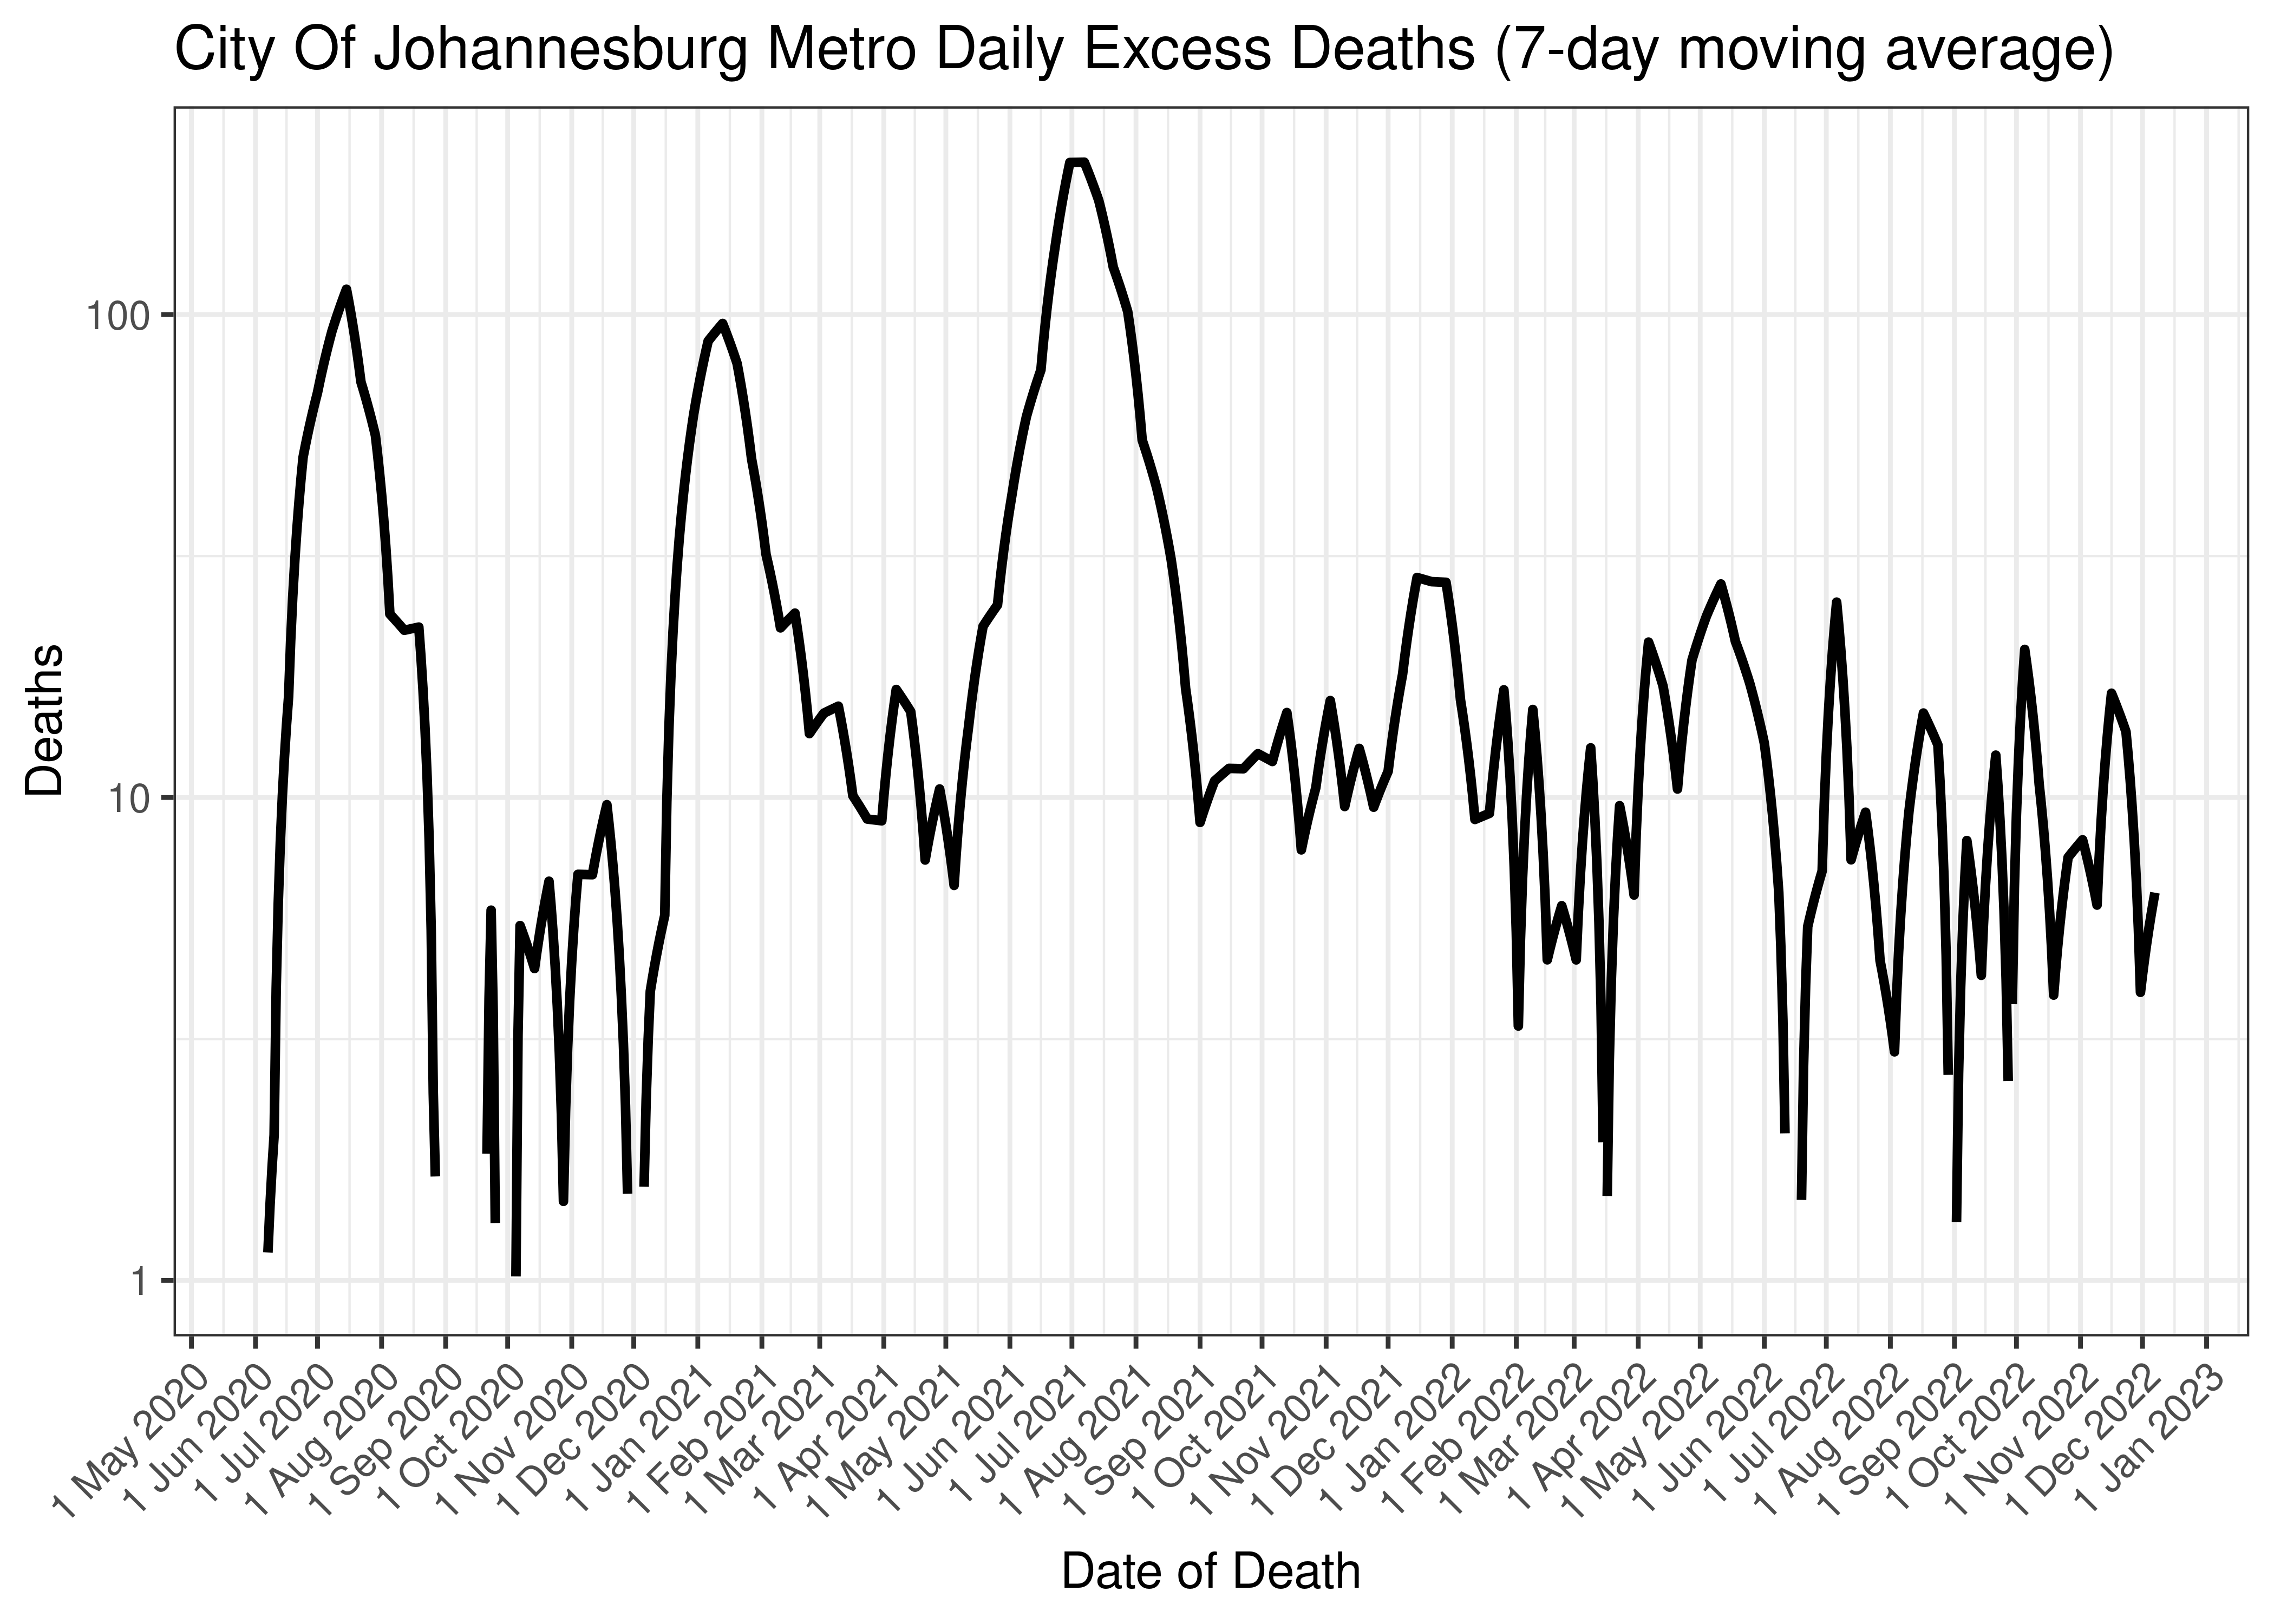
City Of Johannesburg Metro Daily Excess Deaths (7-day moving average)
Below the above chart is repeated for the last 30-days:
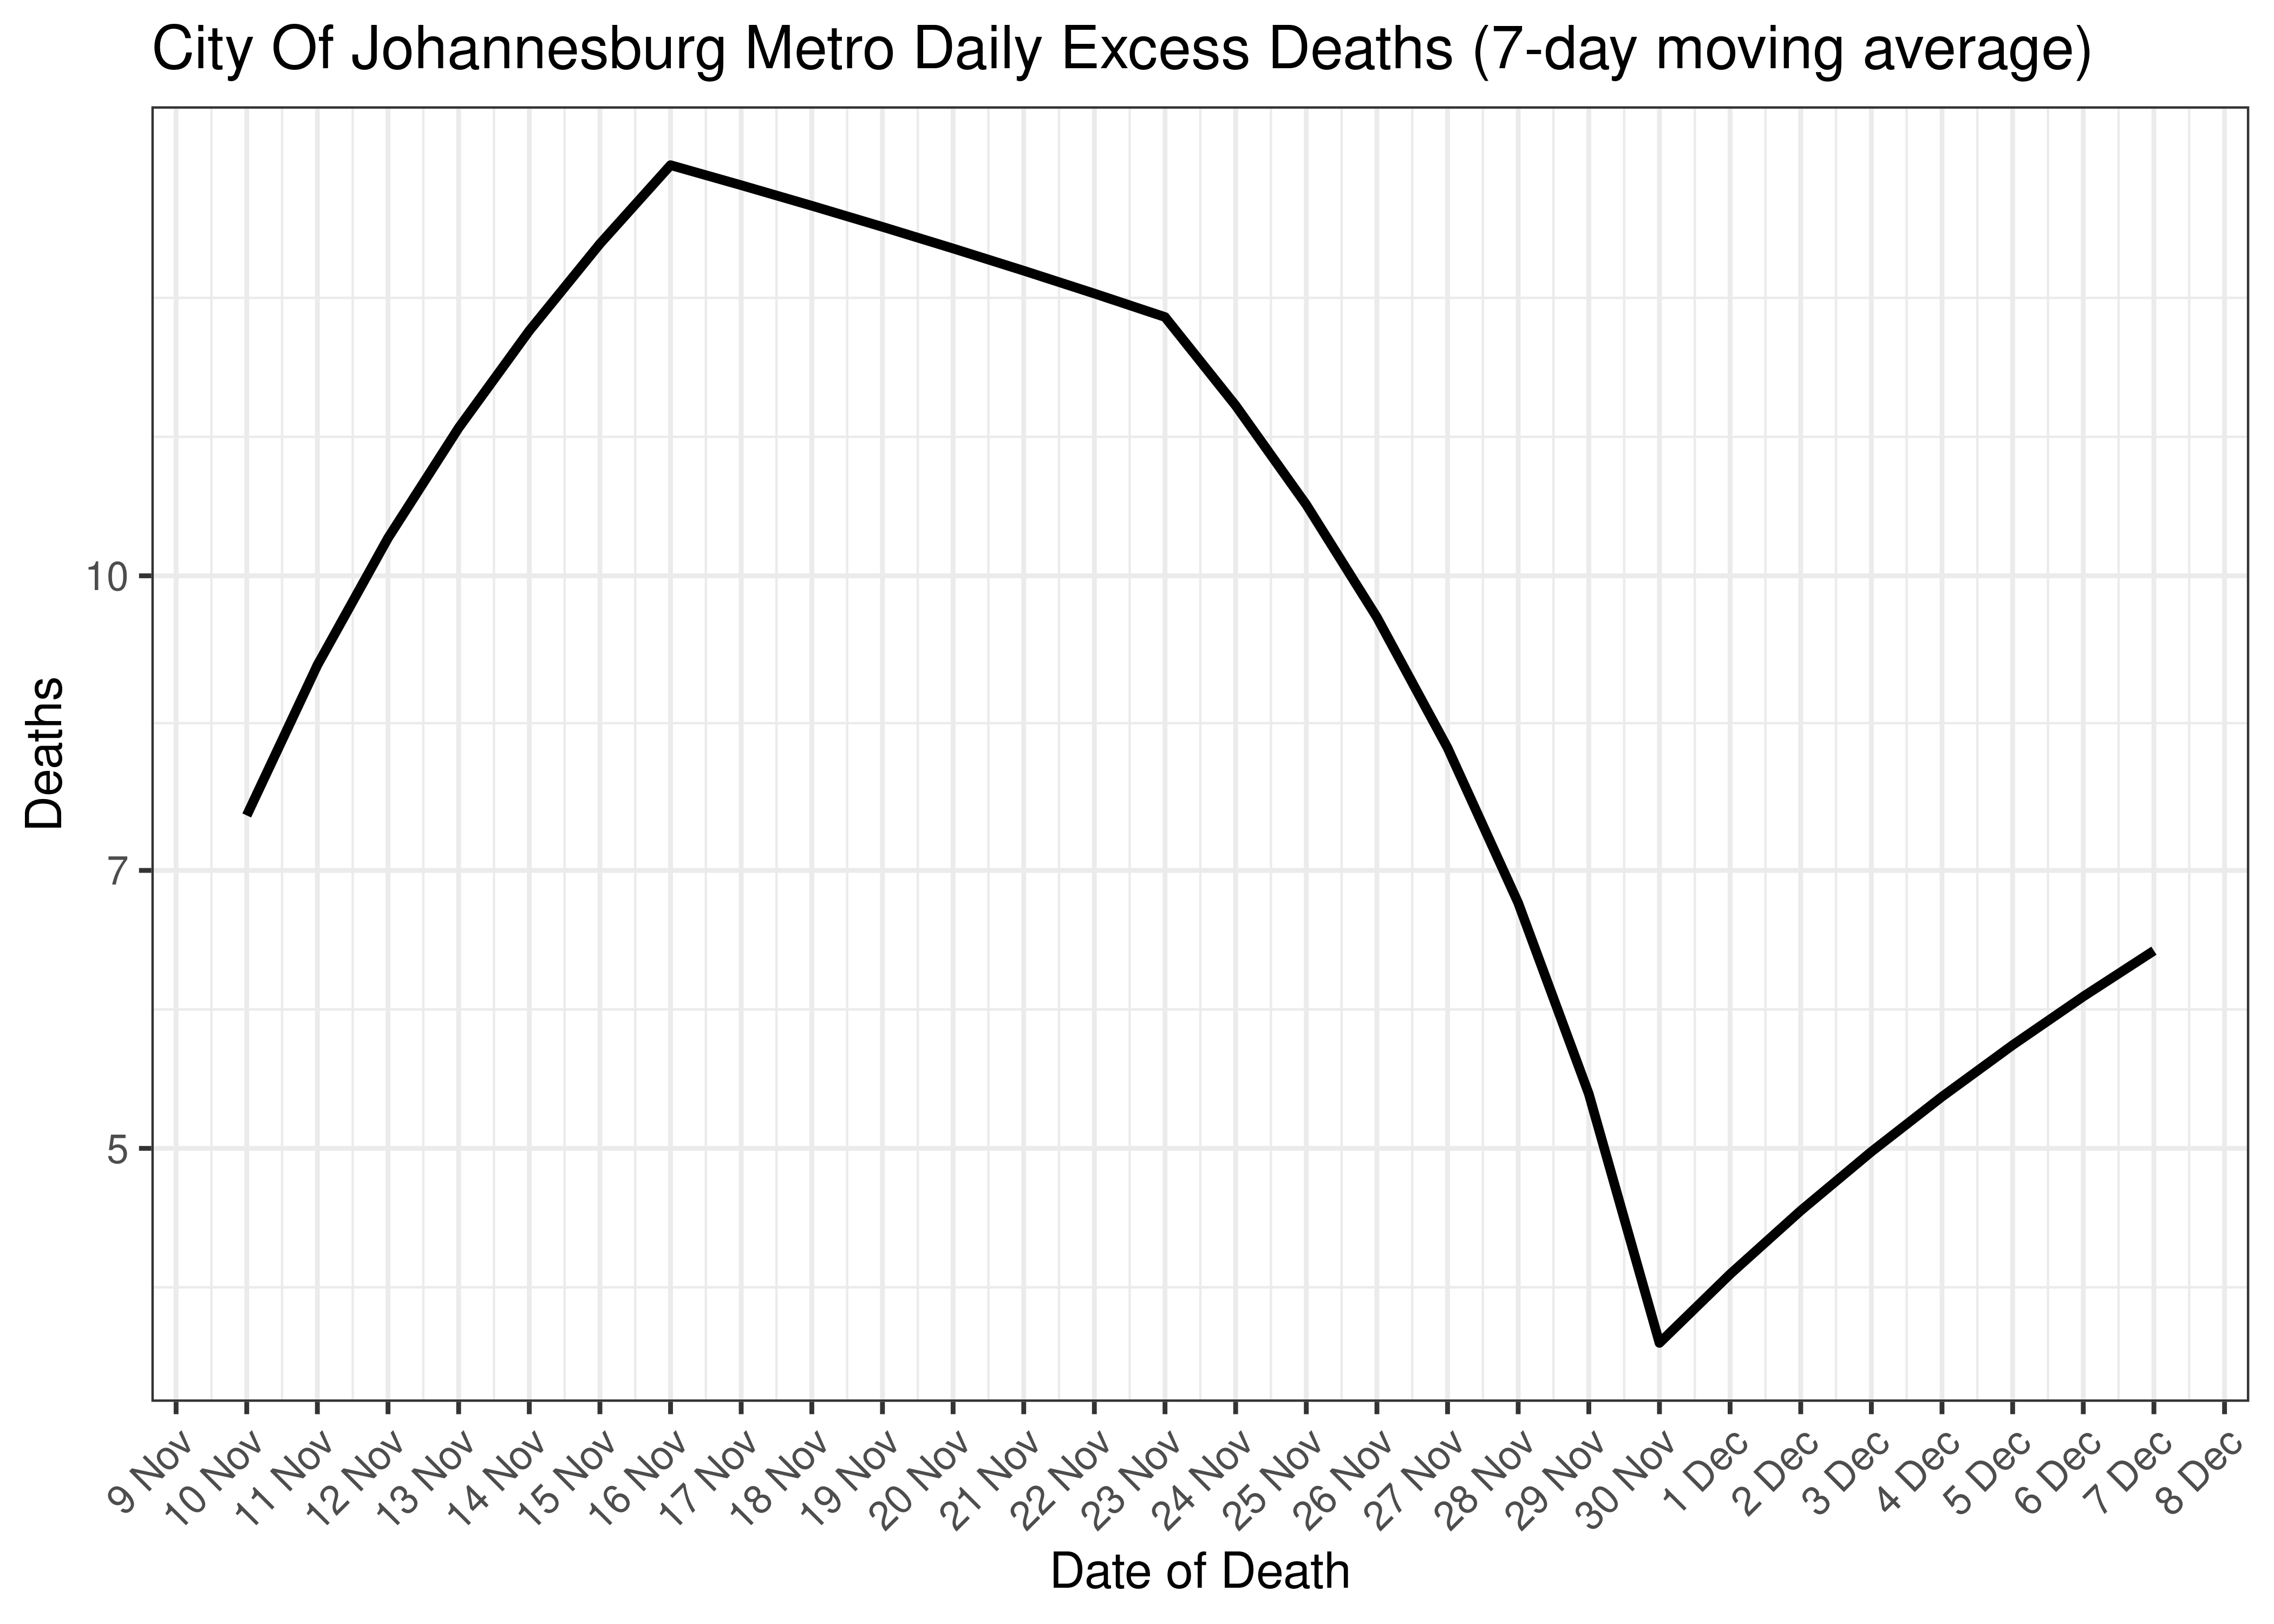
City Of Johannesburg Metro Excess Deaths for Last 30-days (7-day moving average)
6.4.8.3 Cases and Excess Deaths Combined
Below a 7-day moving average daily case count and estimated daily excess deaths are plotted for City Of Johannesburg Metro on a log scale since start of the epidemic:
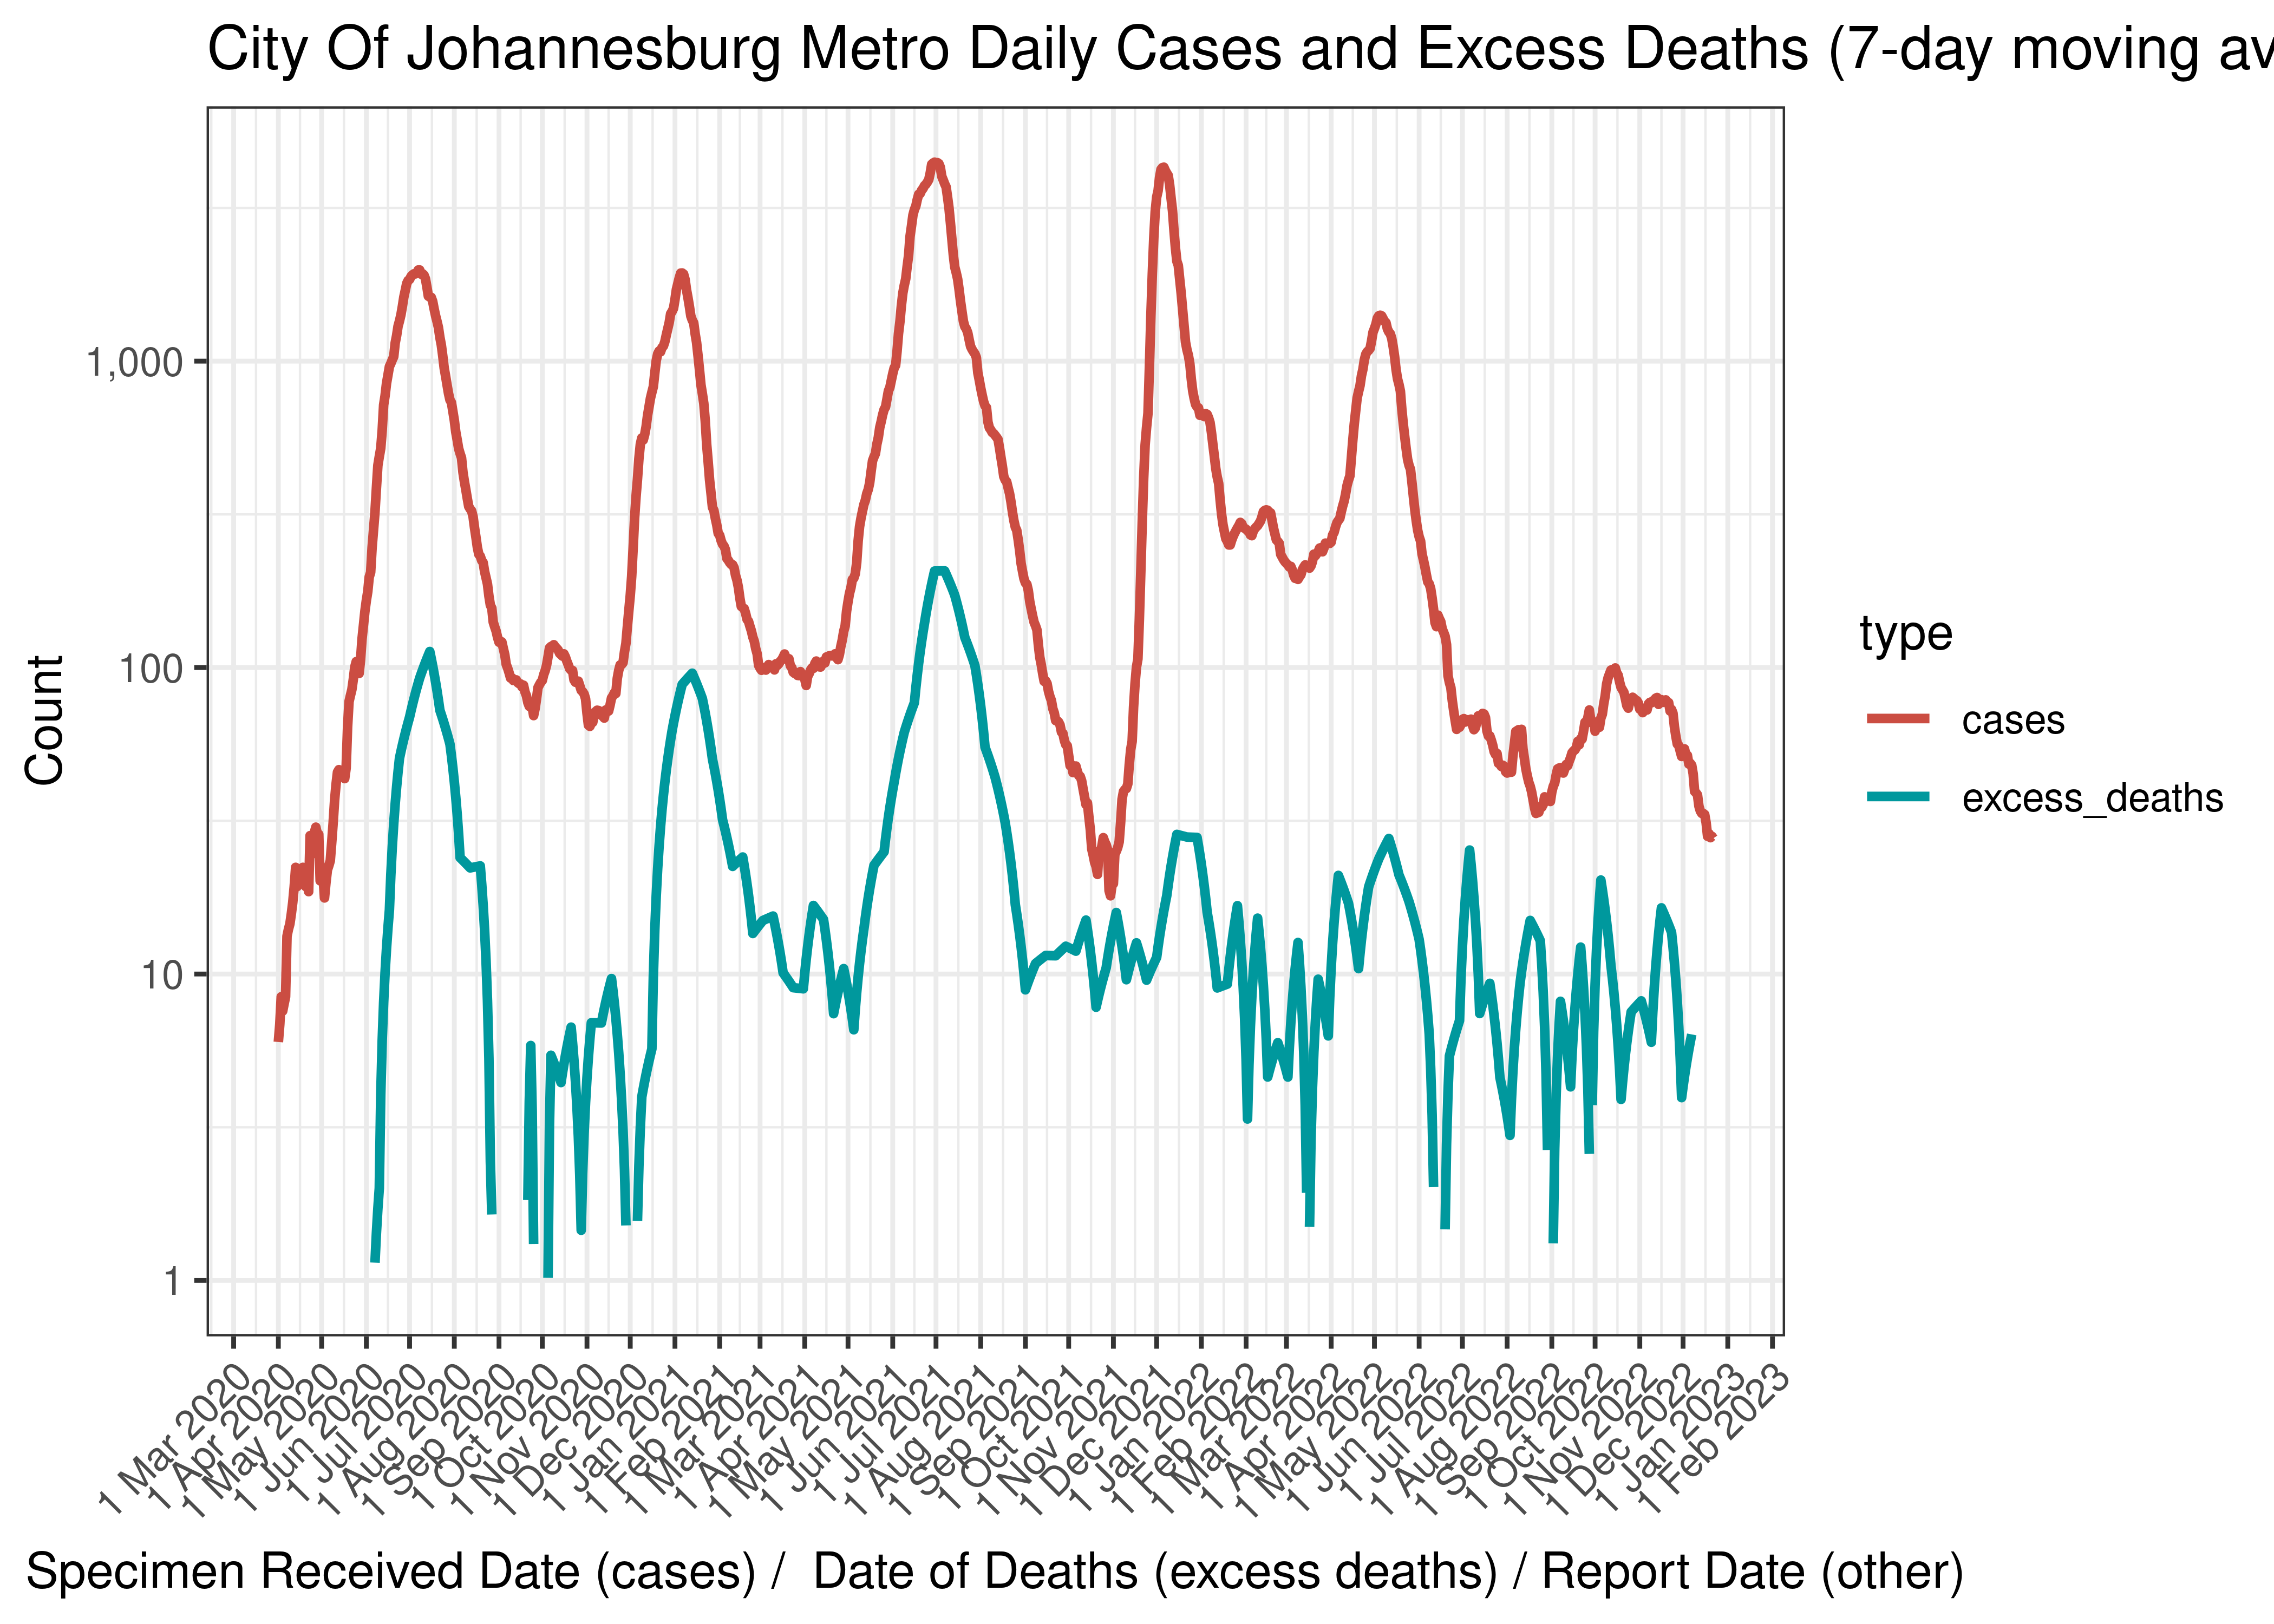
City Of Johannesburg Metro Daily Cases and Excess Deaths (7-day moving average)
Below the above chart is repeated for the last 30-days:

City Of Johannesburg Metro Daily Cases and Deaths (if available) for Last 30-days (7-day moving average)
6.4.8.4 Reproduction Number
Below current (last weekly) reproduction number estimates are tabulated for City Of Johannesburg Metro.
| Count (Per Day) | Week Ending | Reproduction Number [95% Confidence Interval] | |
|---|---|---|---|
| City Of Johannesburg Metro | 27.7 | 2022-12-25 | 0.90 [0.77 - 1.03] |
Below the effective reproduction number for City Of Johannesburg Metro over the last 90 days are plotted together with a plot since start of the pandemic.
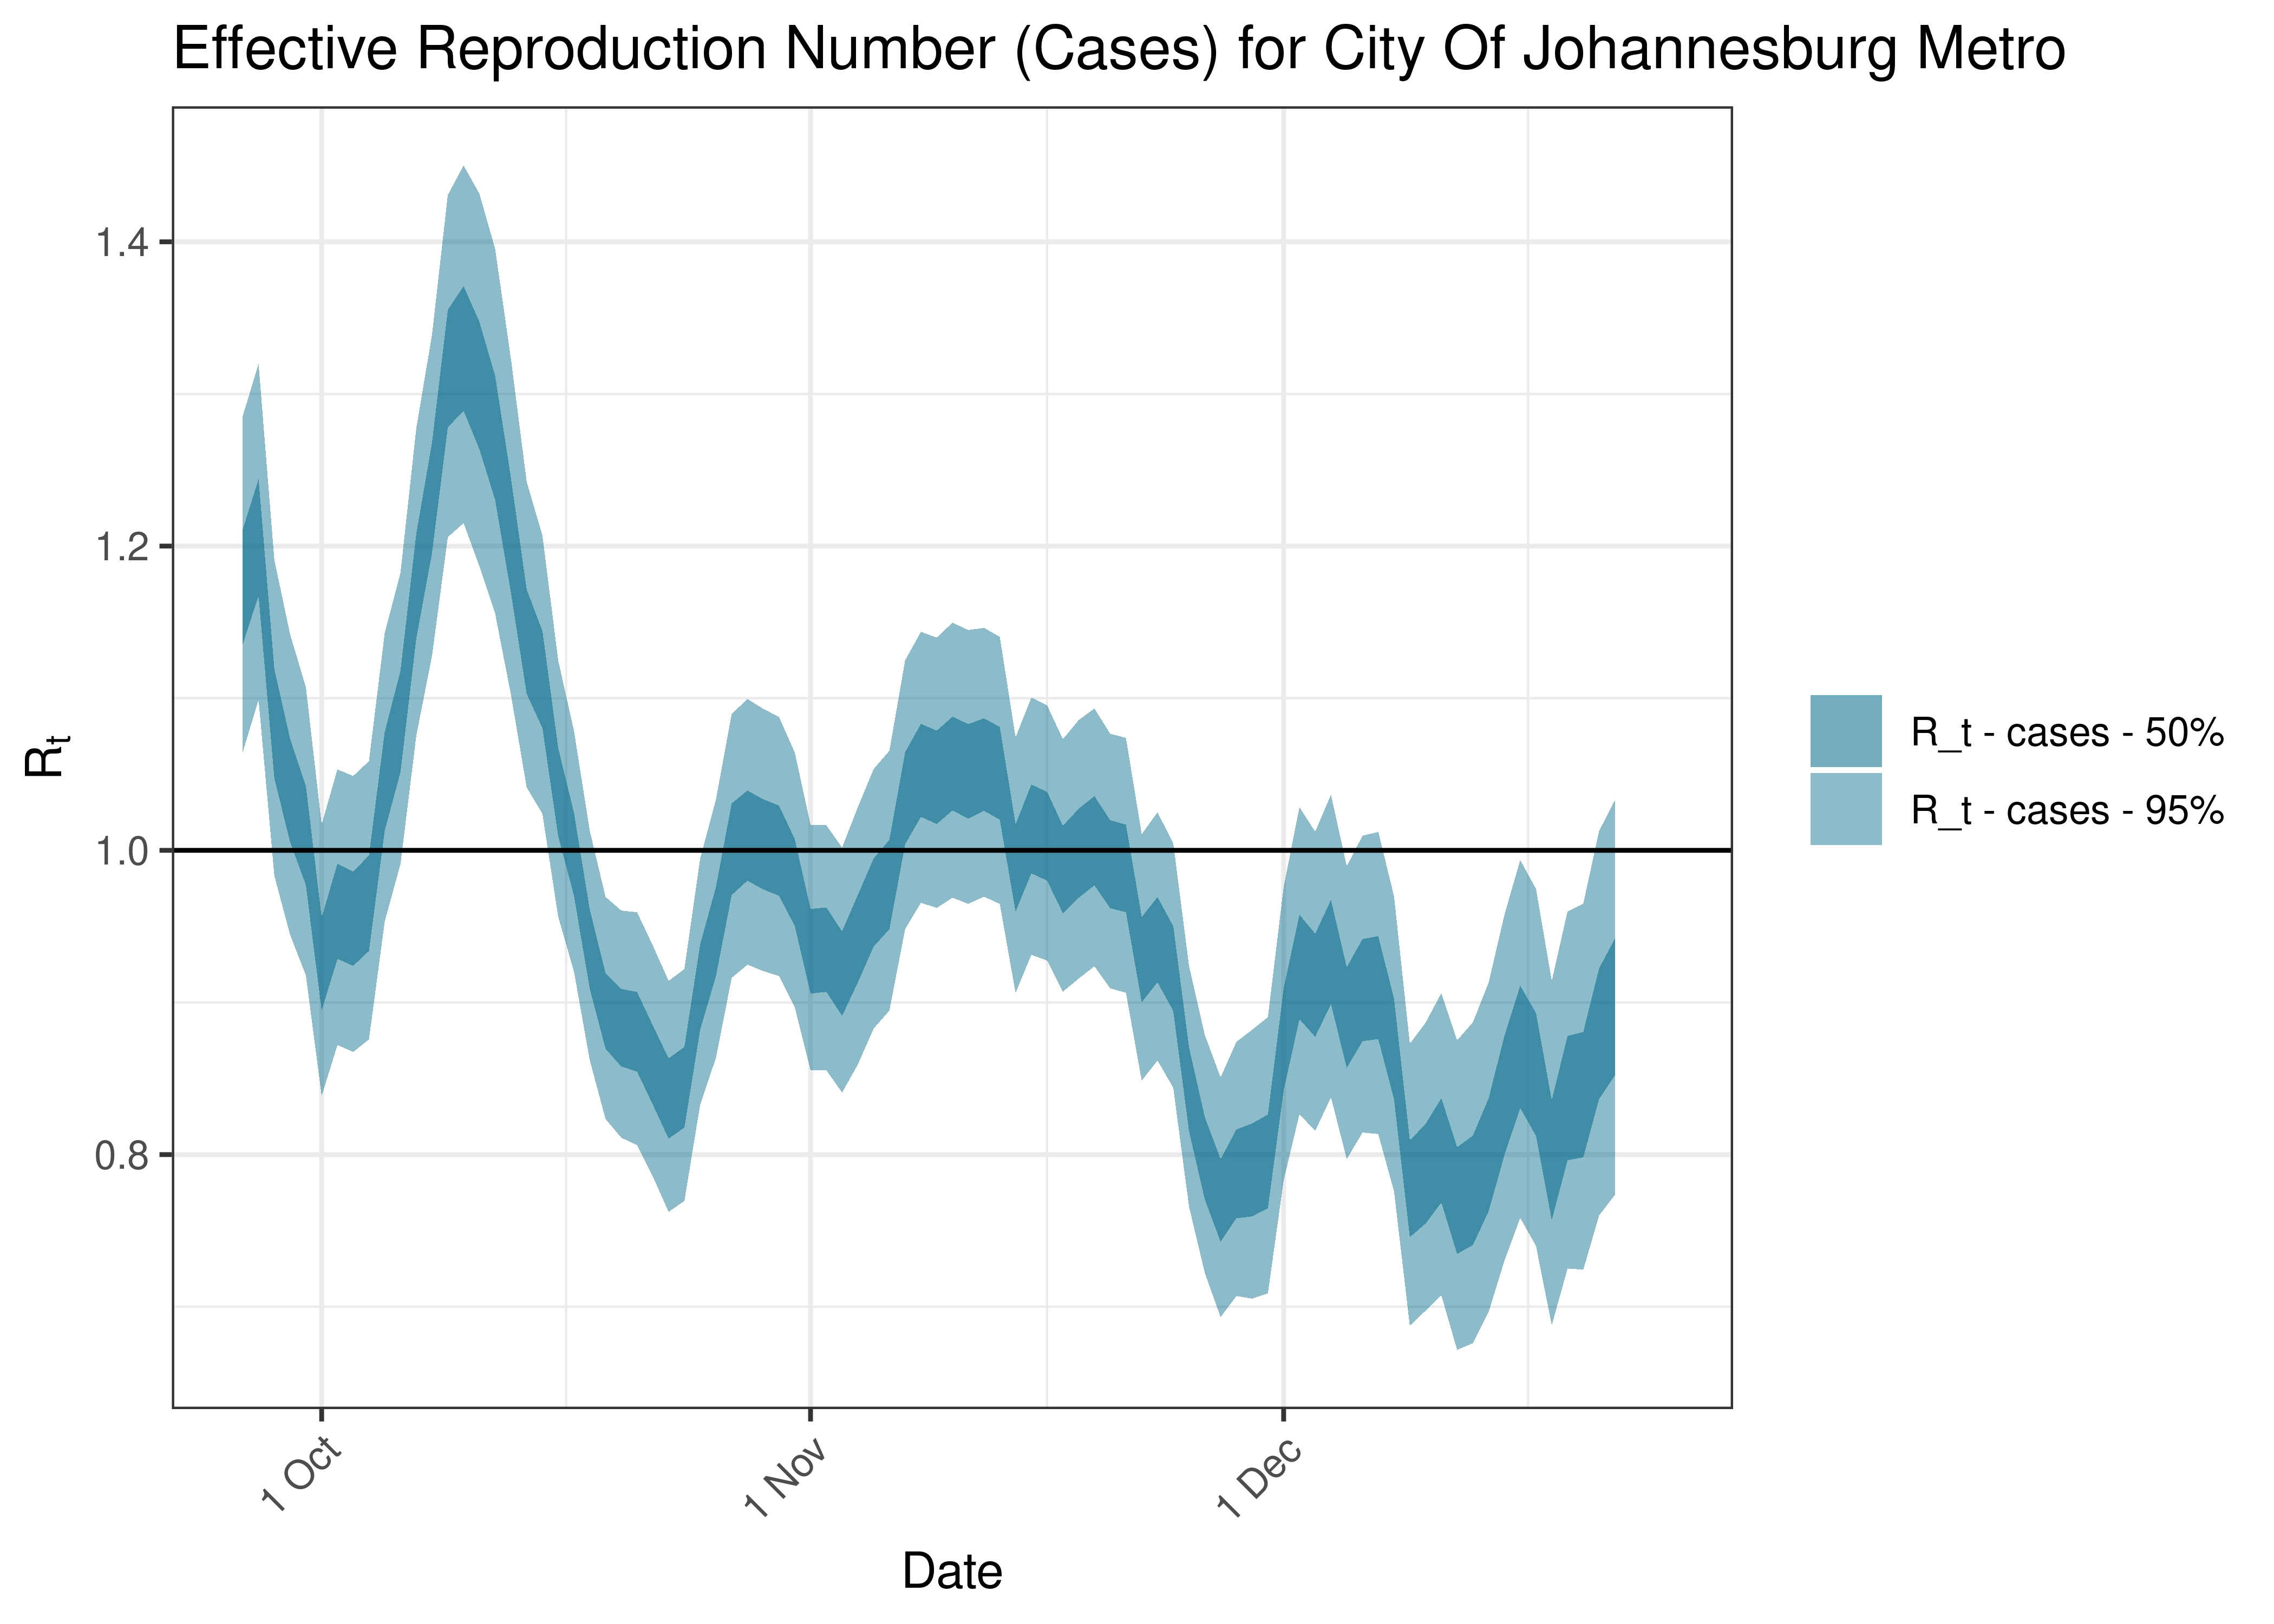
Estimated Effective Reproduction Number Based on Cases for City Of Johannesburg Metro over last 90 days
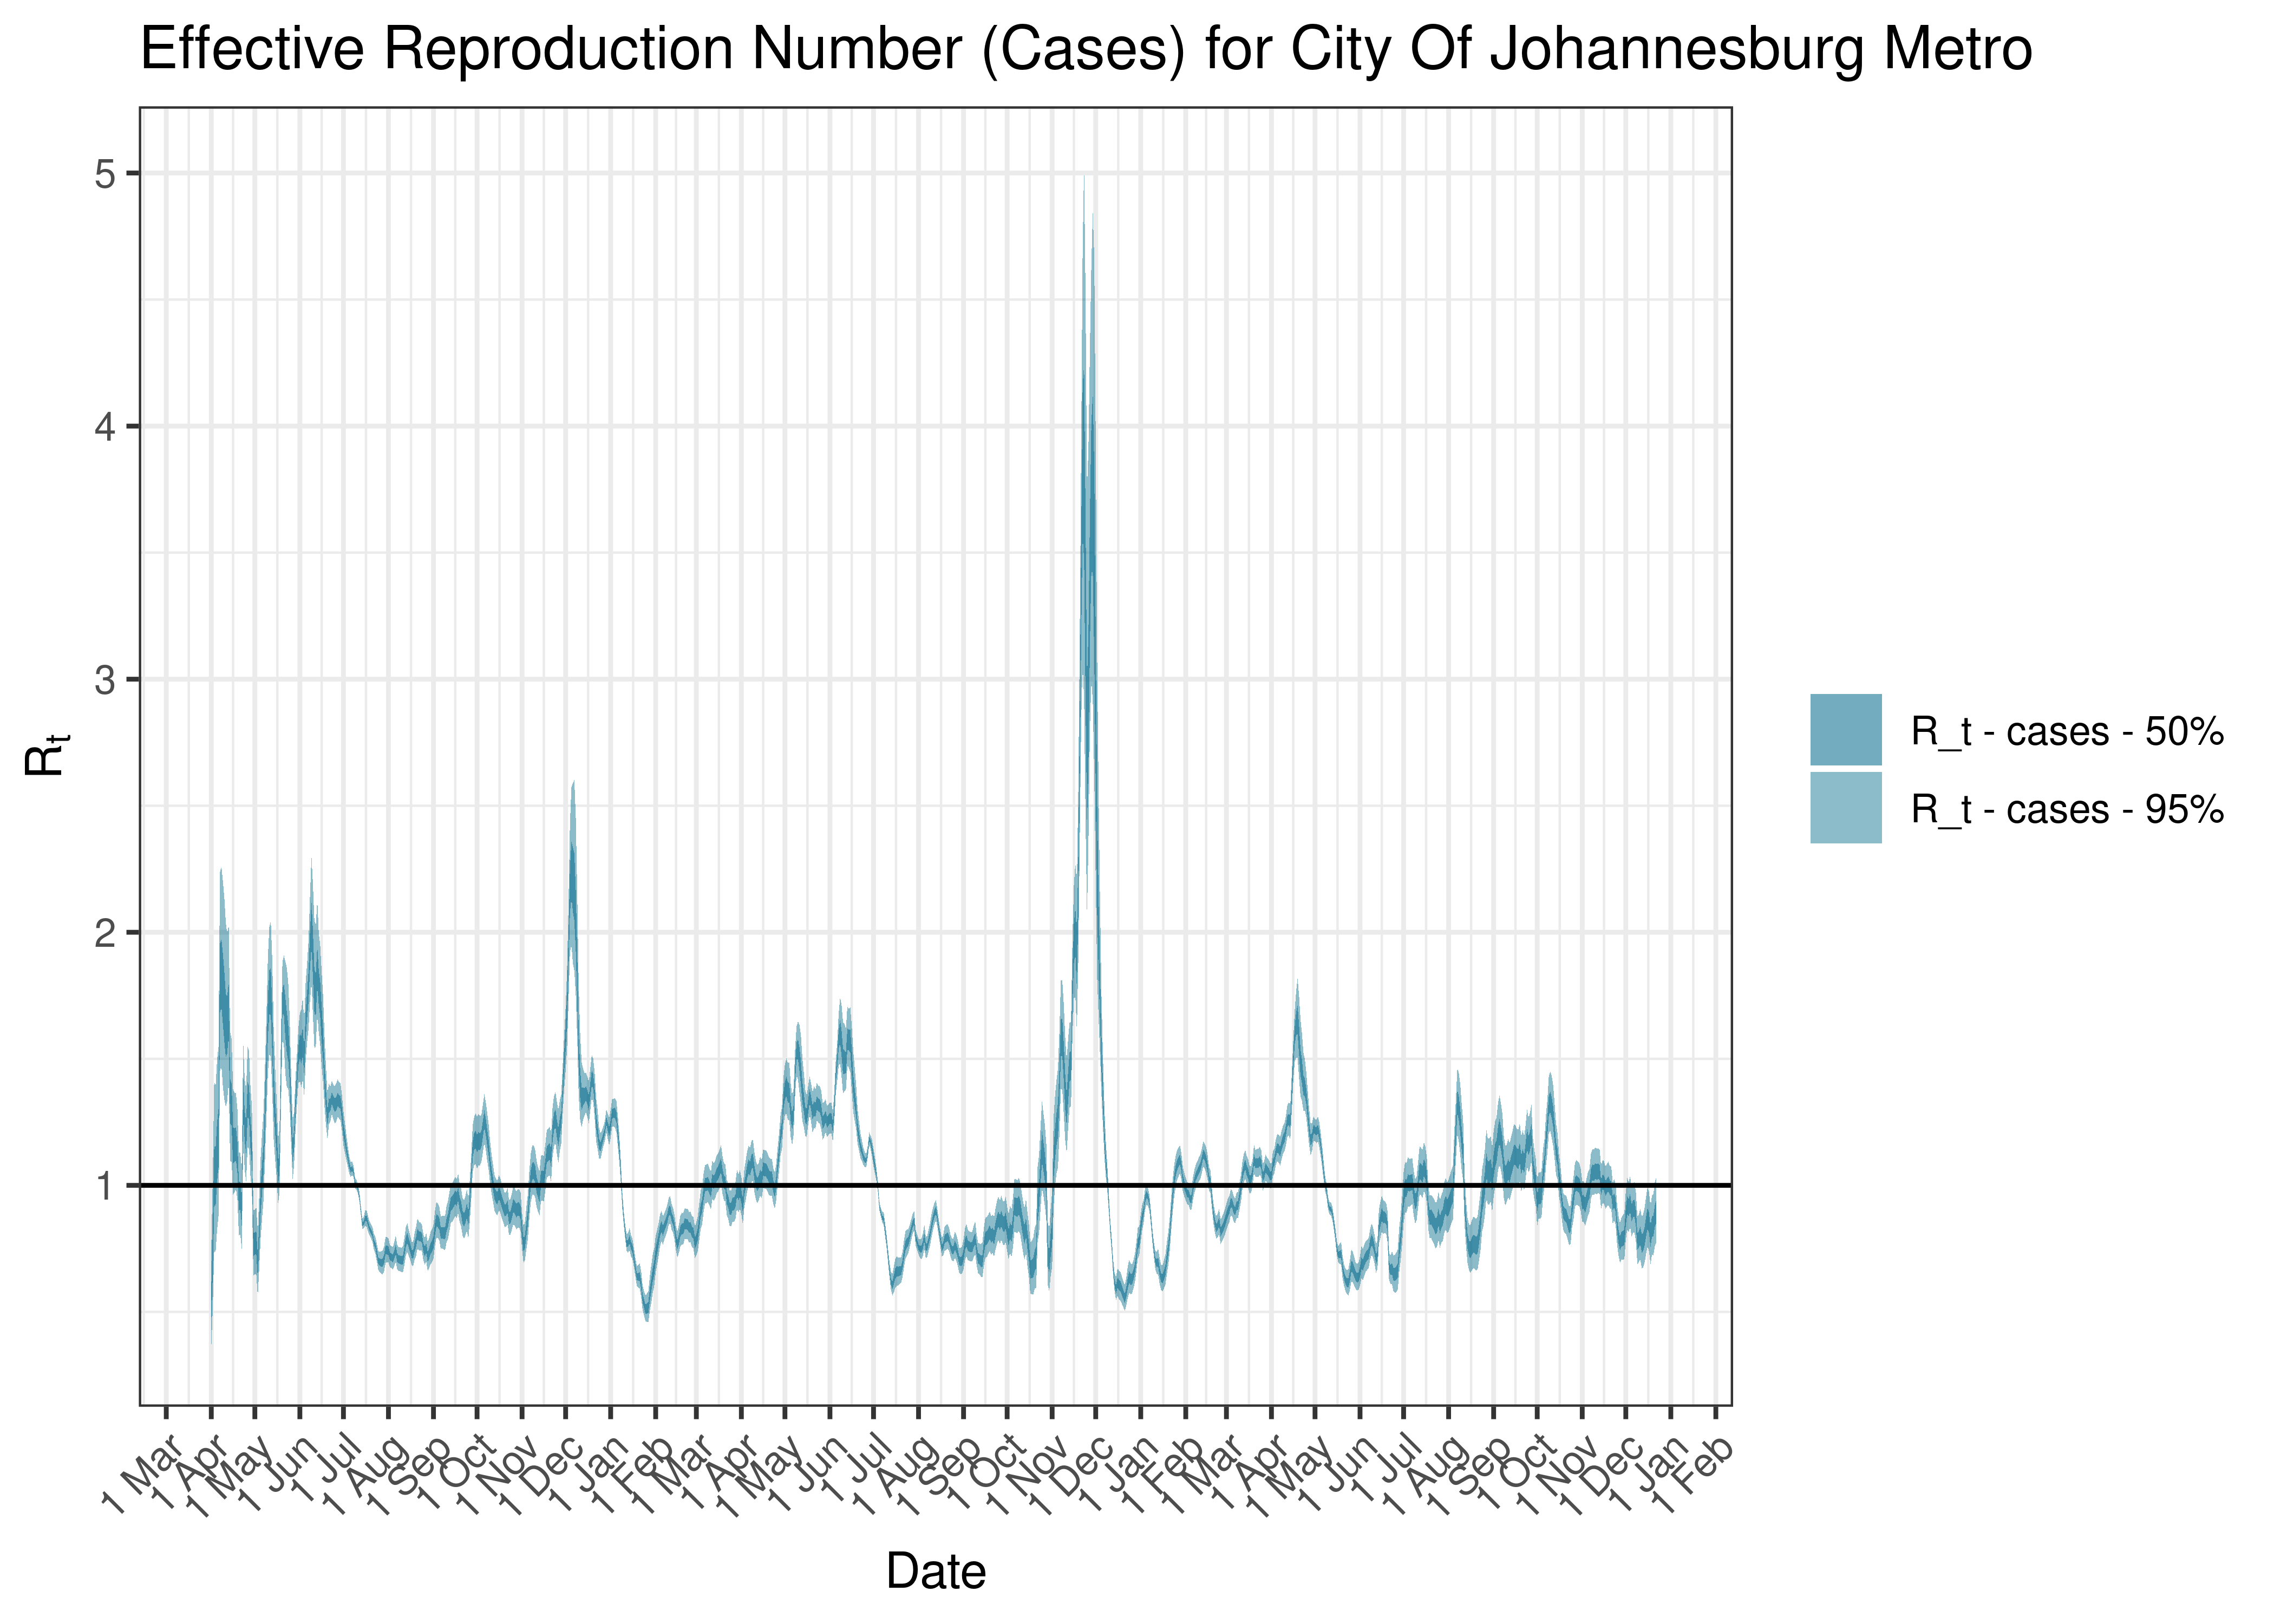
Estimated Effective Reproduction Number Based on Cases for City Of Johannesburg Metro since 1 April 2020
6.4.9 City Of Tshwane Metro
6.4.9.1 Cases
Cases are tabulated by specimen received date below. Cases include estimates for late reporting in recent days as well as adjustments for any public holidays. A centred 7-day moving average is also shown. The peak daily cases in previous waves (as measured by the moving average) is also shown.
| Specimen Received Date | Cases | 7-day Moving Average | Comment |
|---|---|---|---|
| 2020-07-11 | 842 | 1,042 | Wave 1 Peak |
| 2021-01-06 | 2,037 | 1,728 | Wave 2 Peak |
| 2021-07-01 | 4,151 | 3,037 | Wave 3 Peak |
| 2021-12-03 | 3,149 | 2,911 | Wave 4 Peak |
| 2022-05-06 | 830 | 812 | Wave 5 Peak (to date) |
Below a 7-day moving average daily case count are plotted for City Of Tshwane Metro on a log scale since start of the epidemic:
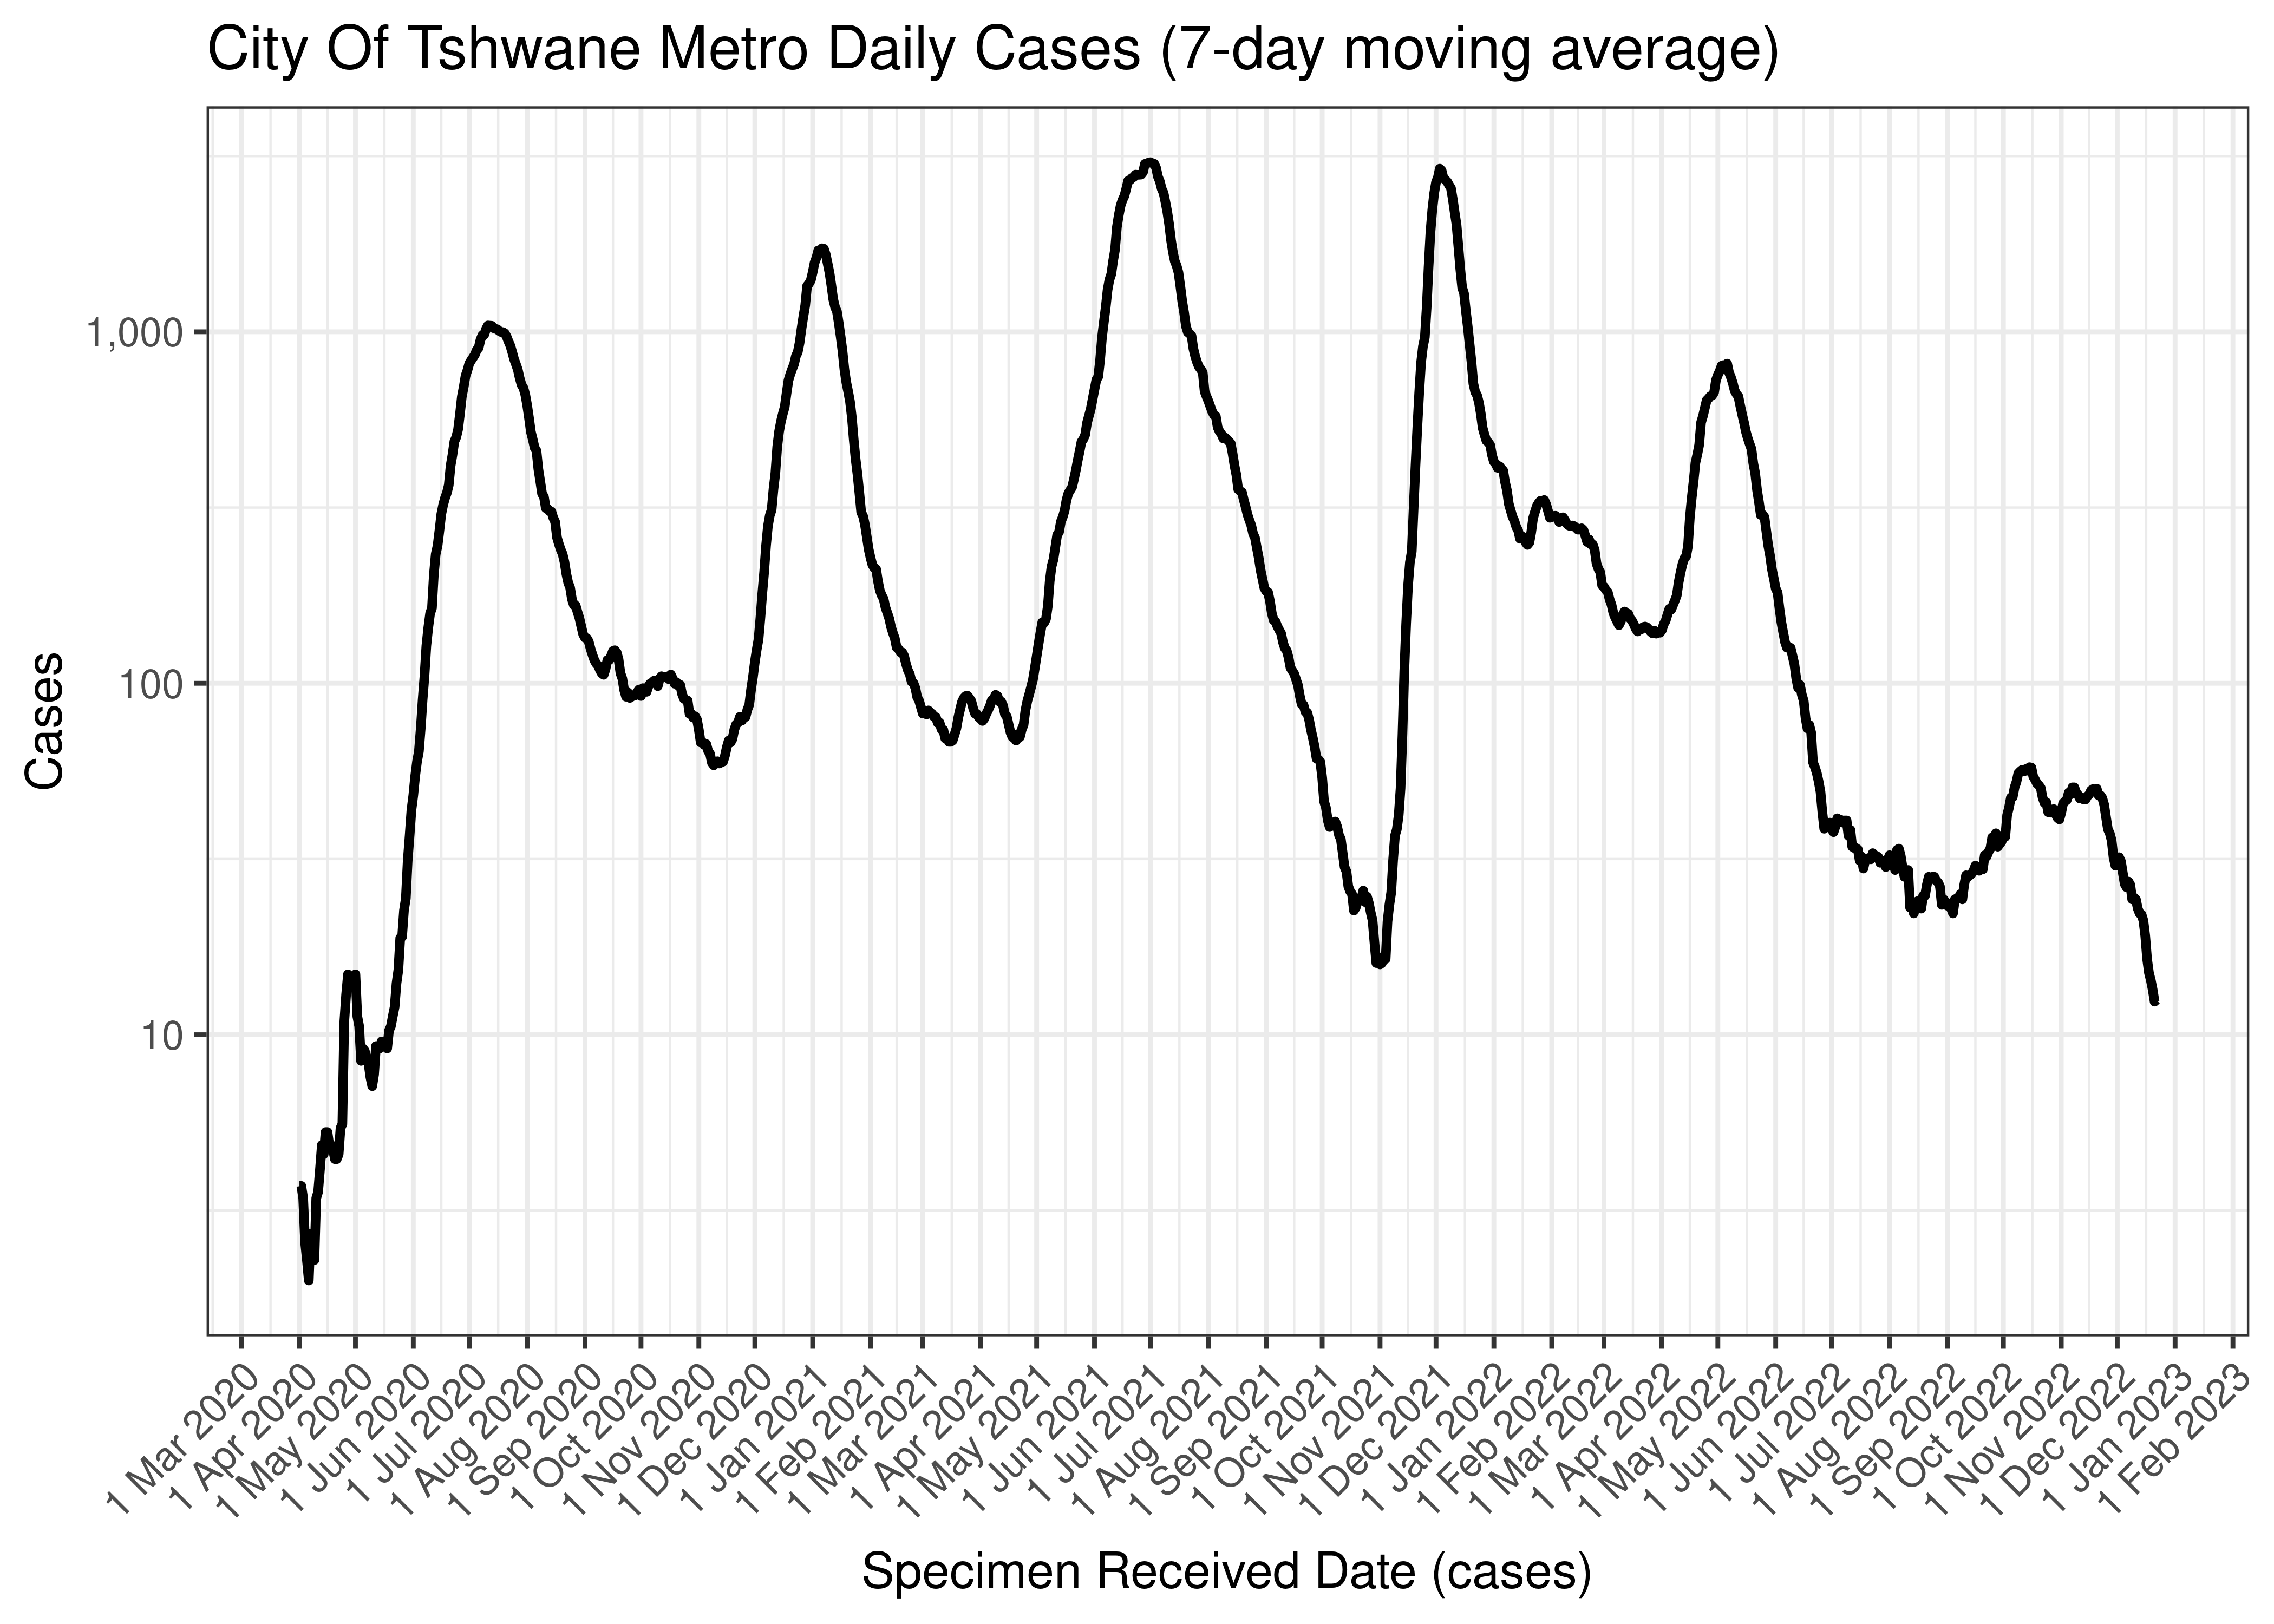
City Of Tshwane Metro Daily Cases (7-day moving average)
Below the above chart is repeated for the last 30-days:

City Of Tshwane Metro Daily Cases for Last 30-days (7-day moving average)
6.4.9.2 Excess Deaths
Excess deaths are tabulated by date of death below. A centred 7-day moving average is also shown. The peak daily deaths in previous waves (as measured by the moving average) is also shown.
| Specimen Received Date | Excess Deaths | 7-day Moving Average | Comment |
|---|---|---|---|
| 2020-07-15 | 43 | 43 | Wave 1 Peak |
| 2021-01-06 | 91 | 91 | Wave 2 Peak |
| 2021-07-14 | 105 | 105 | Wave 3 Peak |
| 2021-12-08 | 14 | 14 | Wave 4 Peak |
| 2022-05-11 | 9 | 9 | Wave 5 Peak (to date) |
| 2022-12-03 | -5 | -3 | |
| 2022-12-04 | 1 | -2 | |
| 2022-12-05 | 1 | -1 | |
| 2022-12-06 | 1 | 0 | |
| 2022-12-07 | 1 | 1 | |
| 2022-12-08 | 1 | NA | |
| 2022-12-09 | 1 | NA | |
| 2022-12-10 | 1 | NA |
Below a 7-day moving average daily excess deaths is plotted for City Of Tshwane Metro on a log scale since start of the epidemic:
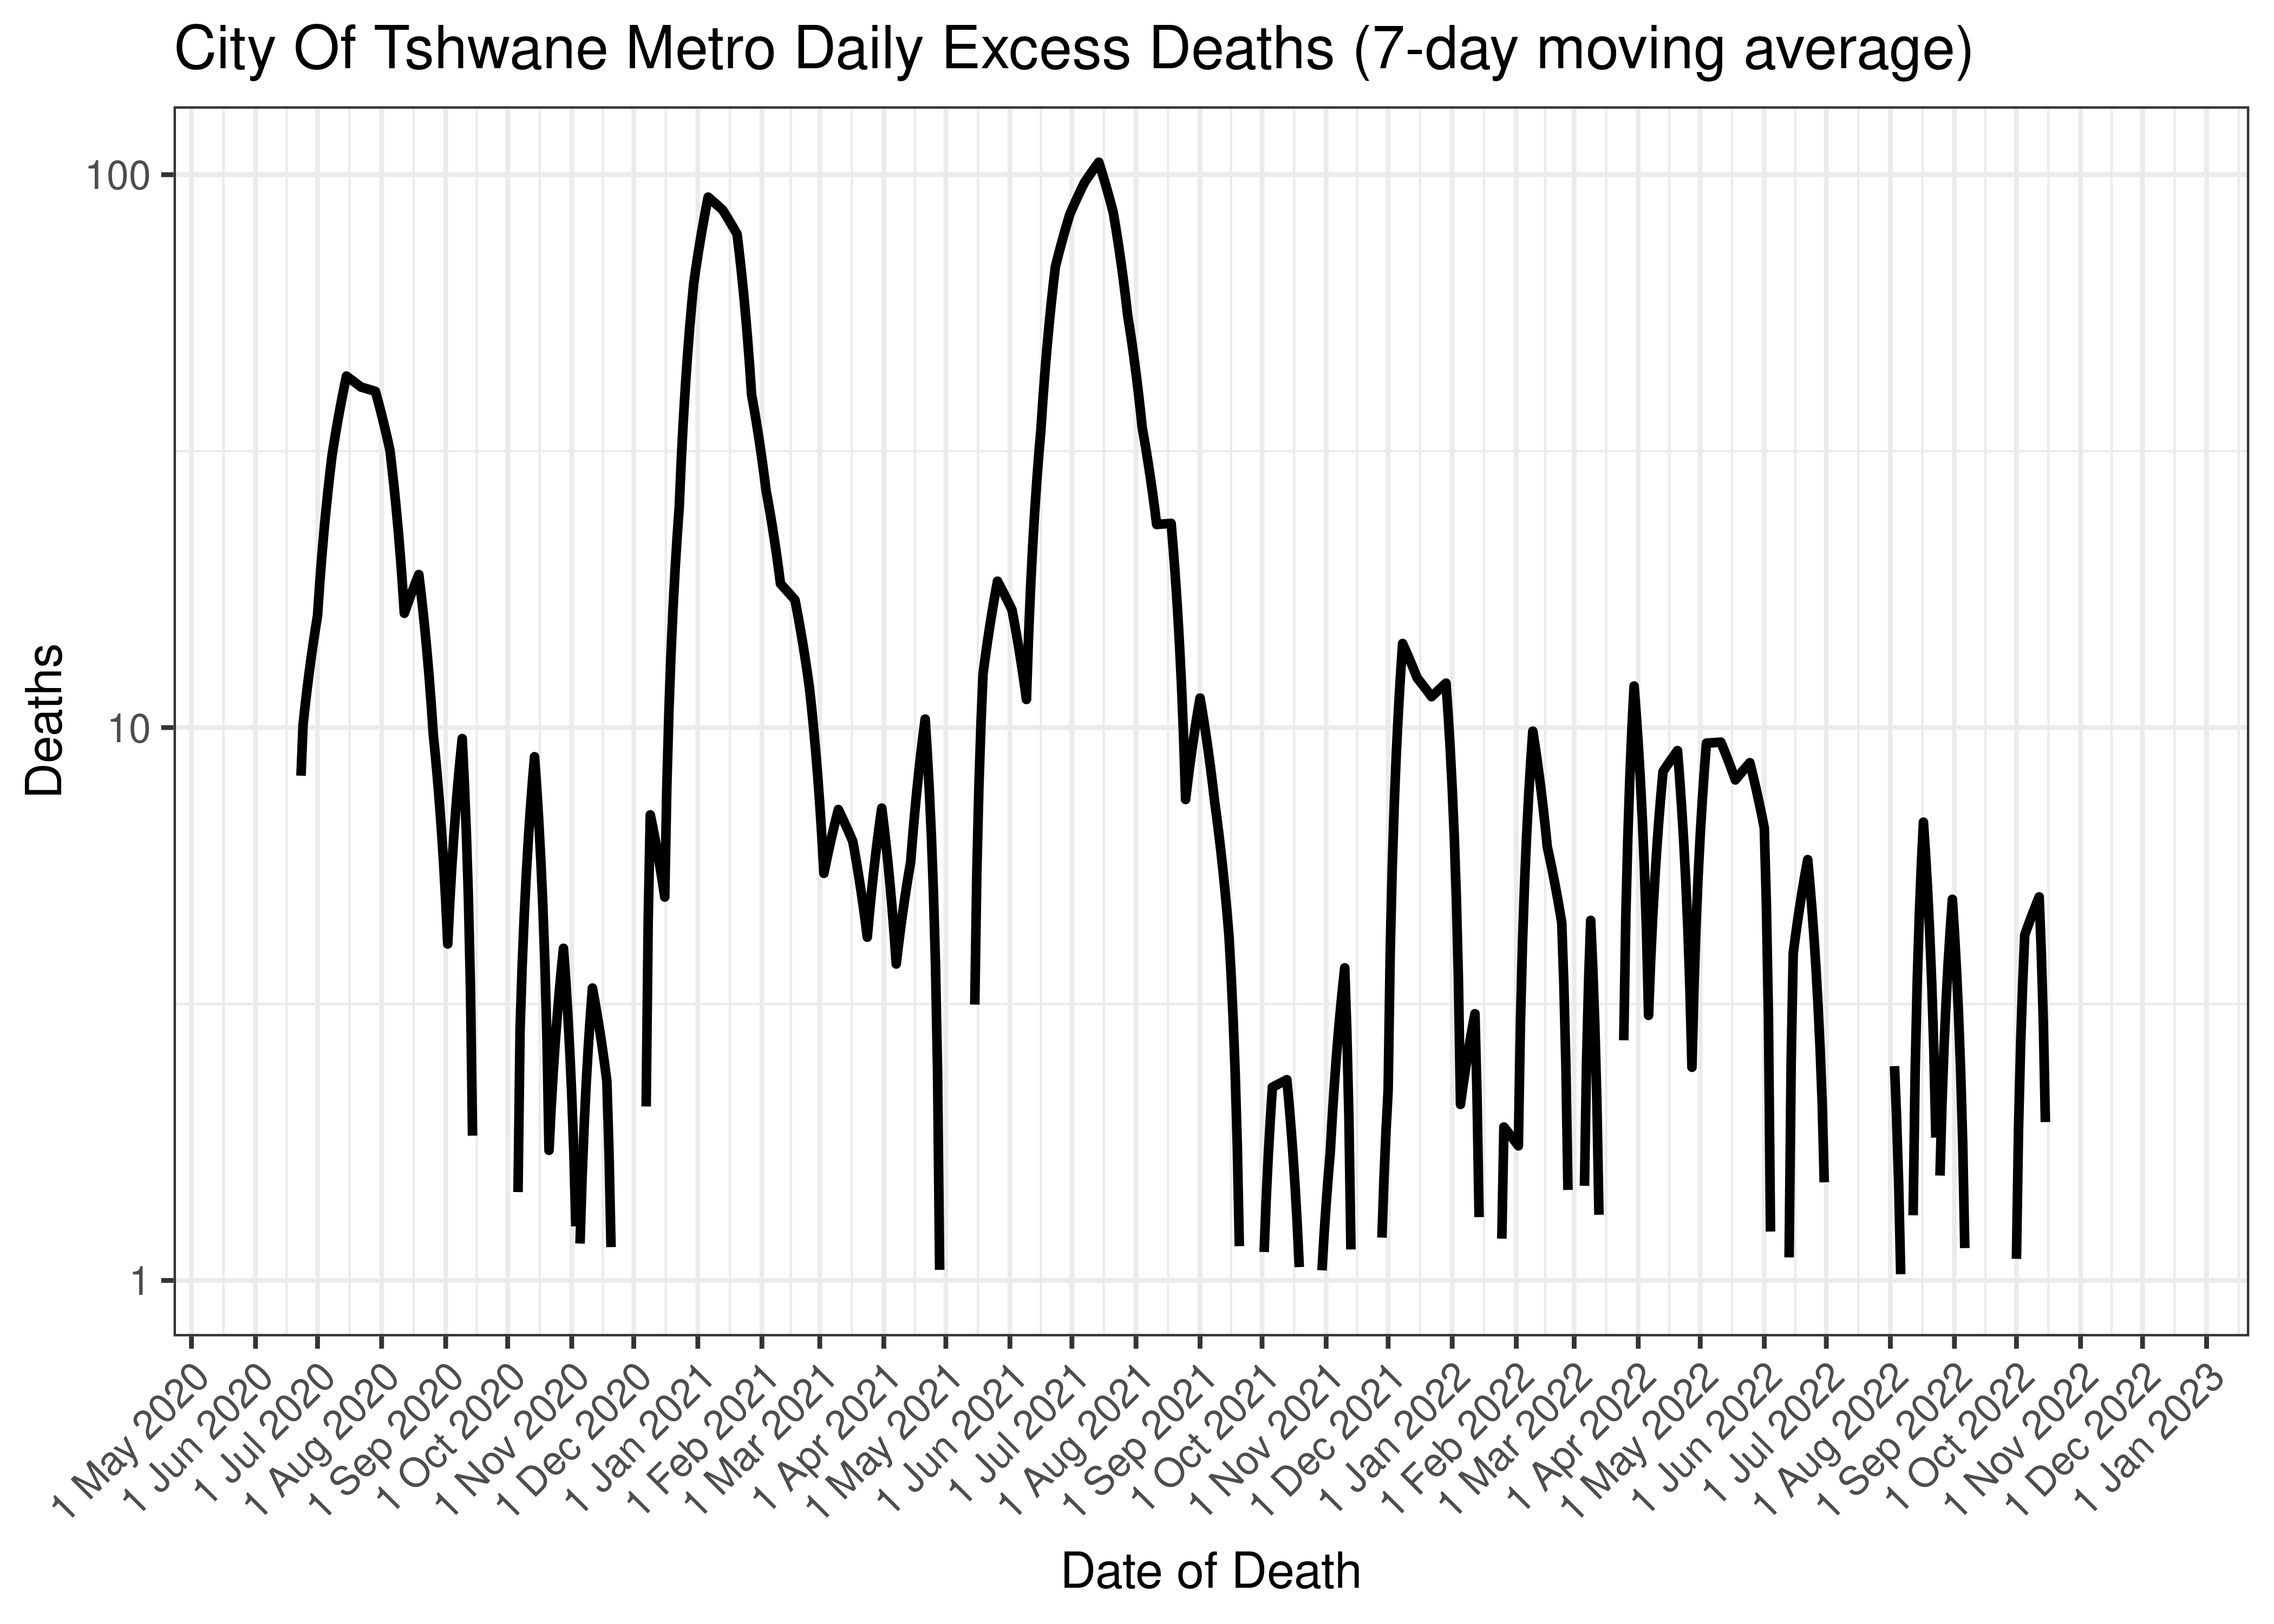
City Of Tshwane Metro Daily Excess Deaths (7-day moving average)
Below the above chart is repeated for the last 30-days:
## `geom_line()`: Each group consists of only one observation.
## ℹ Do you need to adjust the group aesthetic?
City Of Tshwane Metro Excess Deaths for Last 30-days (7-day moving average)
6.4.9.3 Cases and Excess Deaths Combined
Below a 7-day moving average daily case count and estimated daily excess deaths are plotted for City Of Tshwane Metro on a log scale since start of the epidemic:
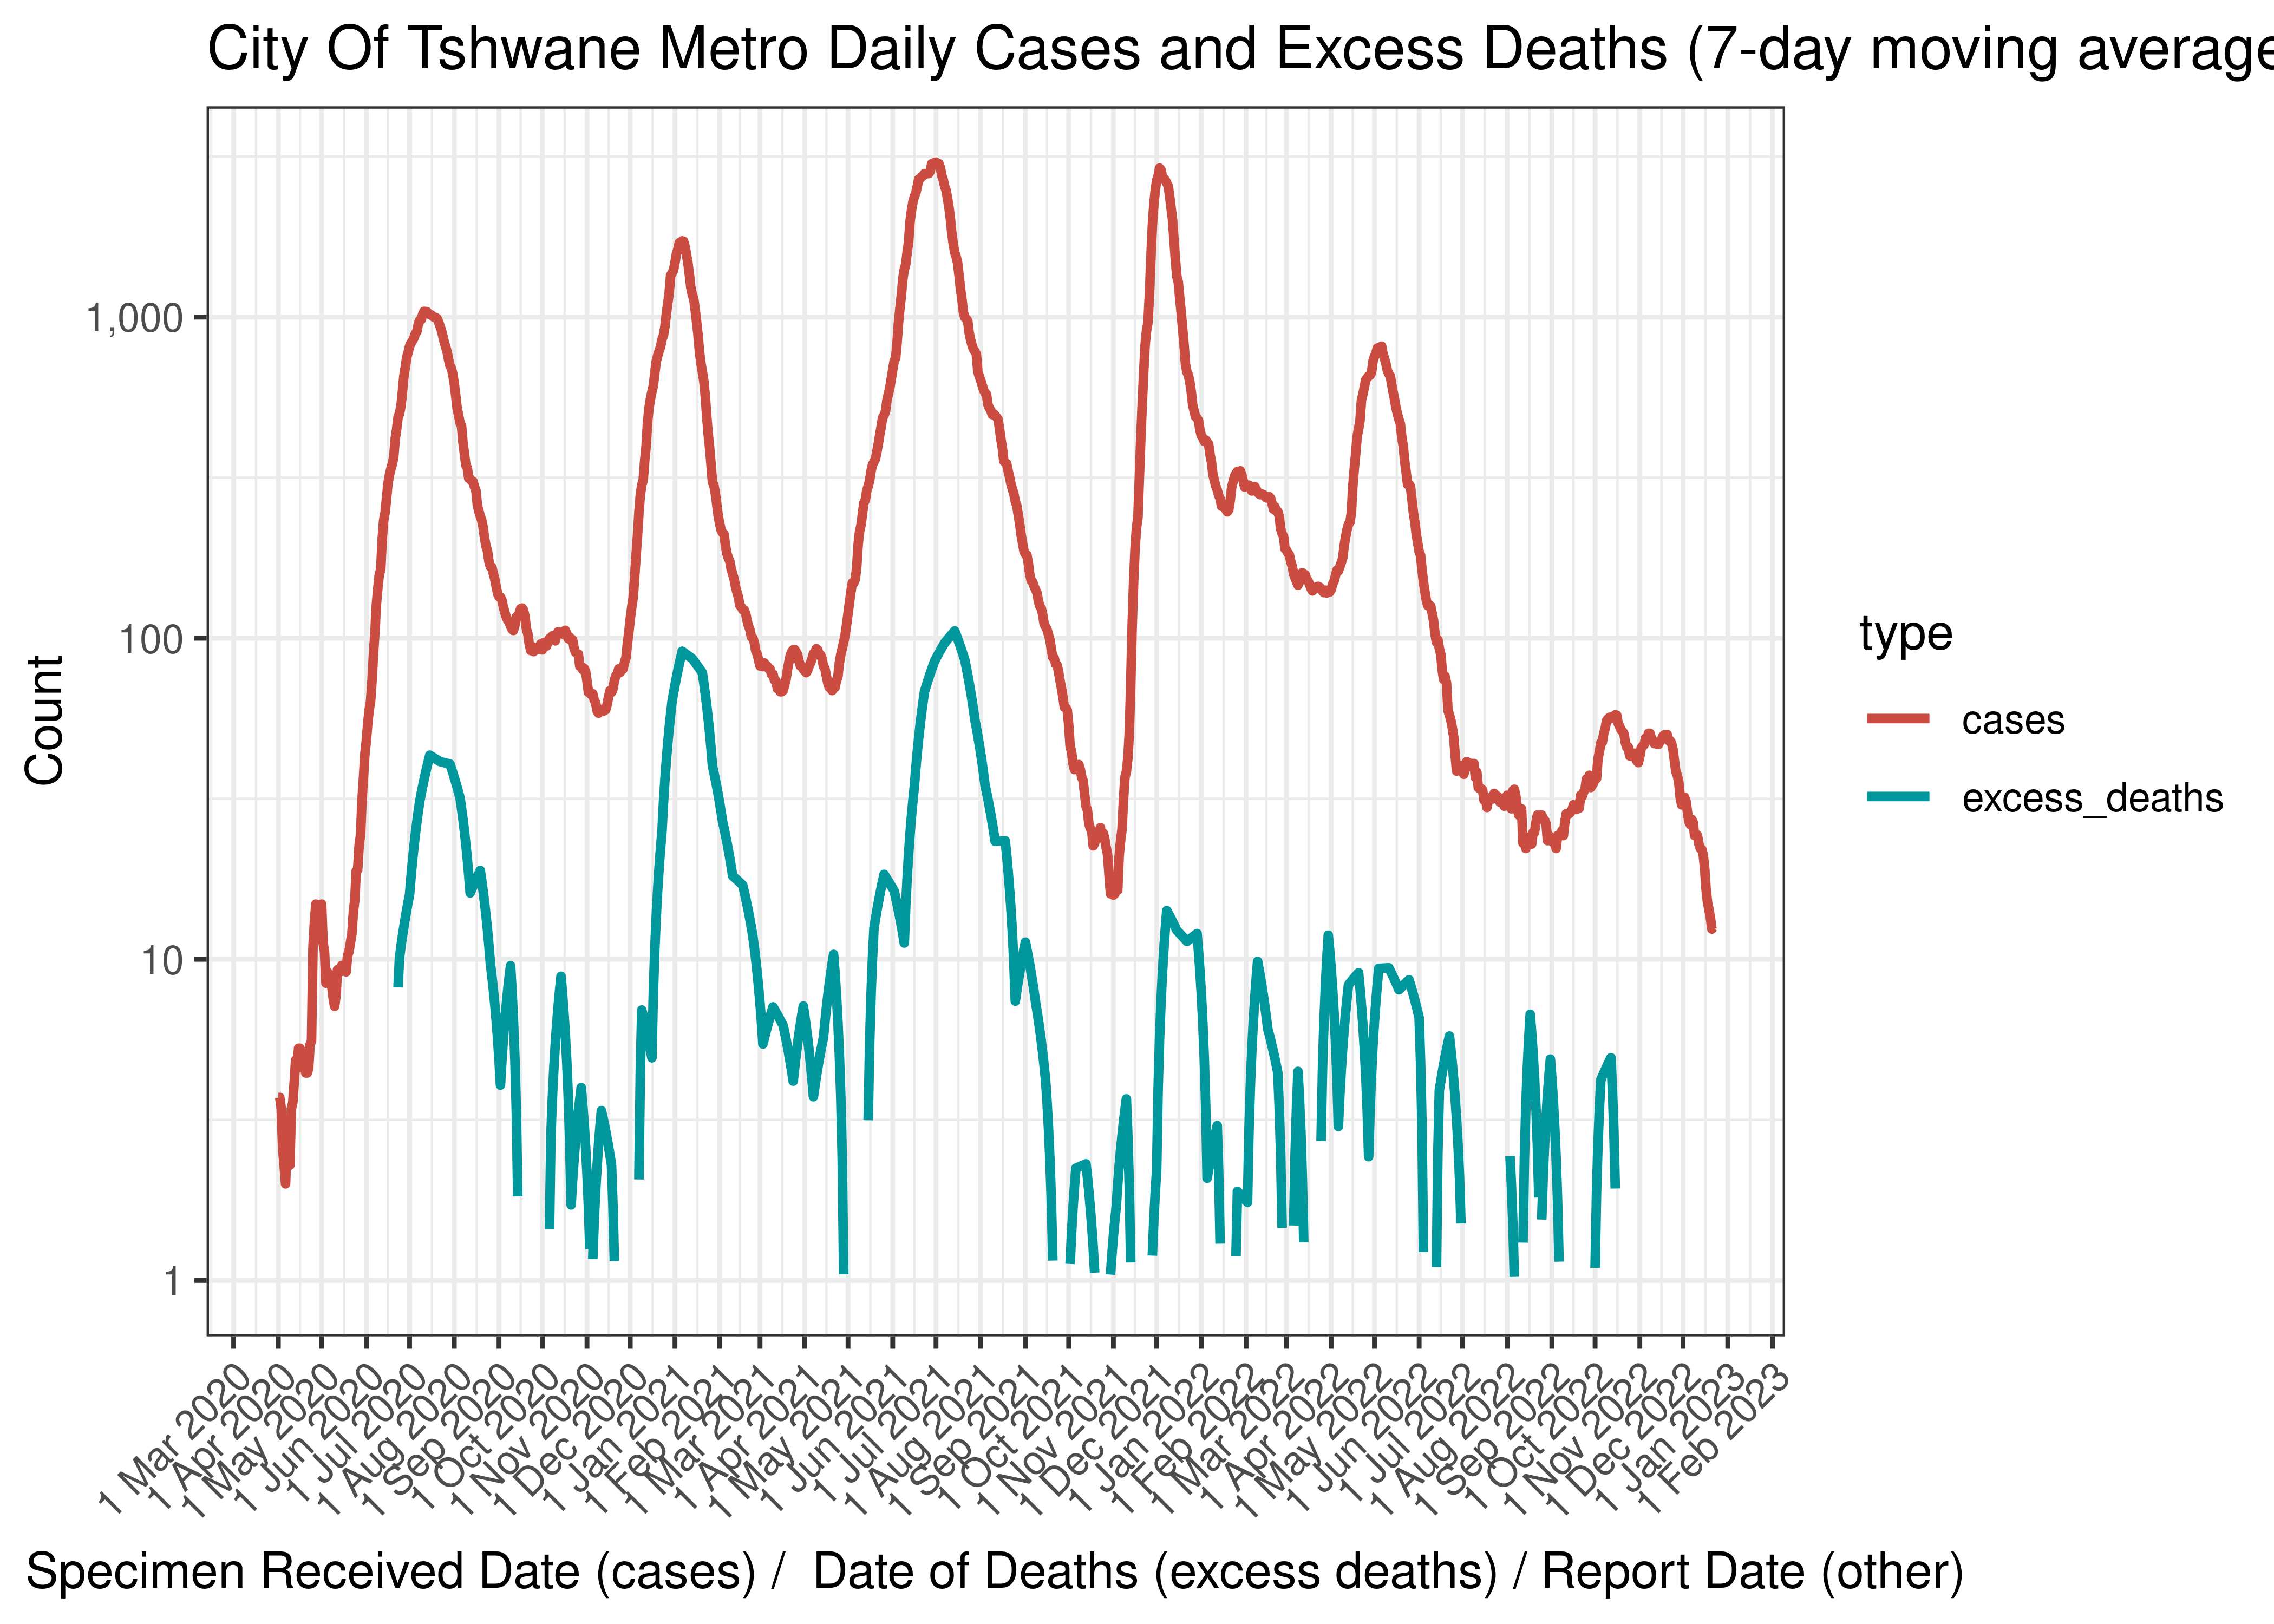
City Of Tshwane Metro Daily Cases and Excess Deaths (7-day moving average)
Below the above chart is repeated for the last 30-days:

City Of Tshwane Metro Daily Cases and Deaths (if available) for Last 30-days (7-day moving average)
6.4.9.4 Reproduction Number
Below current (last weekly) reproduction number estimates are tabulated for City Of Tshwane Metro.
| Count (Per Day) | Week Ending | Reproduction Number [95% Confidence Interval] | |
|---|---|---|---|
| City Of Tshwane Metro | 12.6 | 2022-12-25 | 0.73 [0.58 - 0.91] |
Below the effective reproduction number for City Of Tshwane Metro over the last 90 days are plotted together with a plot since start of the pandemic.
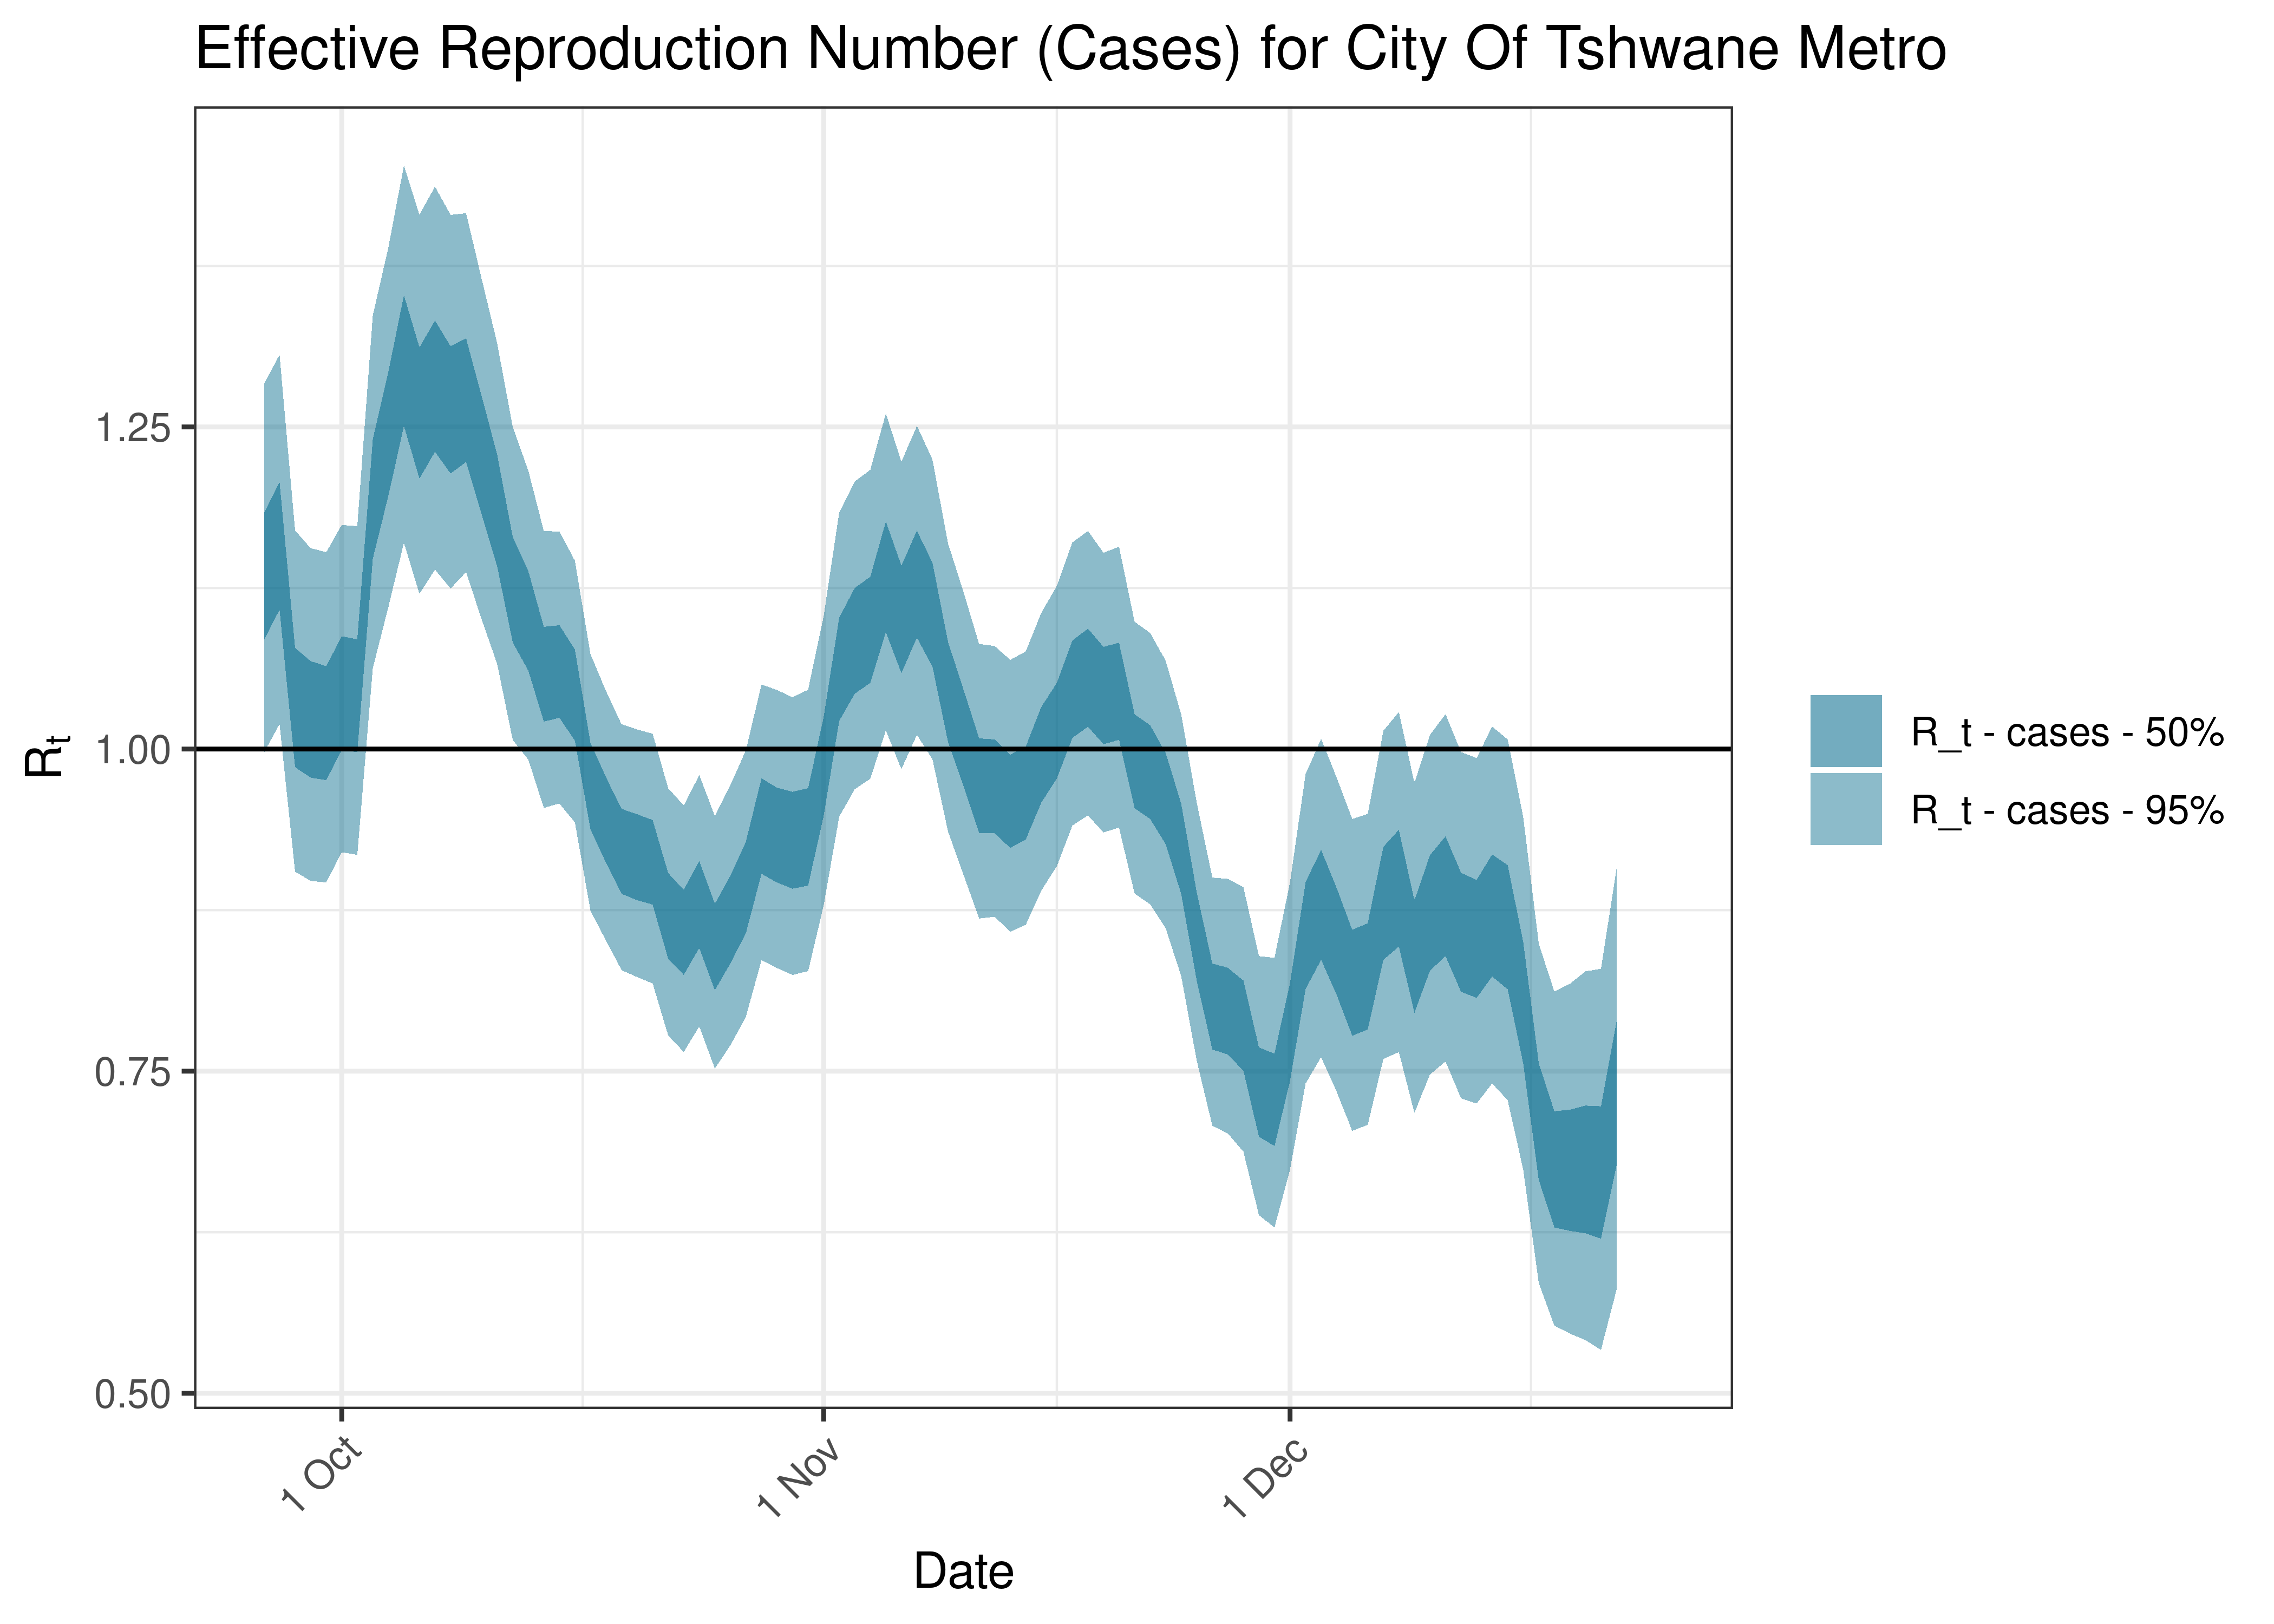
Estimated Effective Reproduction Number Based on Cases for City Of Tshwane Metro over last 90 days
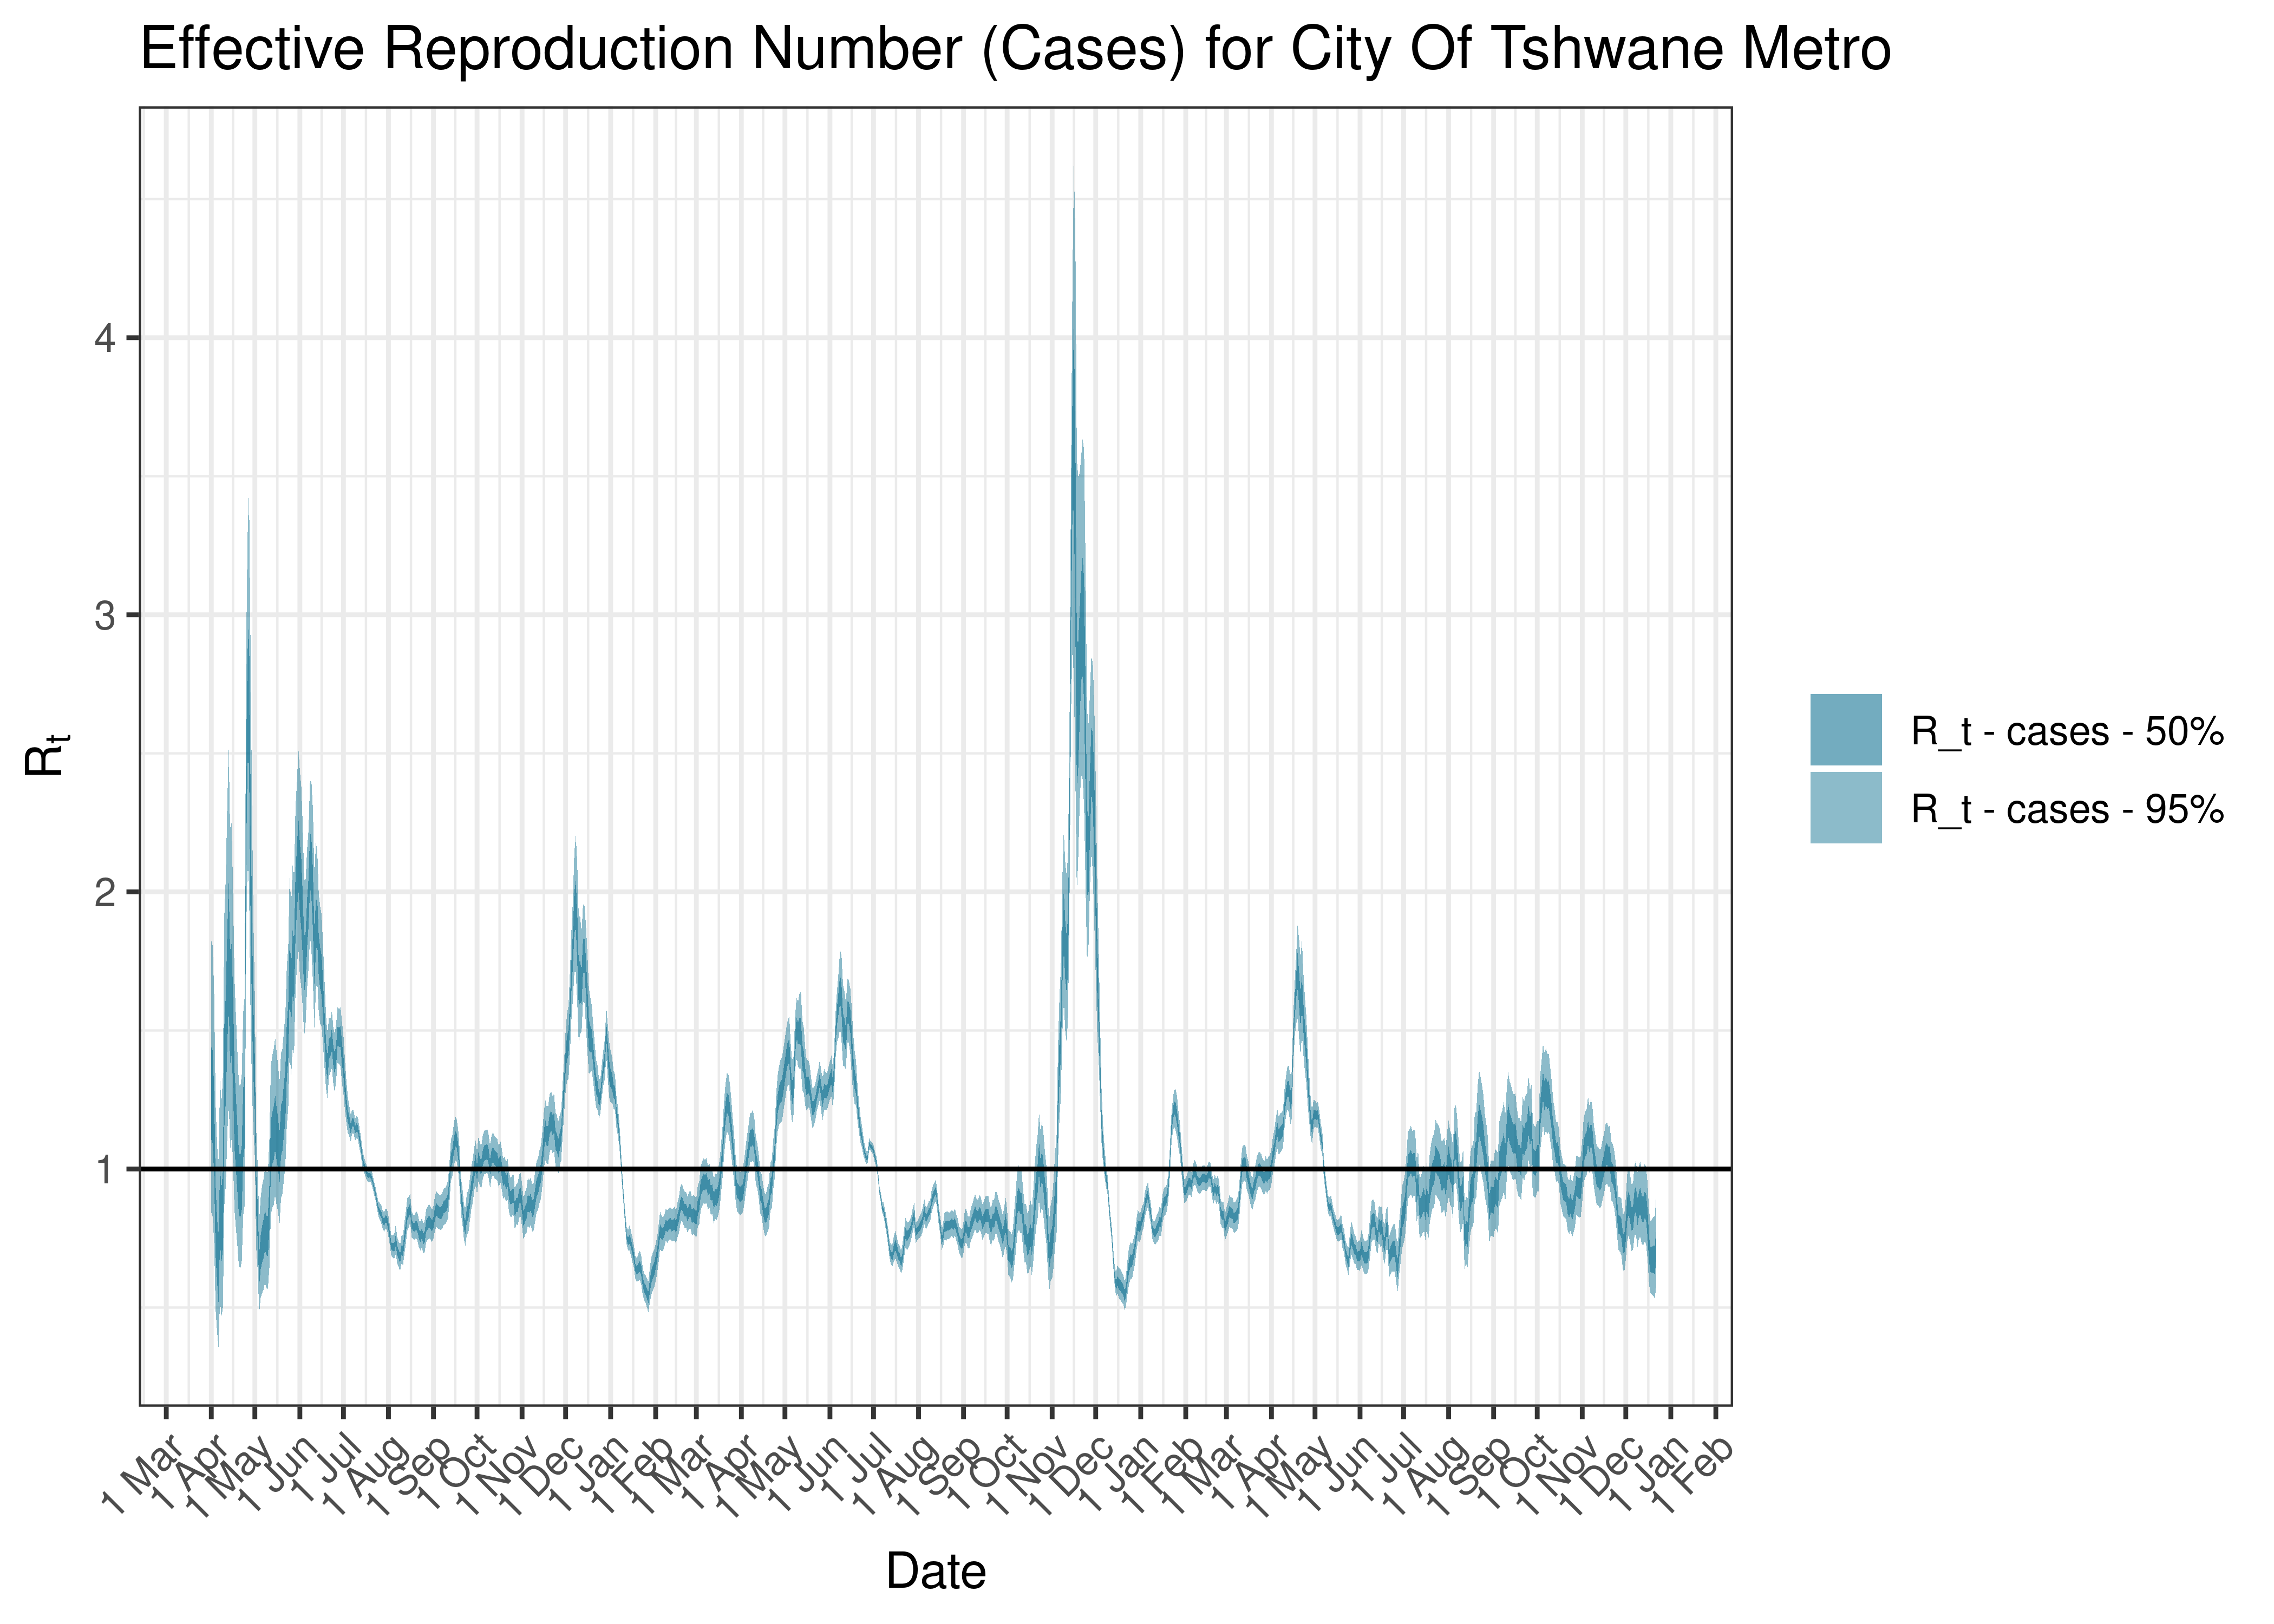
Estimated Effective Reproduction Number Based on Cases for City Of Tshwane Metro since 1 April 2020
6.4.10 Ekurhuleni Metro
6.4.10.1 Cases
Cases are tabulated by specimen received date below. Cases include estimates for late reporting in recent days as well as adjustments for any public holidays. A centred 7-day moving average is also shown. The peak daily cases in previous waves (as measured by the moving average) is also shown.
| Specimen Received Date | Cases | 7-day Moving Average | Comment |
|---|---|---|---|
| 2020-07-07 | 1,357 | 1,003 | Wave 1 Peak |
| 2021-01-06 | 1,168 | 1,030 | Wave 2 Peak |
| 2021-07-03 | 1,485 | 2,301 | Wave 3 Peak |
| 2021-12-09 | 3,027 | 2,159 | Wave 4 Peak |
| 2022-05-06 | 680 | 624 | Wave 5 Peak (to date) |
Below a 7-day moving average daily case count are plotted for Ekurhuleni Metro on a log scale since start of the epidemic:
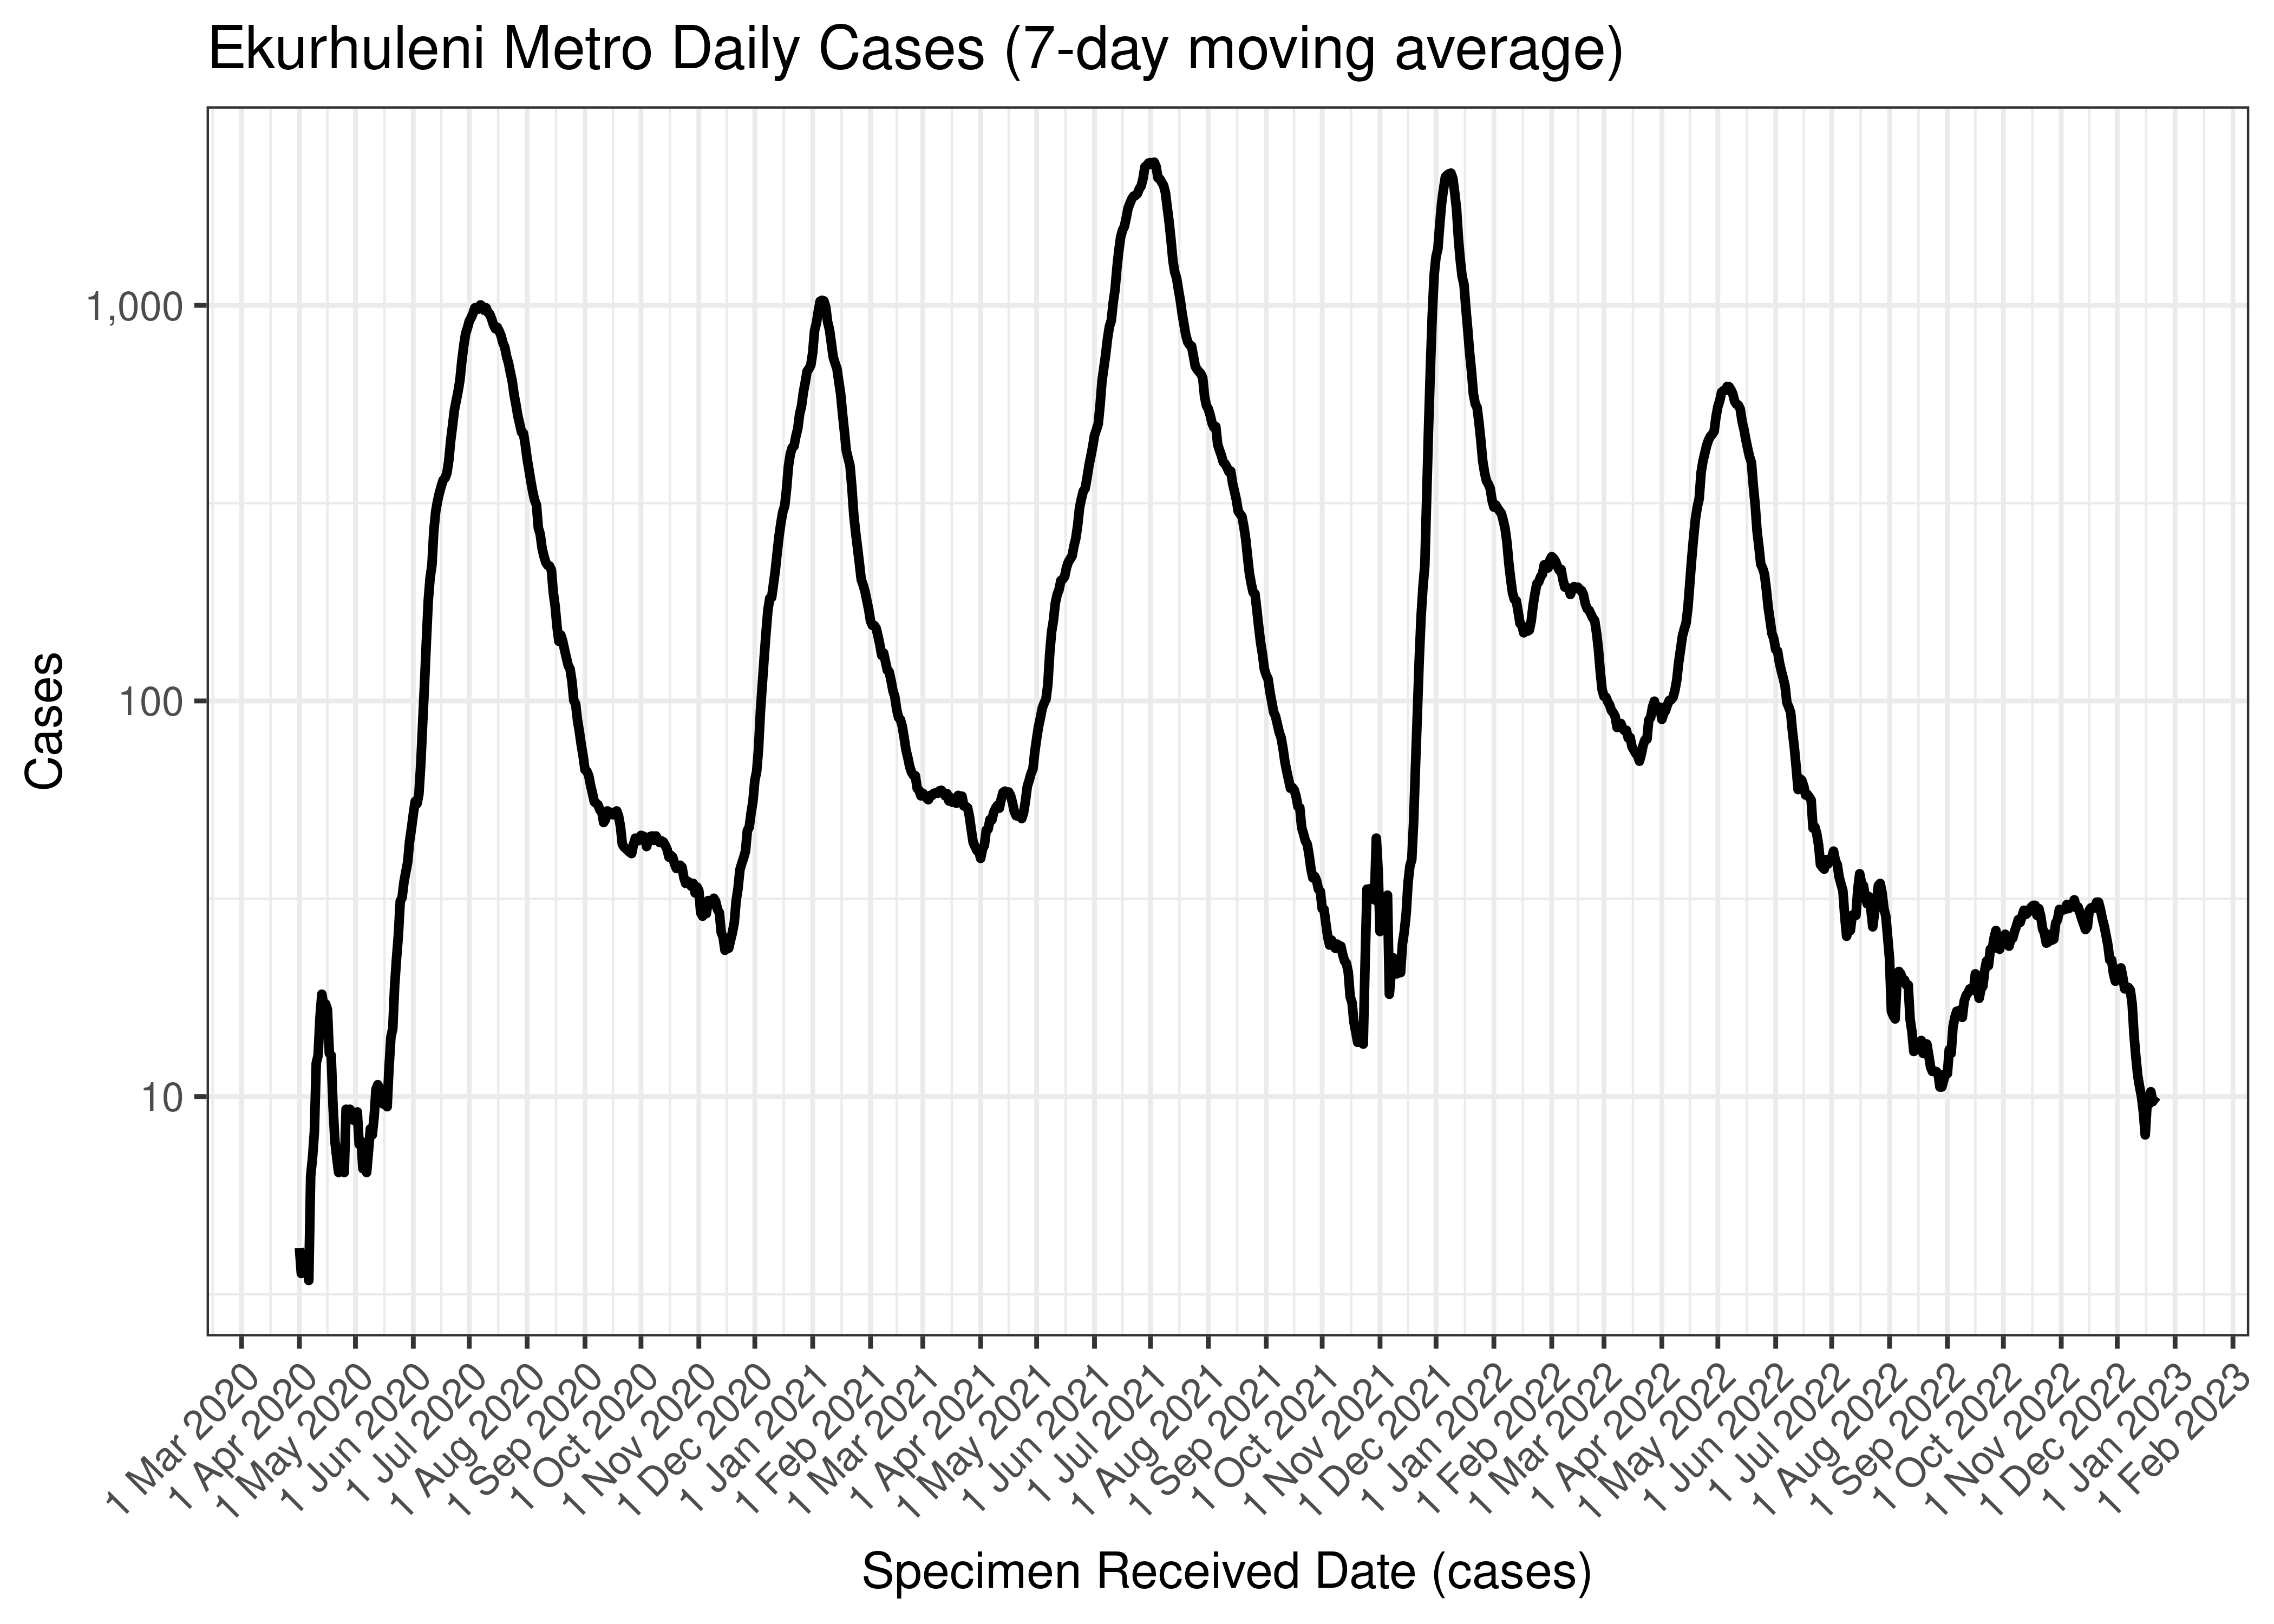
Ekurhuleni Metro Daily Cases (7-day moving average)
Below the above chart is repeated for the last 30-days:

Ekurhuleni Metro Daily Cases for Last 30-days (7-day moving average)
6.4.10.2 Excess Deaths
Excess deaths are tabulated by date of death below. A centred 7-day moving average is also shown. The peak daily deaths in previous waves (as measured by the moving average) is also shown.
| Specimen Received Date | Excess Deaths | 7-day Moving Average | Comment |
|---|---|---|---|
| 2020-07-15 | 100 | 100 | Wave 1 Peak |
| 2021-01-06 | 84 | 84 | Wave 2 Peak |
| 2021-07-14 | 160 | 160 | Wave 3 Peak |
| 2021-12-15 | 18 | 18 | Wave 4 Peak |
| 2022-04-06 | 10 | 10 | Wave 5 Peak (to date) |
| 2022-12-03 | -8 | -9 | |
| 2022-12-04 | -11 | -10 | |
| 2022-12-05 | -11 | -10 | |
| 2022-12-06 | -11 | -11 | |
| 2022-12-07 | -11 | -11 | |
| 2022-12-08 | -11 | NA | |
| 2022-12-09 | -11 | NA | |
| 2022-12-10 | -11 | NA |
Below a 7-day moving average daily excess deaths is plotted for Ekurhuleni Metro on a log scale since start of the epidemic:
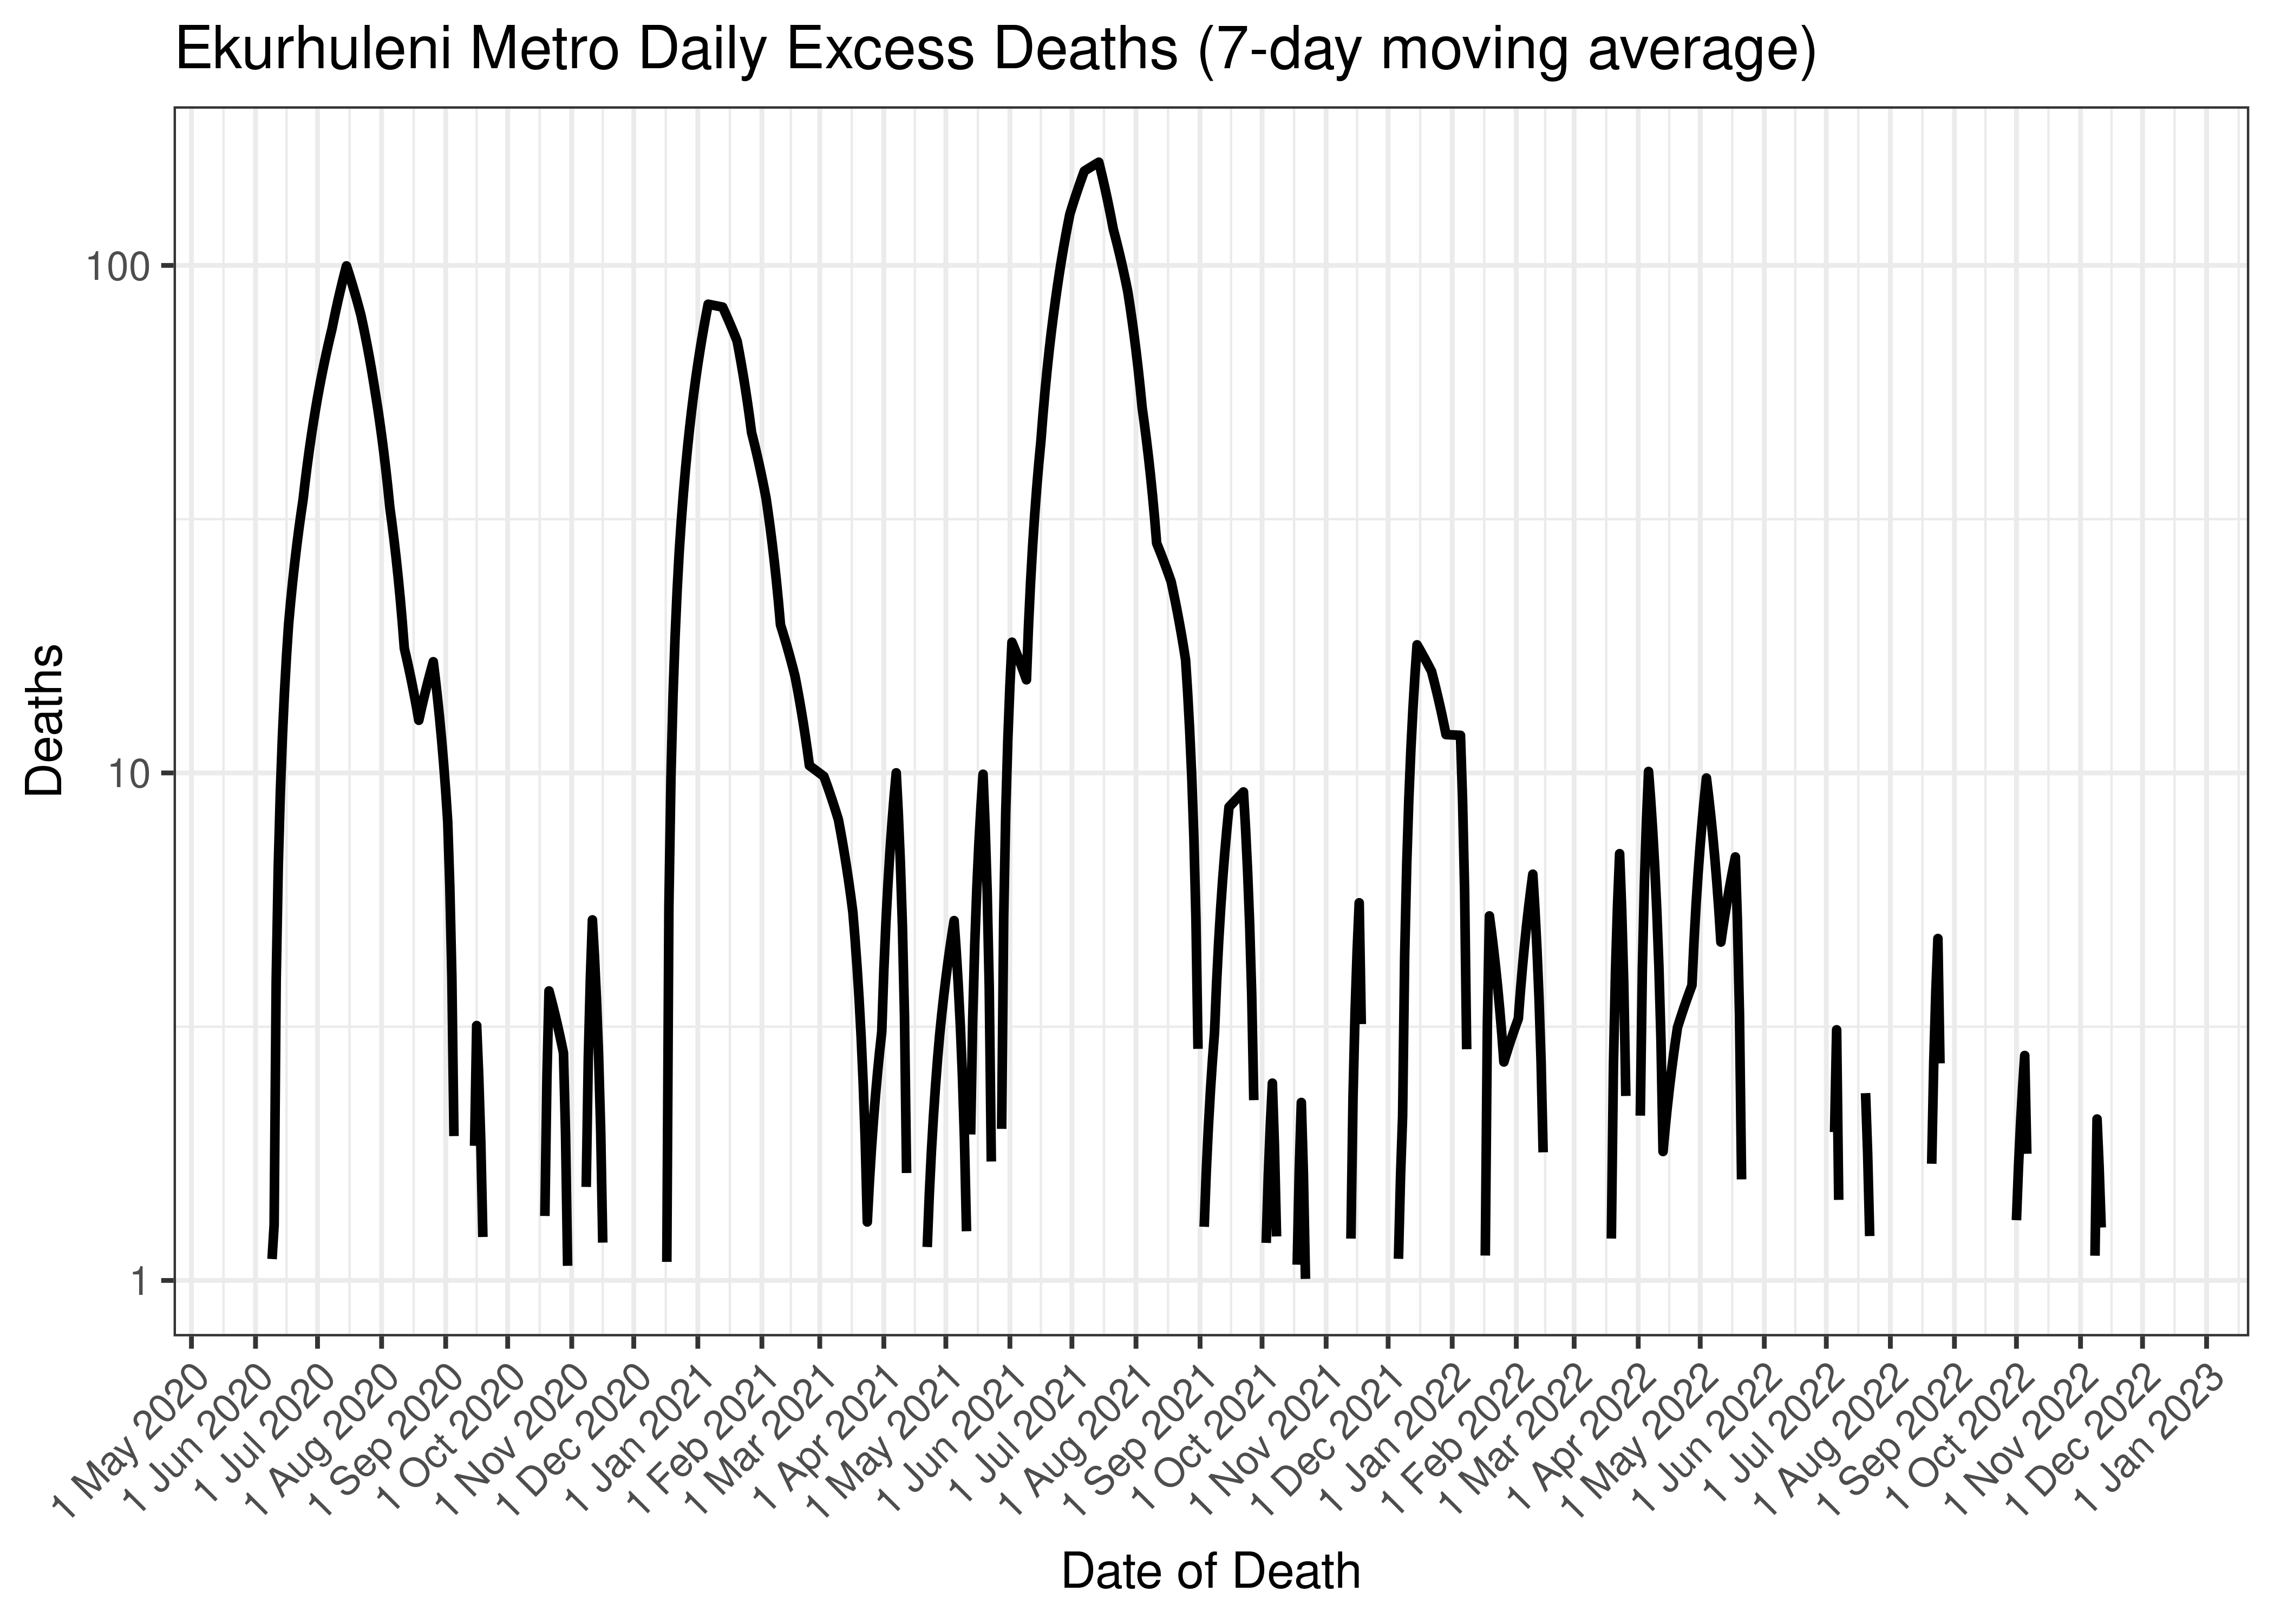
Ekurhuleni Metro Daily Excess Deaths (7-day moving average)
Below the above chart is repeated for the last 30-days:
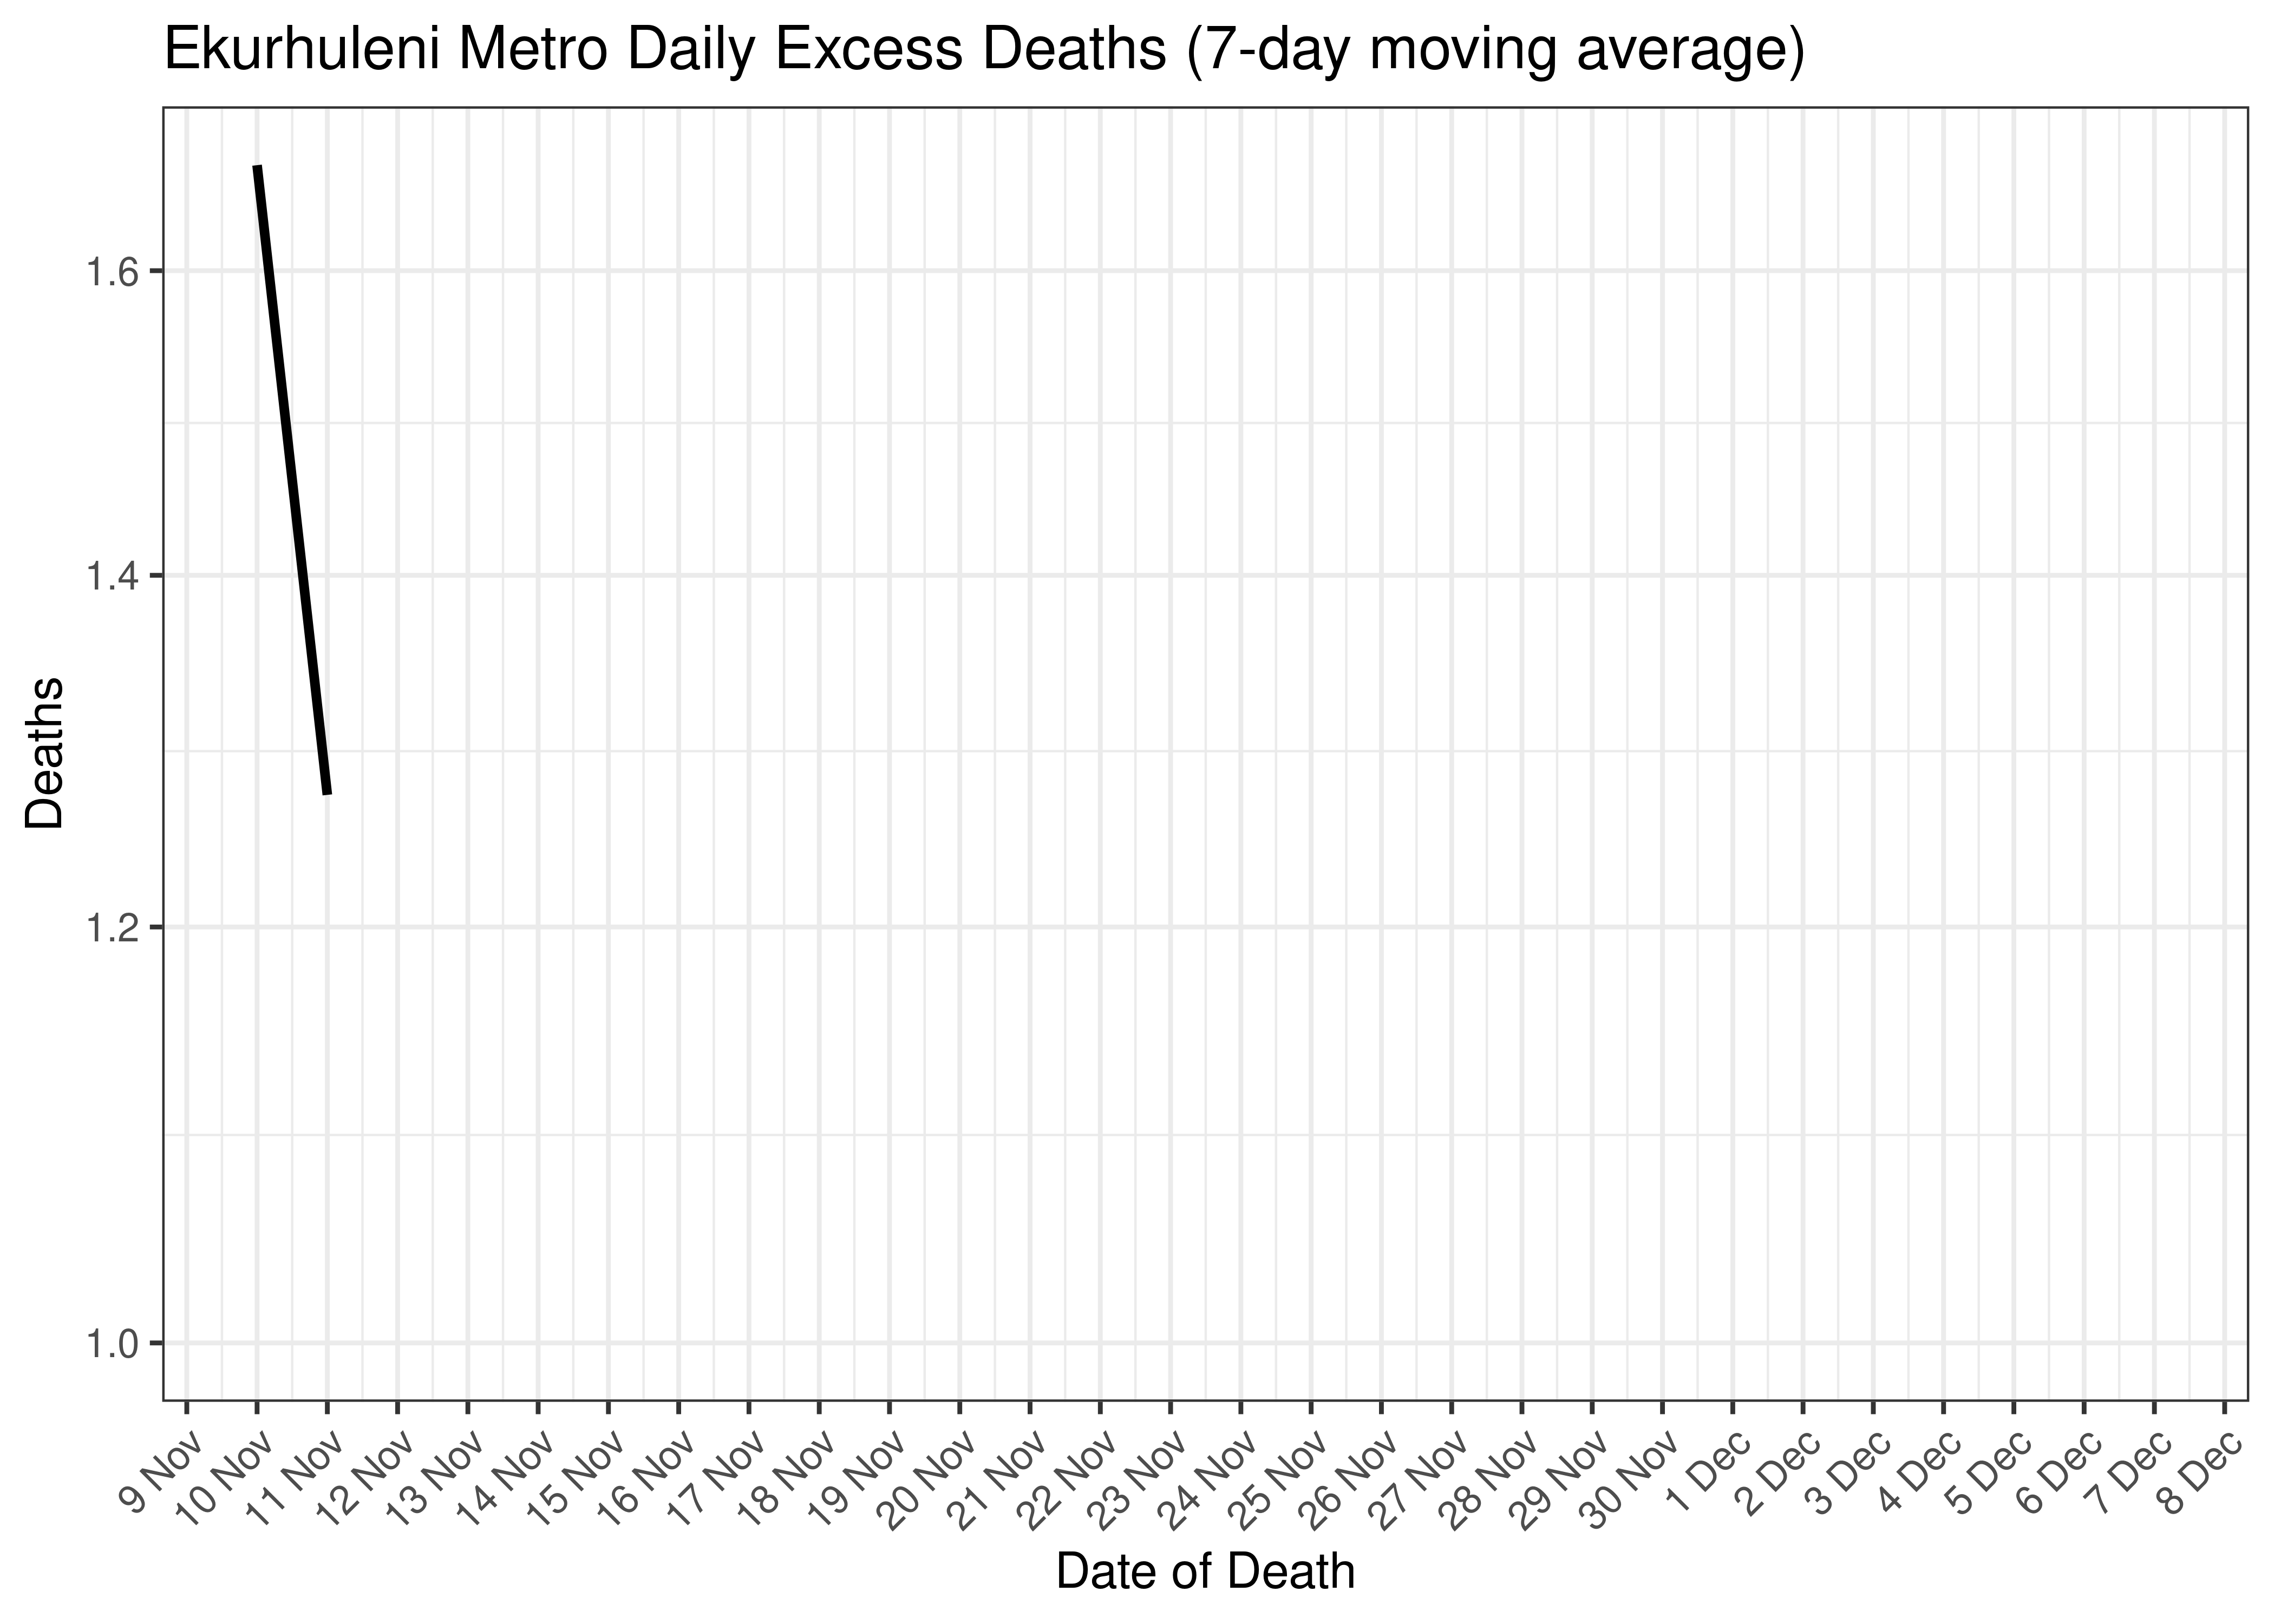
Ekurhuleni Metro Excess Deaths for Last 30-days (7-day moving average)
6.4.10.3 Cases and Excess Deaths Combined
Below a 7-day moving average daily case count and estimated daily excess deaths are plotted for Ekurhuleni Metro on a log scale since start of the epidemic:
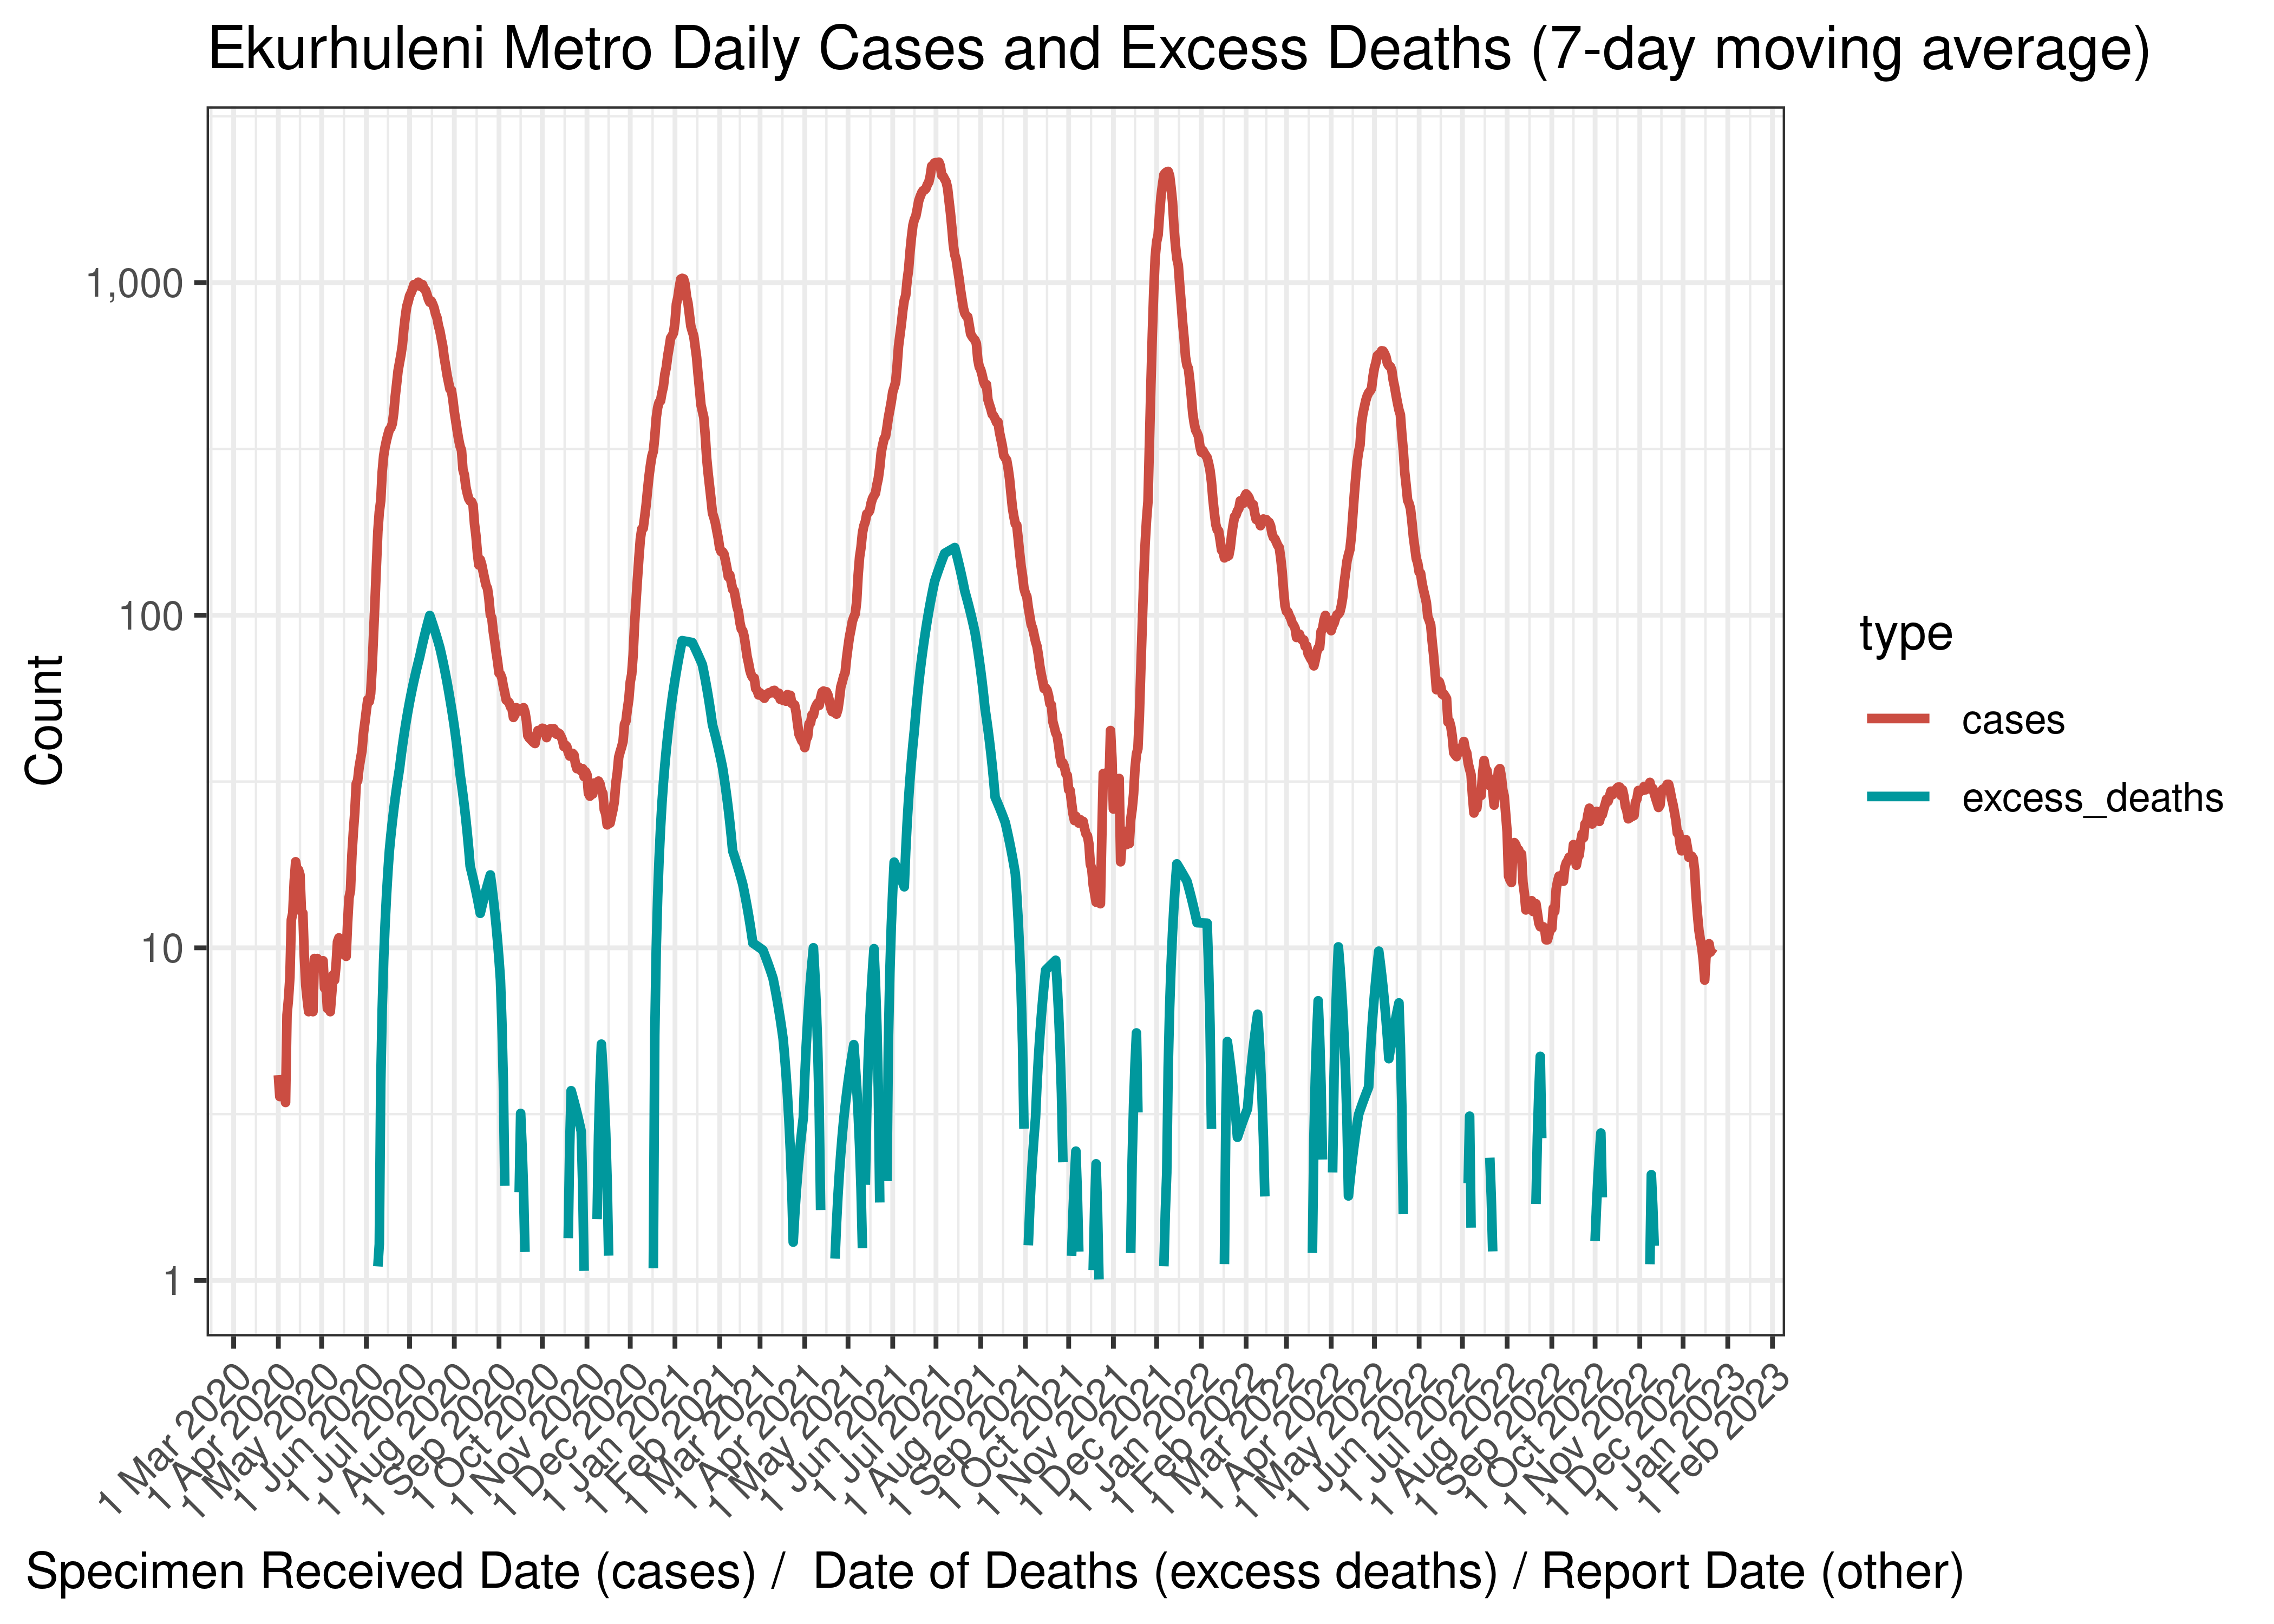
Ekurhuleni Metro Daily Cases and Excess Deaths (7-day moving average)
Below the above chart is repeated for the last 30-days:
Ekurhuleni Metro Daily Cases and Deaths (if available) for Last 30-days (7-day moving average)
6.4.10.4 Reproduction Number
Below current (last weekly) reproduction number estimates are tabulated for Ekurhuleni Metro.
| Count (Per Day) | Week Ending | Reproduction Number [95% Confidence Interval] | |
|---|---|---|---|
| Ekurhuleni Metro | 10 | 2022-12-25 | 1.04 [0.81 - 1.31] |
Below the effective reproduction number for Ekurhuleni Metro over the last 90 days are plotted together with a plot since start of the pandemic.
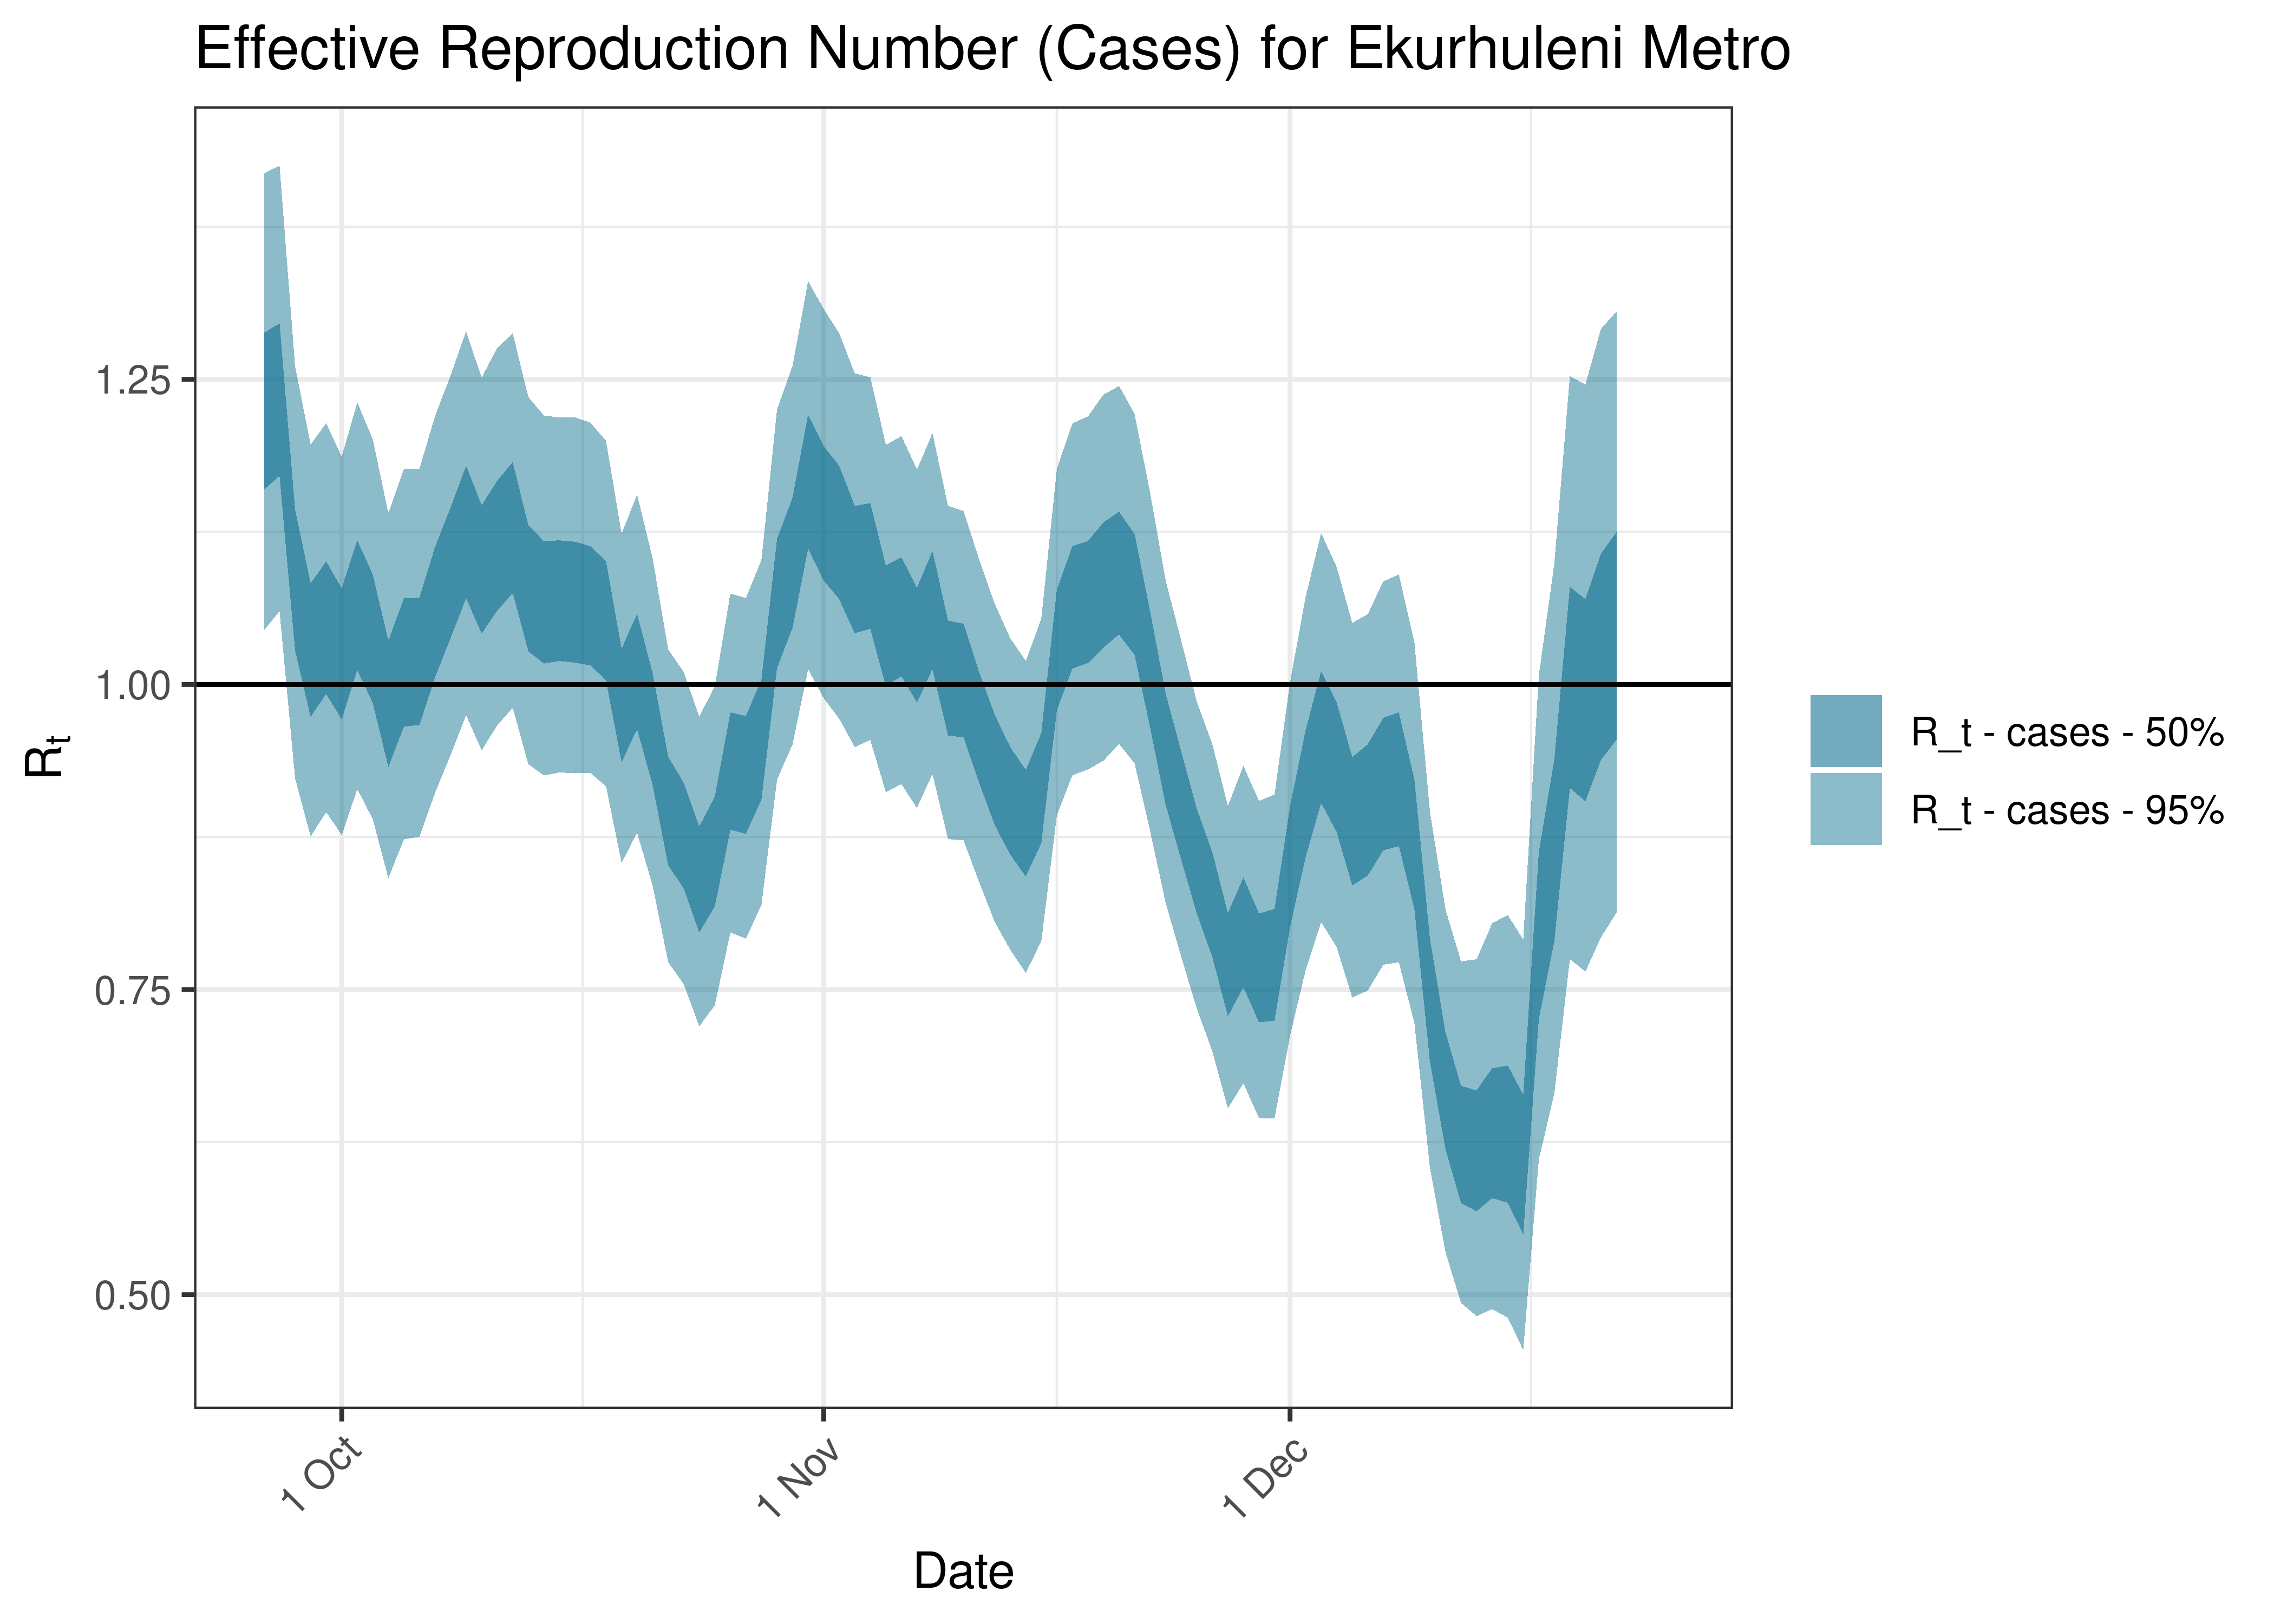
Estimated Effective Reproduction Number Based on Cases for Ekurhuleni Metro over last 90 days
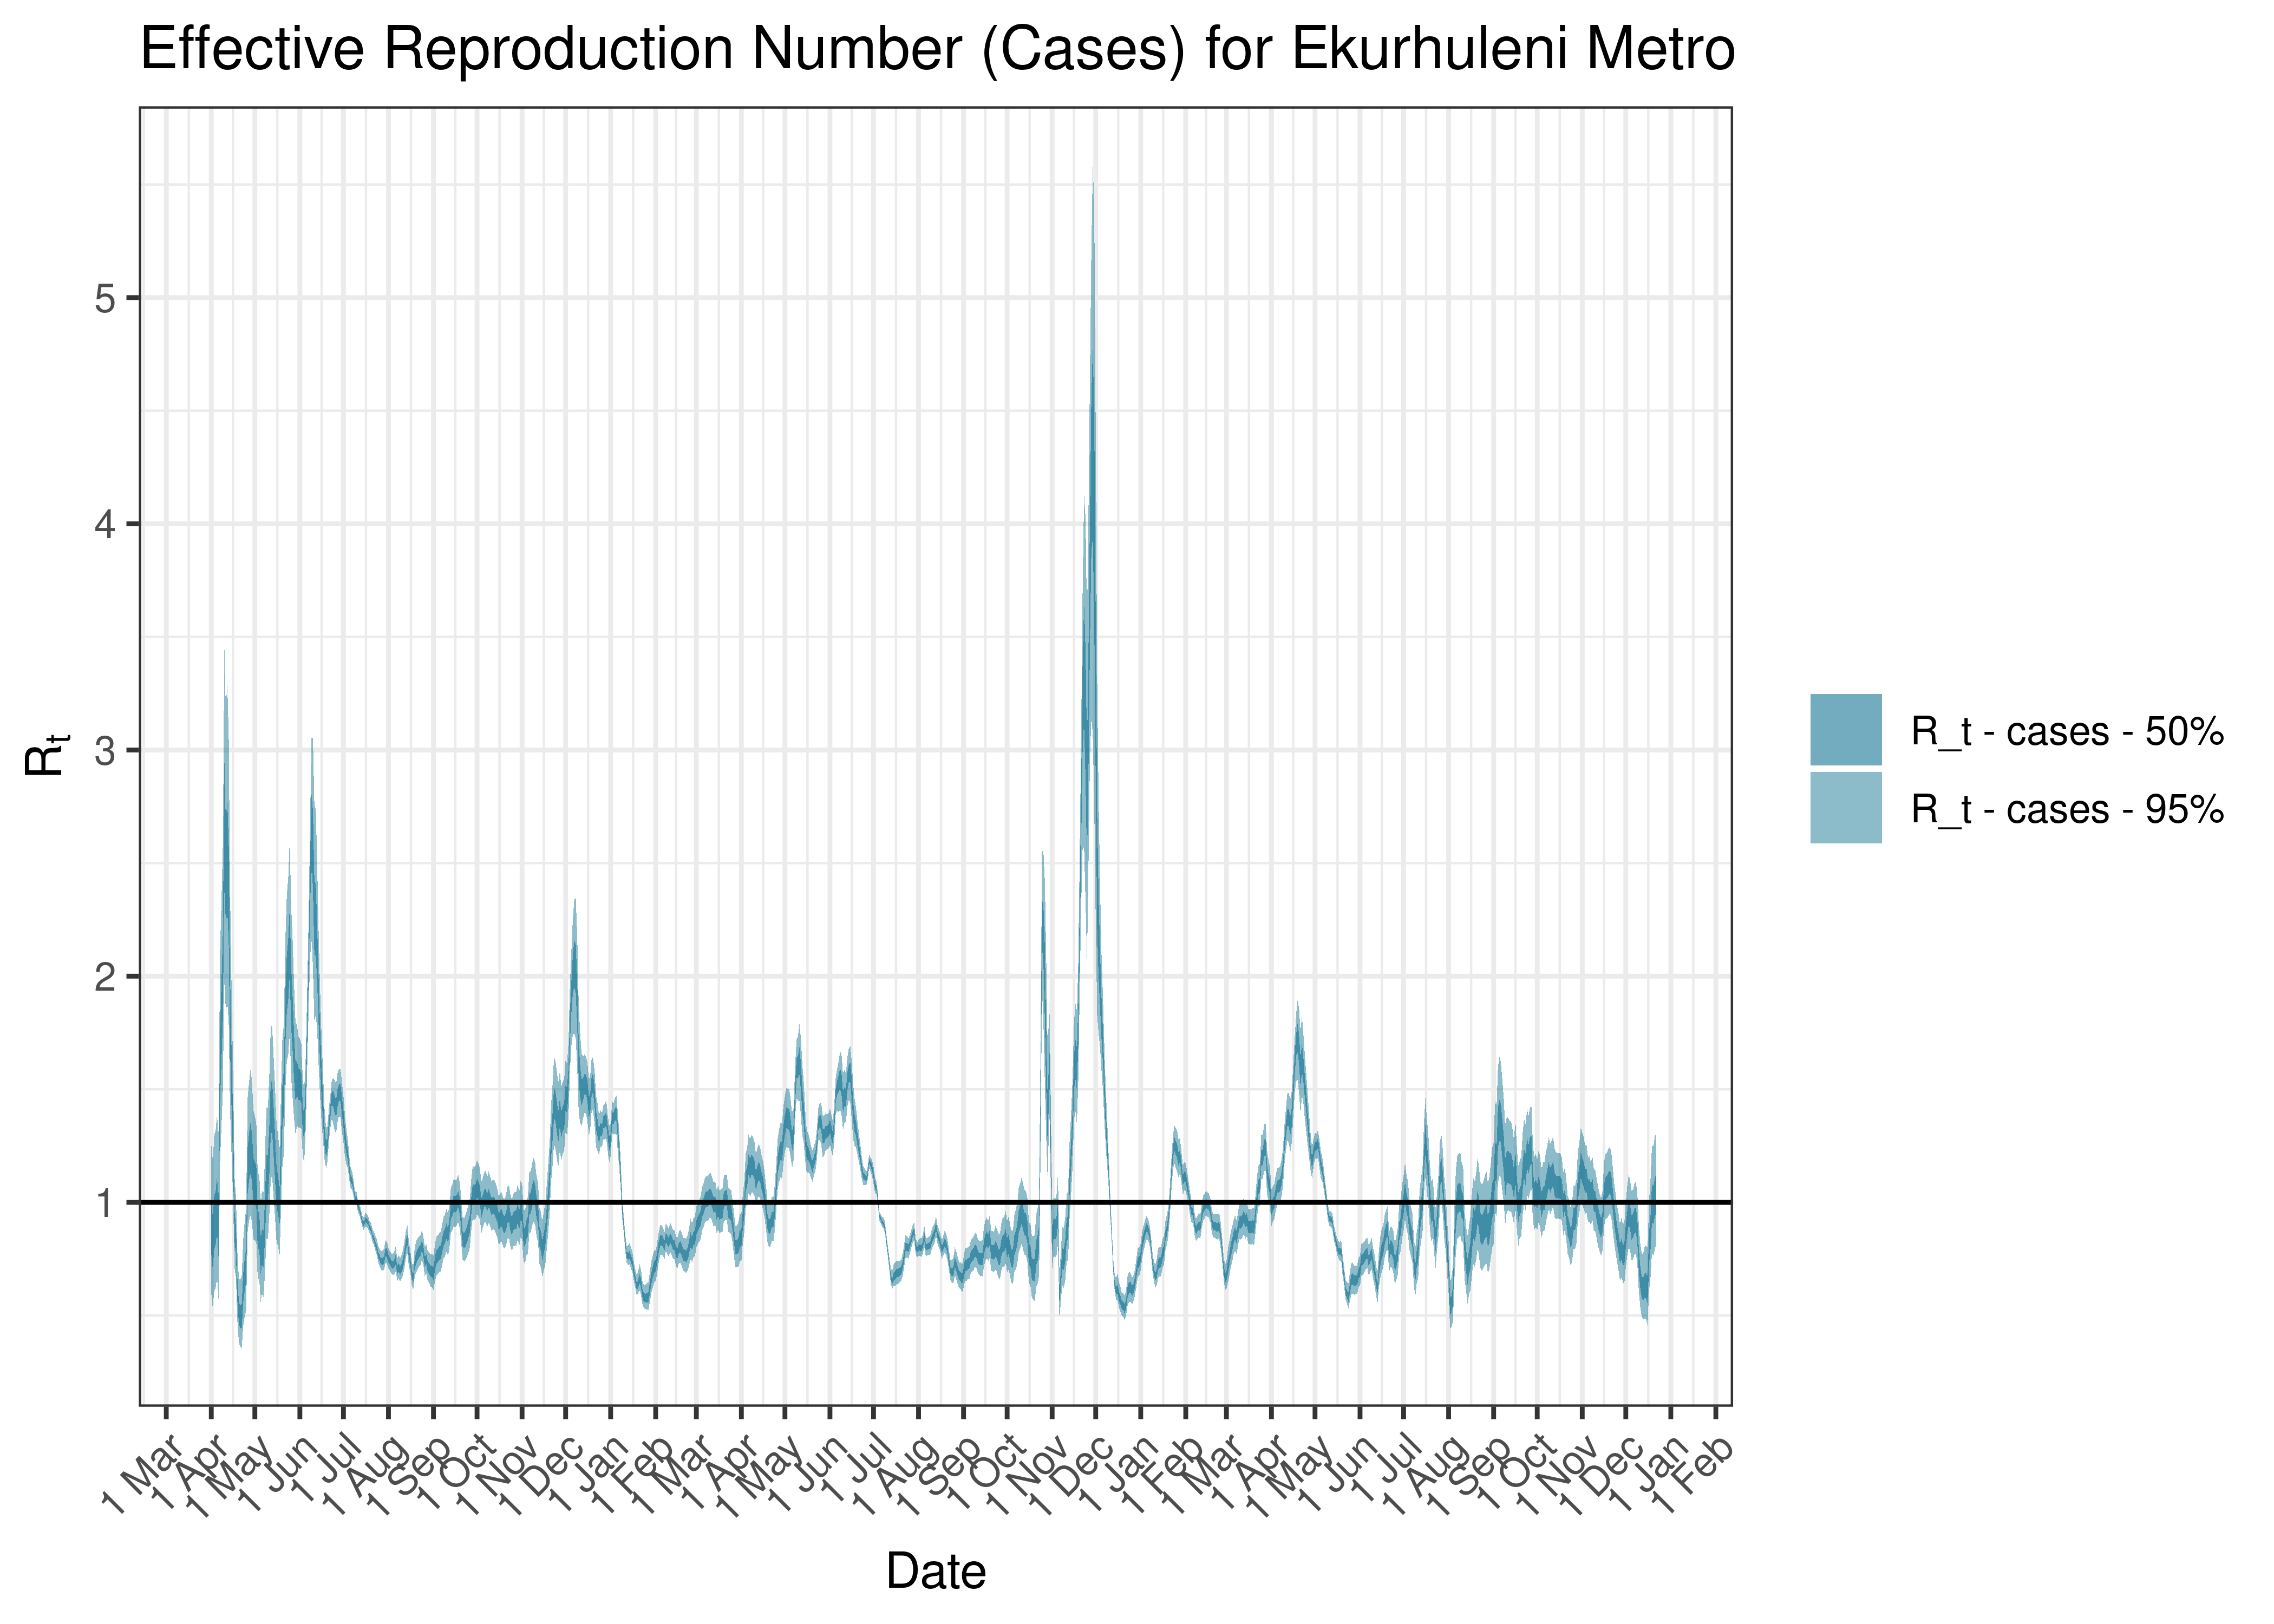
Estimated Effective Reproduction Number Based on Cases for Ekurhuleni Metro since 1 April 2020
6.4.11 Sedibeng
6.4.11.1 Cases
Cases are tabulated by specimen received date below. Cases include estimates for late reporting in recent days as well as adjustments for any public holidays. A centred 7-day moving average is also shown. The peak daily cases in previous waves (as measured by the moving average) is also shown.
| Specimen Received Date | Cases | 7-day Moving Average | Comment |
|---|---|---|---|
| 2020-07-16 | 432 | 402 | Wave 1 Peak |
| 2021-01-07 | 264 | 240 | Wave 2 Peak |
| 2021-07-02 | 632 | 641 | Wave 3 Peak |
| 2021-12-09 | 593 | 514 | Wave 4 Peak |
| 2022-05-06 | 140 | 132 | Wave 5 Peak (to date) |
Below a 7-day moving average daily case count are plotted for Sedibeng on a log scale since start of the epidemic:
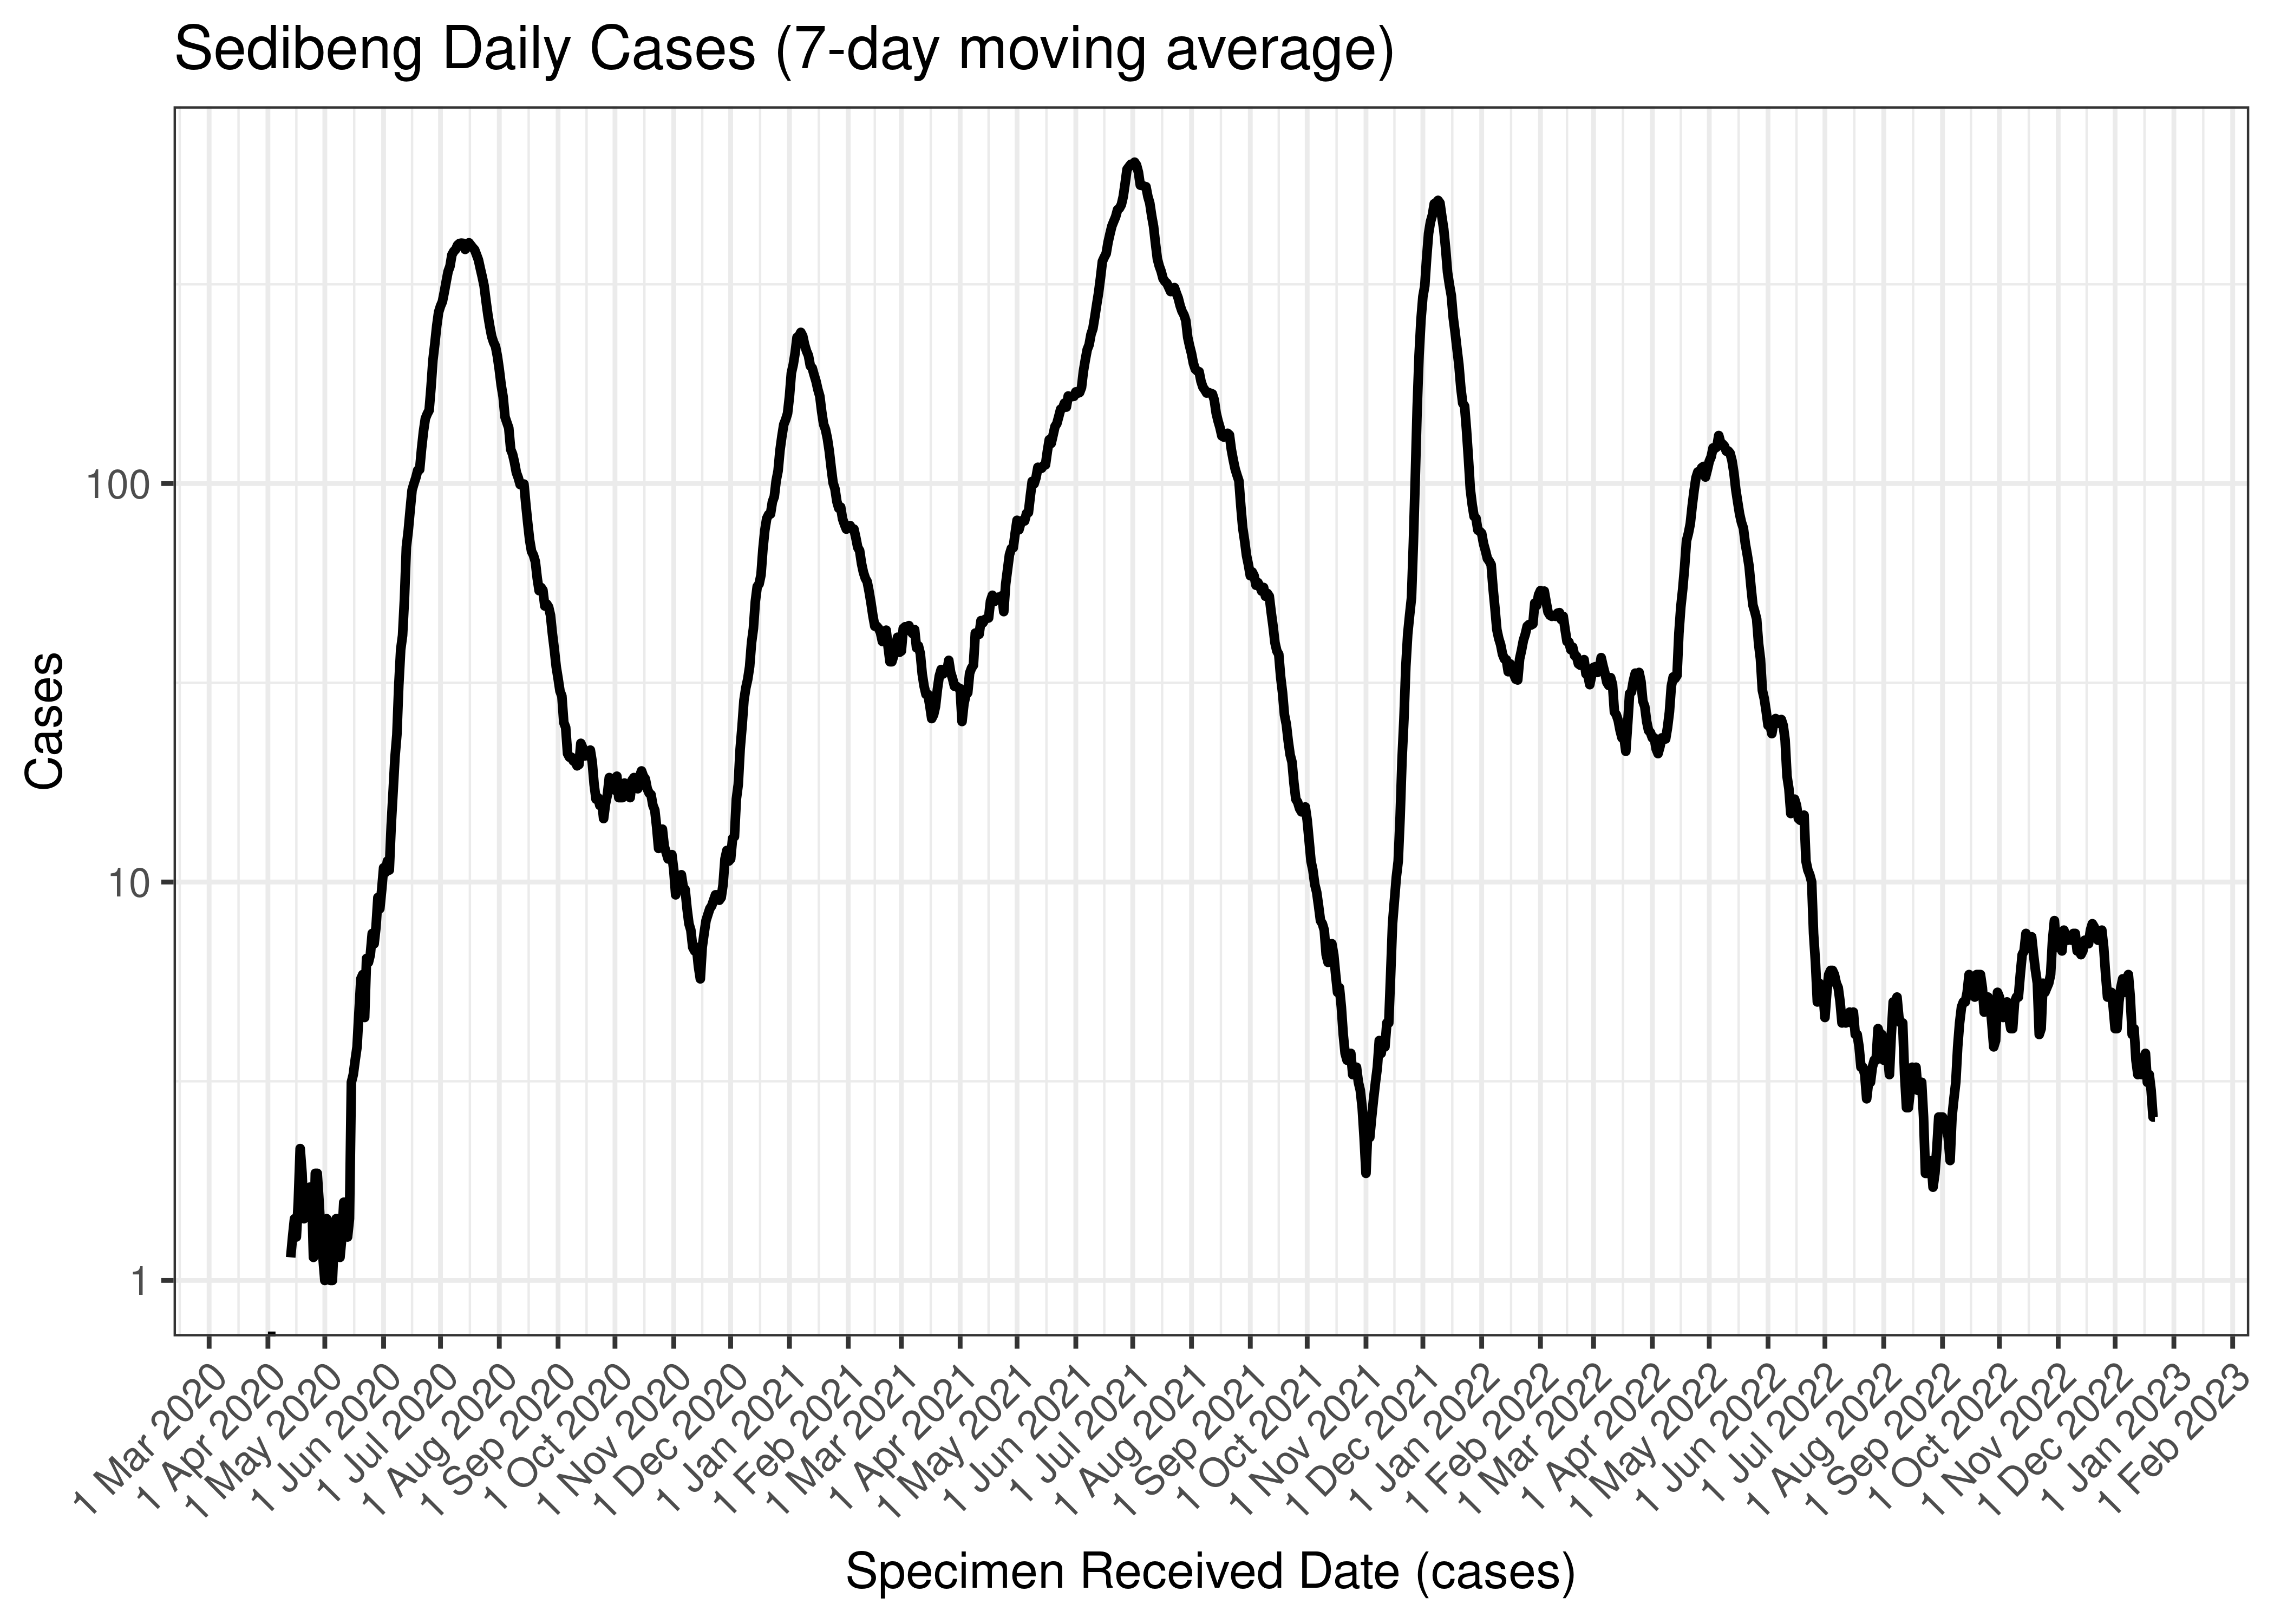
Sedibeng Daily Cases (7-day moving average)
Below the above chart is repeated for the last 30-days:
Sedibeng Daily Cases for Last 30-days (7-day moving average)
6.4.11.2 Reproduction Number
Below current (last weekly) reproduction number estimates are tabulated for Sedibeng.
| Count (Per Day) | Week Ending | Reproduction Number [95% Confidence Interval] | |
|---|---|---|---|
| Sedibeng | 2.6 | 2022-12-25 | 0.79 [0.48 - 1.19] |
Below the effective reproduction number for Sedibeng over the last 90 days are plotted together with a plot since start of the pandemic.
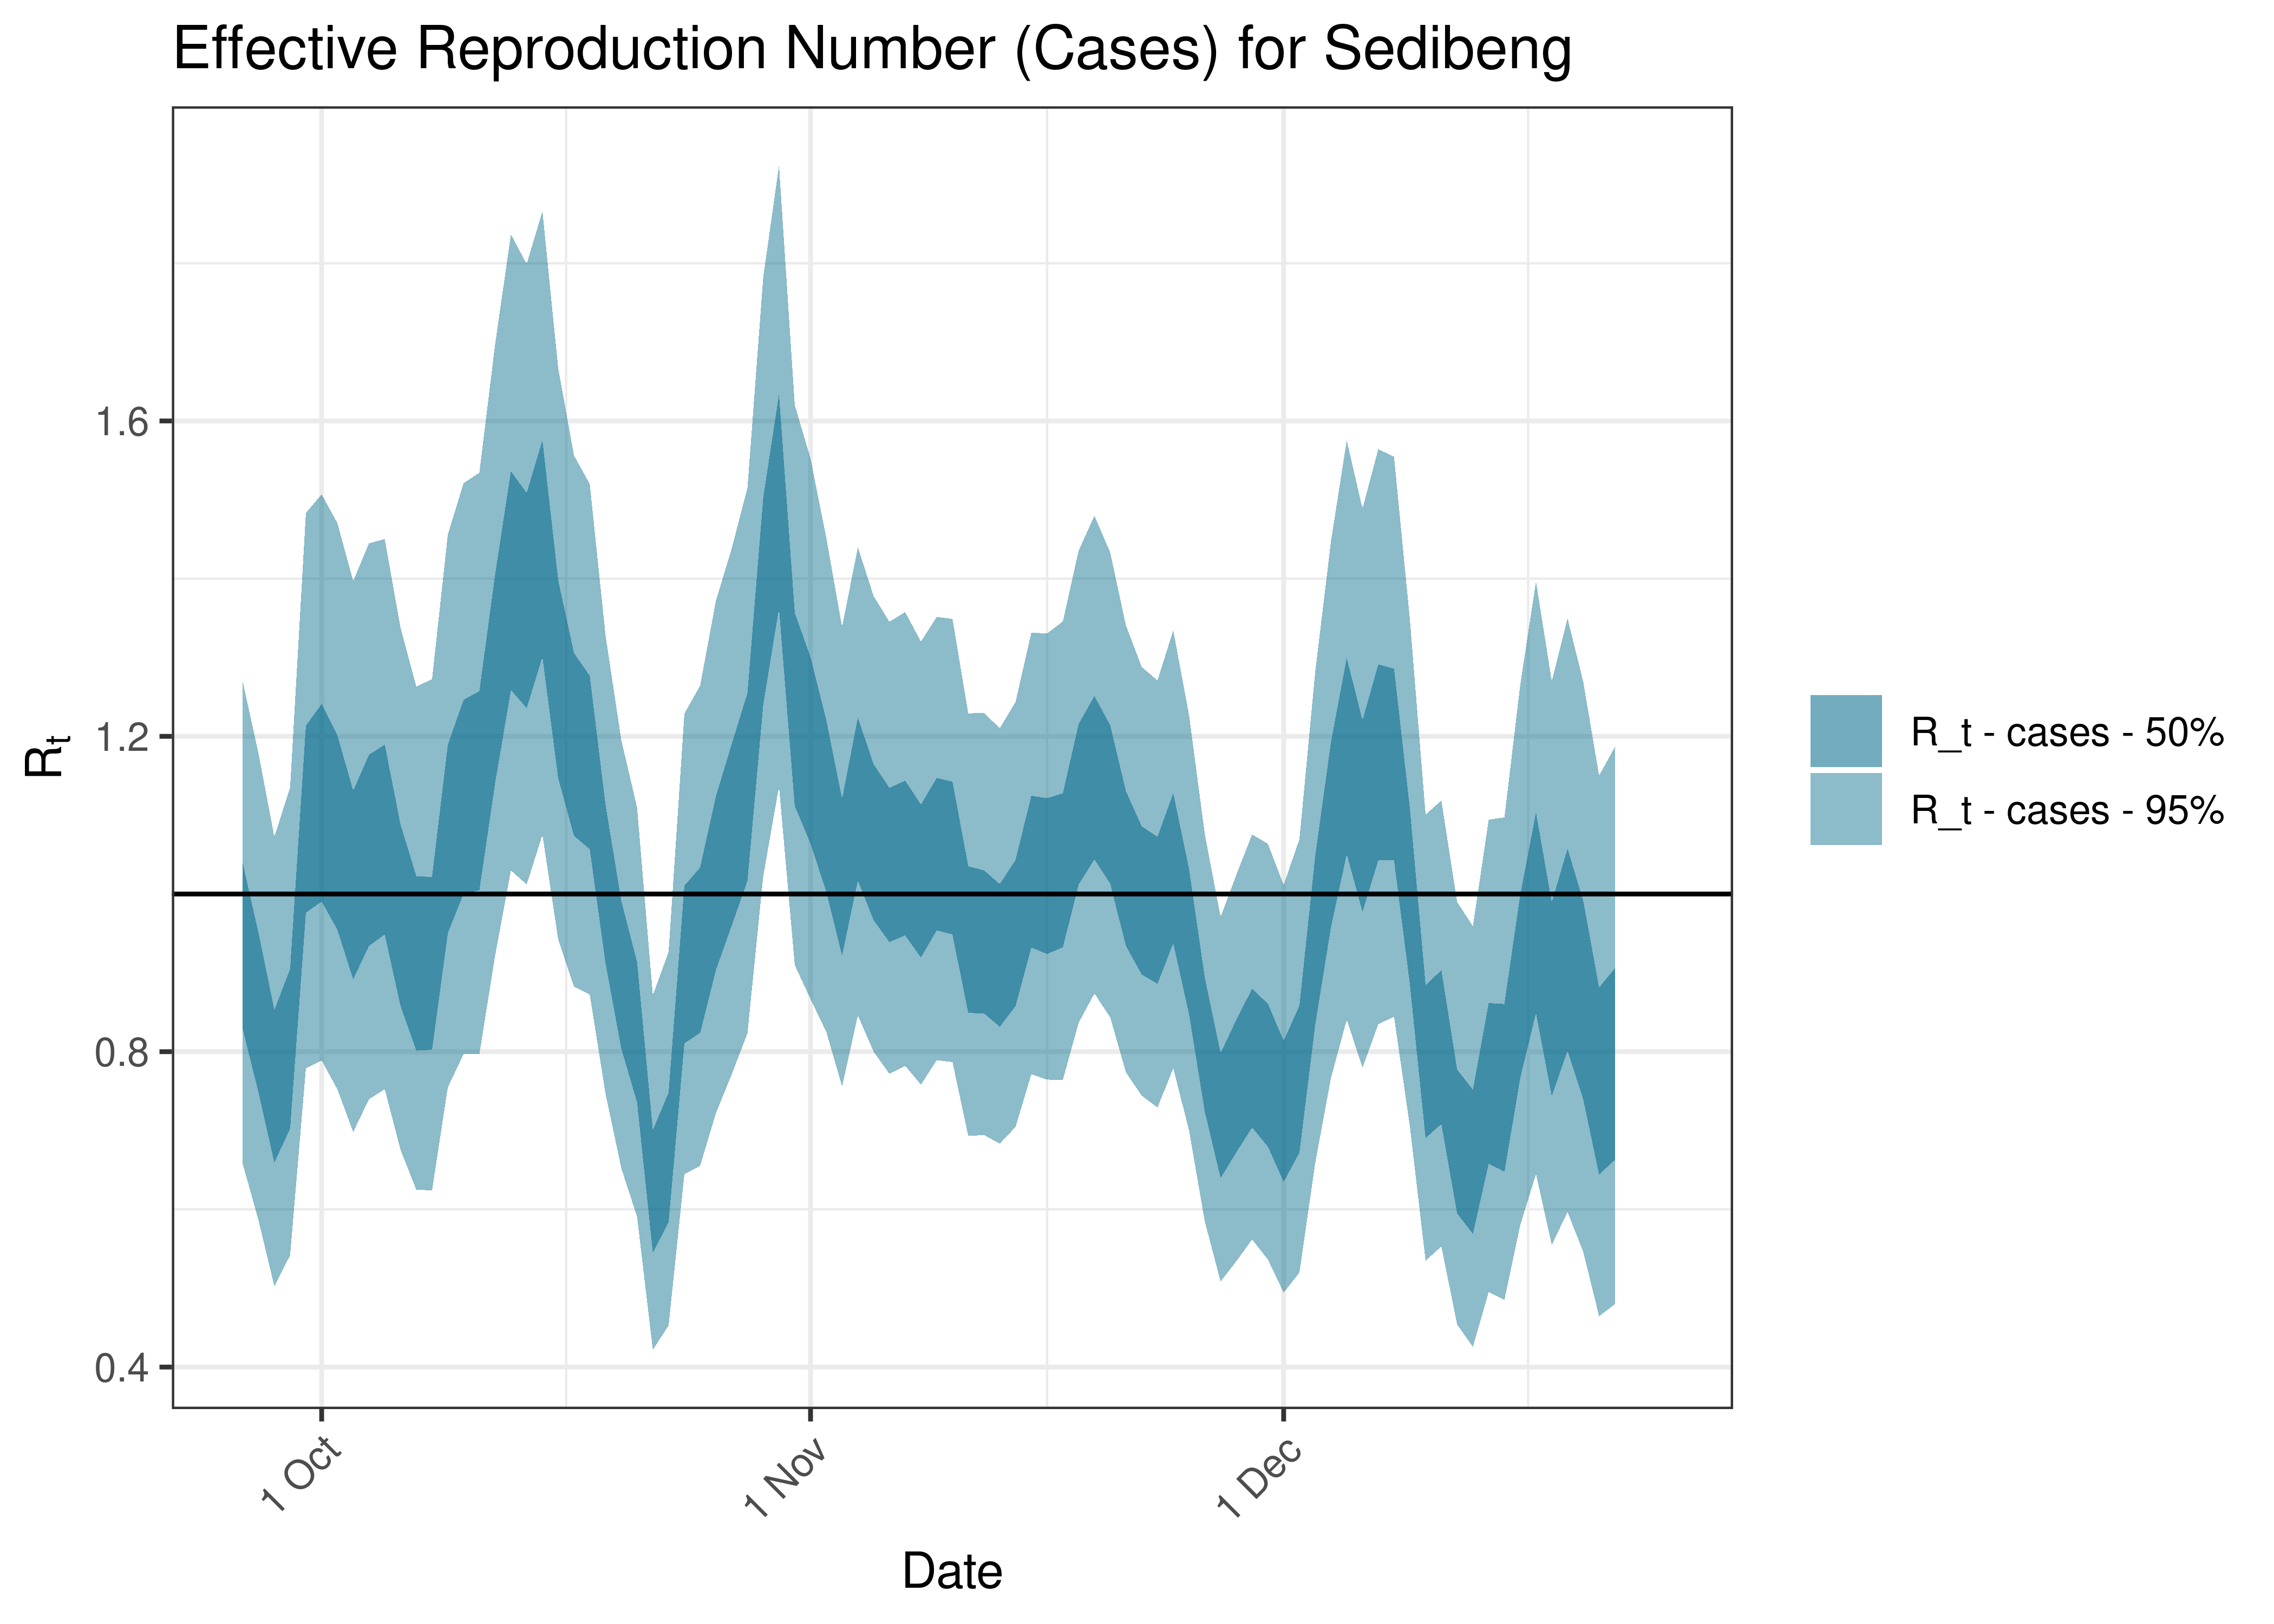
Estimated Effective Reproduction Number Based on Cases for Sedibeng over last 90 days
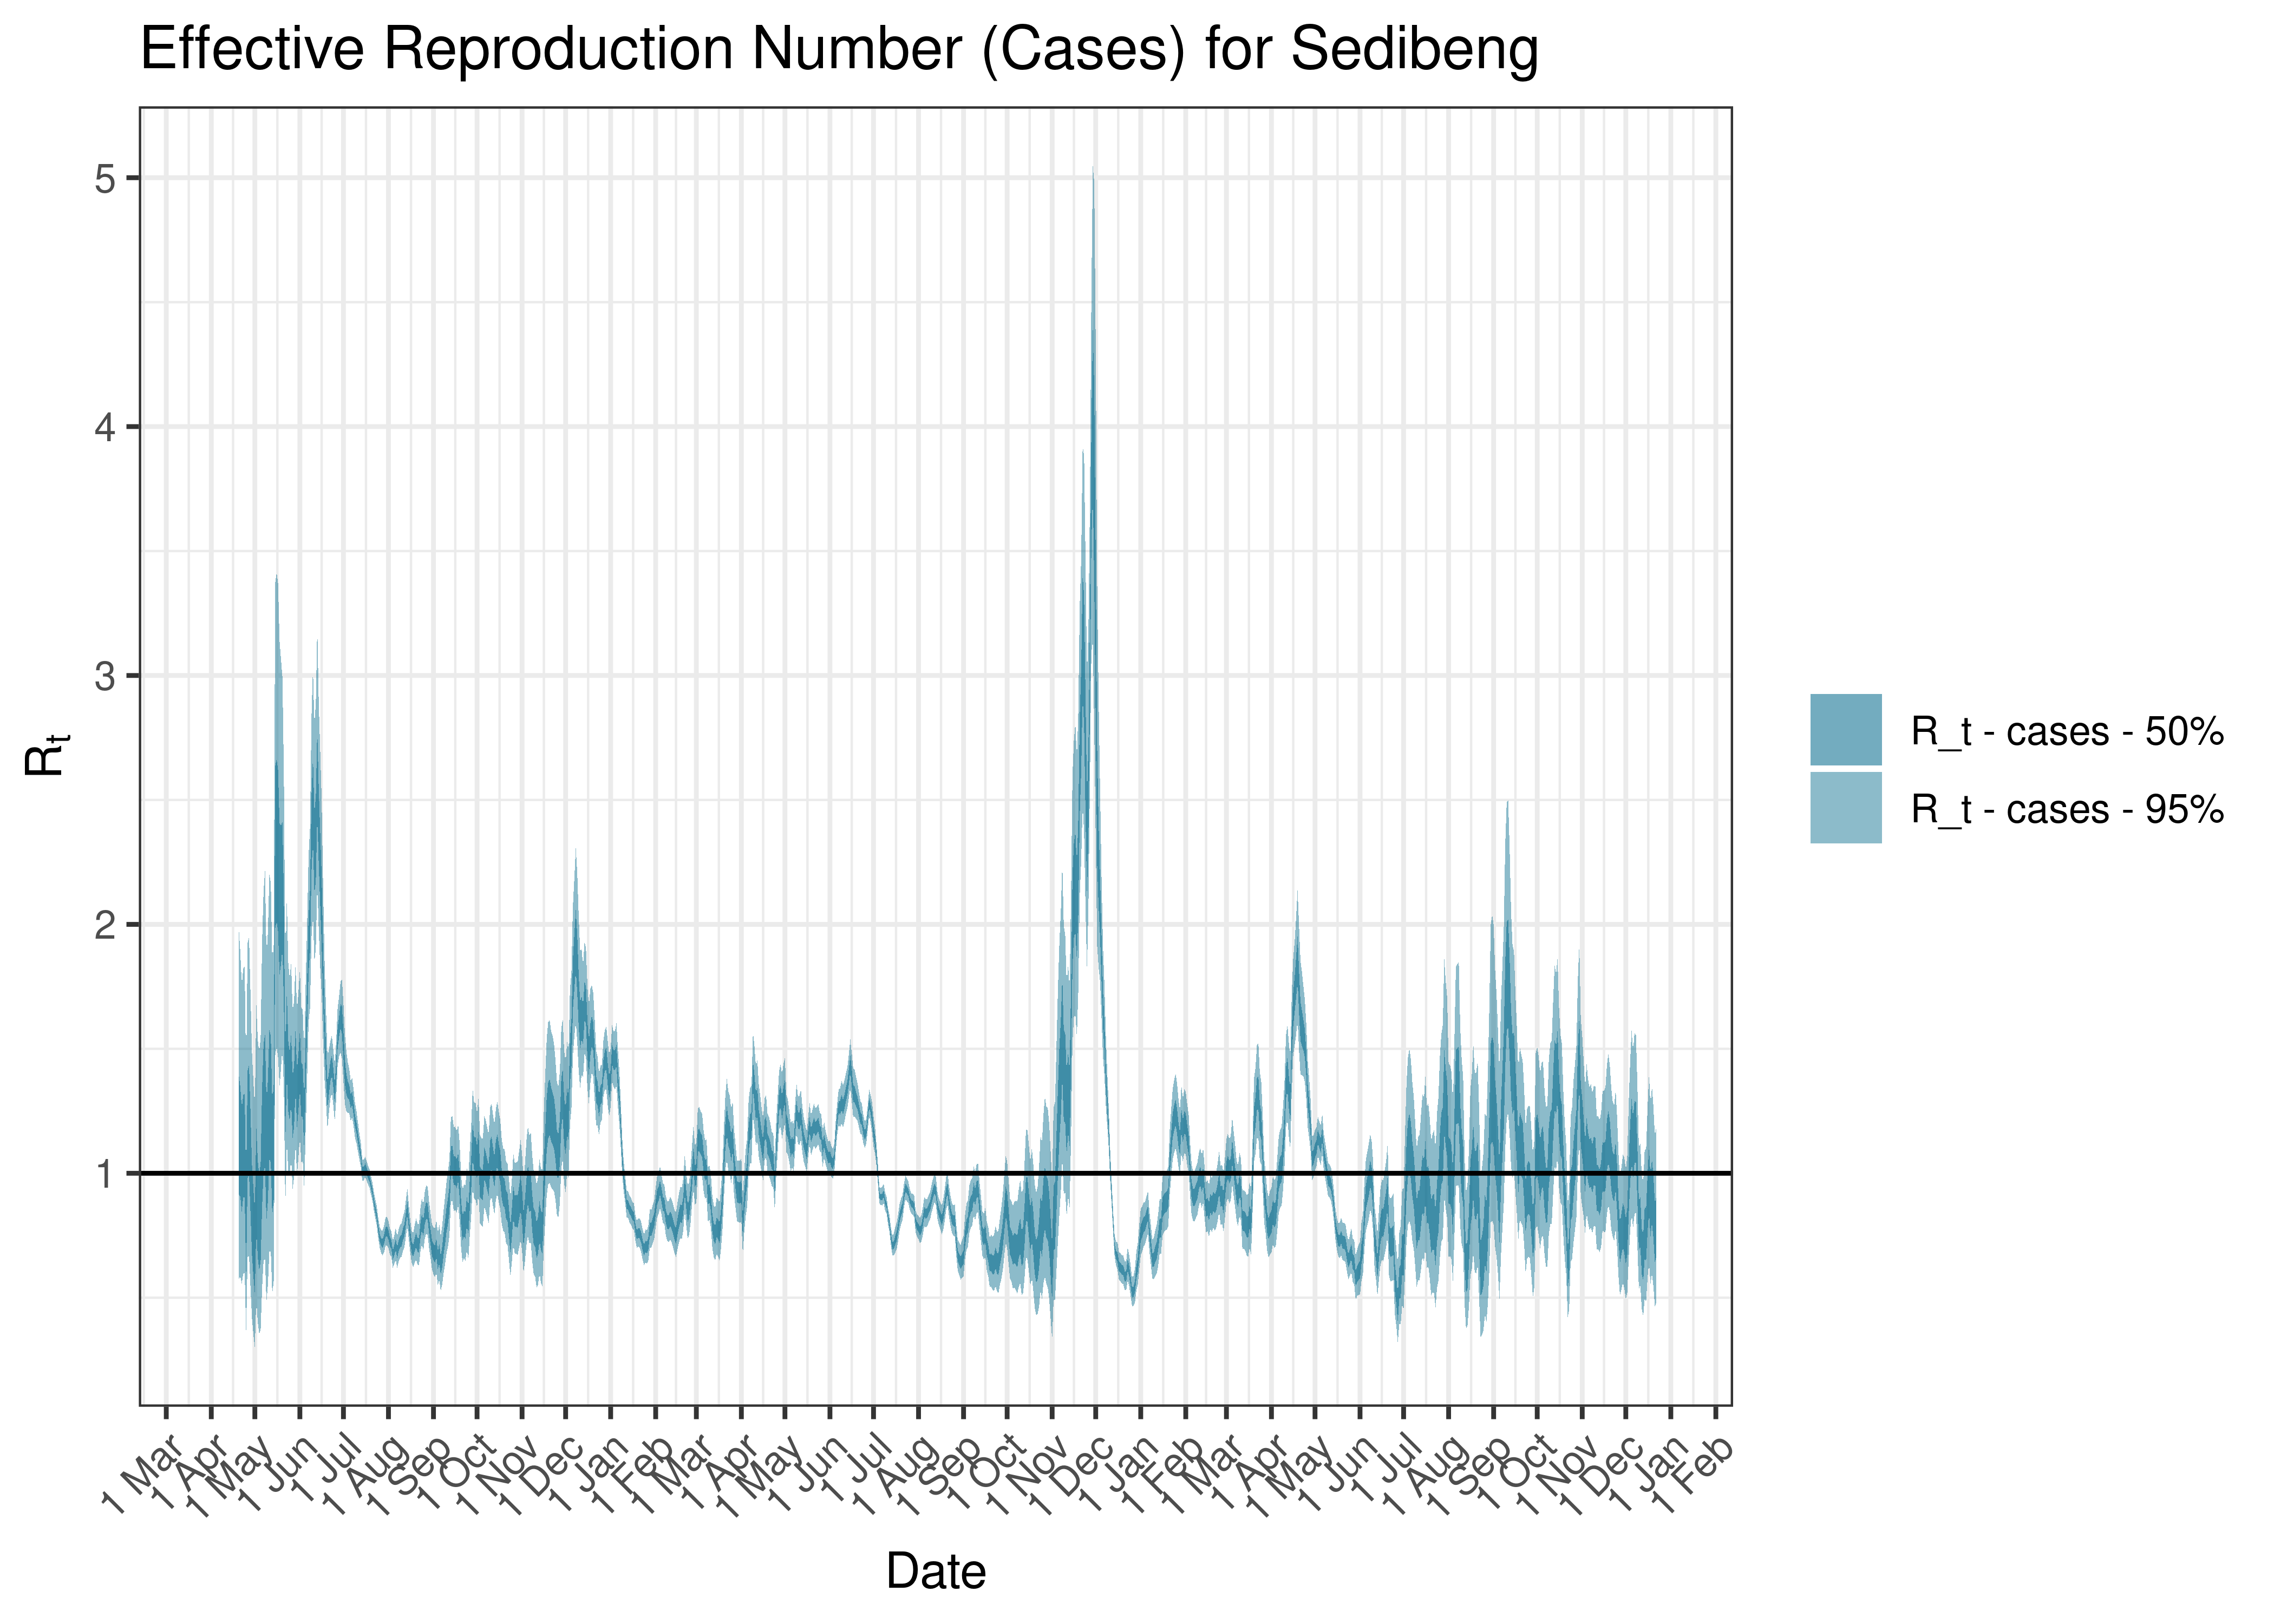
Estimated Effective Reproduction Number Based on Cases for Sedibeng since 1 April 2020
6.4.12 West Rand
6.4.12.1 Cases
Cases are tabulated by specimen received date below. Cases include estimates for late reporting in recent days as well as adjustments for any public holidays. A centred 7-day moving average is also shown. The peak daily cases in previous waves (as measured by the moving average) is also shown.
| Specimen Received Date | Cases | 7-day Moving Average | Comment |
|---|---|---|---|
| 2020-07-10 | 464 | 432 | Wave 1 Peak |
| 2021-01-05 | 459 | 360 | Wave 2 Peak |
| 2021-06-27 | 481 | 854 | Wave 3 Peak |
| 2021-12-09 | 779 | 586 | Wave 4 Peak |
| 2022-05-09 | 210 | 150 | Wave 5 Peak (to date) |
Below a 7-day moving average daily case count are plotted for West Rand on a log scale since start of the epidemic:
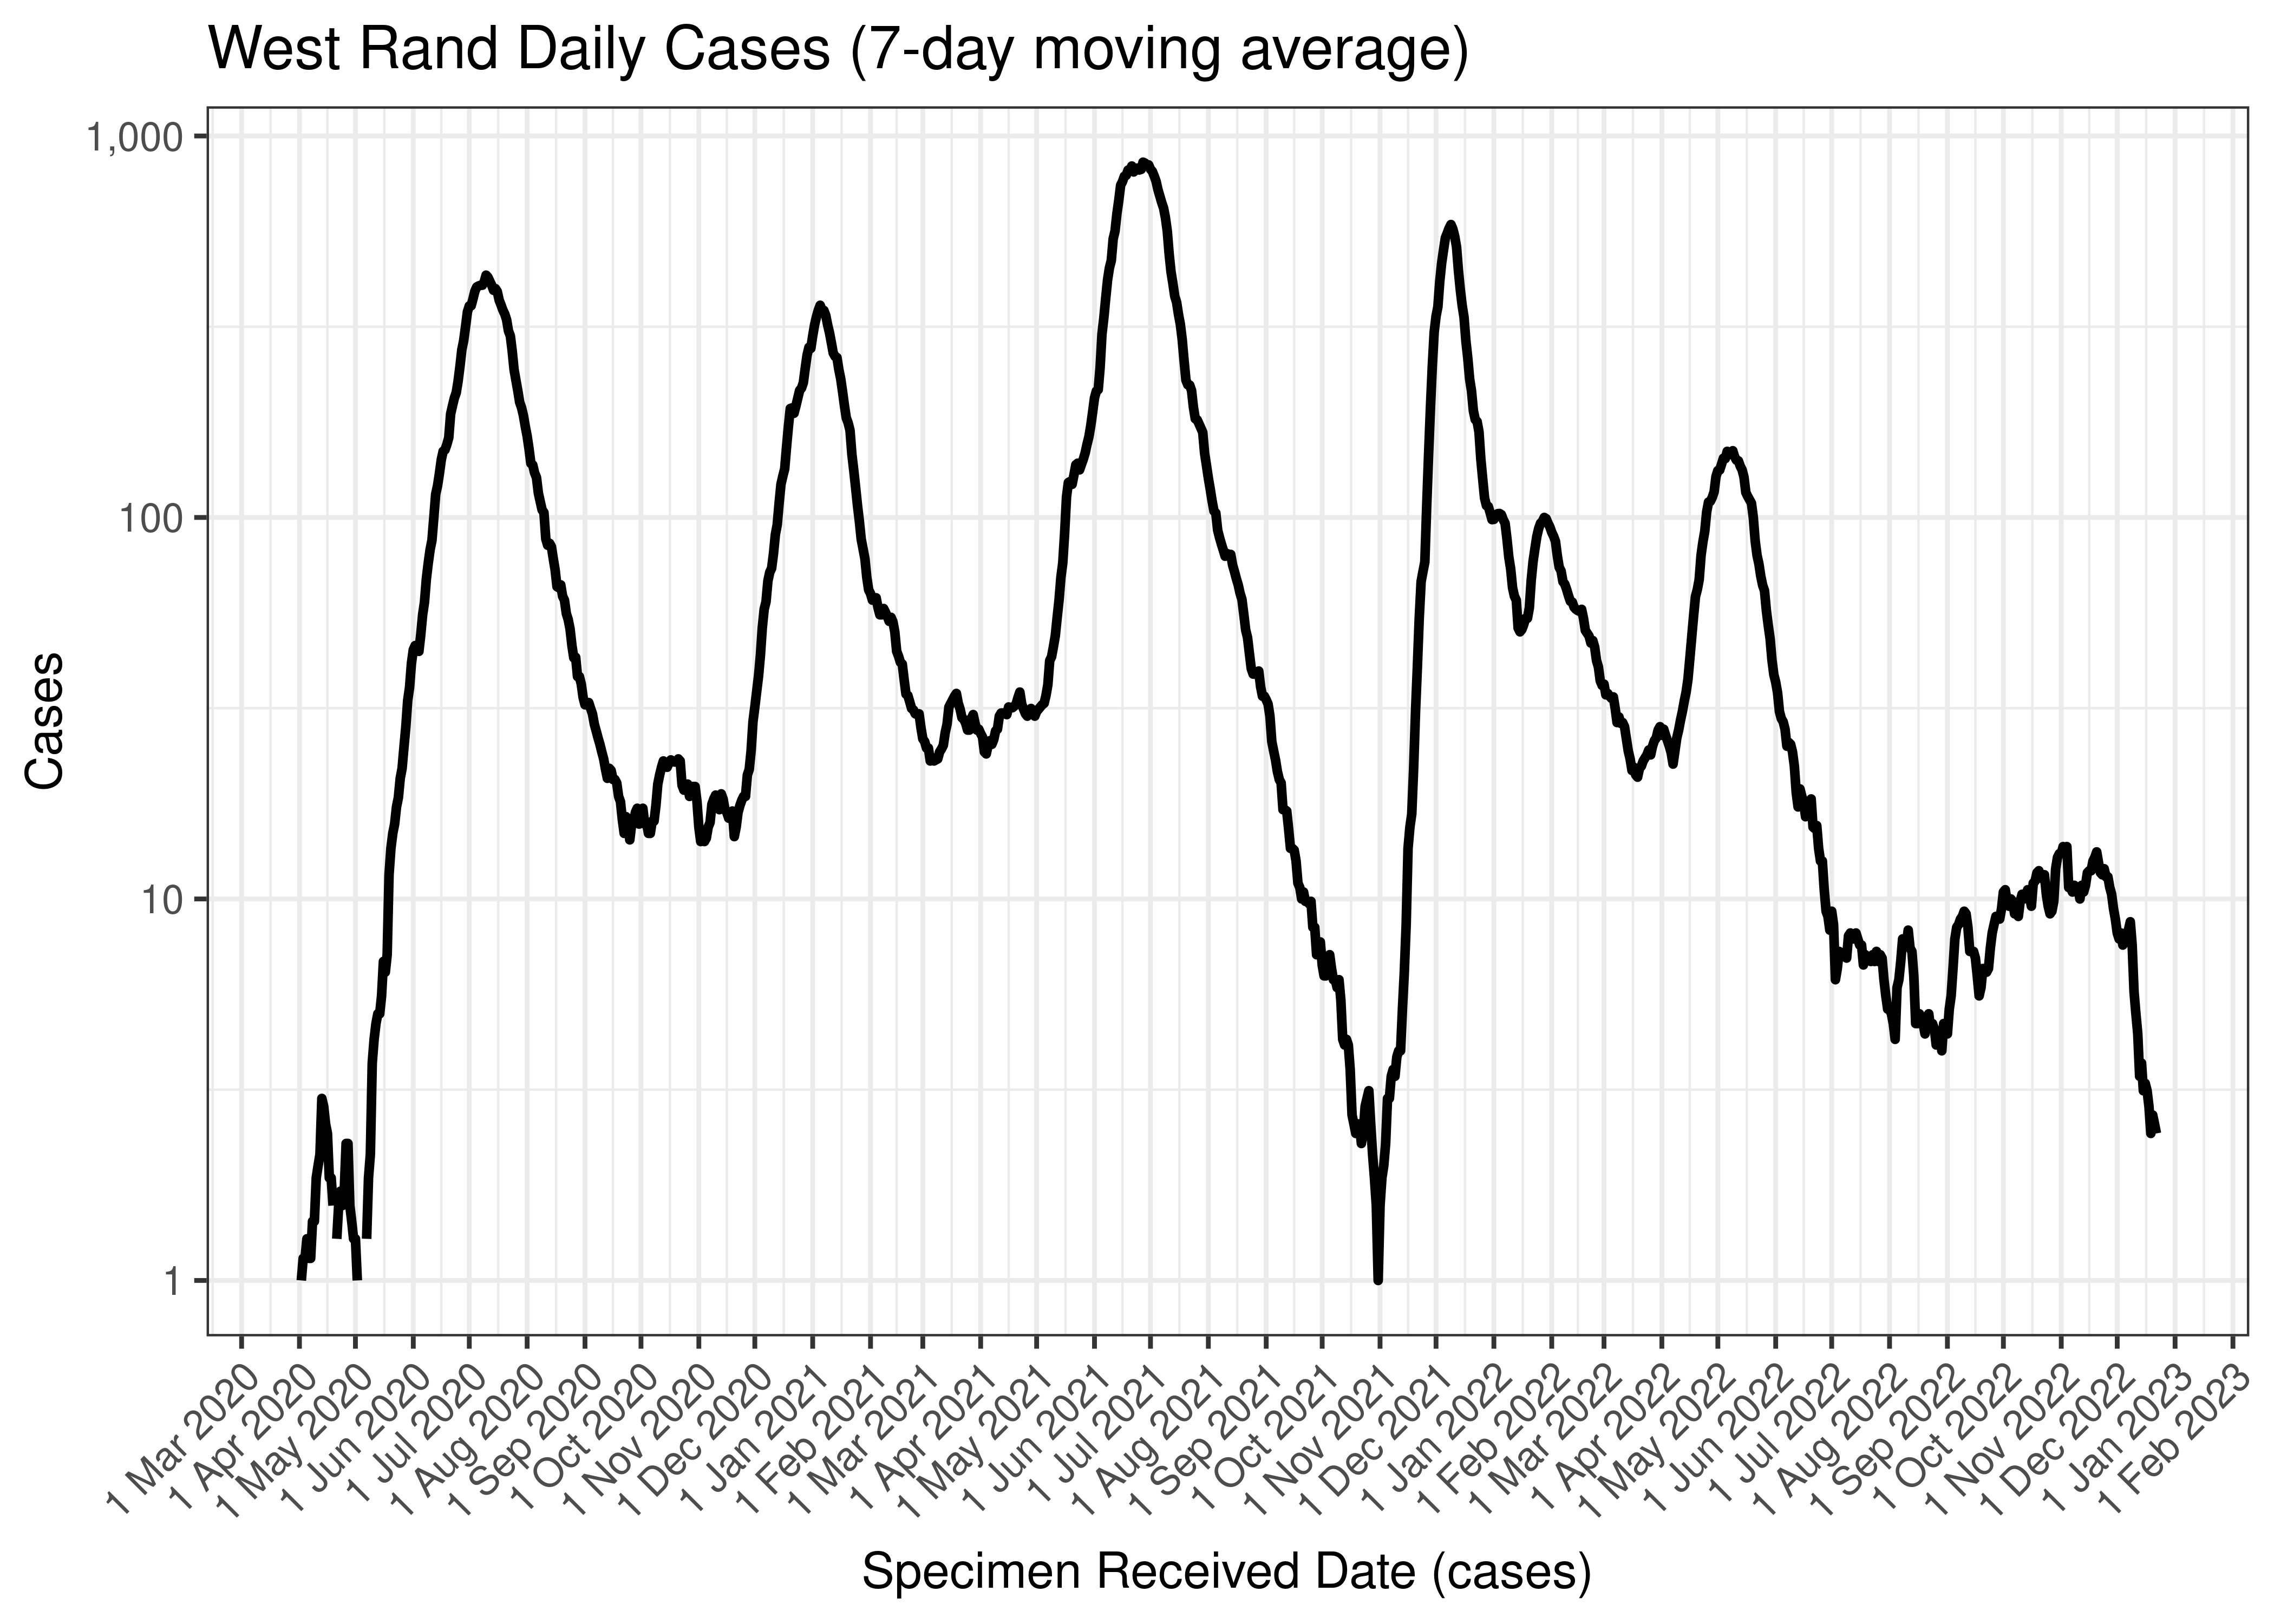
West Rand Daily Cases (7-day moving average)
Below the above chart is repeated for the last 30-days:

West Rand Daily Cases for Last 30-days (7-day moving average)
6.4.12.2 Reproduction Number
Below current (last weekly) reproduction number estimates are tabulated for West Rand.
| Count (Per Day) | Week Ending | Reproduction Number [95% Confidence Interval] | |
|---|---|---|---|
| West Rand | 2.4 | 2022-12-25 | 0.82 [0.48 - 1.25] |
Below the effective reproduction number for West Rand over the last 90 days are plotted together with a plot since start of the pandemic.
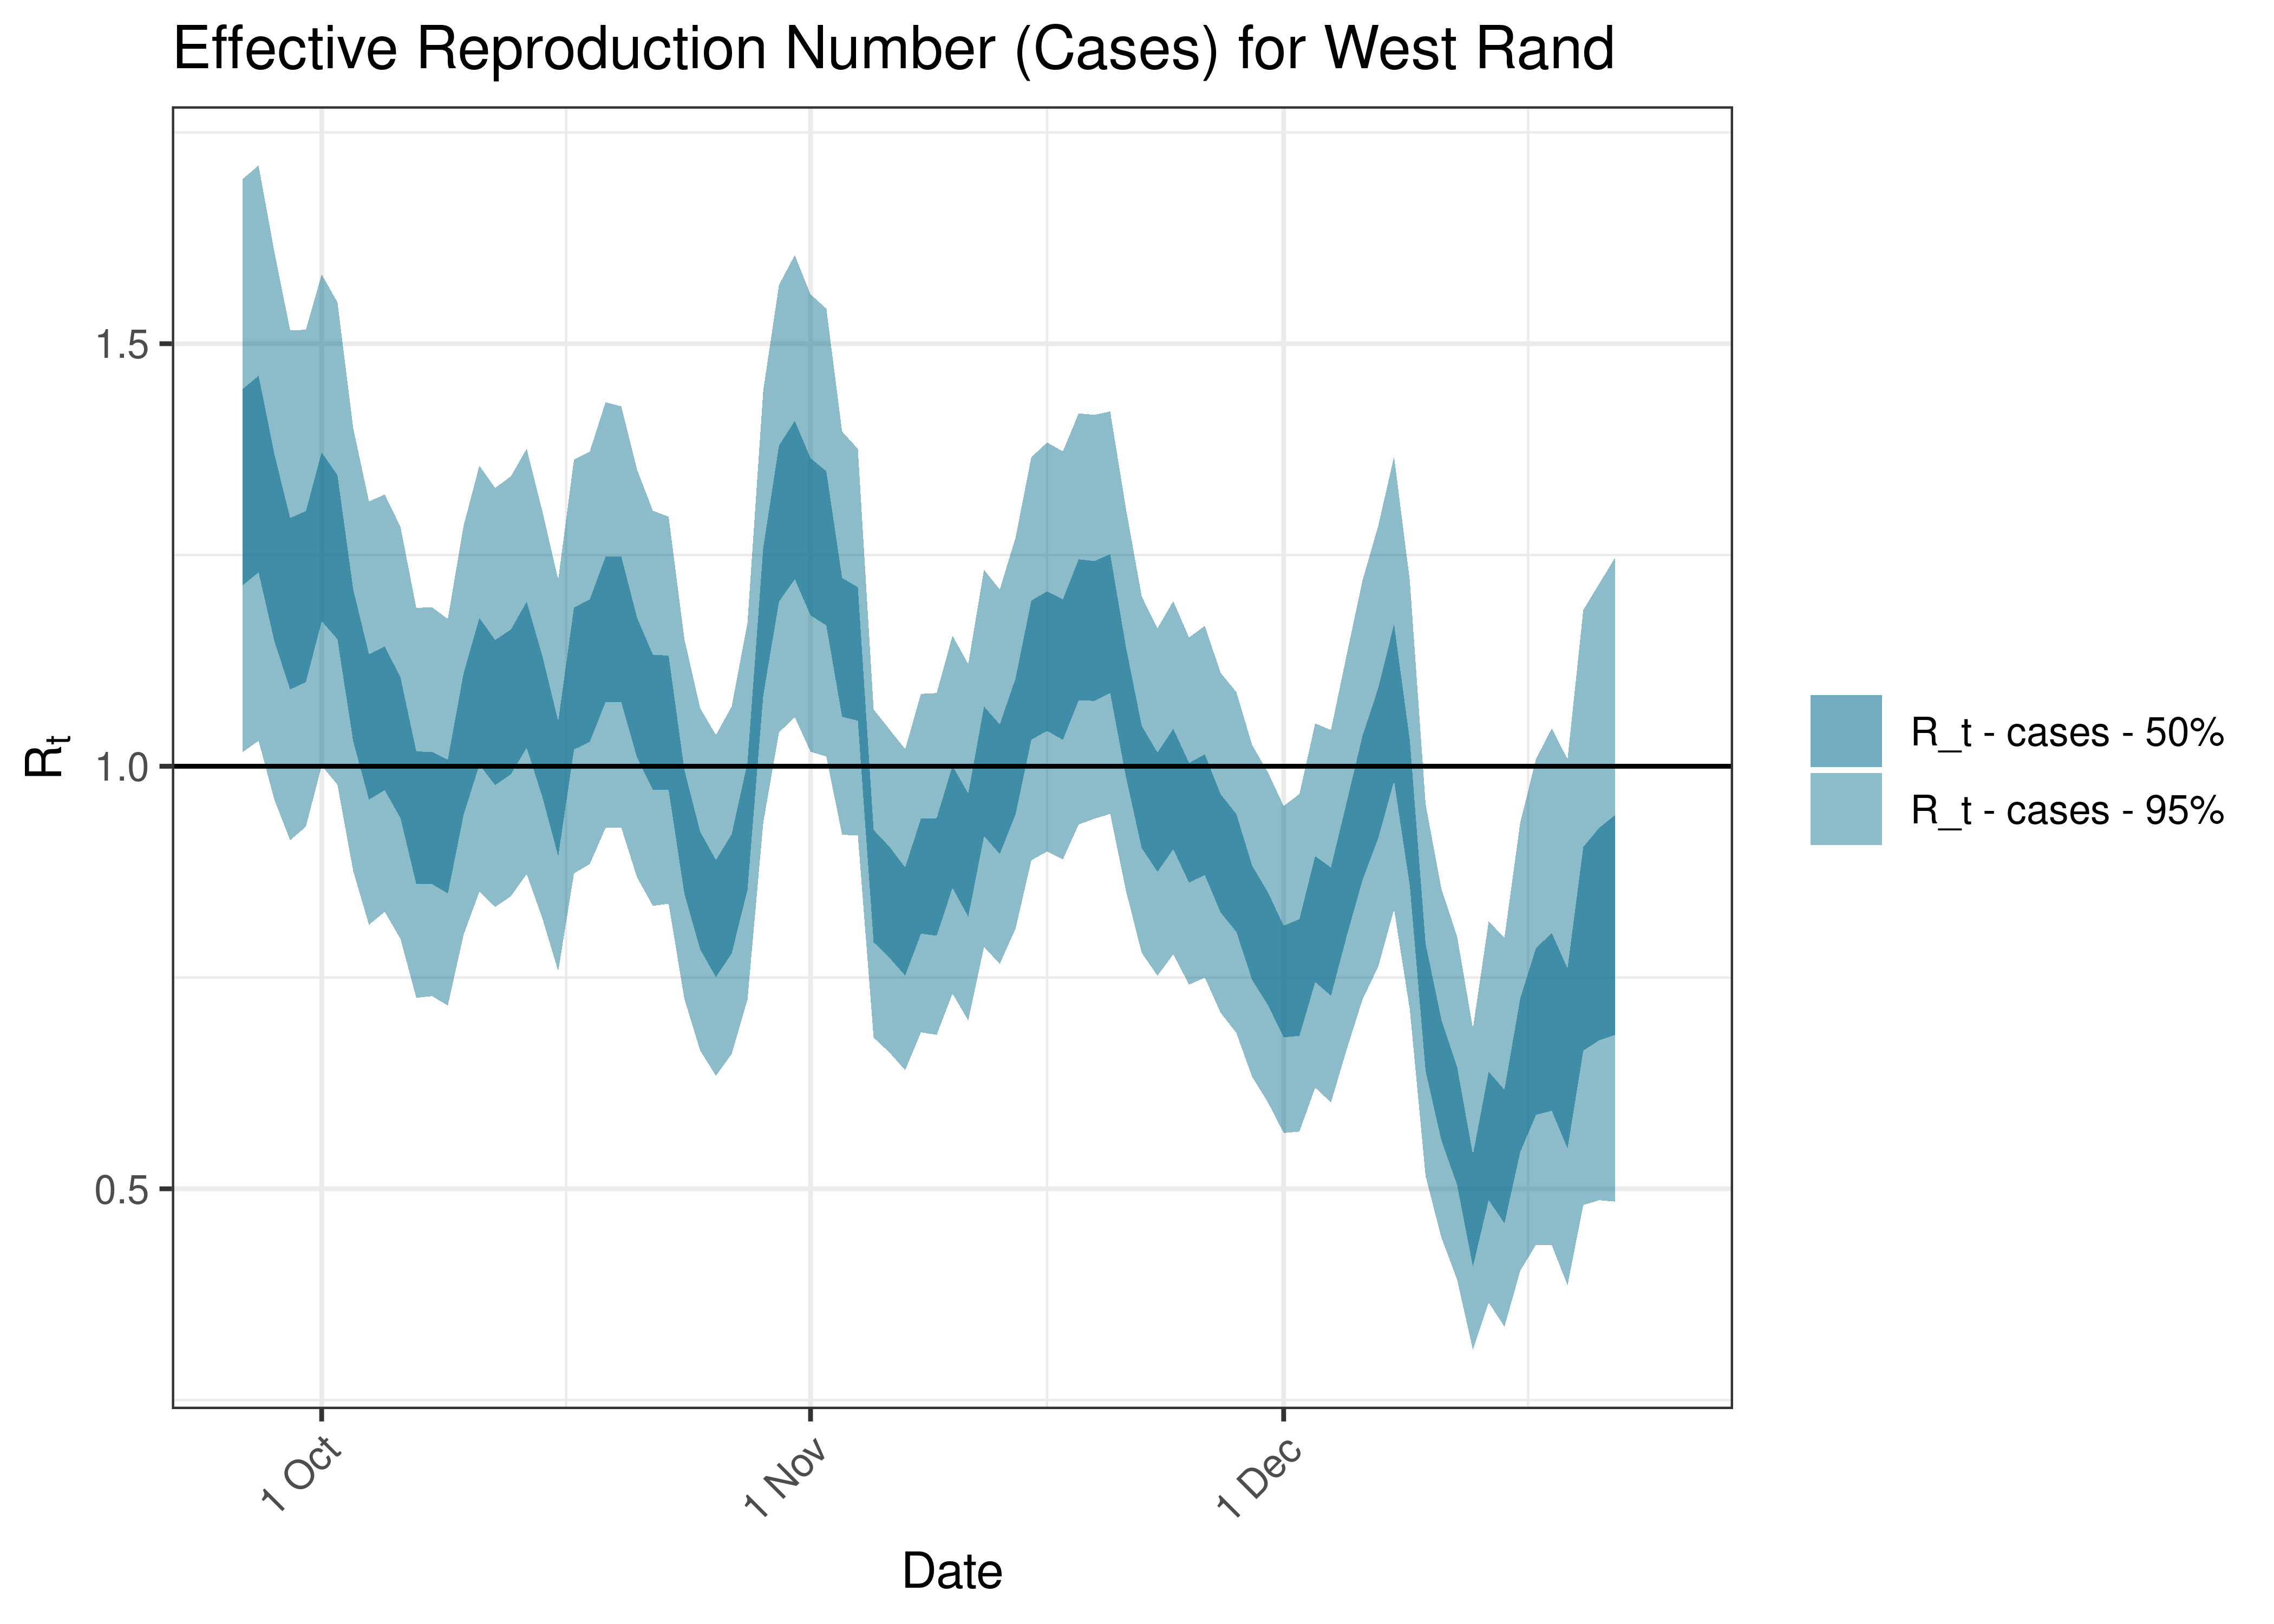
Estimated Effective Reproduction Number Based on Cases for West Rand over last 90 days
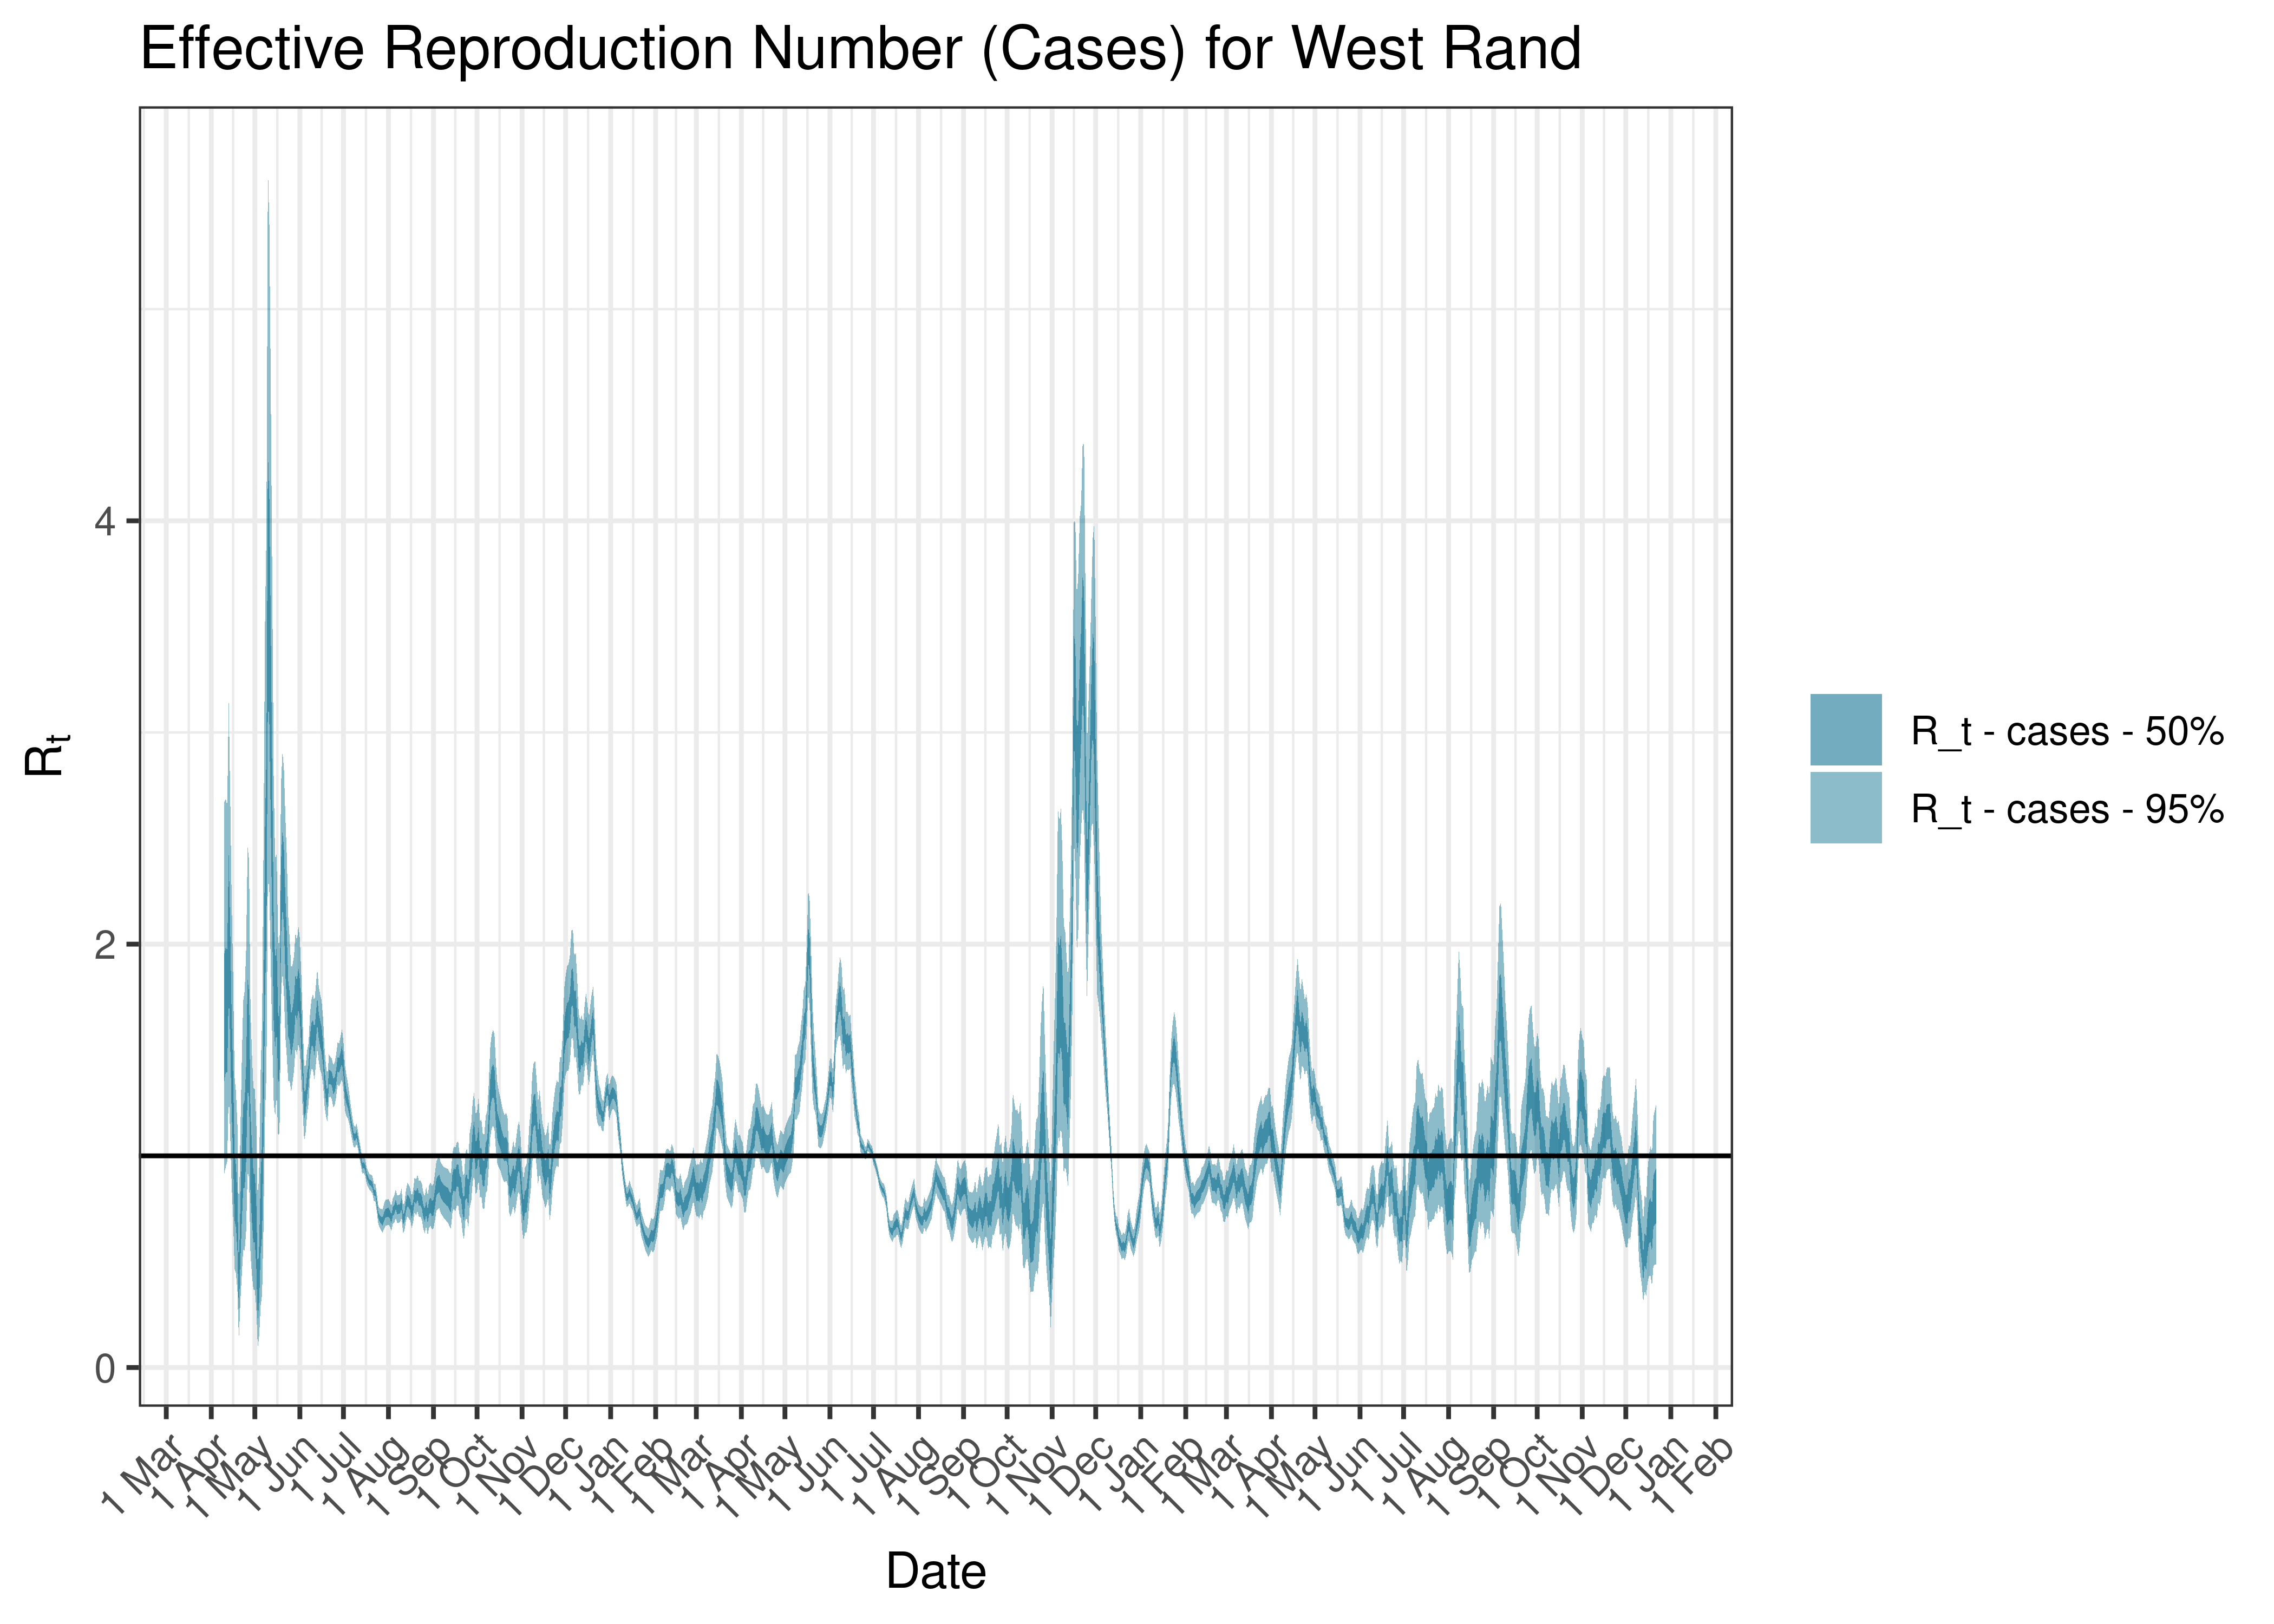
Estimated Effective Reproduction Number Based on Cases for West Rand since 1 April 2020
6.5 KwaZulu-Natal
6.5.1 Cases
Cases are tabulated by specimen received date below. Cases include estimates for late reporting in recent days as well as adjustments for any public holidays. A centred 7-day moving average is also shown. The peak daily cases in previous waves (as measured by the moving average) is also shown.
| Specimen Received Date | Cases | 7-day Moving Average | Comment |
|---|---|---|---|
| 2020-07-20 | 3,505 | 2,917 | Wave 1 Peak |
| 2021-01-02 | 4,331 | 5,643 | Wave 2 Peak |
| 2021-08-19 | 4,259 | 3,472 | Wave 3 Peak |
| 2021-12-14 | 6,184 | 4,936 | Wave 4 Peak |
| 2022-05-04 | 2,436 | 1,892 | Wave 5 Peak (to date) |
Below a 7-day moving average daily case count is plotted for KwaZulu-Natal on a log scale since start of the epidemic:
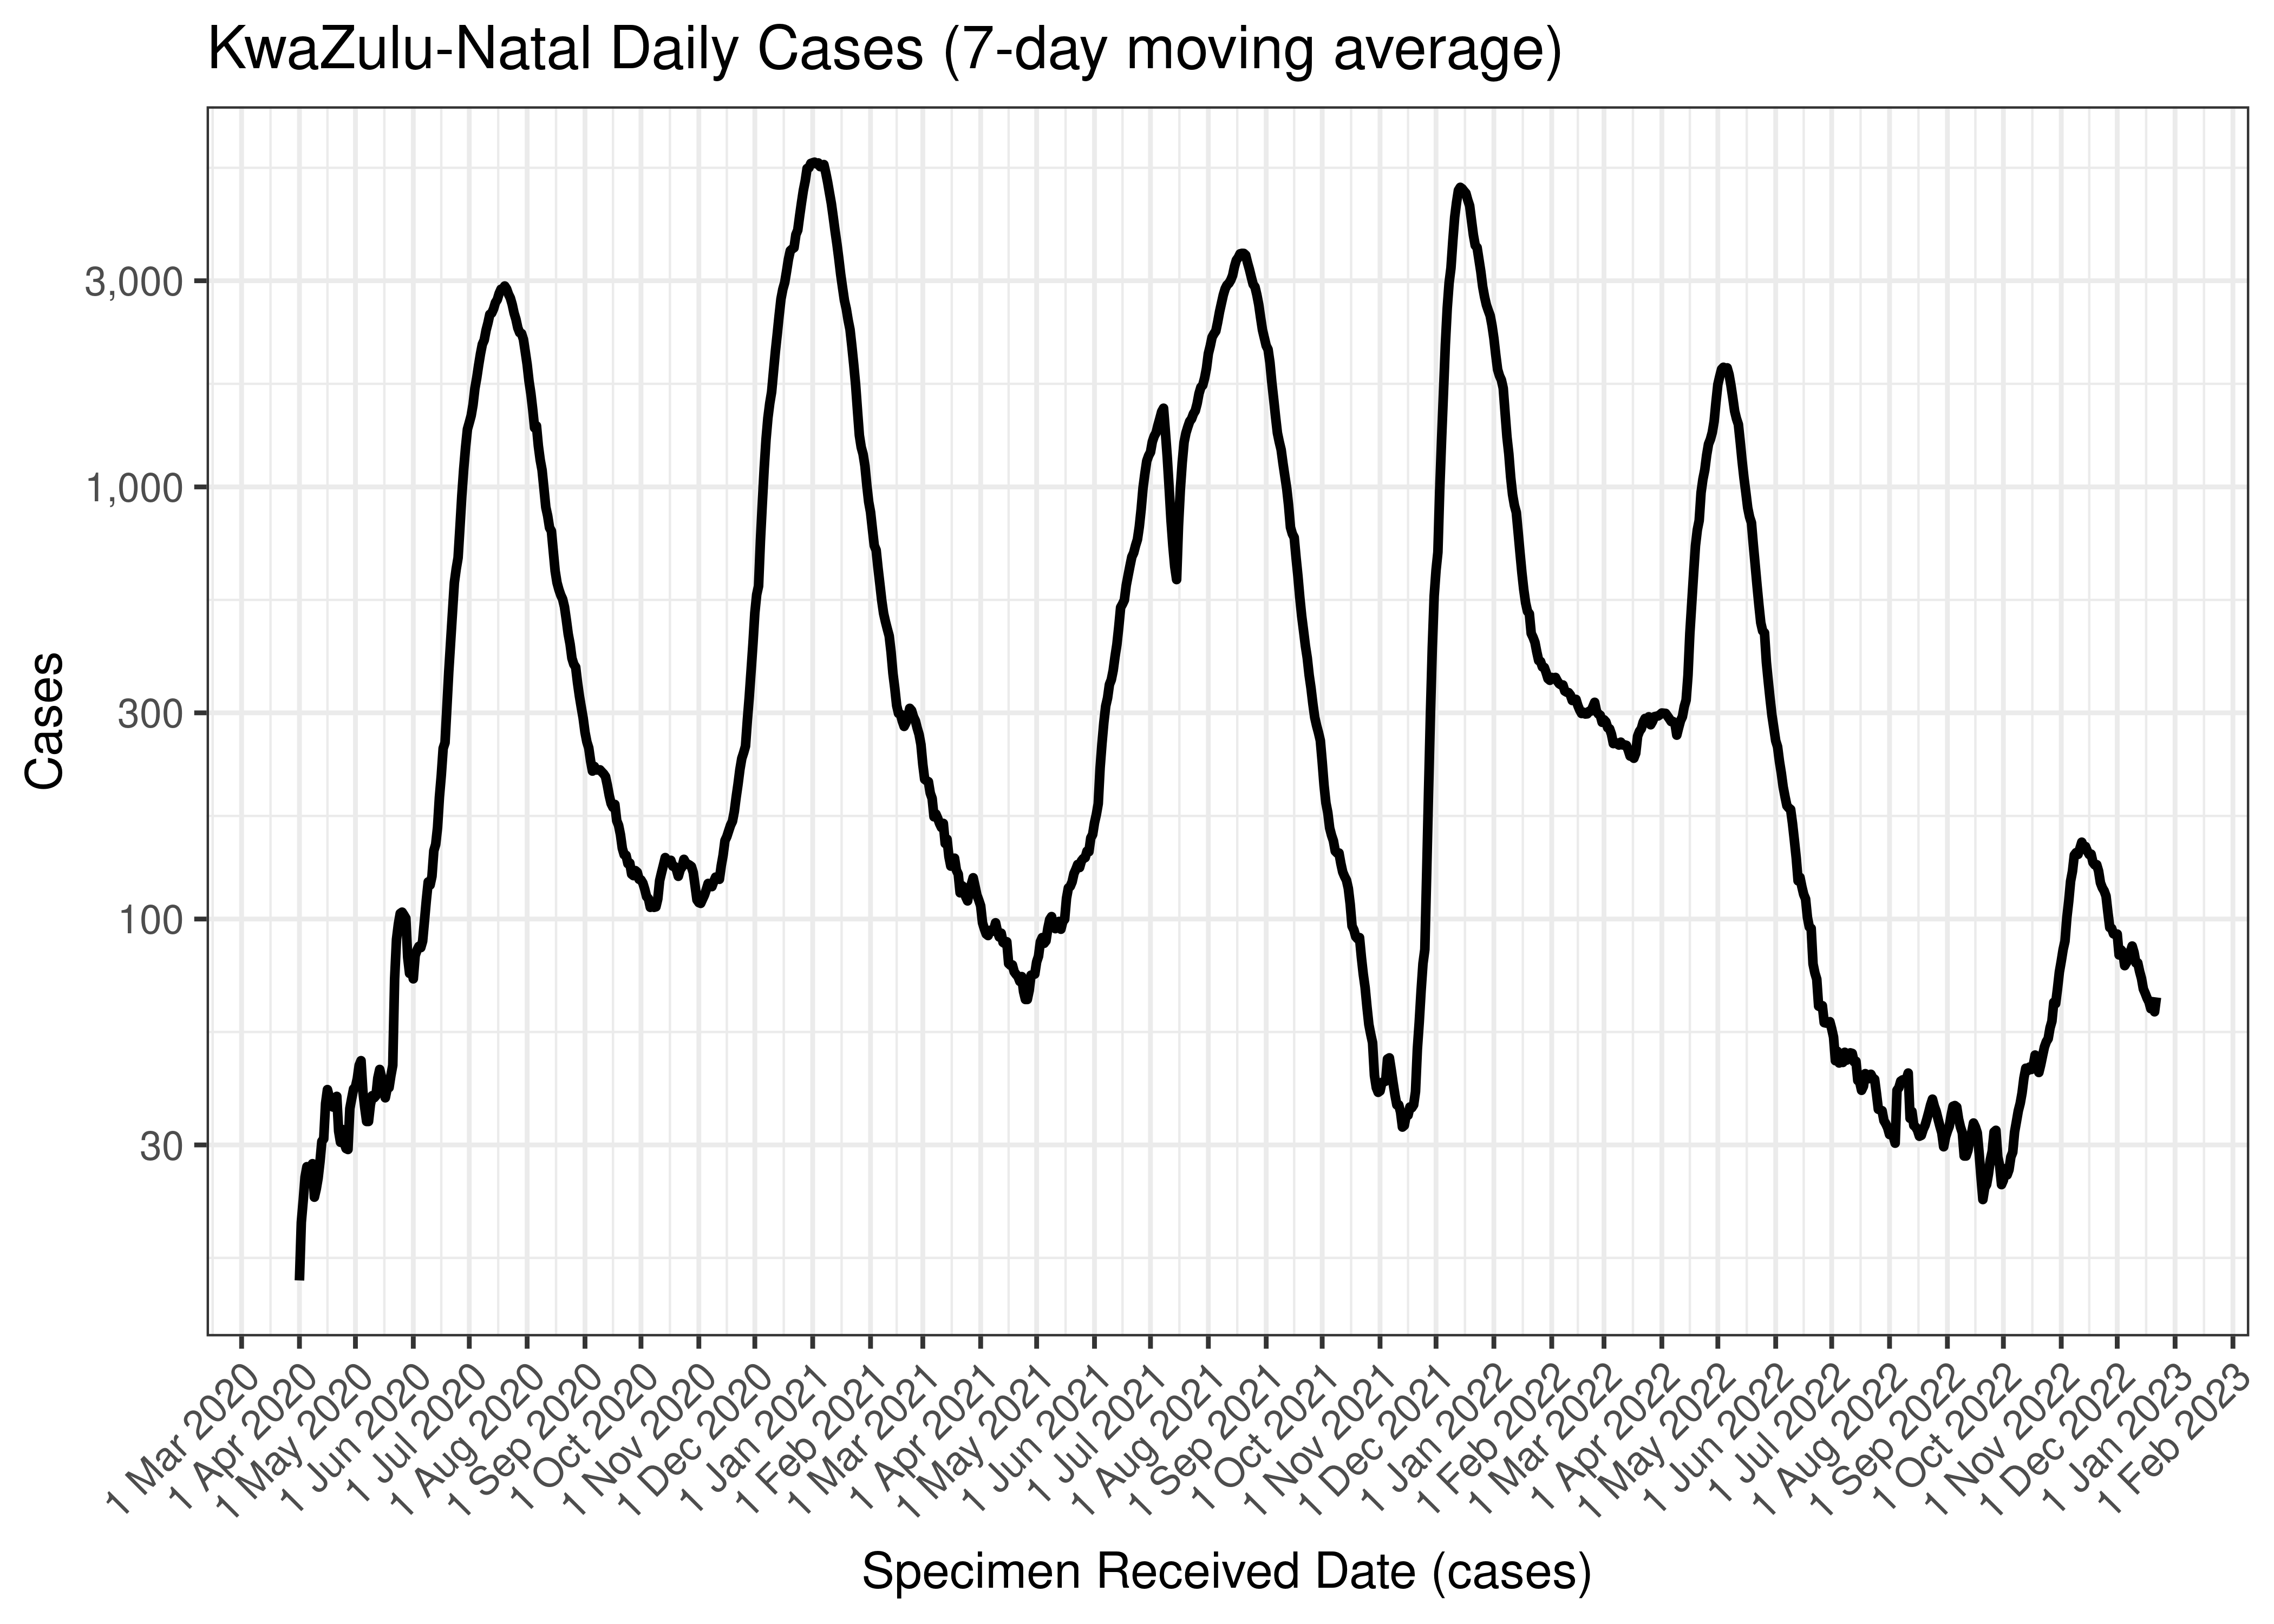
KwaZulu-Natal Daily Cases (7-day moving average)
Below the above chart is repeated for the last 30-days:

KwaZulu-Natal Daily Cases for Last 30-days (7-day moving average)
Below a 7-day moving average daily case count is plotted for KwaZulu-Natal by district municipality on a log scale since start of the epidemic:
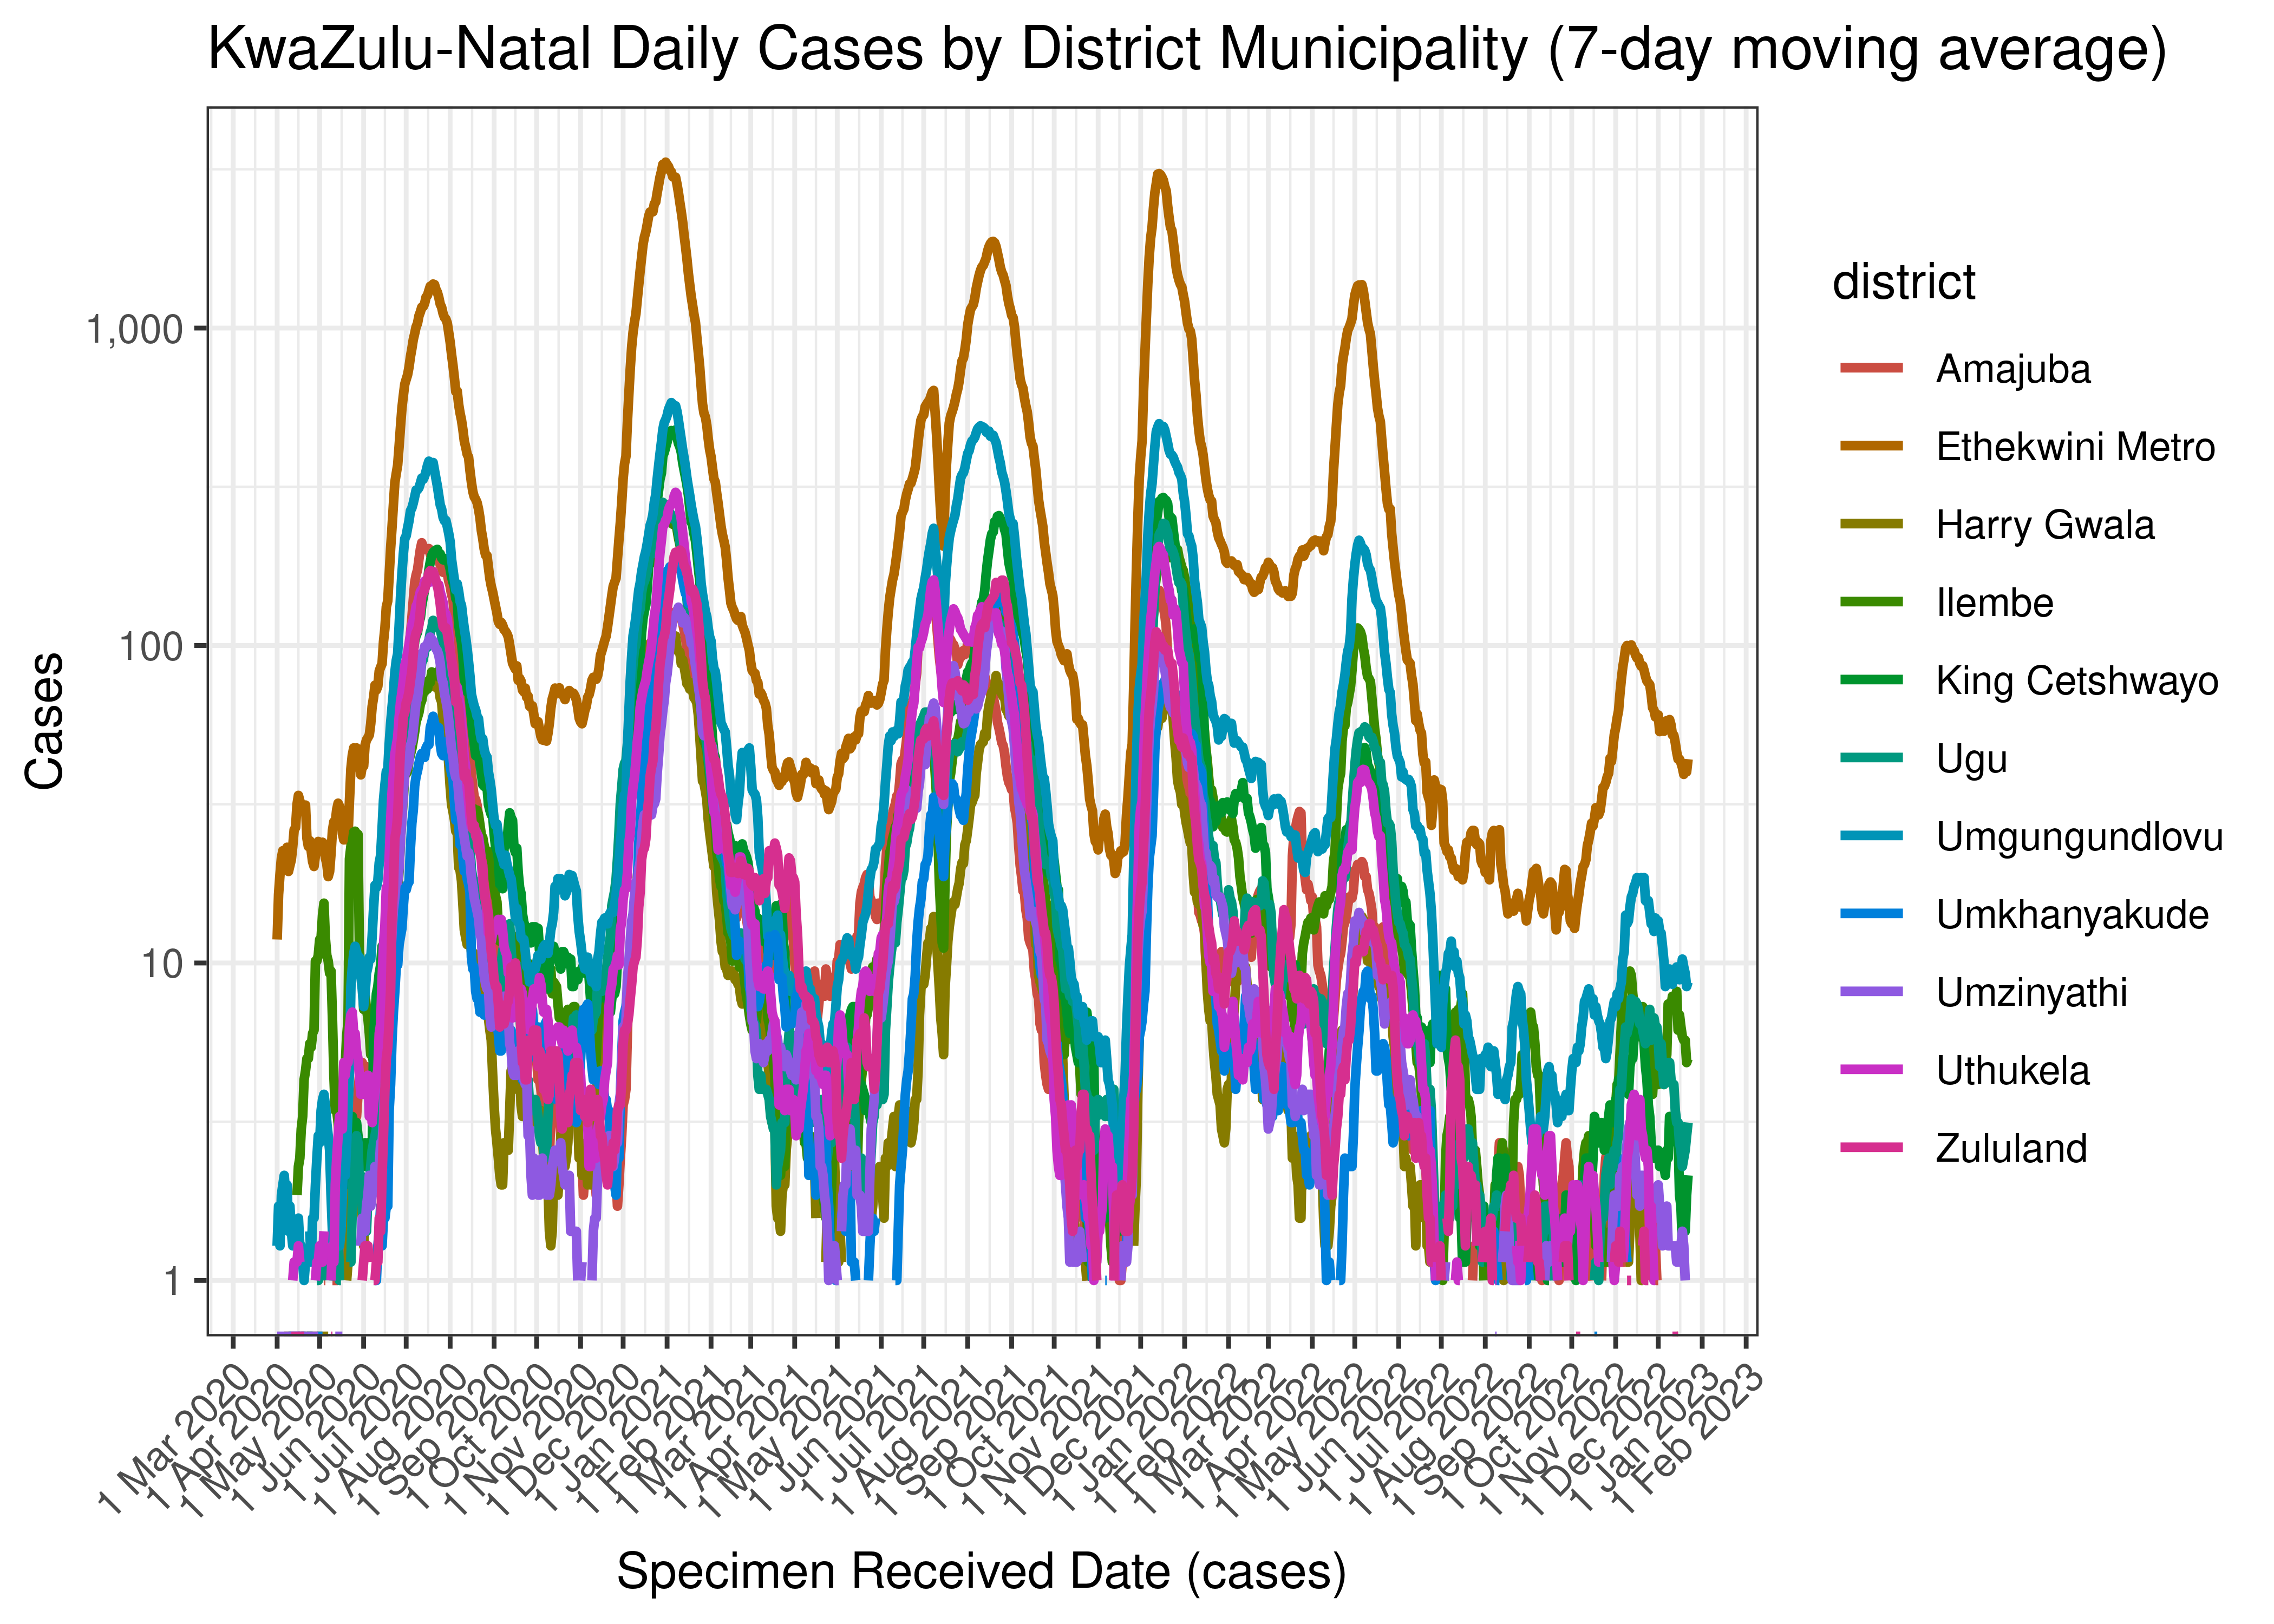
KwaZulu-Natal Daily Cases by District Municipality (7-day moving average)
Below the above chart is repeated for the last 30-days:
KwaZulu-Natal Daily Cases for Last 30-days by District Municipality (7-day moving average)
6.5.2 Hospital Admissions
Hospital admissions are tabulated by reported date below. The peak daily admissions in previous waves (as measured by the moving average) is also shown.
| Reported Date | Hospital Admissions | 7-day Moving Average | Comment |
|---|---|---|---|
| 2020-07-30 | 181 | 281 | Wave 1 Peak |
| 2021-01-26 | 572 | 655 | Wave 2 Peak |
| 2021-08-15 | 43 | 299 | Wave 3 Peak |
| 2022-01-07 | 247 | 284 | Wave 4 Peak |
| 2022-05-14 | 48 | 106 | Wave 5 Peak (to date) |
| 2022-12-16 | 0 | 11 | |
| 2022-12-17 | 6 | 10 | |
| 2022-12-18 | 5 | 8 | |
| 2022-12-19 | 4 | 8 | |
| 2022-12-20 | 18 | 9 | |
| 2022-12-21 | 10 | NA | |
| 2022-12-22 | 13 | NA | |
| 2022-12-23 | 6 | NA |
Below a 7-day moving average daily hospital admissions count is plotted for KwaZulu-Natal on a log scale since start of the epidemic:
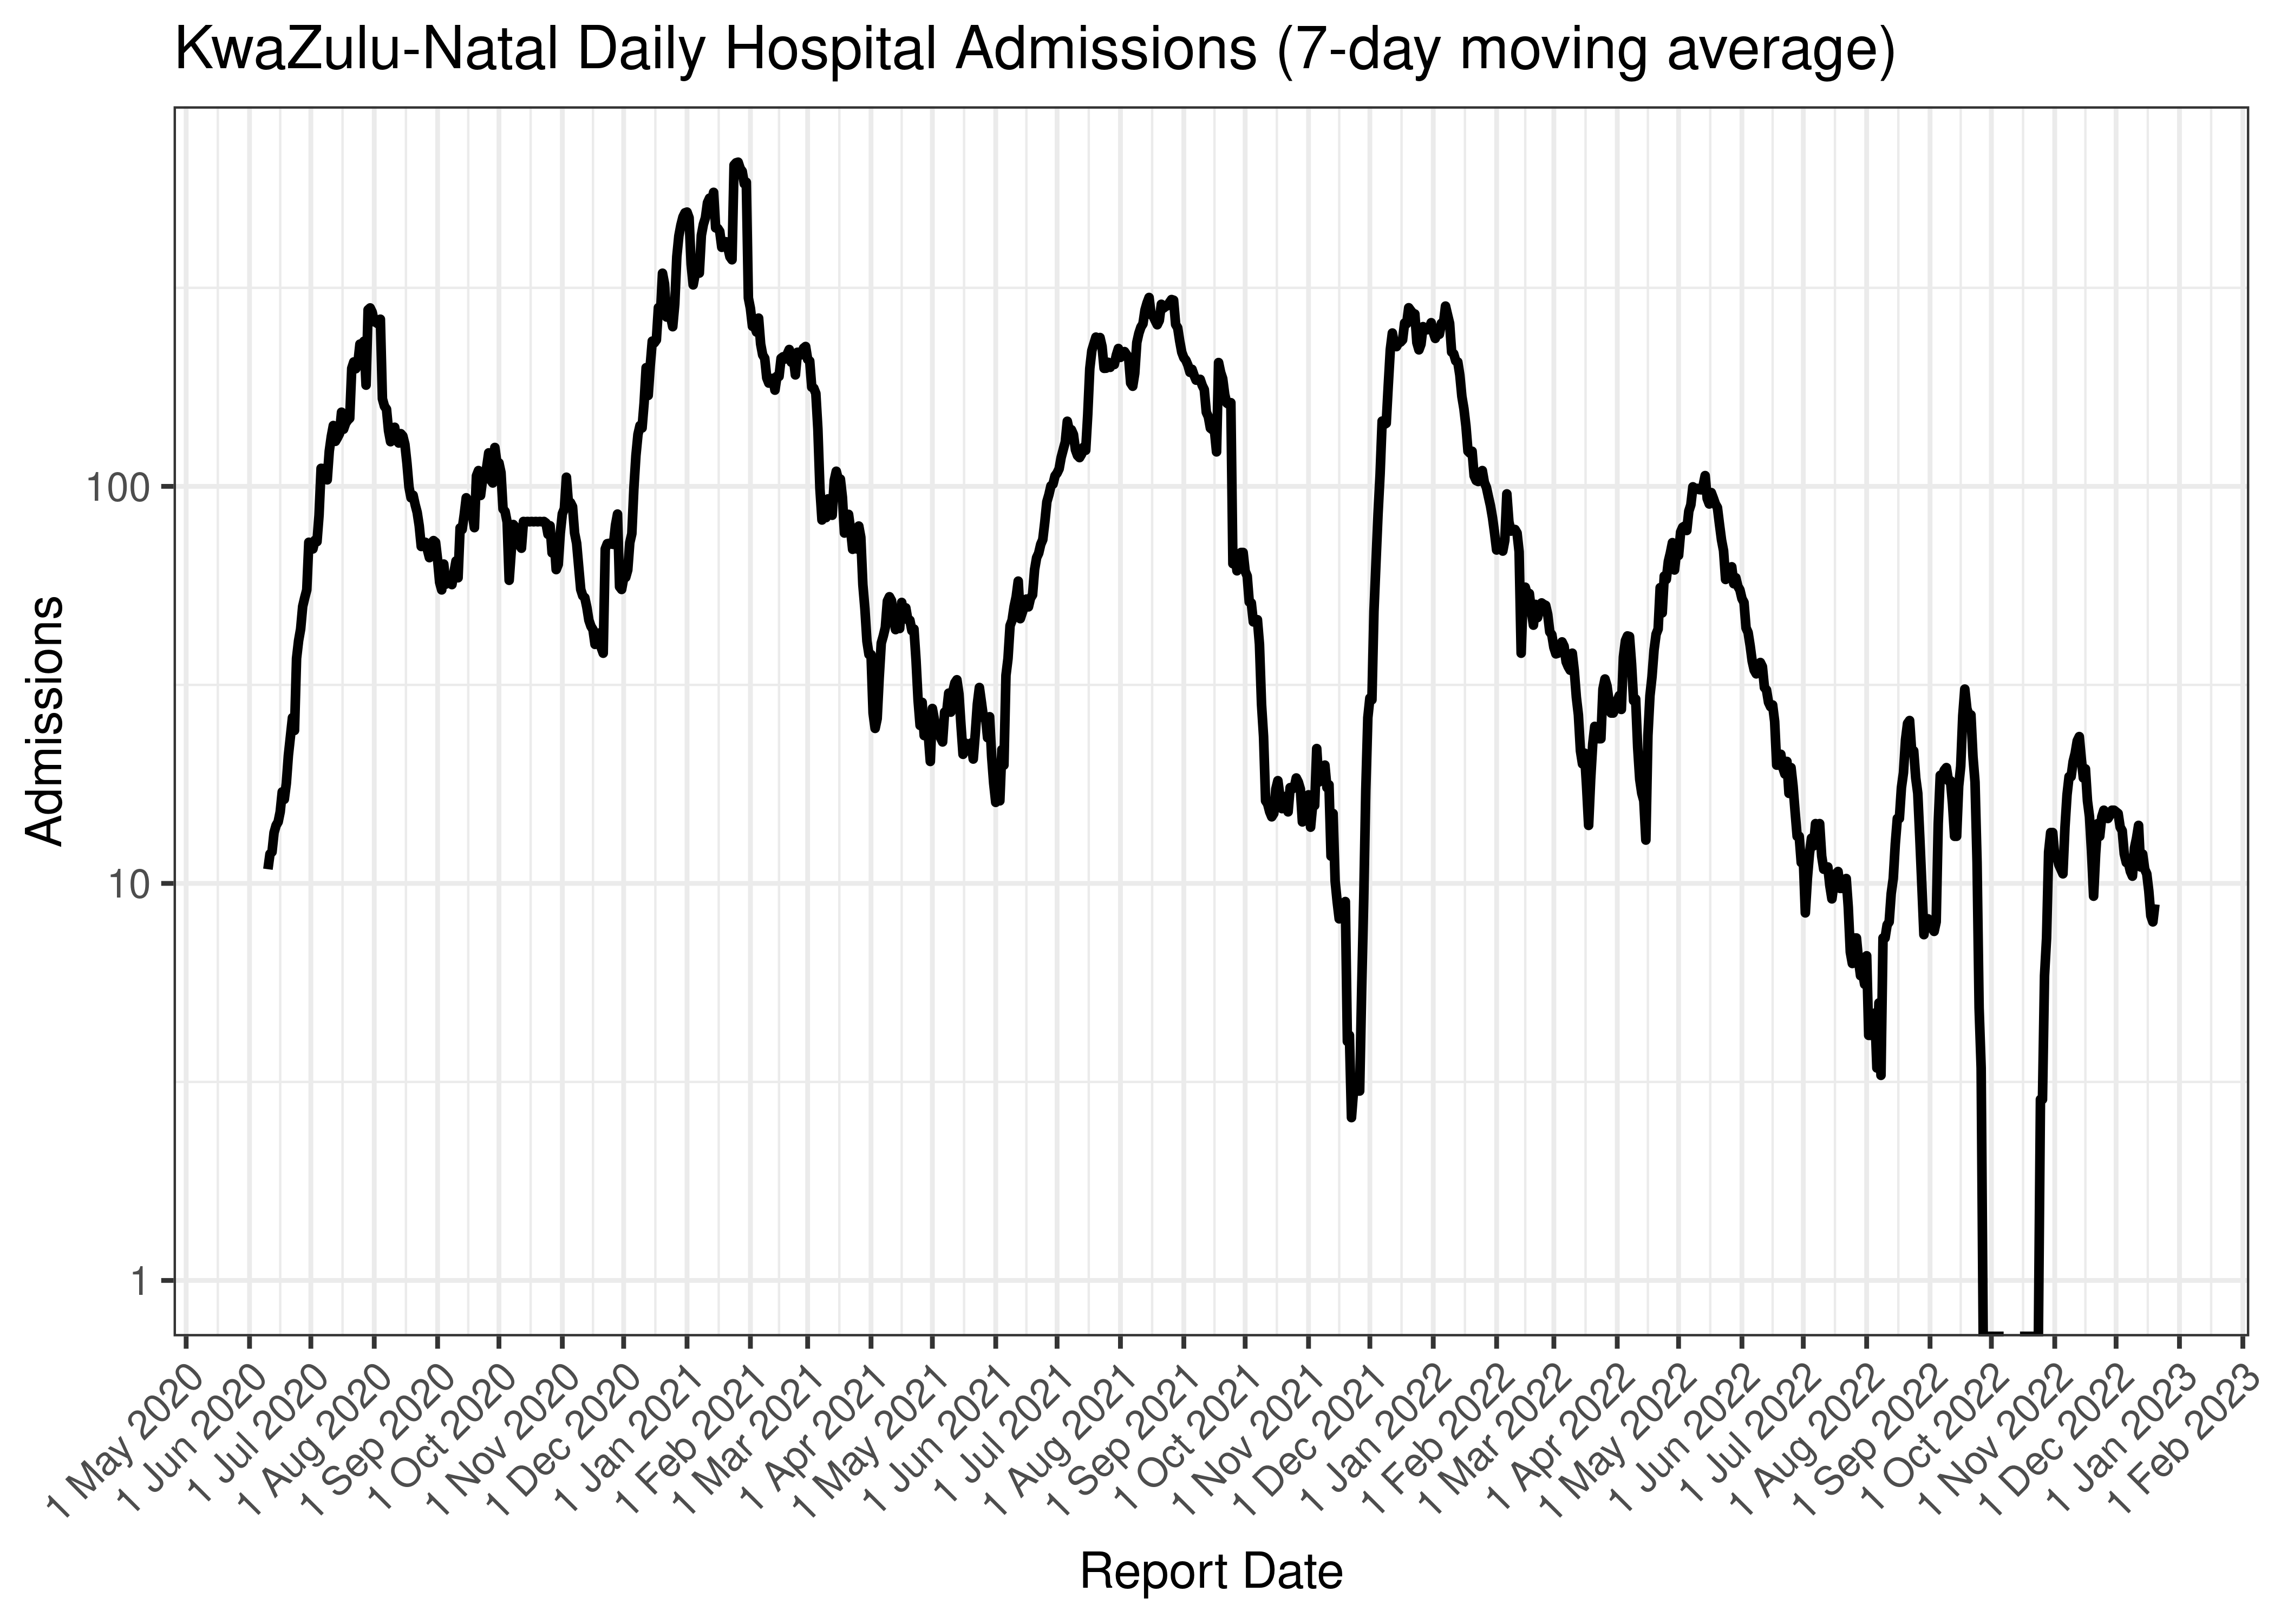
KwaZulu-Natal Daily Hospital Admissions (7-day moving average)
Below the above chart is repeated for the last 30-days:
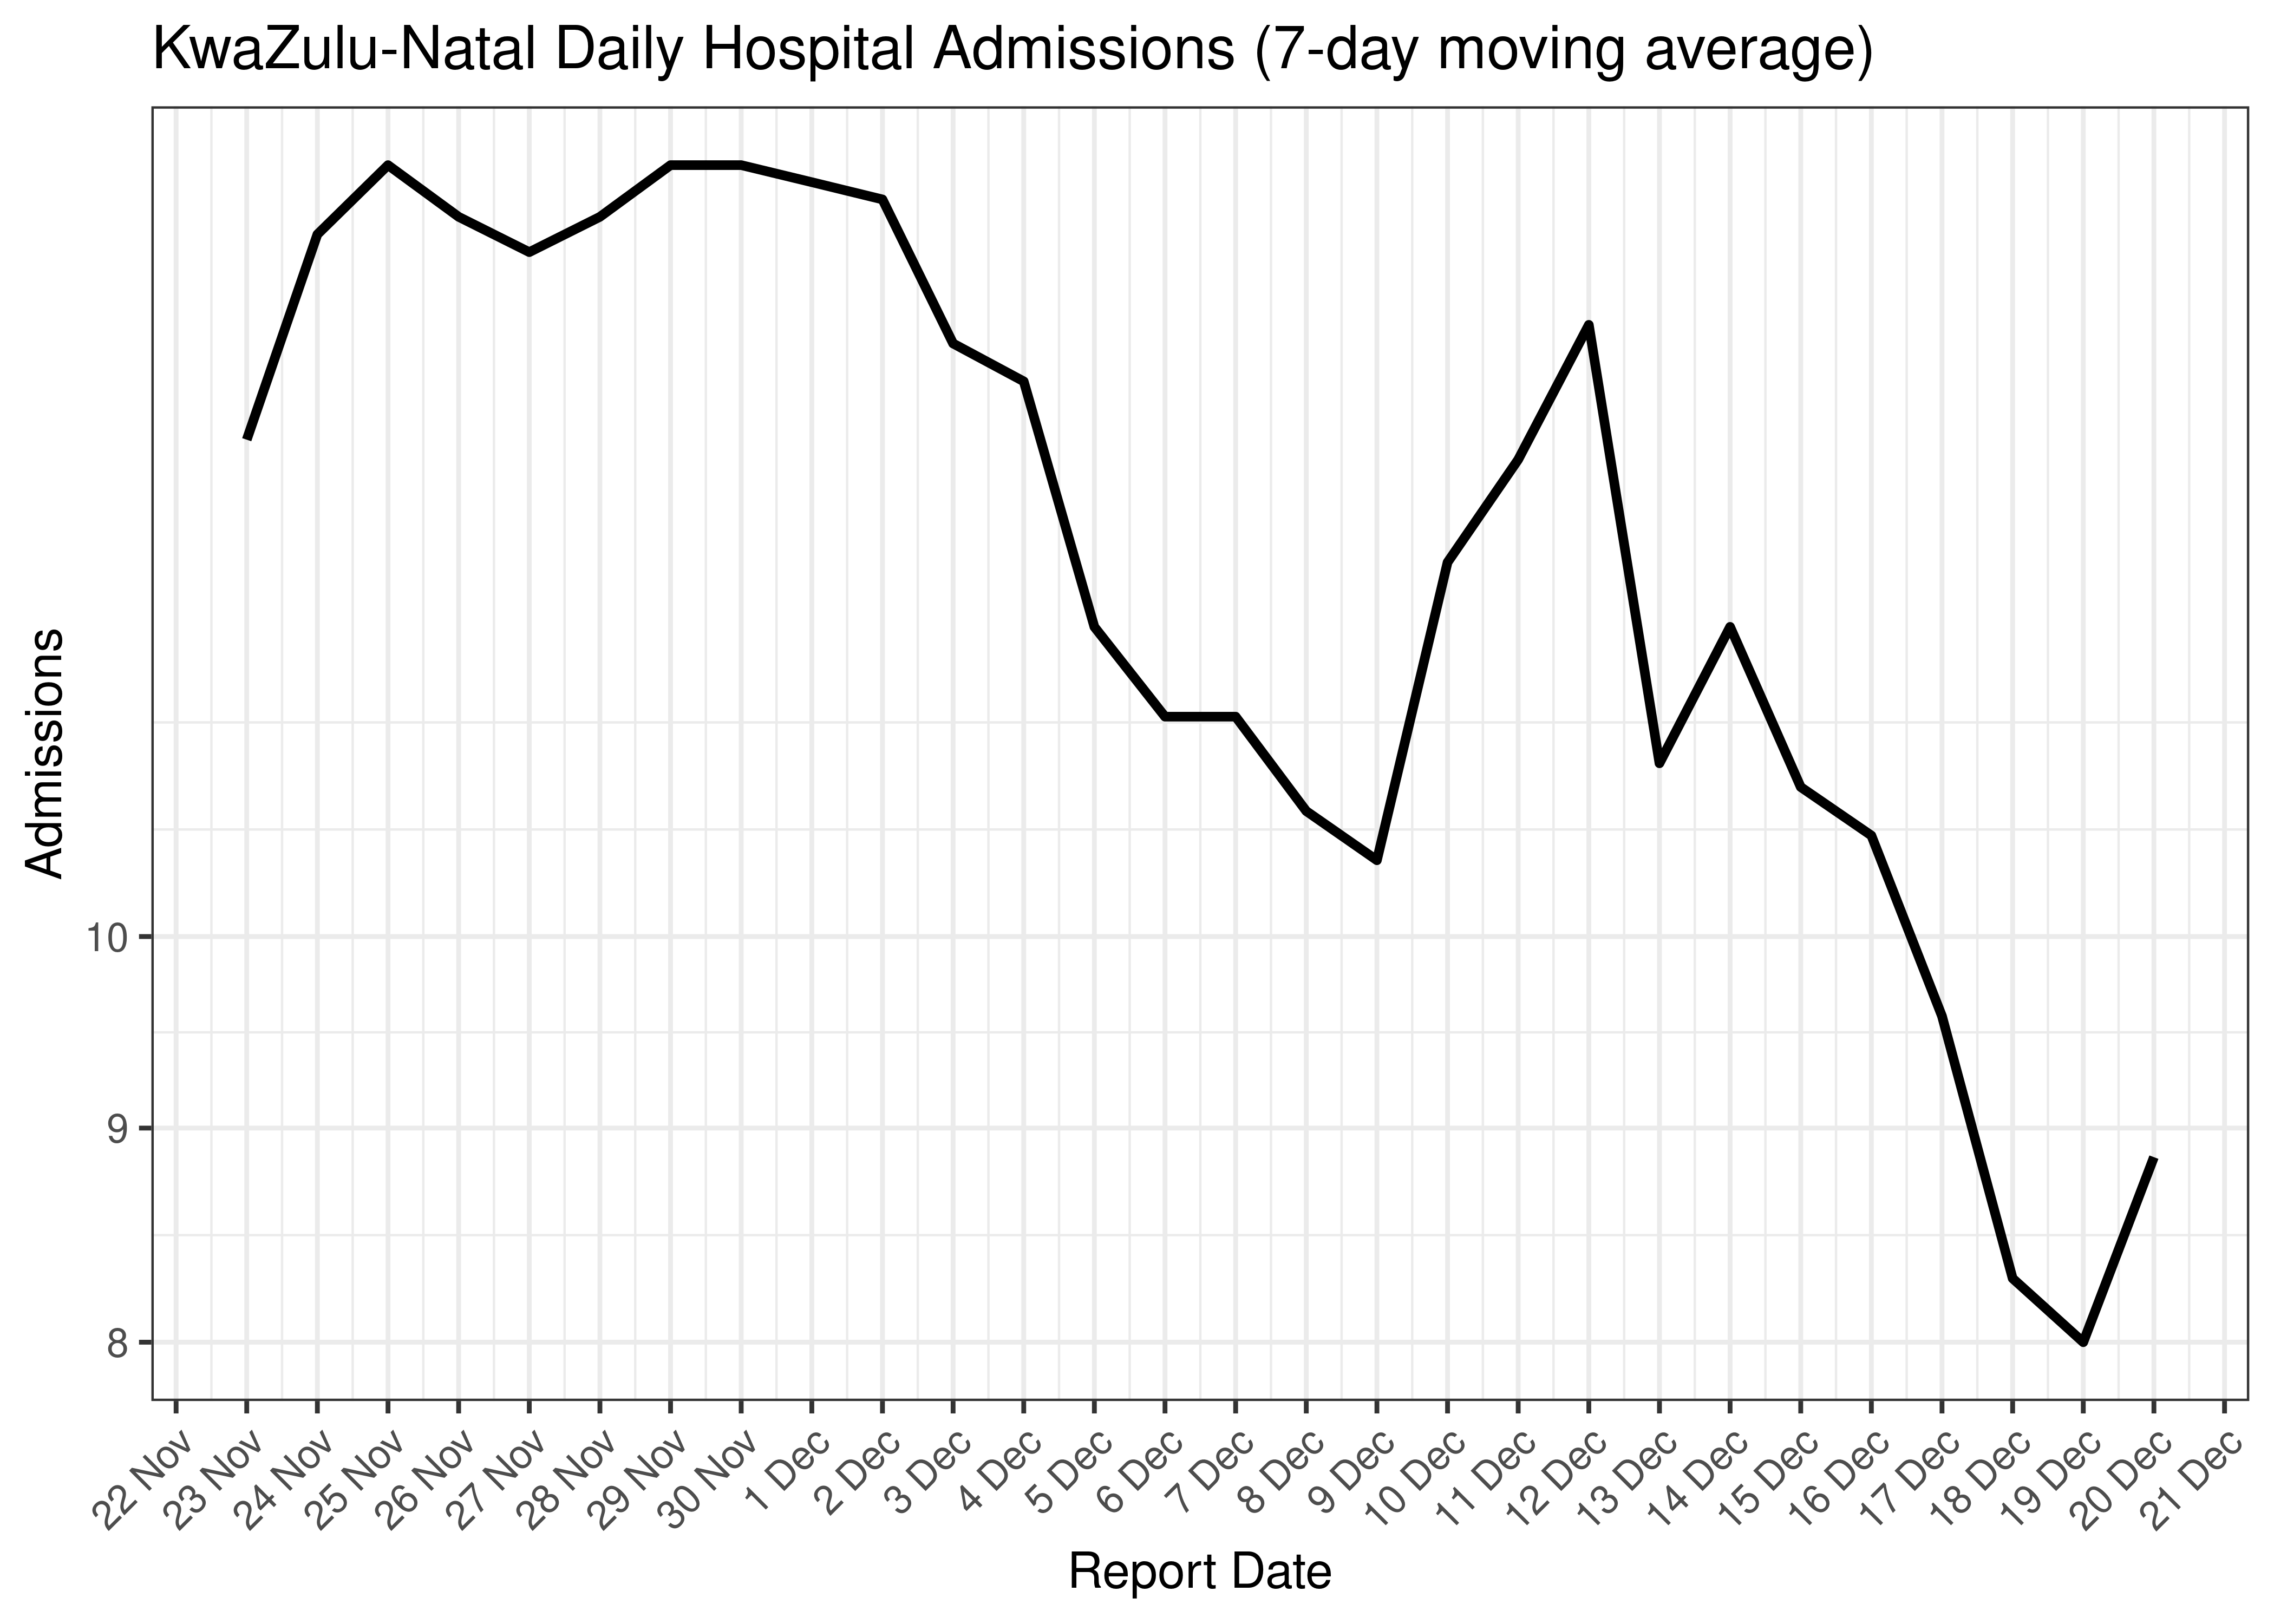
KwaZulu-Natal Daily Hospital Admissions for Last 30-days (7-day moving average)
6.5.3 Hospital Deaths
Hospital deaths are tabulated by reported date below. The peak daily deaths in previous waves (as measured by the moving average) is also shown.
Note that hospital deaths underestimates total COVID-19 deaths in South Africa.
| Reported Date | Hospital Deaths | 7-day Moving Average | Comment |
|---|---|---|---|
| 2020-07-26 | 22 | 42 | Wave 1 Peak |
| 2021-01-14 | 173 | 154 | Wave 2 Peak |
| 2021-08-27 | 67 | 70 | Wave 3 Peak |
| 2022-01-09 | 2 | 39 | Wave 4 Peak |
| 2022-05-20 | 11 | 7 | Wave 5 Peak (to date) |
| 2022-12-16 | 0 | 1 | |
| 2022-12-17 | 0 | 1 | |
| 2022-12-18 | 0 | 0 | |
| 2022-12-19 | 0 | 0 | |
| 2022-12-20 | 1 | 0 | |
| 2022-12-21 | 1 | NA | |
| 2022-12-22 | 1 | NA | |
| 2022-12-23 | 0 | NA |
Below a 7-day moving average daily hospital deaths count is plotted for KwaZulu-Natal on a log scale since start of the epidemic:
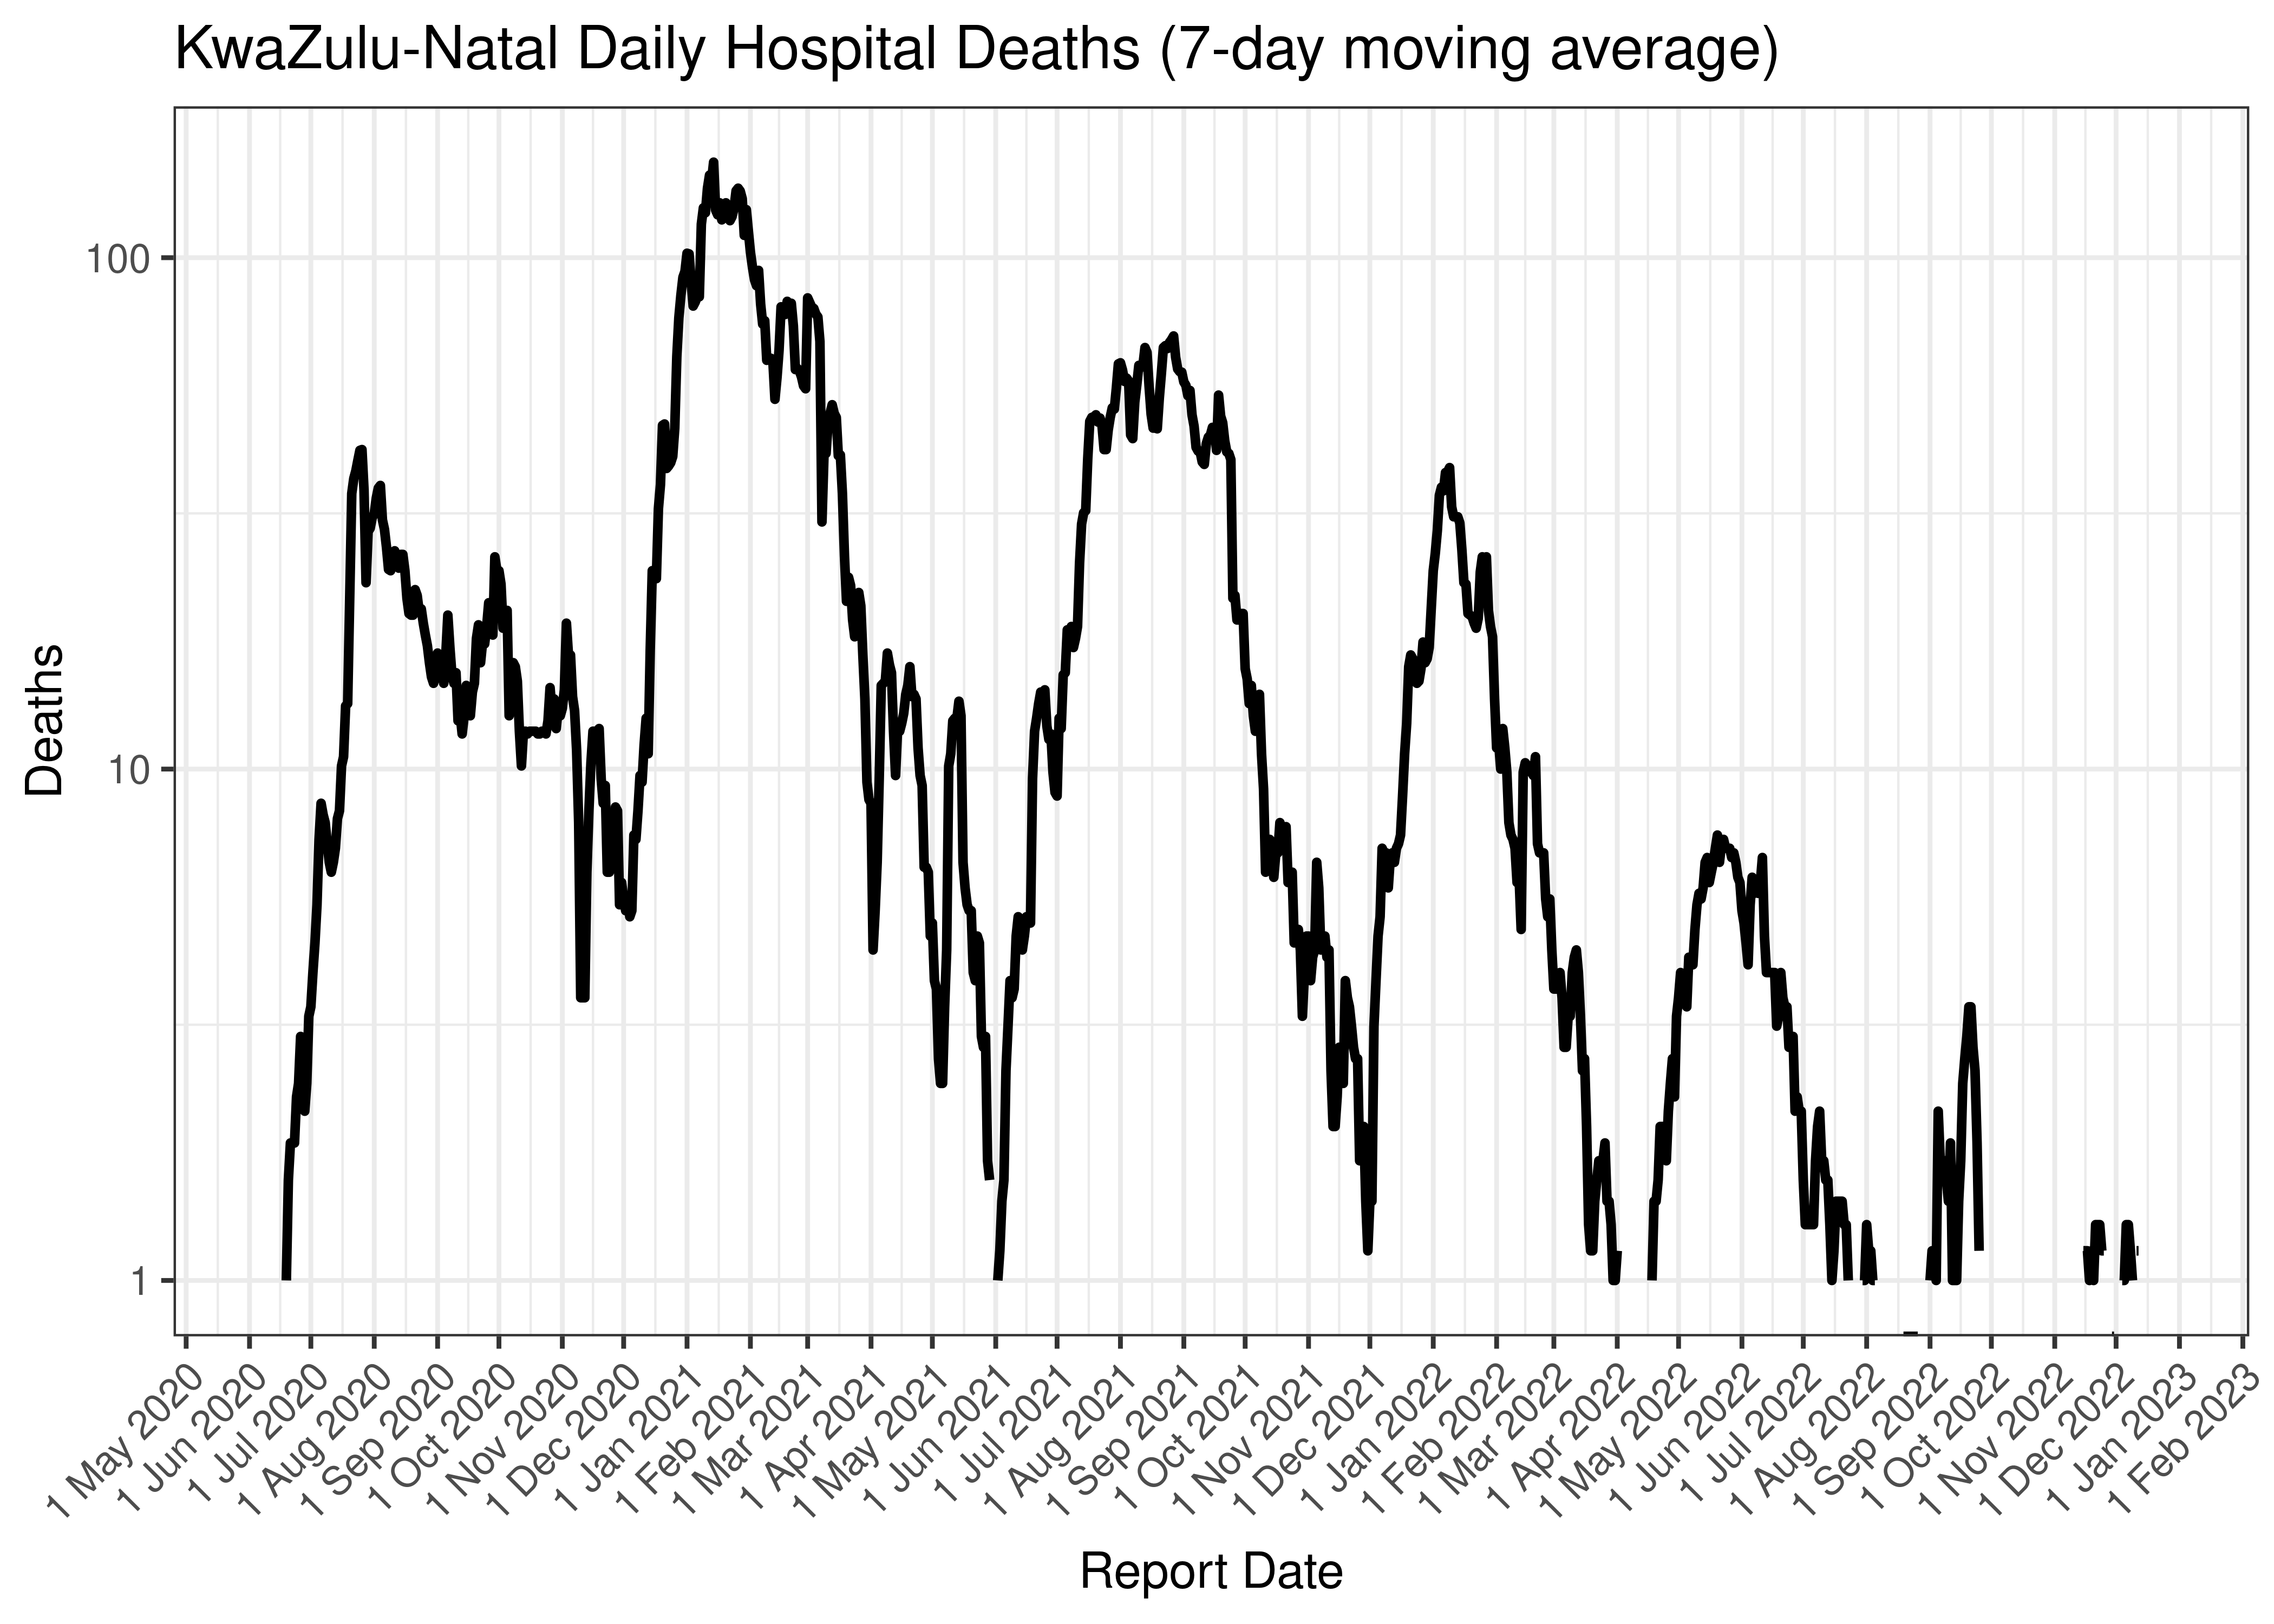
KwaZulu-Natal Daily Hospital Deaths (7-day moving average)
Below the above chart is repeated for the last 30-days:
KwaZulu-Natal Daily Hospital Deaths for Last 30-days (7-day moving average)
6.5.4 Excess Deaths
Excess deaths are tabulated by date of death below. The peak daily deaths in previous waves (as measured by the moving average) is also shown.
| Date of Death | Excess Deaths | 7-day Moving Average | Comment |
|---|---|---|---|
| 2020-07-22 | 226 | 226 | Wave 1 Peak |
| 2021-01-13 | 725 | 725 | Wave 2 Peak |
| 2021-08-18 | 199 | 199 | Wave 3 Peak |
| 2021-12-29 | 127 | 127 | Wave 4 Peak |
| 2022-05-25 | 59 | 59 | Wave 5 Peak (to date) |
| 2022-12-03 | 16 | 19 | |
| 2022-12-04 | 22 | 19 | |
| 2022-12-05 | 22 | 20 | |
| 2022-12-06 | 22 | 21 | |
| 2022-12-07 | 22 | 22 | |
| 2022-12-08 | 22 | NA | |
| 2022-12-09 | 22 | NA | |
| 2022-12-10 | 22 | NA |
Below a 7-day moving average daily excess deaths count is plotted for KwaZulu-Natal on a log scale since start of the epidemic:
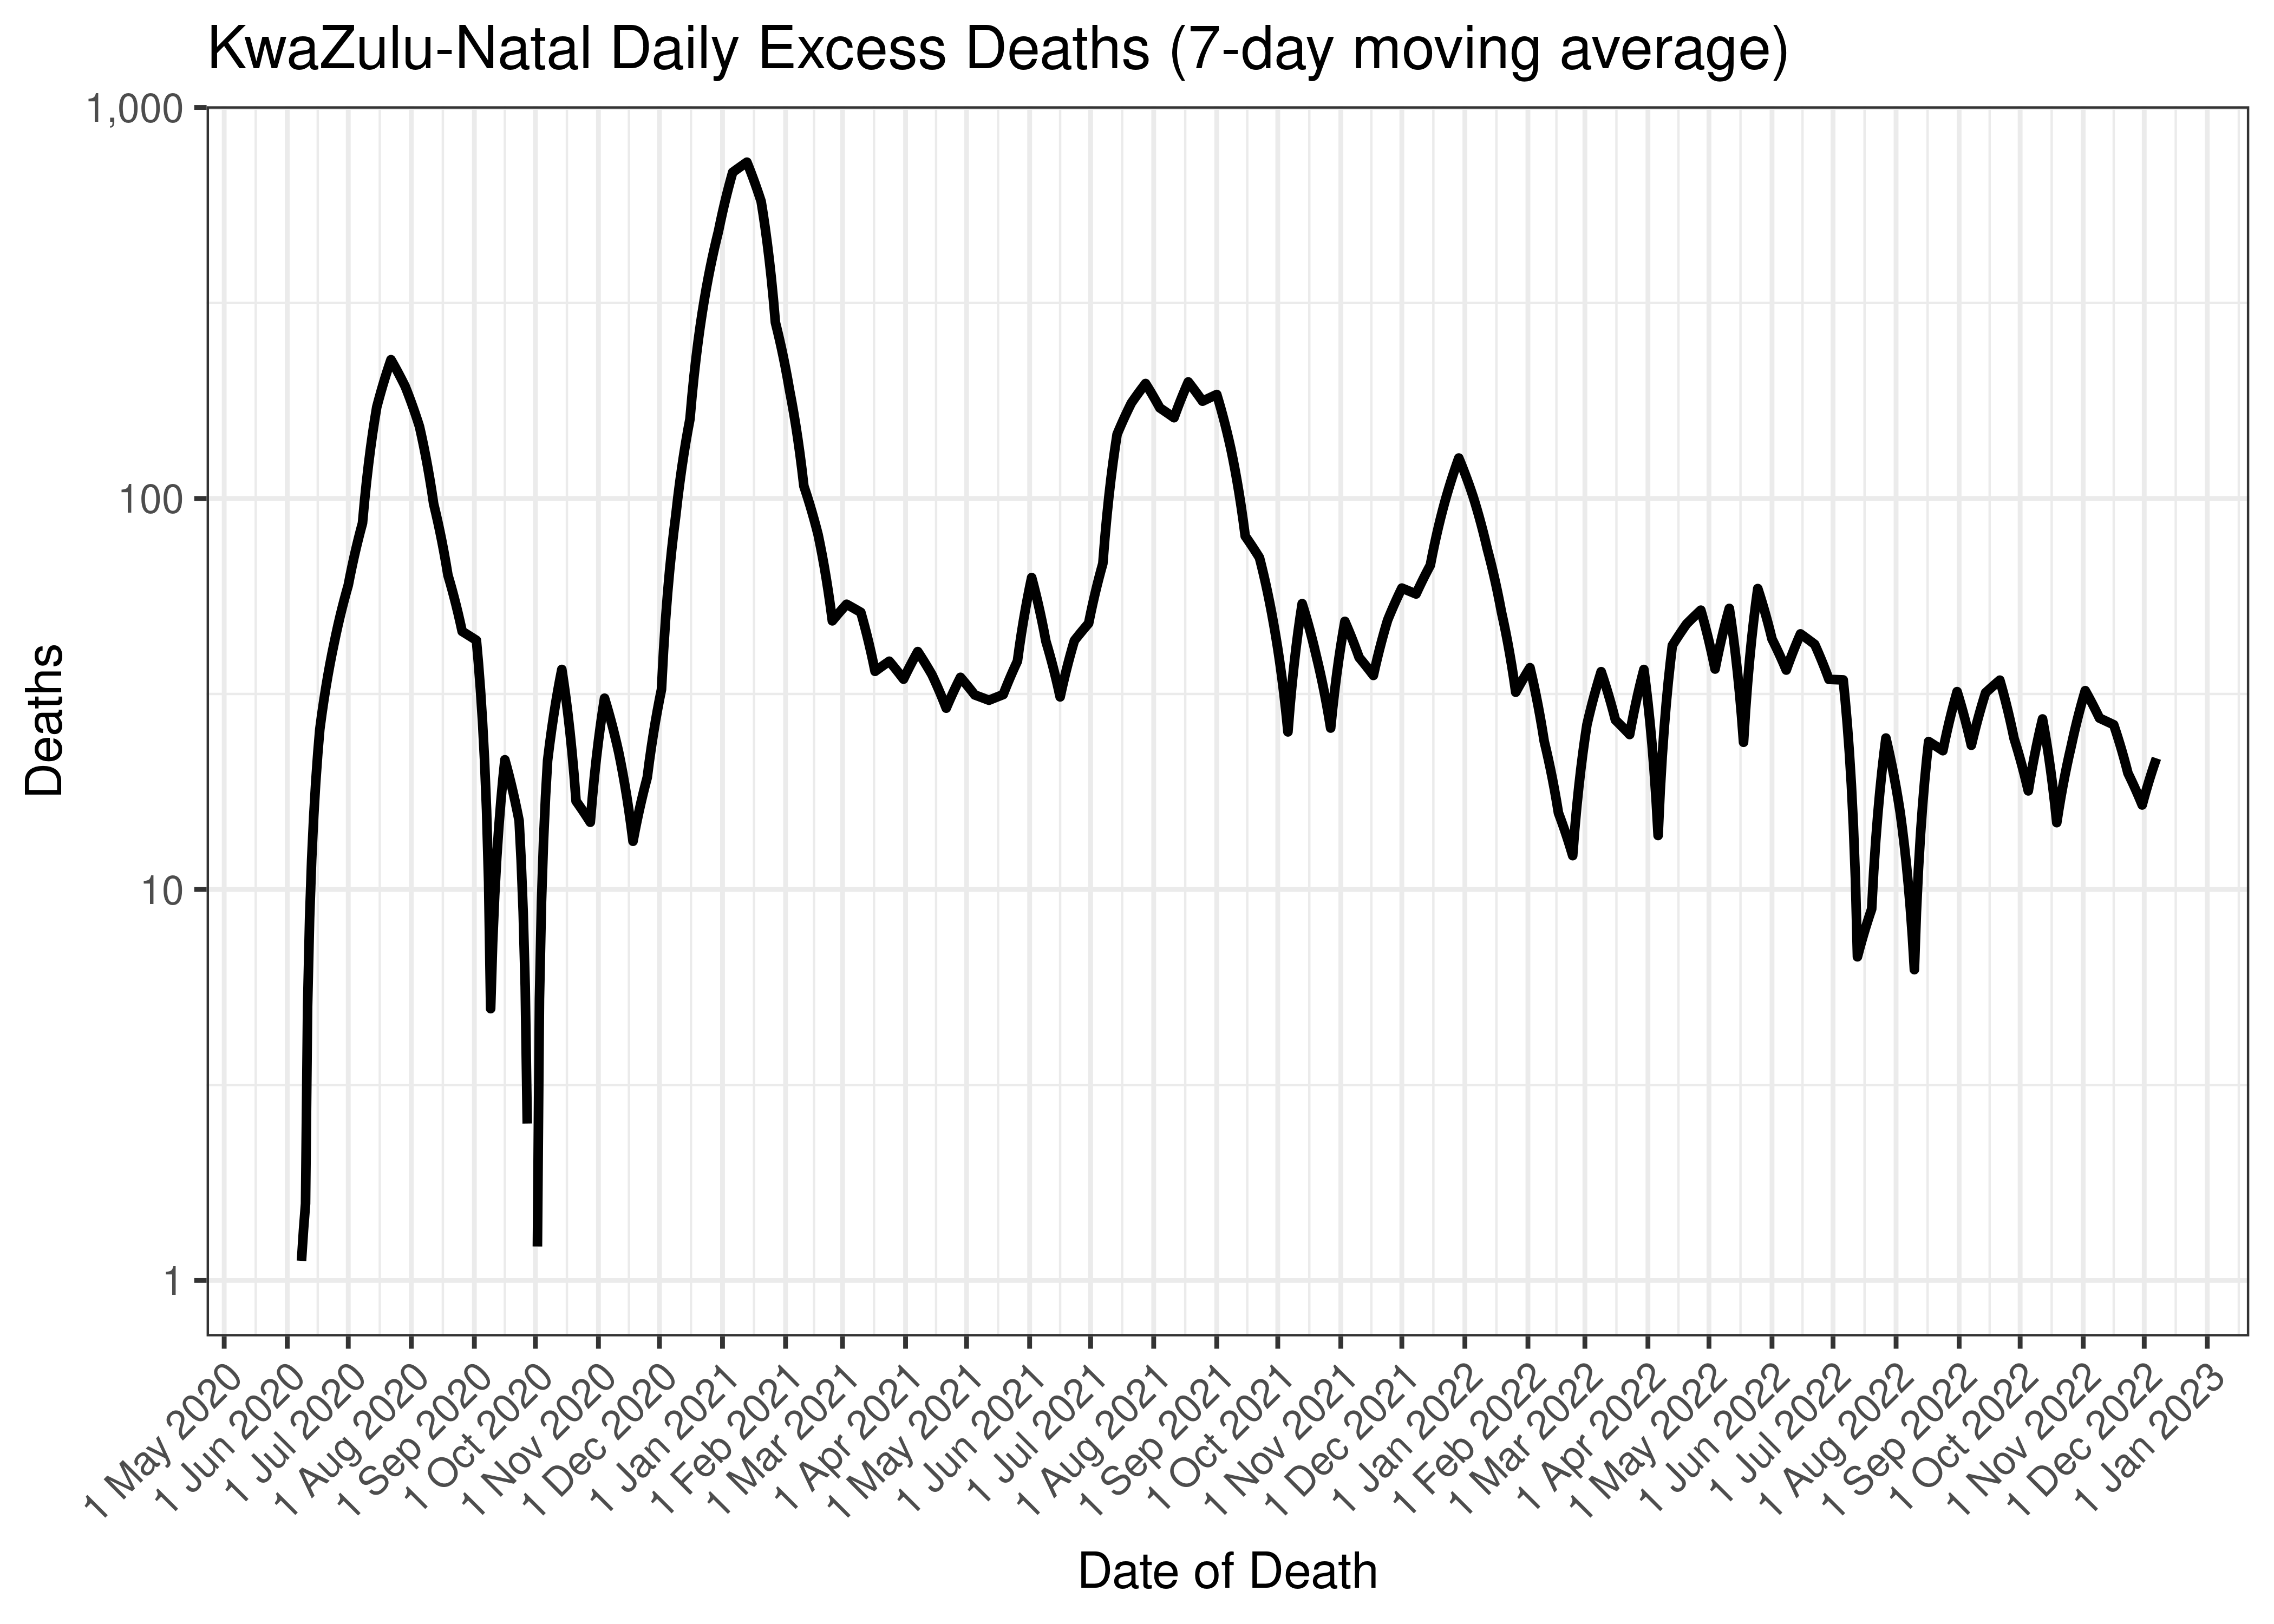
KwaZulu-Natal Daily Excess Deaths (7-day moving average)
Below the above chart is repeated for the last 30-days:
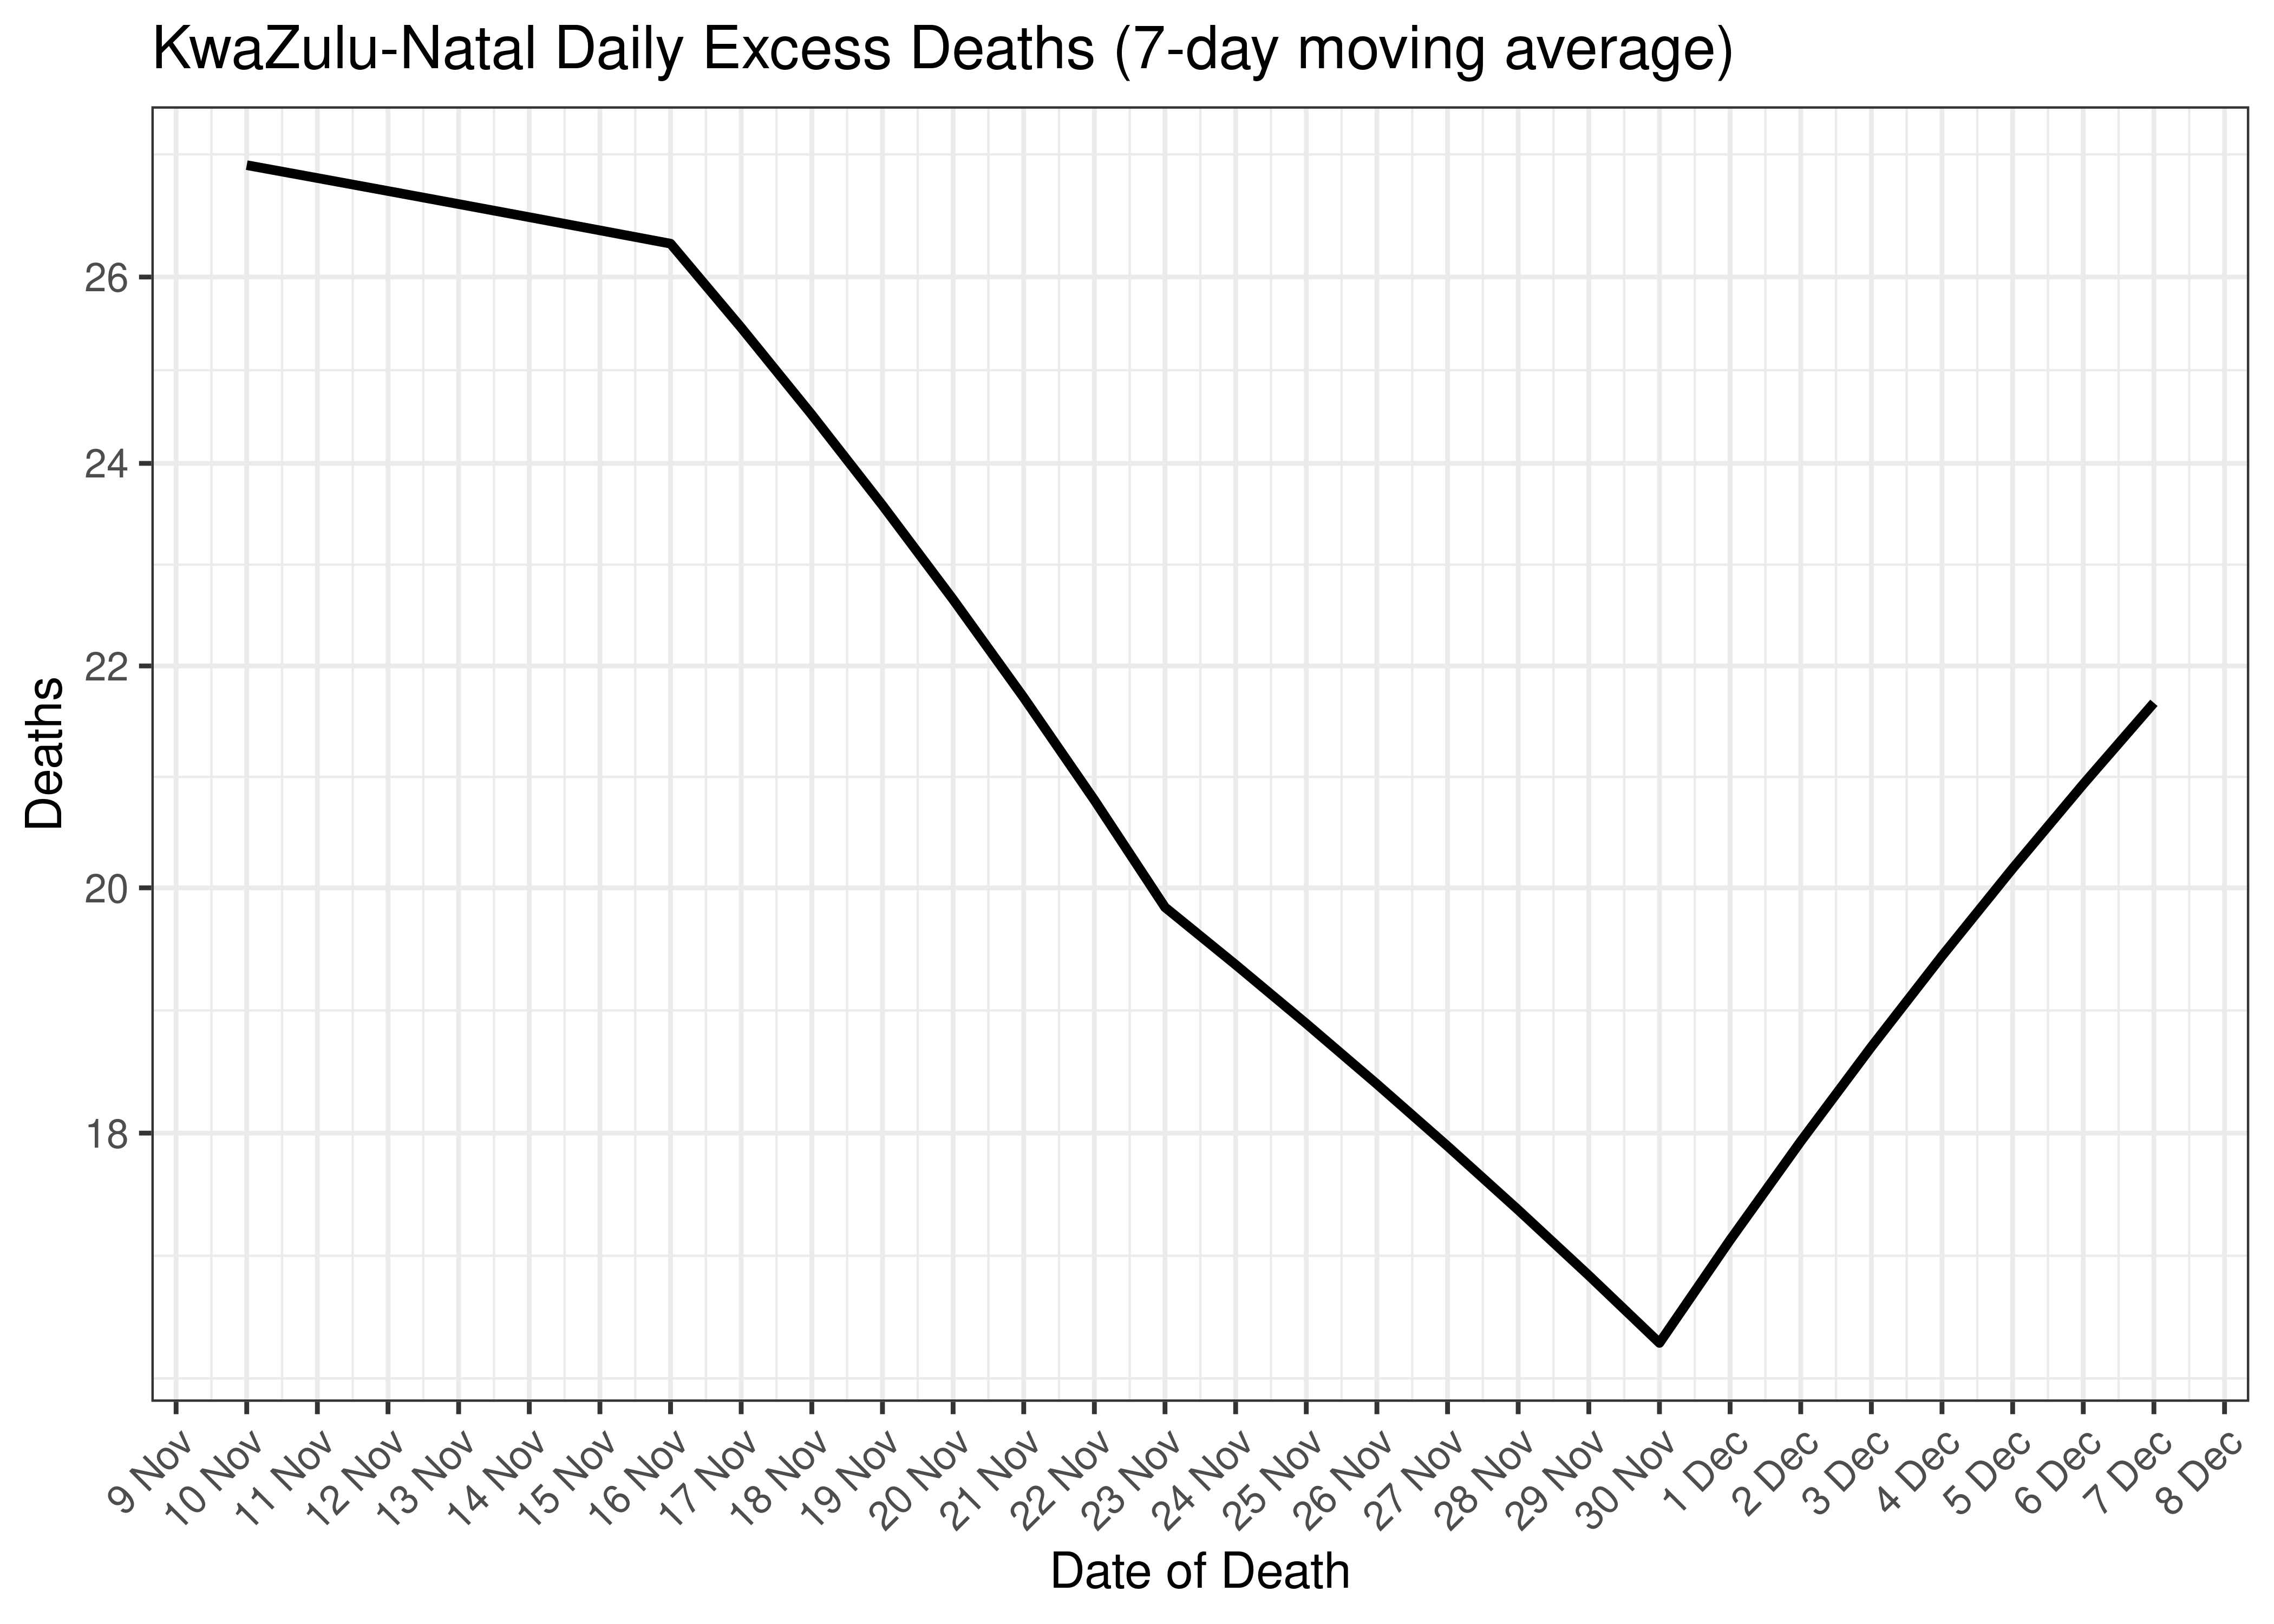
KwaZulu-Natal Daily Excess Deaths for Last 30-days (7-day moving average)
6.5.5 Cases, Admissions and Deaths Combined
Below a 7-day moving average daily case, admission and excess death counts are plotted for KwaZulu-Natal on a log scale since start of the epidemic. Note admissions and excess deaths are plotted by reported date, whereas cases are plotted by specimen received date.
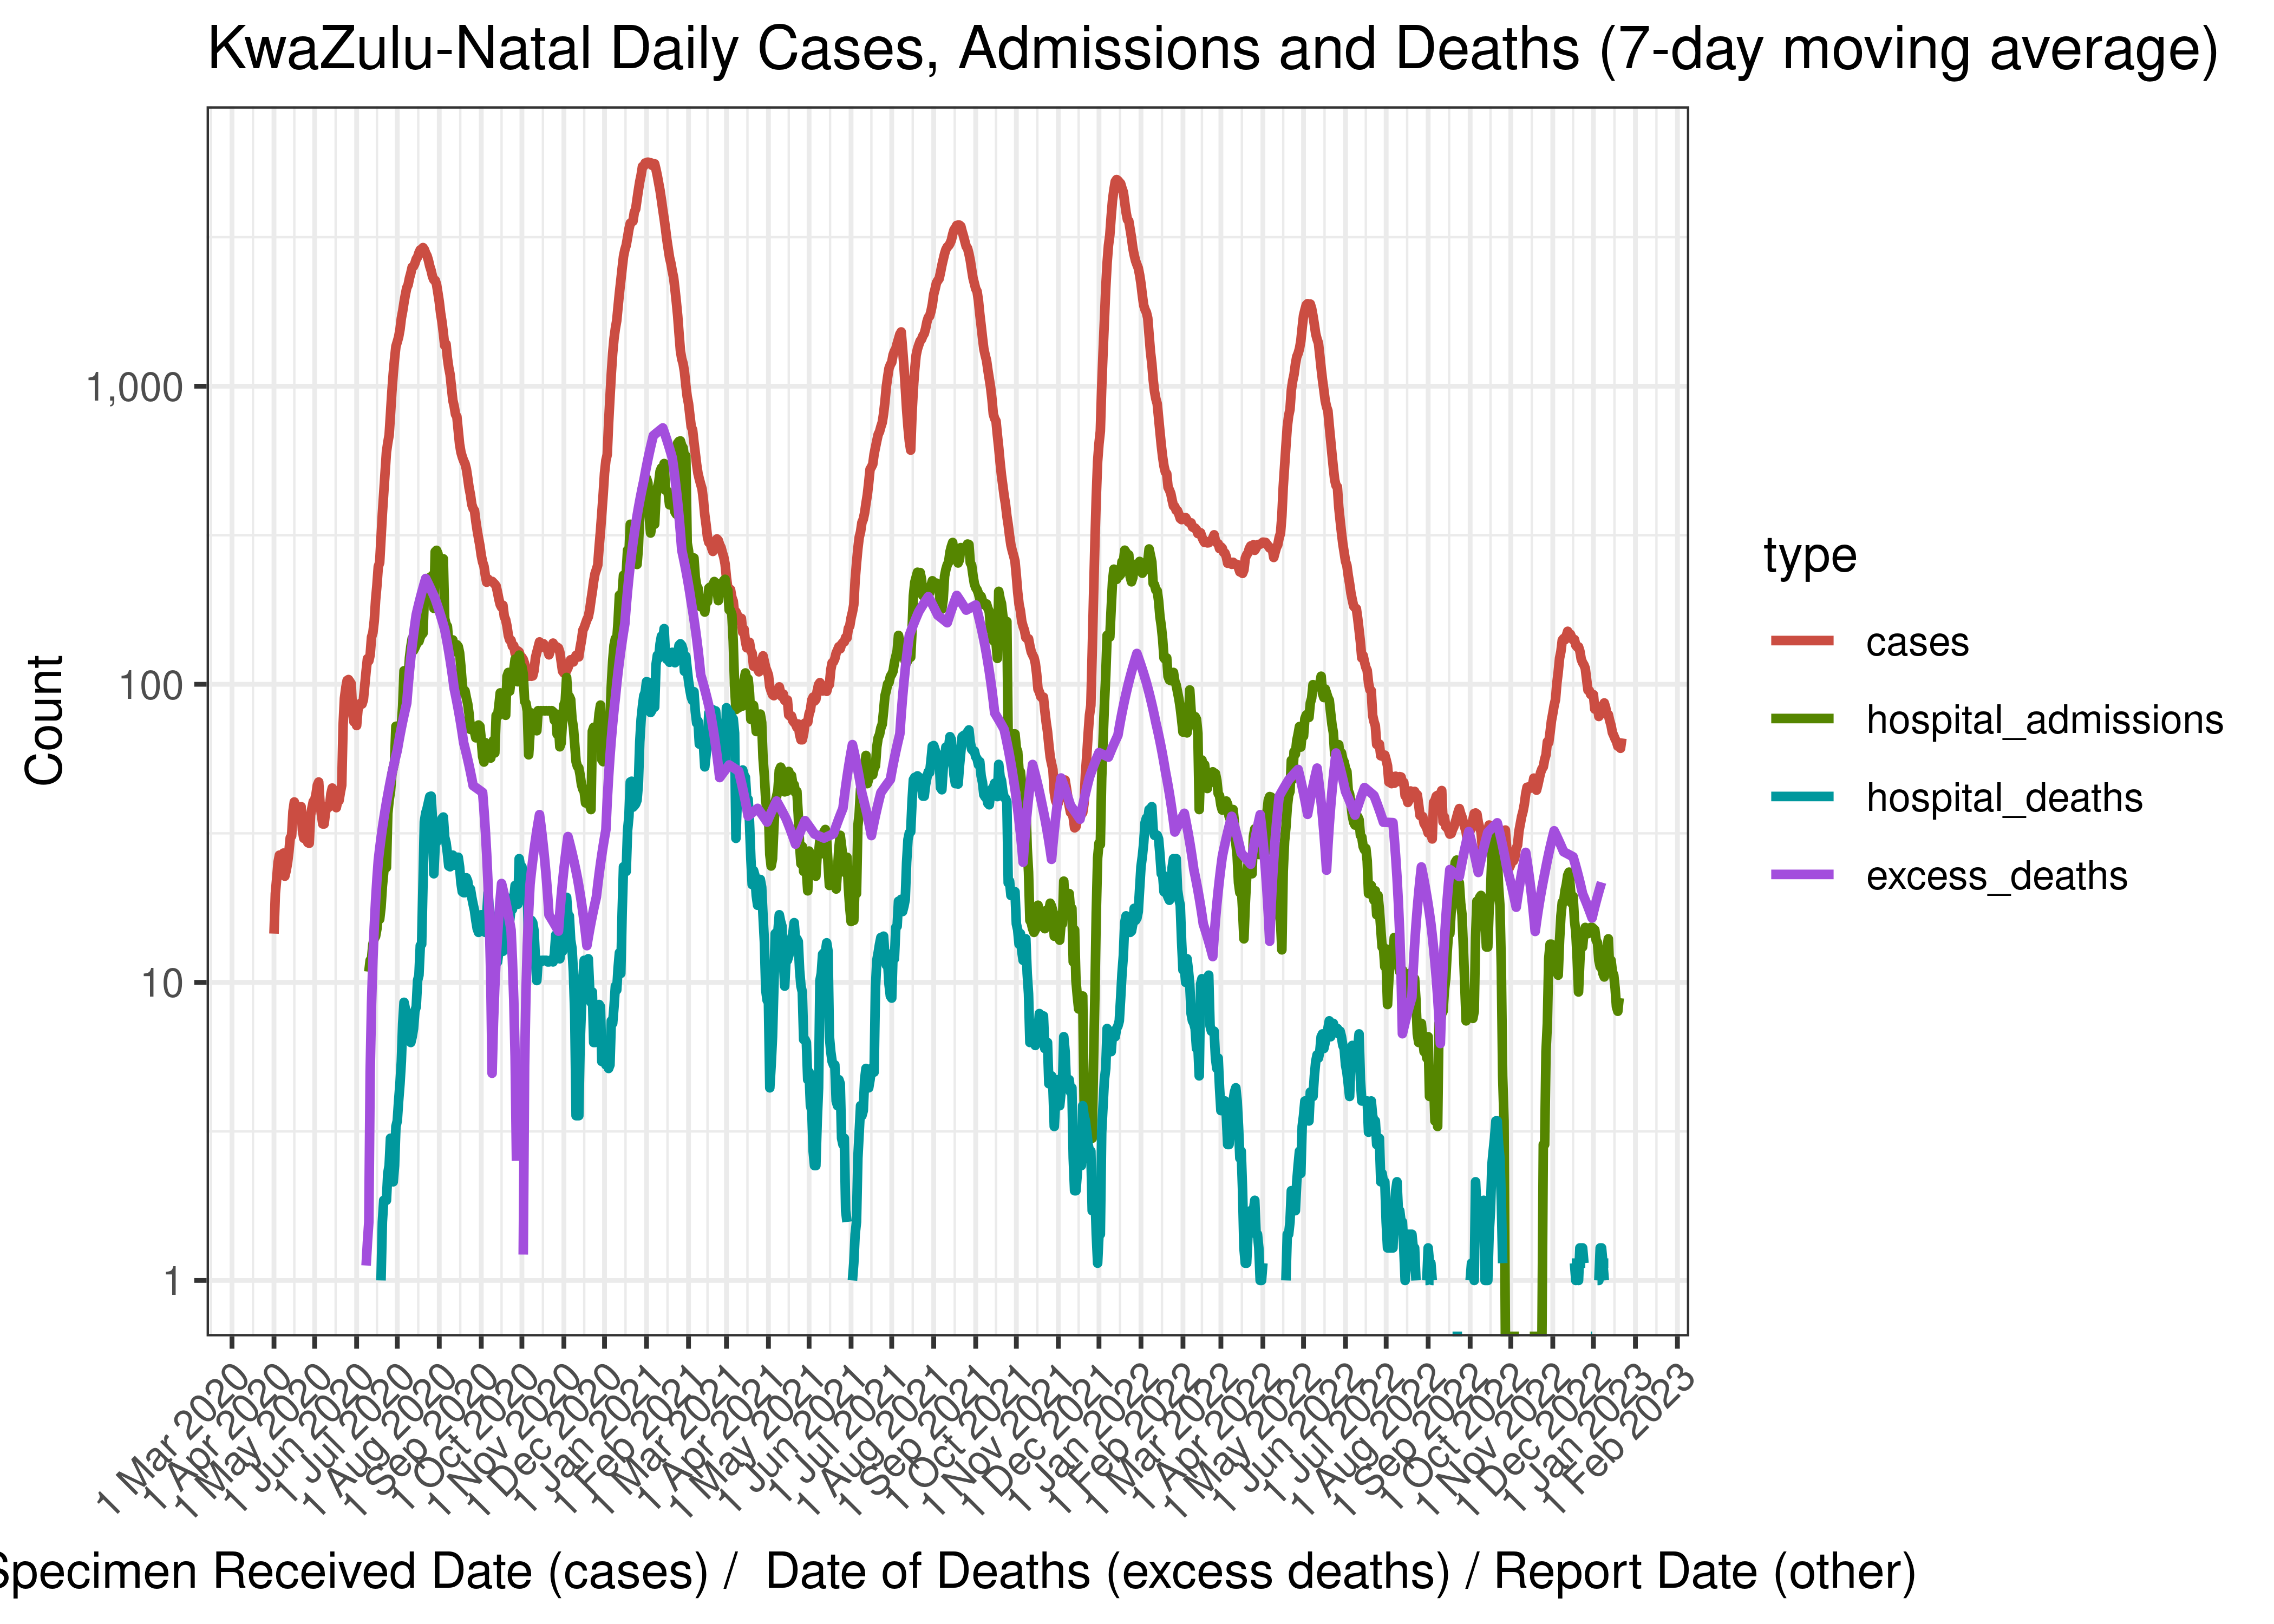
KwaZulu-Natal Daily Cases, Admissions and Deaths (7-day moving average)
Below the above chart is repeated for the last 30-days:

KwaZulu-Natal Daily Cases, Admissions and Deaths for Last 30-days (7-day moving average)
6.5.6 Crude Ratios per Wave
Below crude rations are calculated between the waves. It’s based on the following starting dates:
- Wave 1 started on 2020-01-01.
- Wave 2 started on 2020-10-01.
- Wave 3 started on 2021-04-01.
- Wave 4 started on 2021-11-01.
- Wave 5 started on 2022-04-01.
Below crude ratios are tabulated and plotted. These ratios are:
- Case admissions ratio calculated as admissions divided by cases.
- Case fatality ratio calculated as hospital deaths divided by cases (Note that COVID-19 deaths are under-reported by a significant factor in South Africa).
- Case excess deaths ratio calculated as excess deaths divided by cases.
- Hospital fatality ratio calculated as hospital deaths divided by admissions (Note that COVID-19 deaths are under-reported by a significant factor in South Africa).
- Death reporting ratio calculated as hospital deaths divided by excess deaths.
| Wave | Case Admission Ratio | Case Fatality Ratio | Case Excess Deaths Ratio | Hospital Fatality Ratio | Death Reporting Ratio | |
|---|---|---|---|---|---|---|
| KwaZulu-Natal | Wave 1 | 10.2% | 1.55% | 7.41% | 15.2% | 20.9% |
| KwaZulu-Natal | Wave 2 | 16.2% | 3.98% | 13.32% | 24.7% | 29.9% |
| KwaZulu-Natal | Wave 3 | 12.1% | 2.80% | 9.56% | 23.1% | 29.3% |
| KwaZulu-Natal | Wave 4 | 9.7% | 1.05% | 5.03% | 10.8% | 20.9% |
| KwaZulu-Natal | Wave 5 | 9.6% | 0.72% | 11.07% | 7.5% | 6.5% |
Below the rations above are plotted graphically:
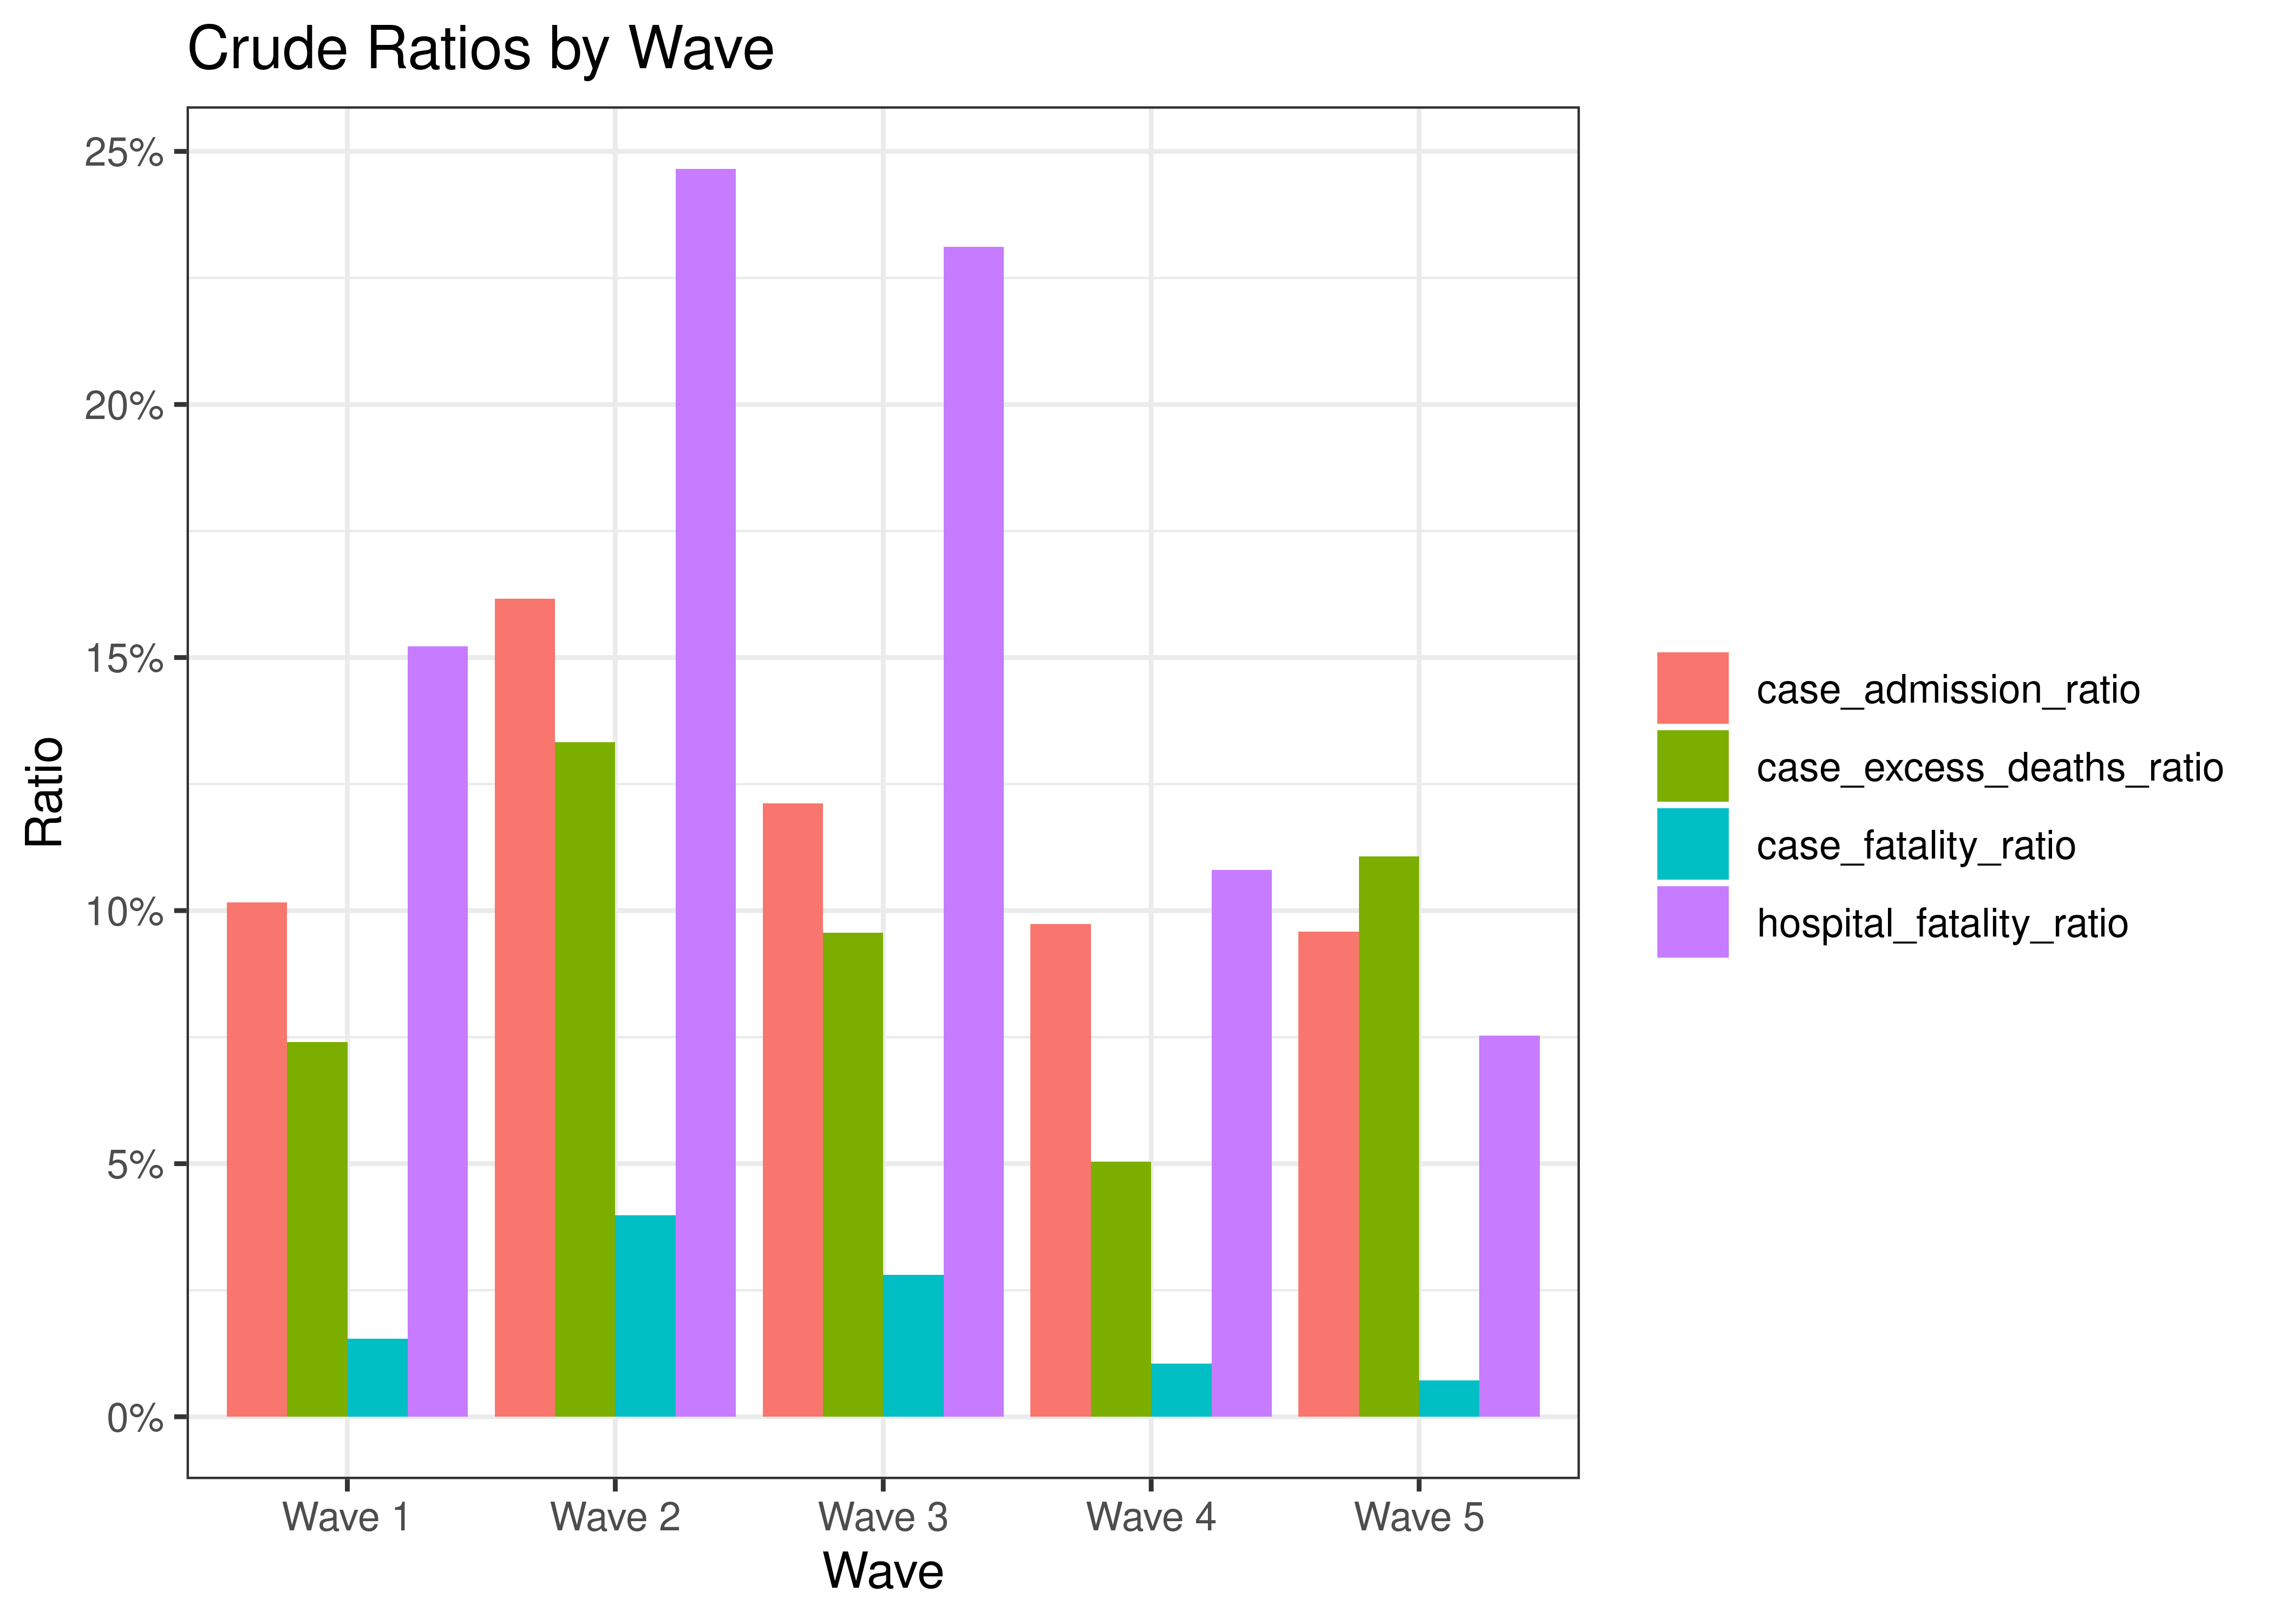
Crude Ratios by Wave
6.5.7 Reproduction Number
Below current (last weekly) effective reproduction number estimates are tabulated for KwaZulu-Natal and by district municipality.
| Type | Count (Per Day) | Week Ending | Reproduction Number [95% Confidence Interval] | |
|---|---|---|---|---|
| KwaZulu-Natal | cases | 65.9 | 2022-12-25 | 0.99 [0.90 - 1.09] |
| KwaZulu-Natal | hospital_admissions | 8.9 | 2022-12-23 | 0.83 [0.64 - 1.06] |
| District Municipality | Type | Count (Per Day) | Week Ending | Reproduction Number [95% Confidence Interval] |
|---|---|---|---|---|
| Amajuba | cases | 0.4 | 2022-12-25 | 1.08 [0.29 - 2.33] |
| Ethekwini Metro | cases | 43.9 | 2022-12-25 | 1.02 [0.91 - 1.14] |
| Harry Gwala | cases | 0.3 | 2022-12-25 | 2.29 [0.47 - 5.67] |
| Ilembe | cases | 5.0 | 2022-12-25 | 0.81 [0.57 - 1.10] |
| King Cetshwayo | cases | 2.1 | 2022-12-25 | 1.17 [0.66 - 1.84] |
| Ugu | cases | 3.1 | 2022-12-25 | 1.19 [0.75 - 1.73] |
| Umgungundlovu | cases | 8.7 | 2022-12-25 | 0.93 [0.71 - 1.17] |
| Umkhanyakude | cases | 0.1 | 2022-12-25 | 1.11 [0.13 - 3.12] |
| Umzinyathi | cases | 0.9 | 2022-12-25 | 0.78 [0.31 - 1.46] |
| Uthukela | cases | 0.9 | 2022-12-25 | 1.21 [0.49 - 2.24] |
| Zululand | cases | 0.4 | 2022-12-25 | 2.51 [0.66 - 5.62] |
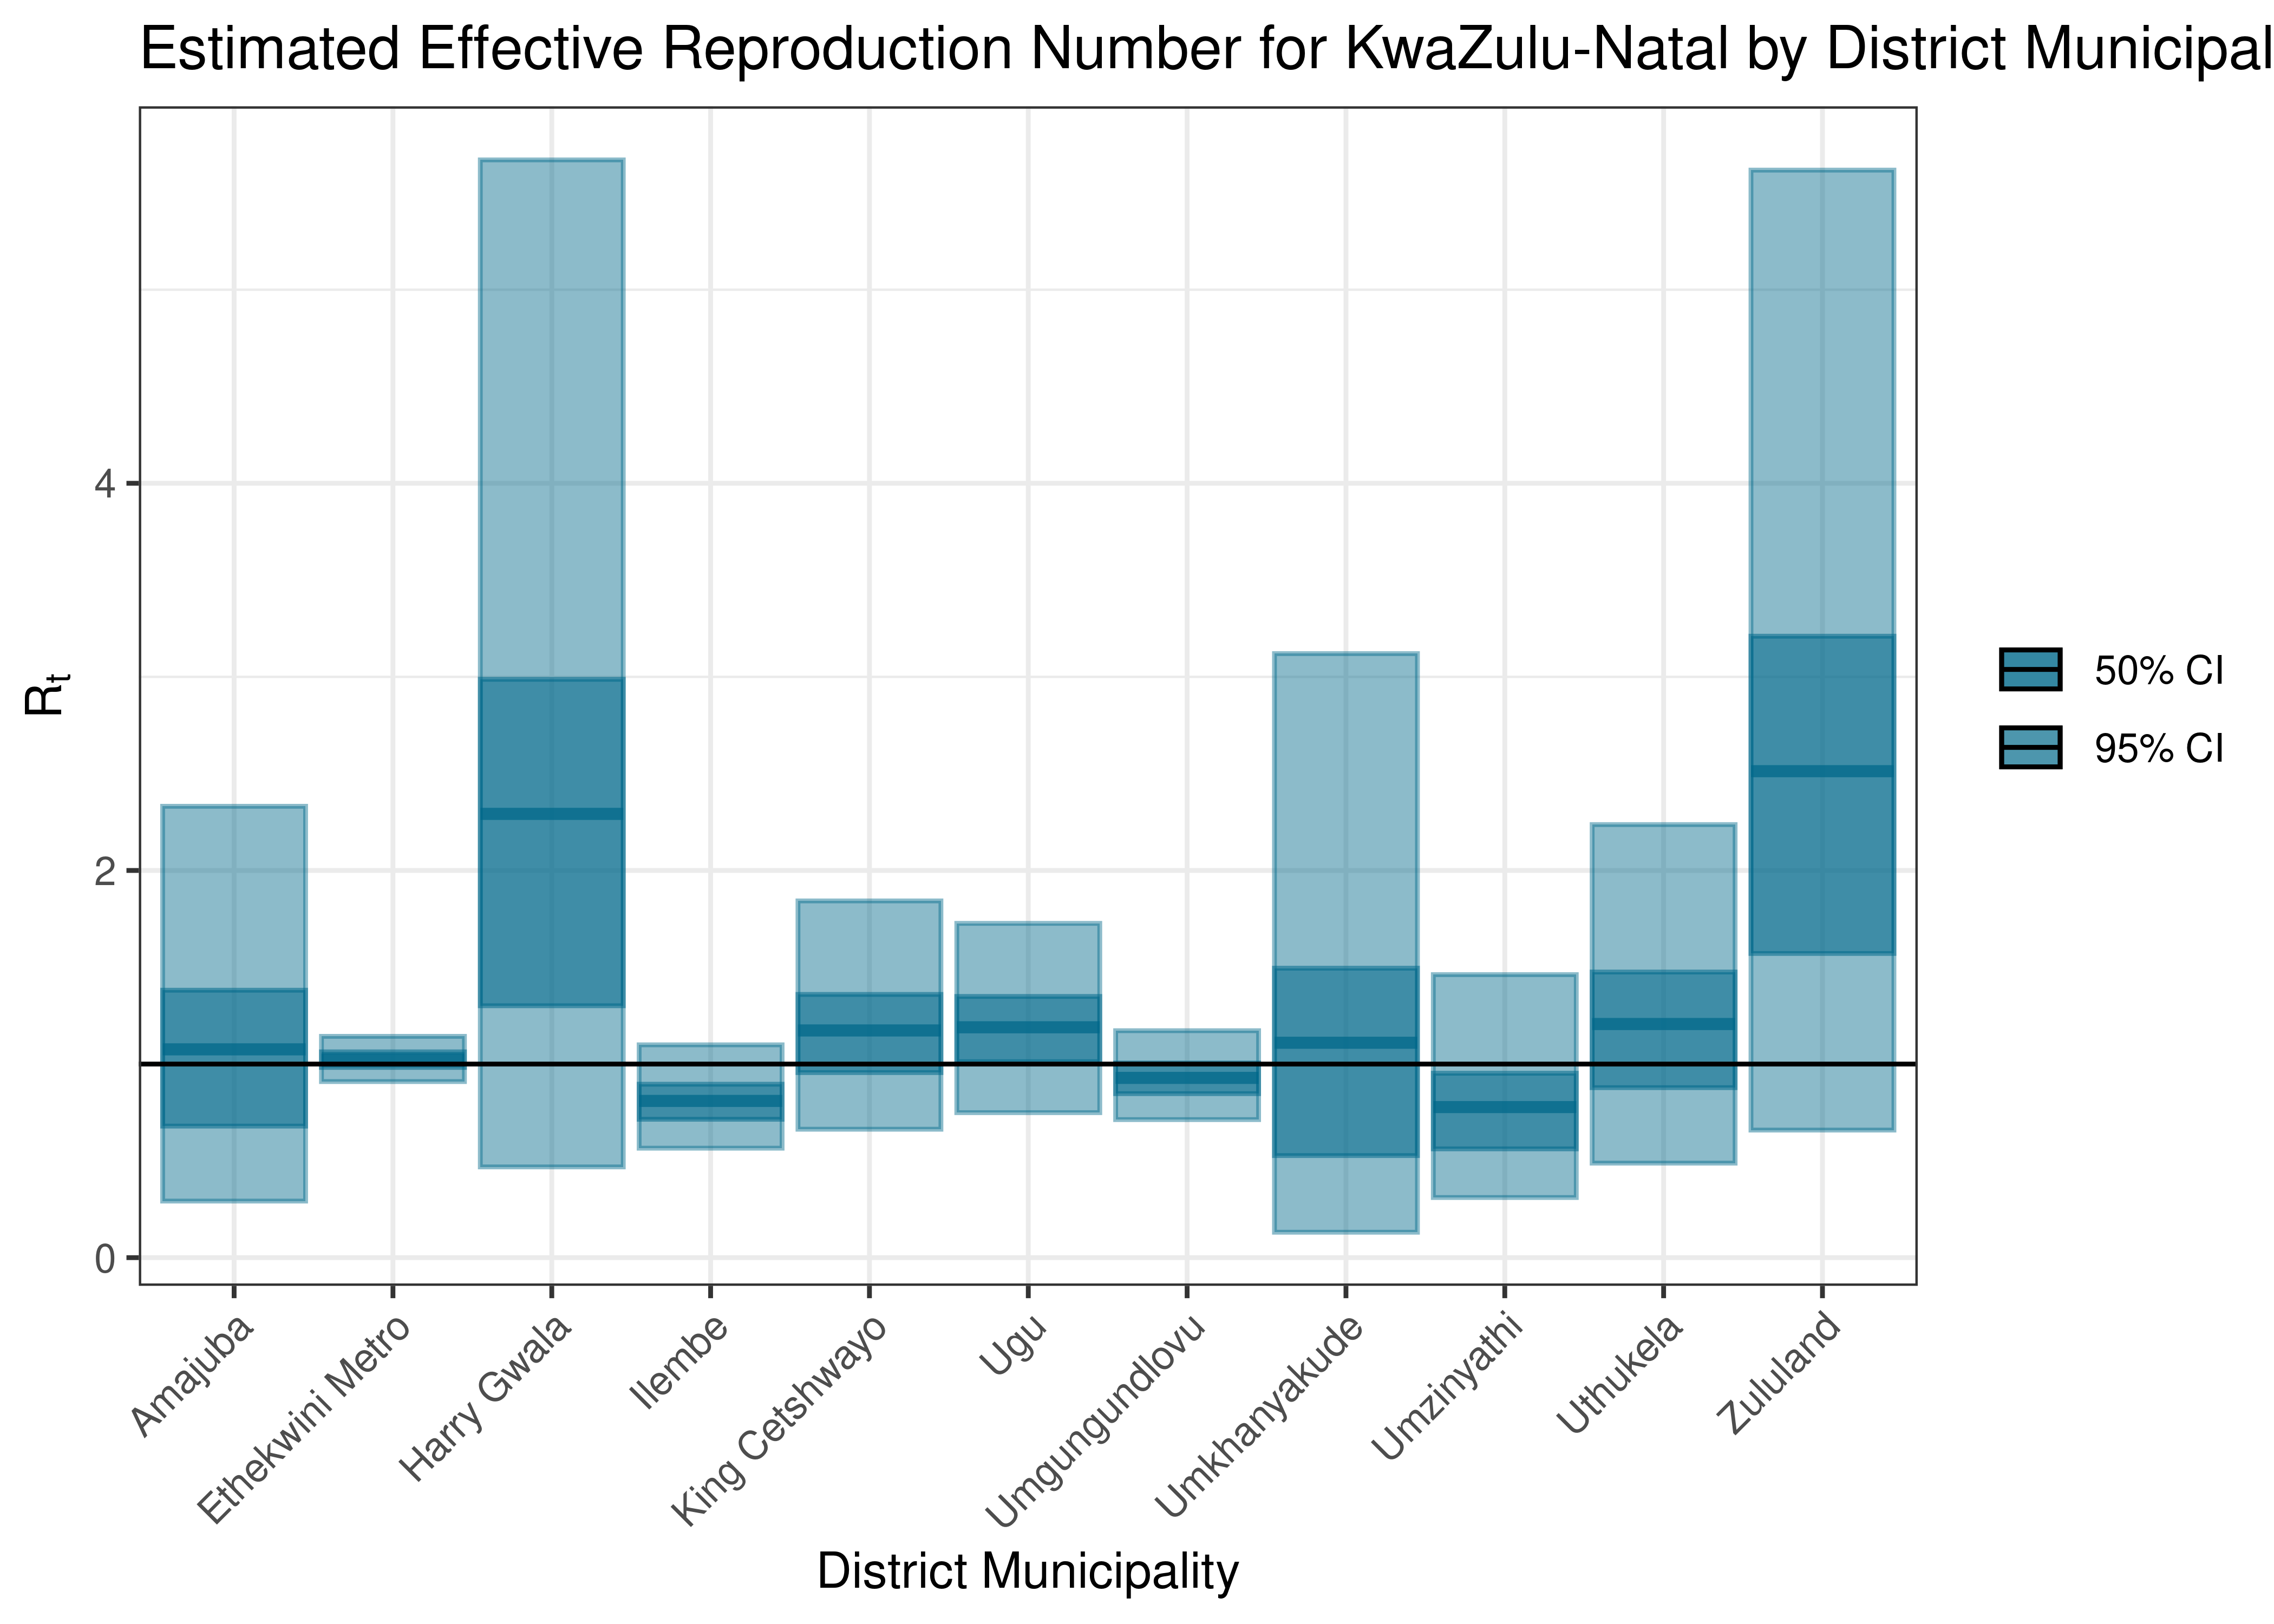
Estimated Effective Reproduction Number for KwaZulu-Natal by District Municipality
Below the effective reproduction number for KwaZulu-Natal over the last 90 days are plotted together with a plot since start of the pandemic.
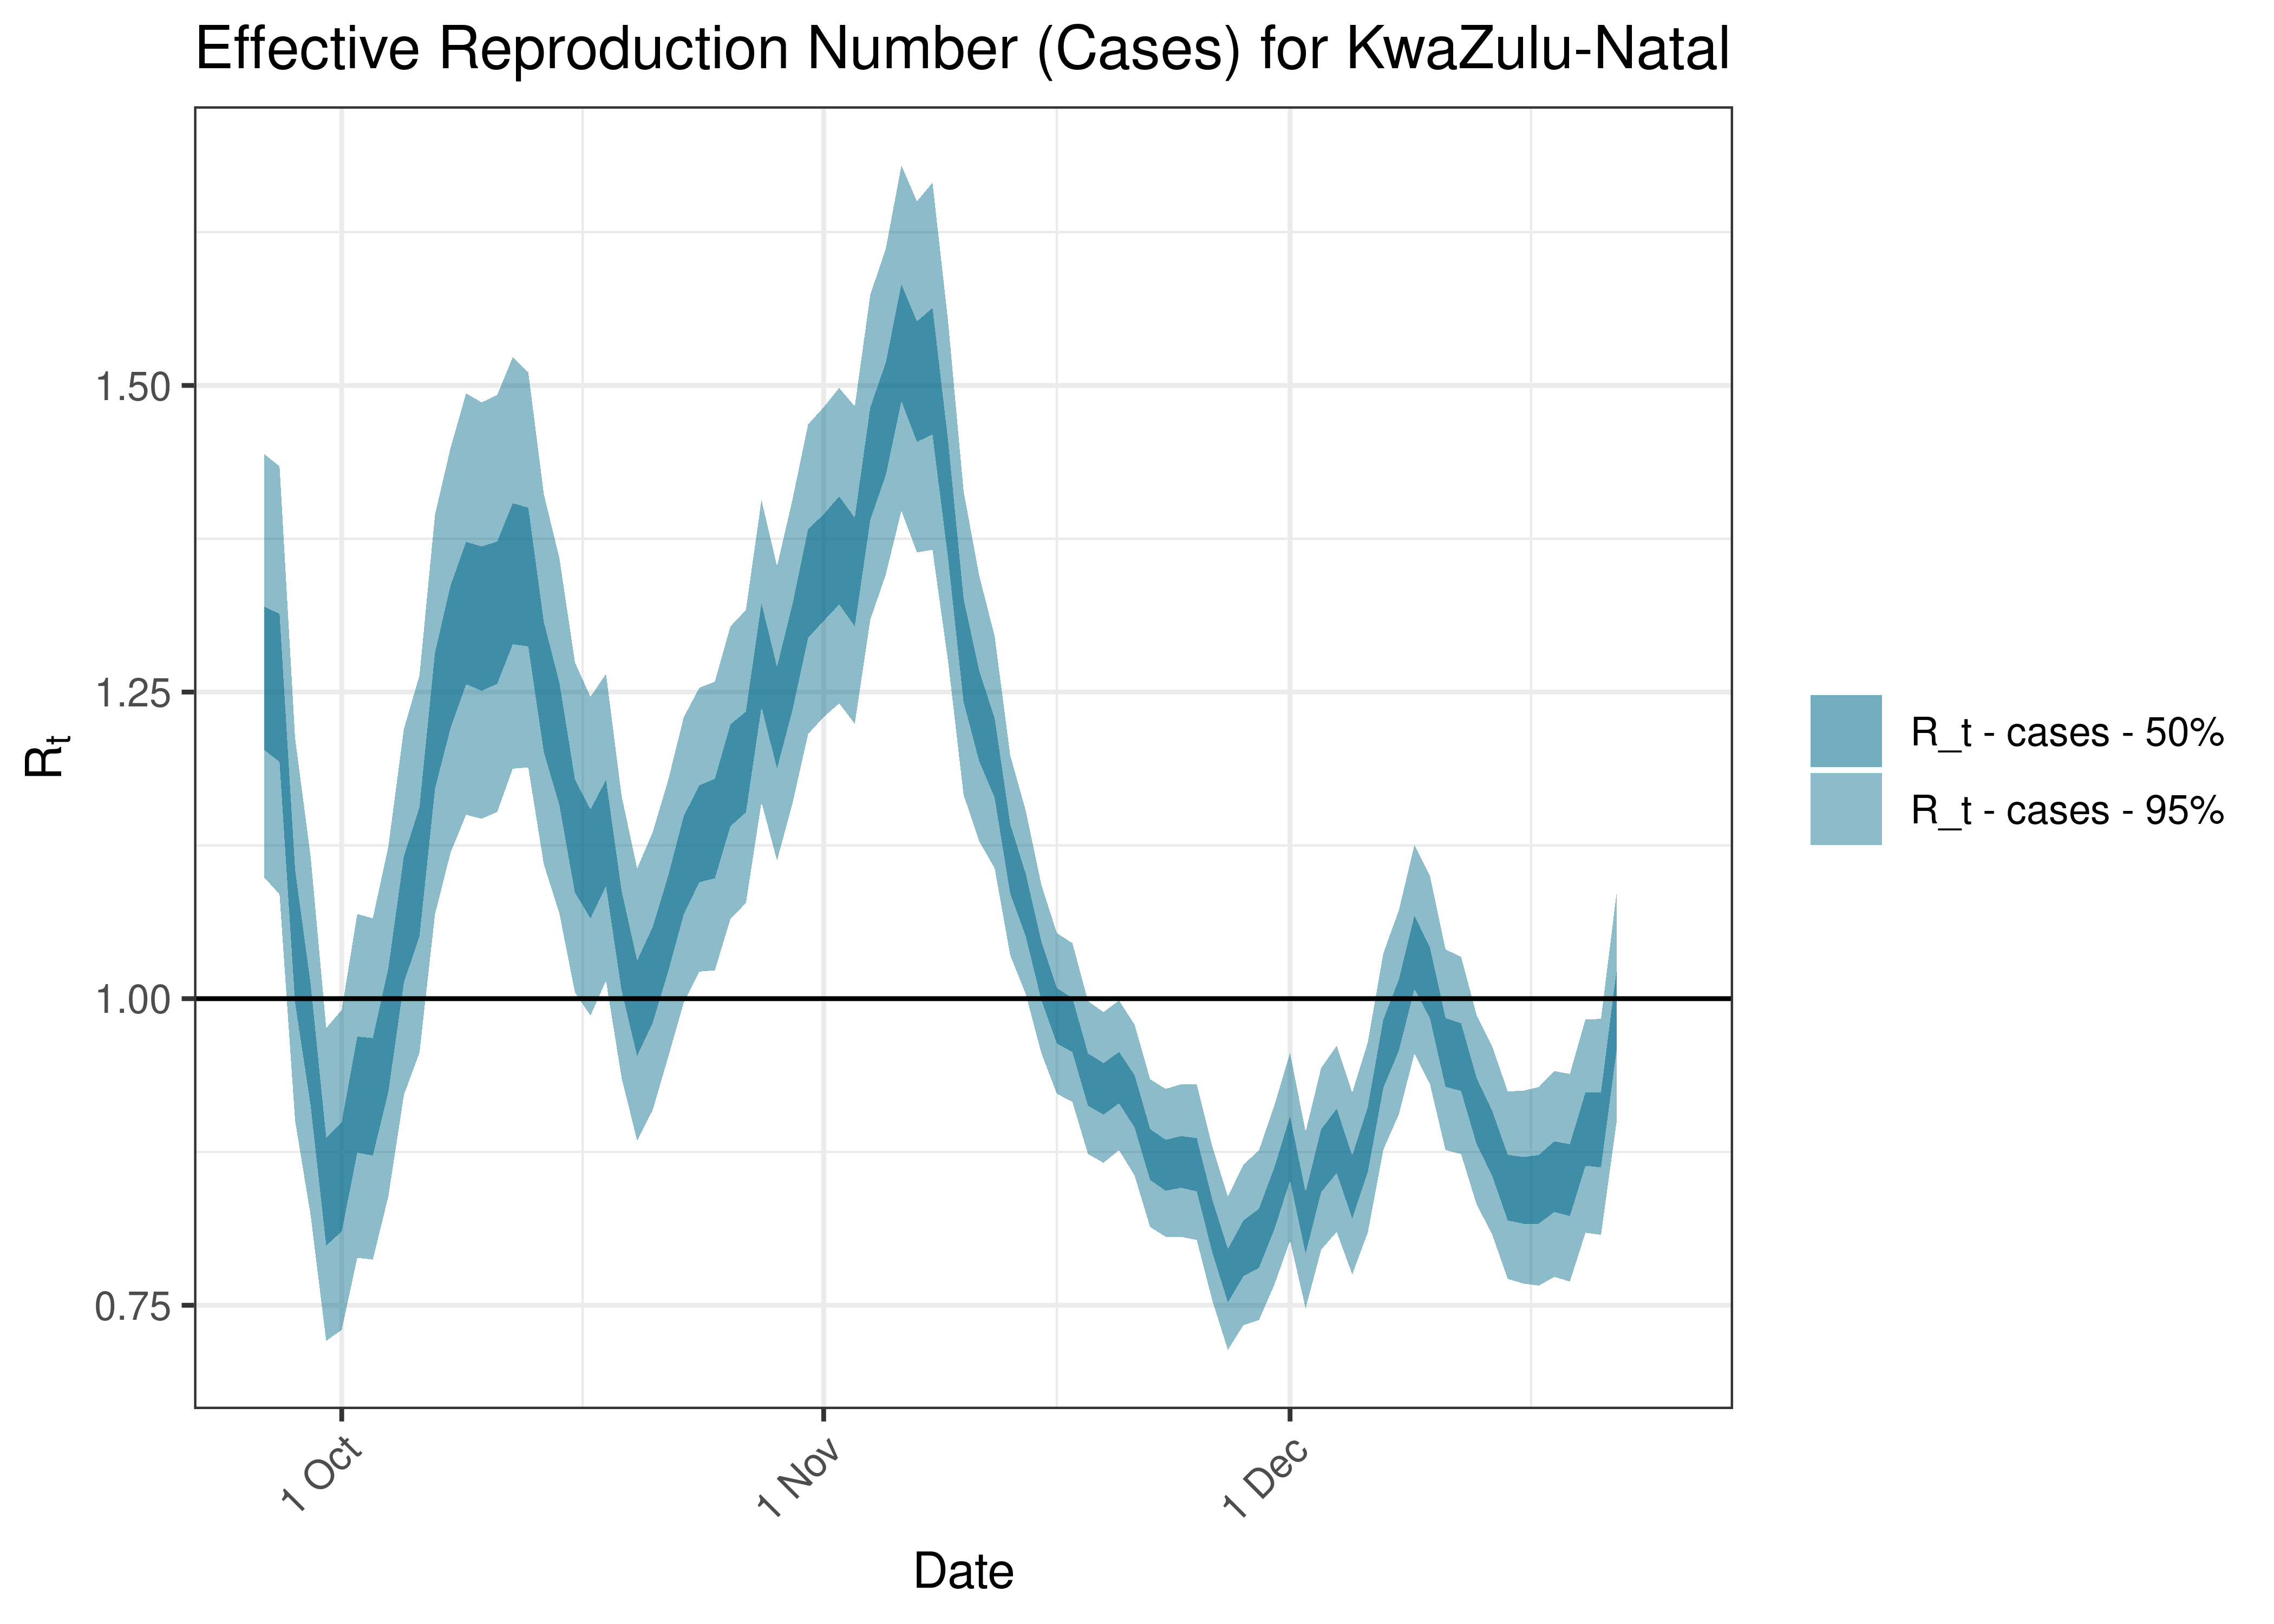
Estimated Effective Reproduction Number Based on Cases for KwaZulu-Natal over last 90 days
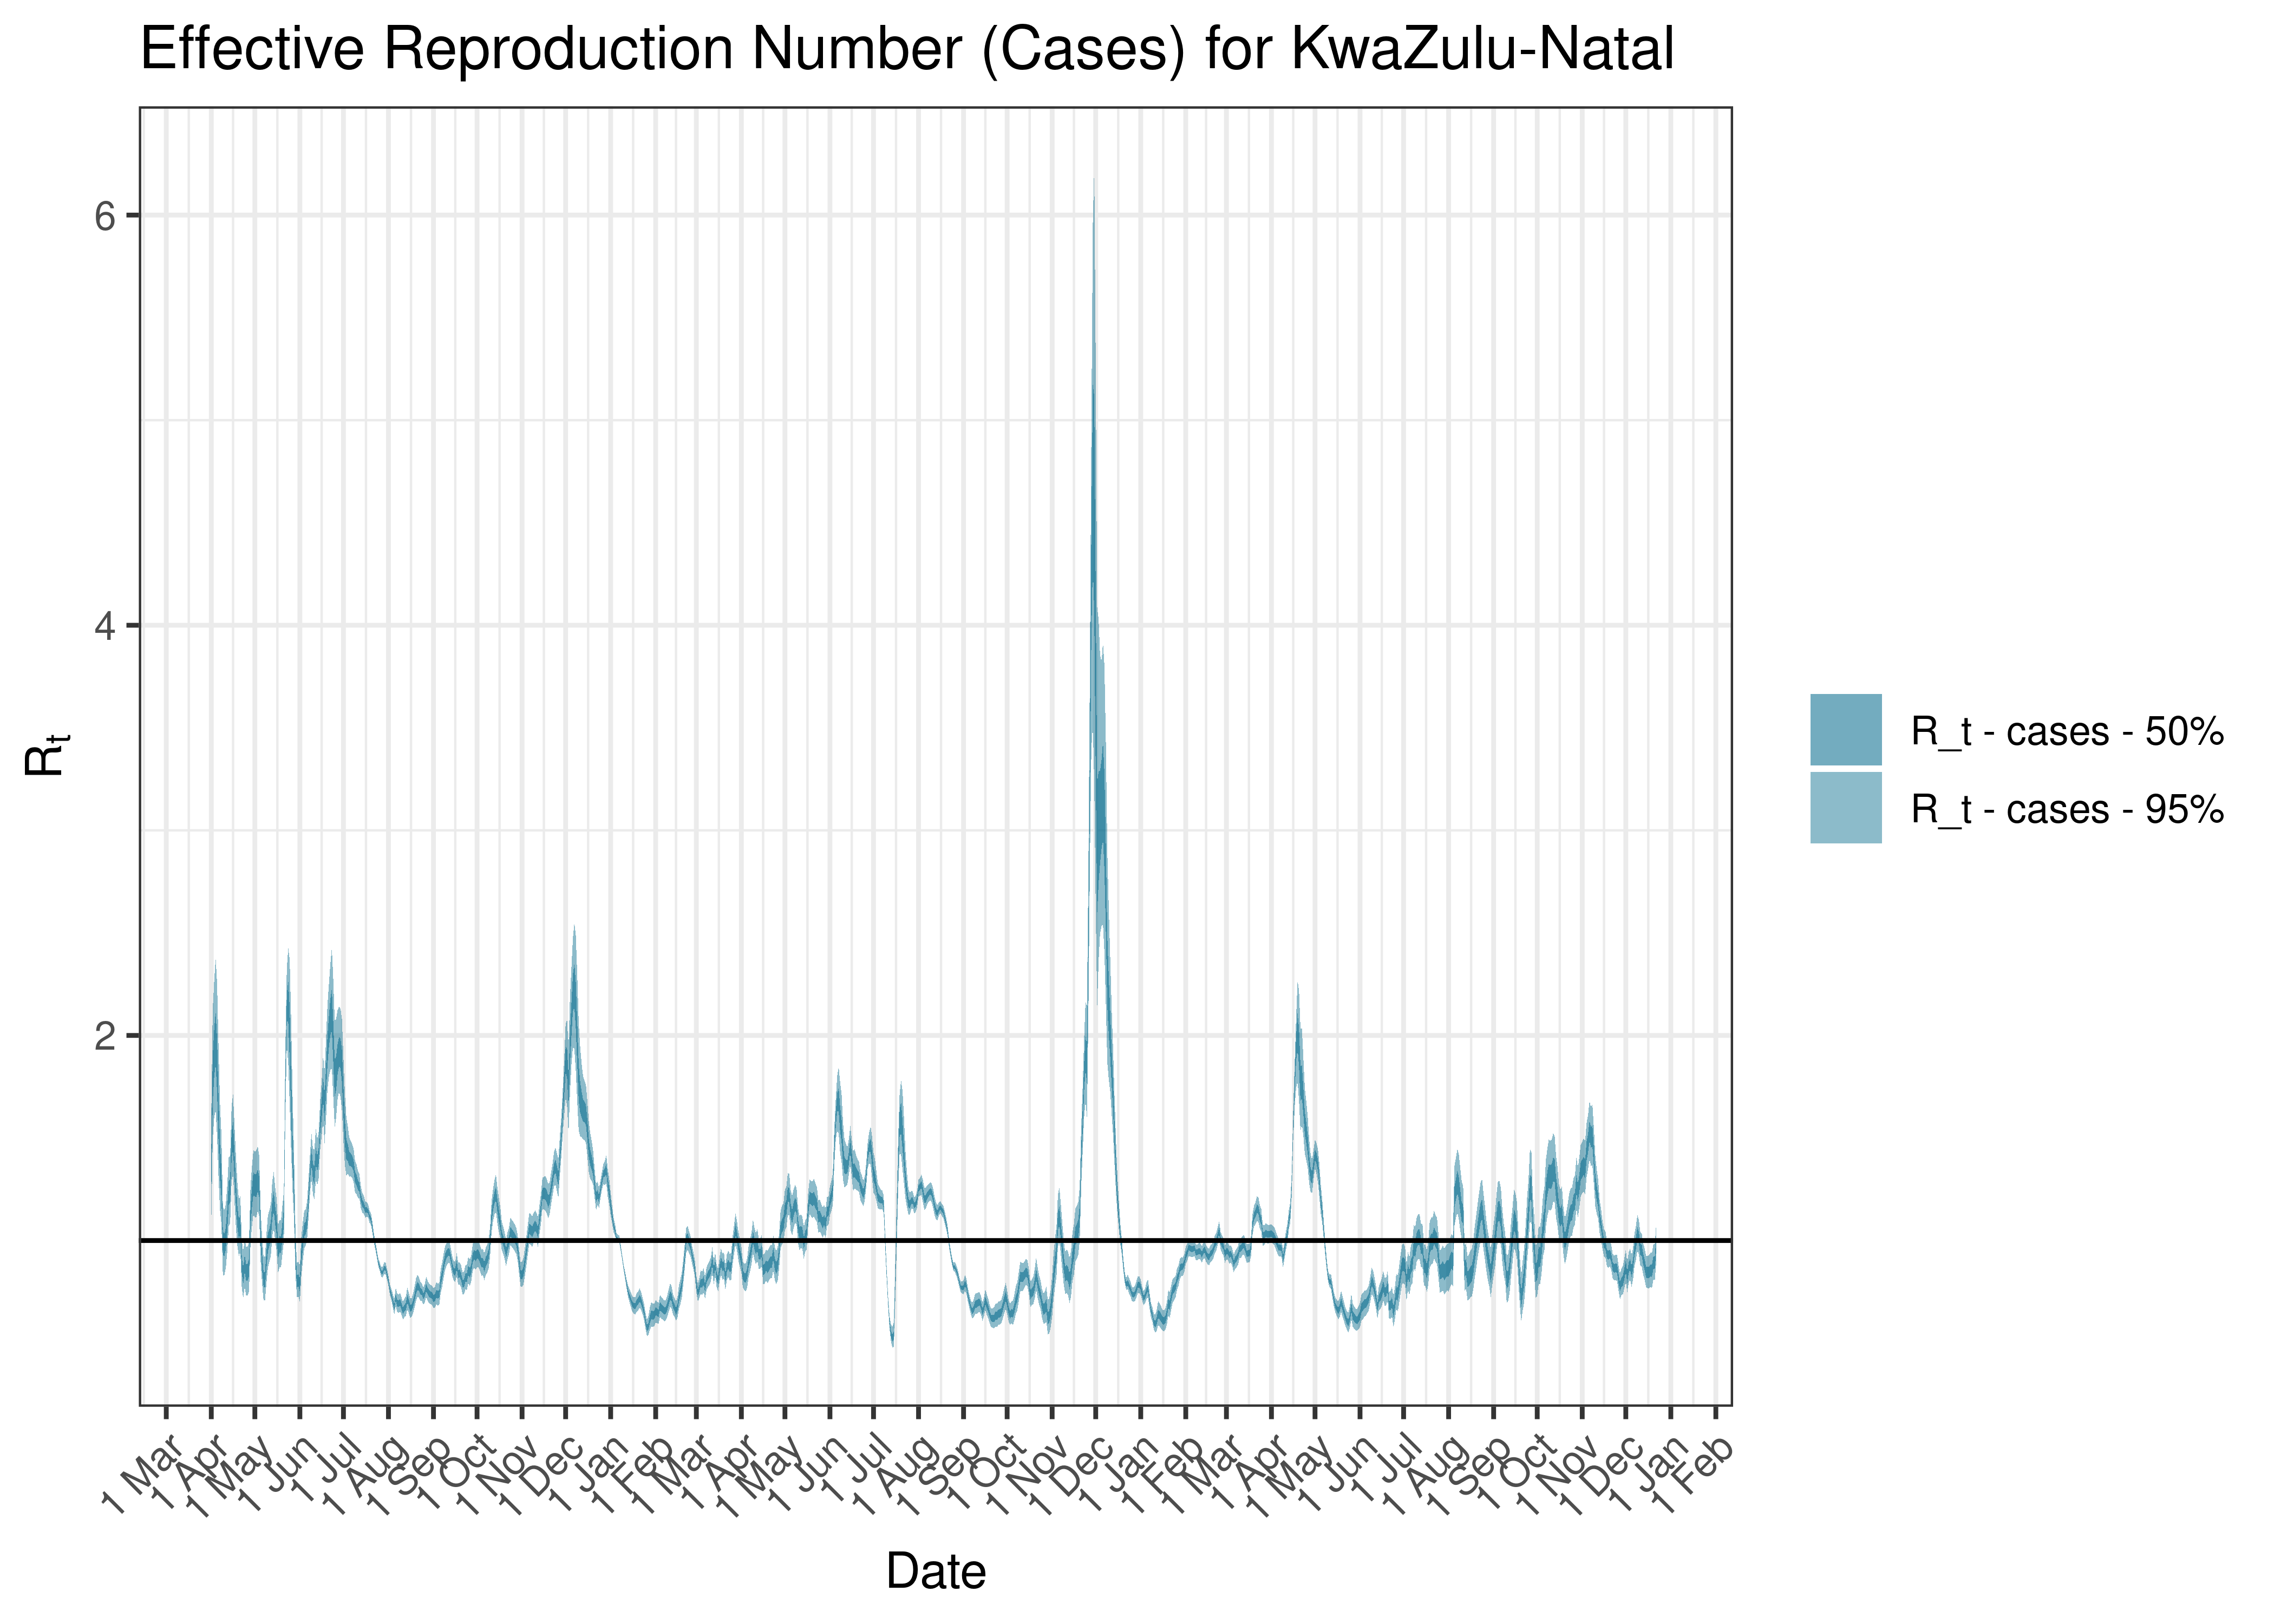
Estimated Effective Reproduction Number Based on Cases for KwaZulu-Natal since 1 April 2020
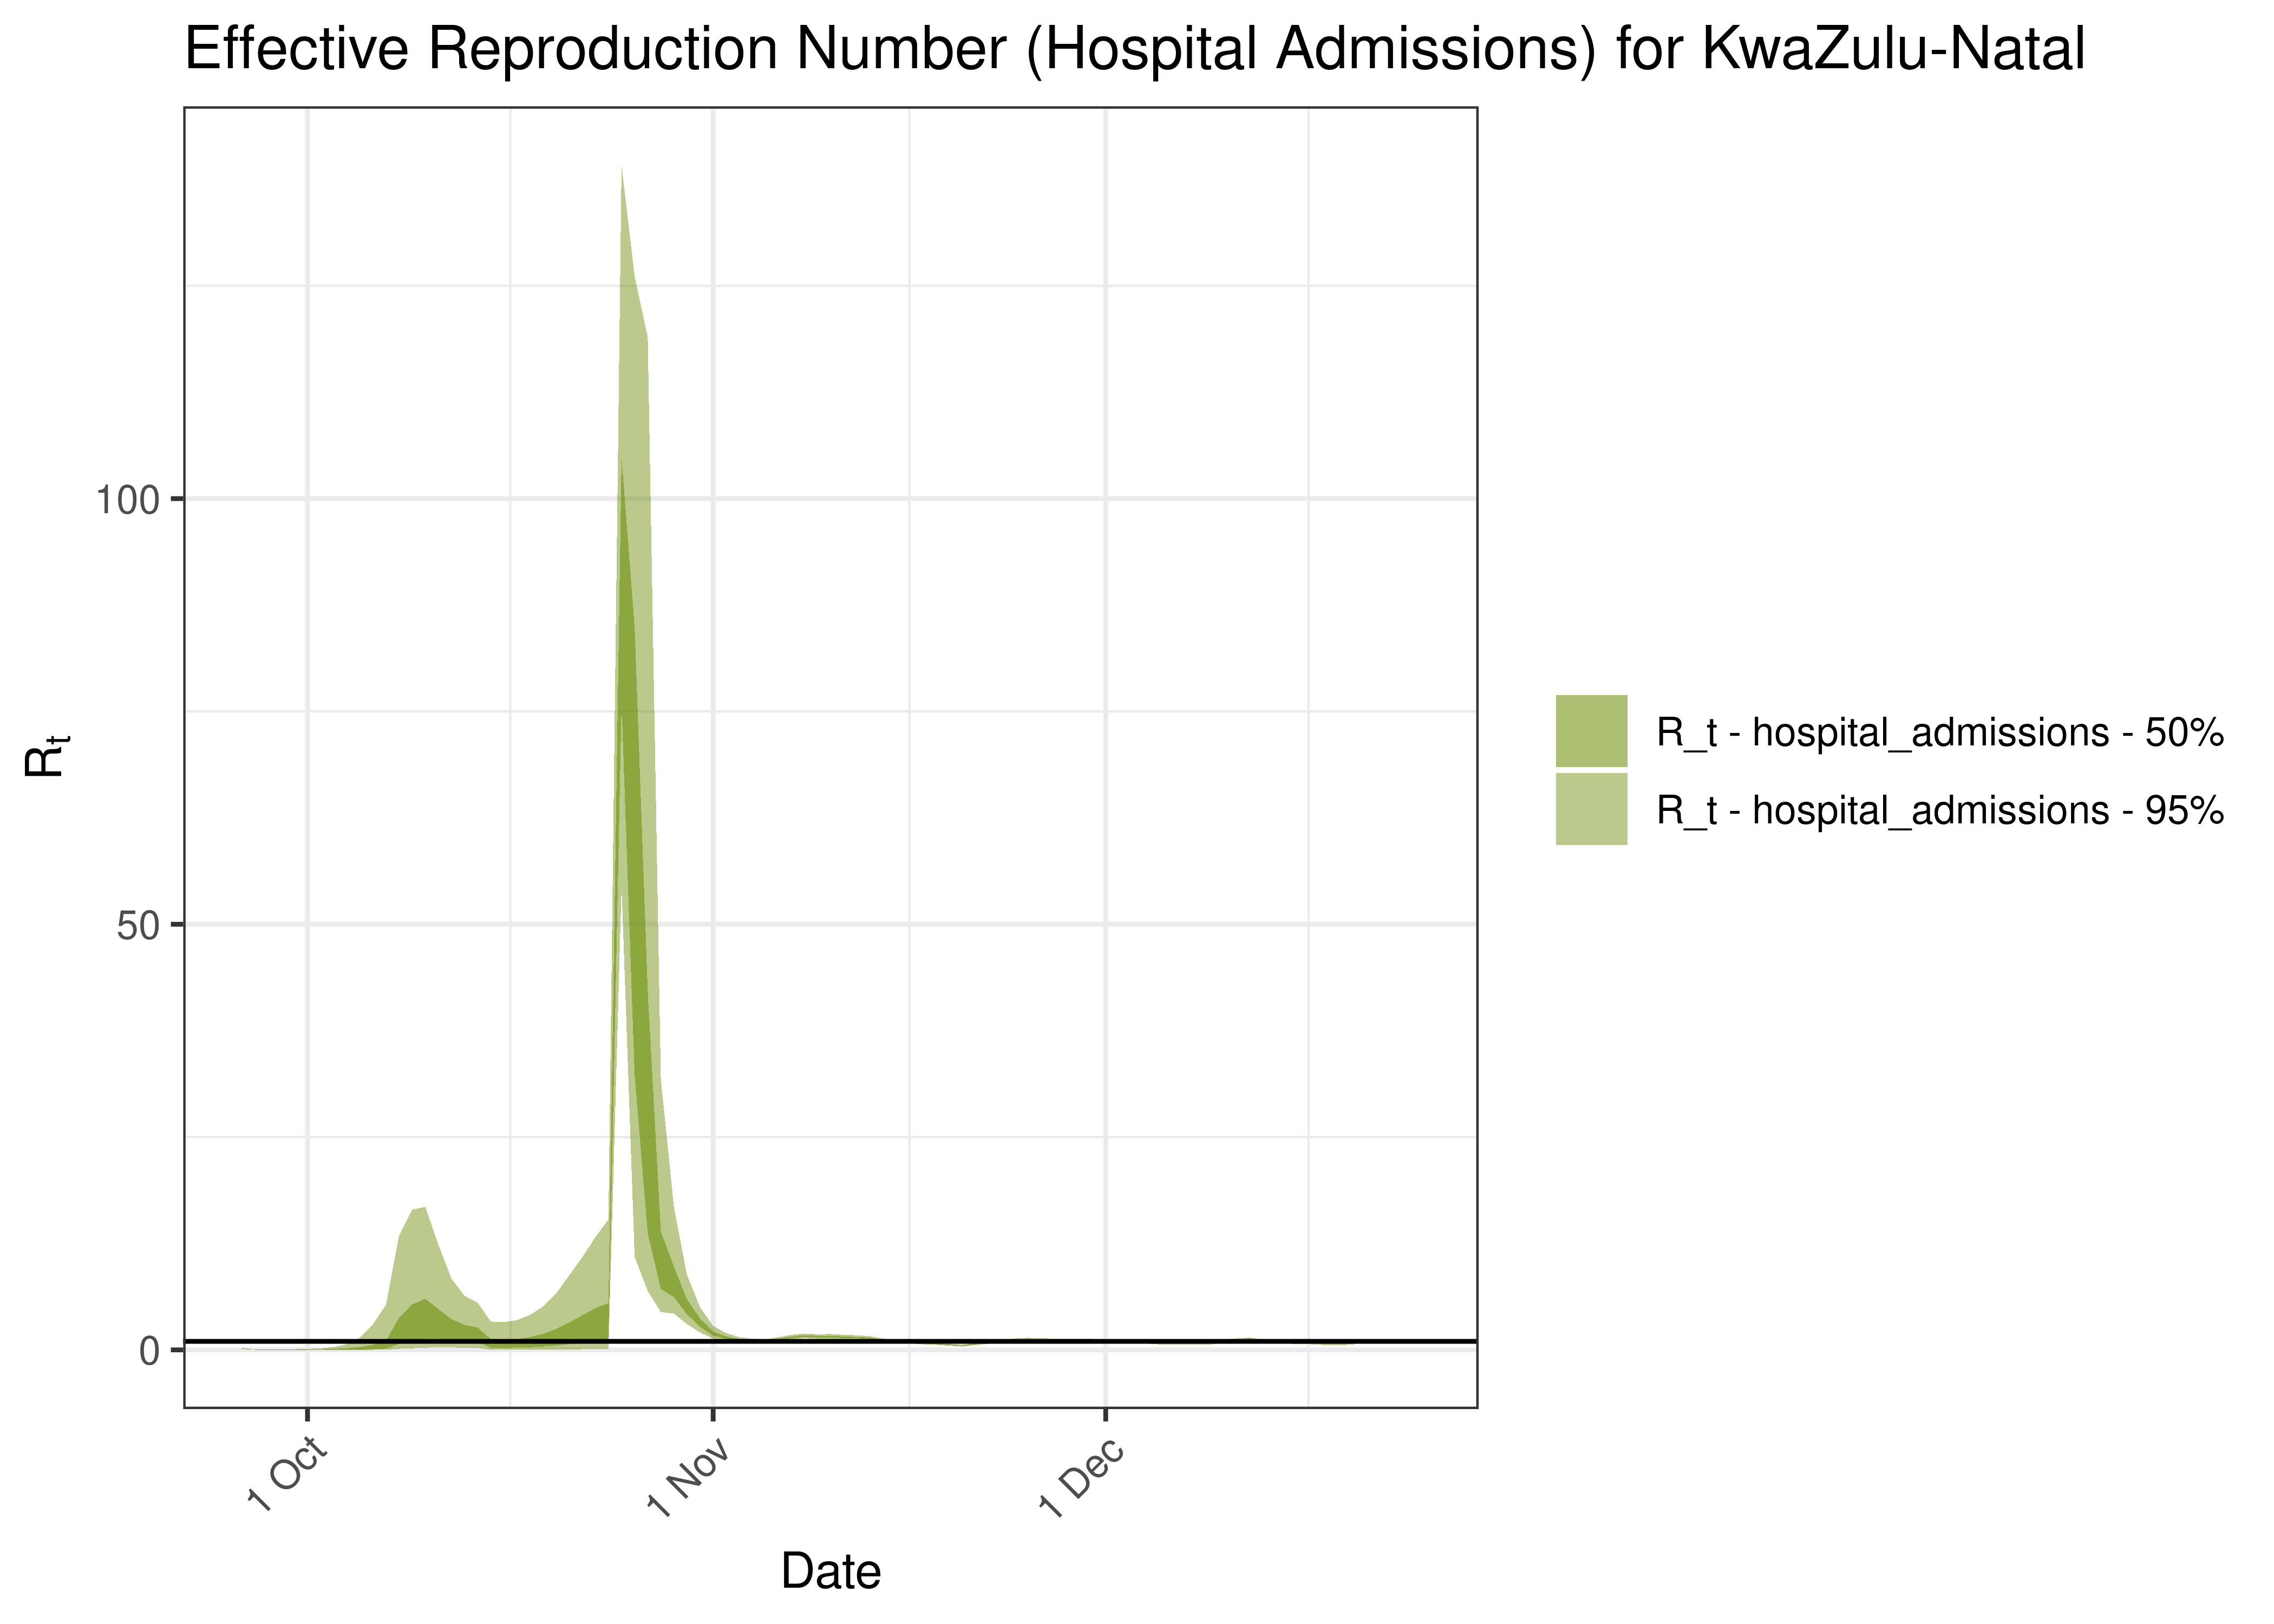
Estimated Effective Reproduction Number Based on Hospital Admissions for KwaZulu-Natal over last 90 days
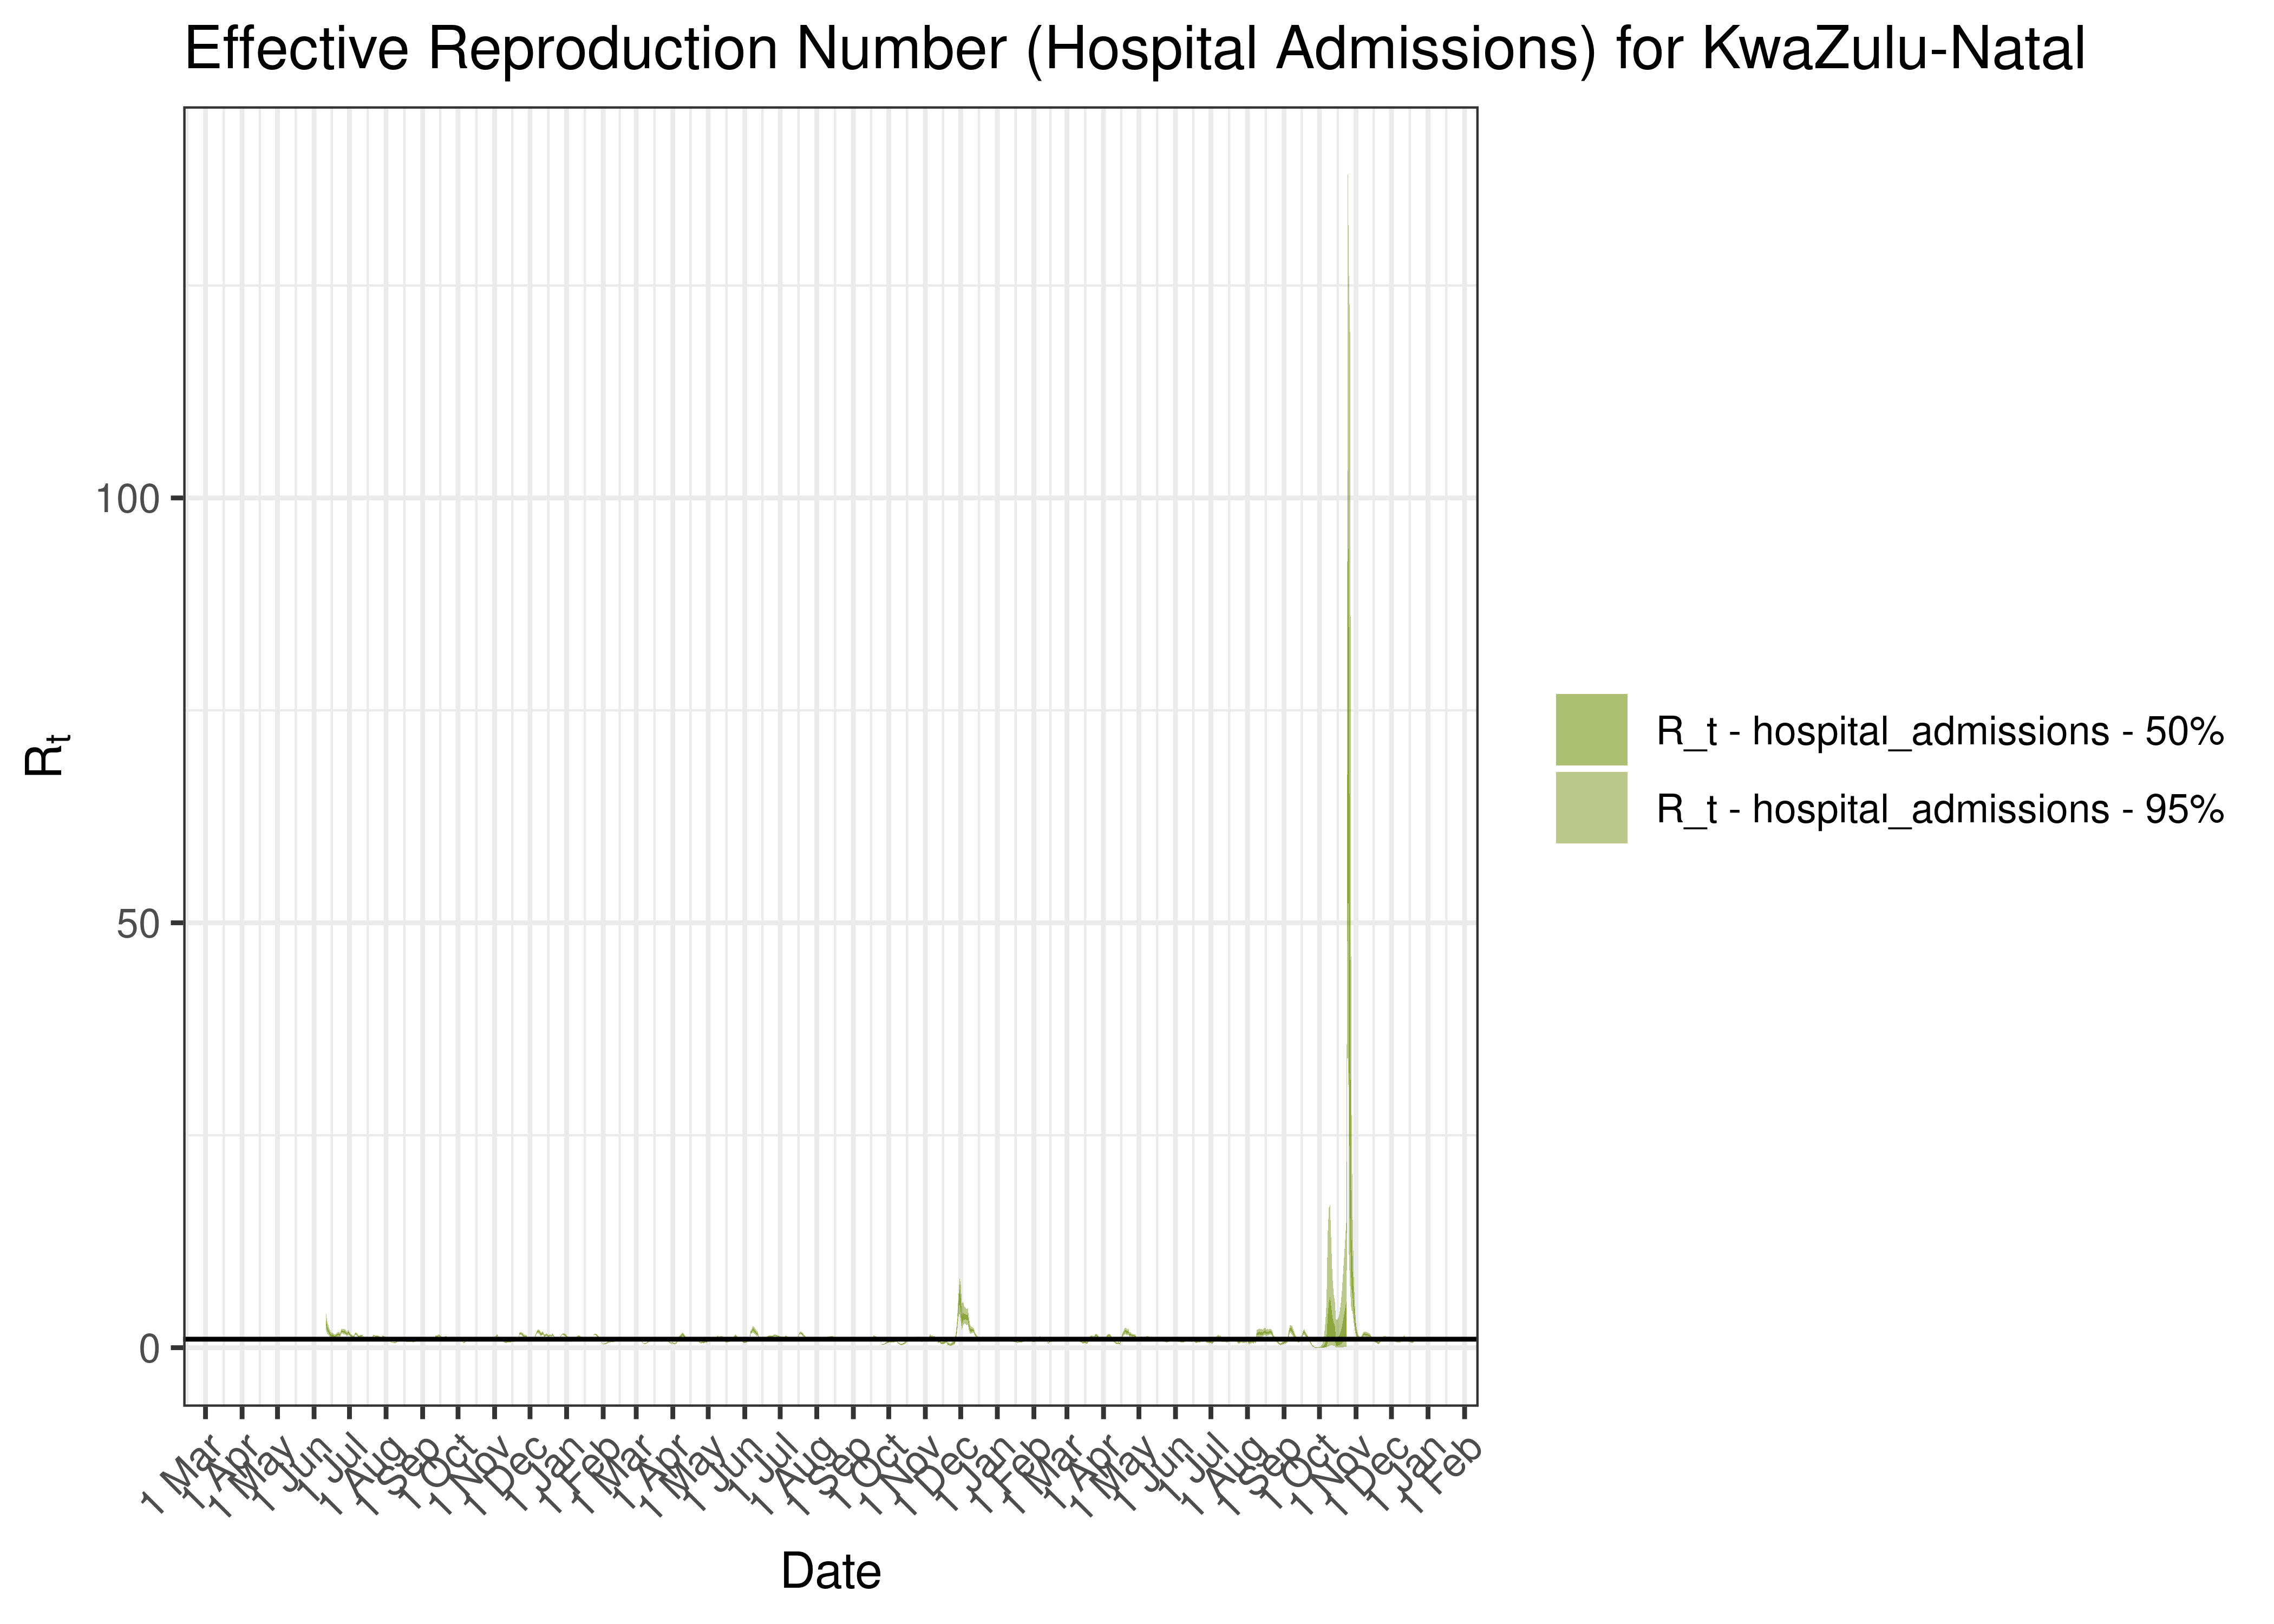
Estimated Effective Reproduction Number Based on Hospital Admissions for KwaZulu-Natal since 1 April 2020
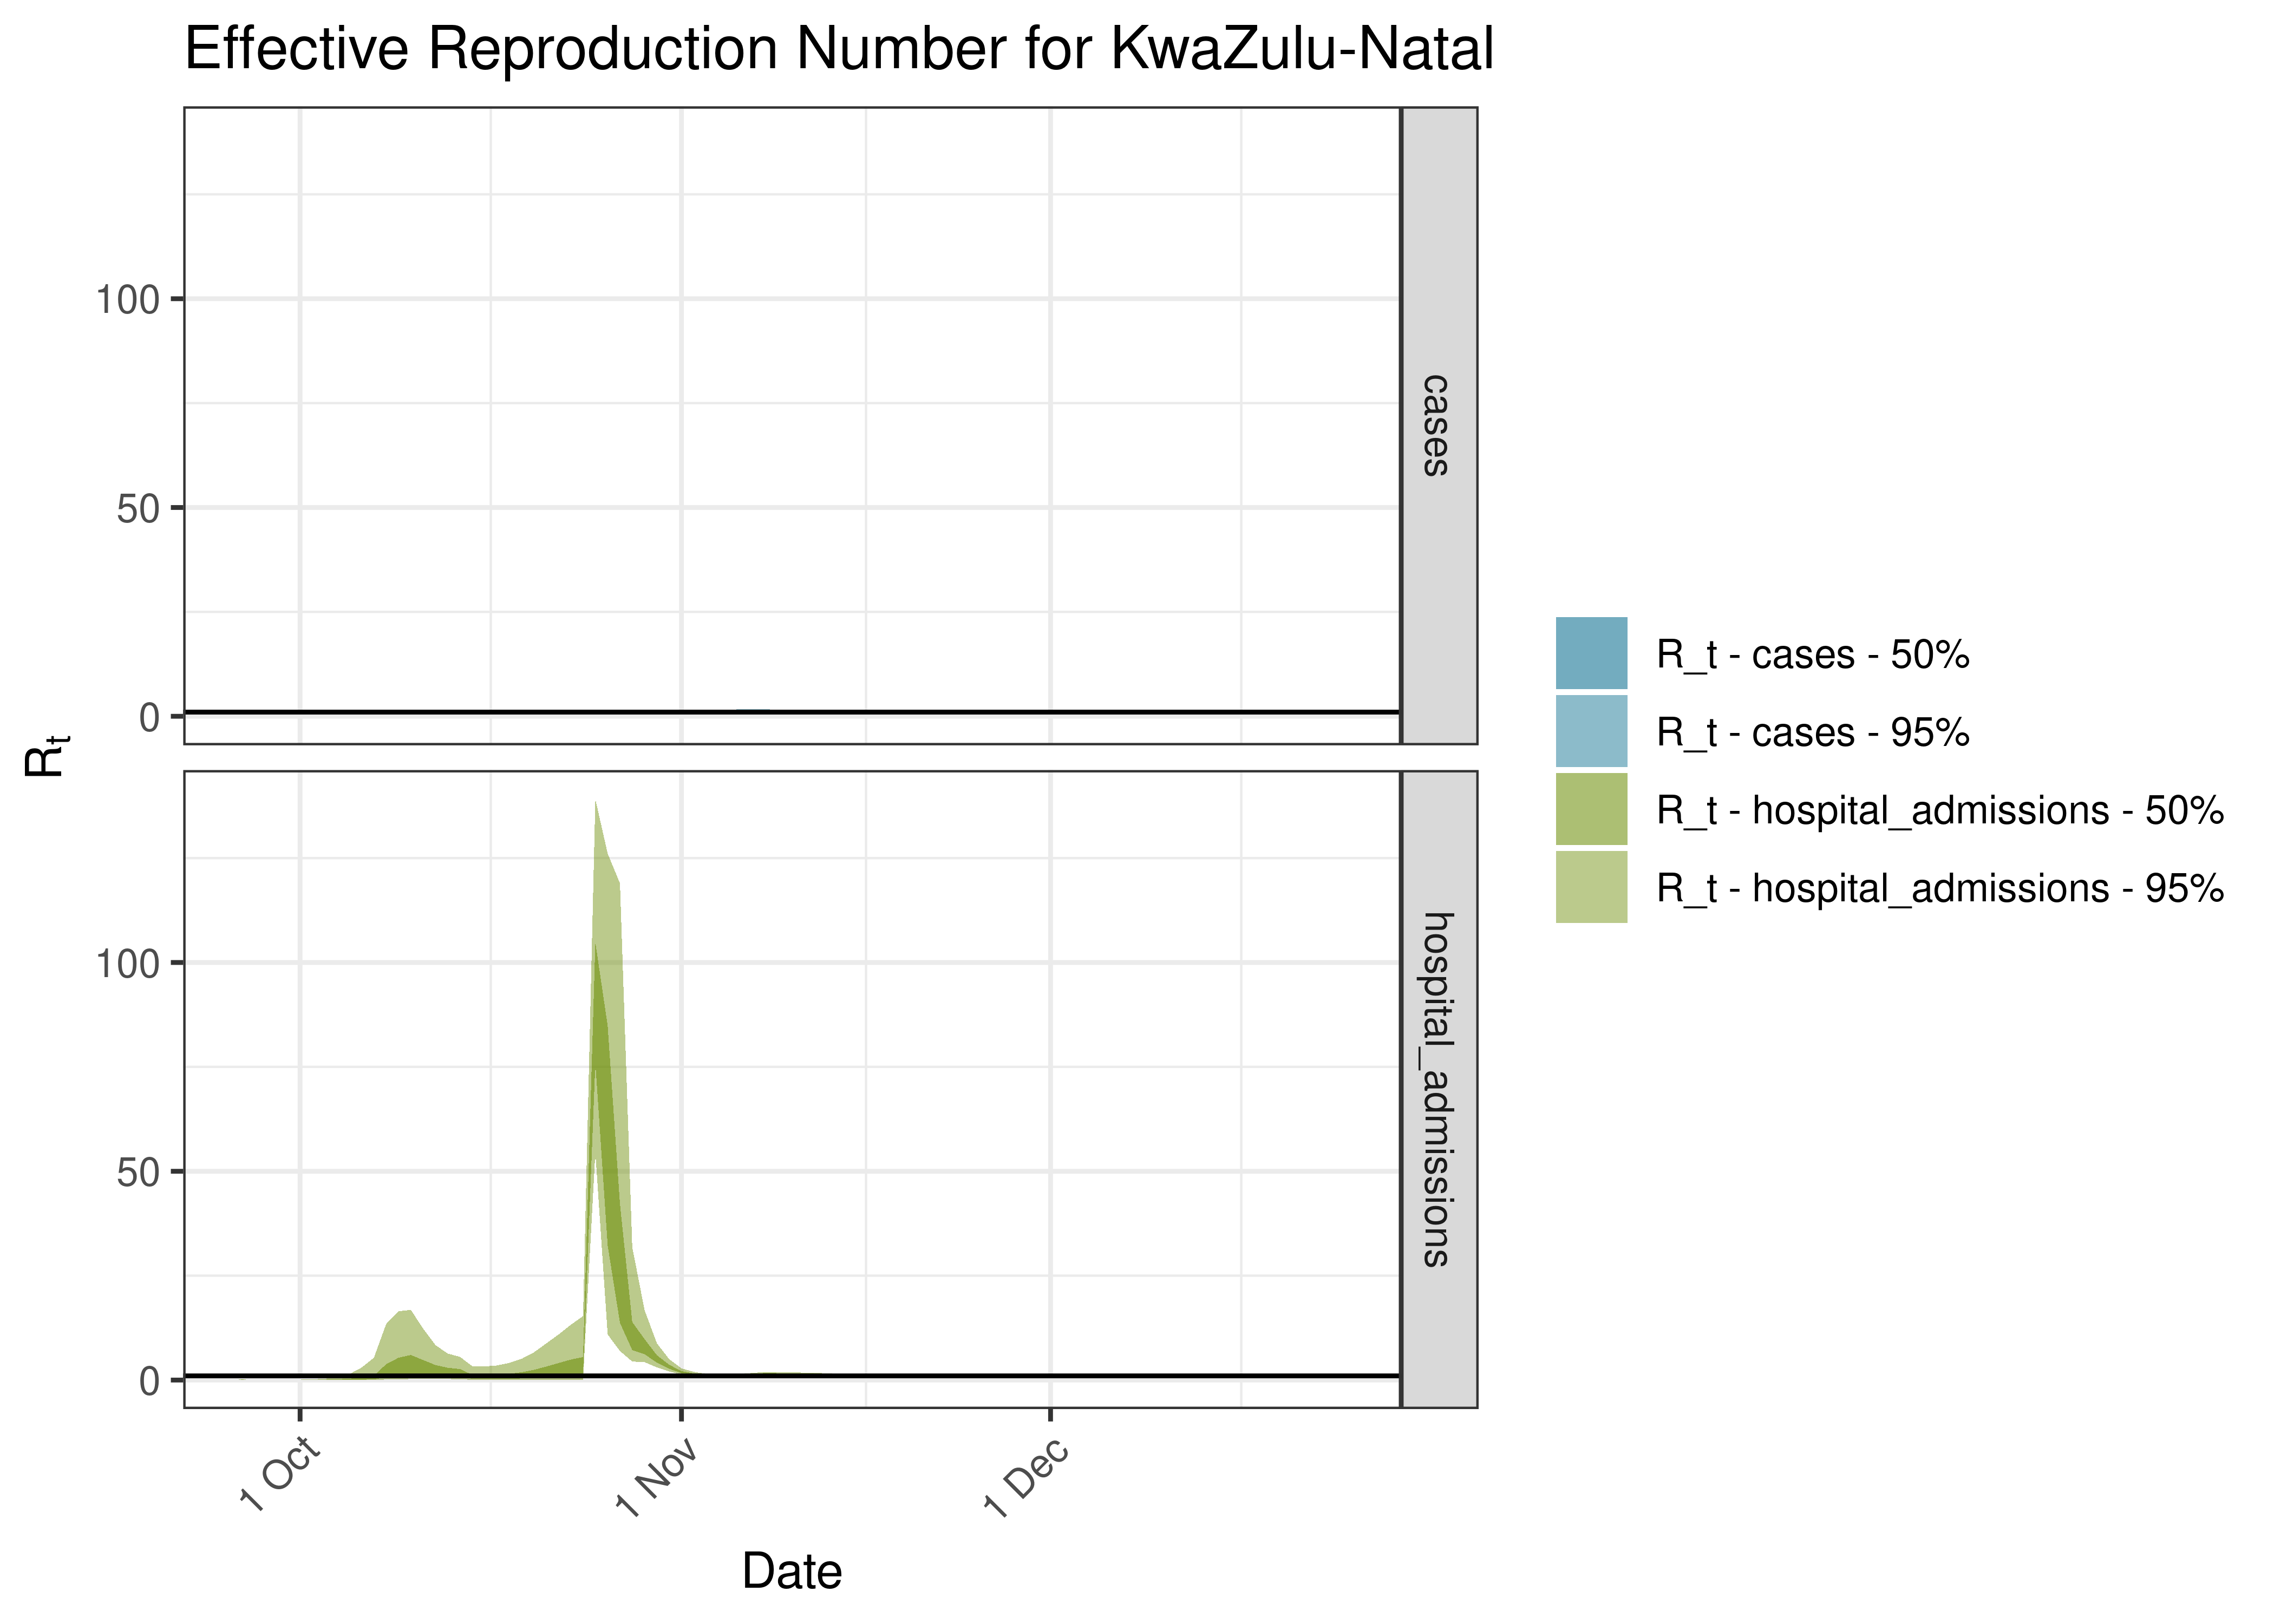
Estimated Effective Reproduction Number for KwaZulu-Natal over last 90 days
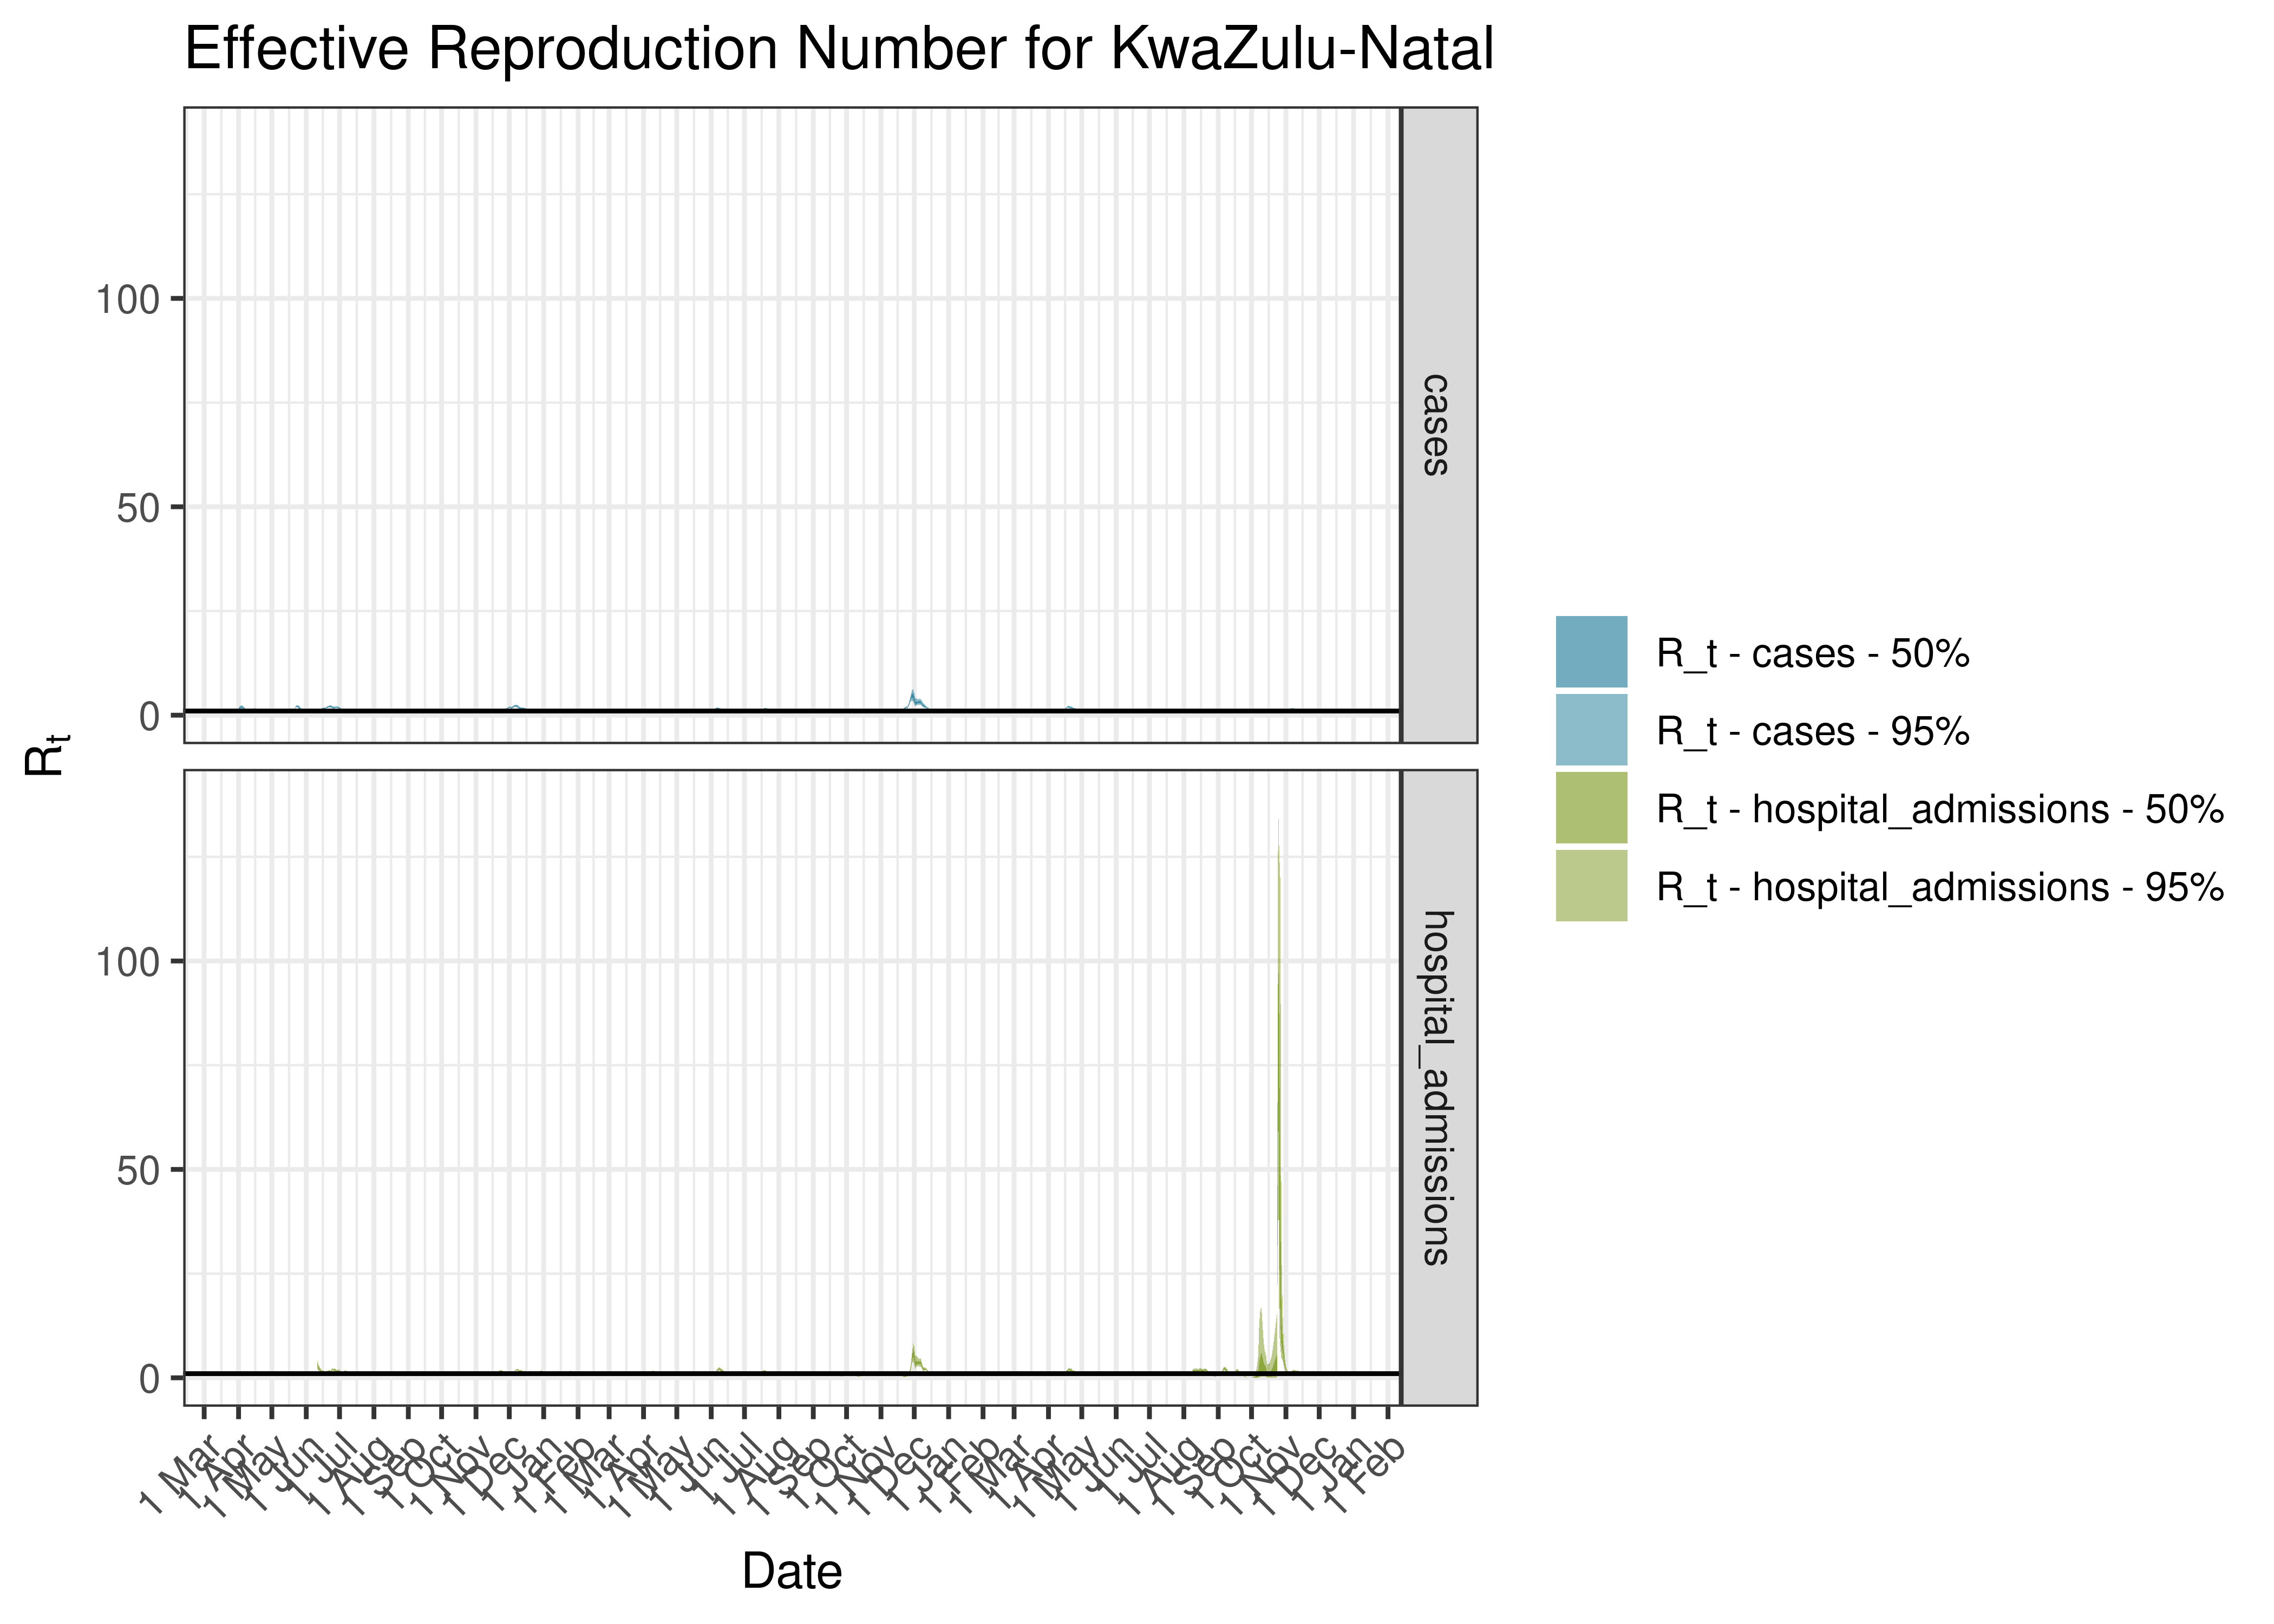
Estimated Effective Reproduction Number for KwaZulu-Natal since 1 April 2020
6.5.8 Amajuba
6.5.8.1 Cases
Cases are tabulated by specimen received date below. Cases include estimates for late reporting in recent days as well as adjustments for any public holidays. A centred 7-day moving average is also shown. The peak daily cases in previous waves (as measured by the moving average) is also shown.
| Specimen Received Date | Cases | 7-day Moving Average | Comment |
|---|---|---|---|
| 2020-07-12 | 82 | 211 | Wave 1 Peak |
| 2021-01-08 | 141 | 128 | Wave 2 Peak |
| 2021-07-08 | 190 | 151 | Wave 3 Peak |
| 2021-12-13 | 180 | 149 | Wave 4 Peak |
| 2021-12-14 | 158 | 149 | Wave 4 Peak |
| 2022-05-06 | 26 | 21 | Wave 5 Peak (to date) |
Below a 7-day moving average daily case count are plotted for Amajuba on a log scale since start of the epidemic:
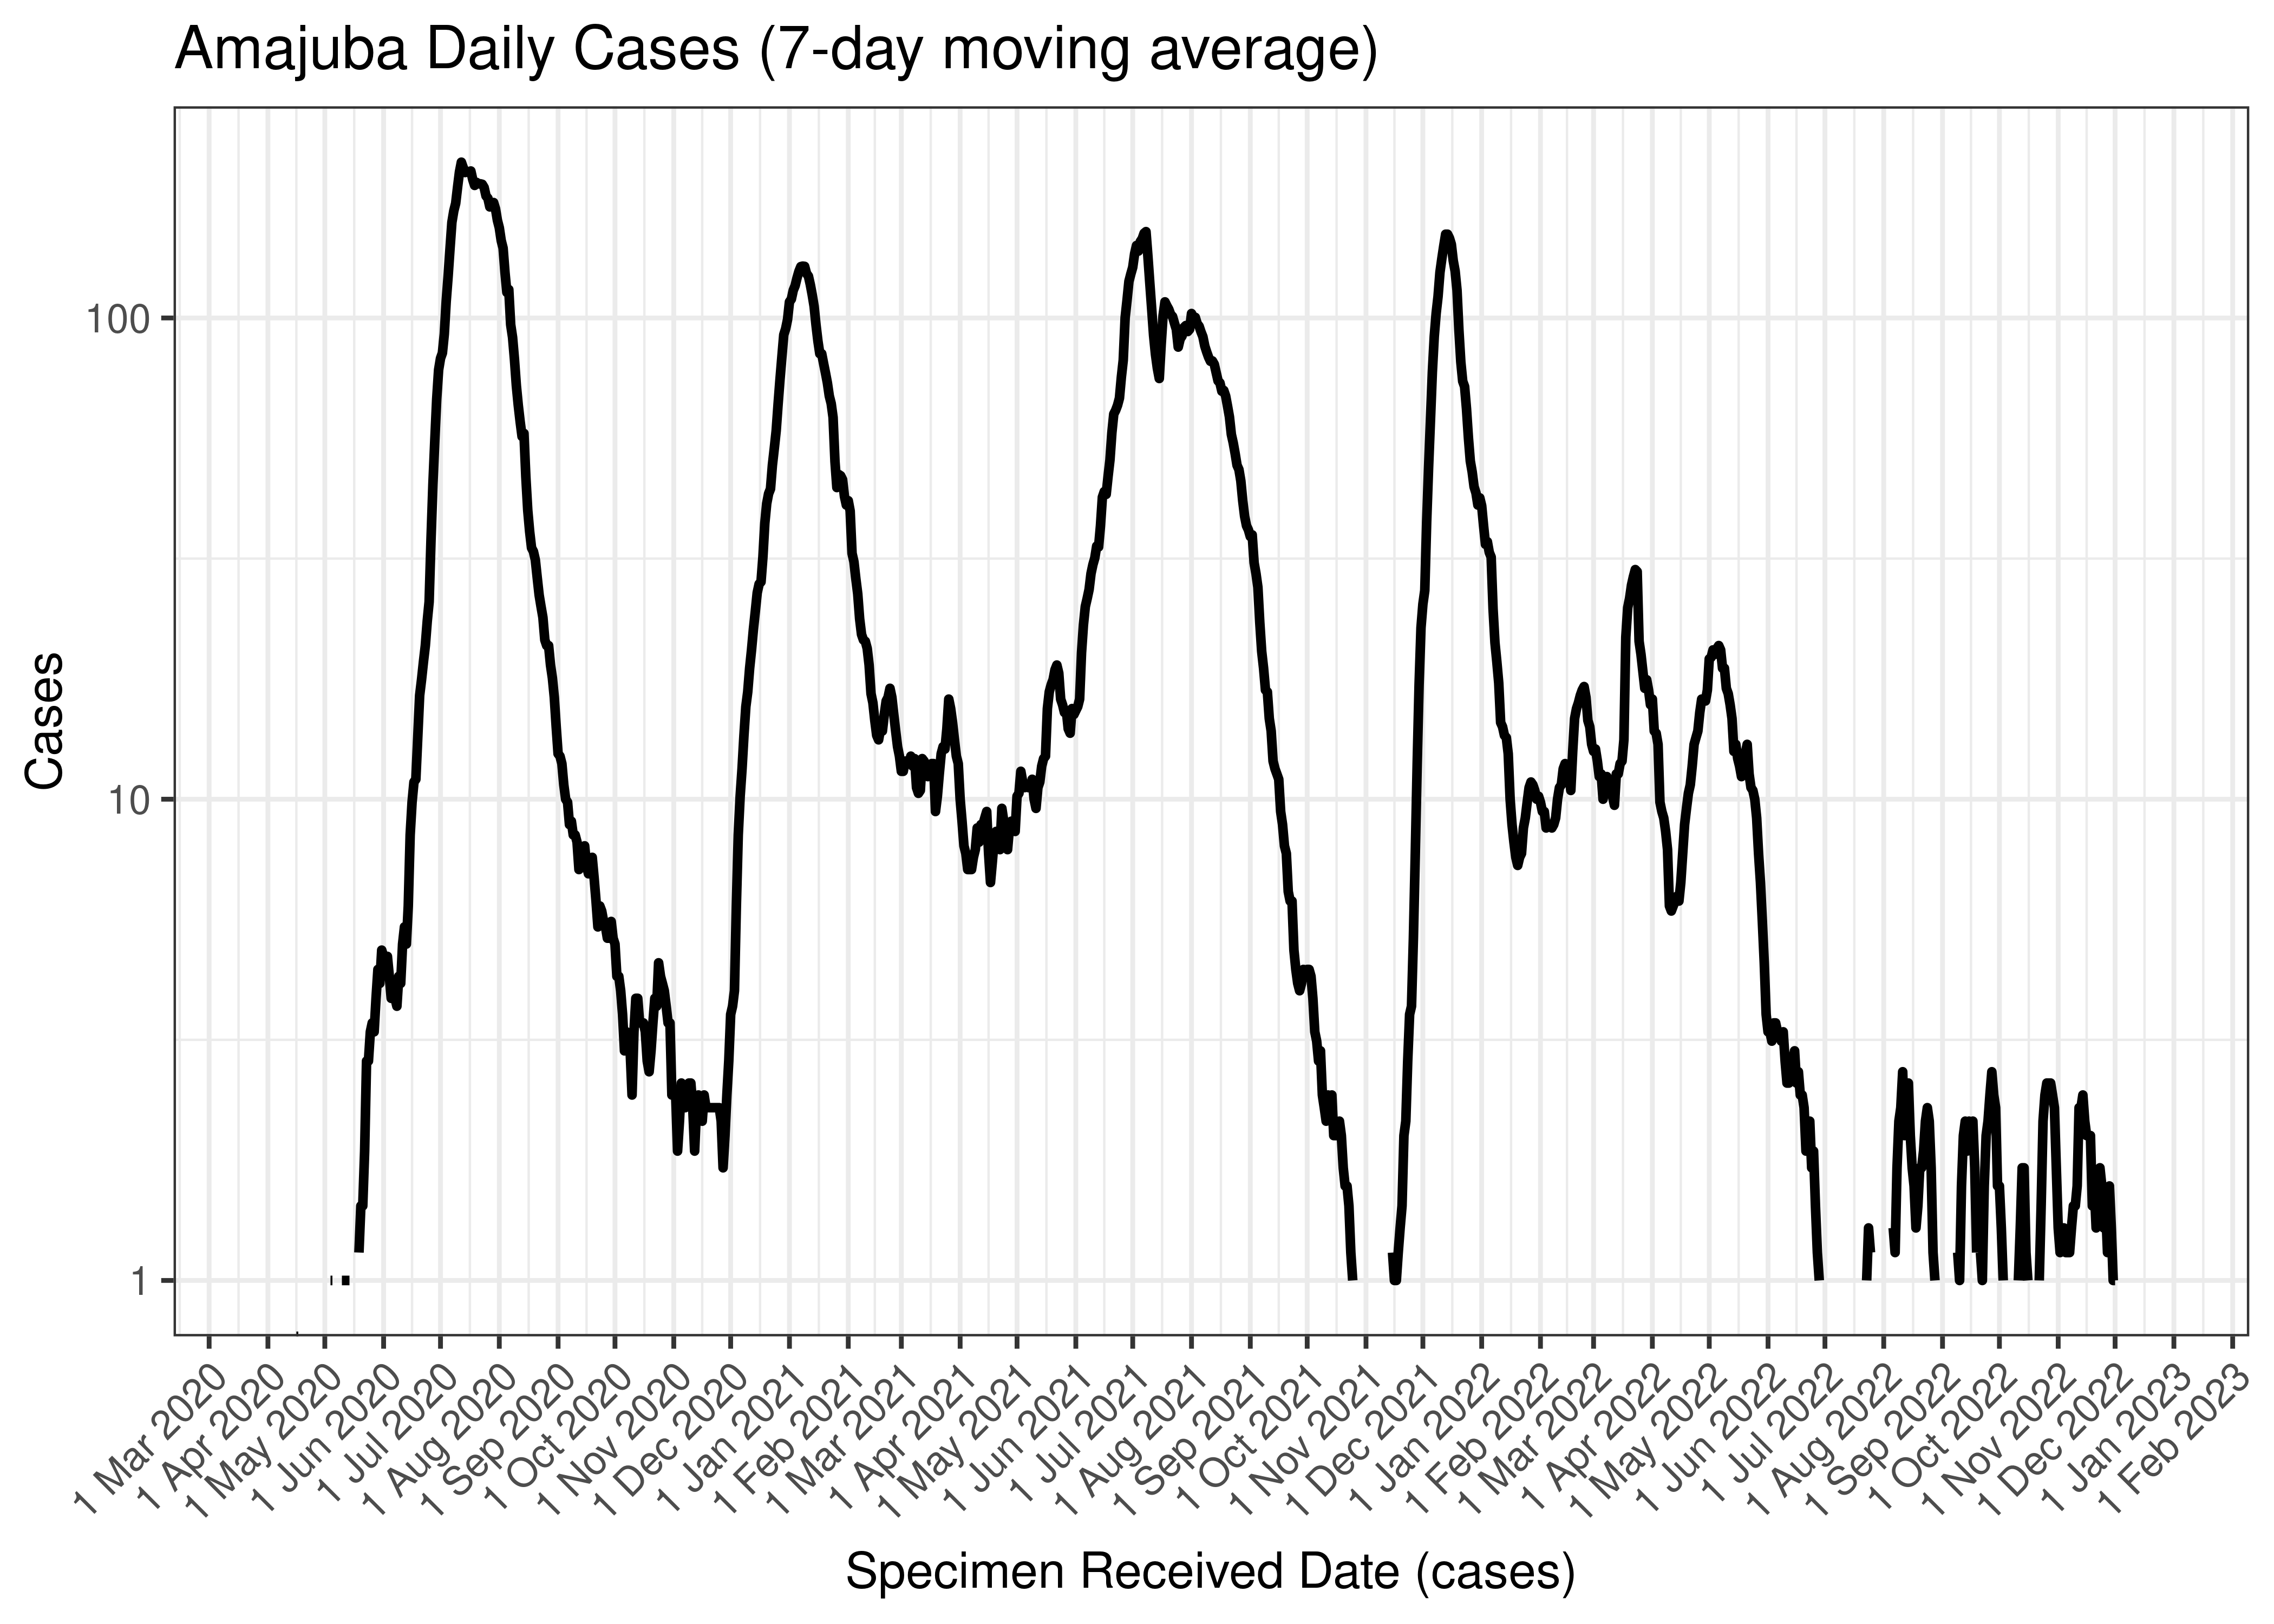
Amajuba Daily Cases (7-day moving average)
Below the above chart is repeated for the last 30-days:

Amajuba Daily Cases for Last 30-days (7-day moving average)
6.5.8.2 Reproduction Number
Below current (last weekly) reproduction number estimates are tabulated for Amajuba.
| Count (Per Day) | Week Ending | Reproduction Number [95% Confidence Interval] | |
|---|---|---|---|
| Amajuba | 0.4 | 2022-12-25 | 1.08 [0.29 - 2.33] |
Below the effective reproduction number for Amajuba over the last 90 days are plotted together with a plot since start of the pandemic.
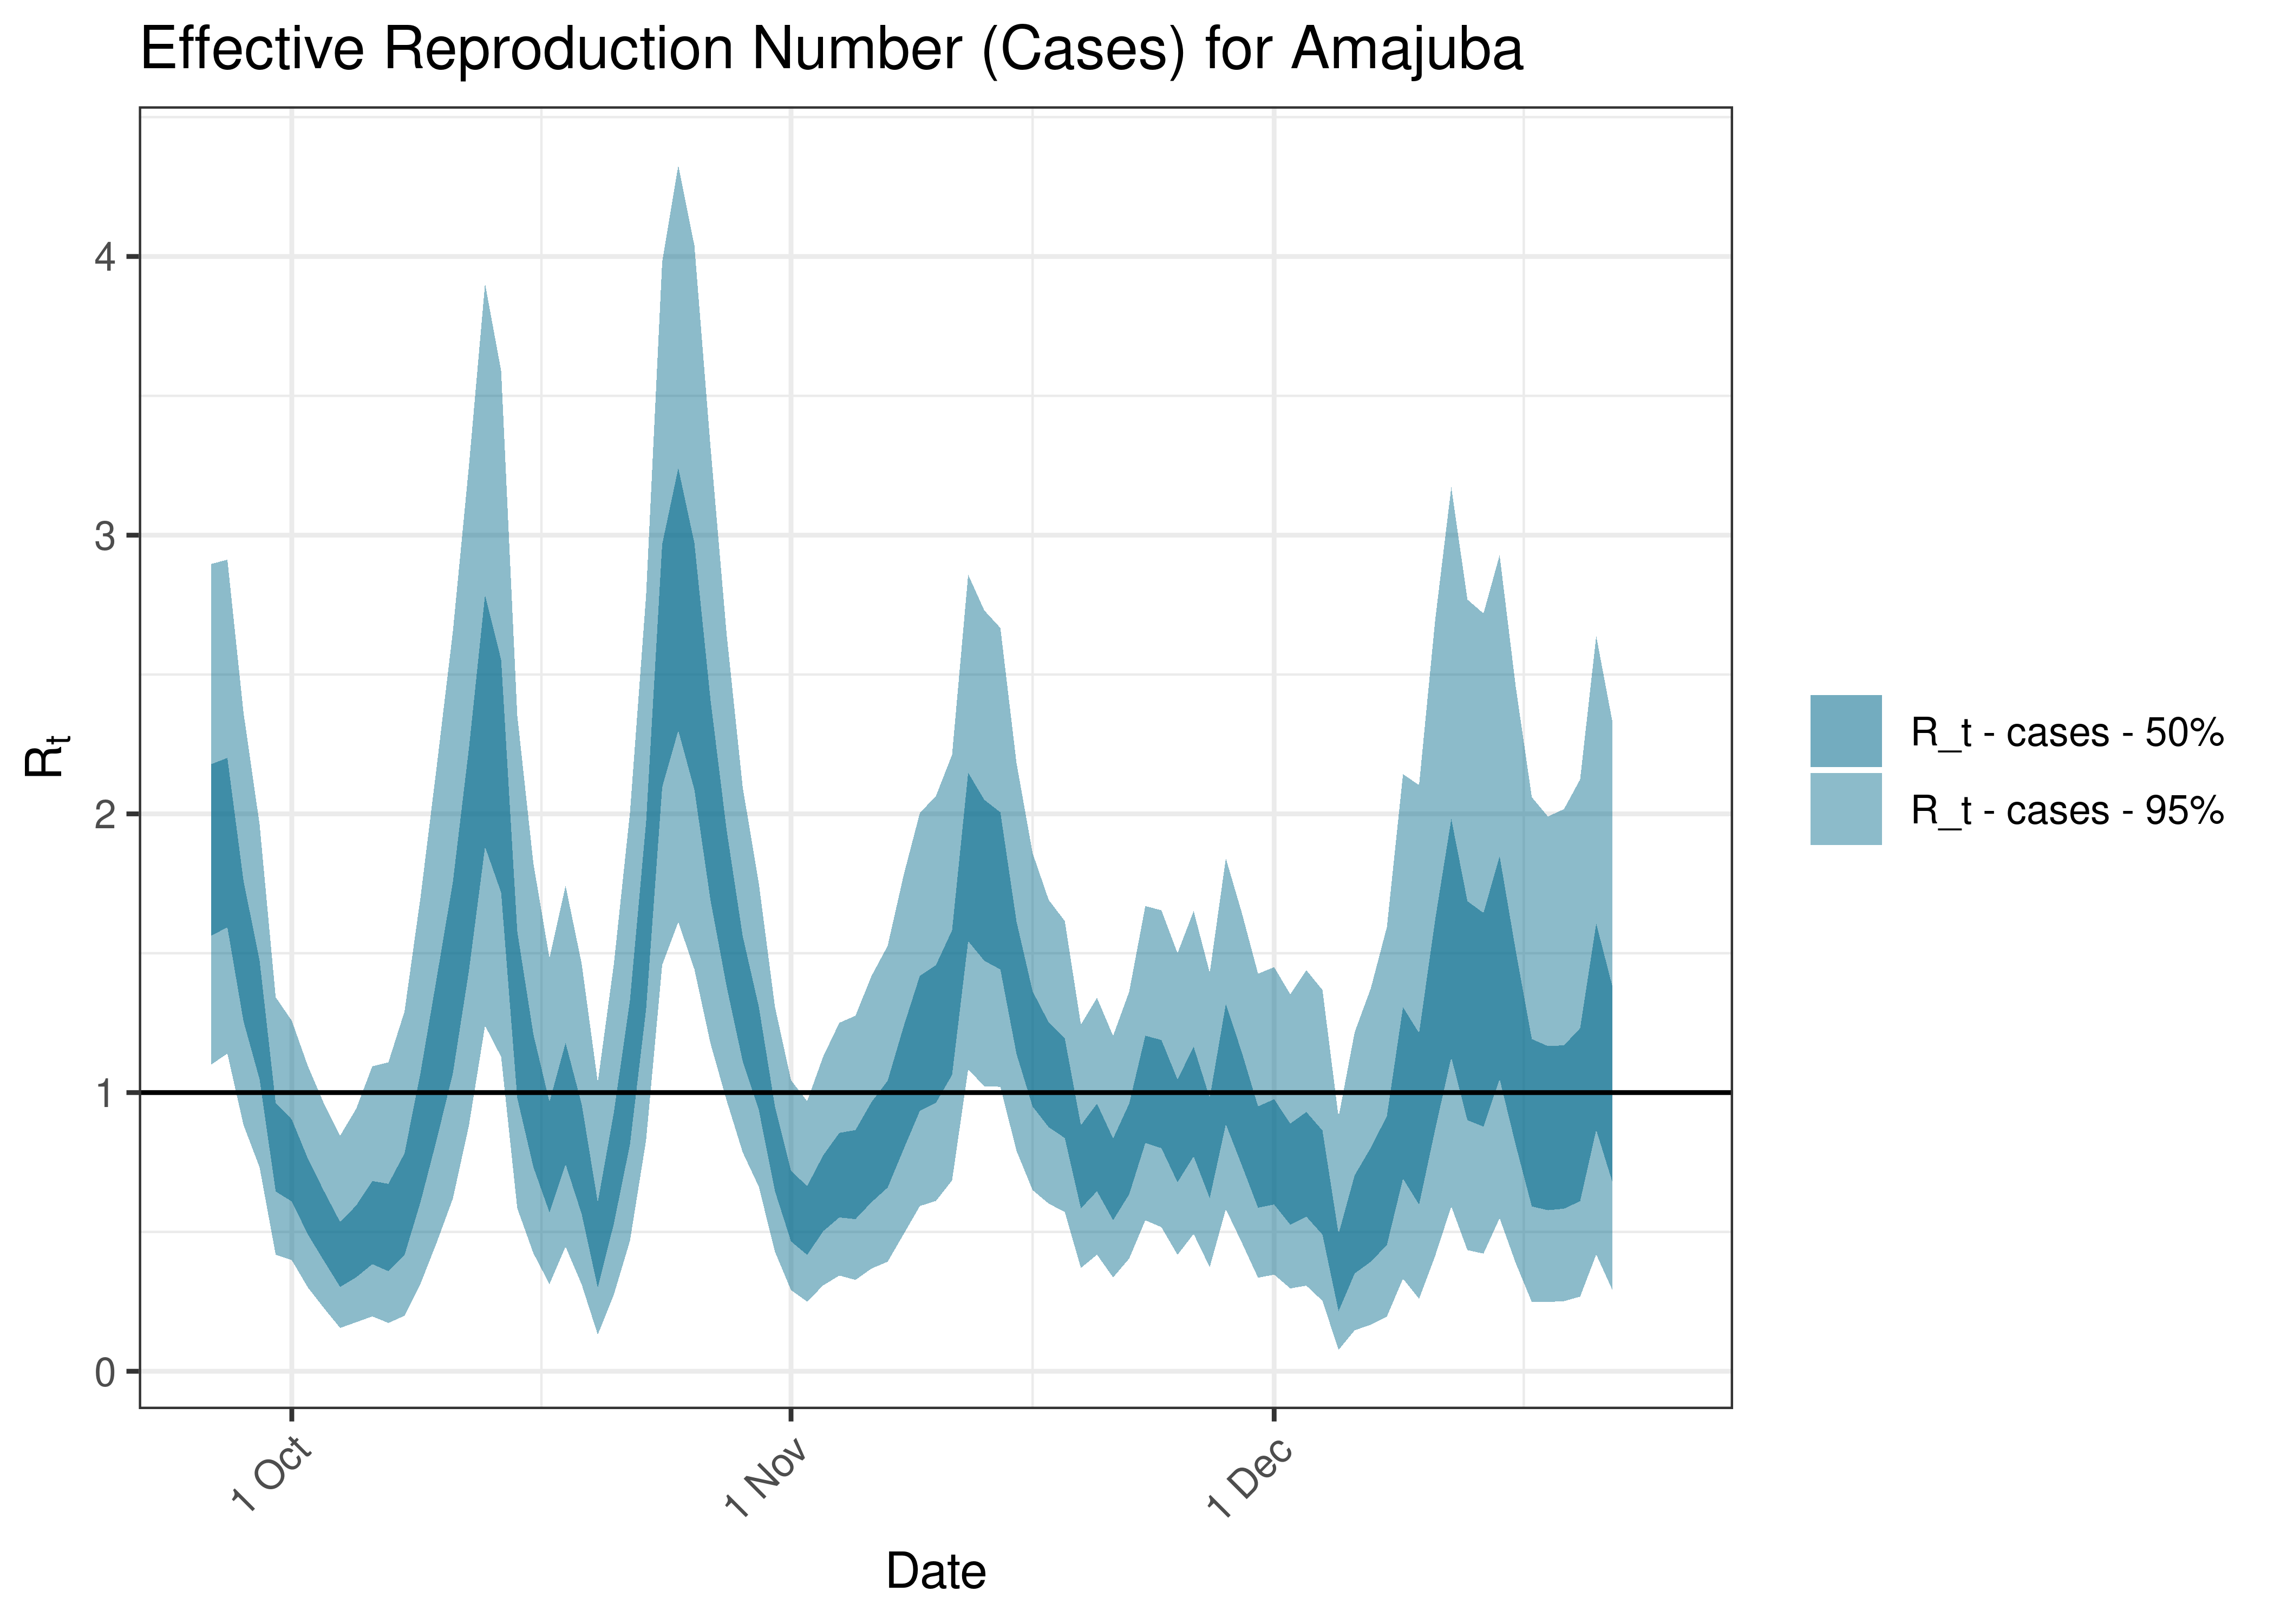
Estimated Effective Reproduction Number Based on Cases for Amajuba over last 90 days
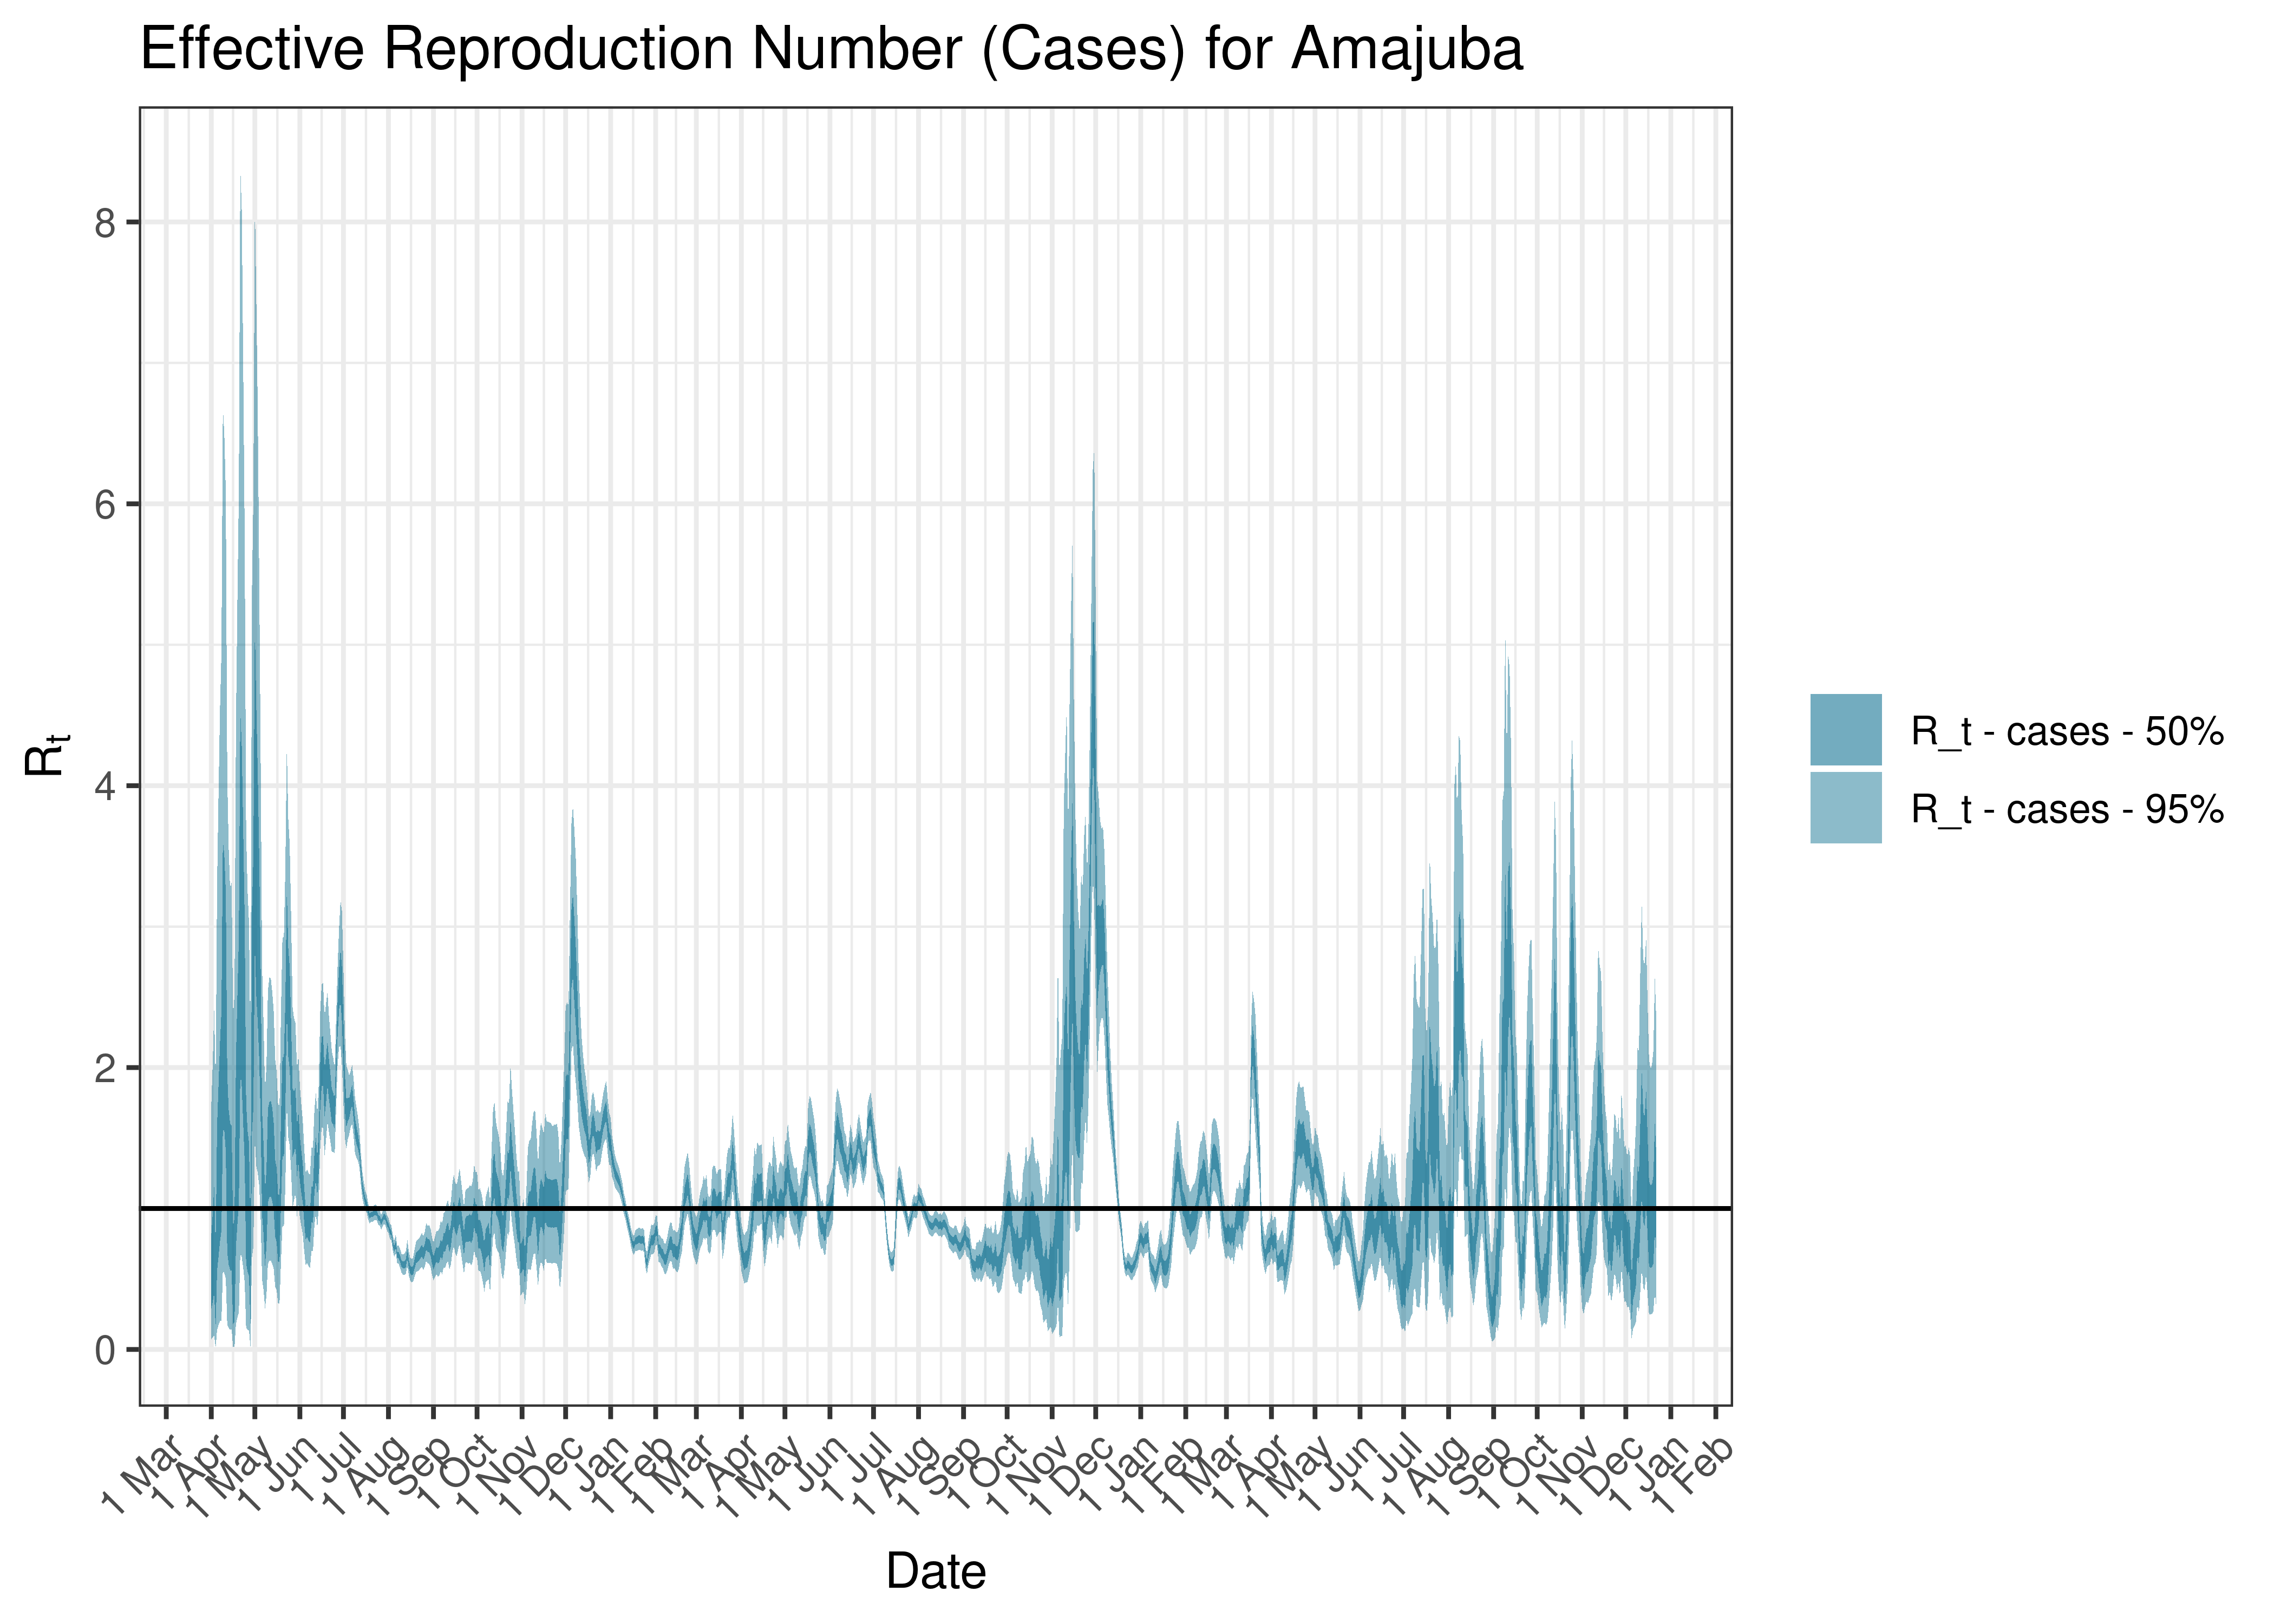
Estimated Effective Reproduction Number Based on Cases for Amajuba since 1 April 2020
6.5.9 Ethekwini Metro
6.5.9.1 Cases
Cases are tabulated by specimen received date below. Cases include estimates for late reporting in recent days as well as adjustments for any public holidays. A centred 7-day moving average is also shown. The peak daily cases in previous waves (as measured by the moving average) is also shown.
| Specimen Received Date | Cases | 7-day Moving Average | Comment |
|---|---|---|---|
| 2020-07-20 | 1,683 | 1,376 | Wave 1 Peak |
| 2020-12-31 | 3,282 | 3,330 | Wave 2 Peak |
| 2021-08-19 | 2,260 | 1,874 | Wave 3 Peak |
| 2021-12-14 | 3,787 | 3,067 | Wave 4 Peak |
| 2022-05-06 | 1,459 | 1,370 | Wave 5 Peak (to date) |
Below a 7-day moving average daily case count are plotted for Ethekwini Metro on a log scale since start of the epidemic:
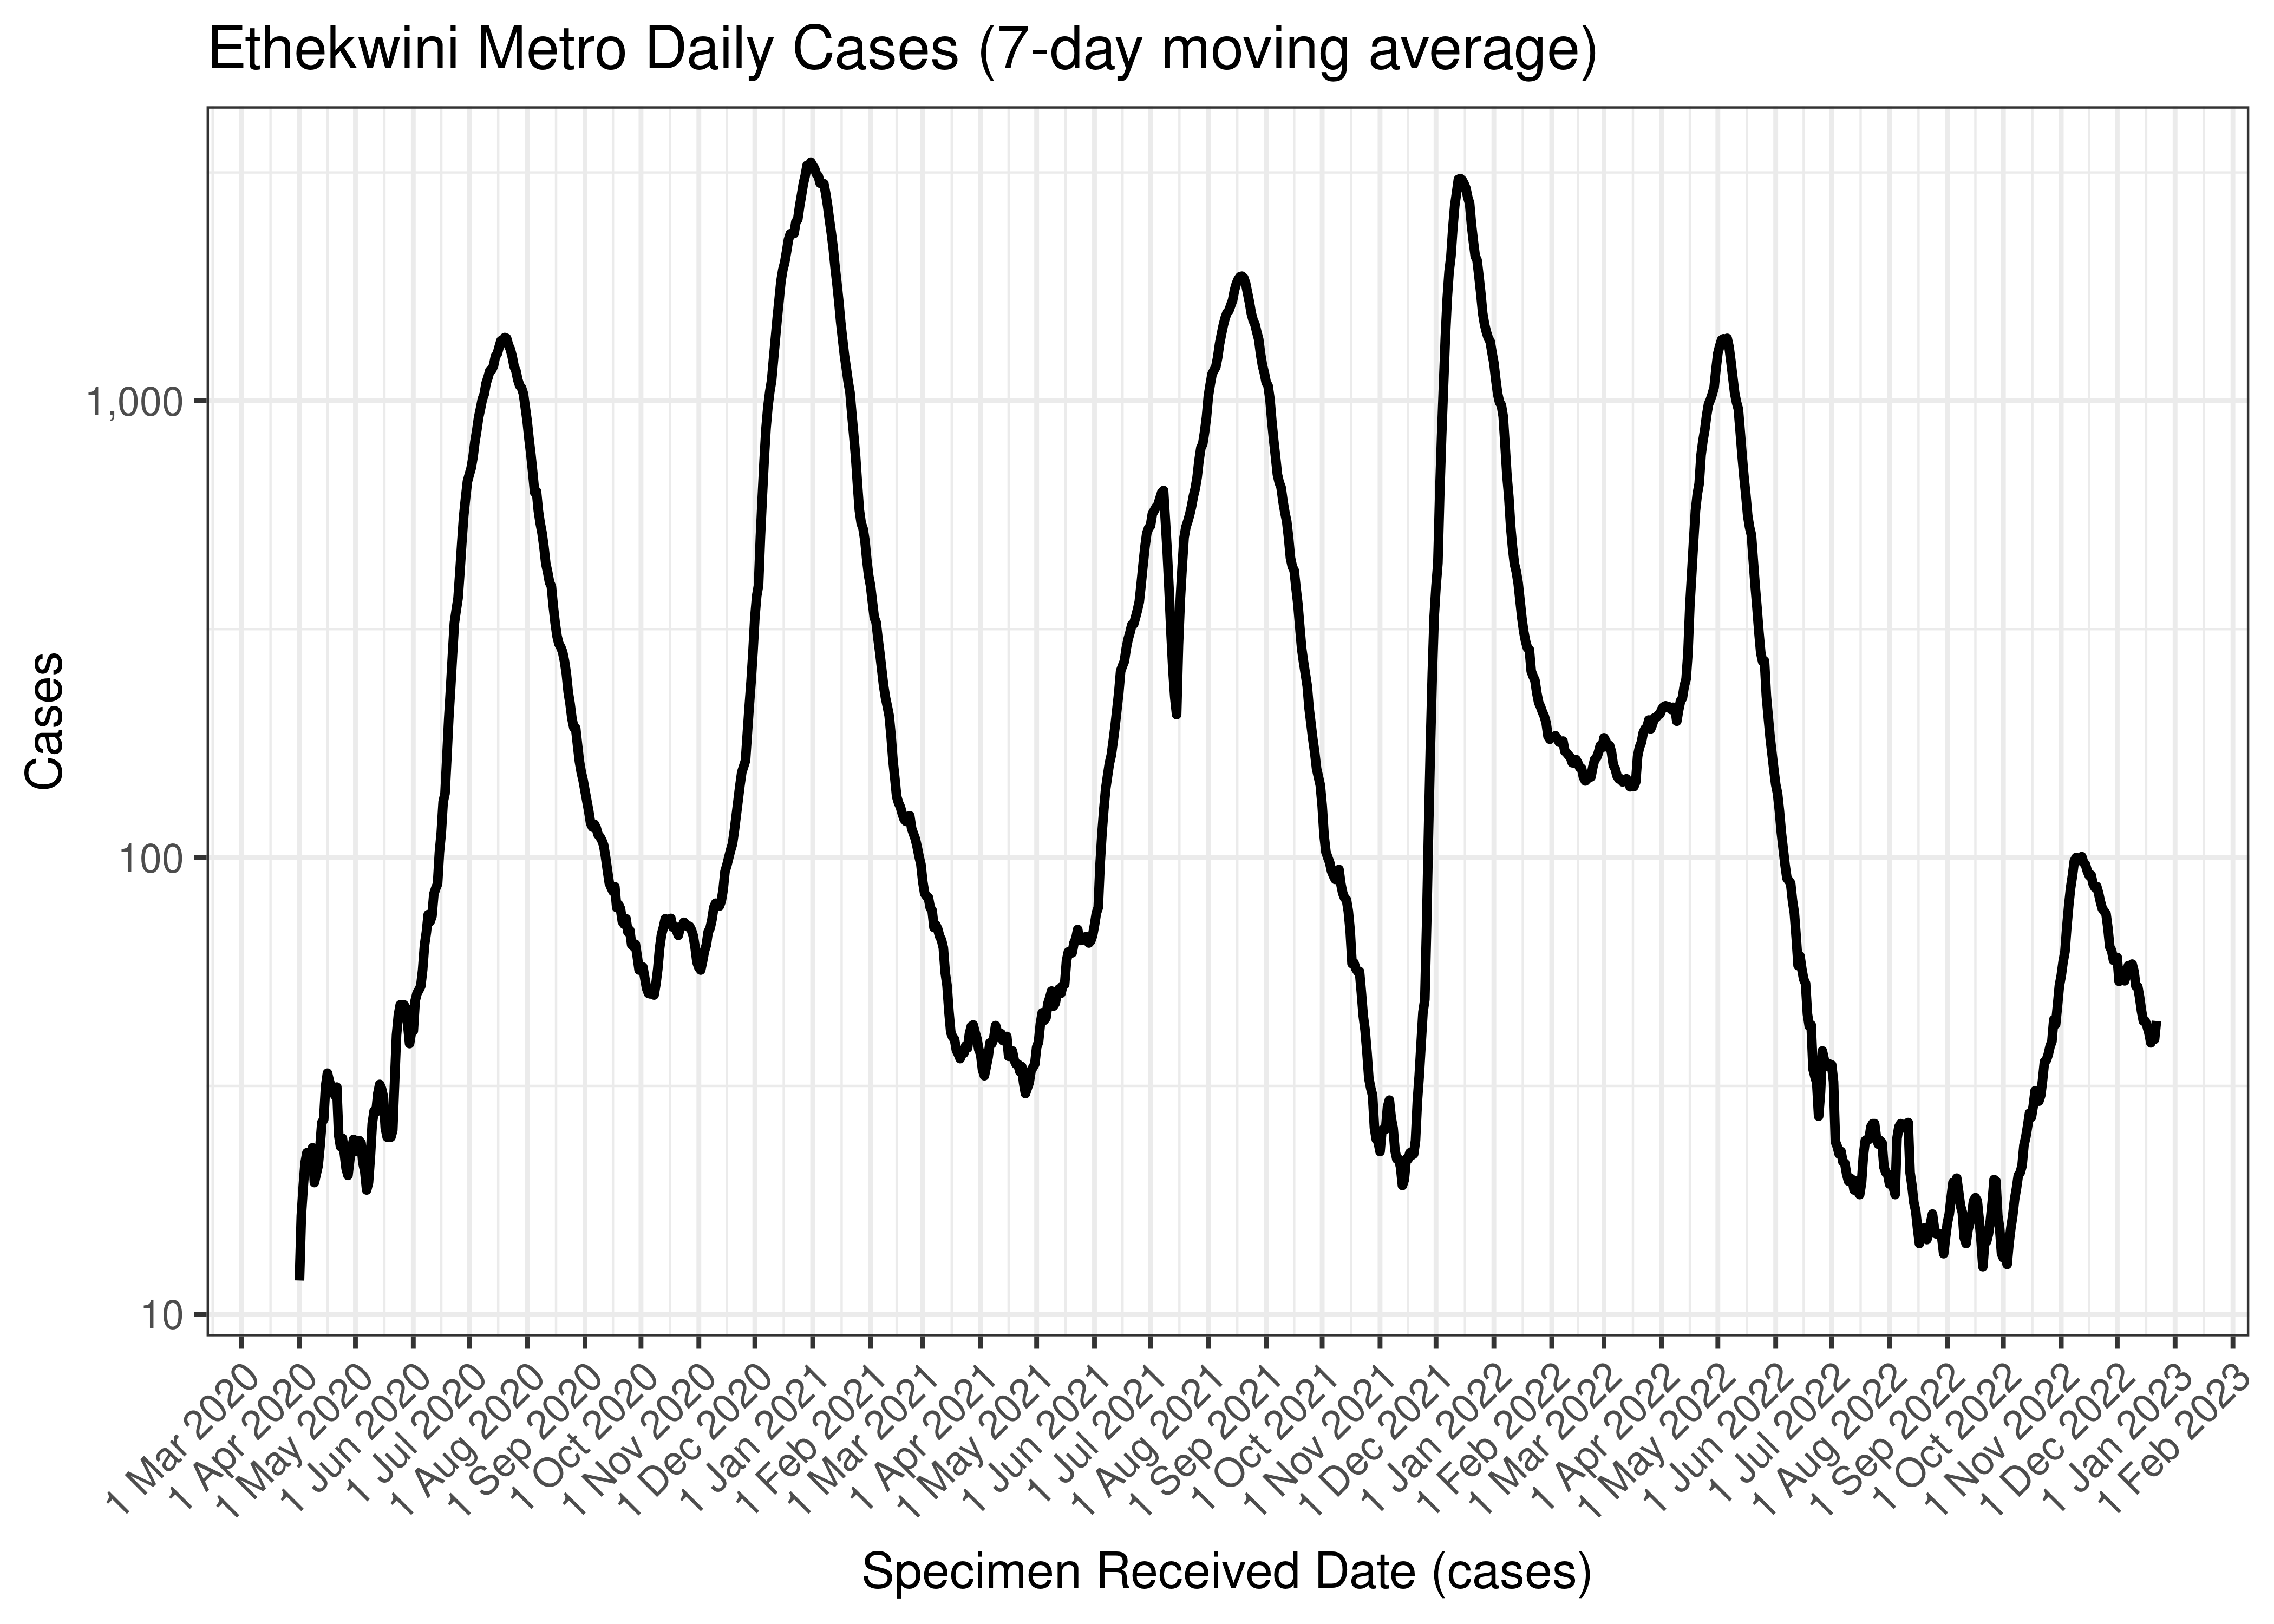
Ethekwini Metro Daily Cases (7-day moving average)
Below the above chart is repeated for the last 30-days:

Ethekwini Metro Daily Cases for Last 30-days (7-day moving average)
6.5.9.2 Excess Deaths
Excess deaths are tabulated by date of death below. A centred 7-day moving average is also shown. The peak daily deaths in previous waves (as measured by the moving average) is also shown.
| Specimen Received Date | Excess Deaths | 7-day Moving Average | Comment |
|---|---|---|---|
| 2020-07-22 | 76 | 76 | Wave 1 Peak |
| 2021-01-06 | 197 | 197 | Wave 2 Peak |
| 2021-08-18 | 50 | 50 | Wave 3 Peak |
| 2021-12-22 | 27 | 27 | Wave 4 Peak |
| 2022-05-11 | 13 | 13 | Wave 5 Peak (to date) |
| 2022-12-03 | -1 | -1 | |
| 2022-12-04 | 0 | -1 | |
| 2022-12-05 | 0 | -1 | |
| 2022-12-06 | 0 | 0 | |
| 2022-12-07 | 0 | 0 | |
| 2022-12-08 | 0 | NA | |
| 2022-12-09 | 0 | NA | |
| 2022-12-10 | 0 | NA |
Below a 7-day moving average daily excess deaths is plotted for Ethekwini Metro on a log scale since start of the epidemic:
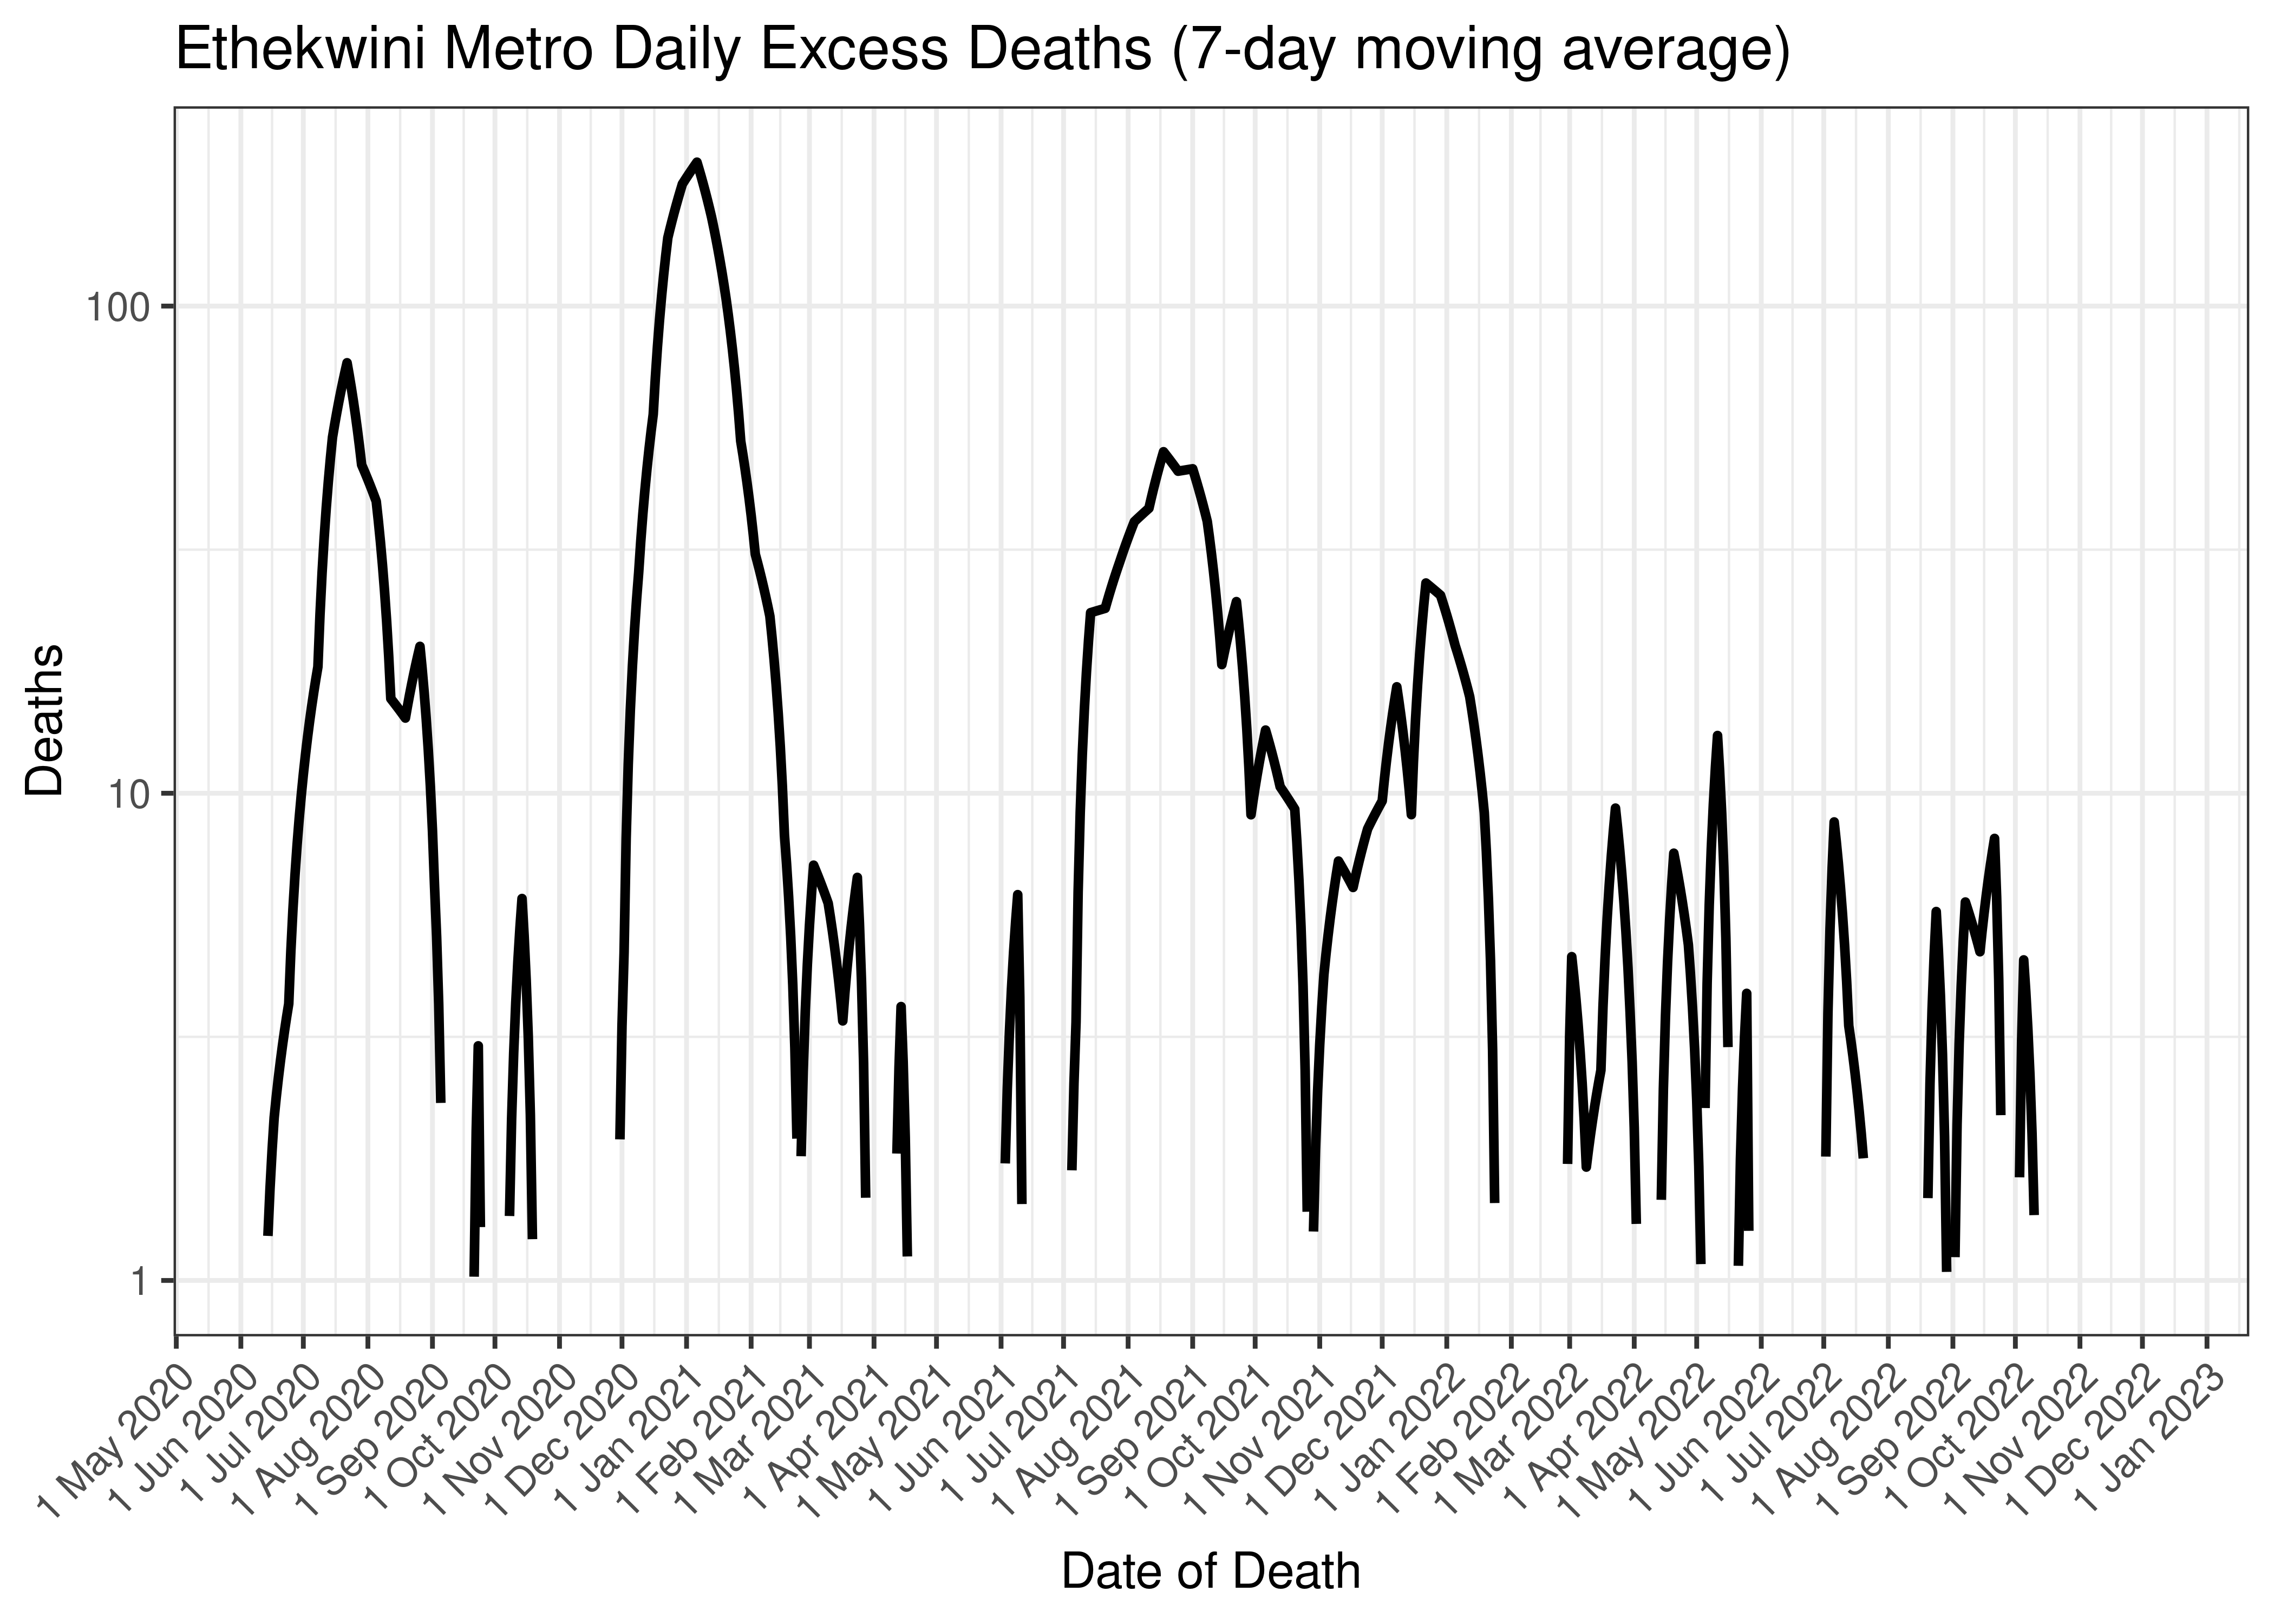
Ethekwini Metro Daily Excess Deaths (7-day moving average)
Below the above chart is repeated for the last 30-days:
Ethekwini Metro Excess Deaths for Last 30-days (7-day moving average)
6.5.9.3 Cases and Excess Deaths Combined
Below a 7-day moving average daily case count and estimated daily excess deaths are plotted for Ethekwini Metro on a log scale since start of the epidemic:
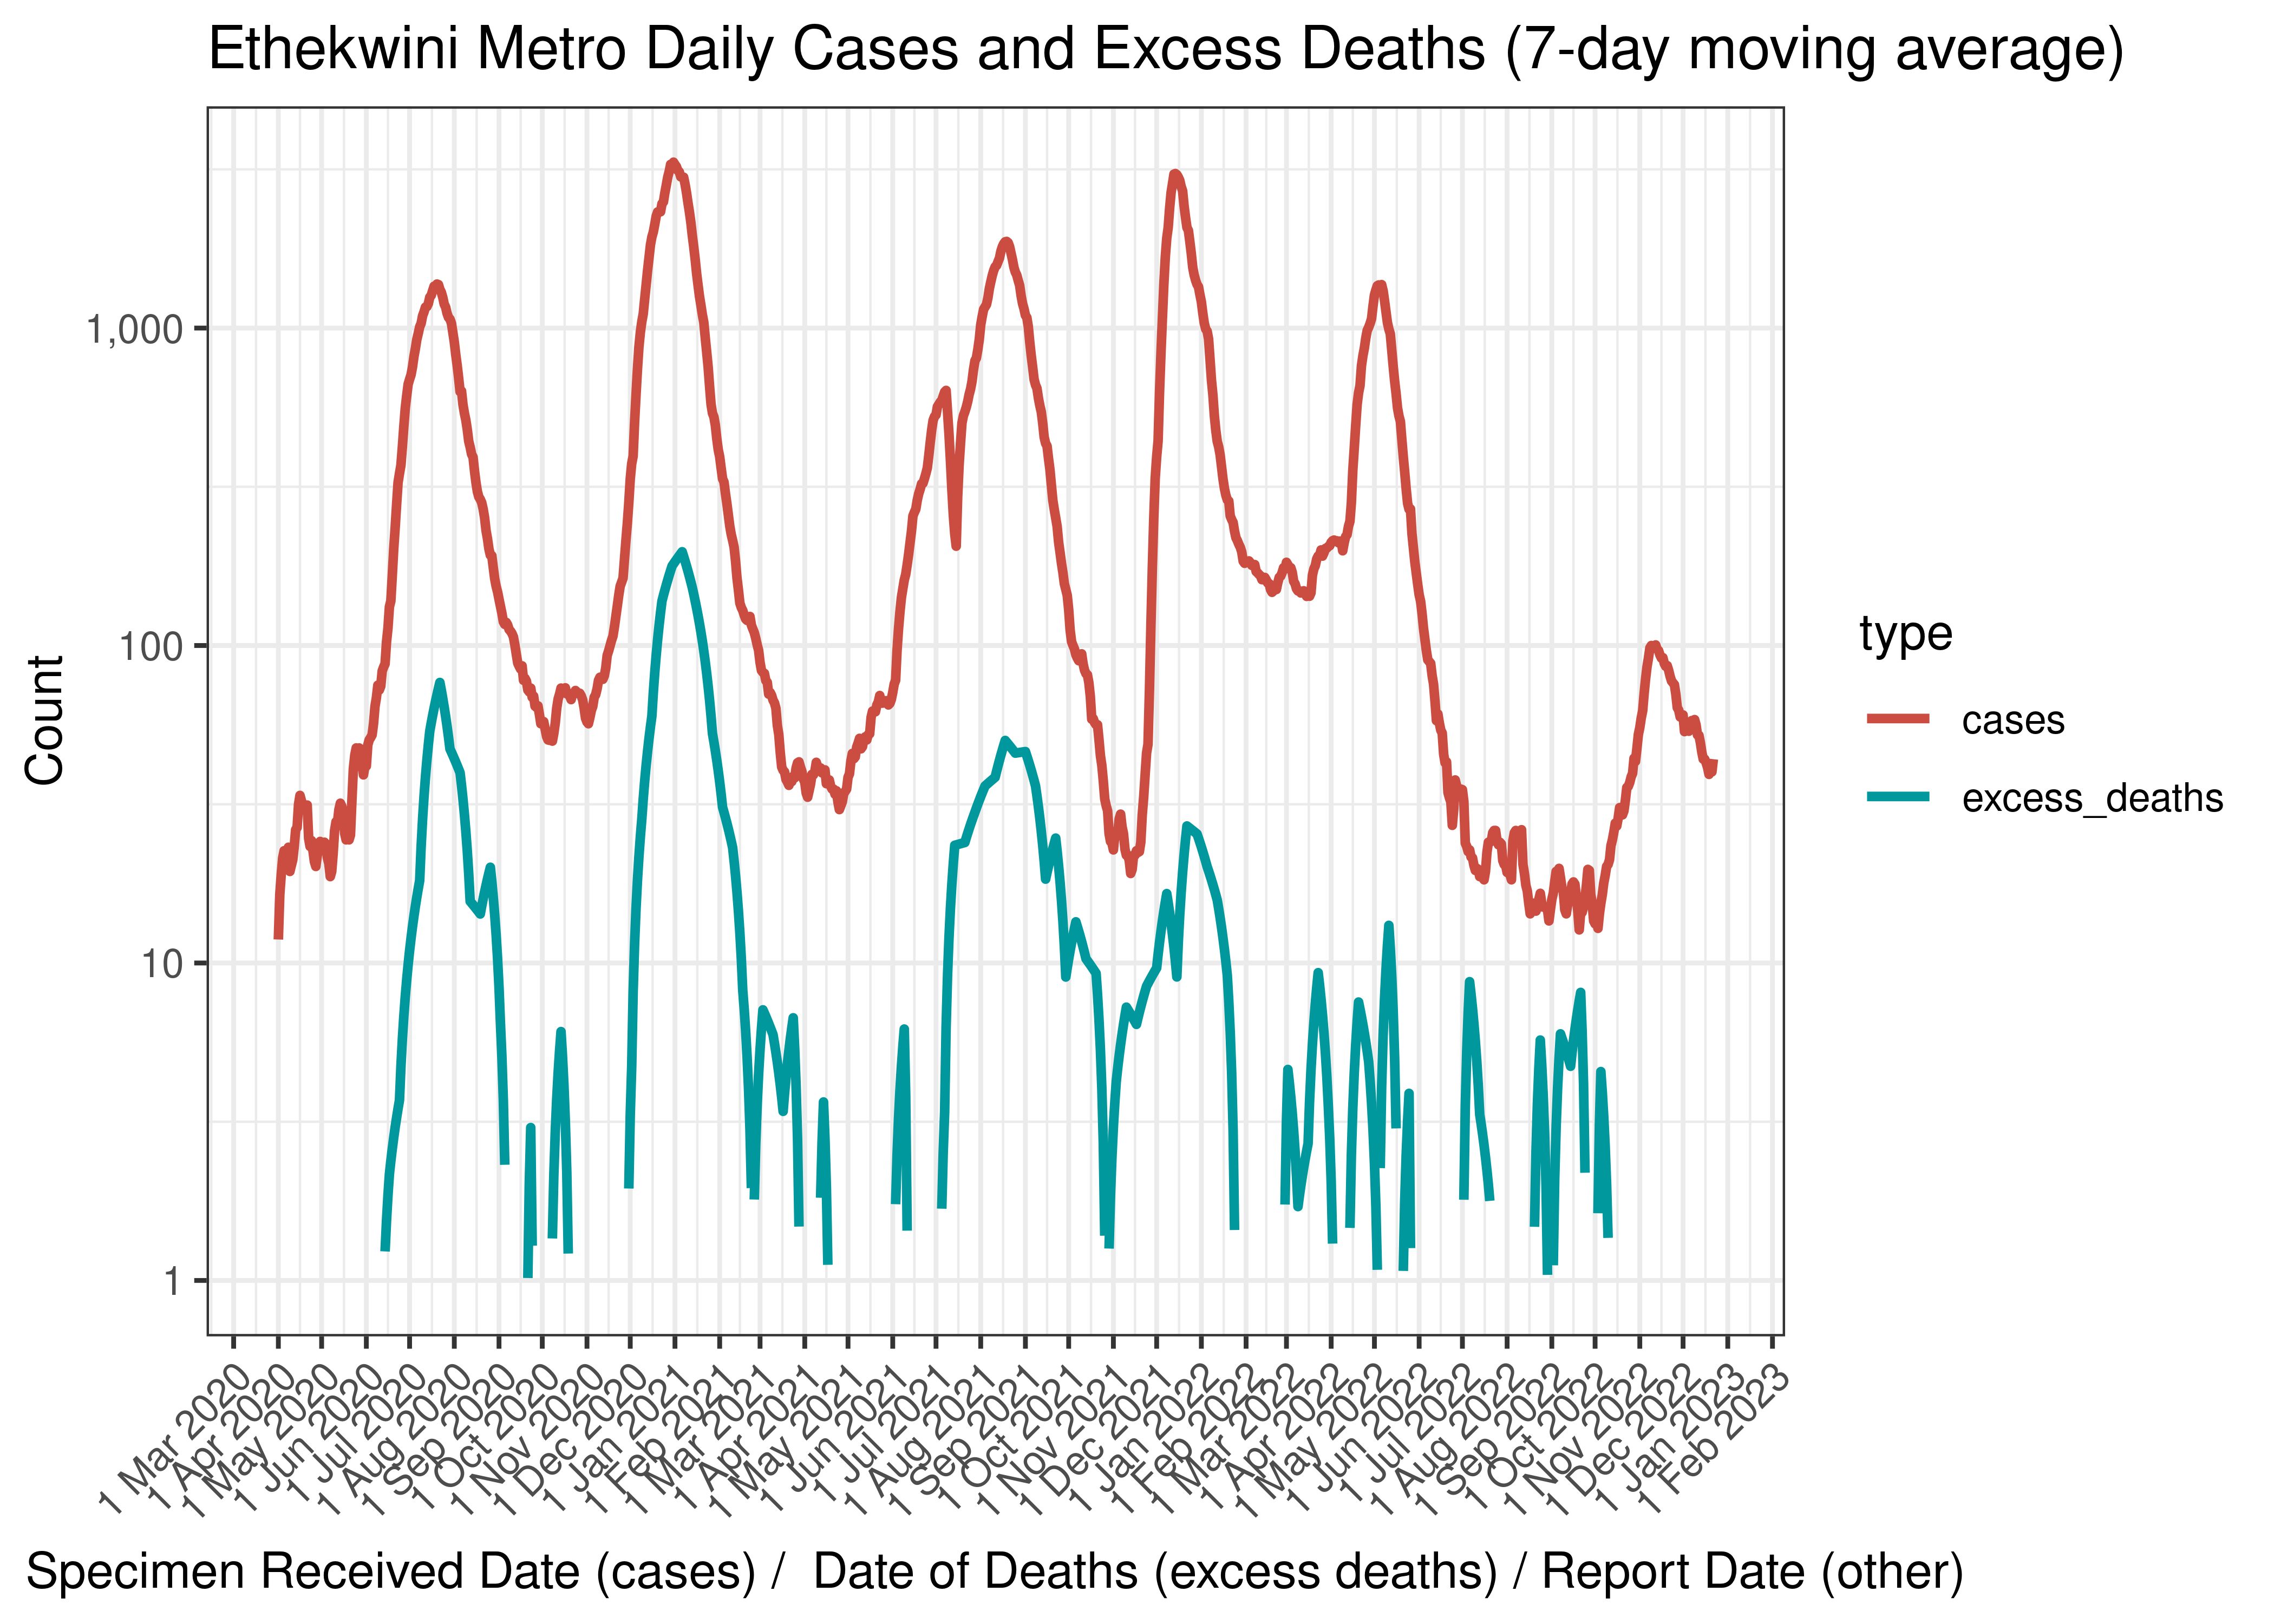
Ethekwini Metro Daily Cases and Excess Deaths (7-day moving average)
Below the above chart is repeated for the last 30-days:
Ethekwini Metro Daily Cases and Deaths (if available) for Last 30-days (7-day moving average)
6.5.9.4 Reproduction Number
Below current (last weekly) reproduction number estimates are tabulated for Ethekwini Metro.
| Count (Per Day) | Week Ending | Reproduction Number [95% Confidence Interval] | |
|---|---|---|---|
| Ethekwini Metro | 43.9 | 2022-12-25 | 1.02 [0.91 - 1.14] |
Below the effective reproduction number for Ethekwini Metro over the last 90 days are plotted together with a plot since start of the pandemic.
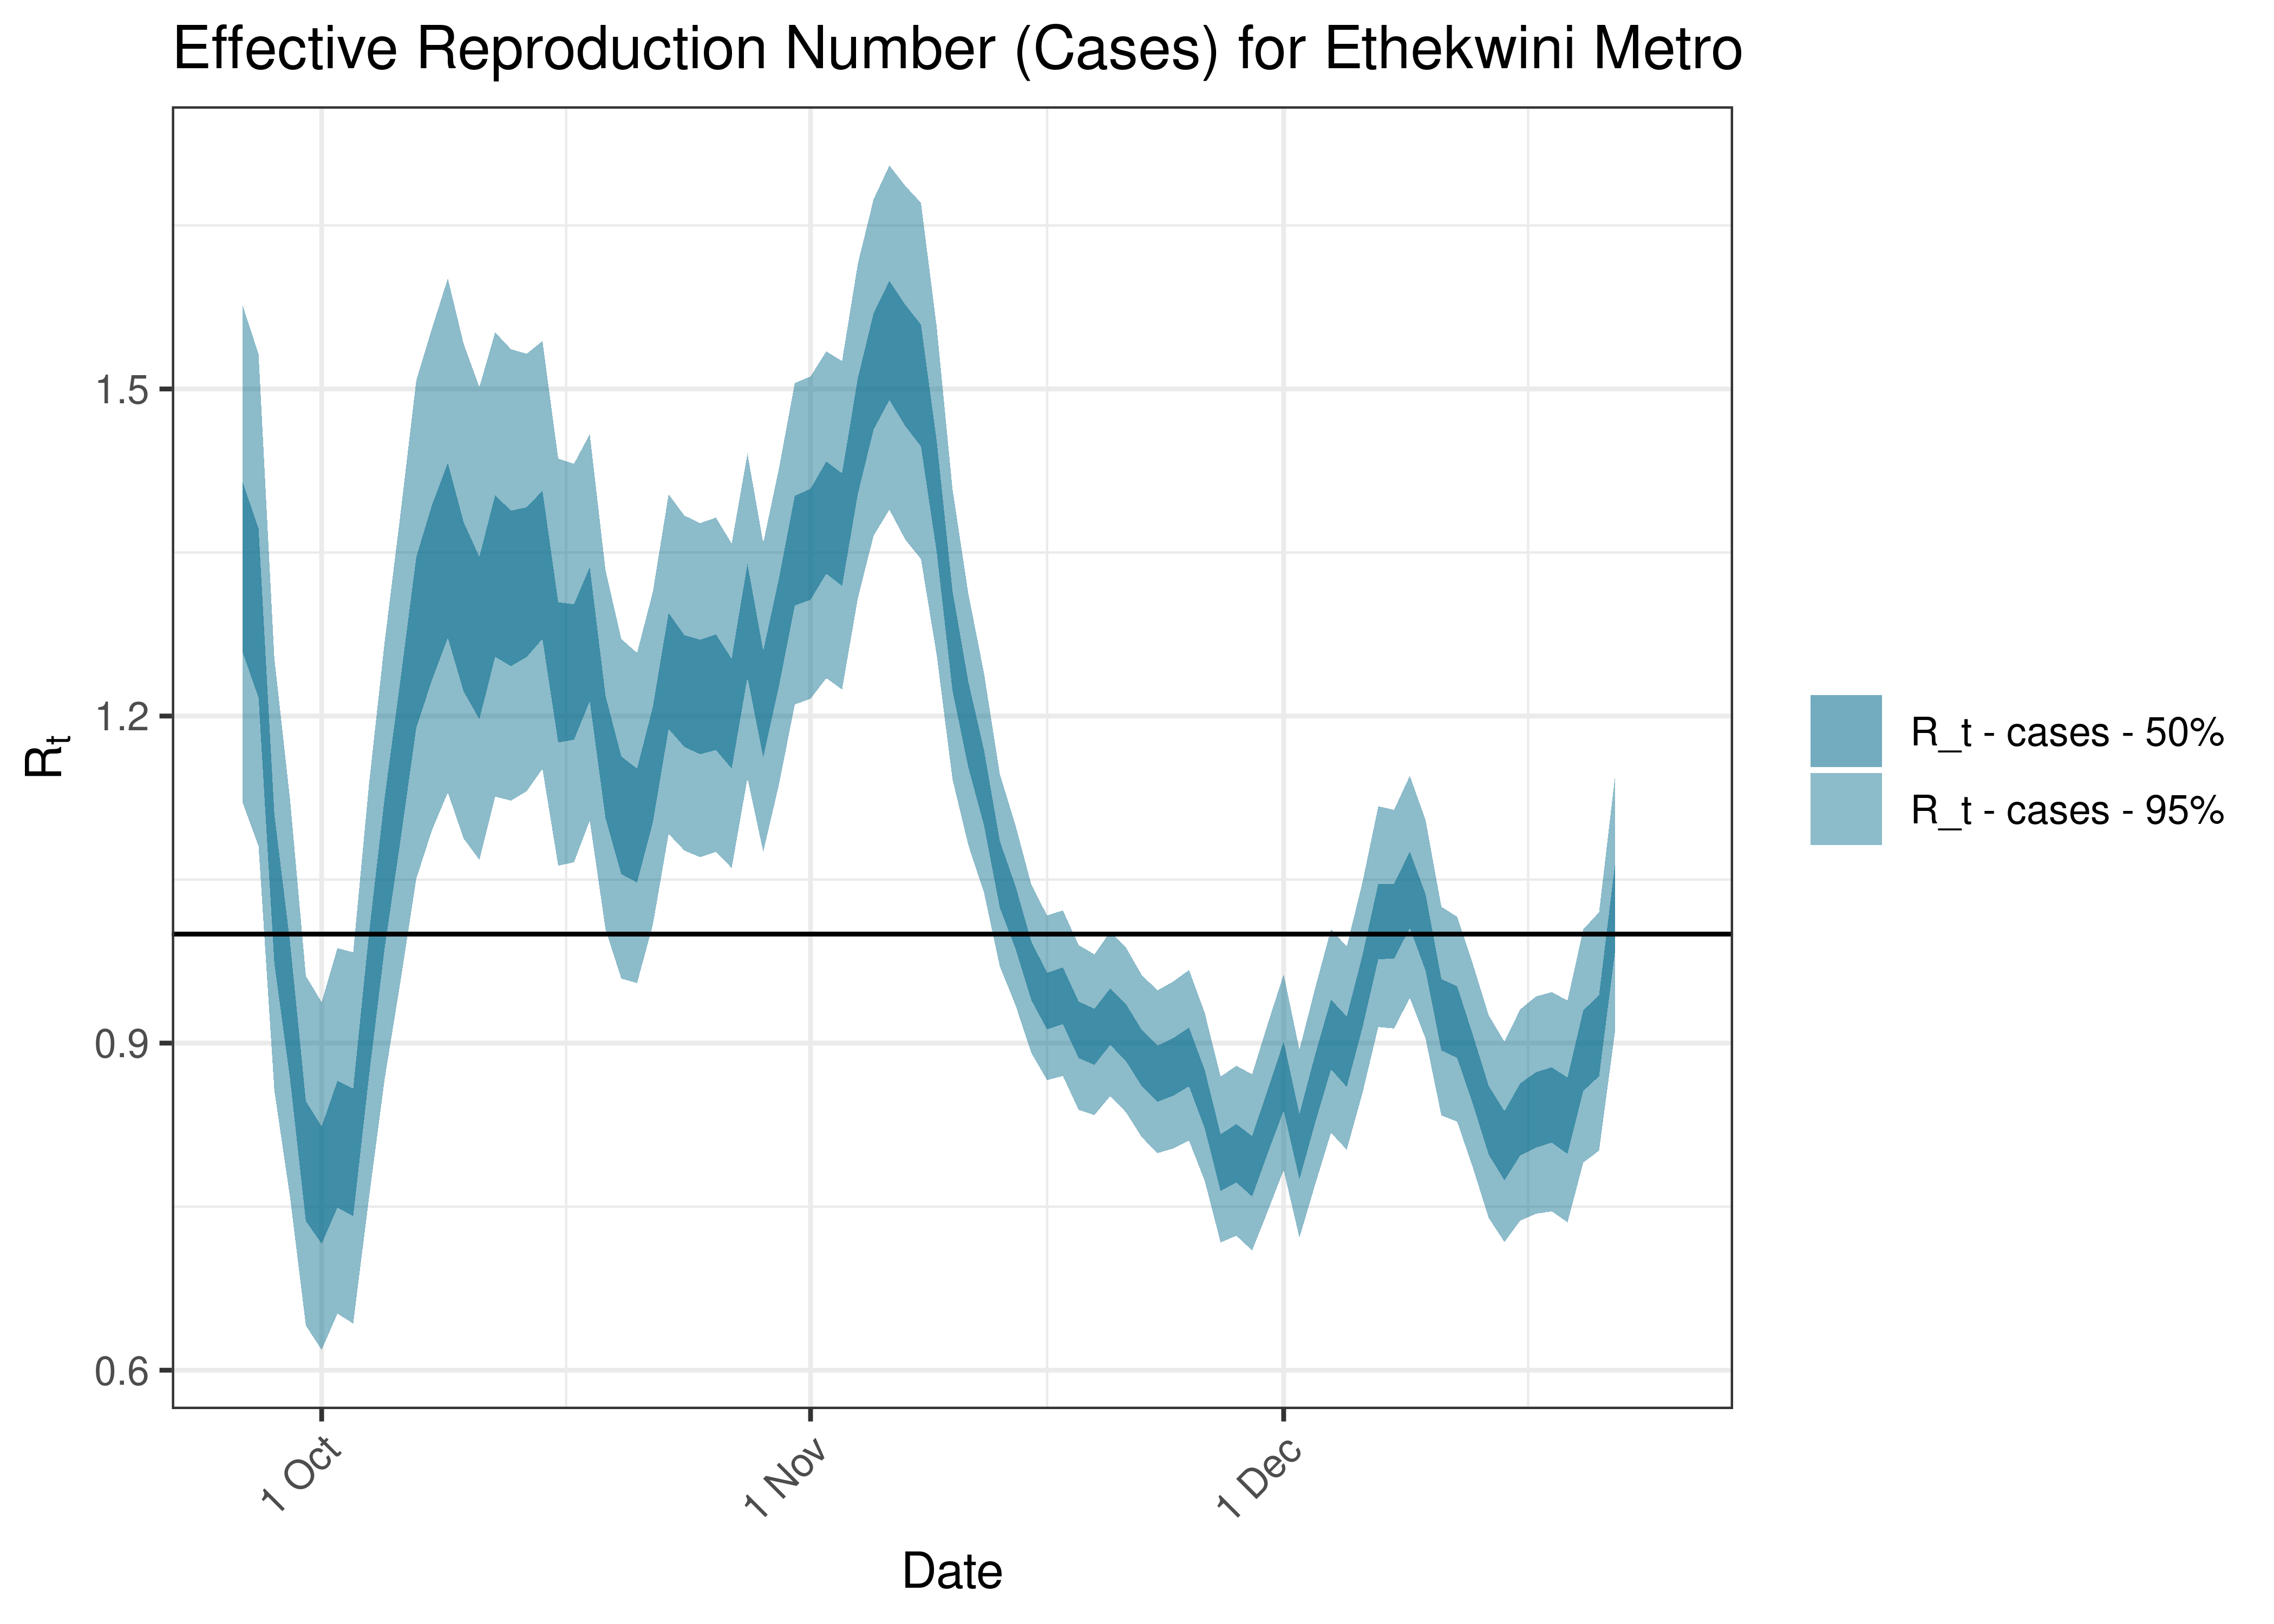
Estimated Effective Reproduction Number Based on Cases for Ethekwini Metro over last 90 days

Estimated Effective Reproduction Number Based on Cases for Ethekwini Metro since 1 April 2020
6.5.10 Harry Gwala
6.5.10.1 Cases
Cases are tabulated by specimen received date below. Cases include estimates for late reporting in recent days as well as adjustments for any public holidays. A centred 7-day moving average is also shown. The peak daily cases in previous waves (as measured by the moving average) is also shown.
| Specimen Received Date | Cases | 7-day Moving Average | Comment |
|---|---|---|---|
| 2020-07-10 | 105 | 77 | Wave 1 Peak |
| 2020-07-13 | 106 | 77 | Wave 1 Peak |
| 2021-01-01 | 100 | 114 | Wave 2 Peak |
| 2021-08-21 | 46 | 80 | Wave 3 Peak |
| 2021-12-20 | 100 | 72 | Wave 4 Peak |
| 2022-05-06 | 14 | 14 | Wave 5 Peak (to date) |
Below a 7-day moving average daily case count are plotted for Harry Gwala on a log scale since start of the epidemic:
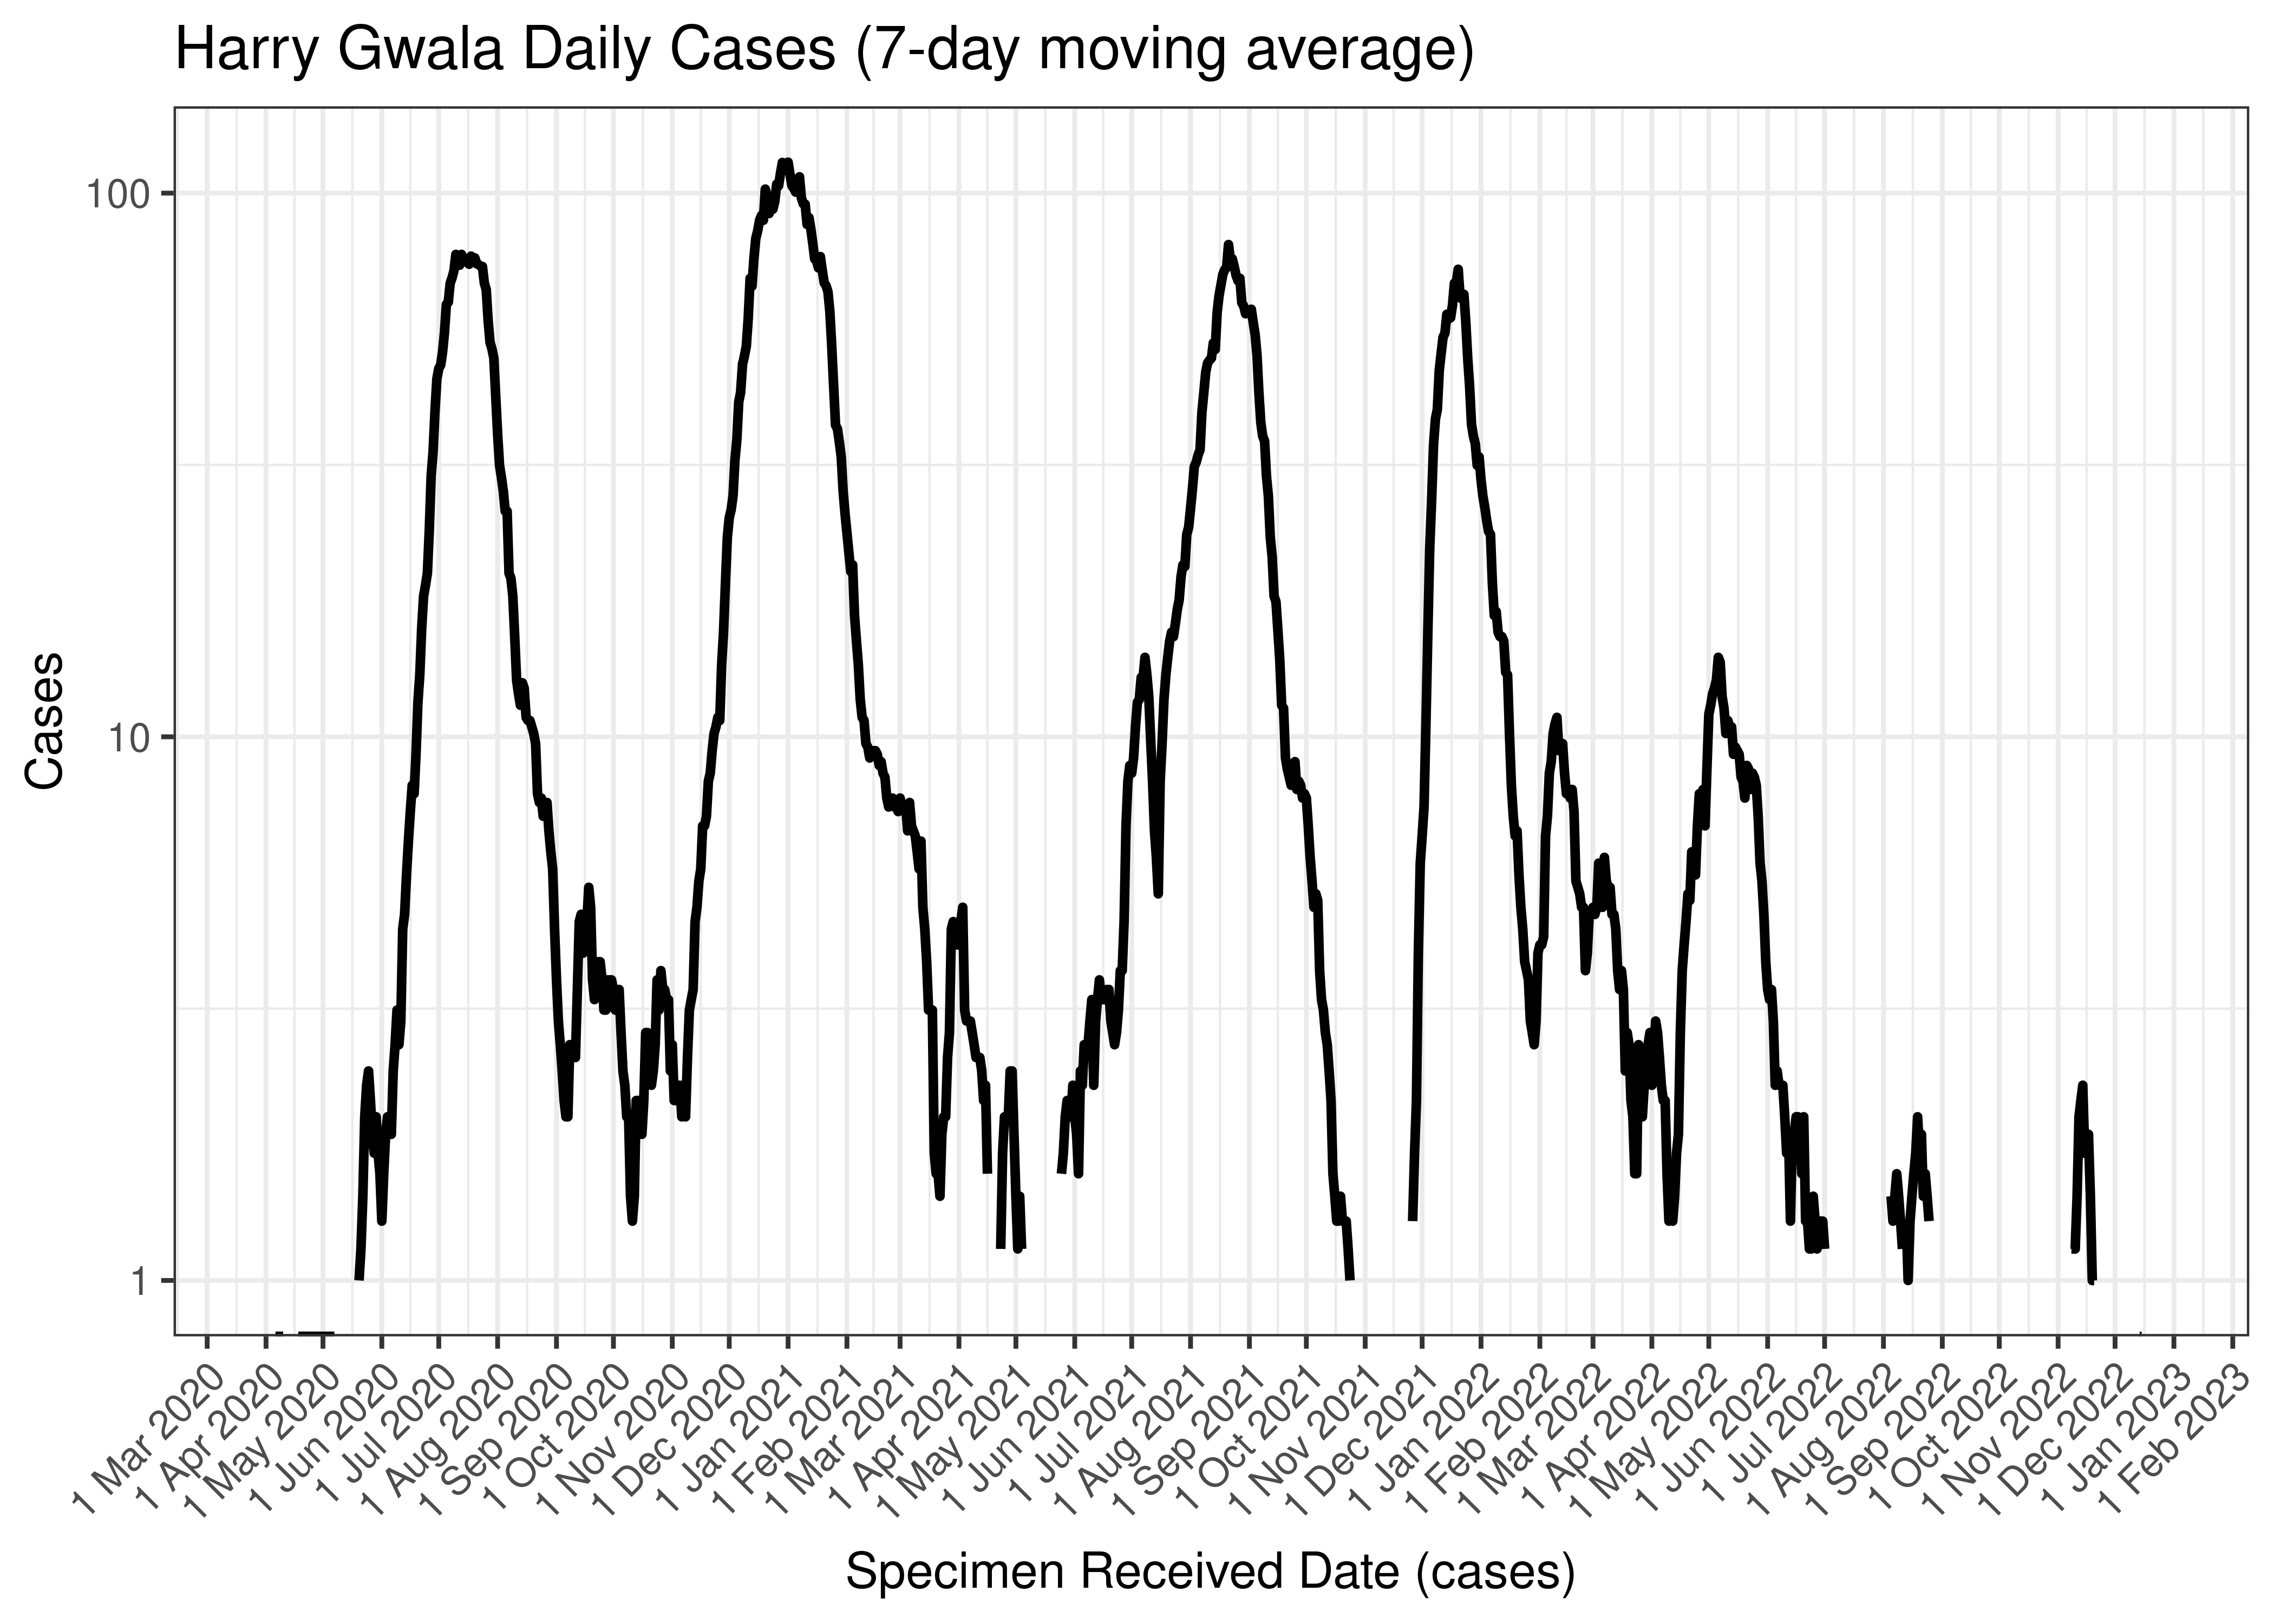
Harry Gwala Daily Cases (7-day moving average)
Below the above chart is repeated for the last 30-days:

Harry Gwala Daily Cases for Last 30-days (7-day moving average)
6.5.10.2 Reproduction Number
Below current (last weekly) reproduction number estimates are tabulated for Harry Gwala.
| Count (Per Day) | Week Ending | Reproduction Number [95% Confidence Interval] | |
|---|---|---|---|
| Harry Gwala | 0.3 | 2022-12-25 | 2.29 [0.47 - 5.67] |
Below the effective reproduction number for Harry Gwala over the last 90 days are plotted together with a plot since start of the pandemic.
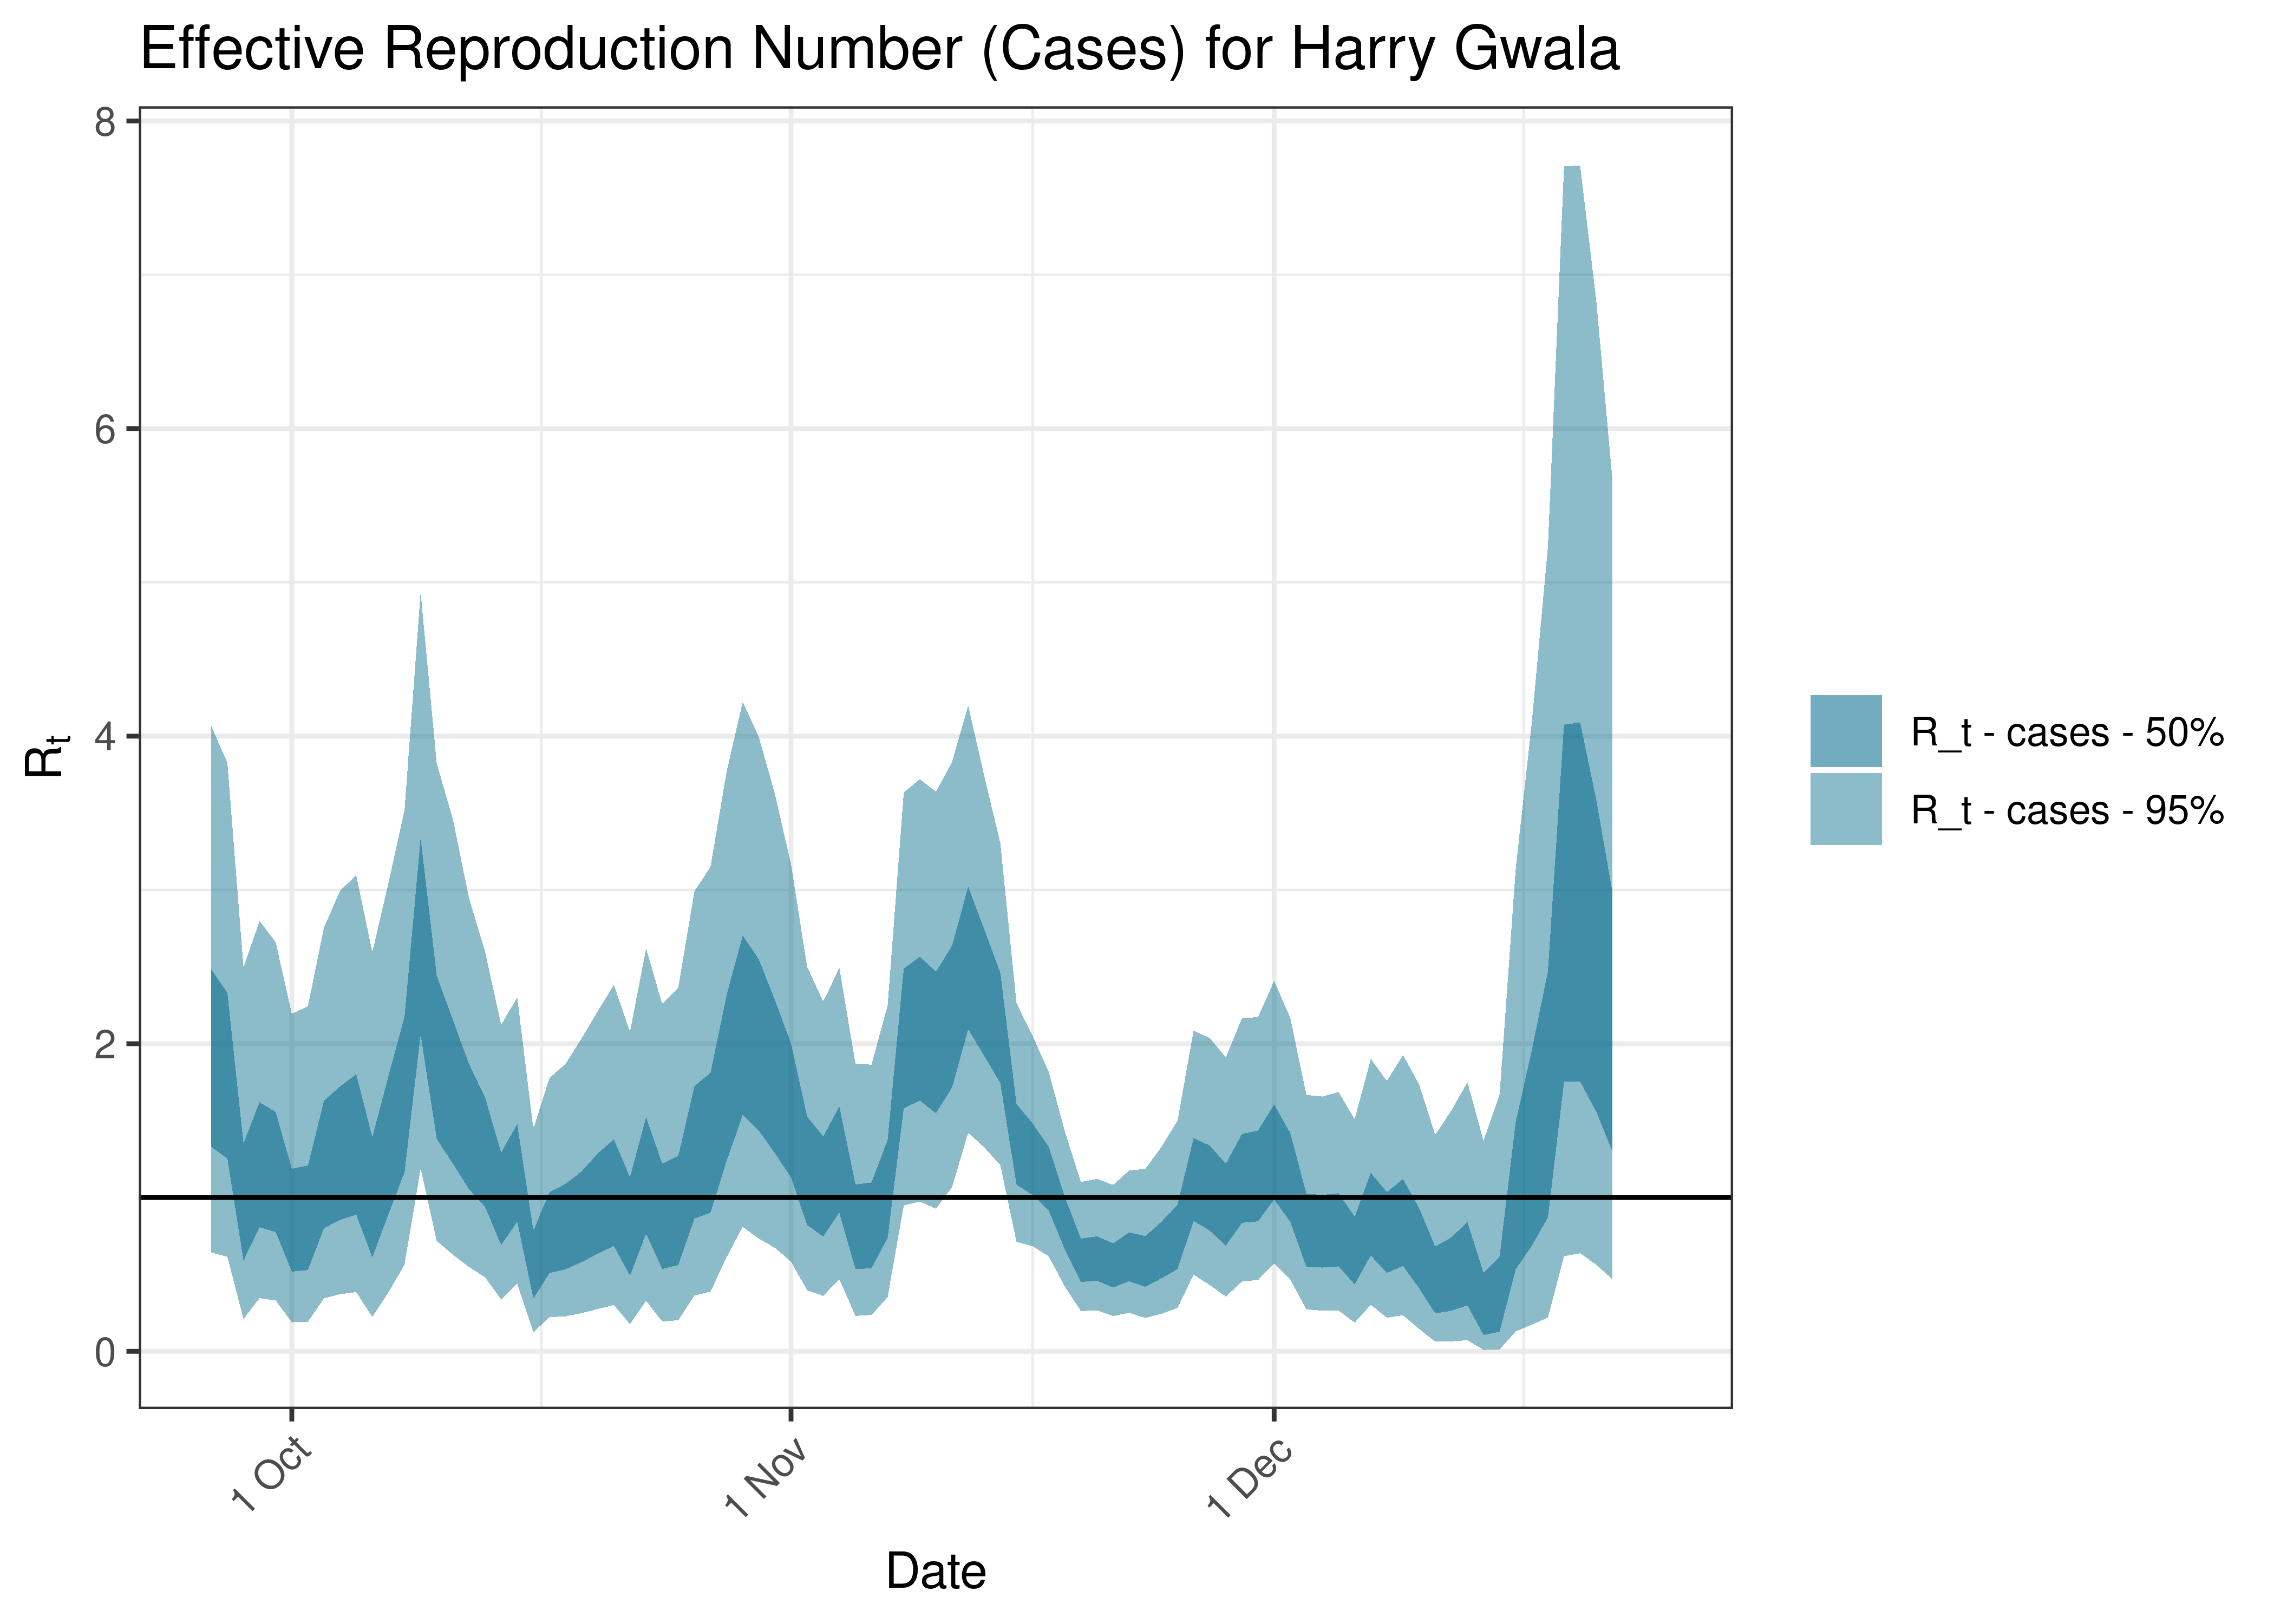
Estimated Effective Reproduction Number Based on Cases for Harry Gwala over last 90 days
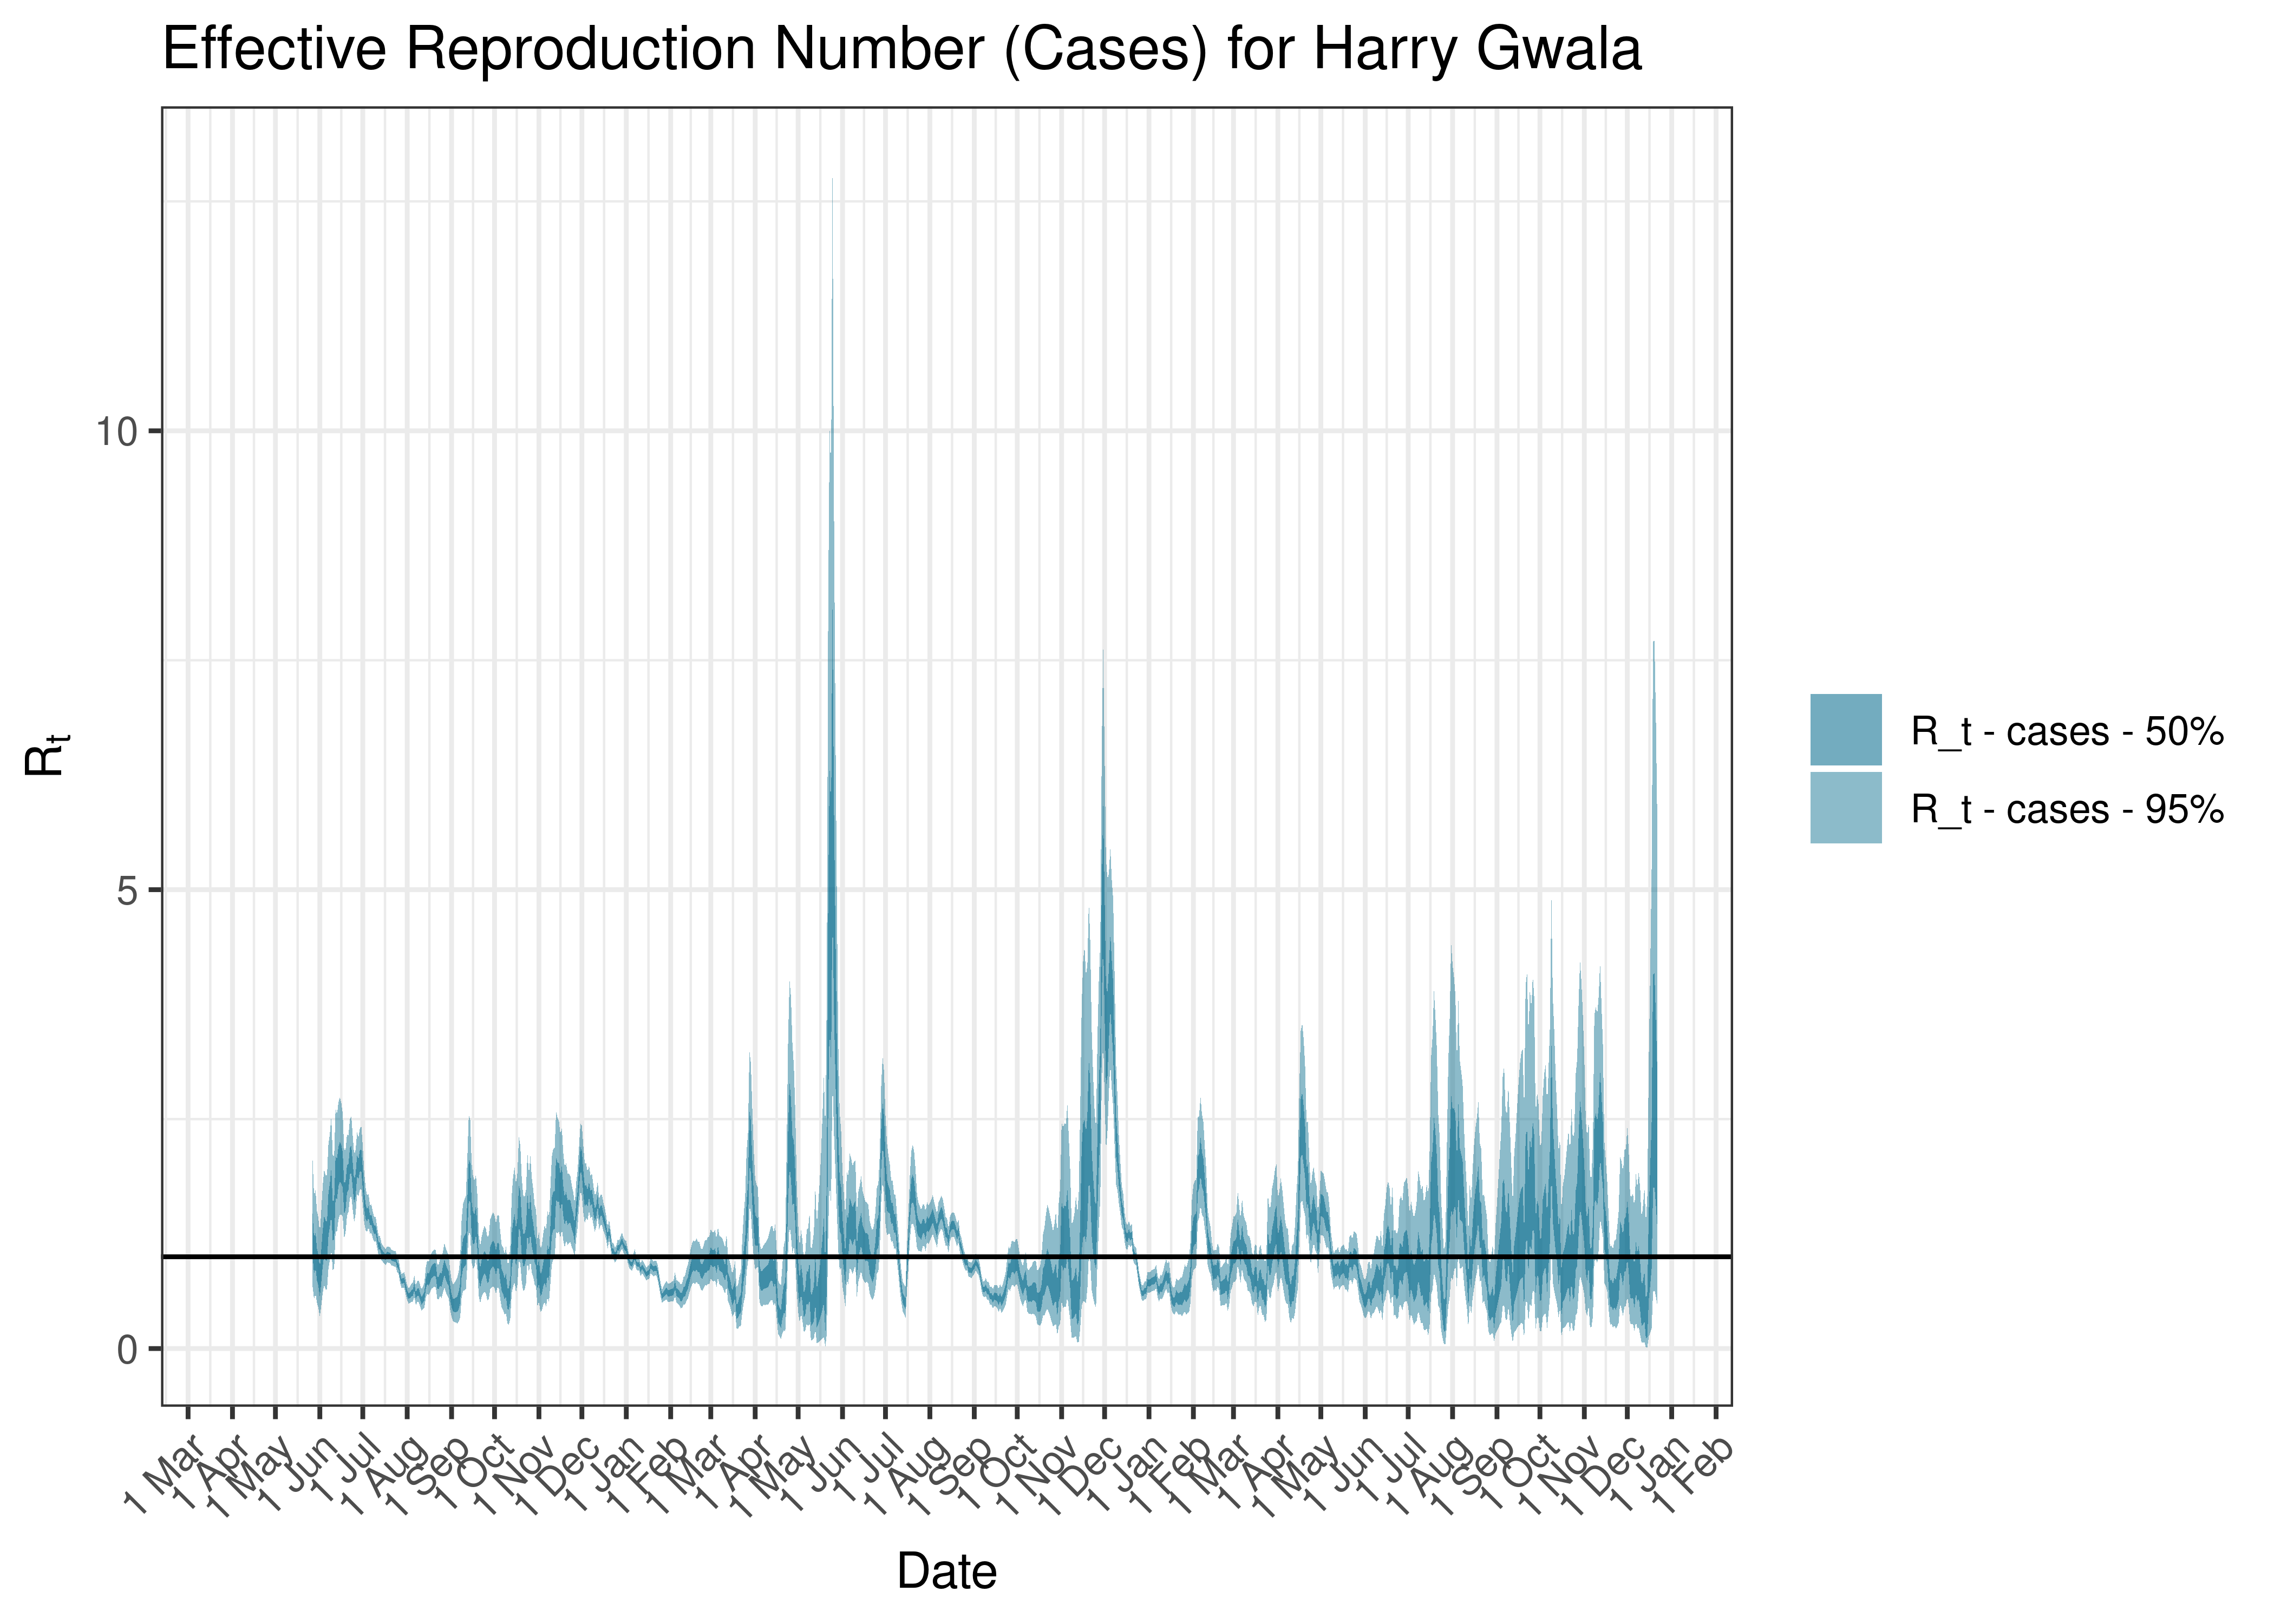
Estimated Effective Reproduction Number Based on Cases for Harry Gwala since 1 April 2020
6.5.11 Ilembe
6.5.11.1 Cases
Cases are tabulated by specimen received date below. Cases include estimates for late reporting in recent days as well as adjustments for any public holidays. A centred 7-day moving average is also shown. The peak daily cases in previous waves (as measured by the moving average) is also shown.
| Specimen Received Date | Cases | 7-day Moving Average | Comment |
|---|---|---|---|
| 2020-07-29 | 92 | 86 | Wave 1 Peak |
| 2020-12-29 | 331 | 257 | Wave 2 Peak |
| 2021-08-21 | 115 | 137 | Wave 3 Peak |
| 2021-12-25 | 110 | 203 | Wave 4 Peak |
| 2022-05-03 | 162 | 114 | Wave 5 Peak (to date) |
Below a 7-day moving average daily case count are plotted for Ilembe on a log scale since start of the epidemic:
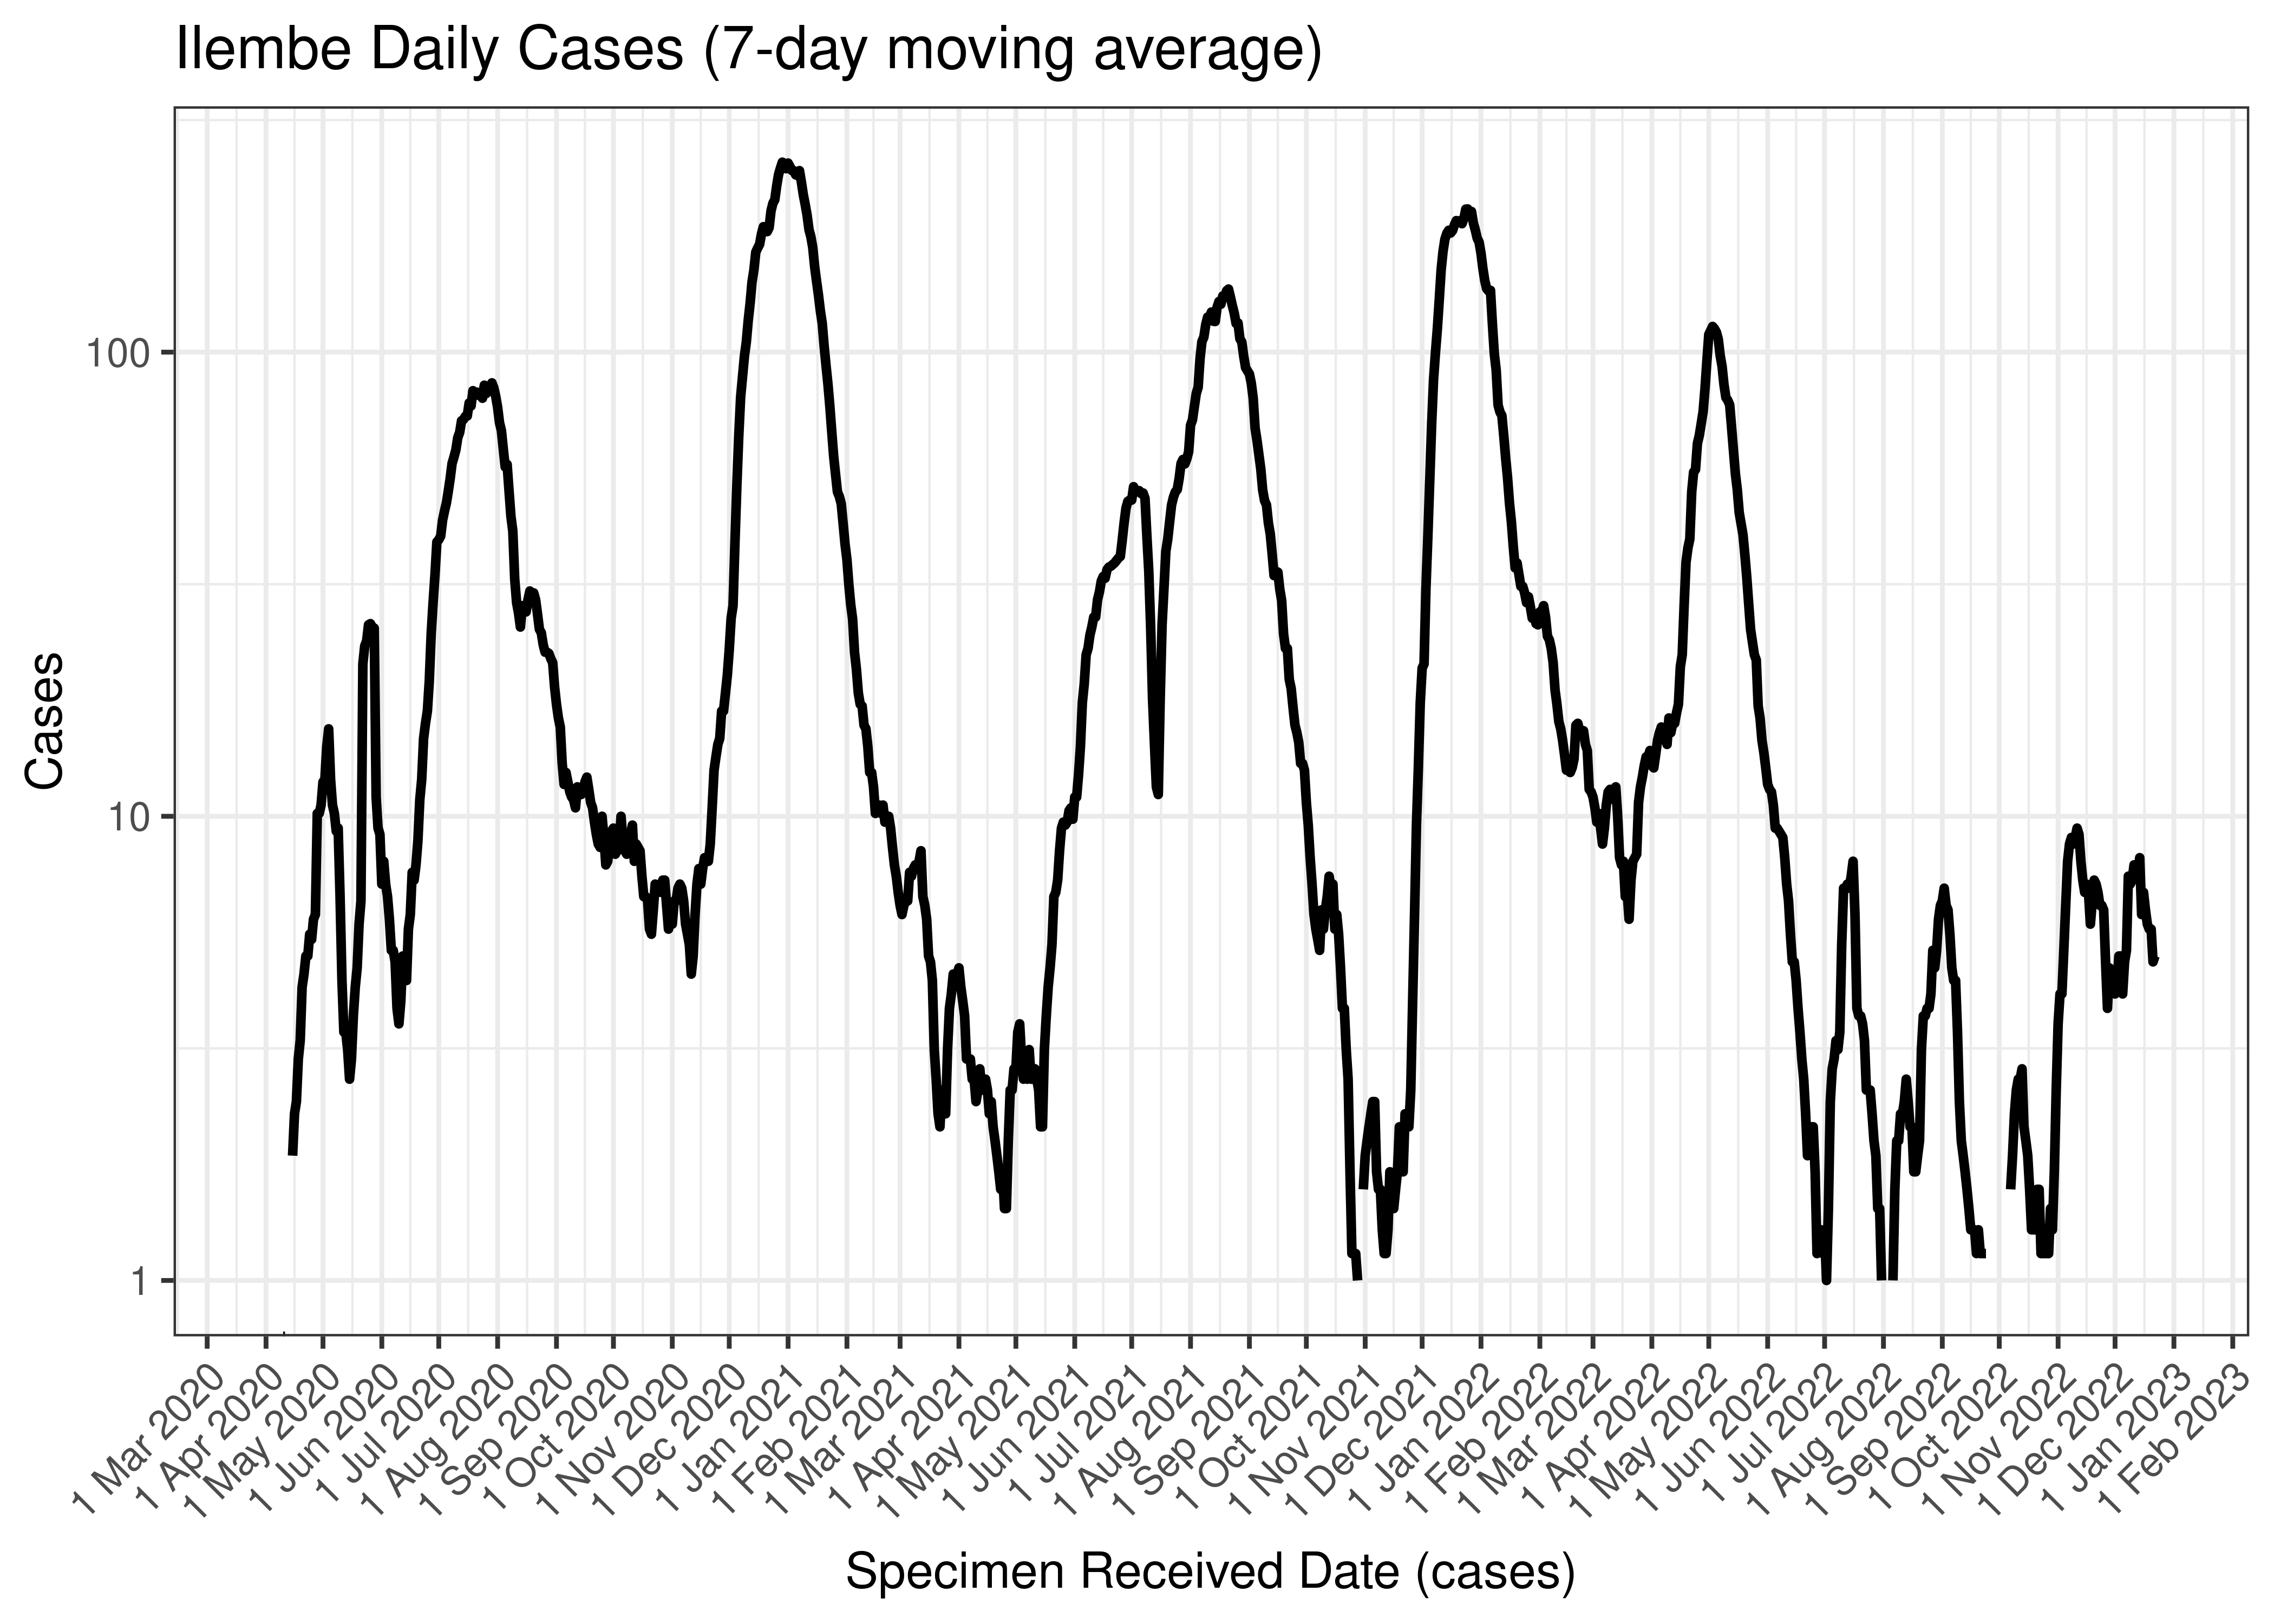
Ilembe Daily Cases (7-day moving average)
Below the above chart is repeated for the last 30-days:
Ilembe Daily Cases for Last 30-days (7-day moving average)
6.5.11.2 Reproduction Number
Below current (last weekly) reproduction number estimates are tabulated for Ilembe.
| Count (Per Day) | Week Ending | Reproduction Number [95% Confidence Interval] | |
|---|---|---|---|
| Ilembe | 5 | 2022-12-25 | 0.81 [0.57 - 1.10] |
Below the effective reproduction number for Ilembe over the last 90 days are plotted together with a plot since start of the pandemic.
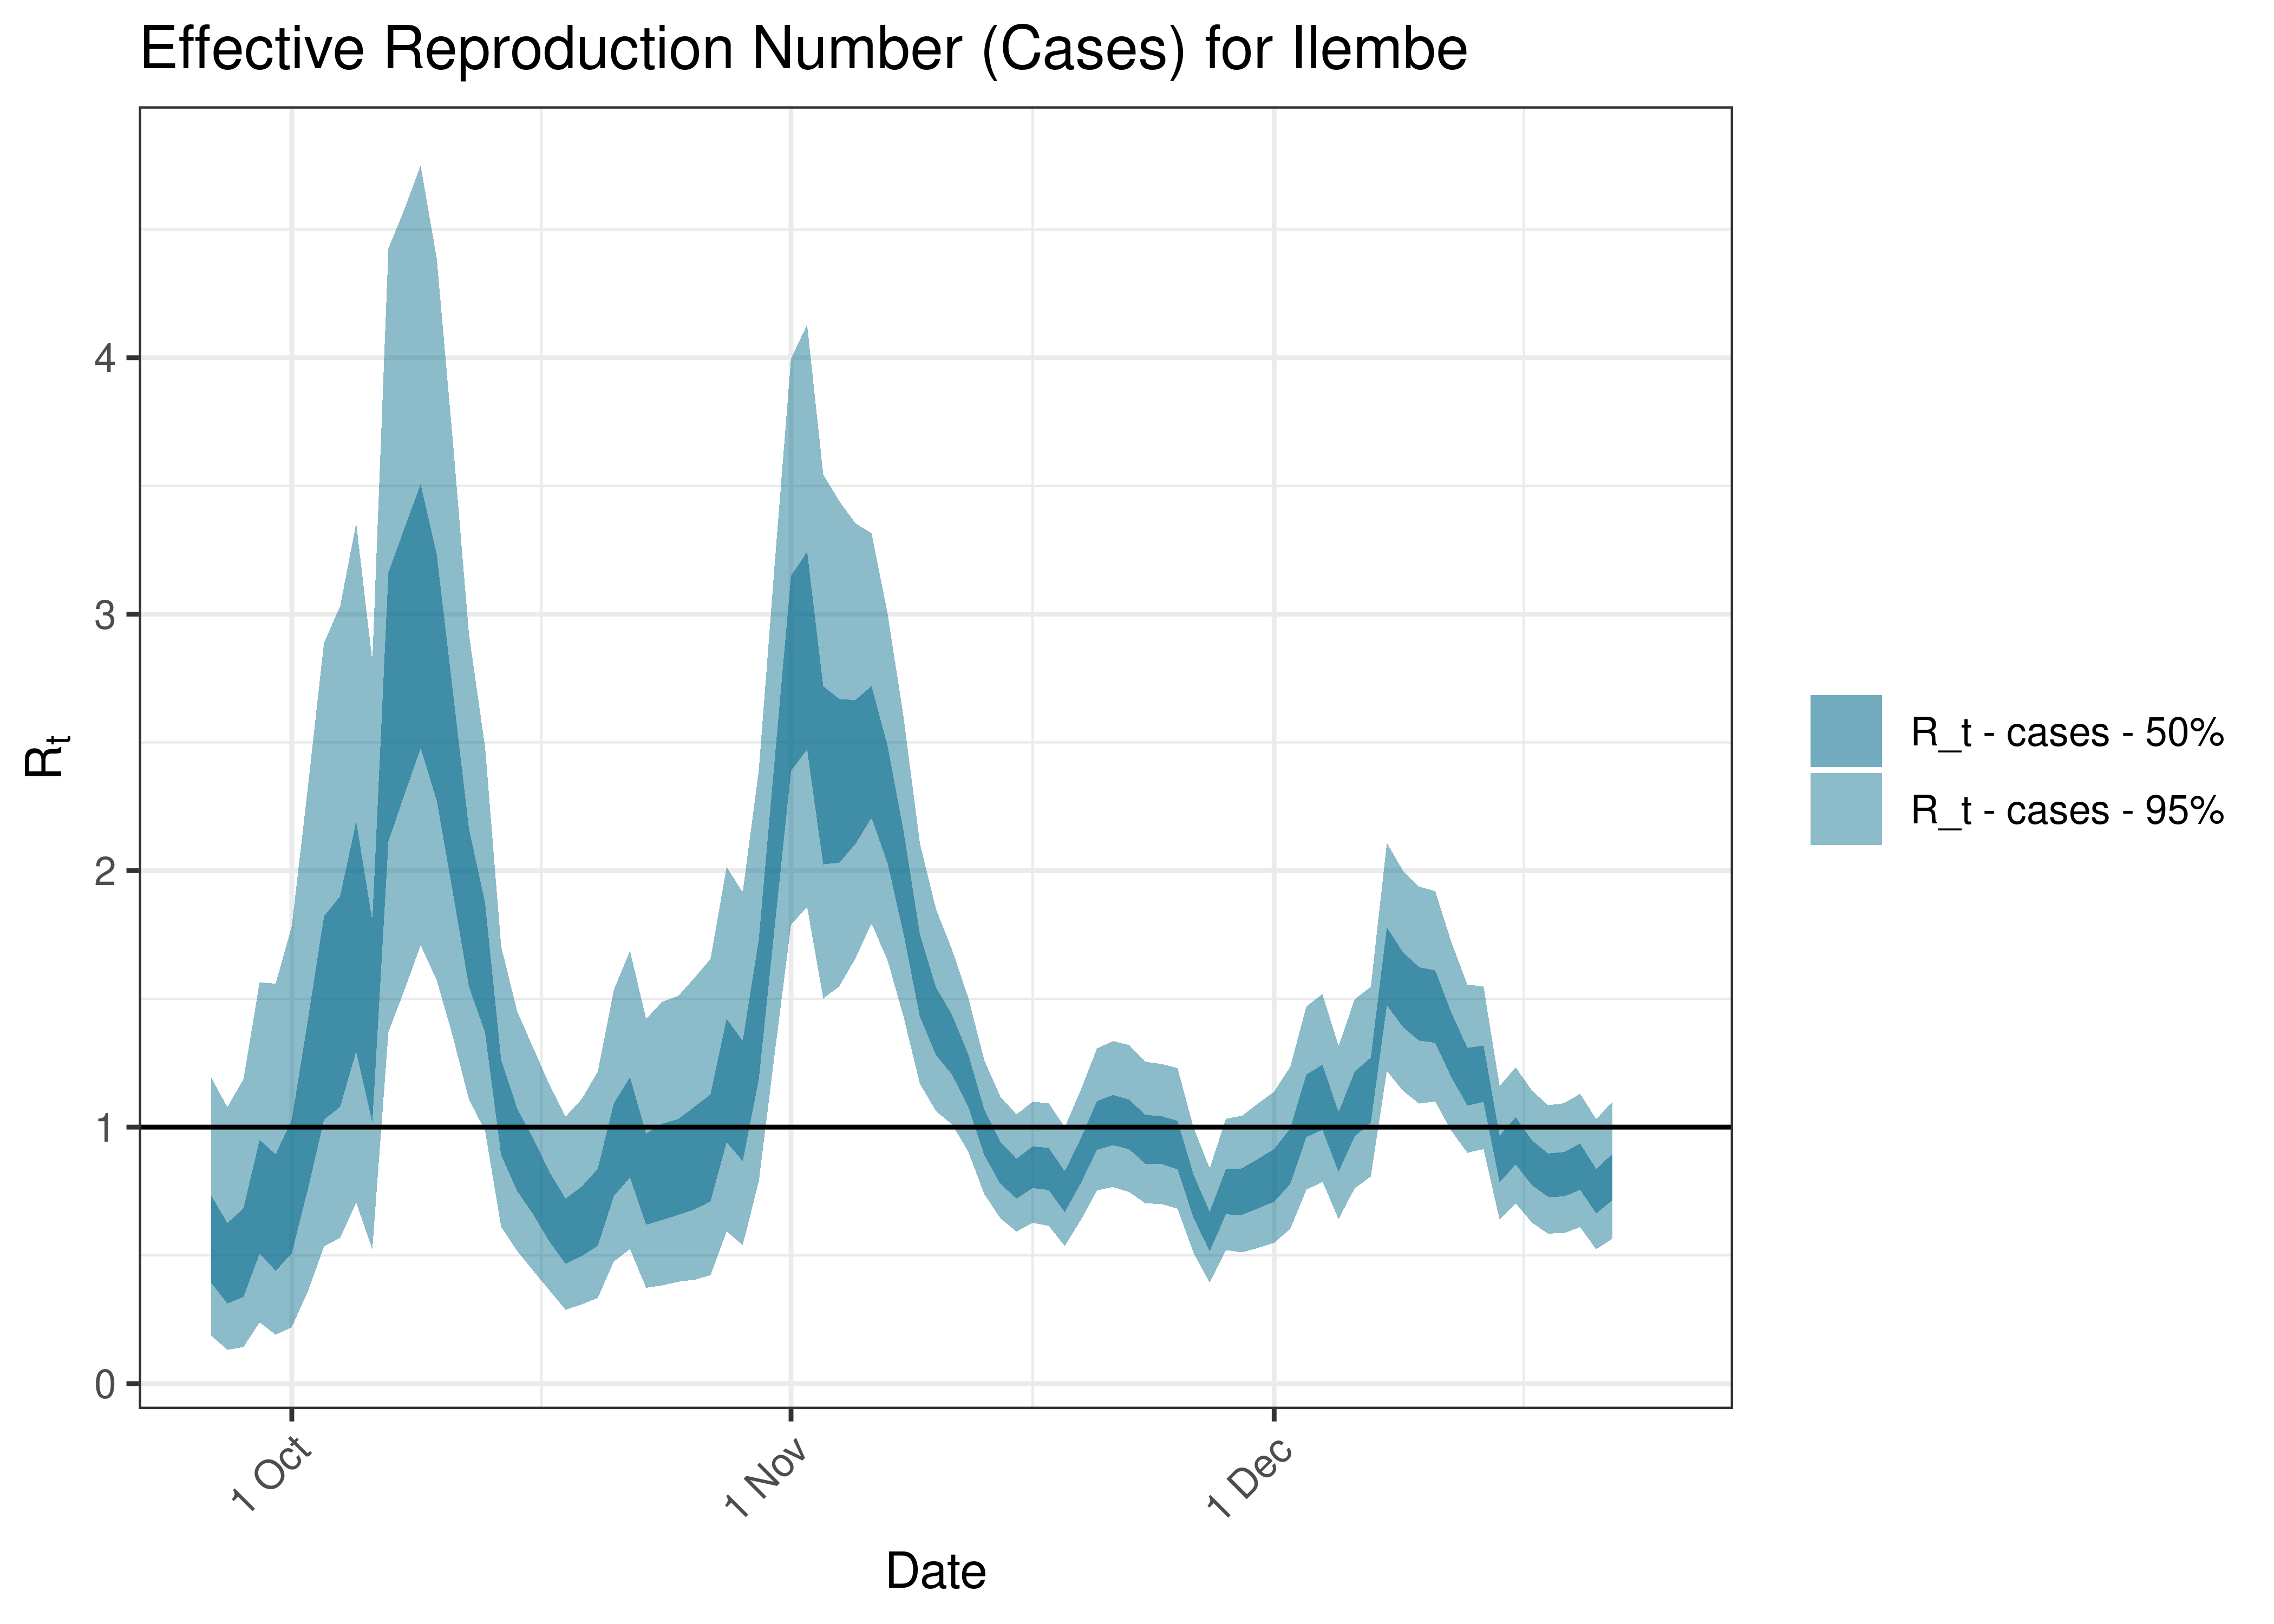
Estimated Effective Reproduction Number Based on Cases for Ilembe over last 90 days
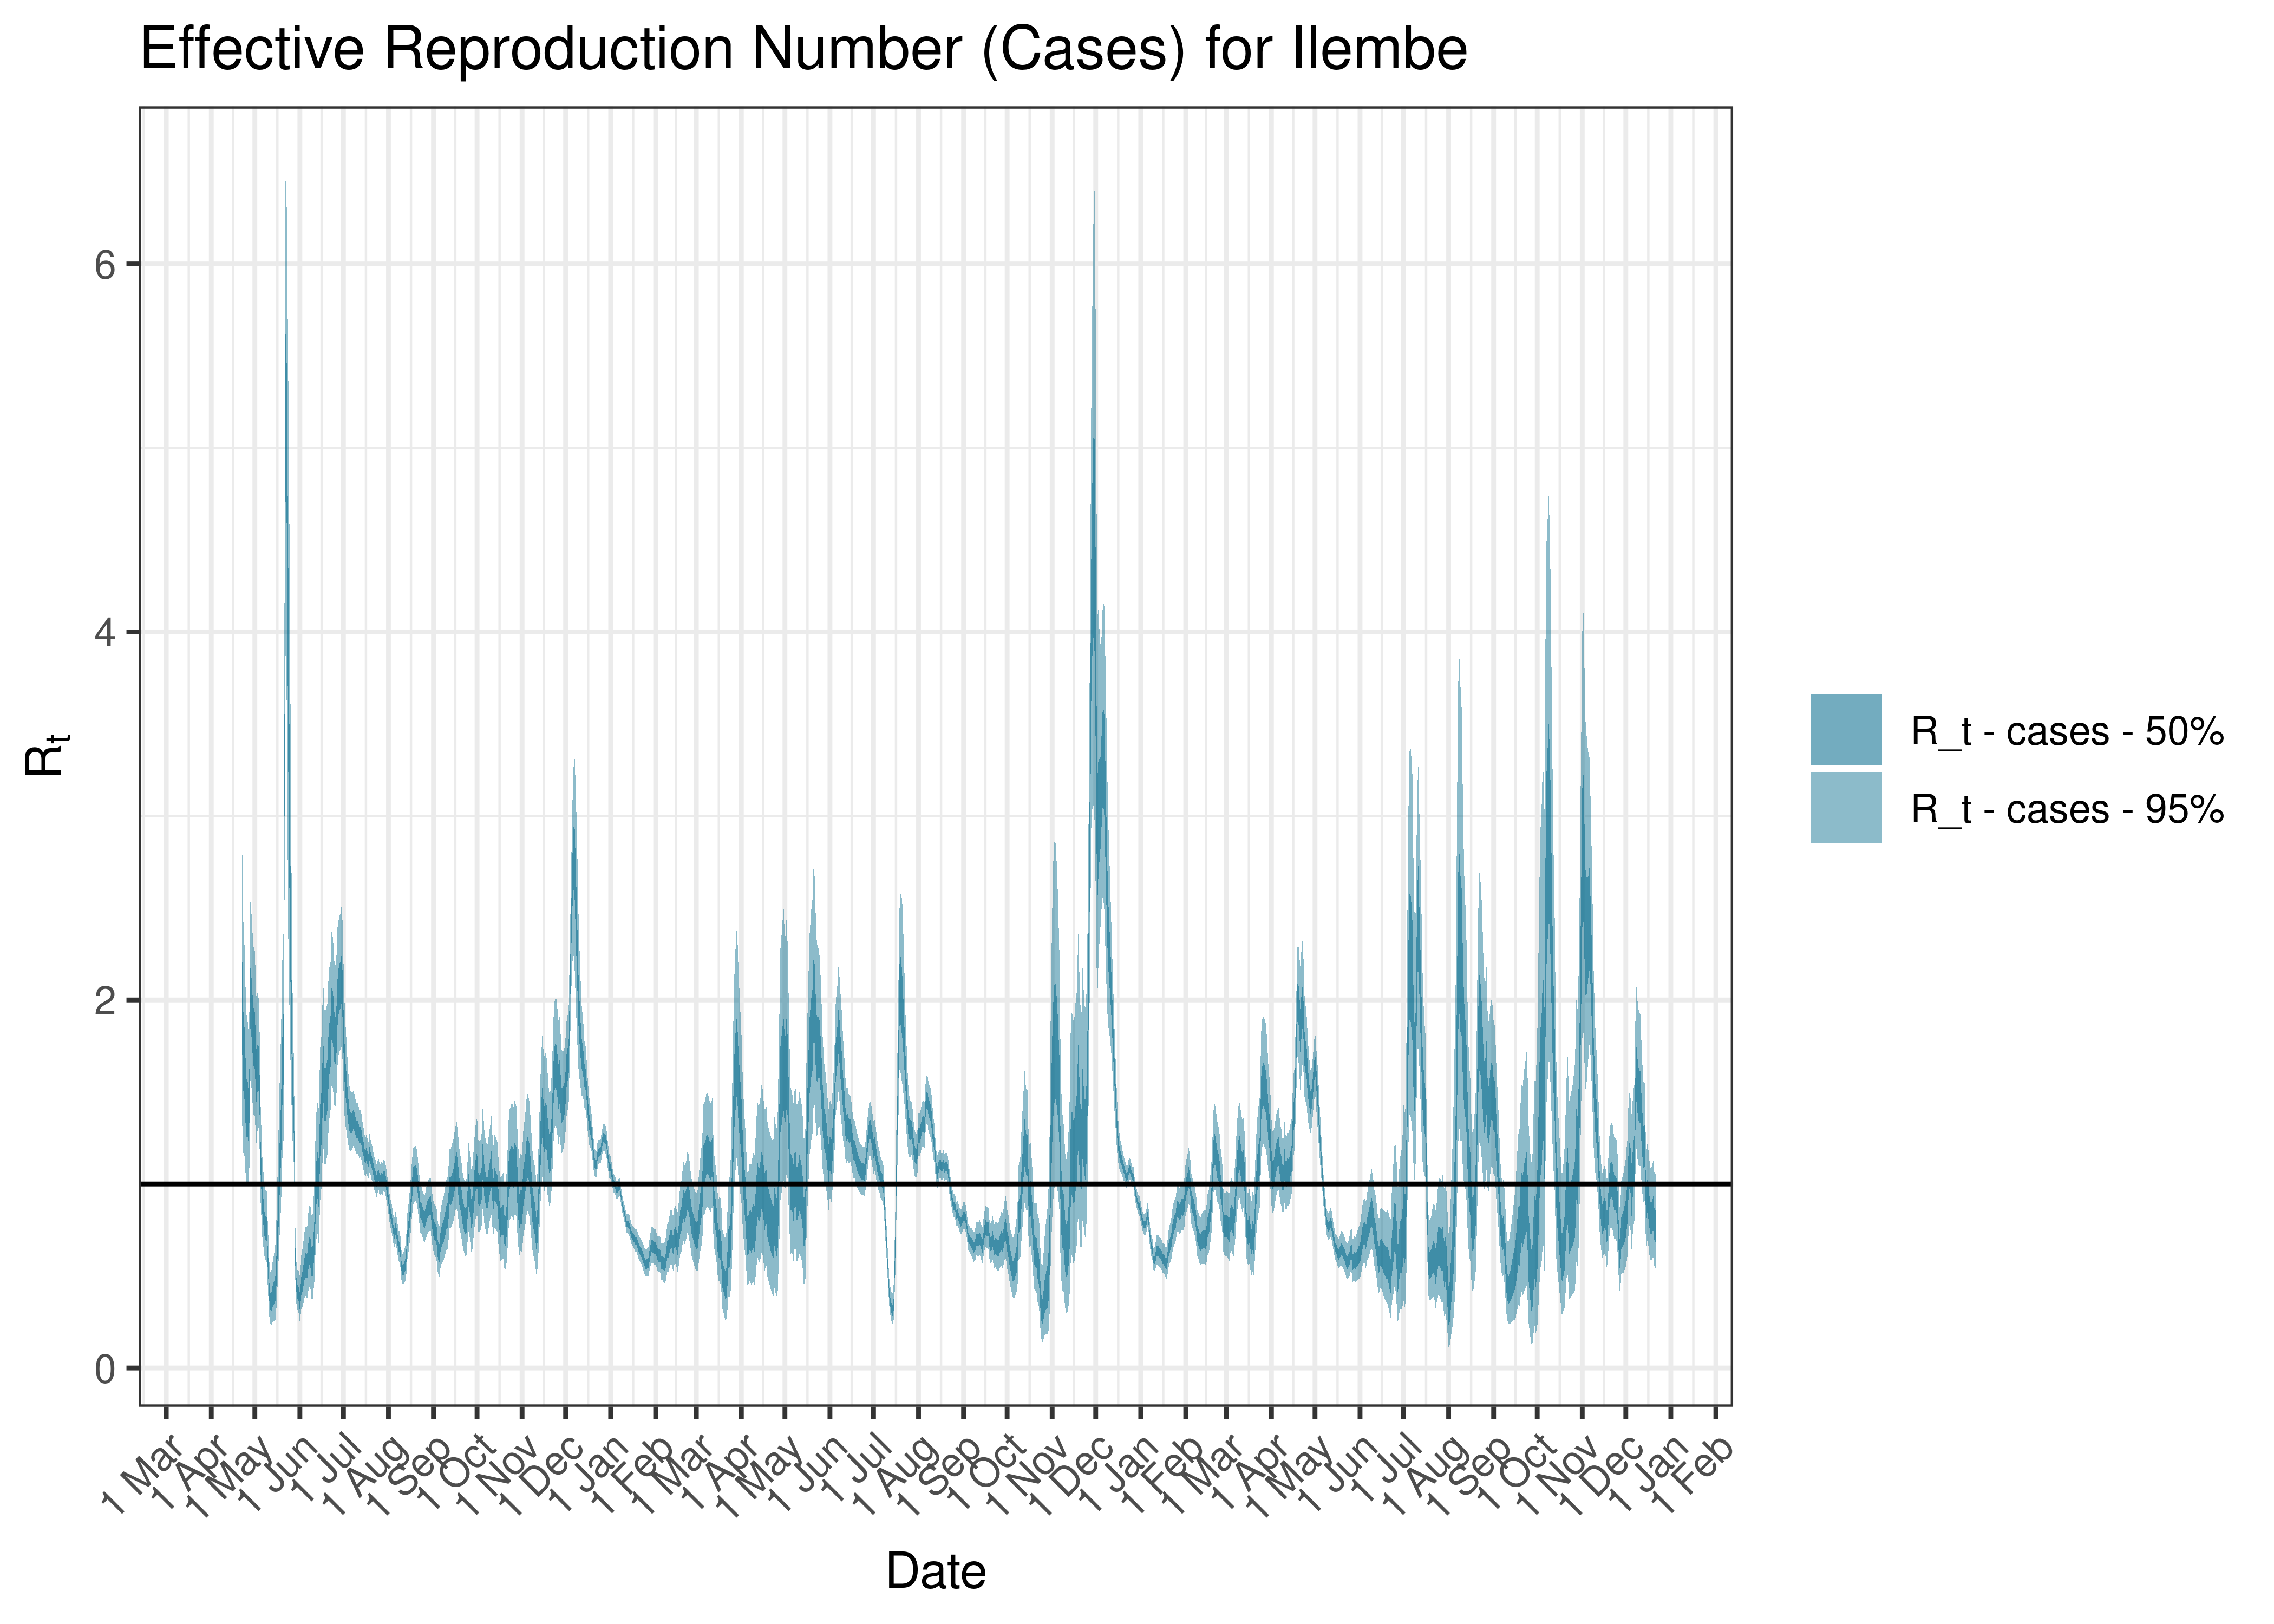
Estimated Effective Reproduction Number Based on Cases for Ilembe since 1 April 2020
6.5.12 King Cetshwayo
6.5.12.1 Cases
Cases are tabulated by specimen received date below. Cases include estimates for late reporting in recent days as well as adjustments for any public holidays. A centred 7-day moving average is also shown. The peak daily cases in previous waves (as measured by the moving average) is also shown.
| Specimen Received Date | Cases | 7-day Moving Average | Comment |
|---|---|---|---|
| 2020-07-23 | 229 | 201 | Wave 1 Peak |
| 2021-01-07 | 507 | 478 | Wave 2 Peak |
| 2021-08-23 | 340 | 257 | Wave 3 Peak |
| 2021-12-17 | 350 | 292 | Wave 4 Peak |
| 2022-05-08 | 20 | 48 | Wave 5 Peak (to date) |
Below a 7-day moving average daily case count are plotted for King Cetshwayo on a log scale since start of the epidemic:
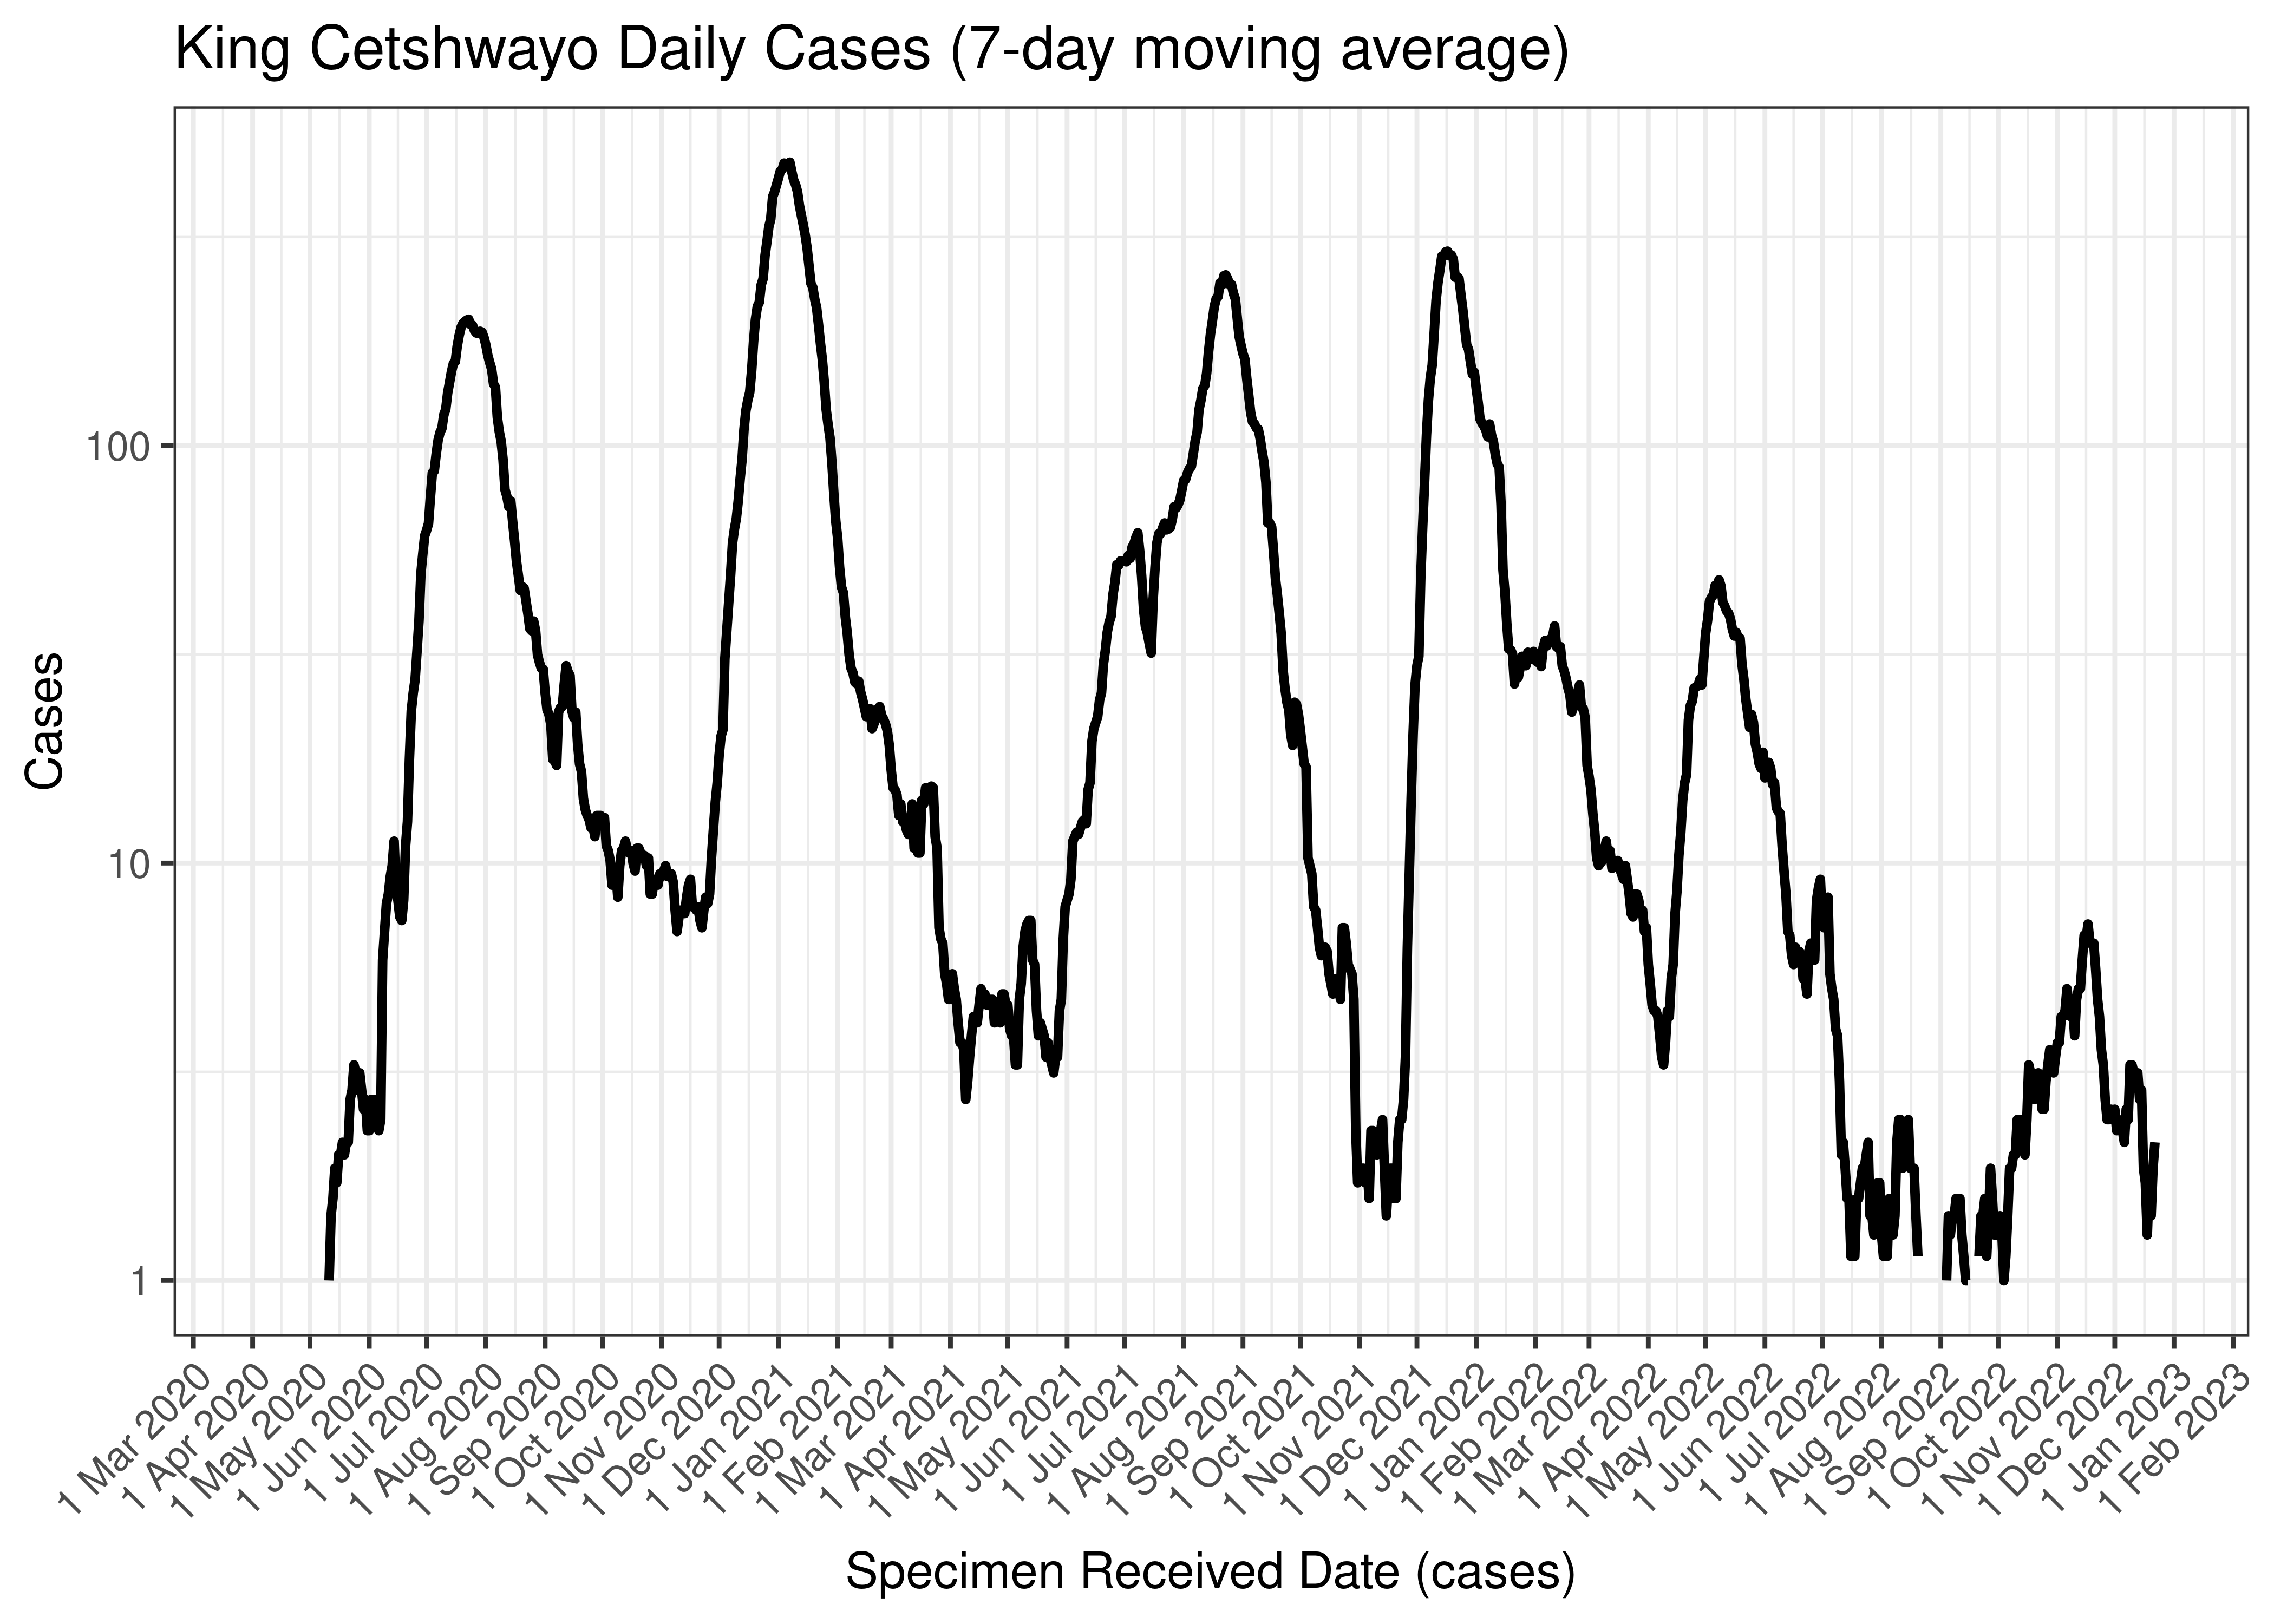
King Cetshwayo Daily Cases (7-day moving average)
Below the above chart is repeated for the last 30-days:

King Cetshwayo Daily Cases for Last 30-days (7-day moving average)
6.5.12.2 Reproduction Number
Below current (last weekly) reproduction number estimates are tabulated for King Cetshwayo.
| Count (Per Day) | Week Ending | Reproduction Number [95% Confidence Interval] | |
|---|---|---|---|
| King Cetshwayo | 2.1 | 2022-12-25 | 1.17 [0.66 - 1.84] |
Below the effective reproduction number for King Cetshwayo over the last 90 days are plotted together with a plot since start of the pandemic.
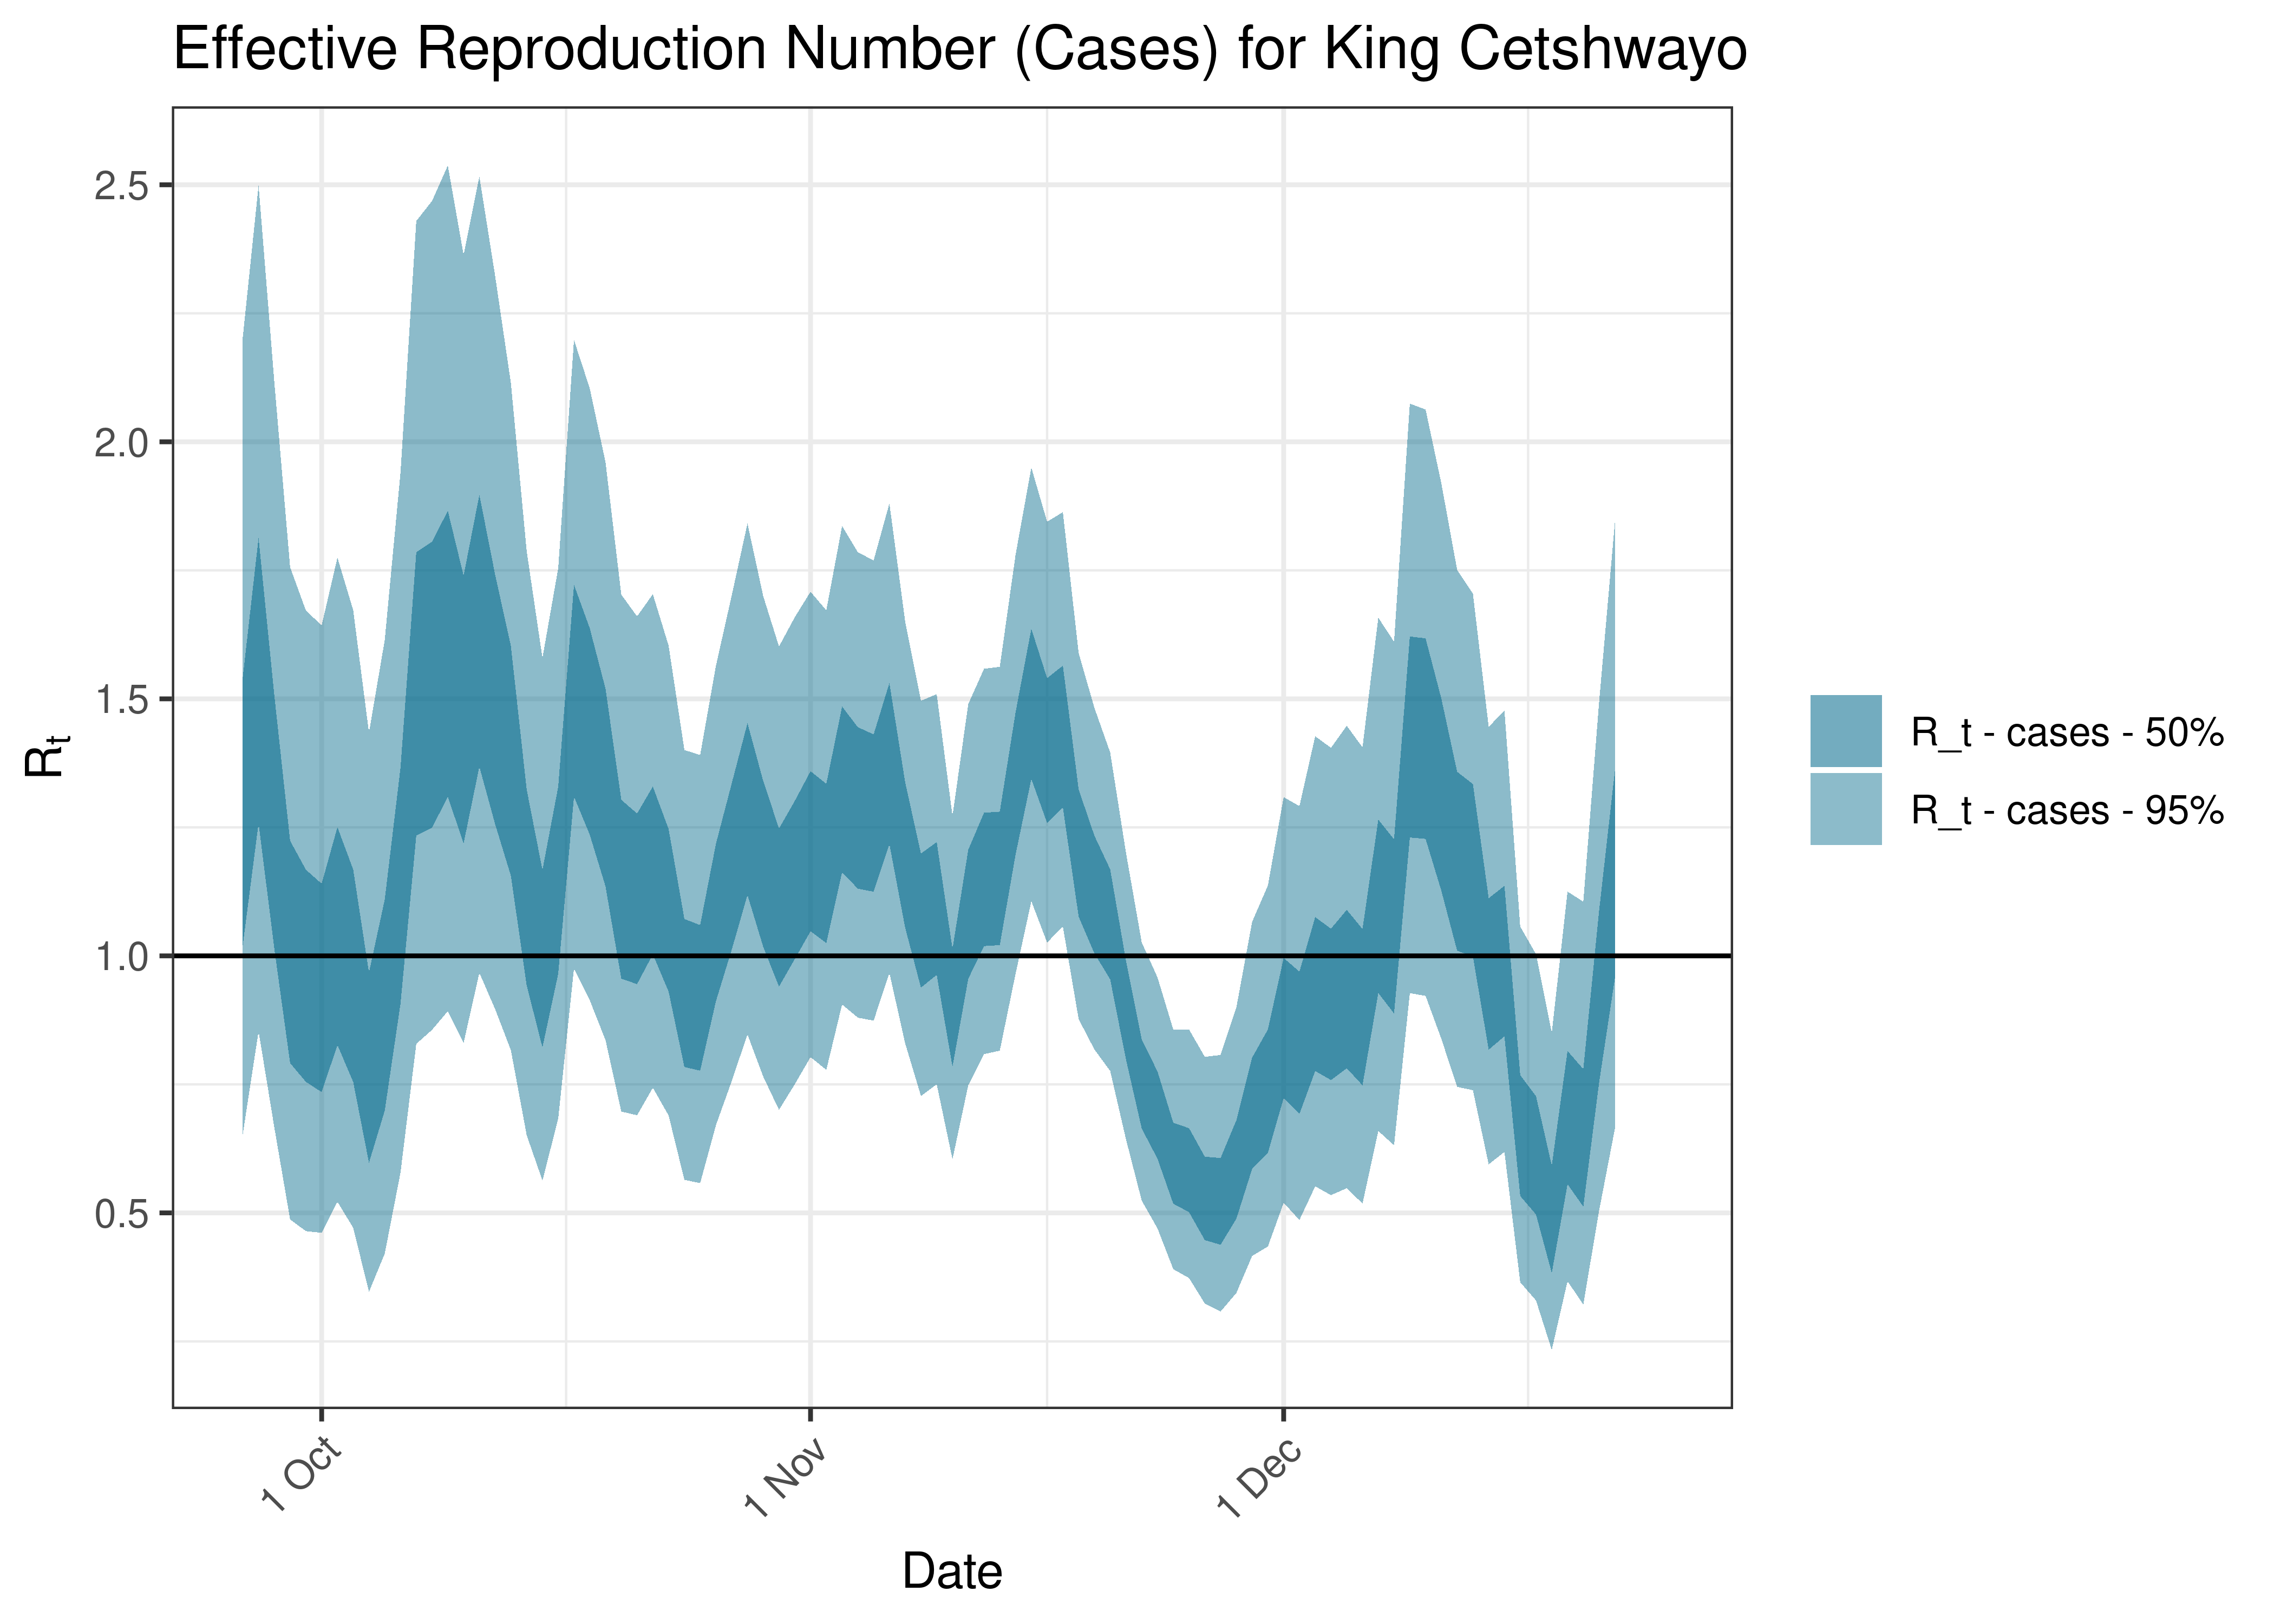
Estimated Effective Reproduction Number Based on Cases for King Cetshwayo over last 90 days
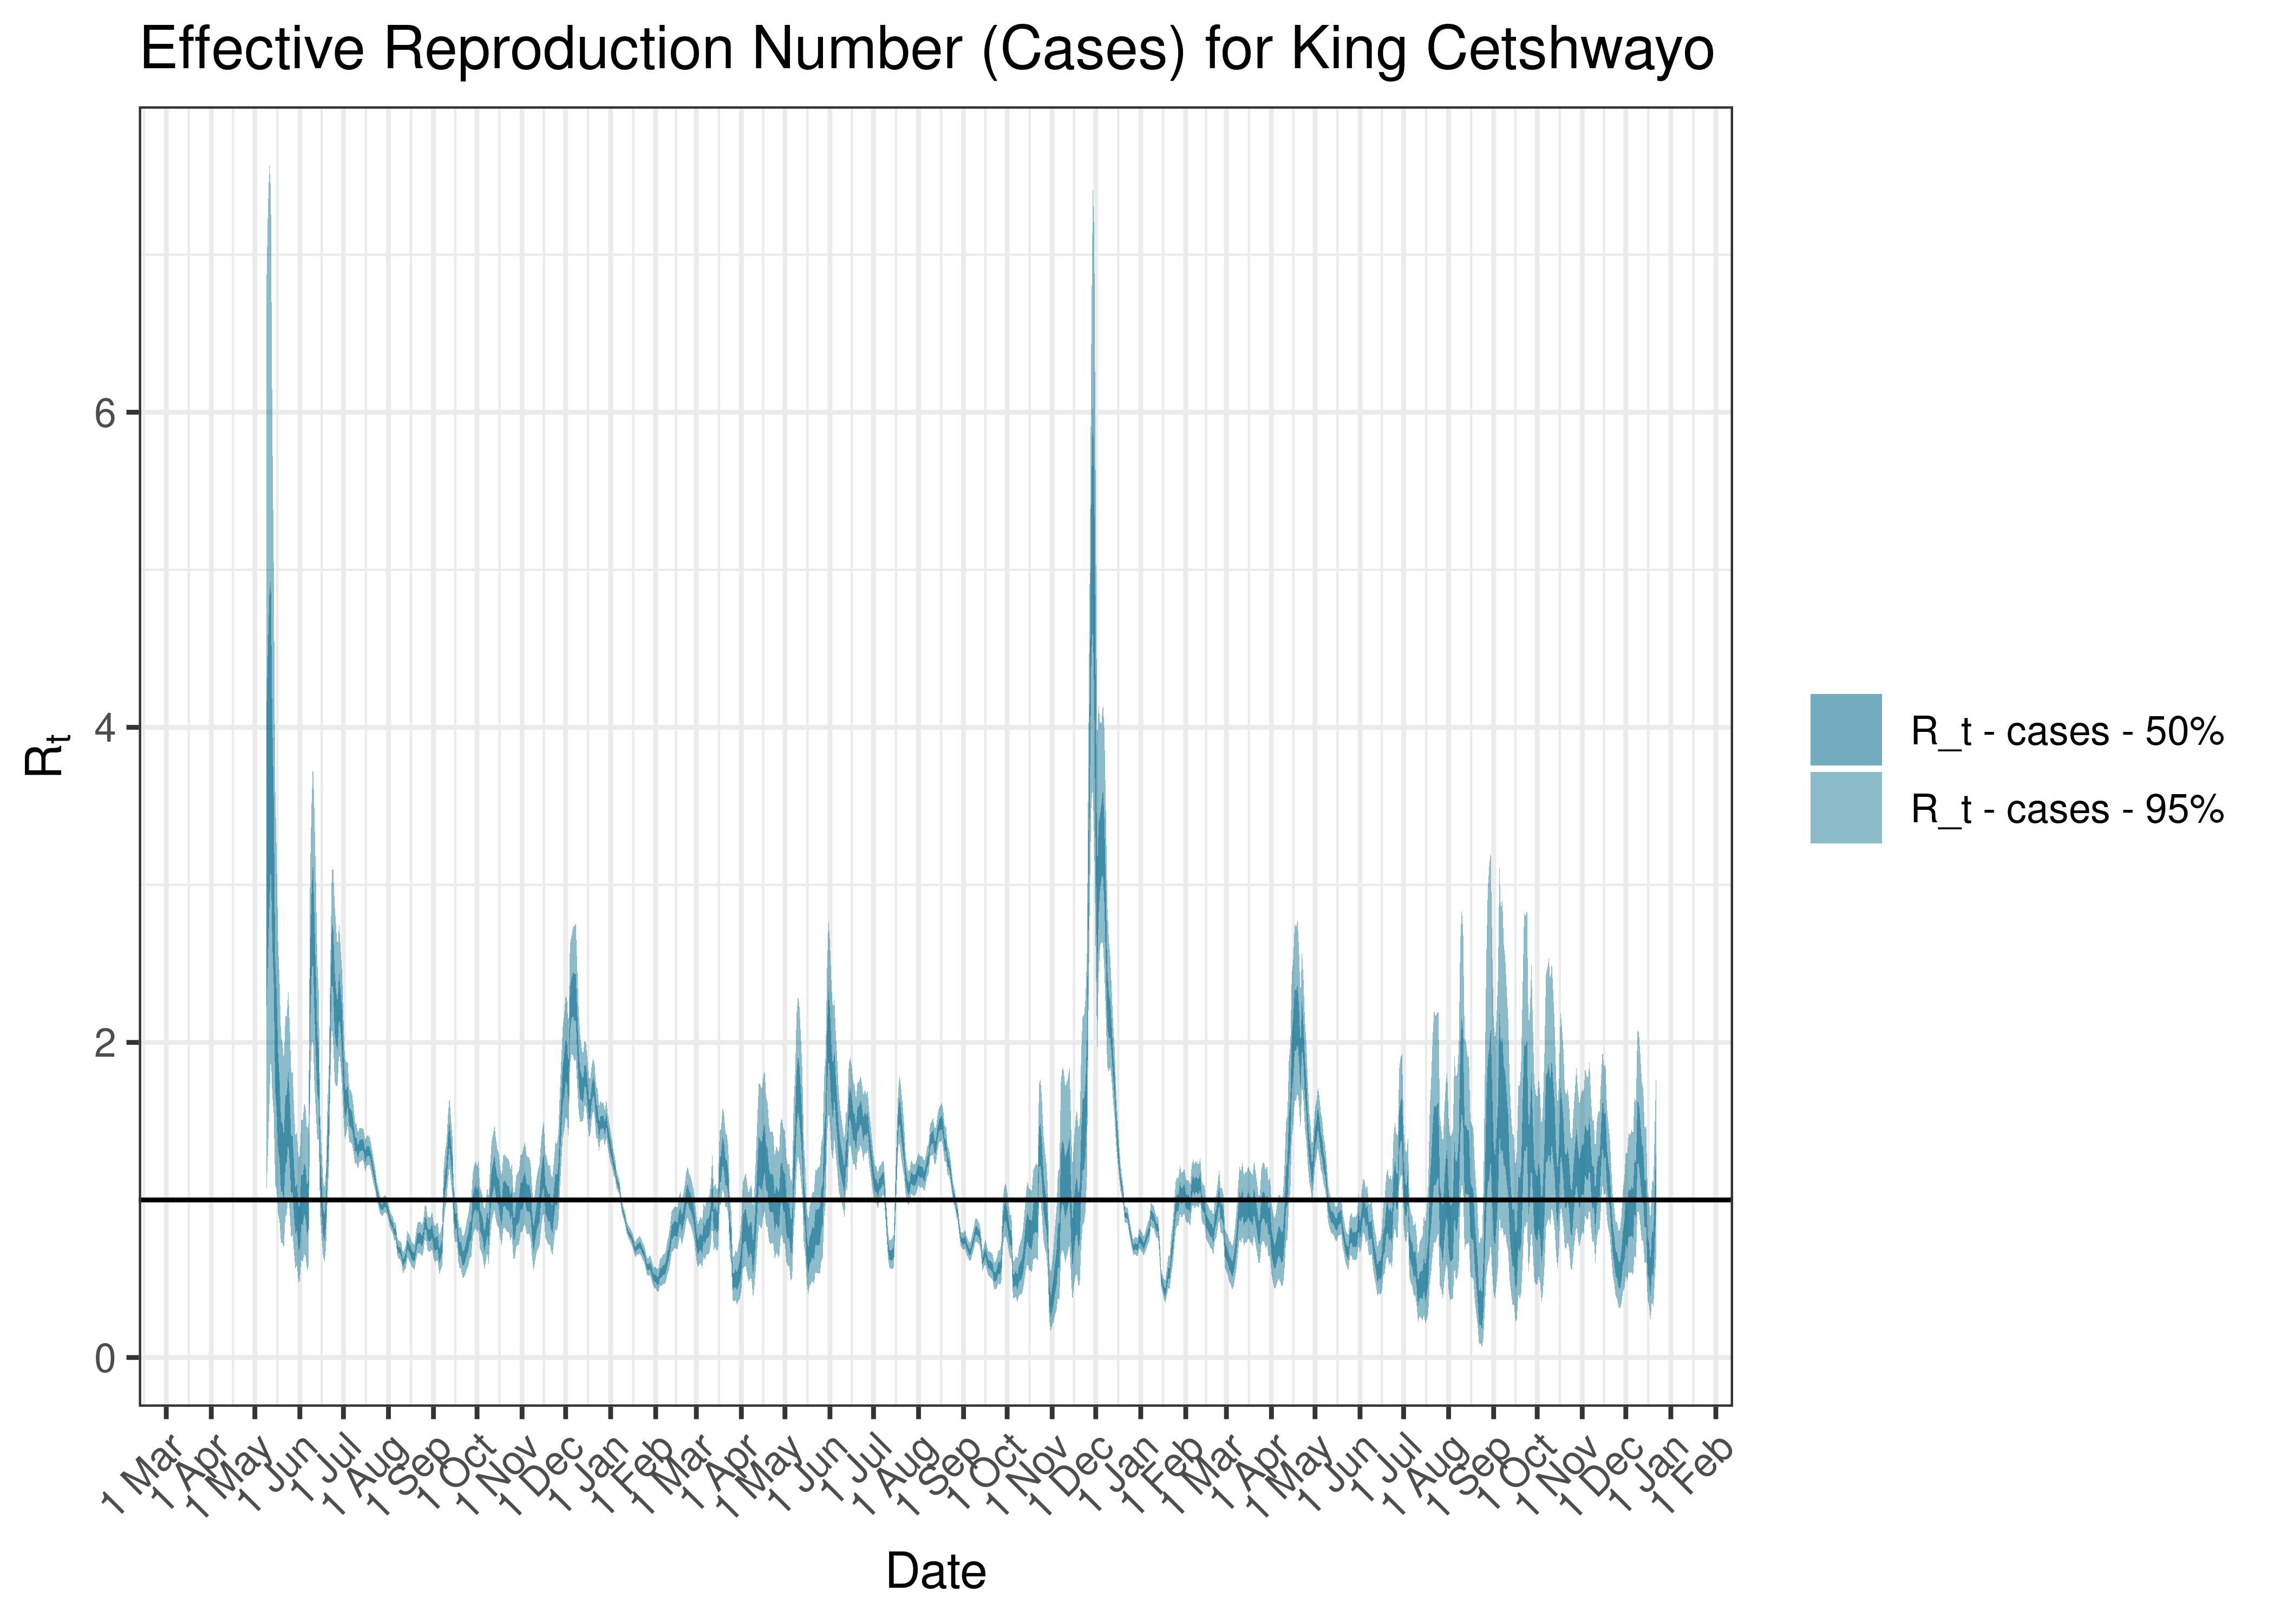
Estimated Effective Reproduction Number Based on Cases for King Cetshwayo since 1 April 2020
6.5.13 Ugu
6.5.13.1 Cases
Cases are tabulated by specimen received date below. Cases include estimates for late reporting in recent days as well as adjustments for any public holidays. A centred 7-day moving average is also shown. The peak daily cases in previous waves (as measured by the moving average) is also shown.
| Specimen Received Date | Cases | 7-day Moving Average | Comment |
|---|---|---|---|
| 2020-07-20 | 149 | 120 | Wave 1 Peak |
| 2020-12-29 | 370 | 282 | Wave 2 Peak |
| 2021-08-18 | 164 | 128 | Wave 3 Peak |
| 2021-12-17 | 268 | 242 | Wave 4 Peak |
| 2022-05-08 | 15 | 55 | Wave 5 Peak (to date) |
Below a 7-day moving average daily case count are plotted for Ugu on a log scale since start of the epidemic:
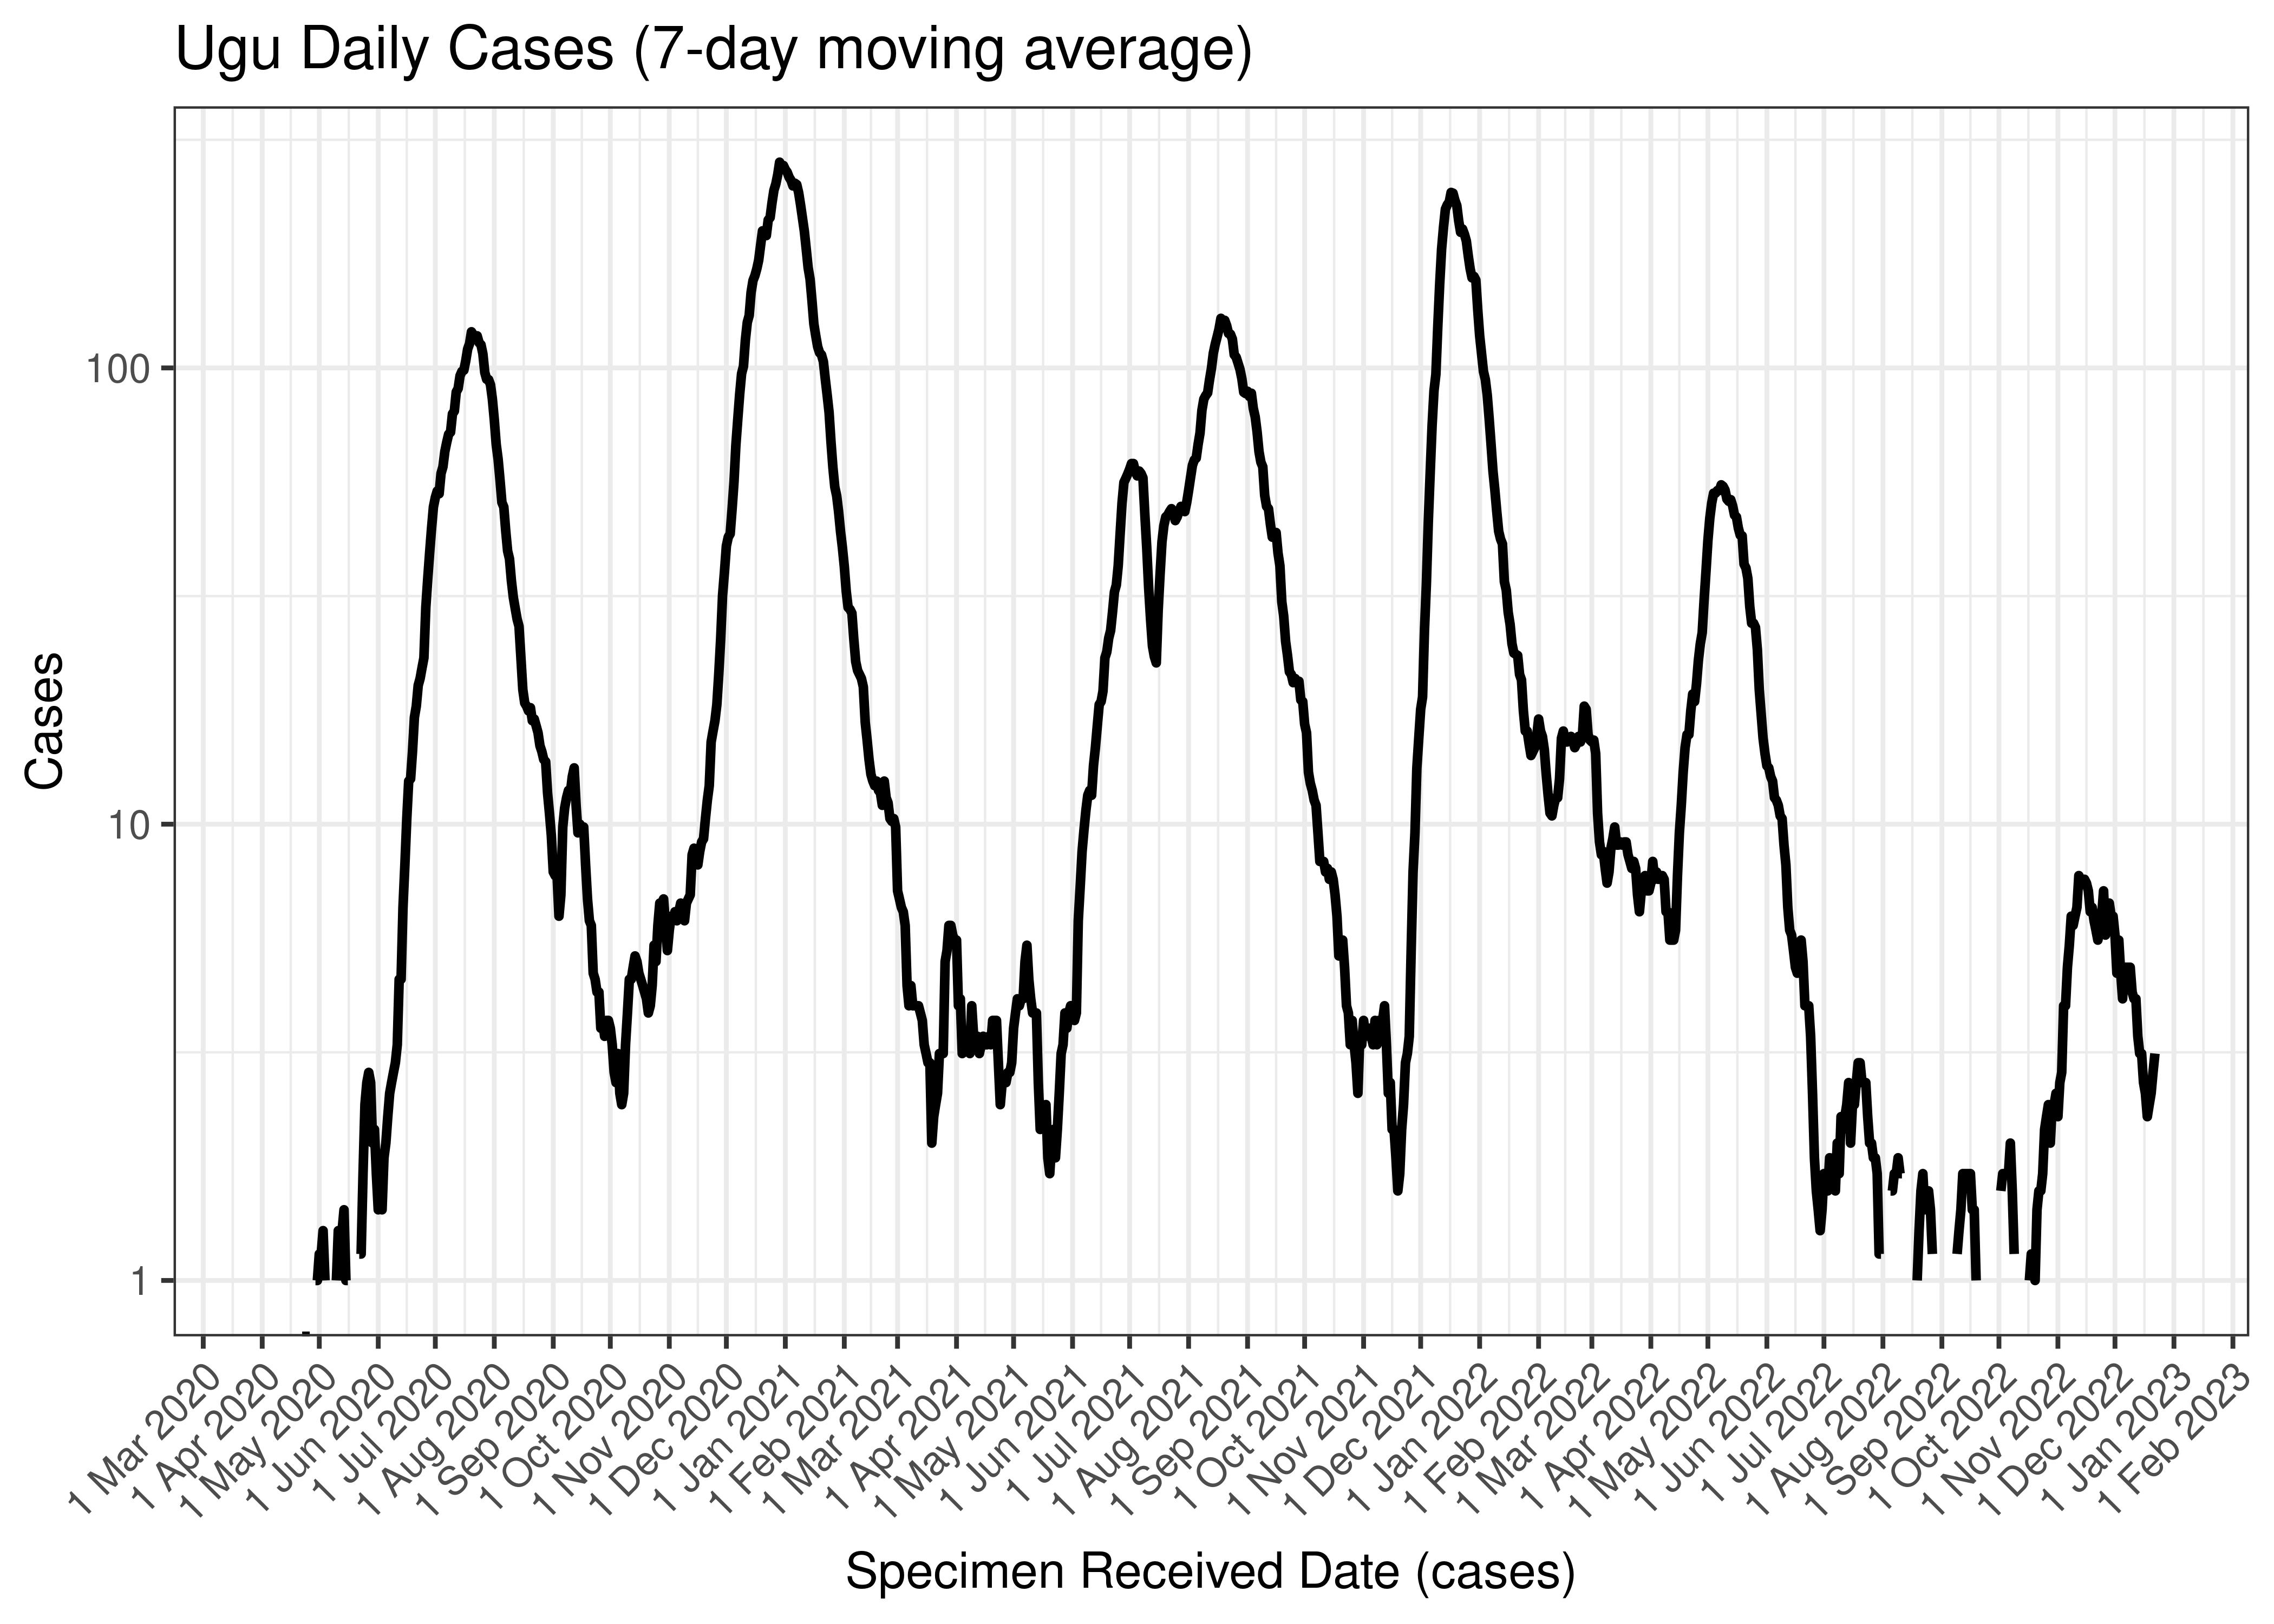
Ugu Daily Cases (7-day moving average)
Below the above chart is repeated for the last 30-days:
Ugu Daily Cases for Last 30-days (7-day moving average)
6.5.13.2 Reproduction Number
Below current (last weekly) reproduction number estimates are tabulated for Ugu.
| Count (Per Day) | Week Ending | Reproduction Number [95% Confidence Interval] | |
|---|---|---|---|
| Ugu | 3.1 | 2022-12-25 | 1.19 [0.75 - 1.73] |
Below the effective reproduction number for Ugu over the last 90 days are plotted together with a plot since start of the pandemic.
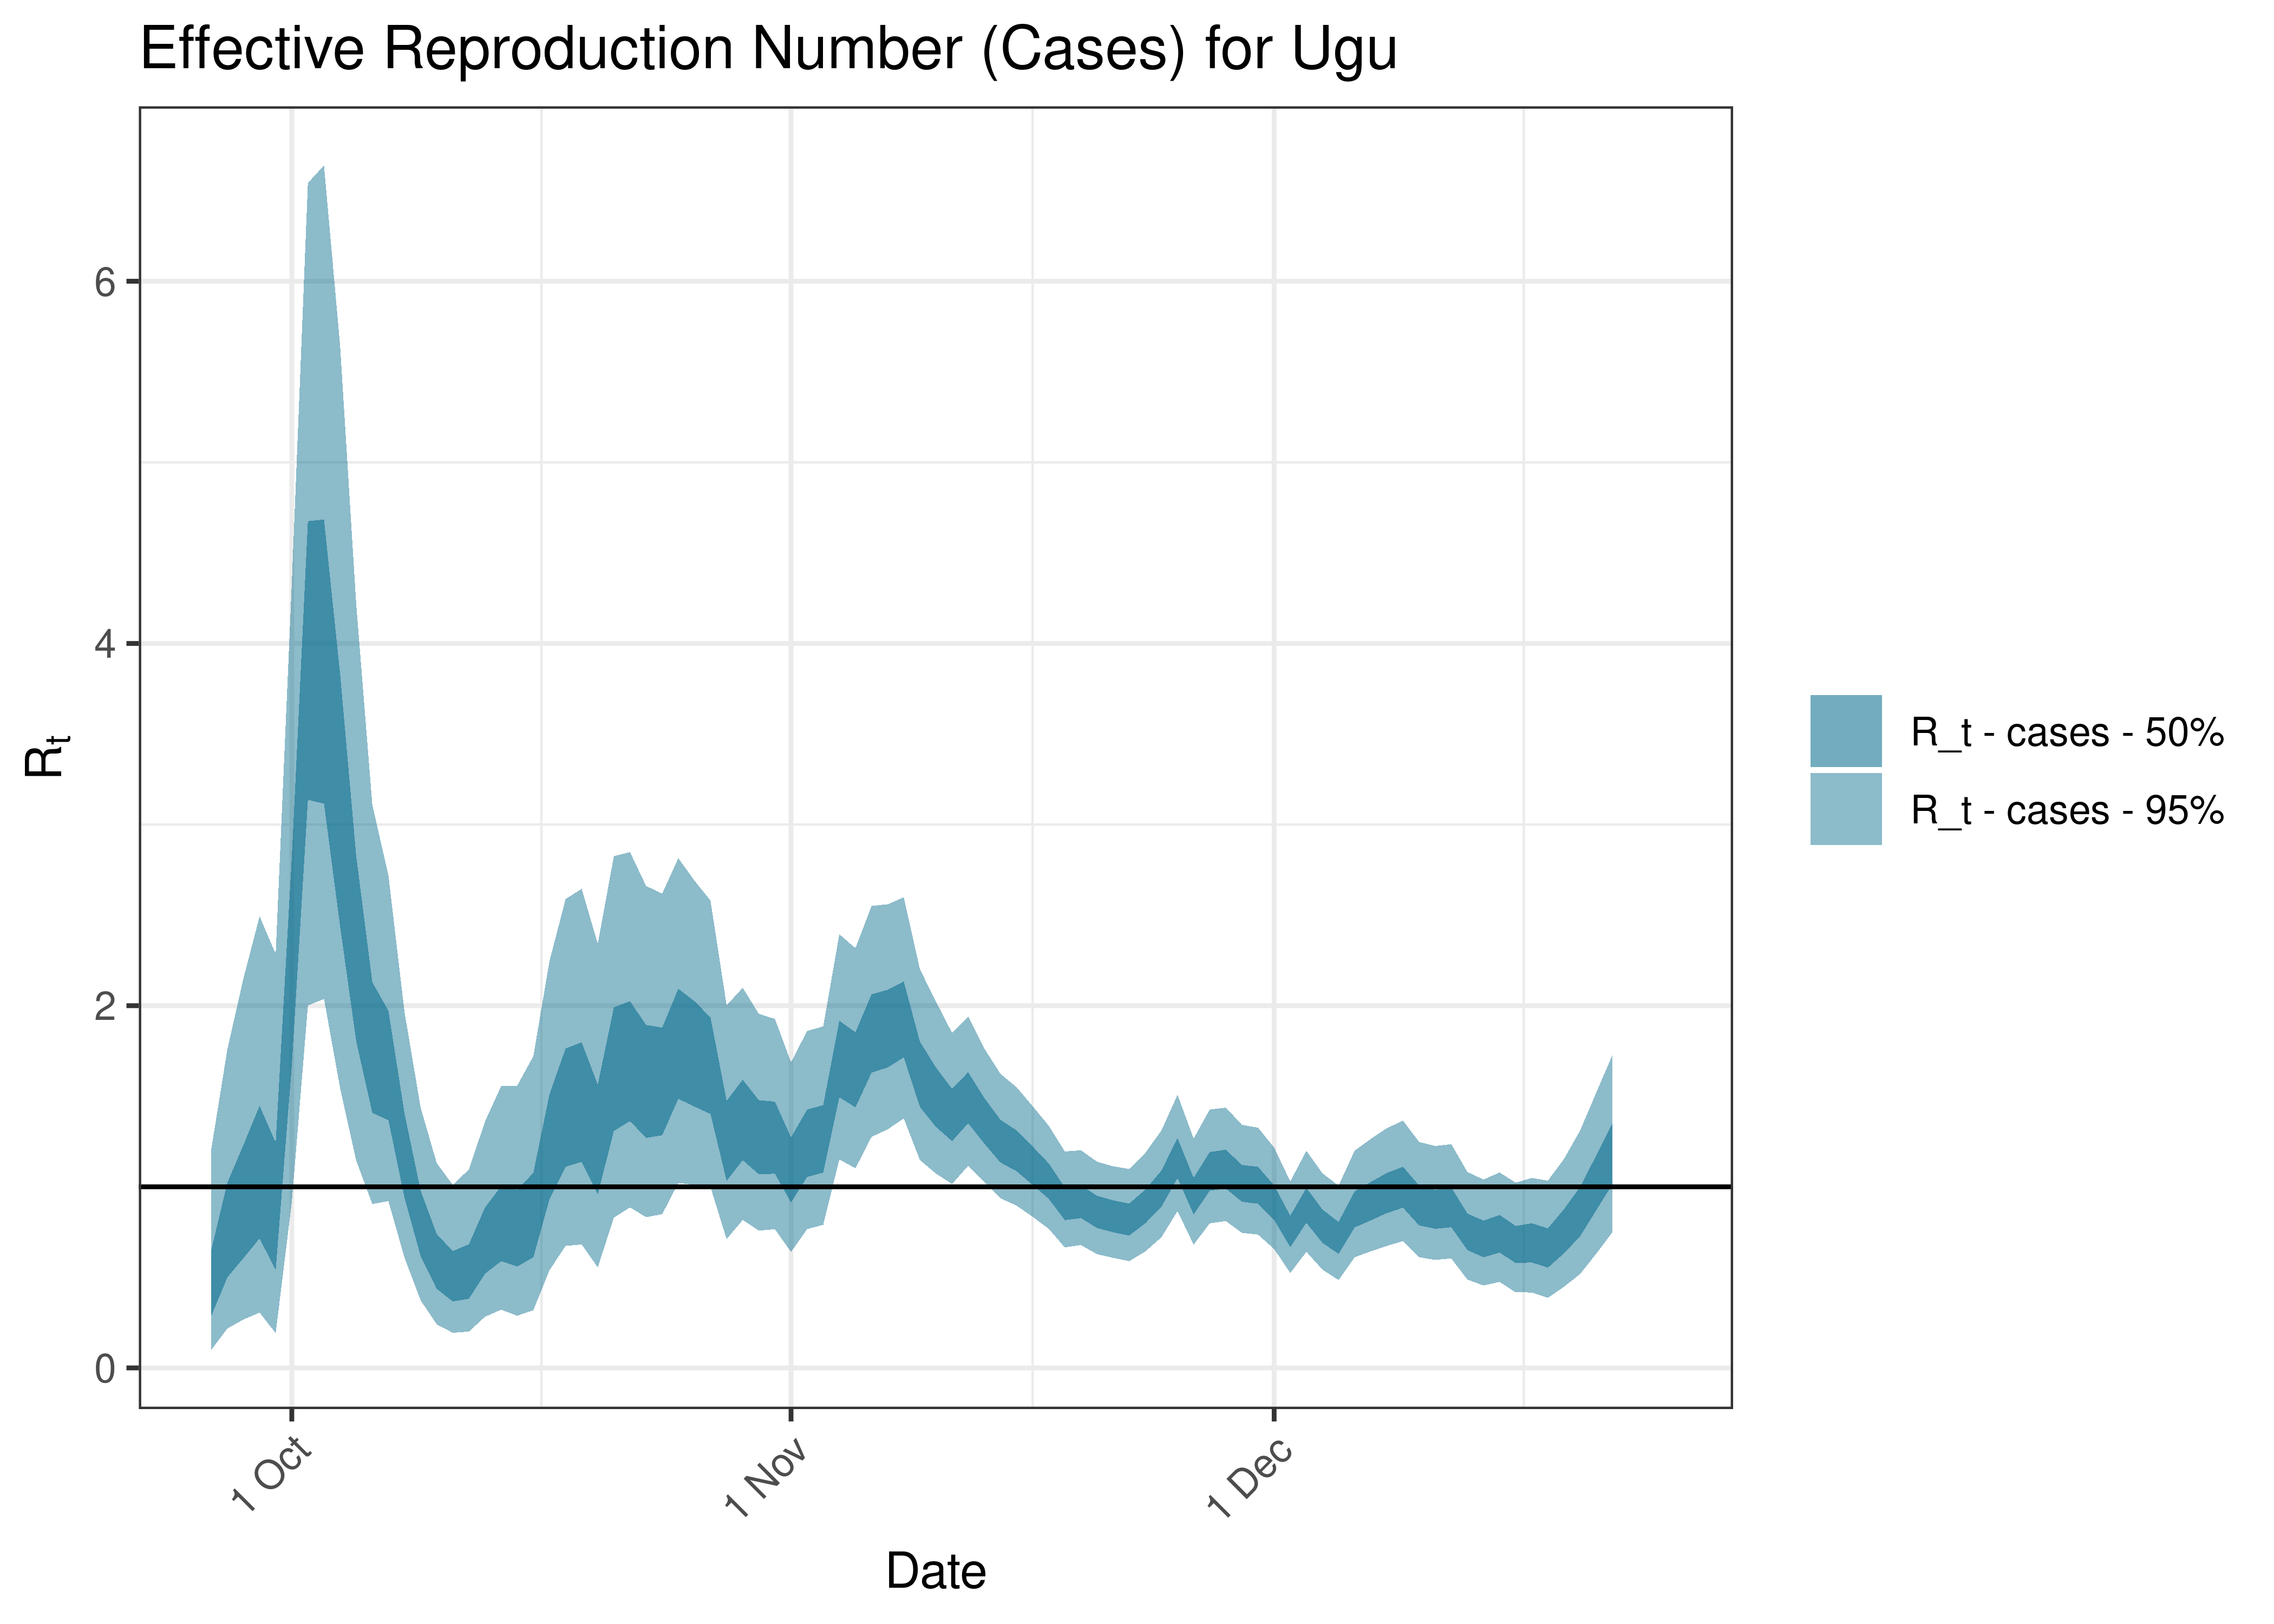
Estimated Effective Reproduction Number Based on Cases for Ugu over last 90 days
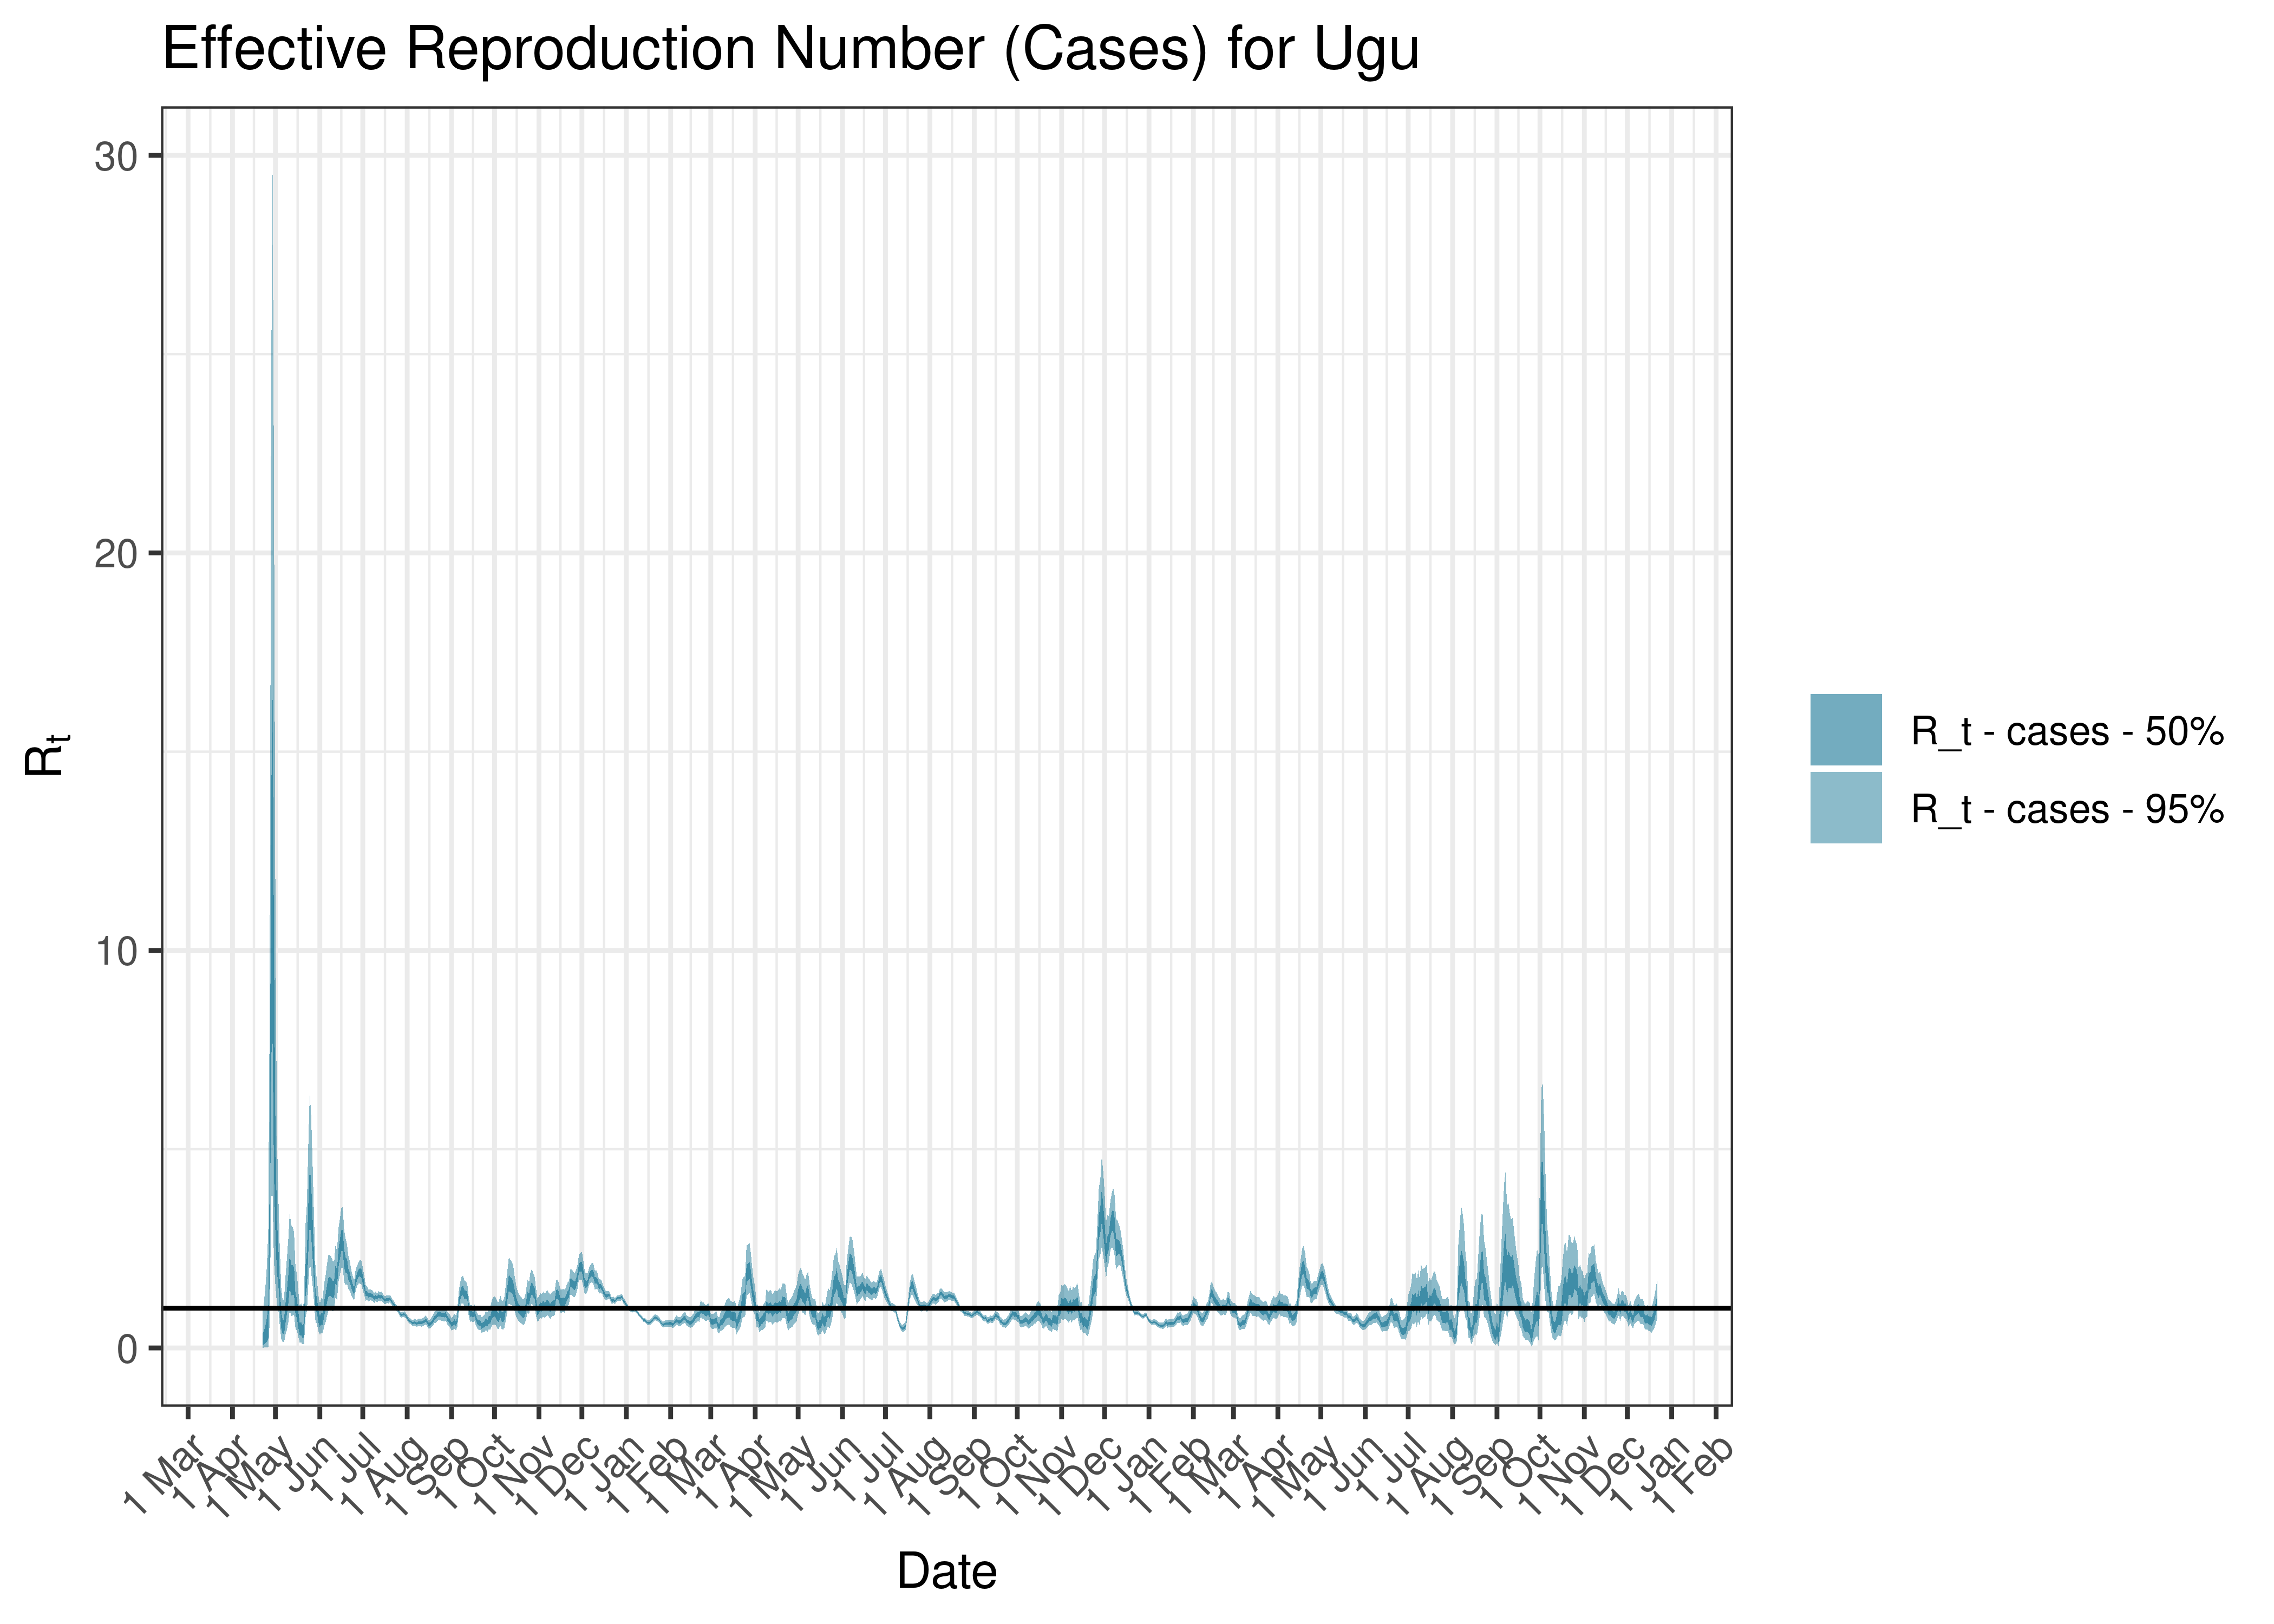
Estimated Effective Reproduction Number Based on Cases for Ugu since 1 April 2020
6.5.14 Umgungundlovu
6.5.14.1 Cases
Cases are tabulated by specimen received date below. Cases include estimates for late reporting in recent days as well as adjustments for any public holidays. A centred 7-day moving average is also shown. The peak daily cases in previous waves (as measured by the moving average) is also shown.
| Specimen Received Date | Cases | 7-day Moving Average | Comment |
|---|---|---|---|
| 2020-07-17 | 438 | 381 | Wave 1 Peak |
| 2021-01-04 | 654 | 582 | Wave 2 Peak |
| 2021-08-10 | 633 | 492 | Wave 3 Peak |
| 2021-12-14 | 625 | 500 | Wave 4 Peak |
| 2022-05-04 | 237 | 215 | Wave 5 Peak (to date) |
Below a 7-day moving average daily case count are plotted for Umgungundlovu on a log scale since start of the epidemic:
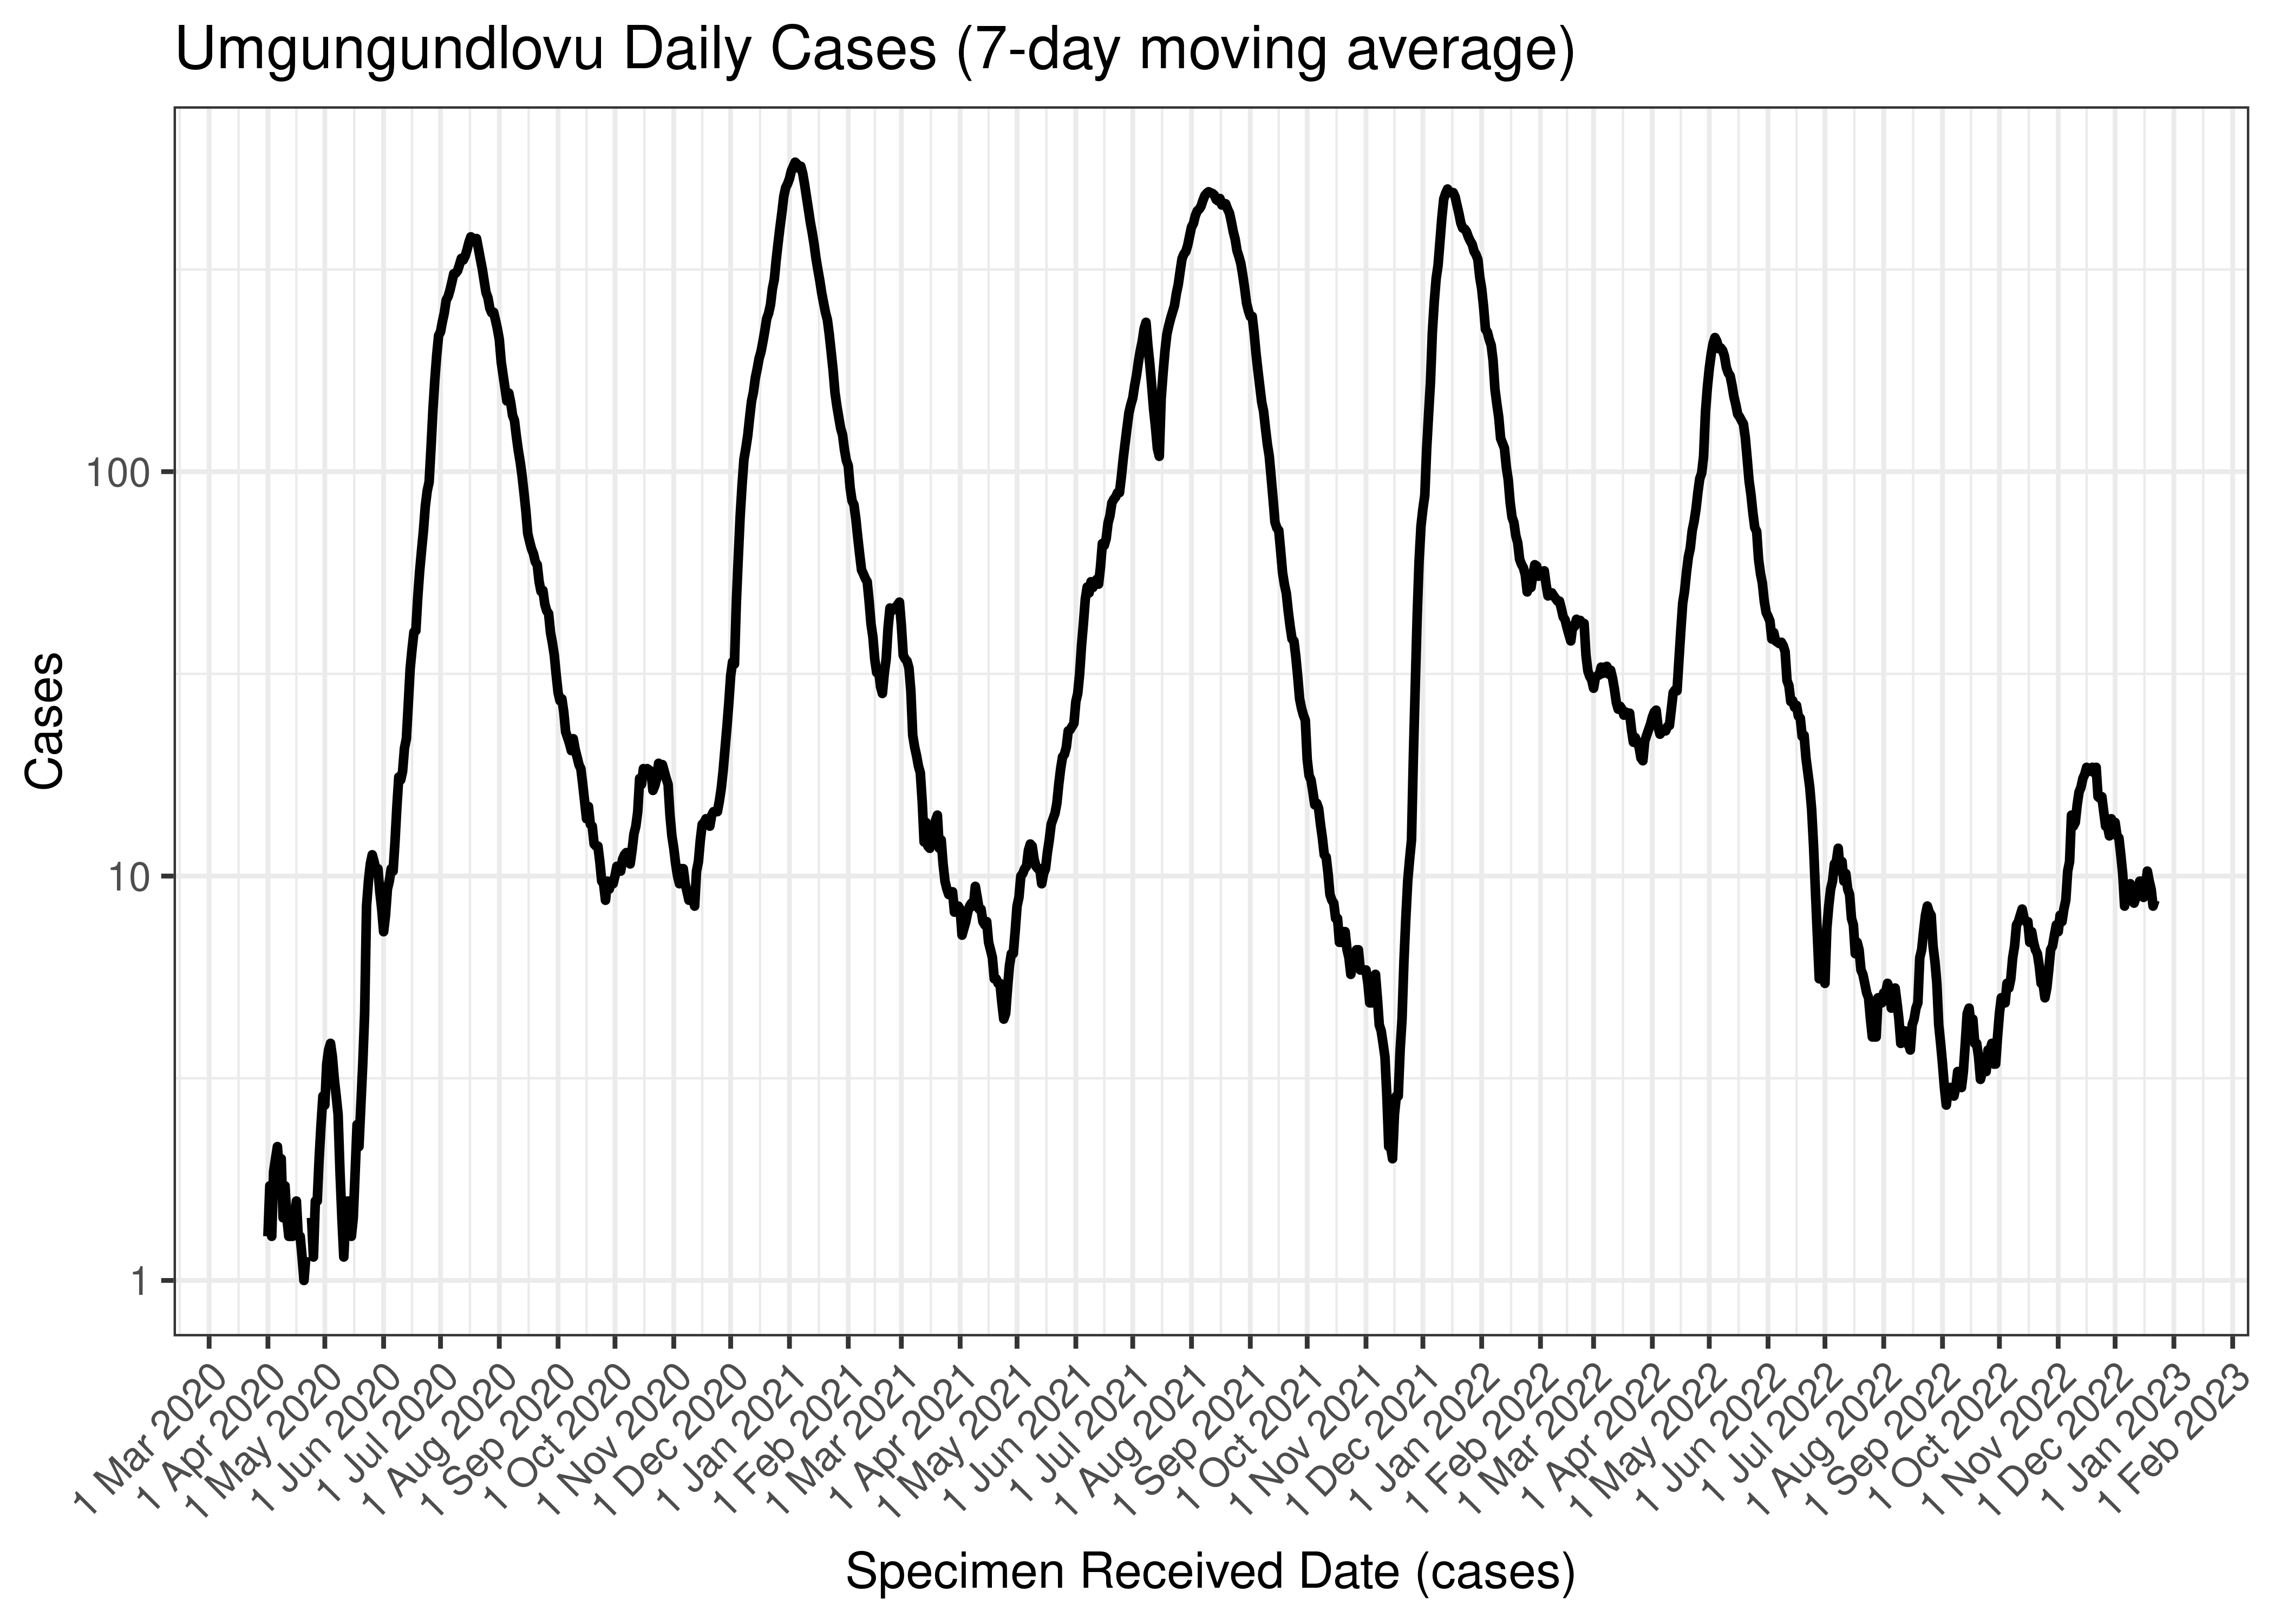
Umgungundlovu Daily Cases (7-day moving average)
Below the above chart is repeated for the last 30-days:

Umgungundlovu Daily Cases for Last 30-days (7-day moving average)
6.5.14.2 Reproduction Number
Below current (last weekly) reproduction number estimates are tabulated for Umgungundlovu.
| Count (Per Day) | Week Ending | Reproduction Number [95% Confidence Interval] | |
|---|---|---|---|
| Umgungundlovu | 8.7 | 2022-12-25 | 0.93 [0.71 - 1.17] |
Below the effective reproduction number for Umgungundlovu over the last 90 days are plotted together with a plot since start of the pandemic.
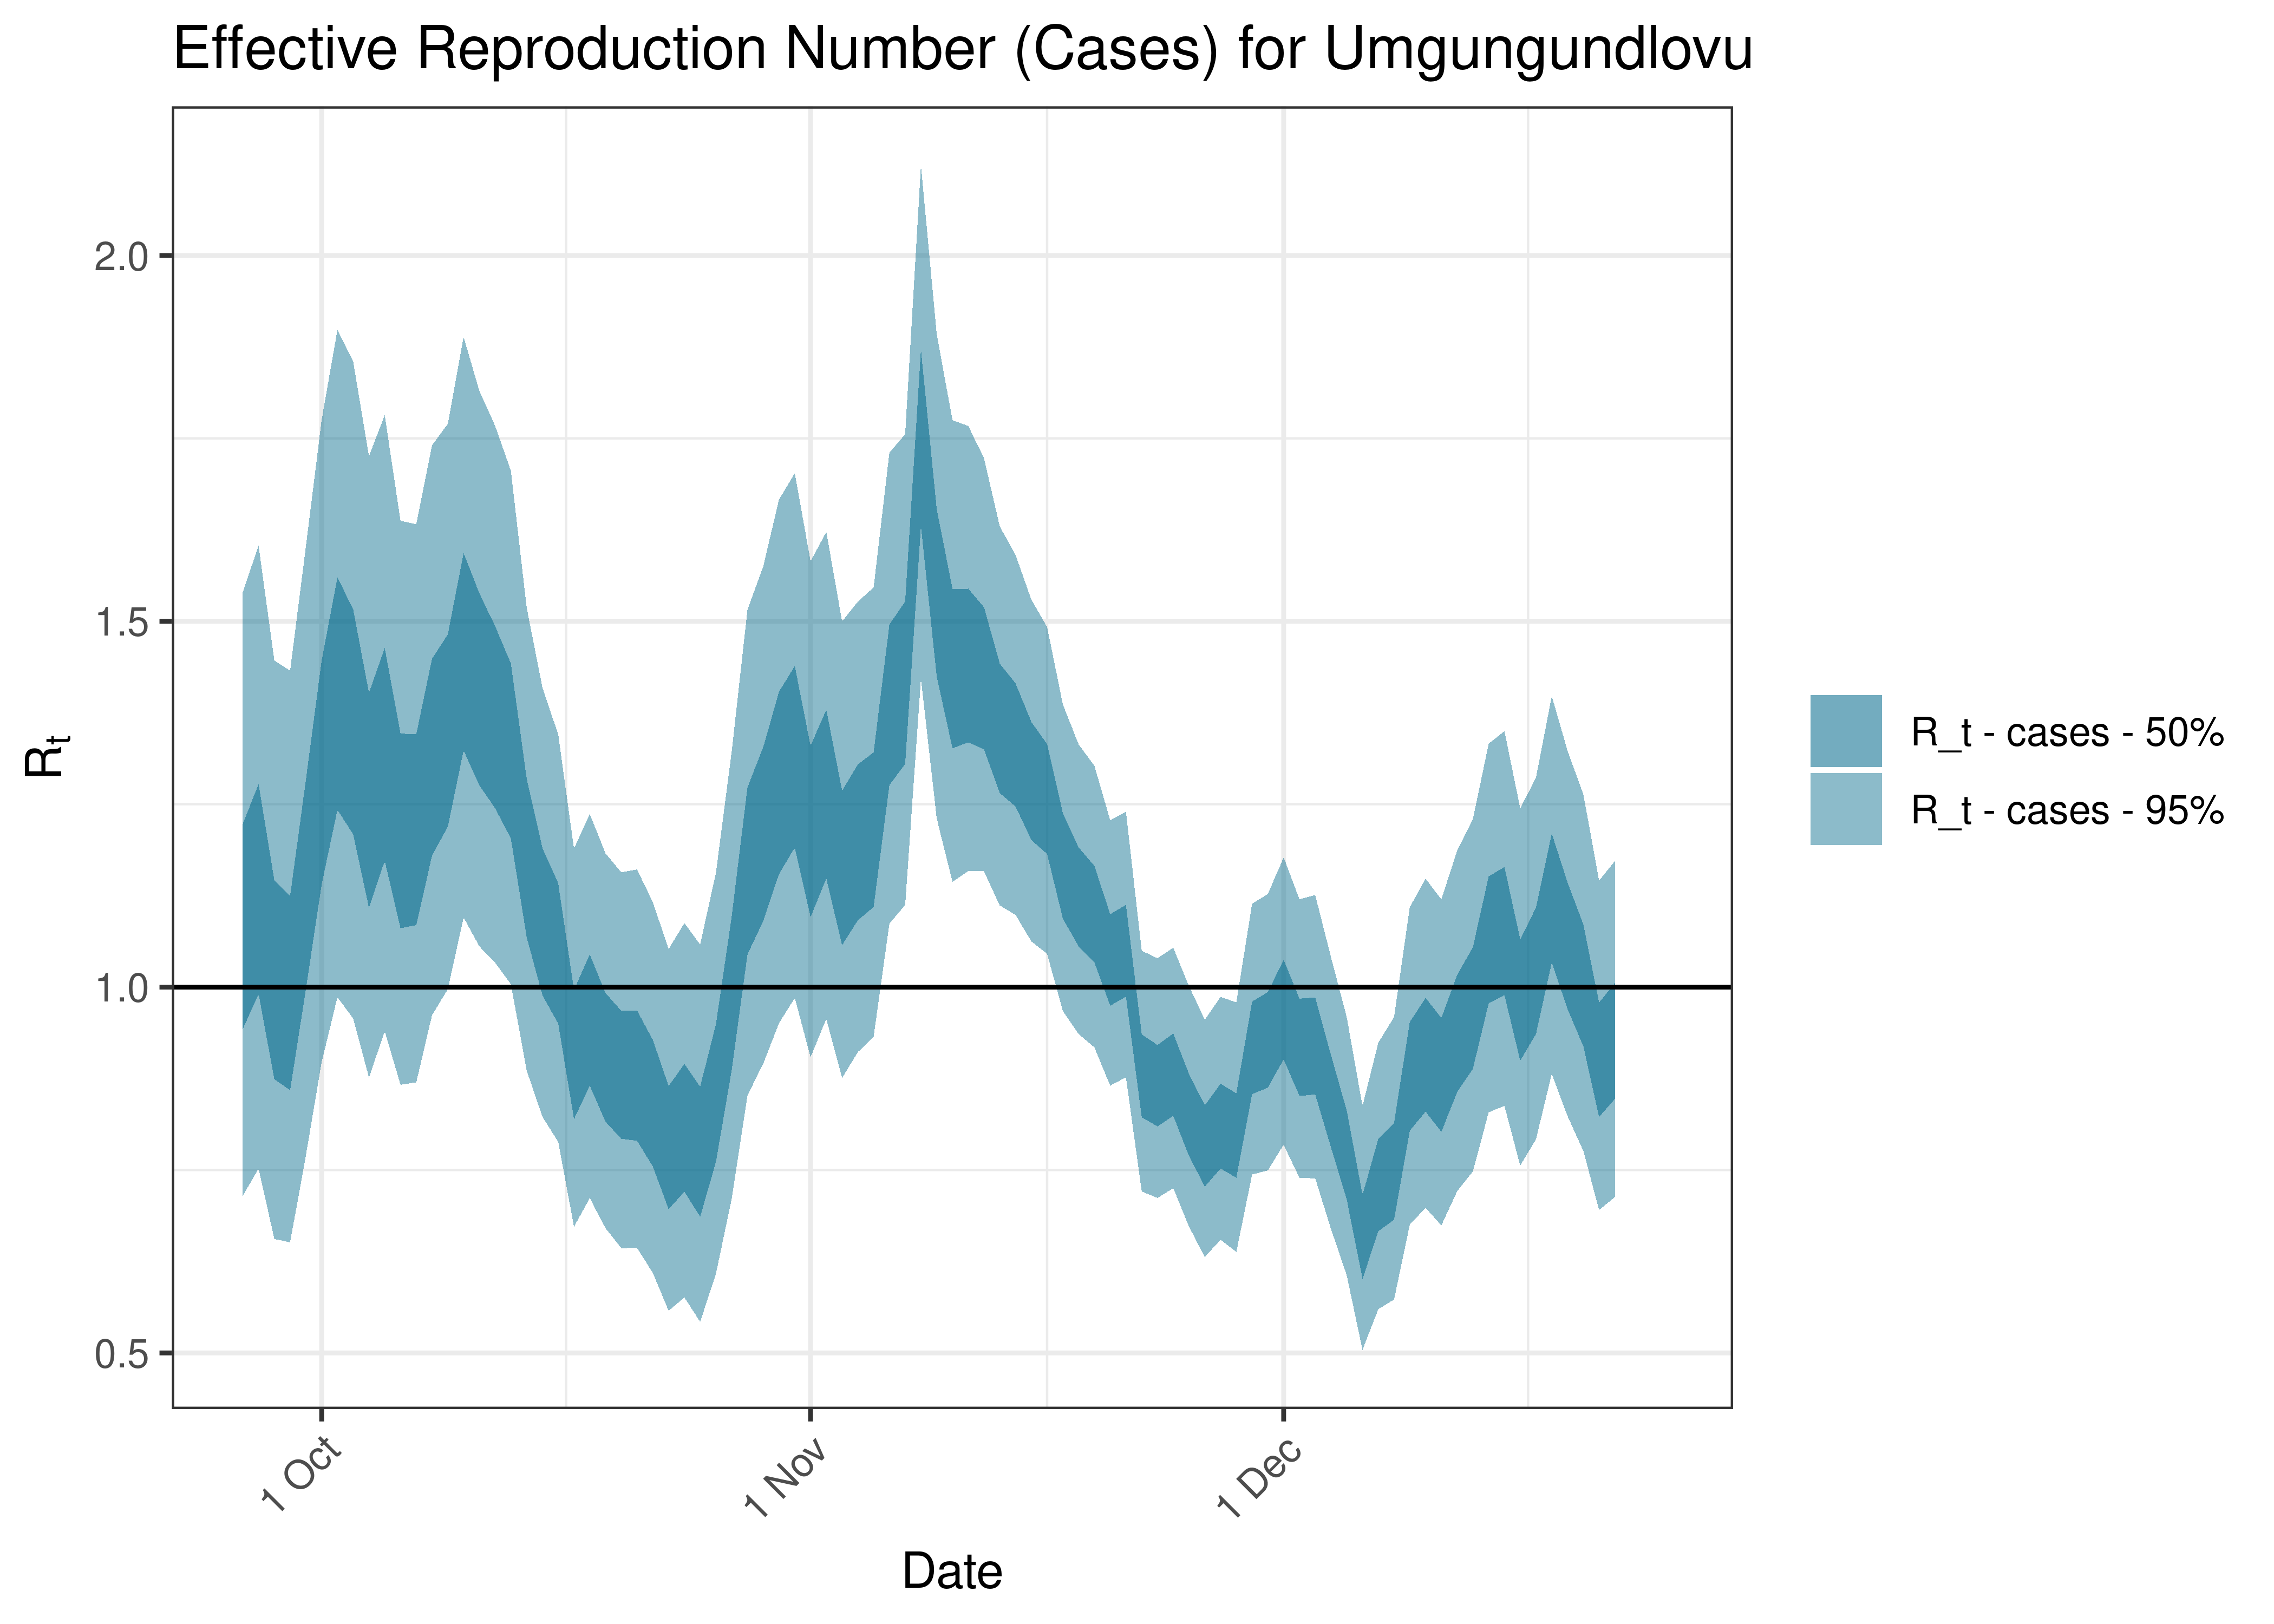
Estimated Effective Reproduction Number Based on Cases for Umgungundlovu over last 90 days
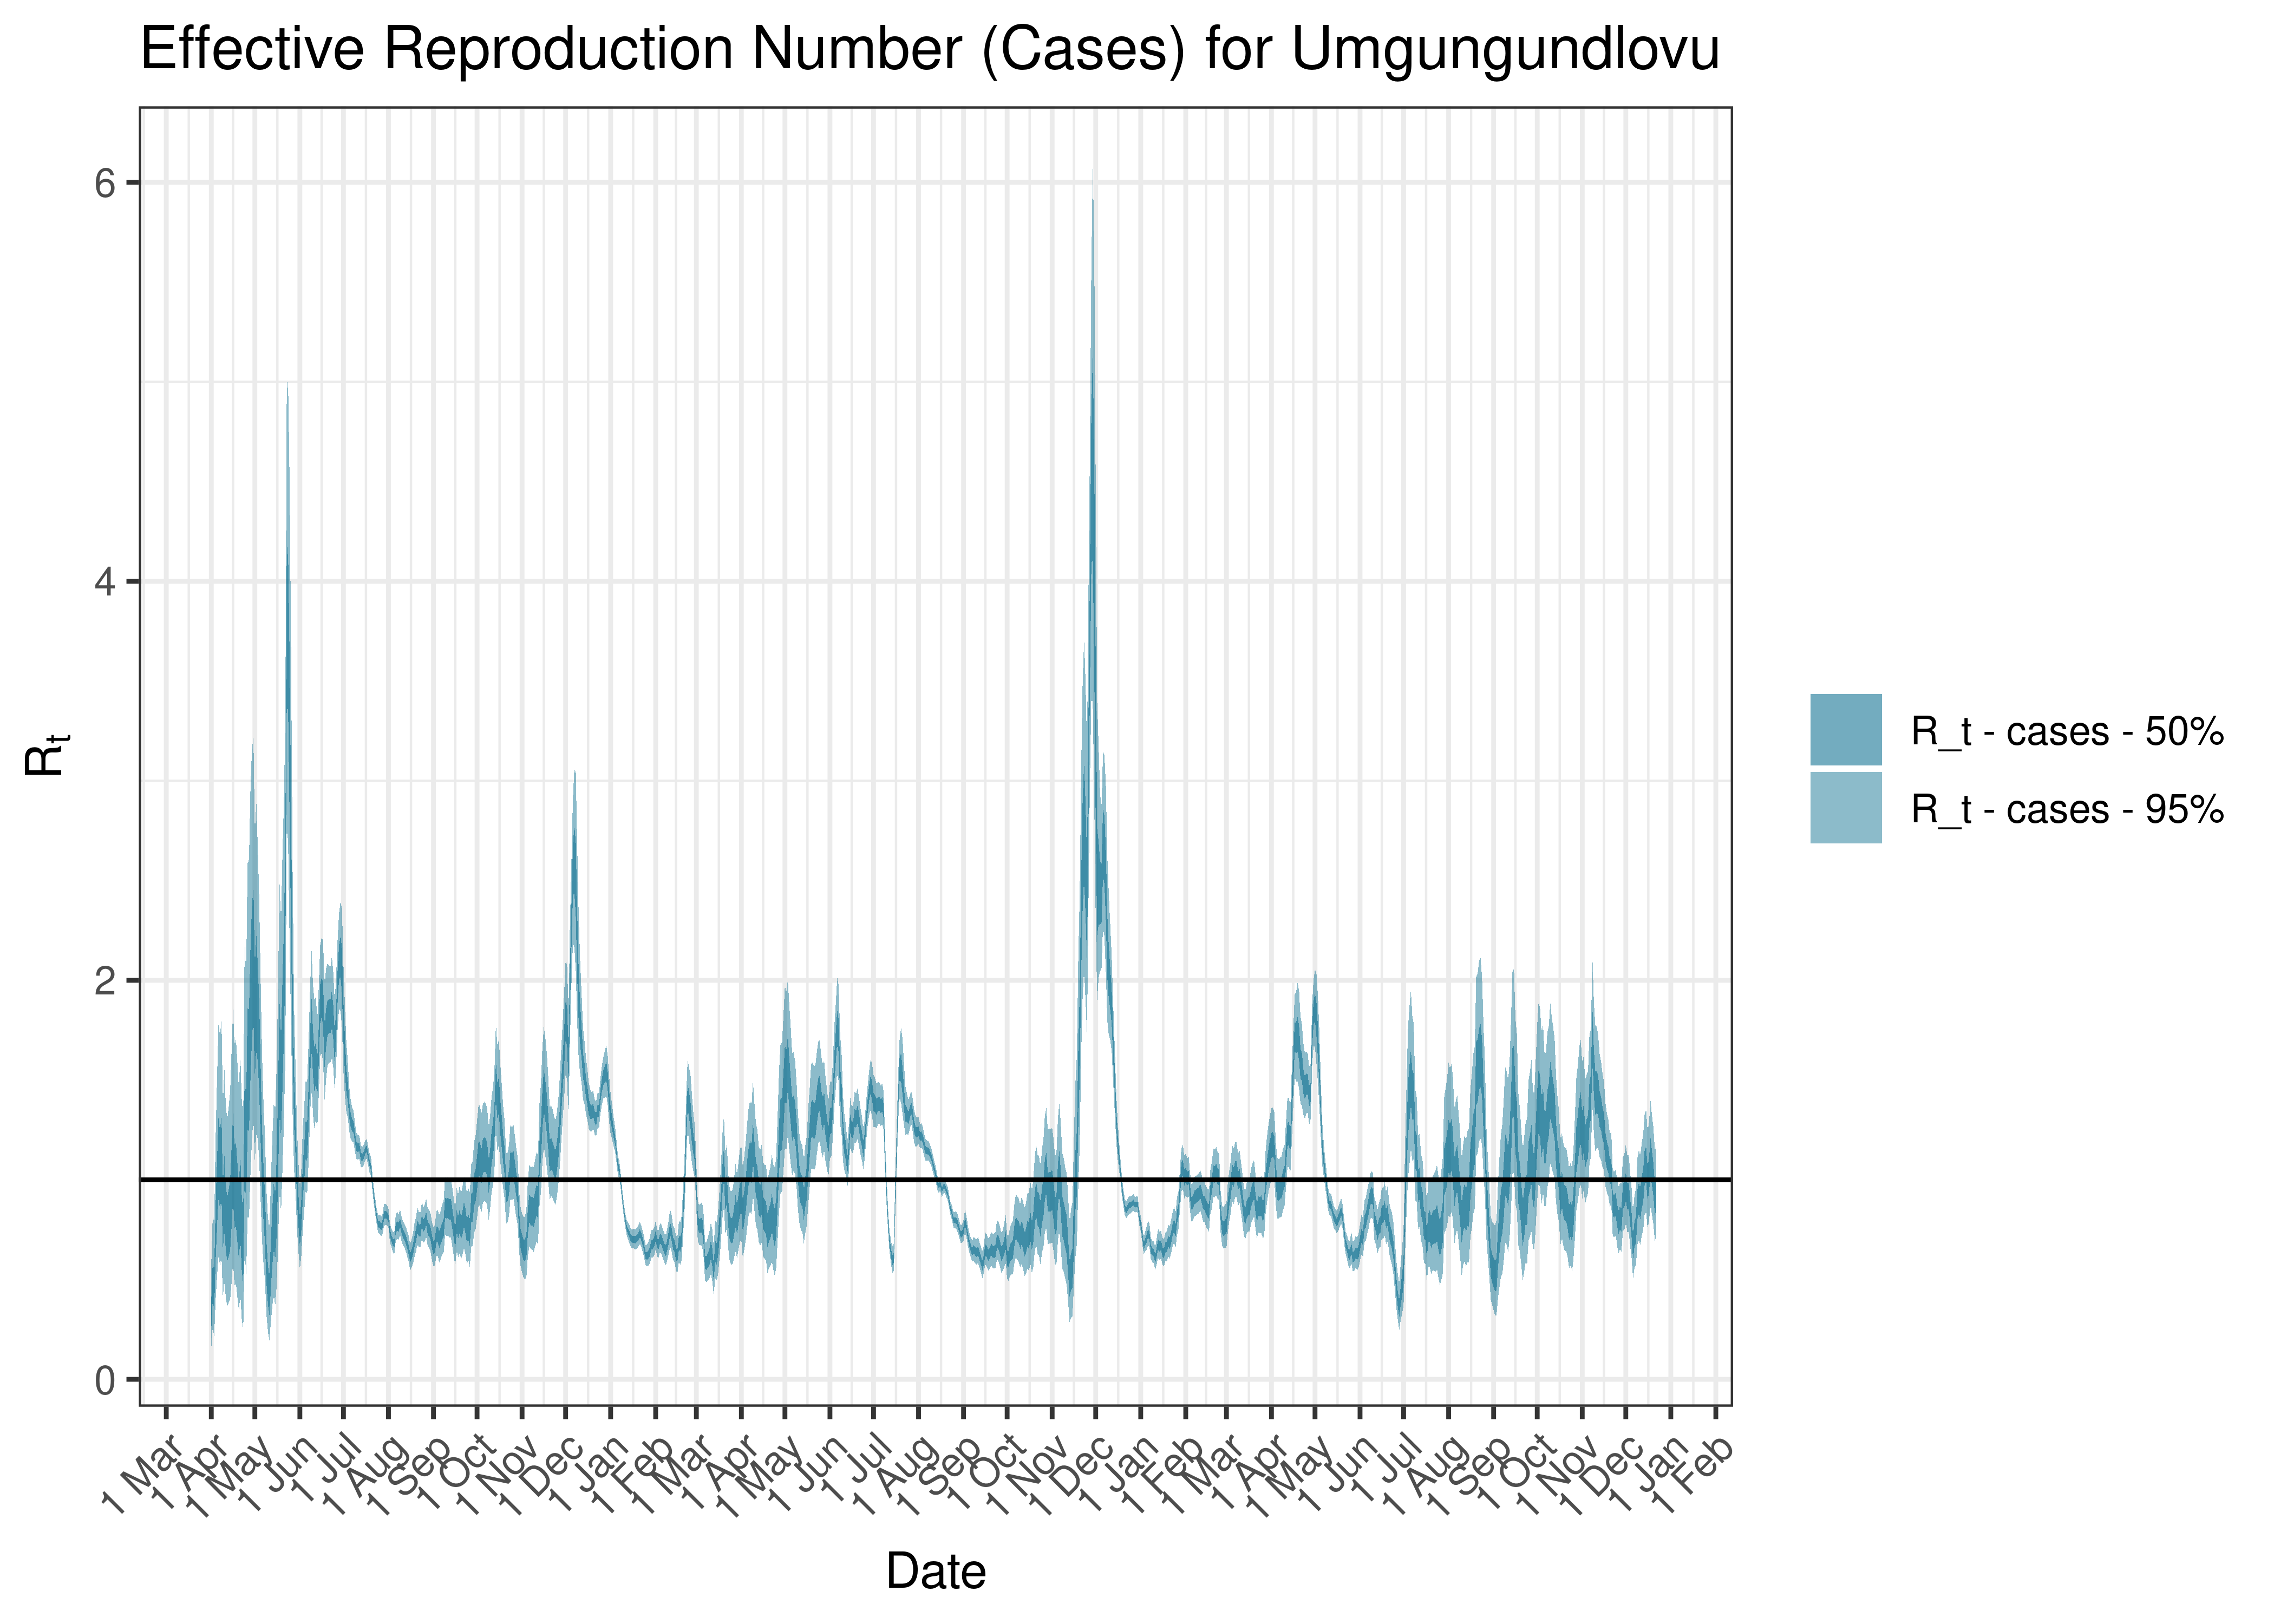
Estimated Effective Reproduction Number Based on Cases for Umgungundlovu since 1 April 2020
6.5.15 Umkhanyakude
6.5.15.1 Cases
Cases are tabulated by specimen received date below. Cases include estimates for late reporting in recent days as well as adjustments for any public holidays. A centred 7-day moving average is also shown. The peak daily cases in previous waves (as measured by the moving average) is also shown.
| Specimen Received Date | Cases | 7-day Moving Average | Comment |
|---|---|---|---|
| 2020-07-20 | 43 | 60 | Wave 1 Peak |
| 2021-01-06 | 199 | 182 | Wave 2 Peak |
| 2021-08-23 | 150 | 144 | Wave 3 Peak |
| 2021-12-20 | 120 | 83 | Wave 4 Peak |
| 2022-05-10 | 12 | 9 | Wave 5 Peak (to date) |
Below a 7-day moving average daily case count are plotted for Umkhanyakude on a log scale since start of the epidemic:
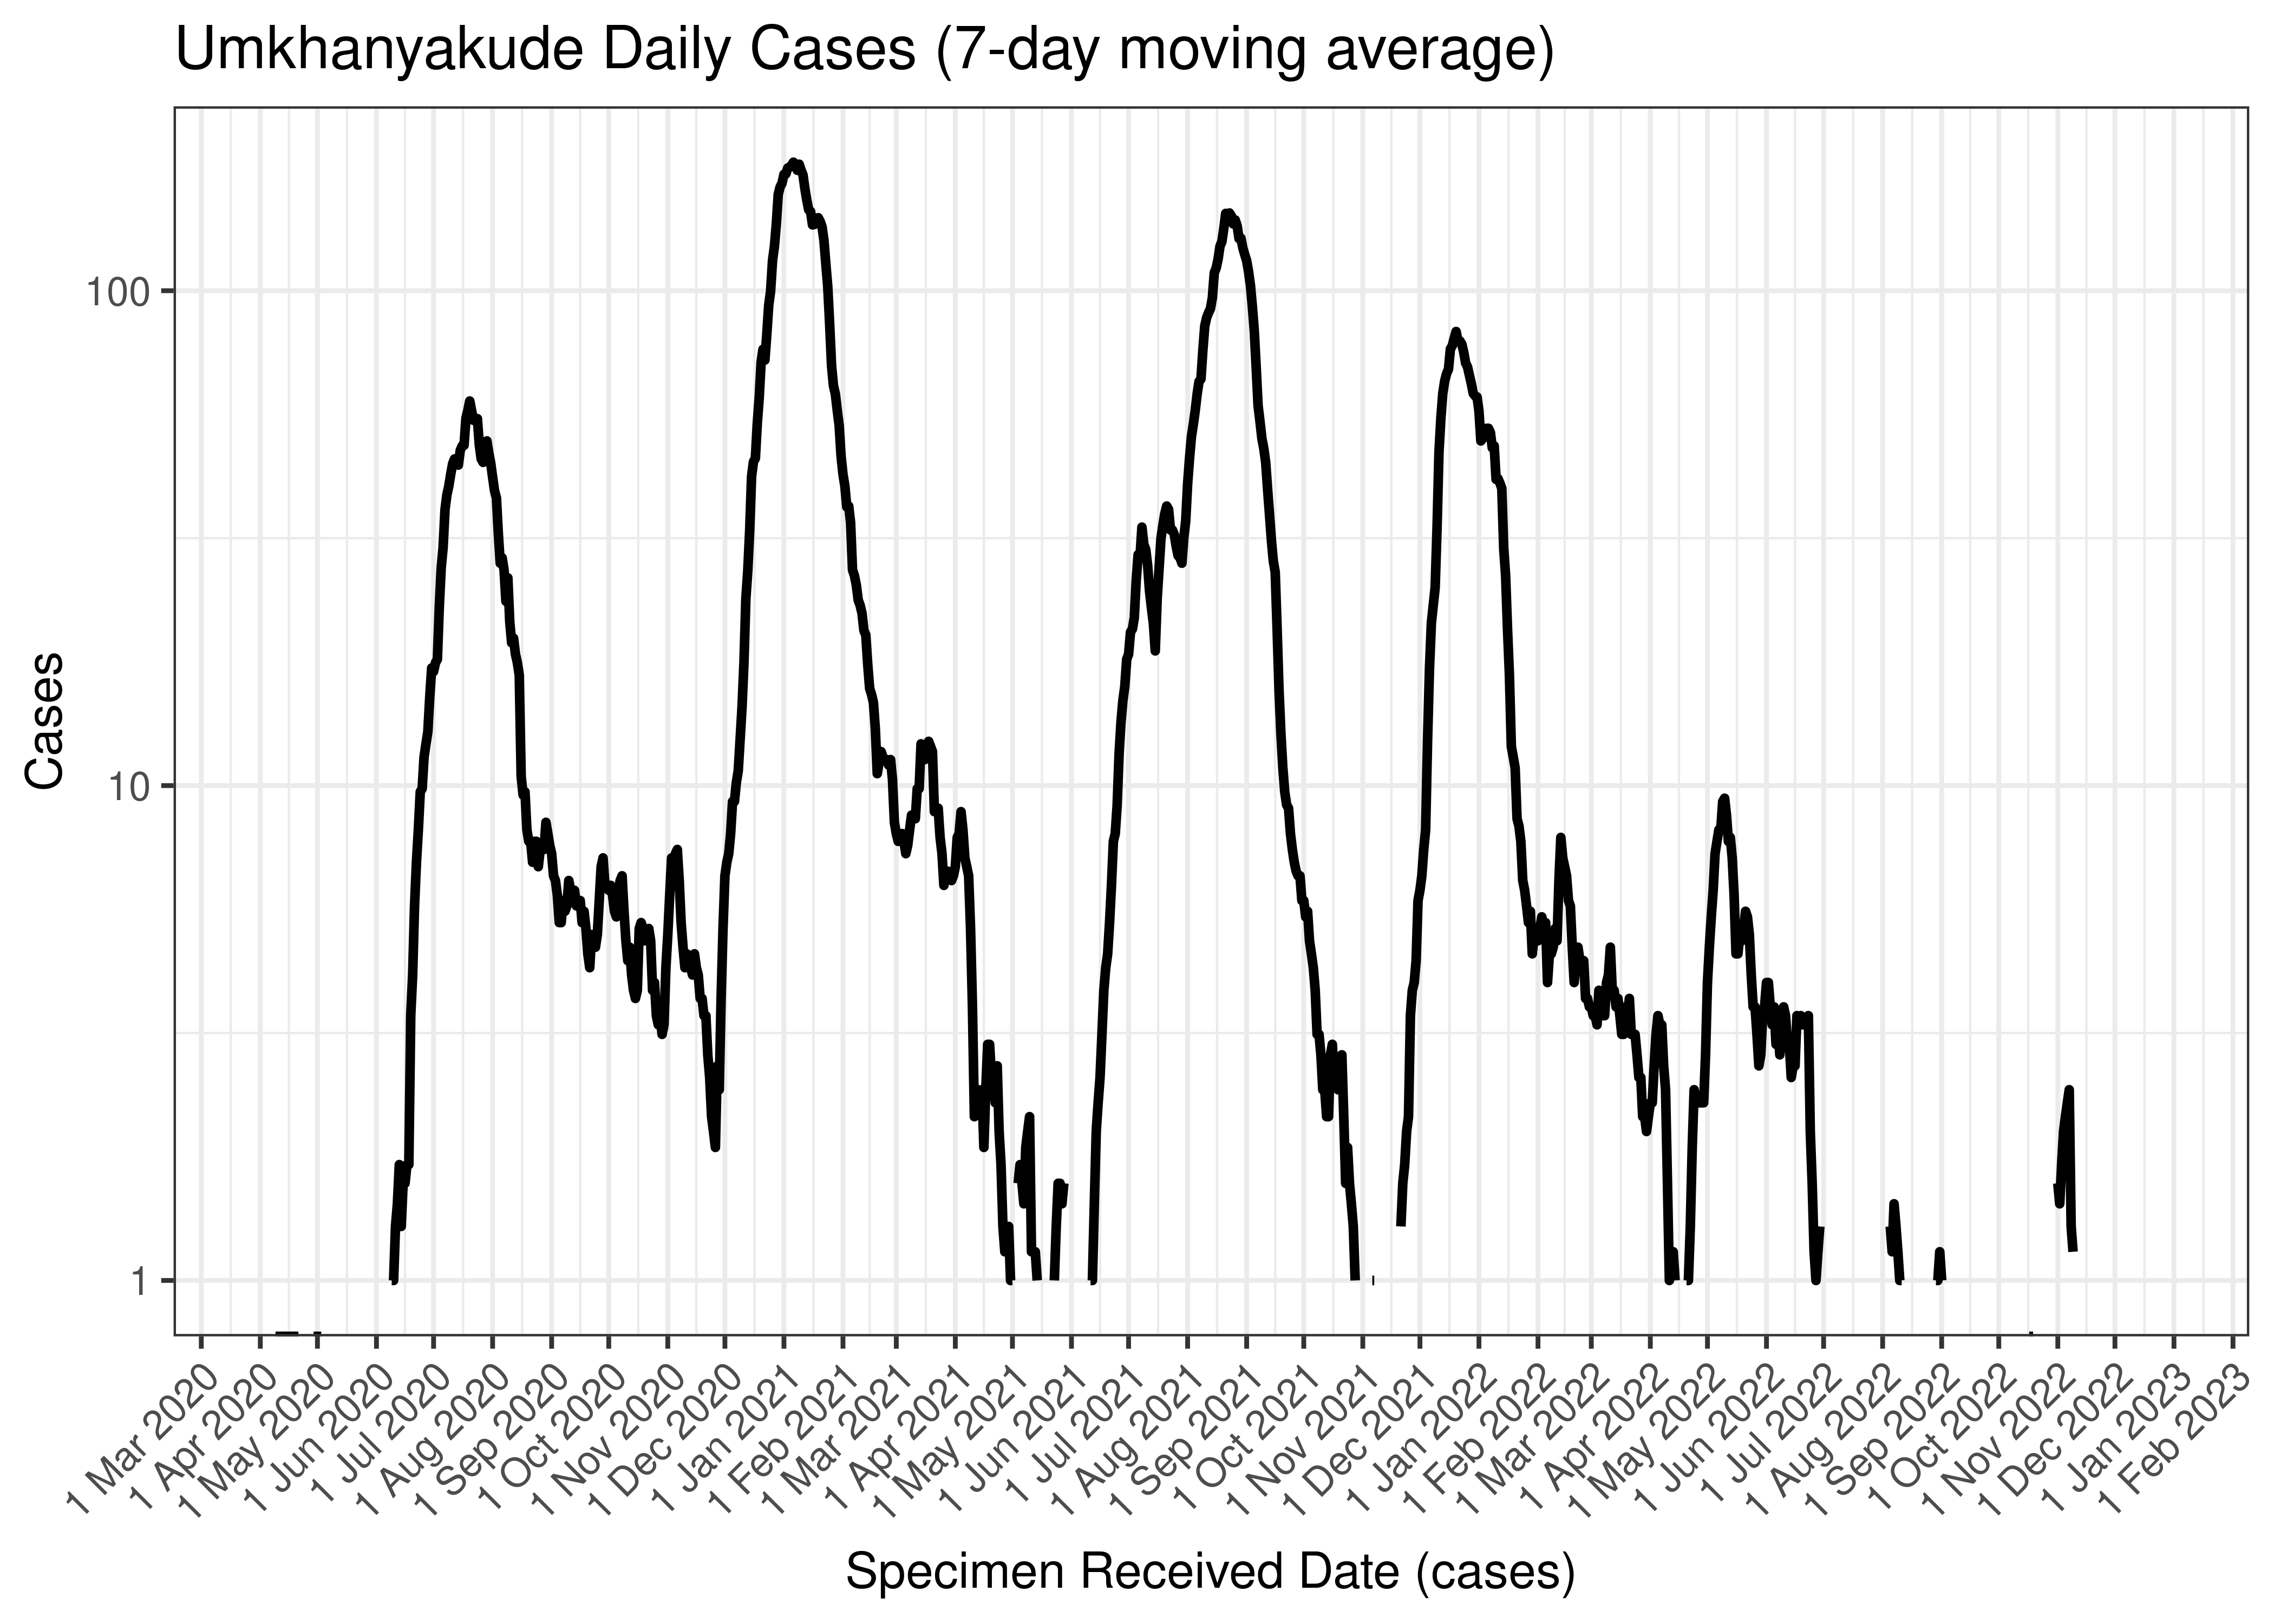
Umkhanyakude Daily Cases (7-day moving average)
Below the above chart is repeated for the last 30-days:
Umkhanyakude Daily Cases for Last 30-days (7-day moving average)
6.5.15.2 Reproduction Number
Below current (last weekly) reproduction number estimates are tabulated for Umkhanyakude.
| Count (Per Day) | Week Ending | Reproduction Number [95% Confidence Interval] | |
|---|---|---|---|
| Umkhanyakude | 0.1 | 2022-12-25 | 1.11 [0.13 - 3.12] |
Below the effective reproduction number for Umkhanyakude over the last 90 days are plotted together with a plot since start of the pandemic.
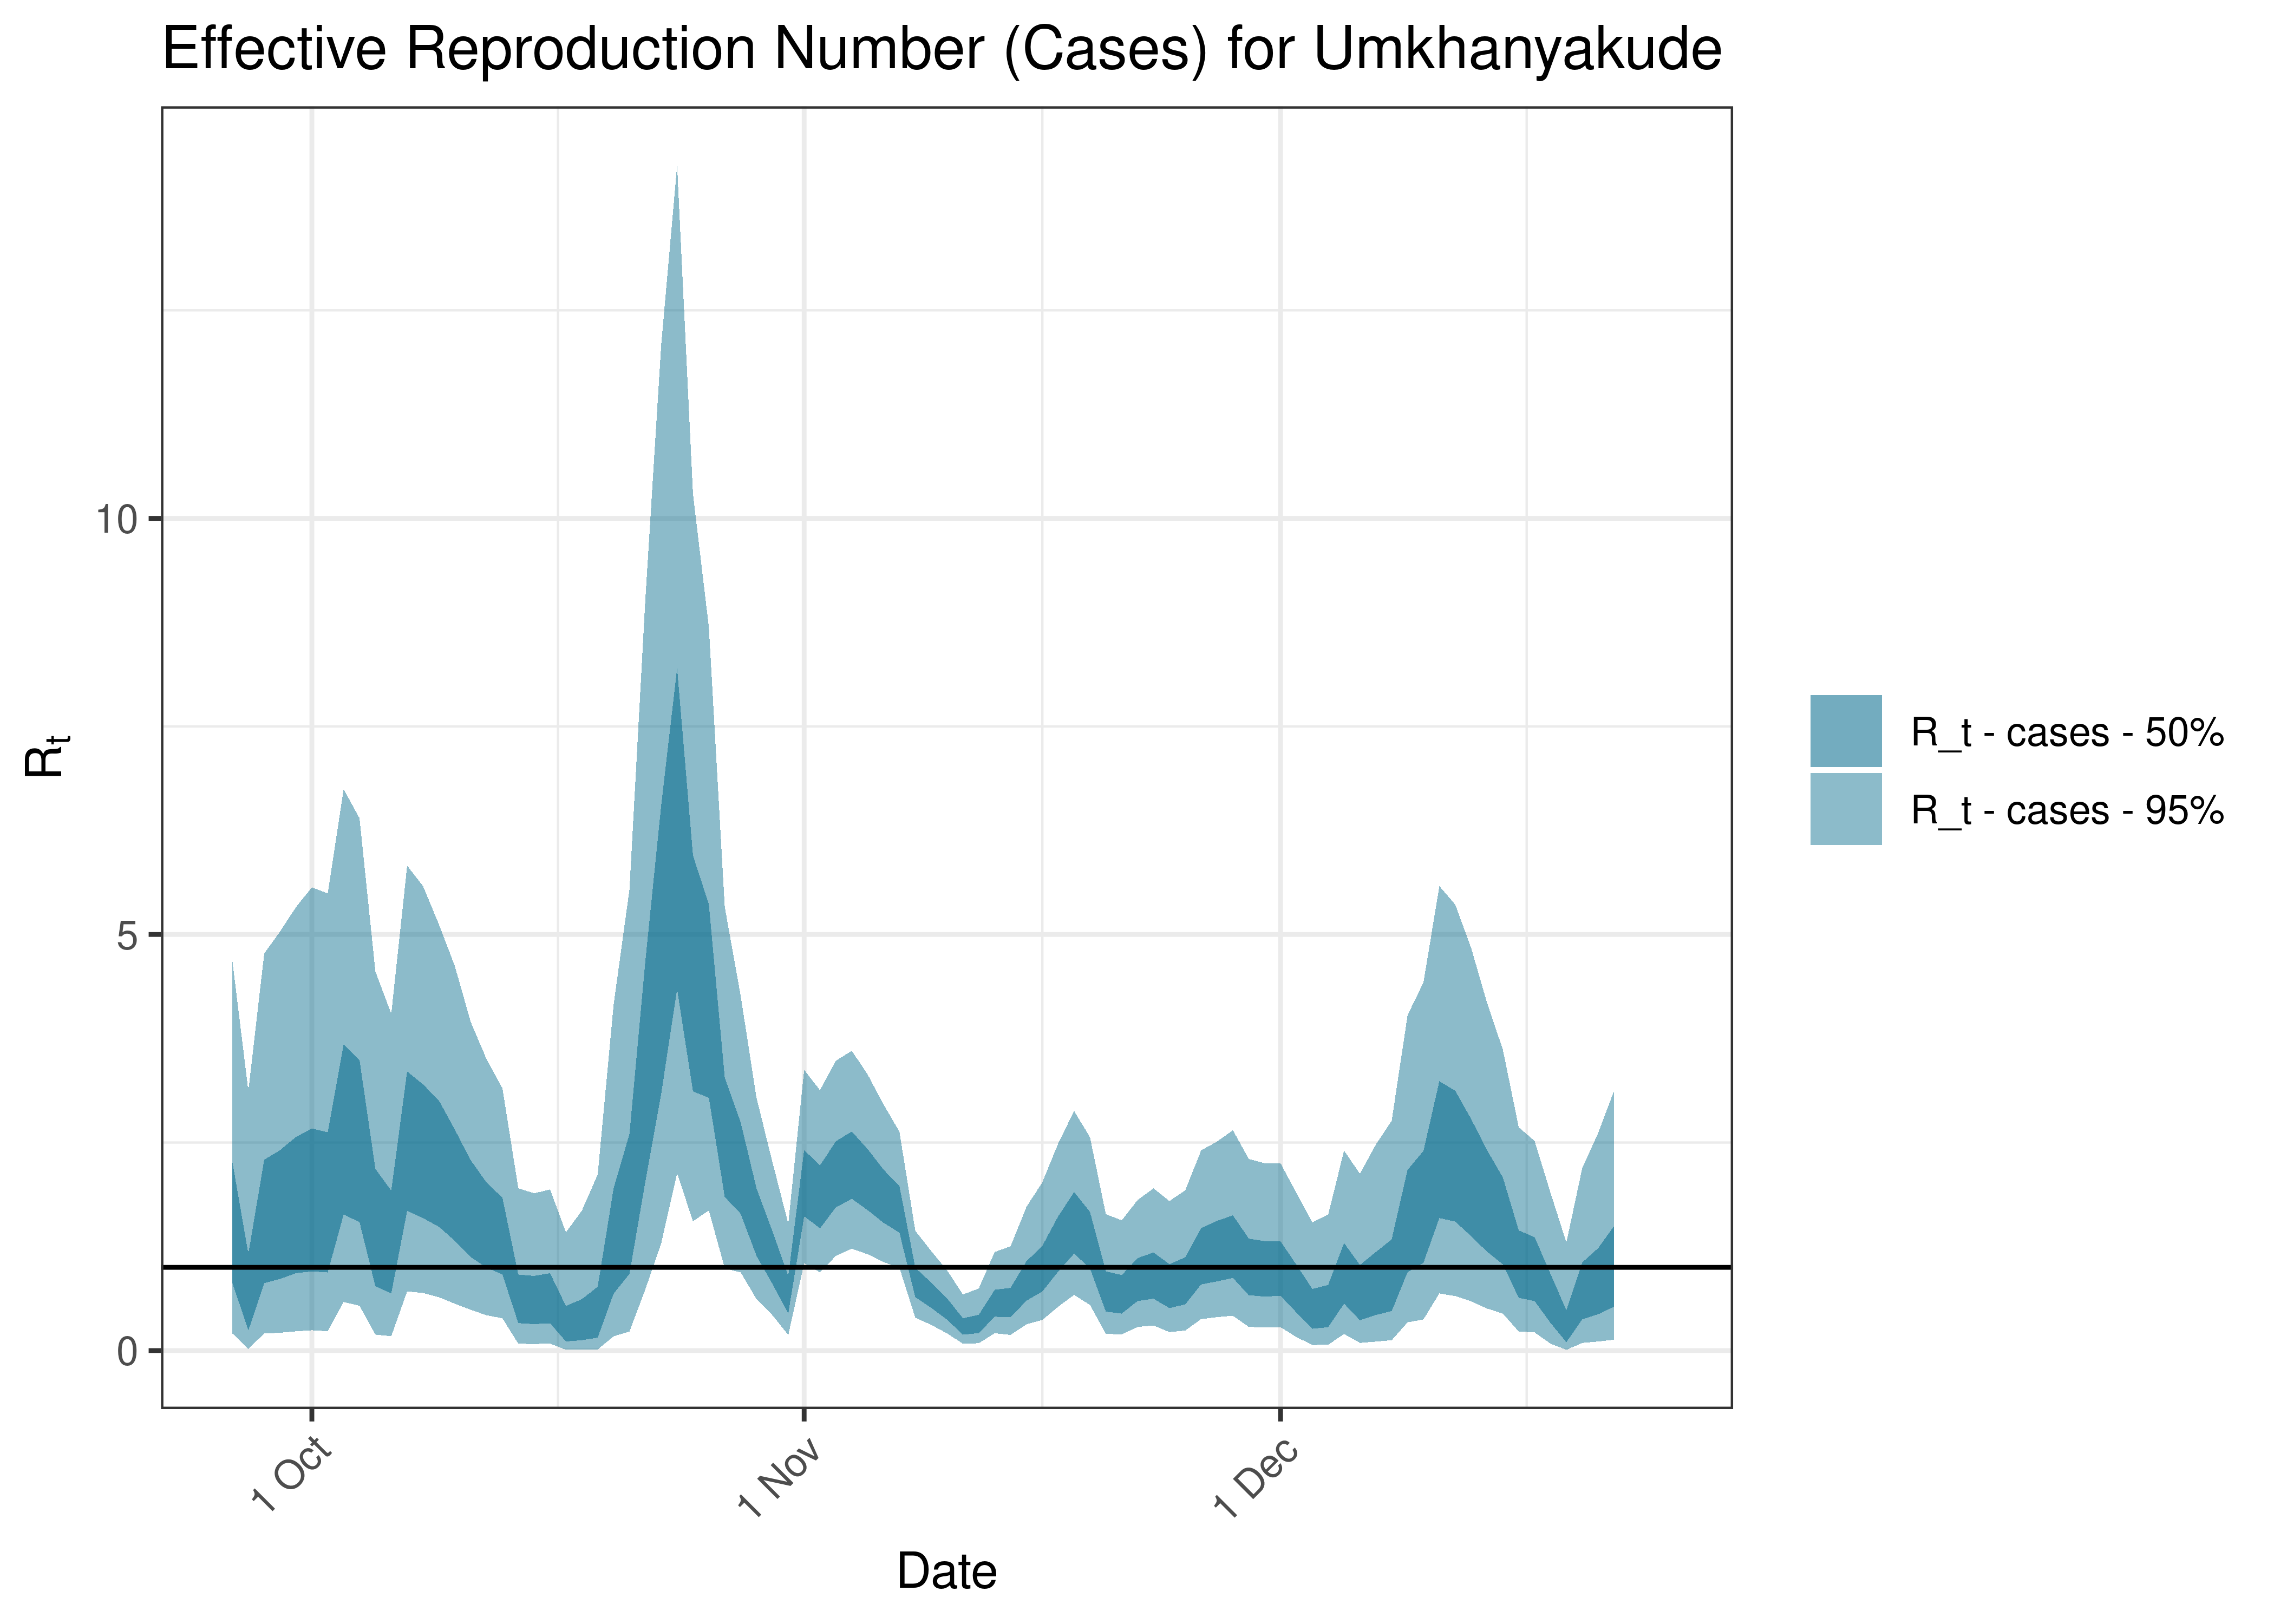
Estimated Effective Reproduction Number Based on Cases for Umkhanyakude over last 90 days
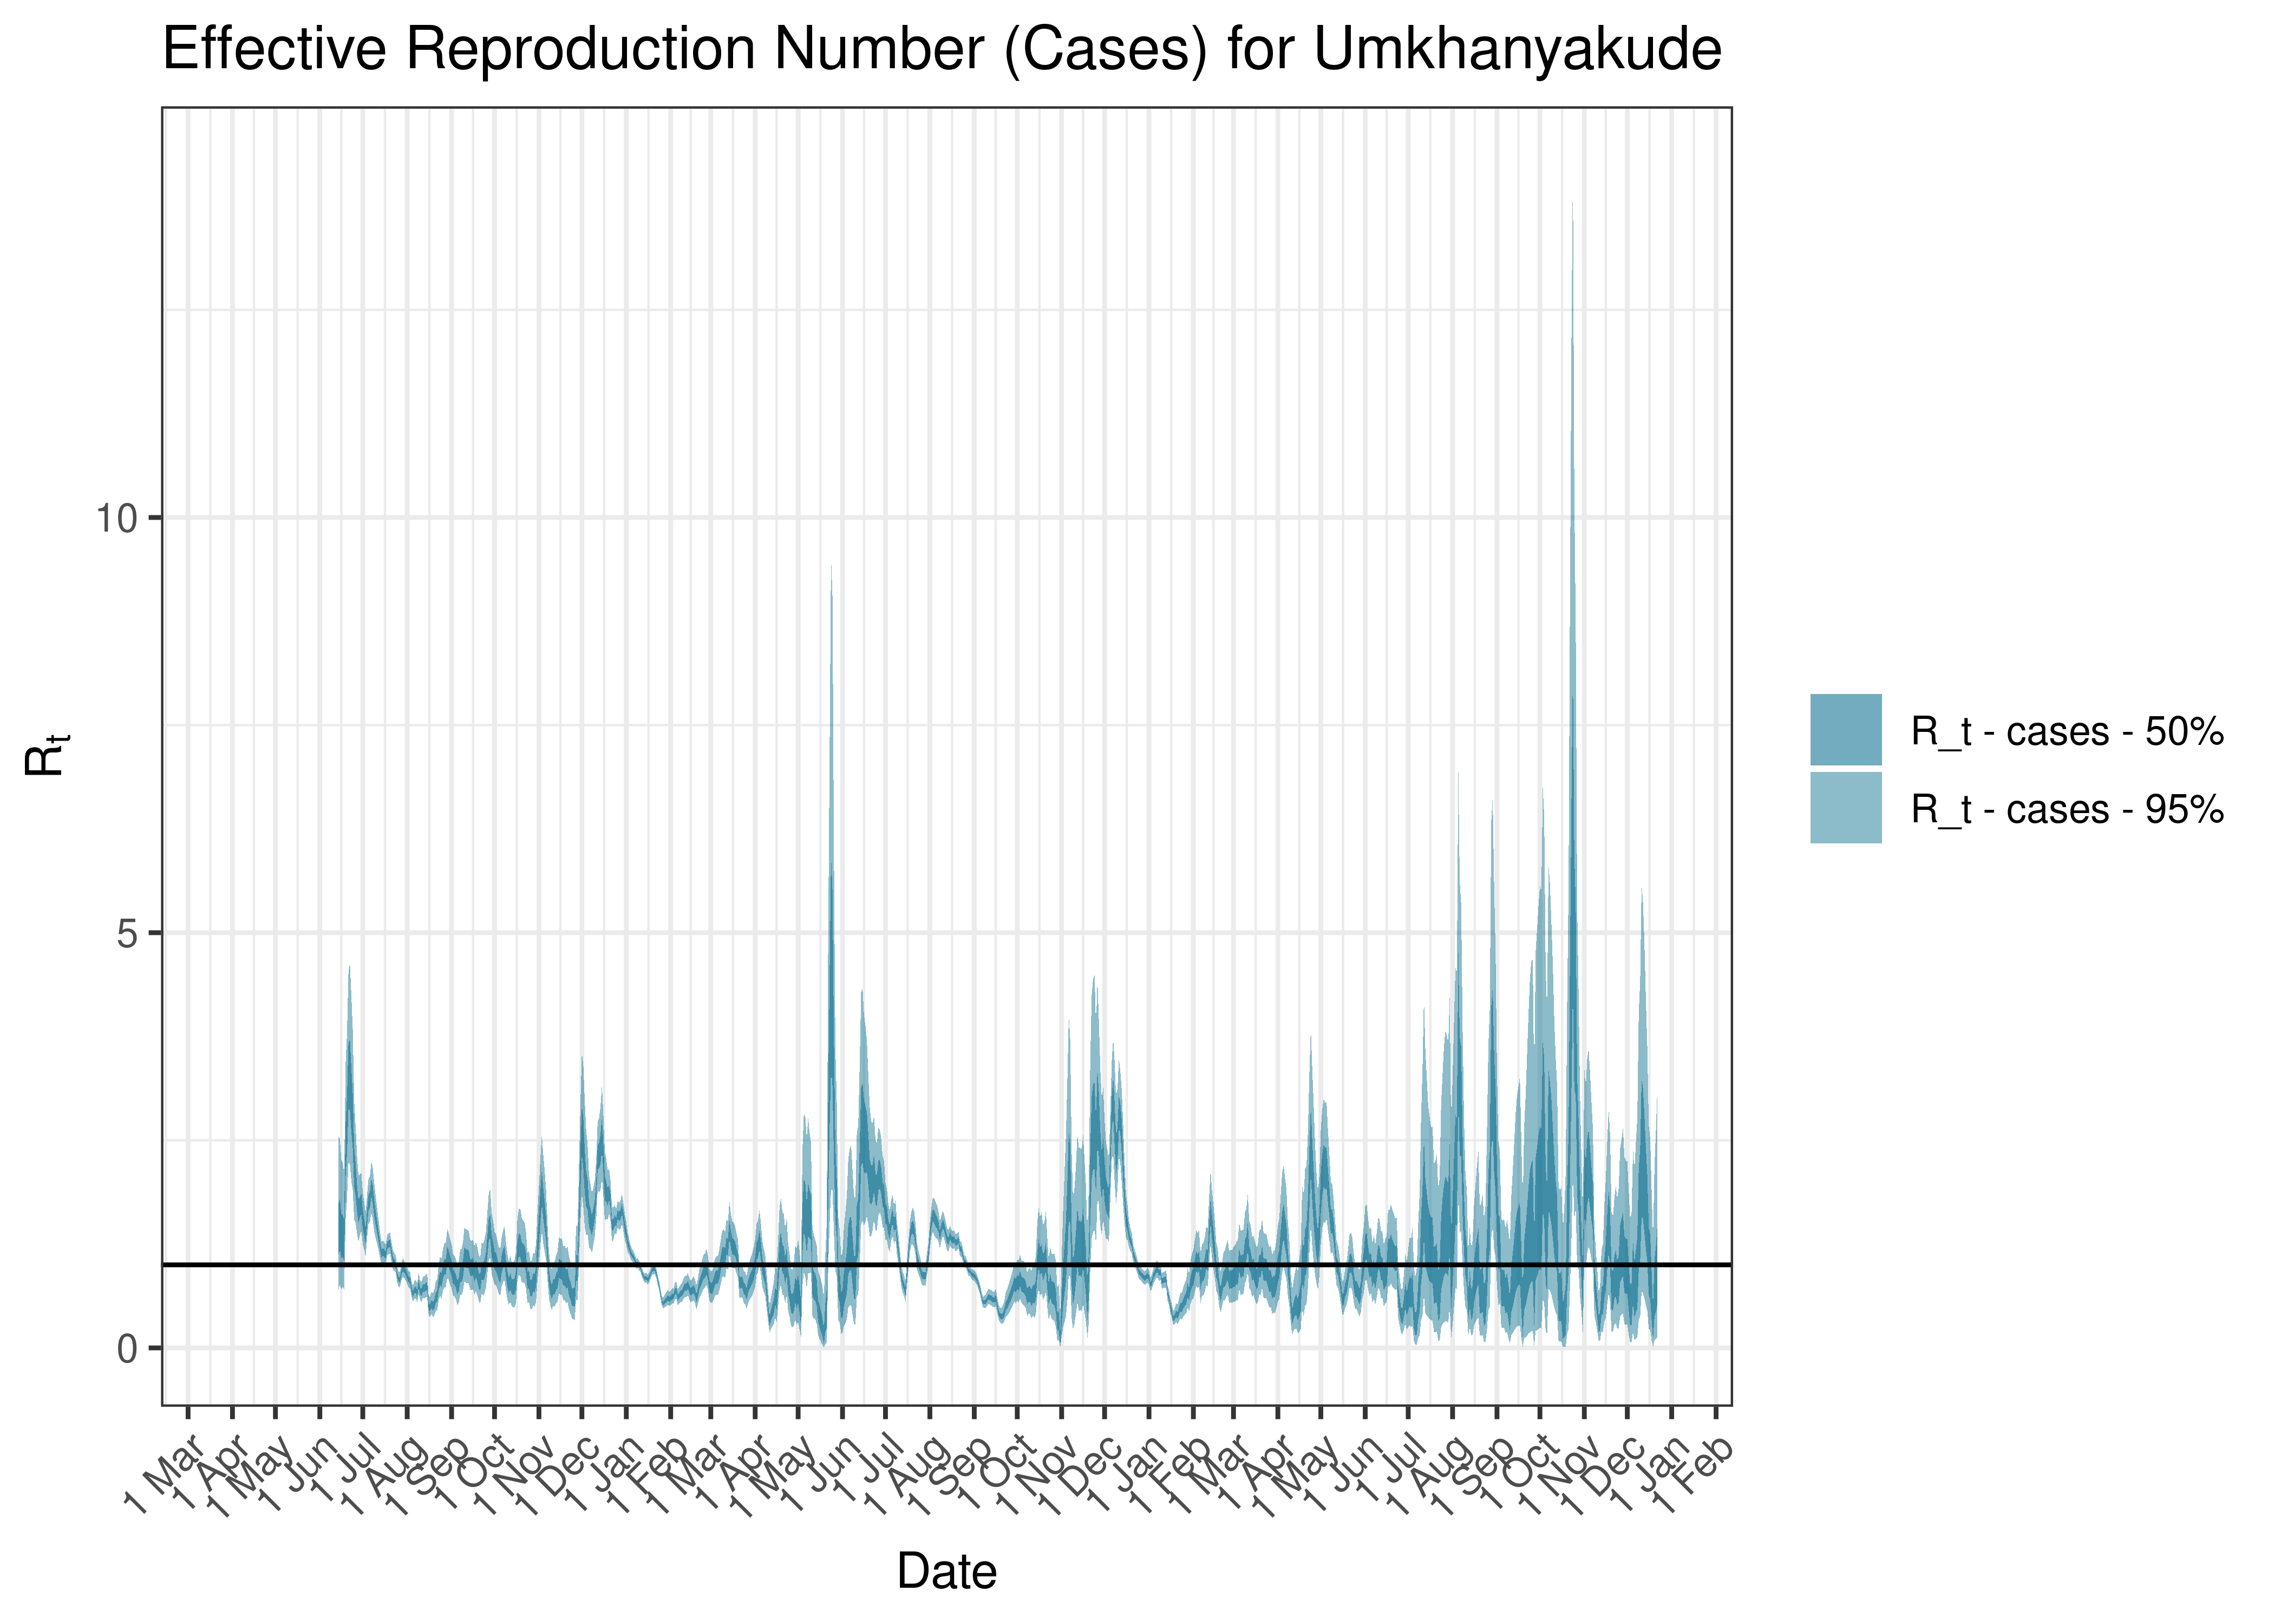
Estimated Effective Reproduction Number Based on Cases for Umkhanyakude since 1 April 2020
6.5.16 Umzinyathi
6.5.16.1 Cases
Cases are tabulated by specimen received date below. Cases include estimates for late reporting in recent days as well as adjustments for any public holidays. A centred 7-day moving average is also shown. The peak daily cases in previous waves (as measured by the moving average) is also shown.
| Specimen Received Date | Cases | 7-day Moving Average | Comment |
|---|---|---|---|
| 2020-07-18 | 71 | 106 | Wave 1 Peak |
| 2021-01-09 | 89 | 132 | Wave 2 Peak |
| 2021-08-21 | 79 | 122 | Wave 3 Peak |
| 2021-12-13 | 93 | 98 | Wave 4 Peak |
| 2022-05-04 | 23 | 14 | Wave 5 Peak (to date) |
Below a 7-day moving average daily case count are plotted for Umzinyathi on a log scale since start of the epidemic:
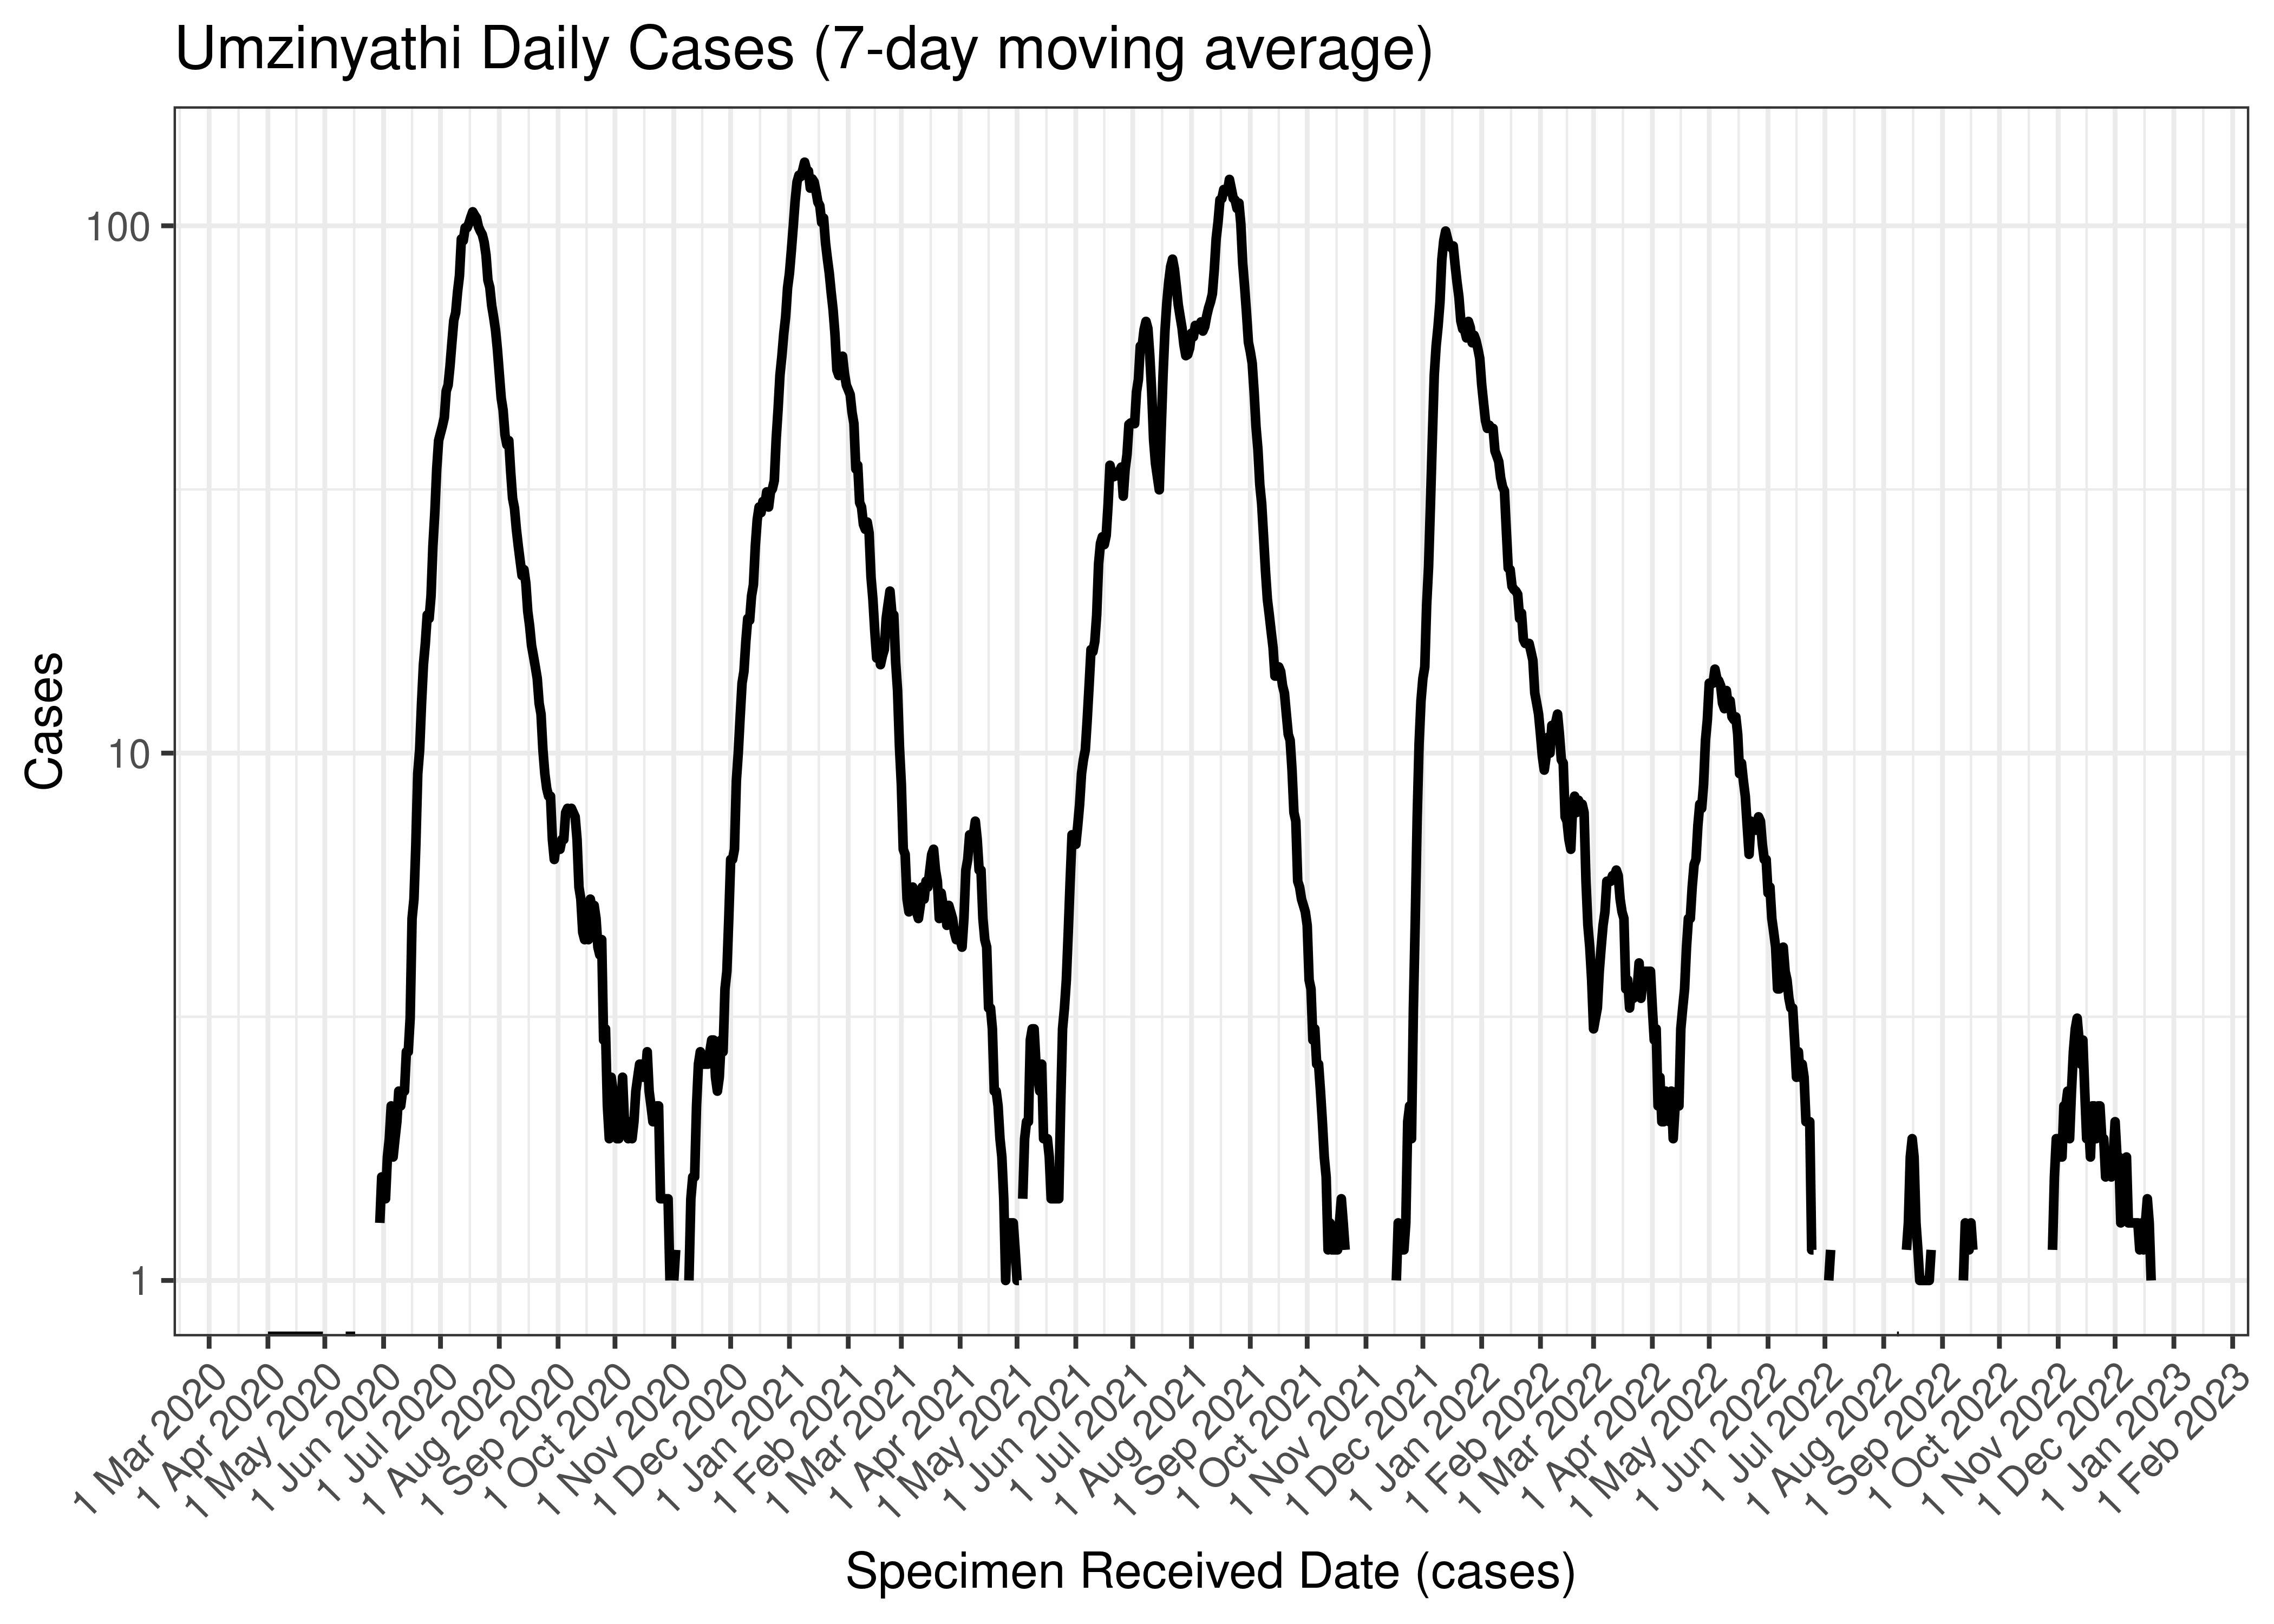
Umzinyathi Daily Cases (7-day moving average)
Below the above chart is repeated for the last 30-days:

Umzinyathi Daily Cases for Last 30-days (7-day moving average)
6.5.16.2 Reproduction Number
Below current (last weekly) reproduction number estimates are tabulated for Umzinyathi.
| Count (Per Day) | Week Ending | Reproduction Number [95% Confidence Interval] | |
|---|---|---|---|
| Umzinyathi | 0.9 | 2022-12-25 | 0.78 [0.31 - 1.46] |
Below the effective reproduction number for Umzinyathi over the last 90 days are plotted together with a plot since start of the pandemic.
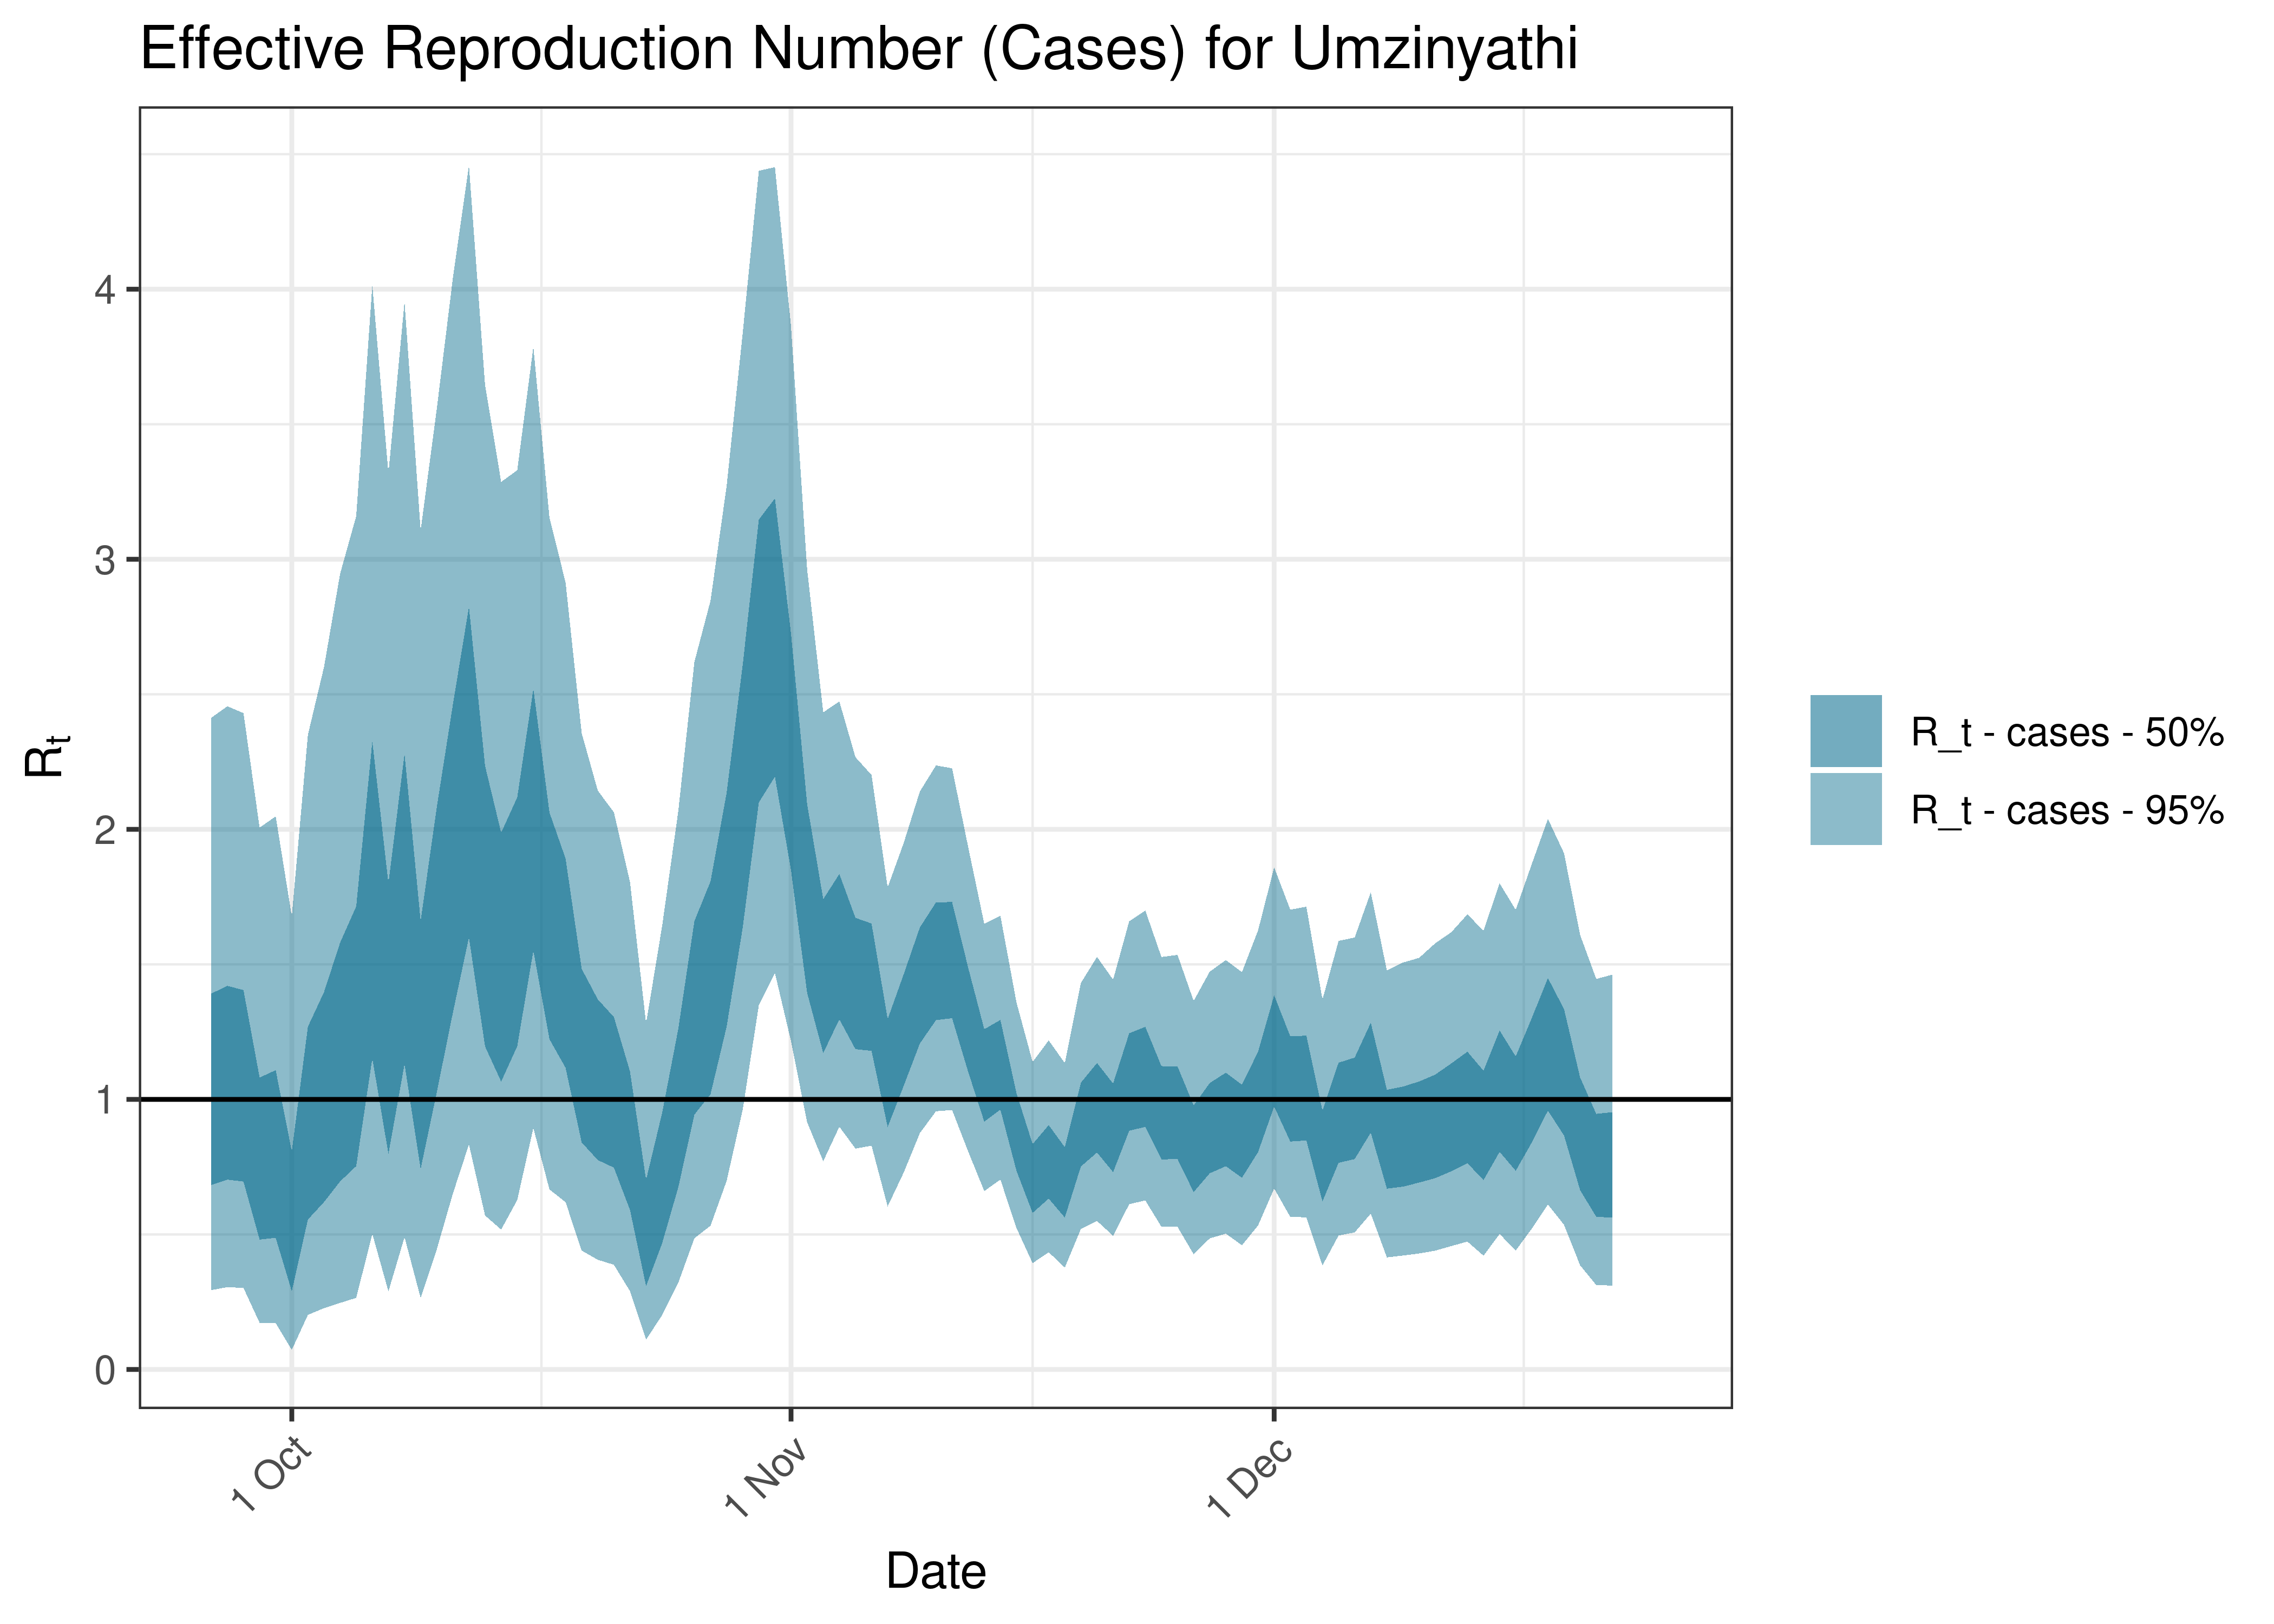
Estimated Effective Reproduction Number Based on Cases for Umzinyathi over last 90 days
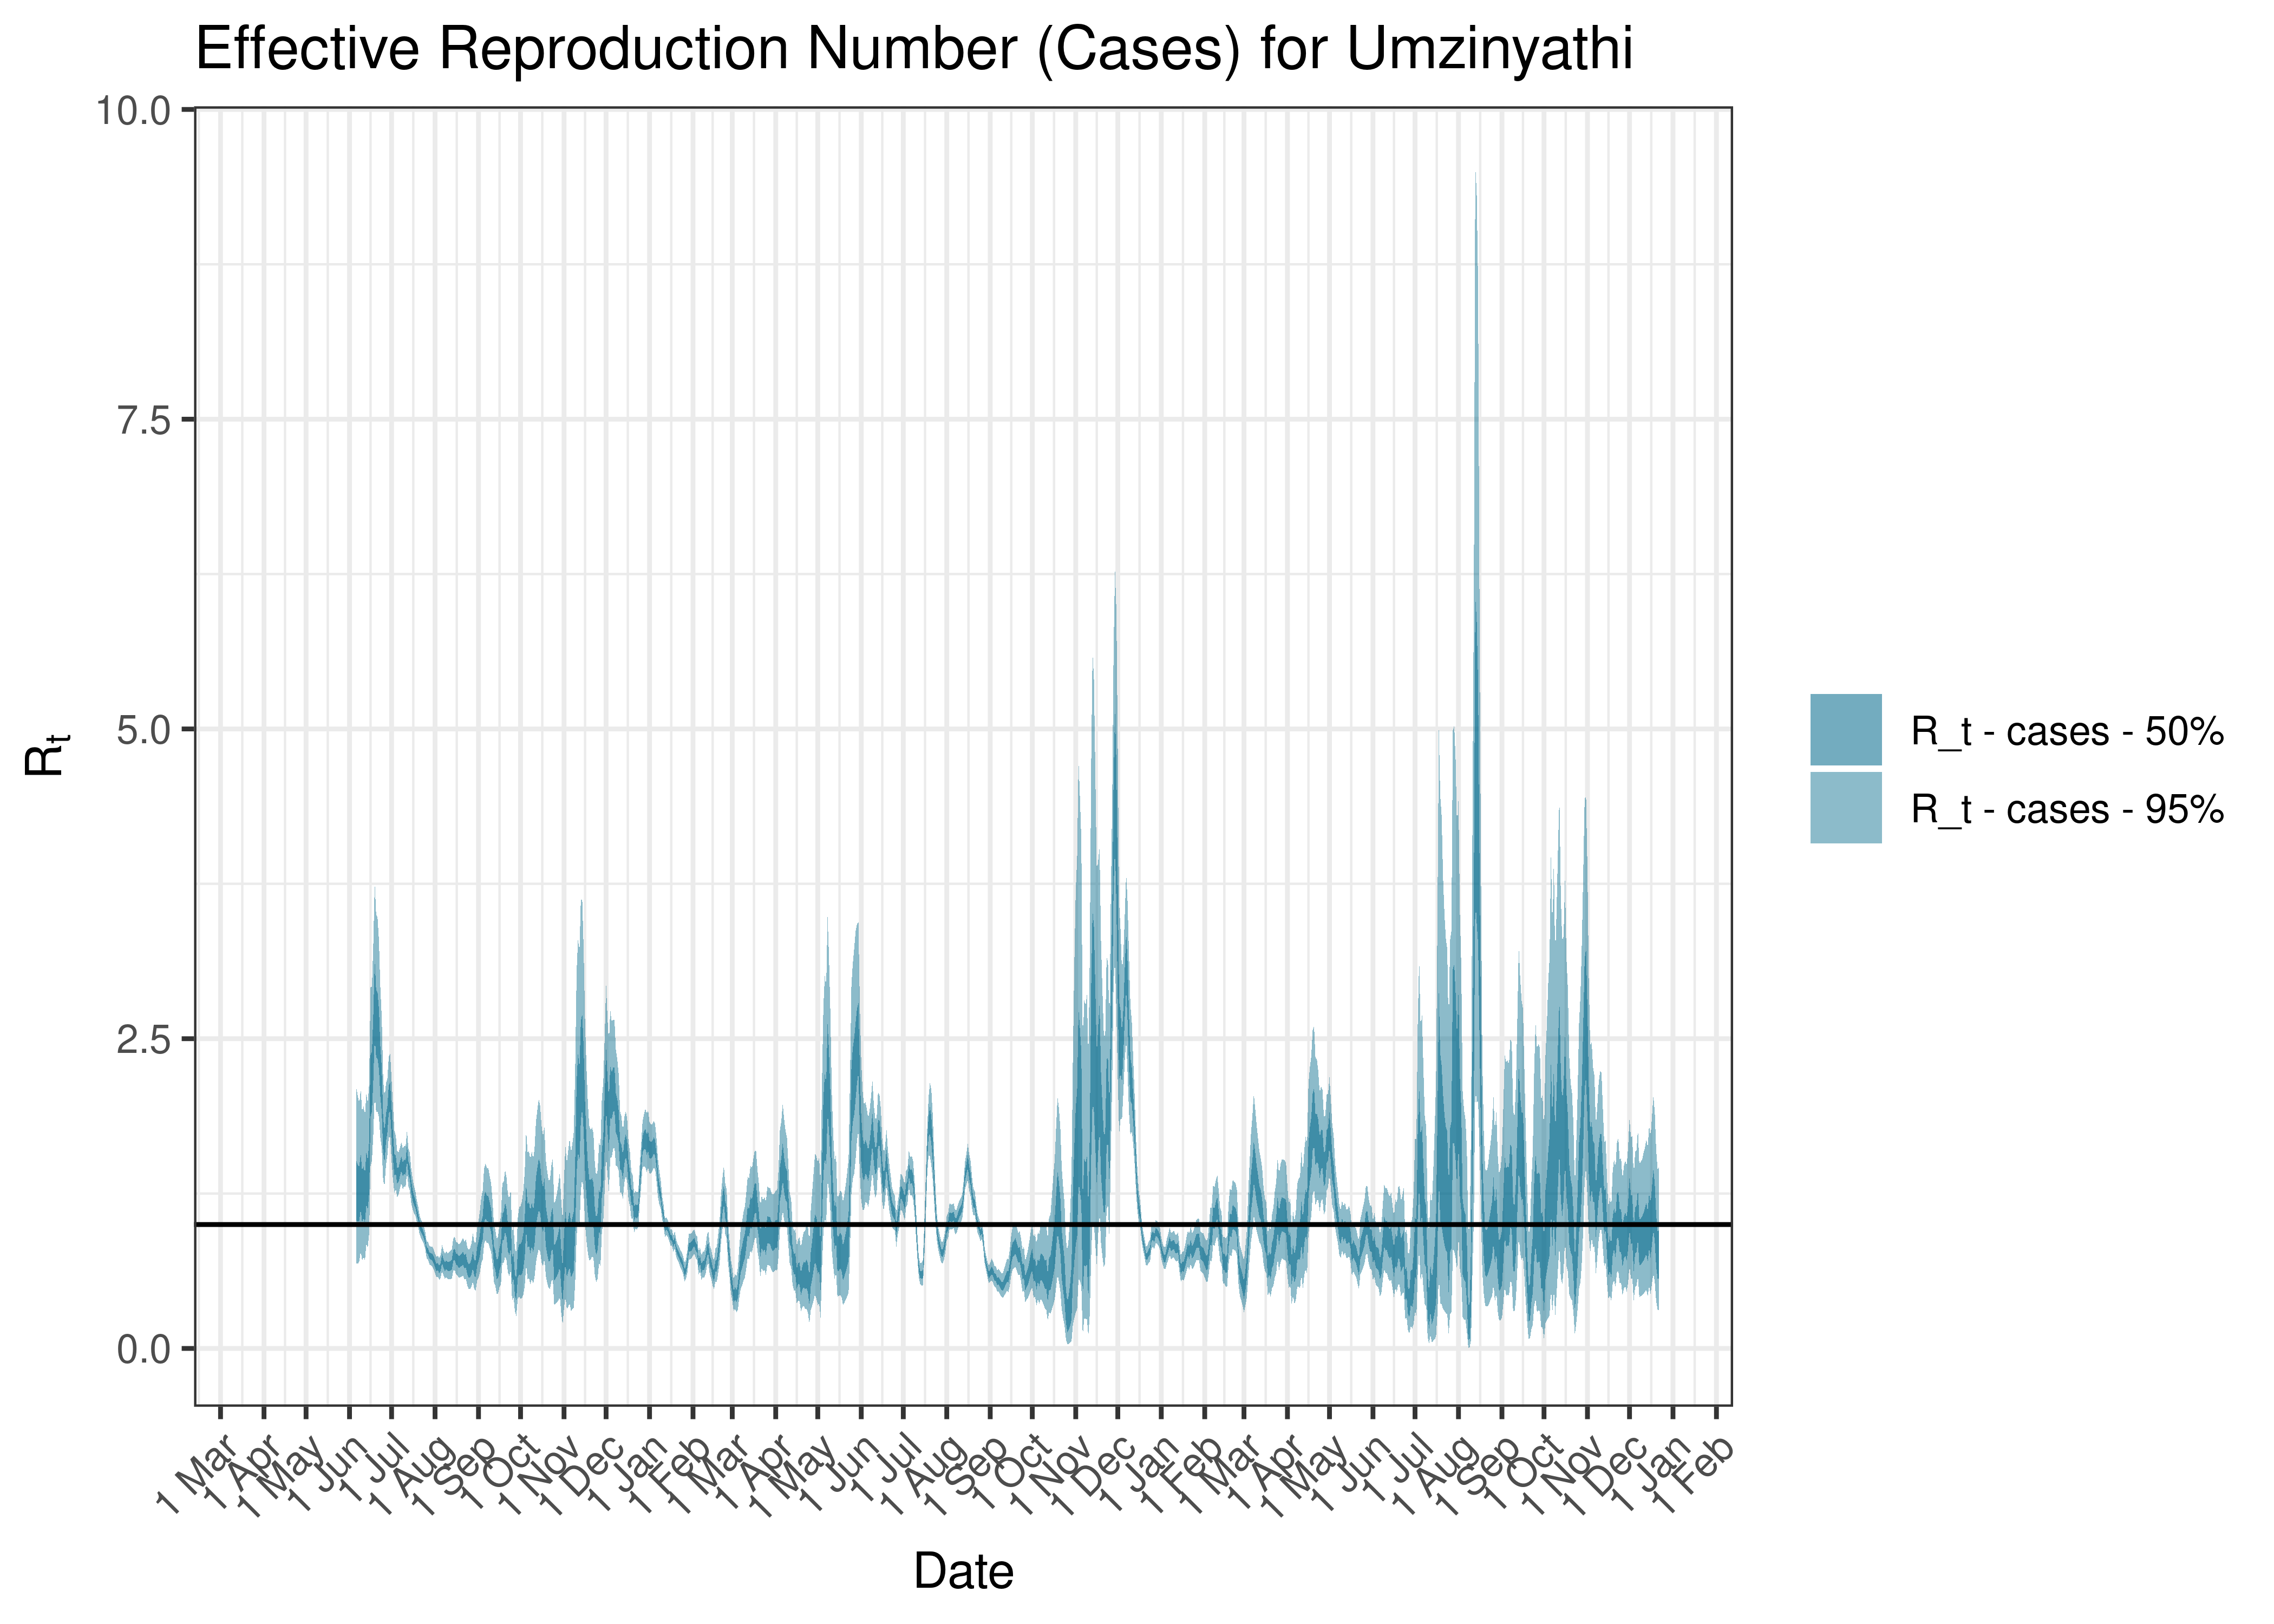
Estimated Effective Reproduction Number Based on Cases for Umzinyathi since 1 April 2020
6.5.17 Uthukela
6.5.17.1 Cases
Cases are tabulated by specimen received date below. Cases include estimates for late reporting in recent days as well as adjustments for any public holidays. A centred 7-day moving average is also shown. The peak daily cases in previous waves (as measured by the moving average) is also shown.
| Specimen Received Date | Cases | 7-day Moving Average | Comment |
|---|---|---|---|
| 2020-07-20 | 172 | 165 | Wave 1 Peak |
| 2021-01-07 | 314 | 304 | Wave 2 Peak |
| 2021-07-08 | 187 | 161 | Wave 3 Peak |
| 2021-12-14 | 247 | 205 | Wave 4 Peak |
| 2022-05-07 | 22 | 41 | Wave 5 Peak (to date) |
Below a 7-day moving average daily case count are plotted for Uthukela on a log scale since start of the epidemic:
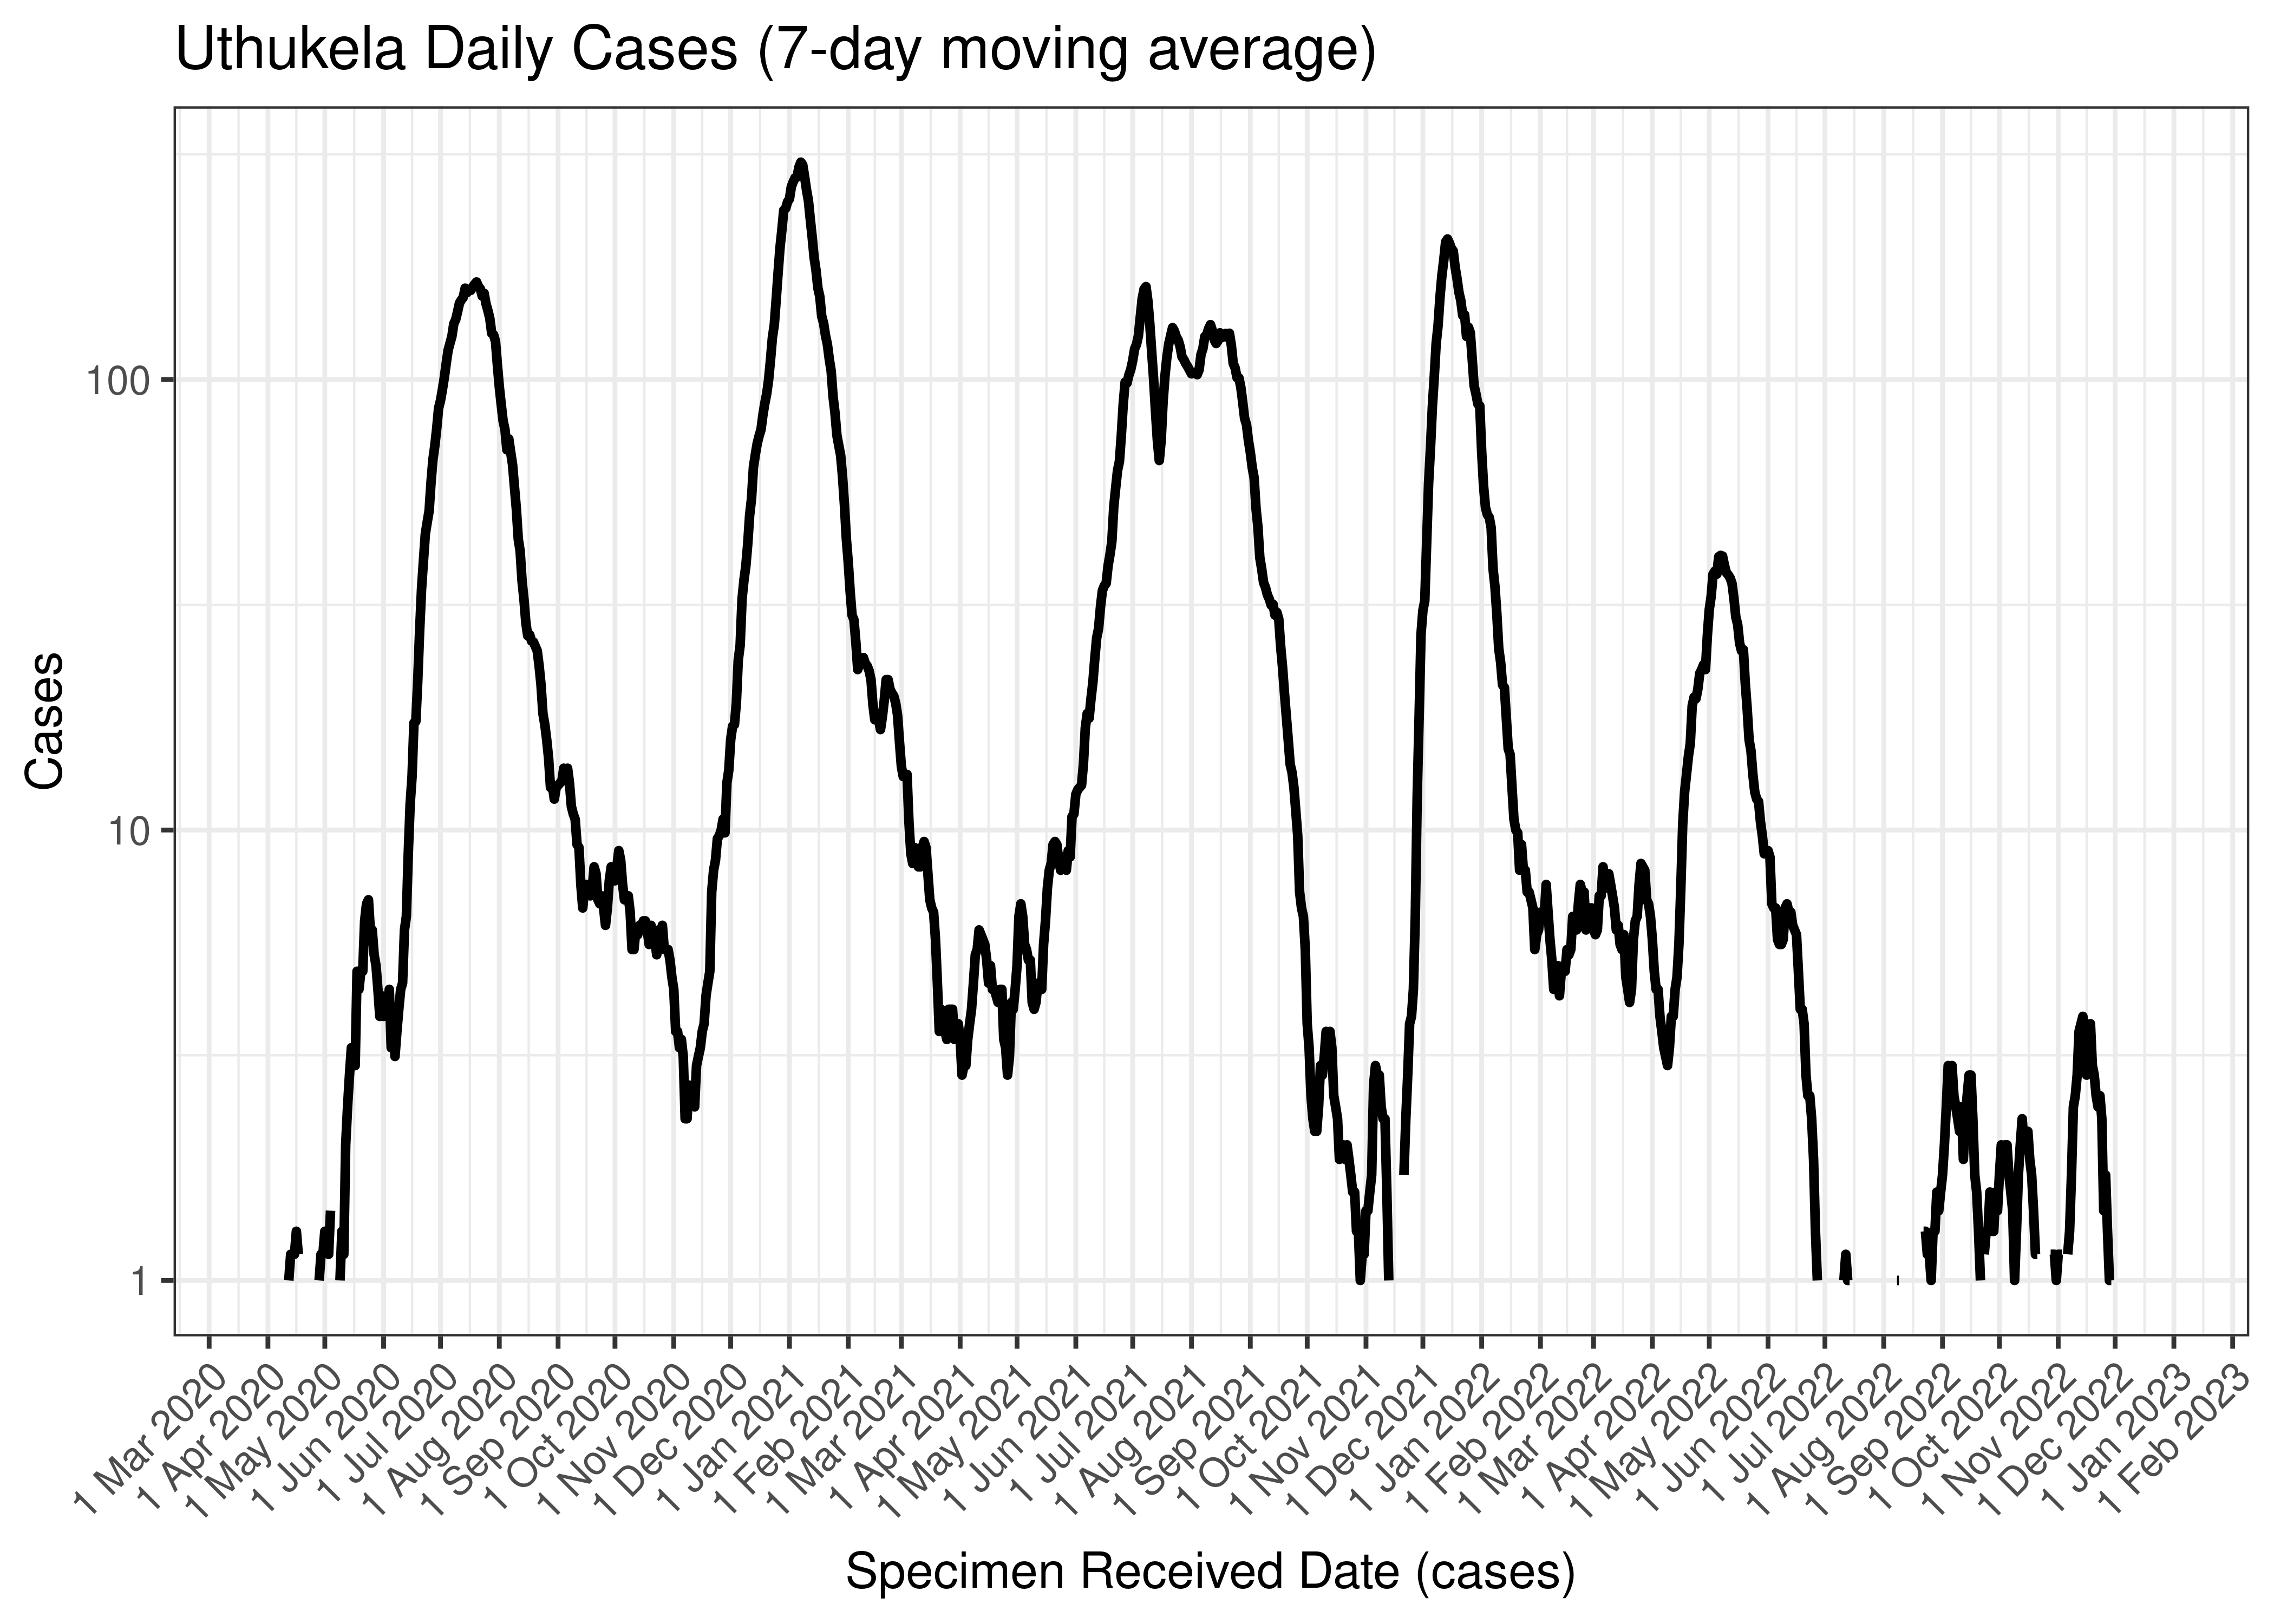
Uthukela Daily Cases (7-day moving average)
Below the above chart is repeated for the last 30-days:

Uthukela Daily Cases for Last 30-days (7-day moving average)
6.5.17.2 Reproduction Number
Below current (last weekly) reproduction number estimates are tabulated for Uthukela.
| Count (Per Day) | Week Ending | Reproduction Number [95% Confidence Interval] | |
|---|---|---|---|
| Uthukela | 0.9 | 2022-12-25 | 1.21 [0.49 - 2.24] |
Below the effective reproduction number for Uthukela over the last 90 days are plotted together with a plot since start of the pandemic.
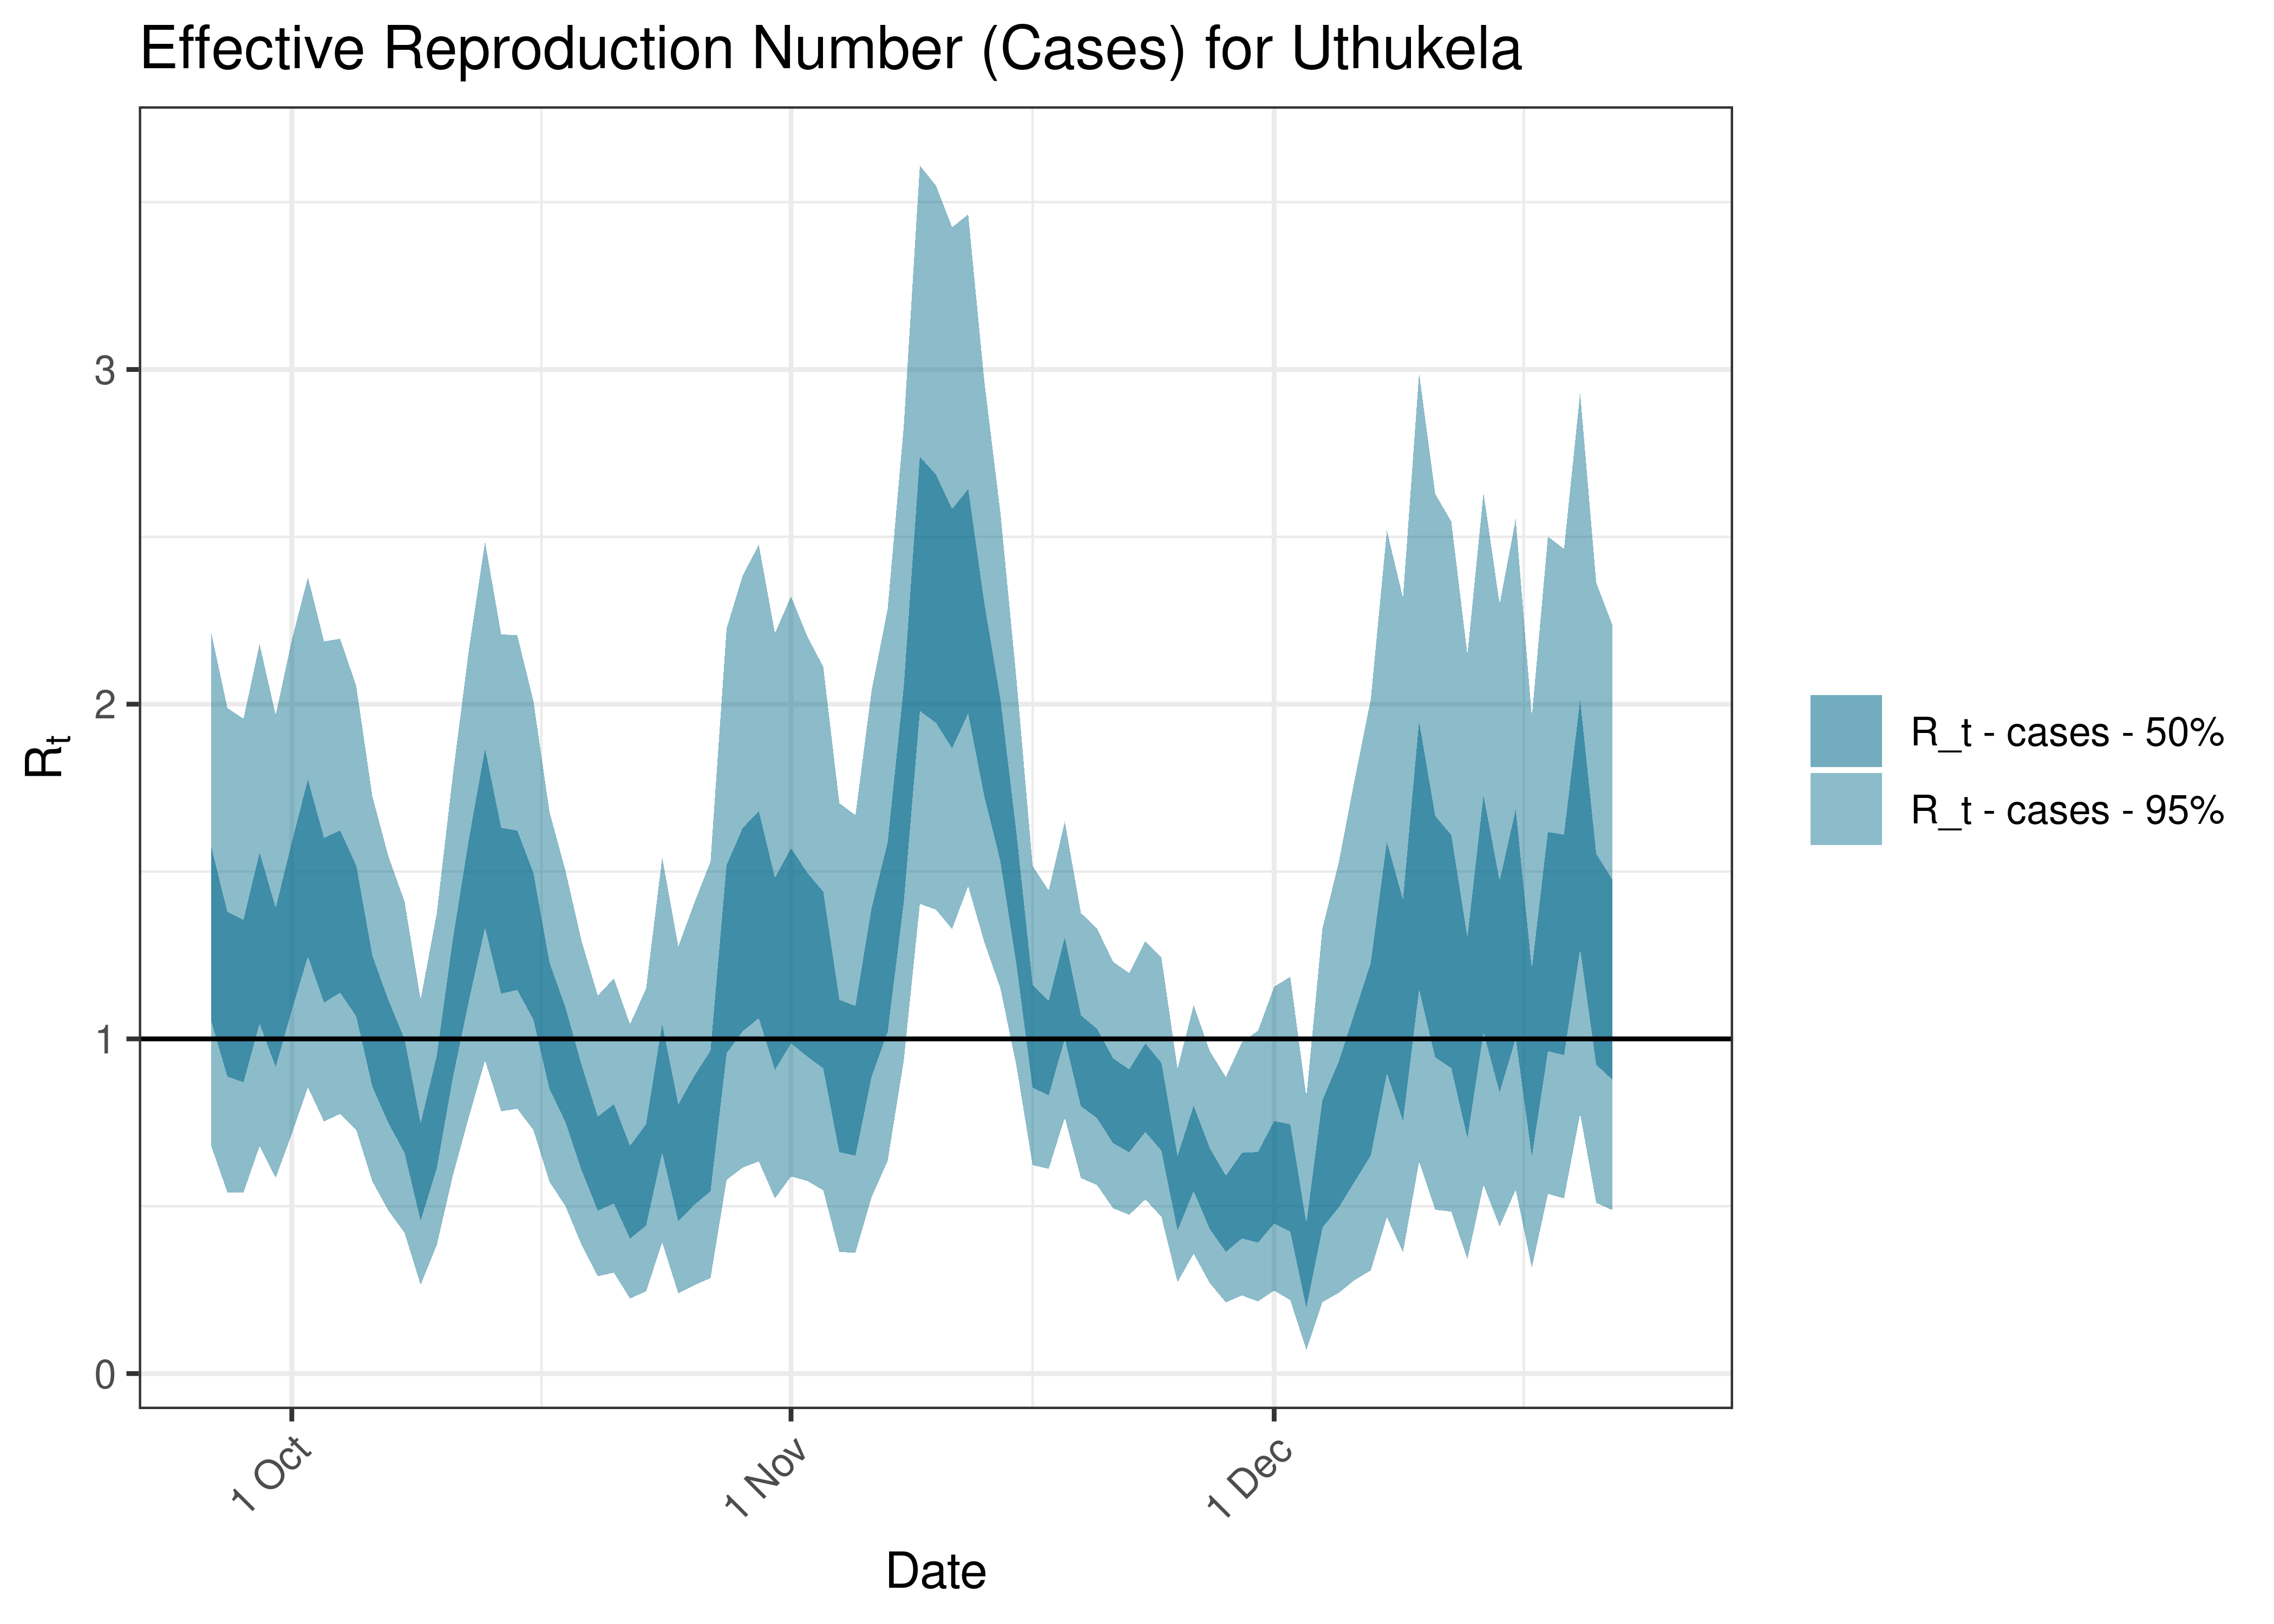
Estimated Effective Reproduction Number Based on Cases for Uthukela over last 90 days
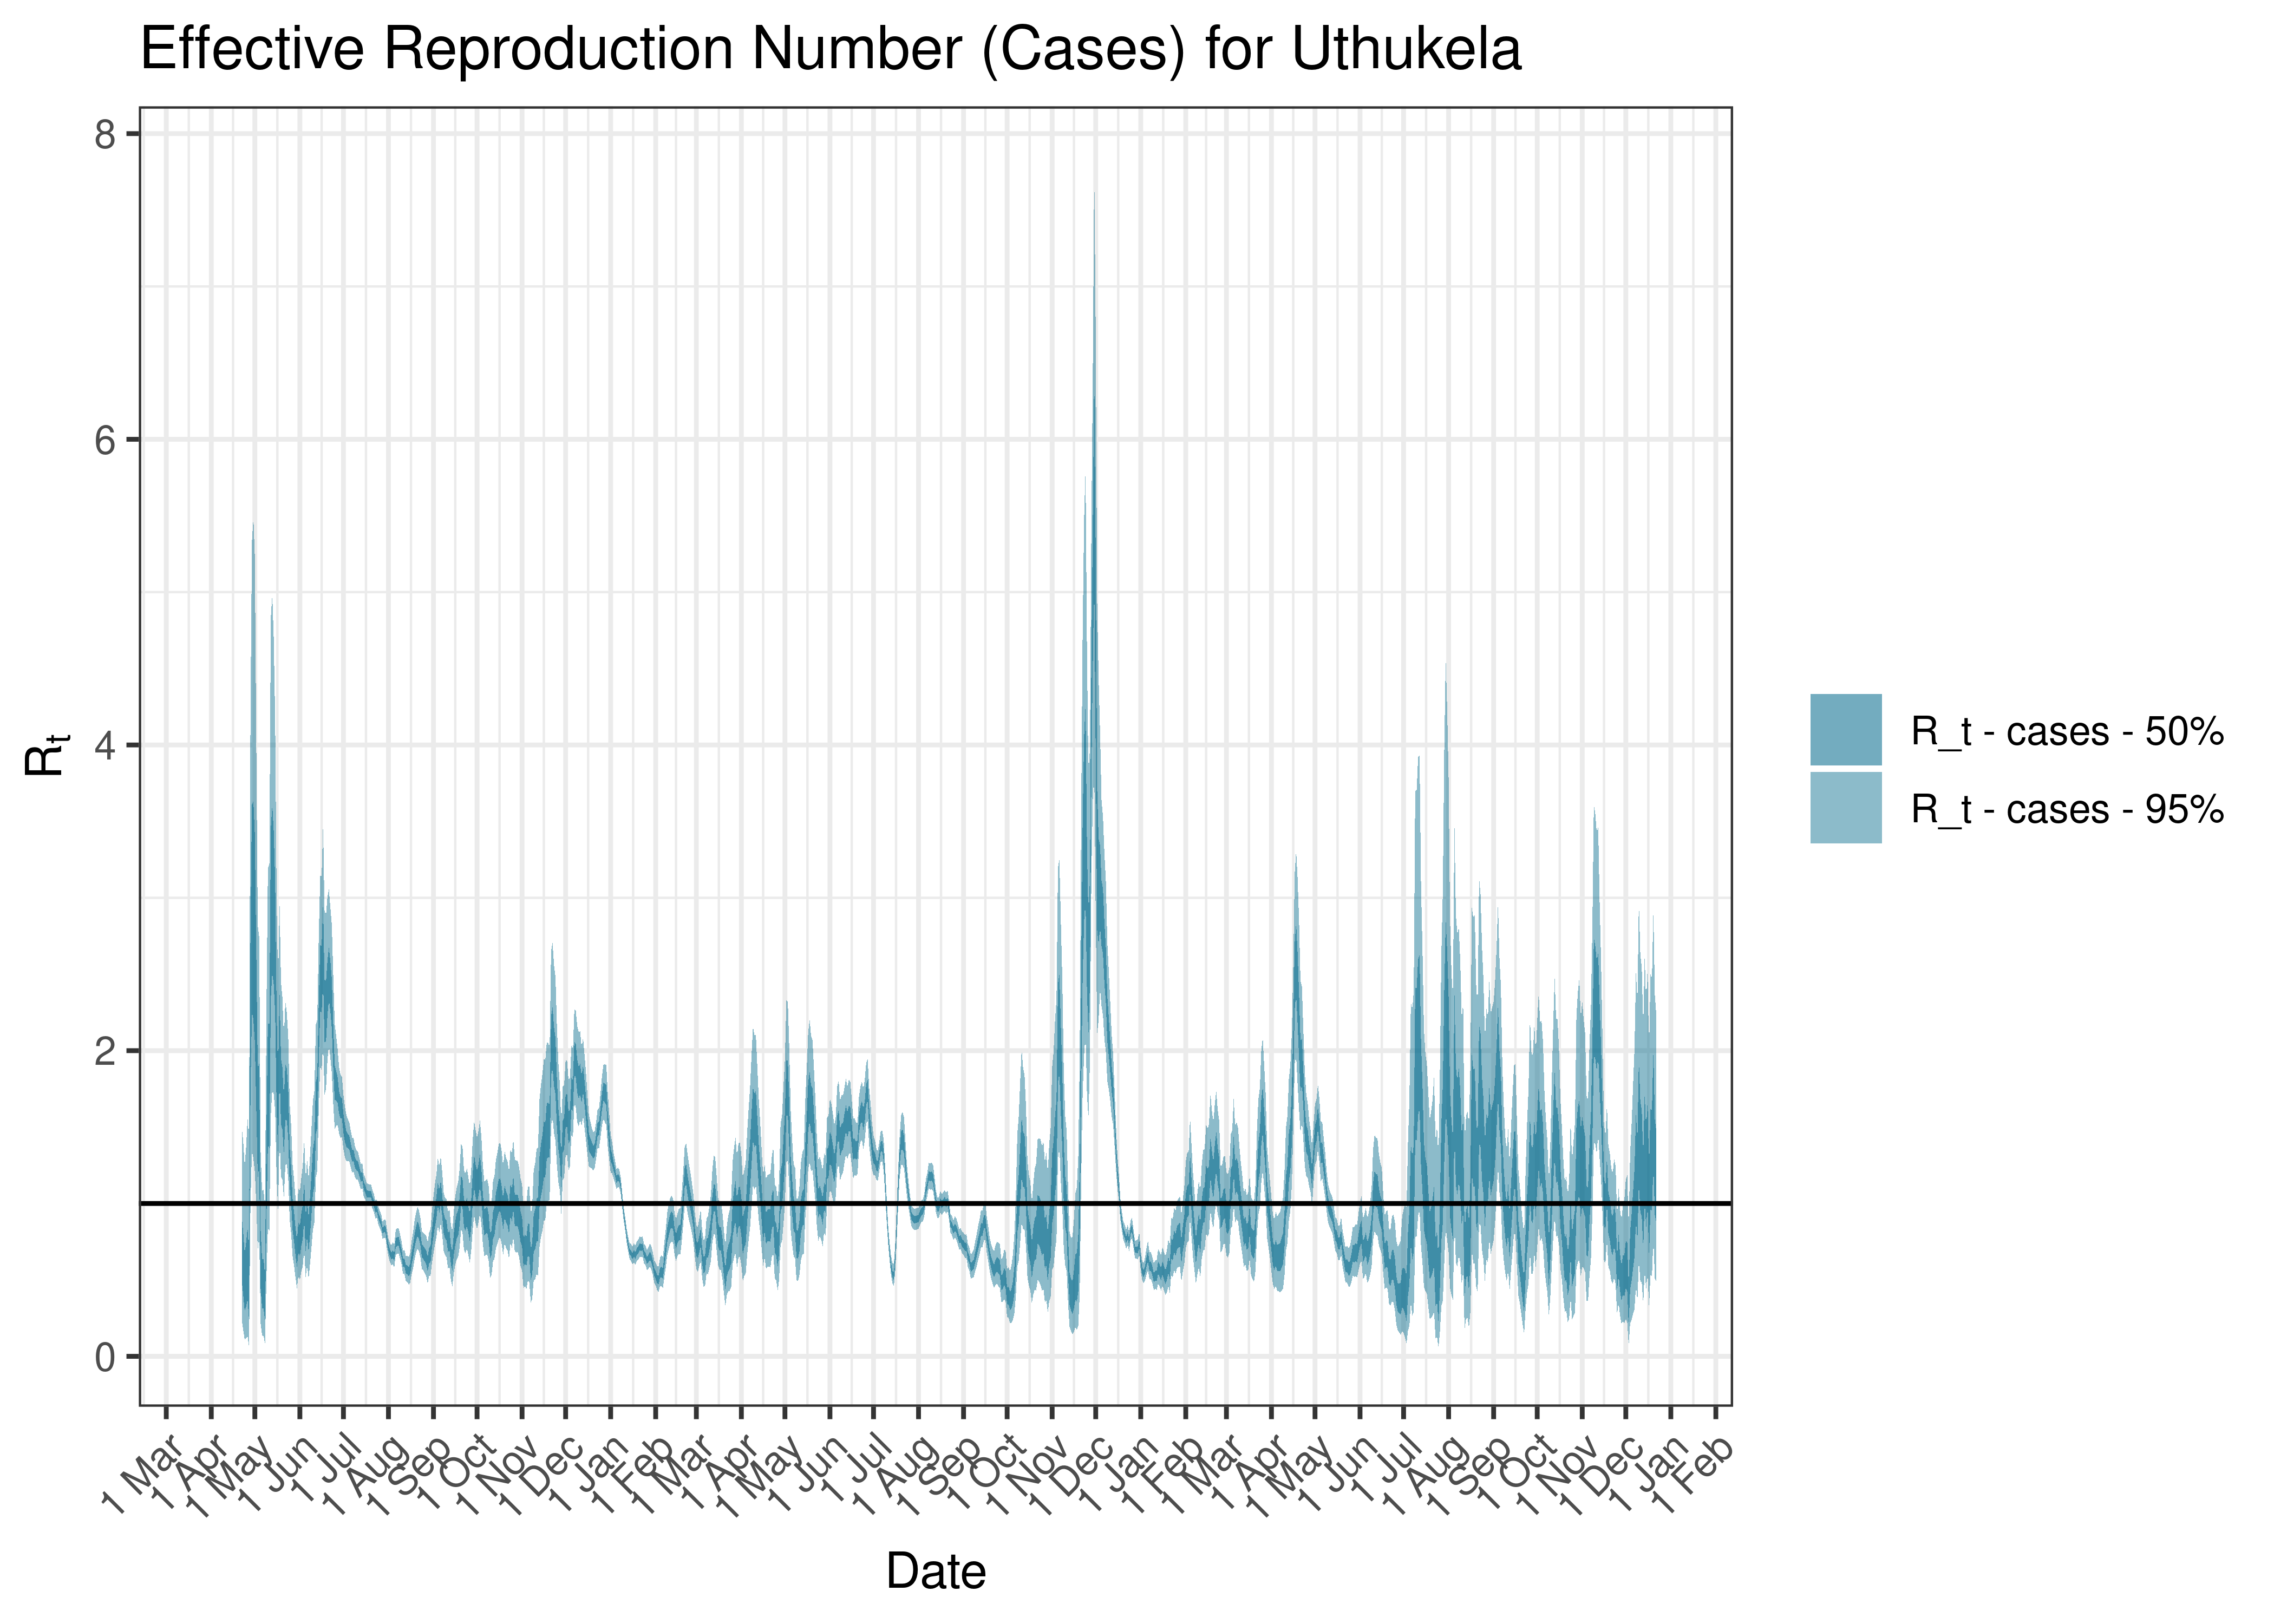
Estimated Effective Reproduction Number Based on Cases for Uthukela since 1 April 2020
6.5.18 Zululand
6.5.18.1 Cases
Cases are tabulated by specimen received date below. Cases include estimates for late reporting in recent days as well as adjustments for any public holidays. A centred 7-day moving average is also shown. The peak daily cases in previous waves (as measured by the moving average) is also shown.
| Specimen Received Date | Cases | 7-day Moving Average | Comment |
|---|---|---|---|
| 2020-07-18 | 136 | 172 | Wave 1 Peak |
| 2021-01-10 | 117 | 200 | Wave 2 Peak |
| 2021-08-25 | 159 | 161 | Wave 3 Peak |
| 2021-08-26 | 199 | 161 | Wave 3 Peak |
| 2021-12-12 | 63 | 110 | Wave 4 Peak |
| 2022-05-11 | 17 | 13 | Wave 5 Peak (to date) |
| 2022-05-12 | 17 | 13 | Wave 5 Peak (to date) |
Below a 7-day moving average daily case count are plotted for Zululand on a log scale since start of the epidemic:
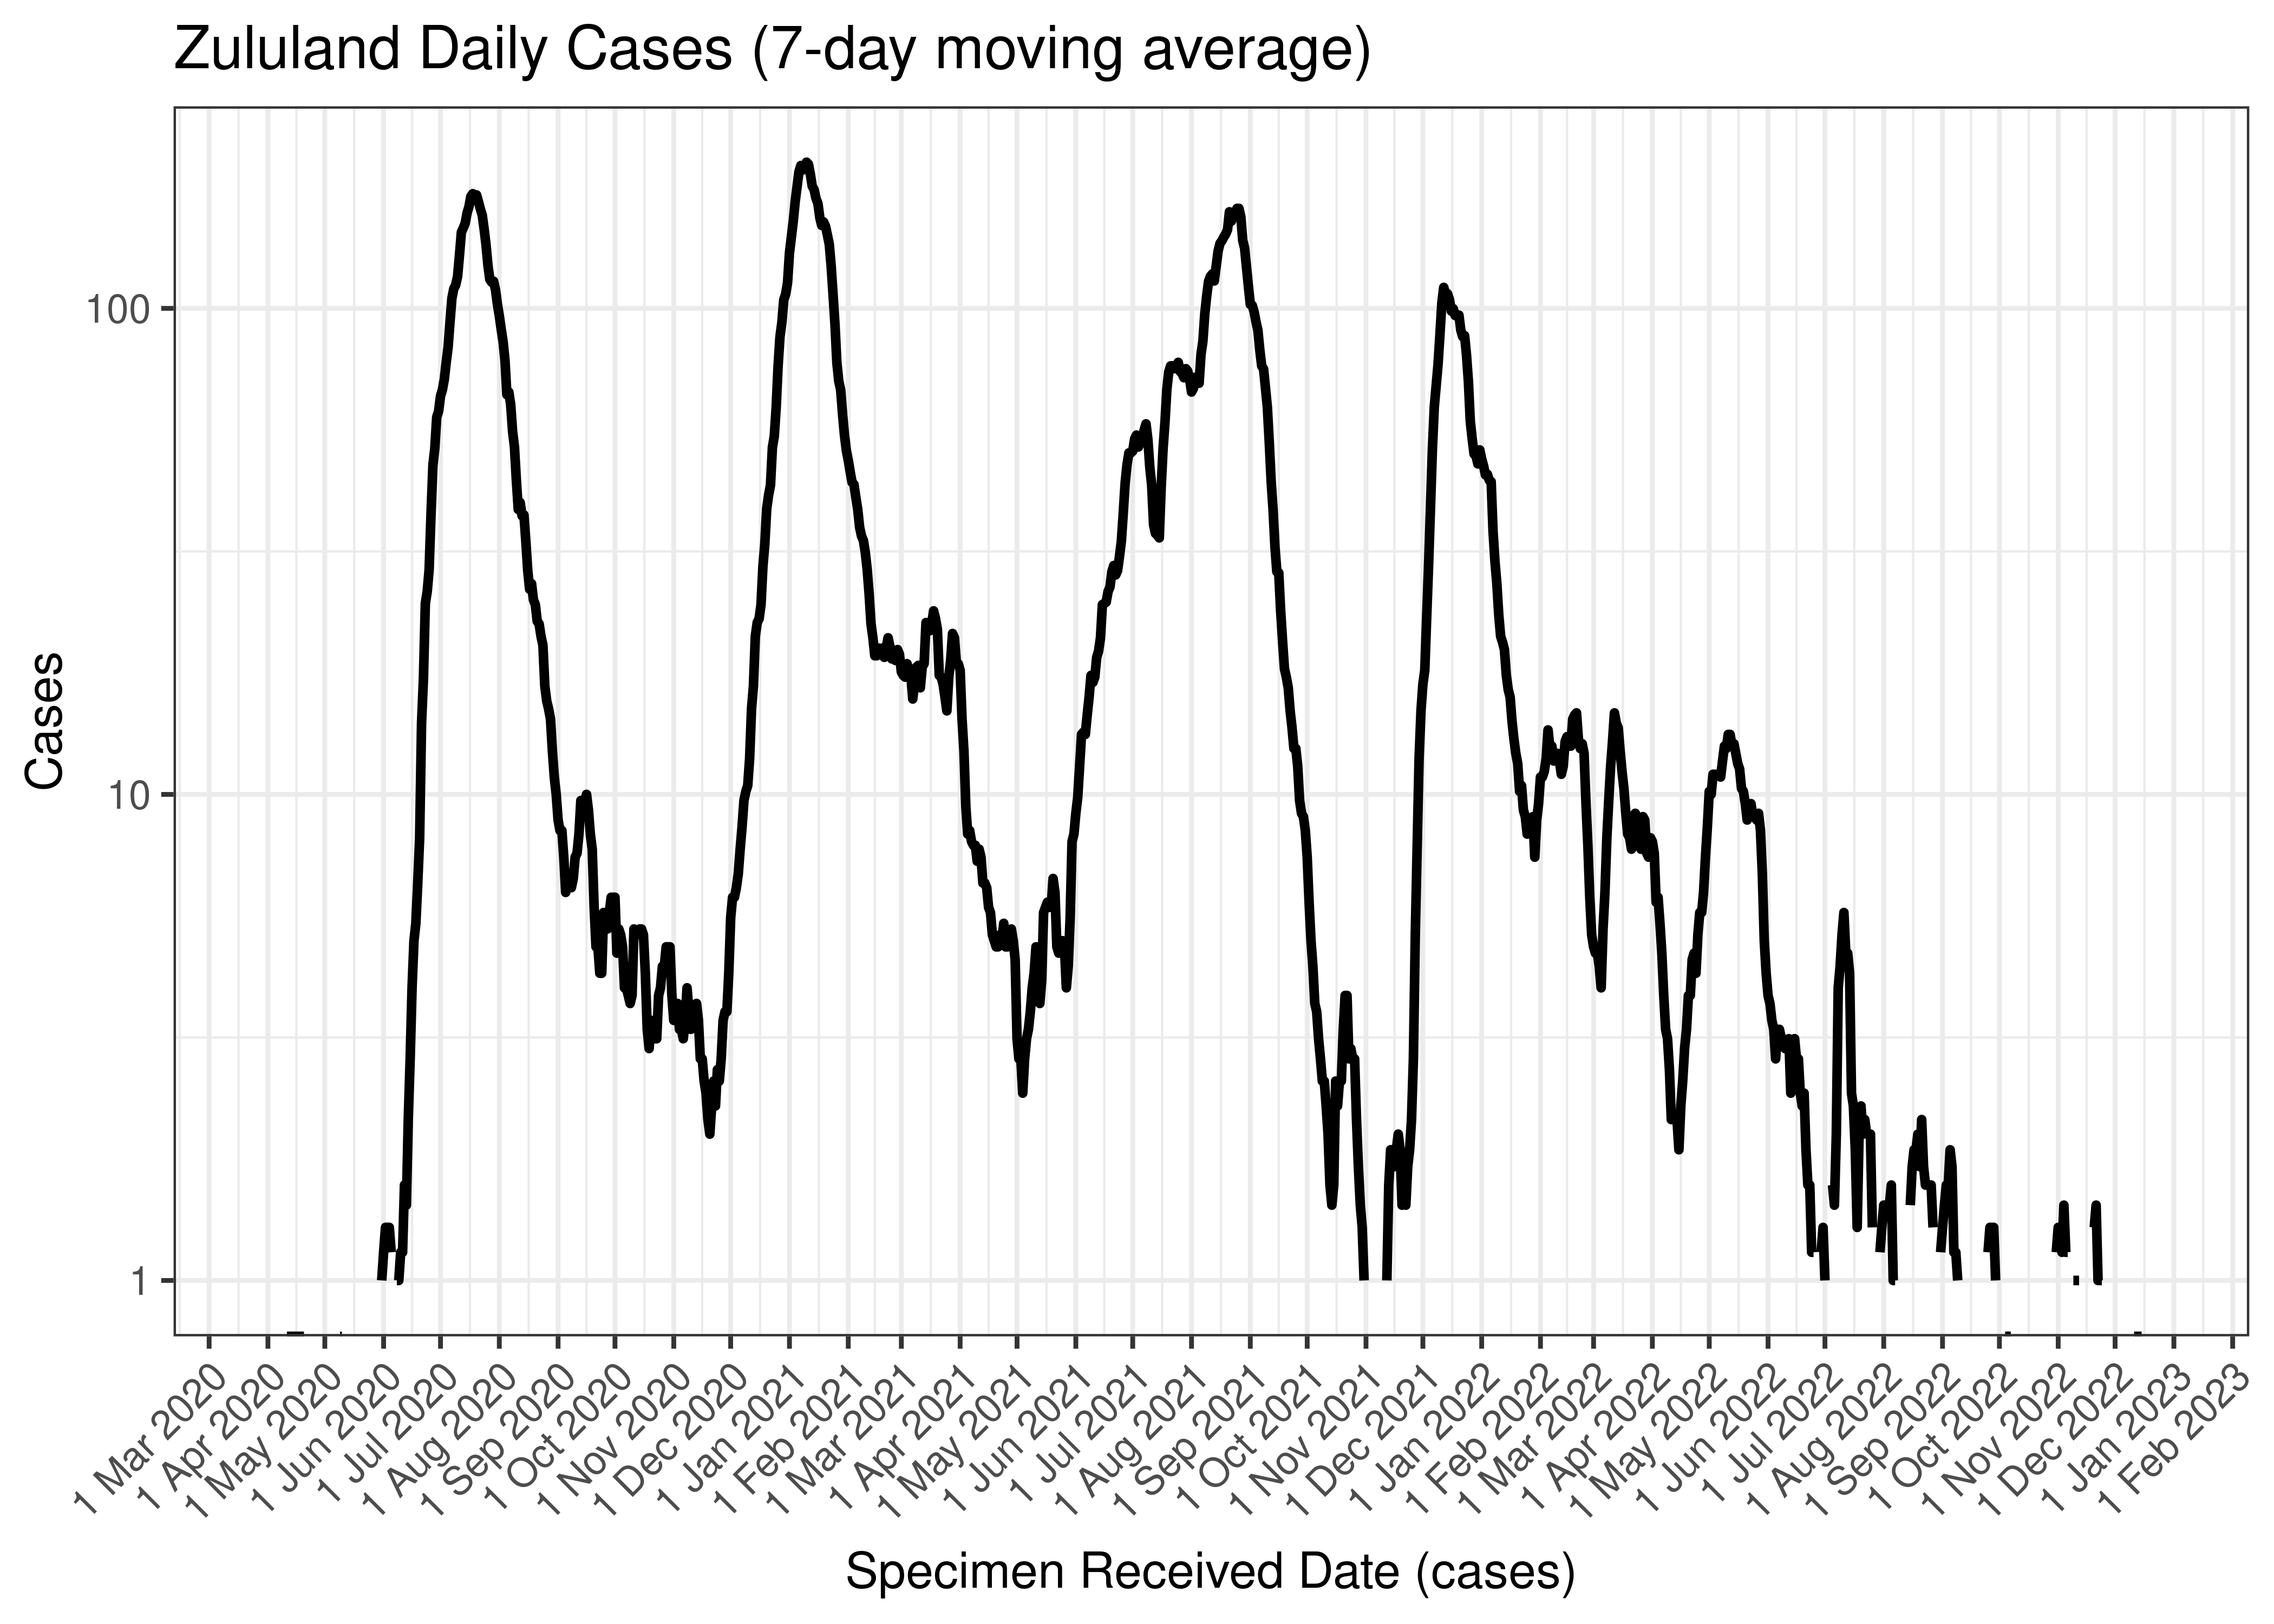
Zululand Daily Cases (7-day moving average)
Below the above chart is repeated for the last 30-days:

Zululand Daily Cases for Last 30-days (7-day moving average)
6.5.18.2 Reproduction Number
Below current (last weekly) reproduction number estimates are tabulated for Zululand.
| Count (Per Day) | Week Ending | Reproduction Number [95% Confidence Interval] | |
|---|---|---|---|
| Zululand | 0.4 | 2022-12-25 | 2.51 [0.66 - 5.62] |
Below the effective reproduction number for Zululand over the last 90 days are plotted together with a plot since start of the pandemic.
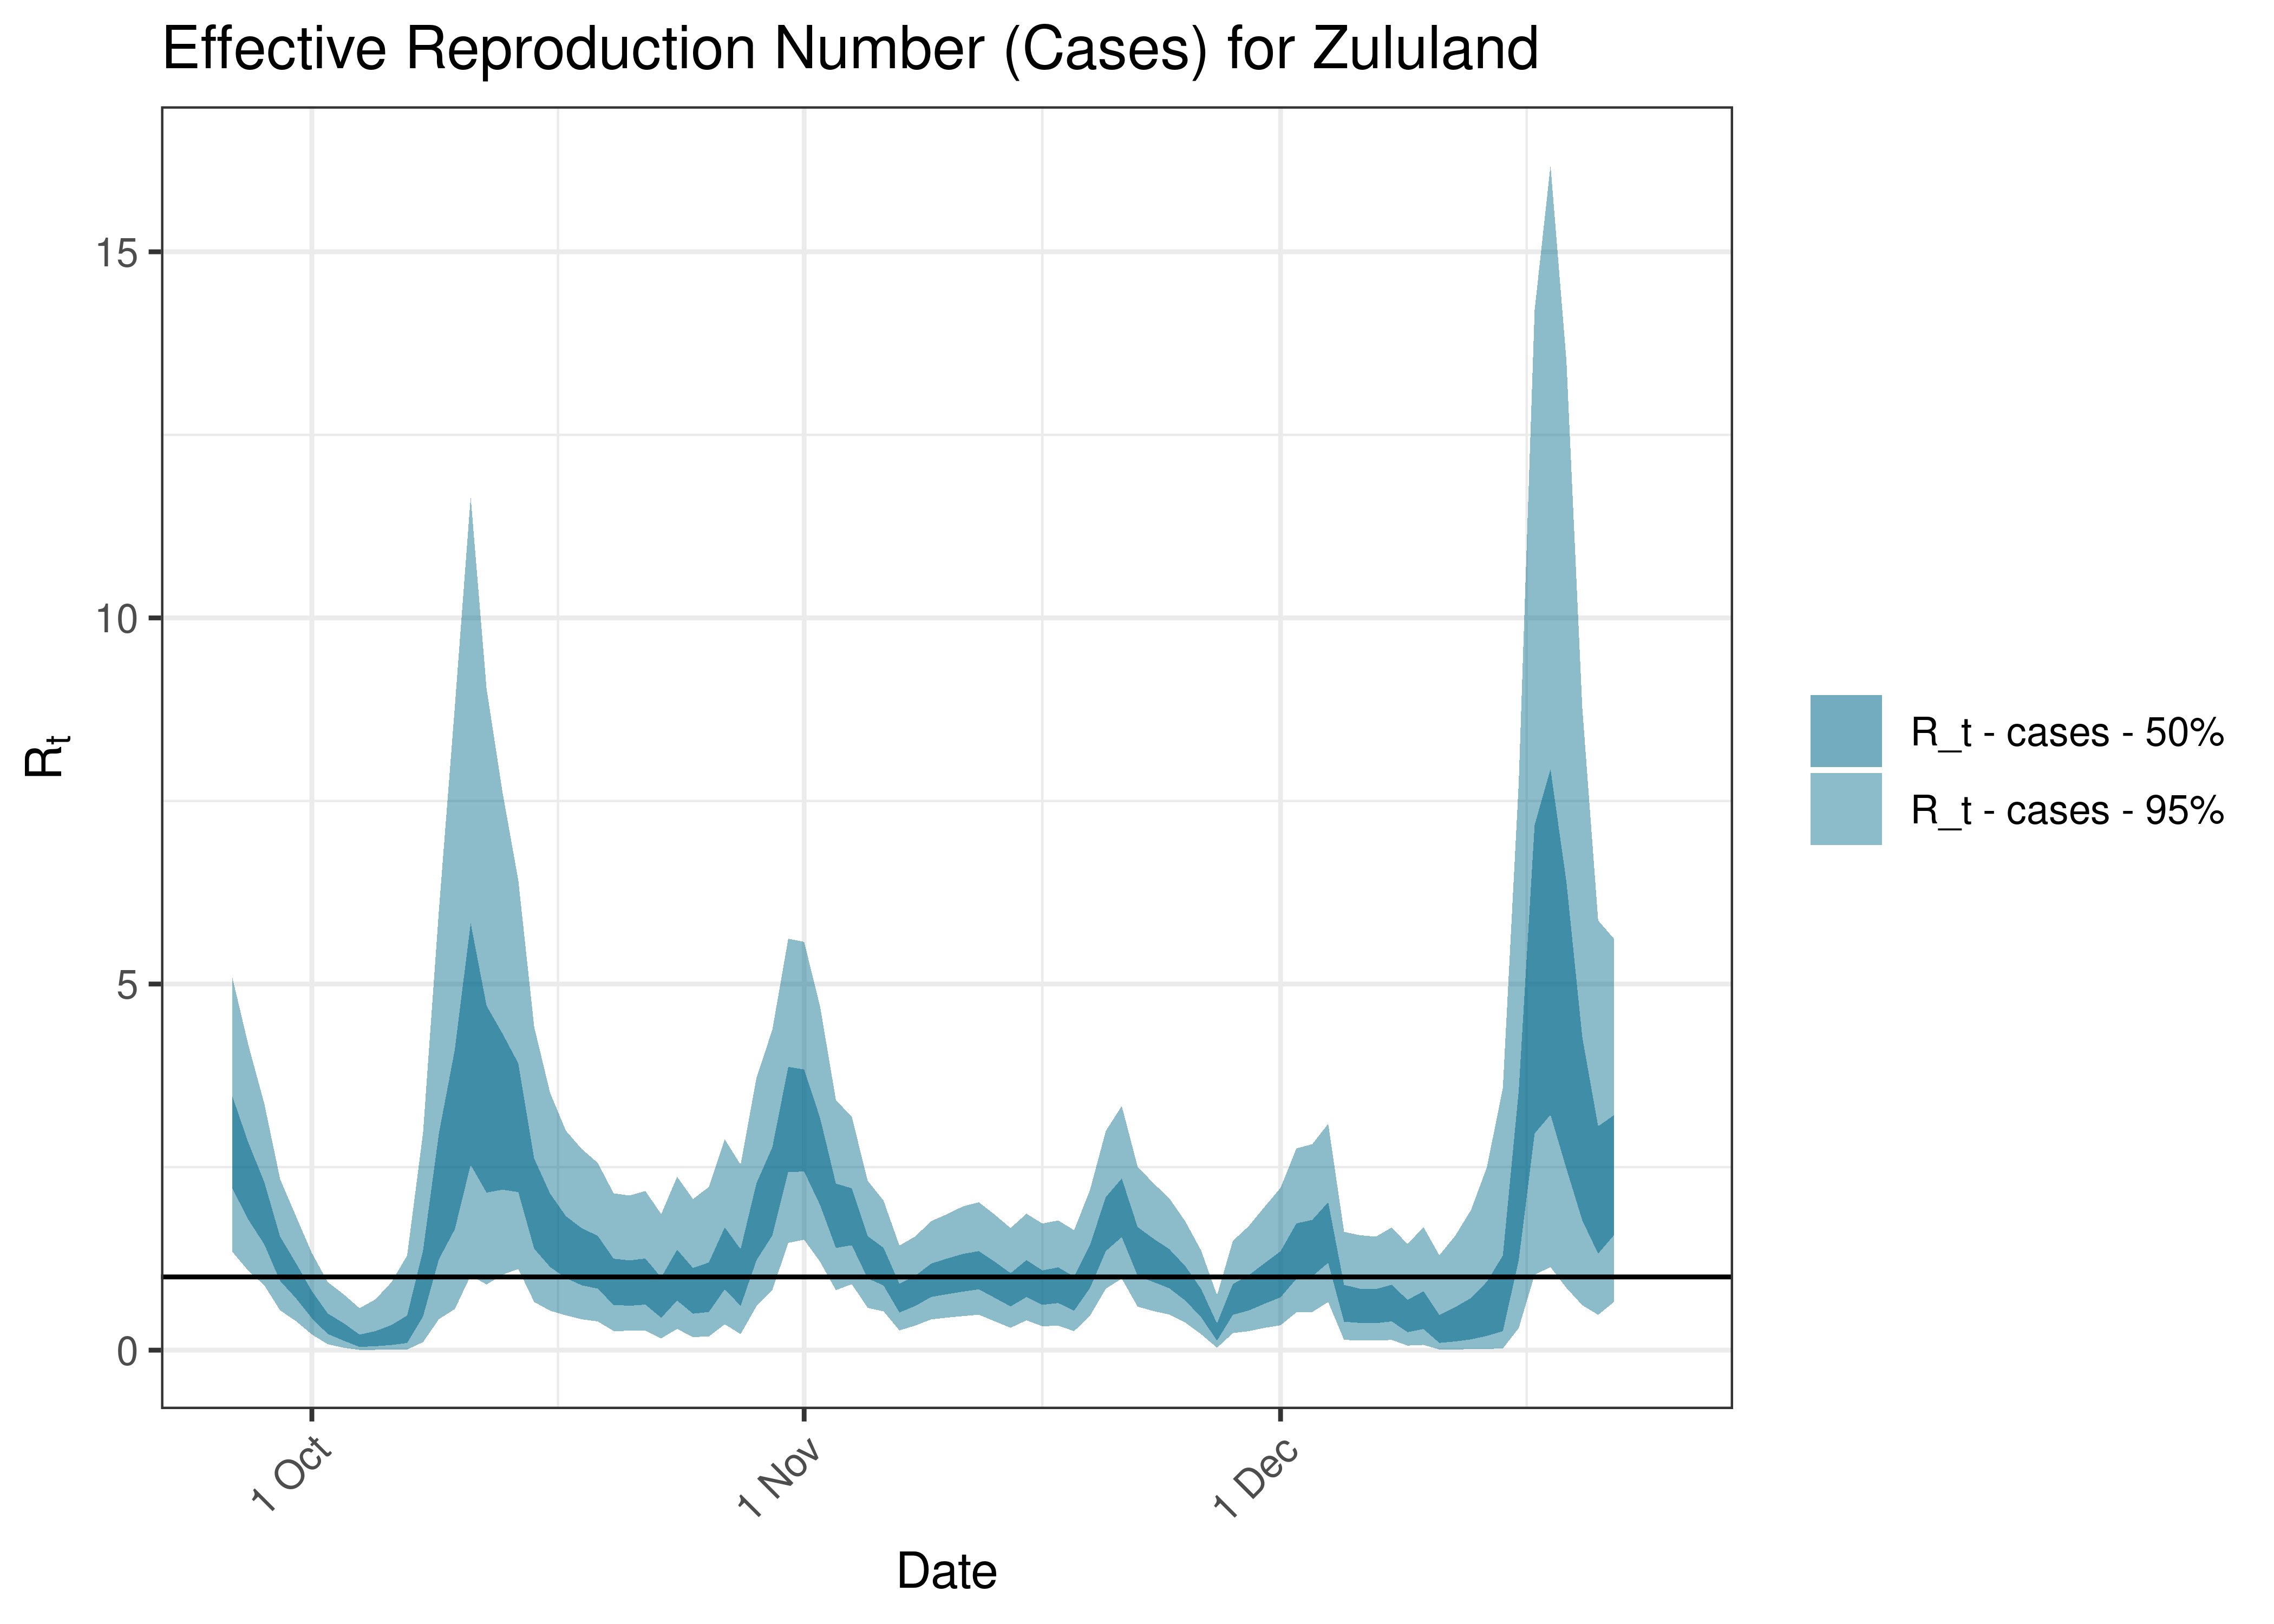
Estimated Effective Reproduction Number Based on Cases for Zululand over last 90 days
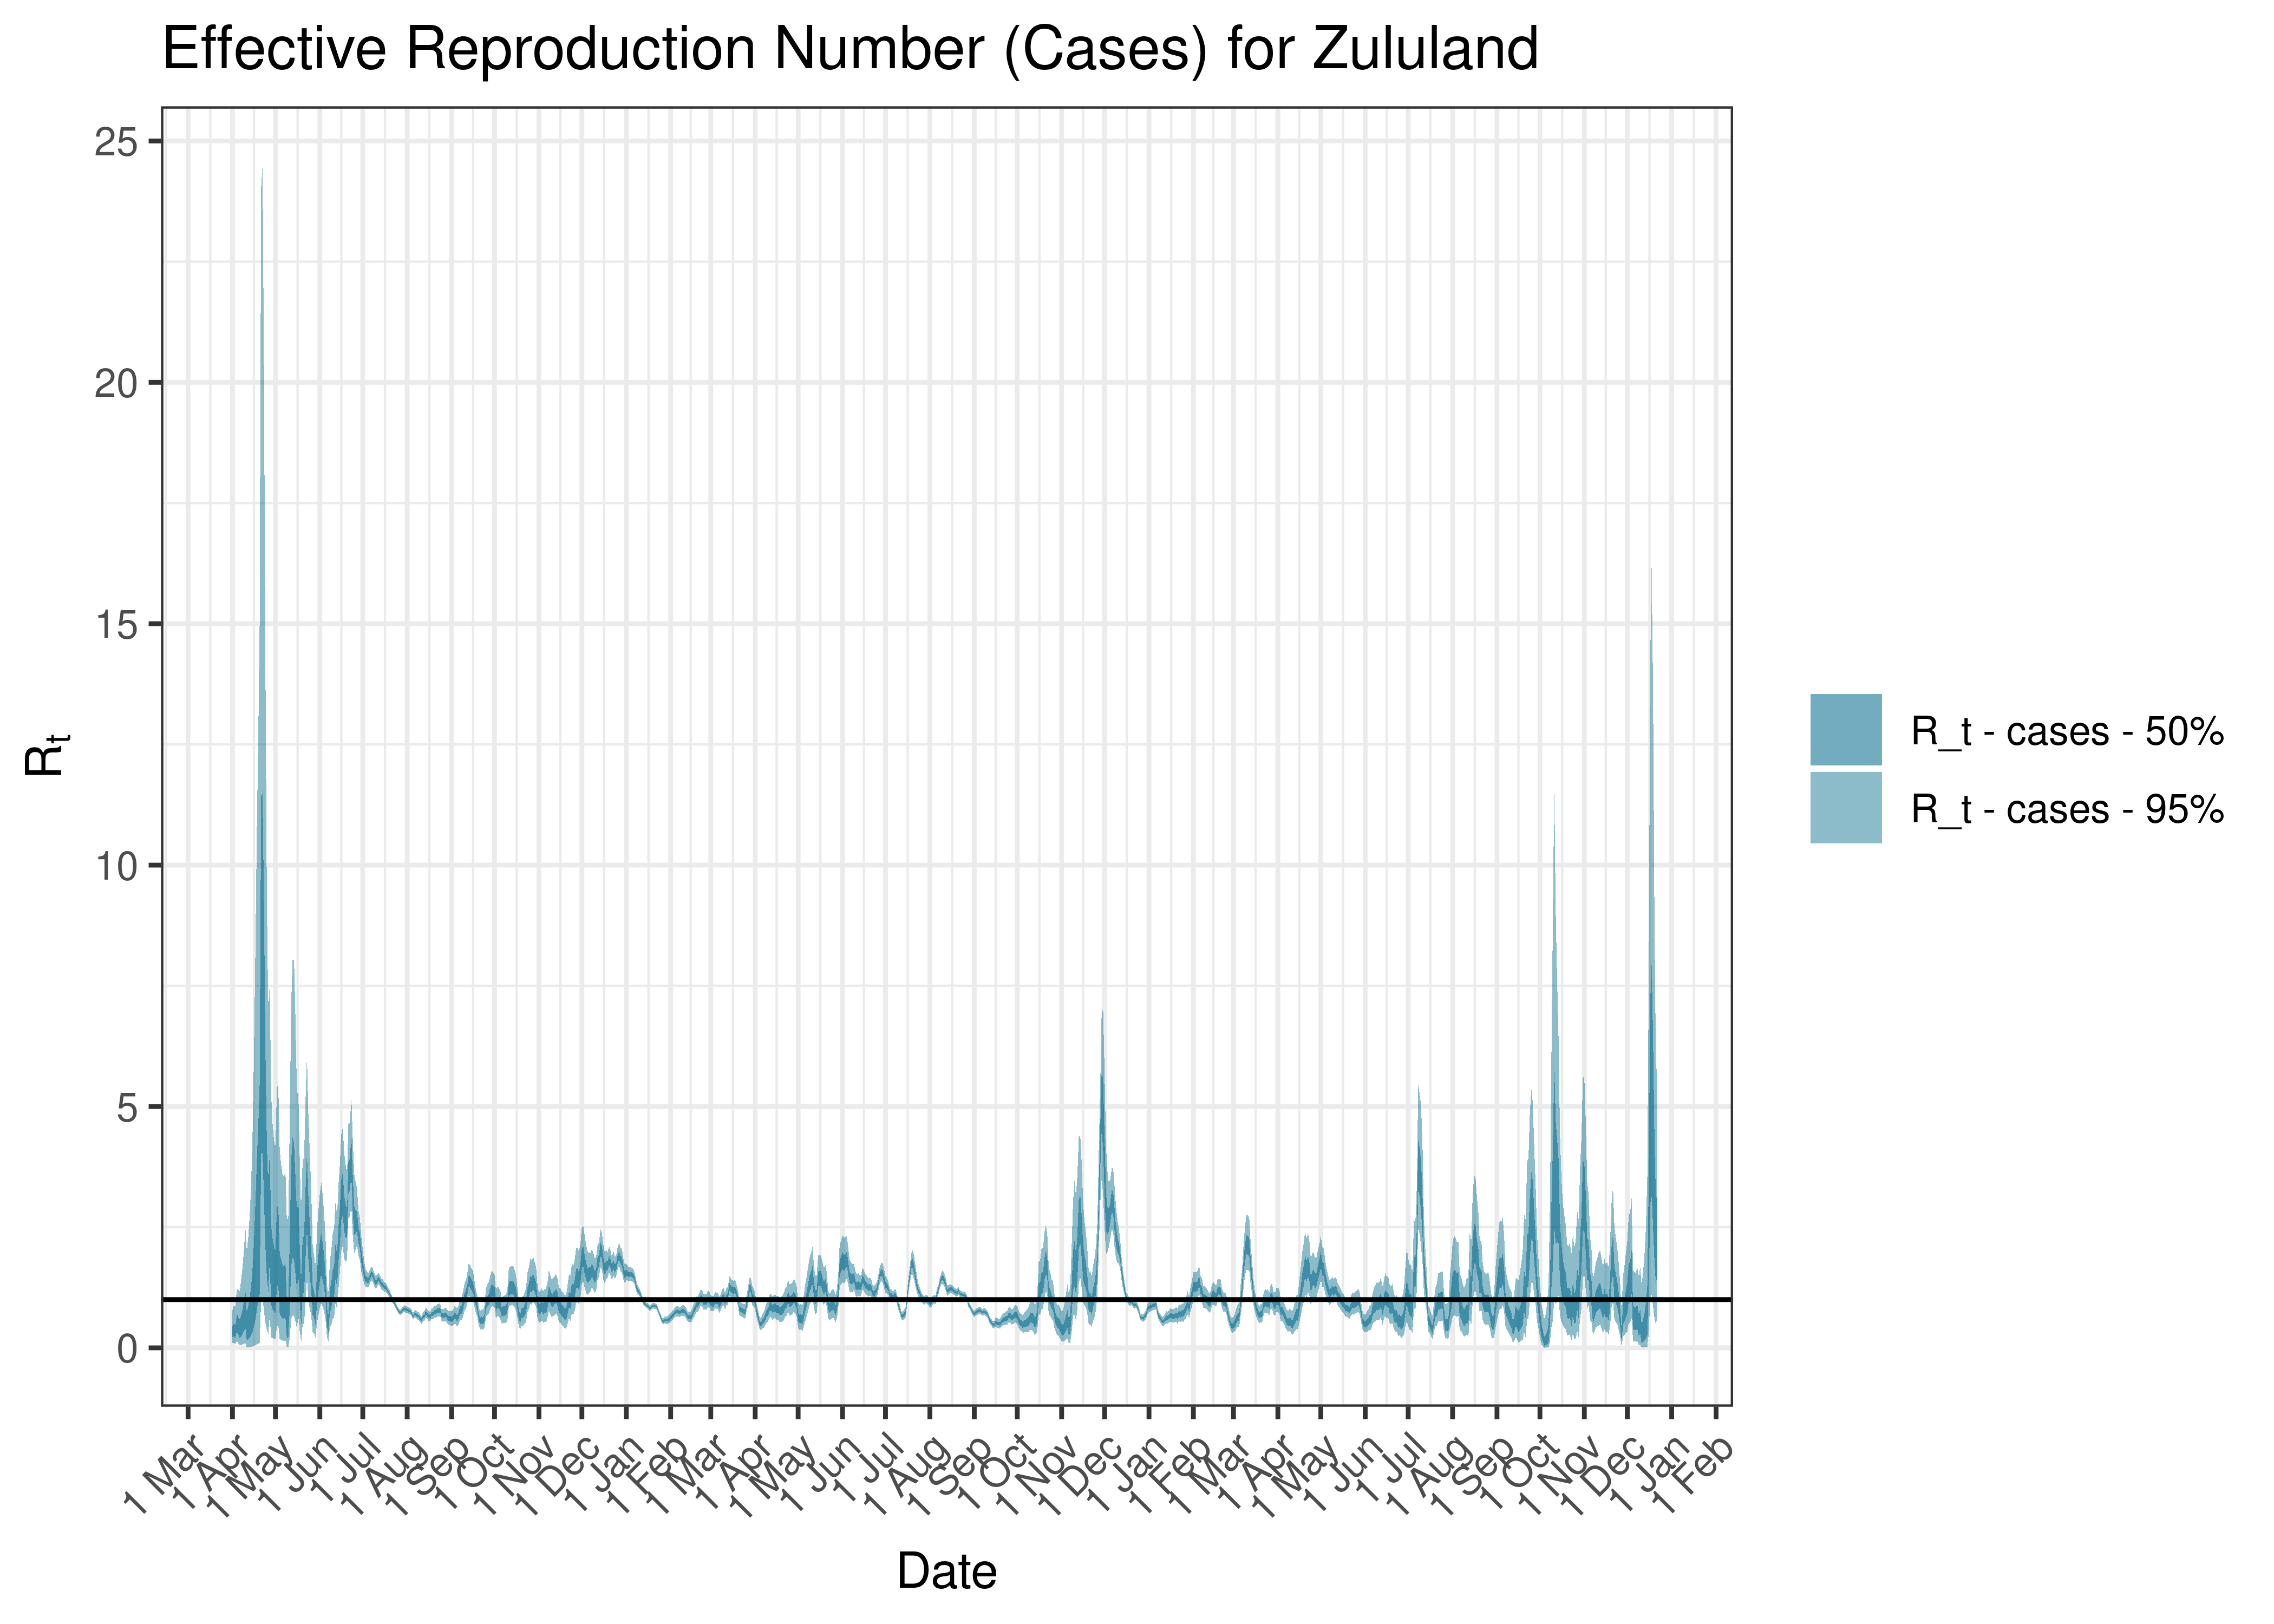
Estimated Effective Reproduction Number Based on Cases for Zululand since 1 April 2020
6.6 Limpopo
6.6.1 Cases
Cases are tabulated by specimen received date below. Cases include estimates for late reporting in recent days as well as adjustments for any public holidays. A centred 7-day moving average is also shown. The peak daily cases in previous waves (as measured by the moving average) is also shown.
| Specimen Received Date | Cases | 7-day Moving Average | Comment |
|---|---|---|---|
| 2020-07-20 | 420 | 318 | Wave 1 Peak |
| 2021-01-07 | 1,684 | 1,630 | Wave 2 Peak |
| 2021-07-08 | 1,830 | 1,507 | Wave 3 Peak |
| 2021-12-11 | 420 | 828 | Wave 4 Peak |
| 2022-05-08 | 11 | 70 | Wave 5 Peak (to date) |
Below a 7-day moving average daily case count is plotted for Limpopo on a log scale since start of the epidemic:
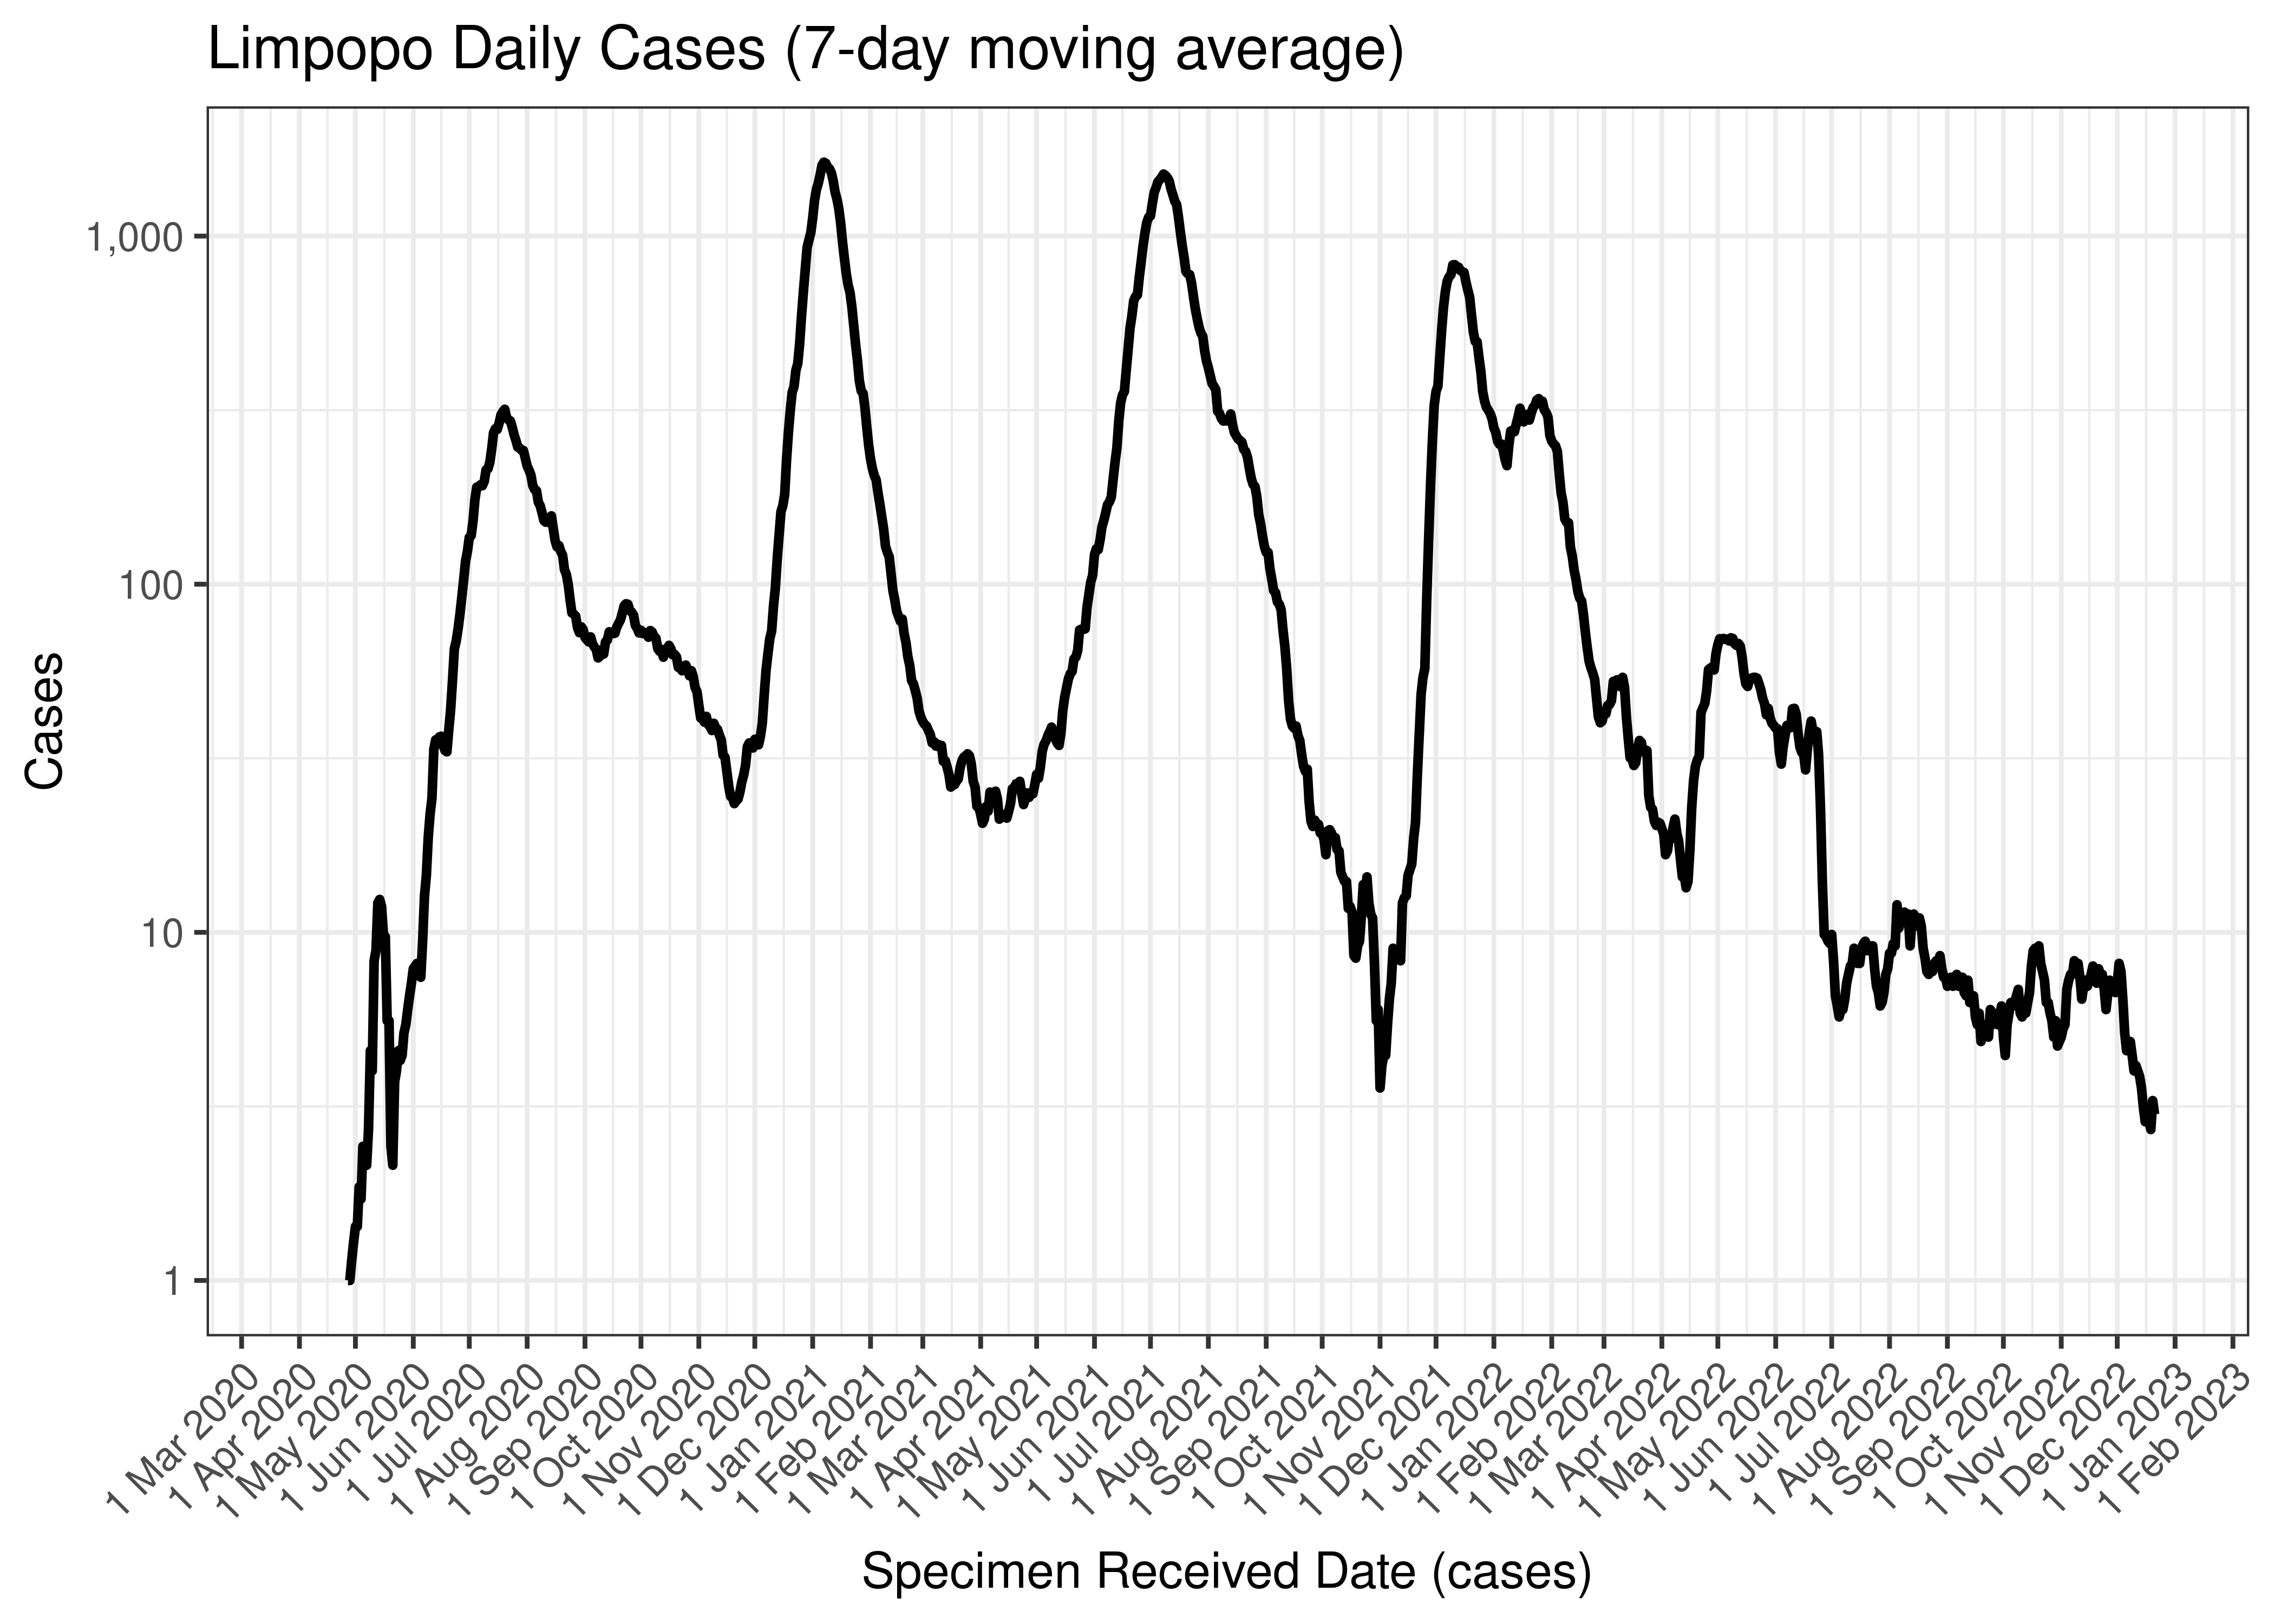
Limpopo Daily Cases (7-day moving average)
Below the above chart is repeated for the last 30-days:

Limpopo Daily Cases for Last 30-days (7-day moving average)
Below a 7-day moving average daily case count is plotted for Limpopo by district municipality on a log scale since start of the epidemic:
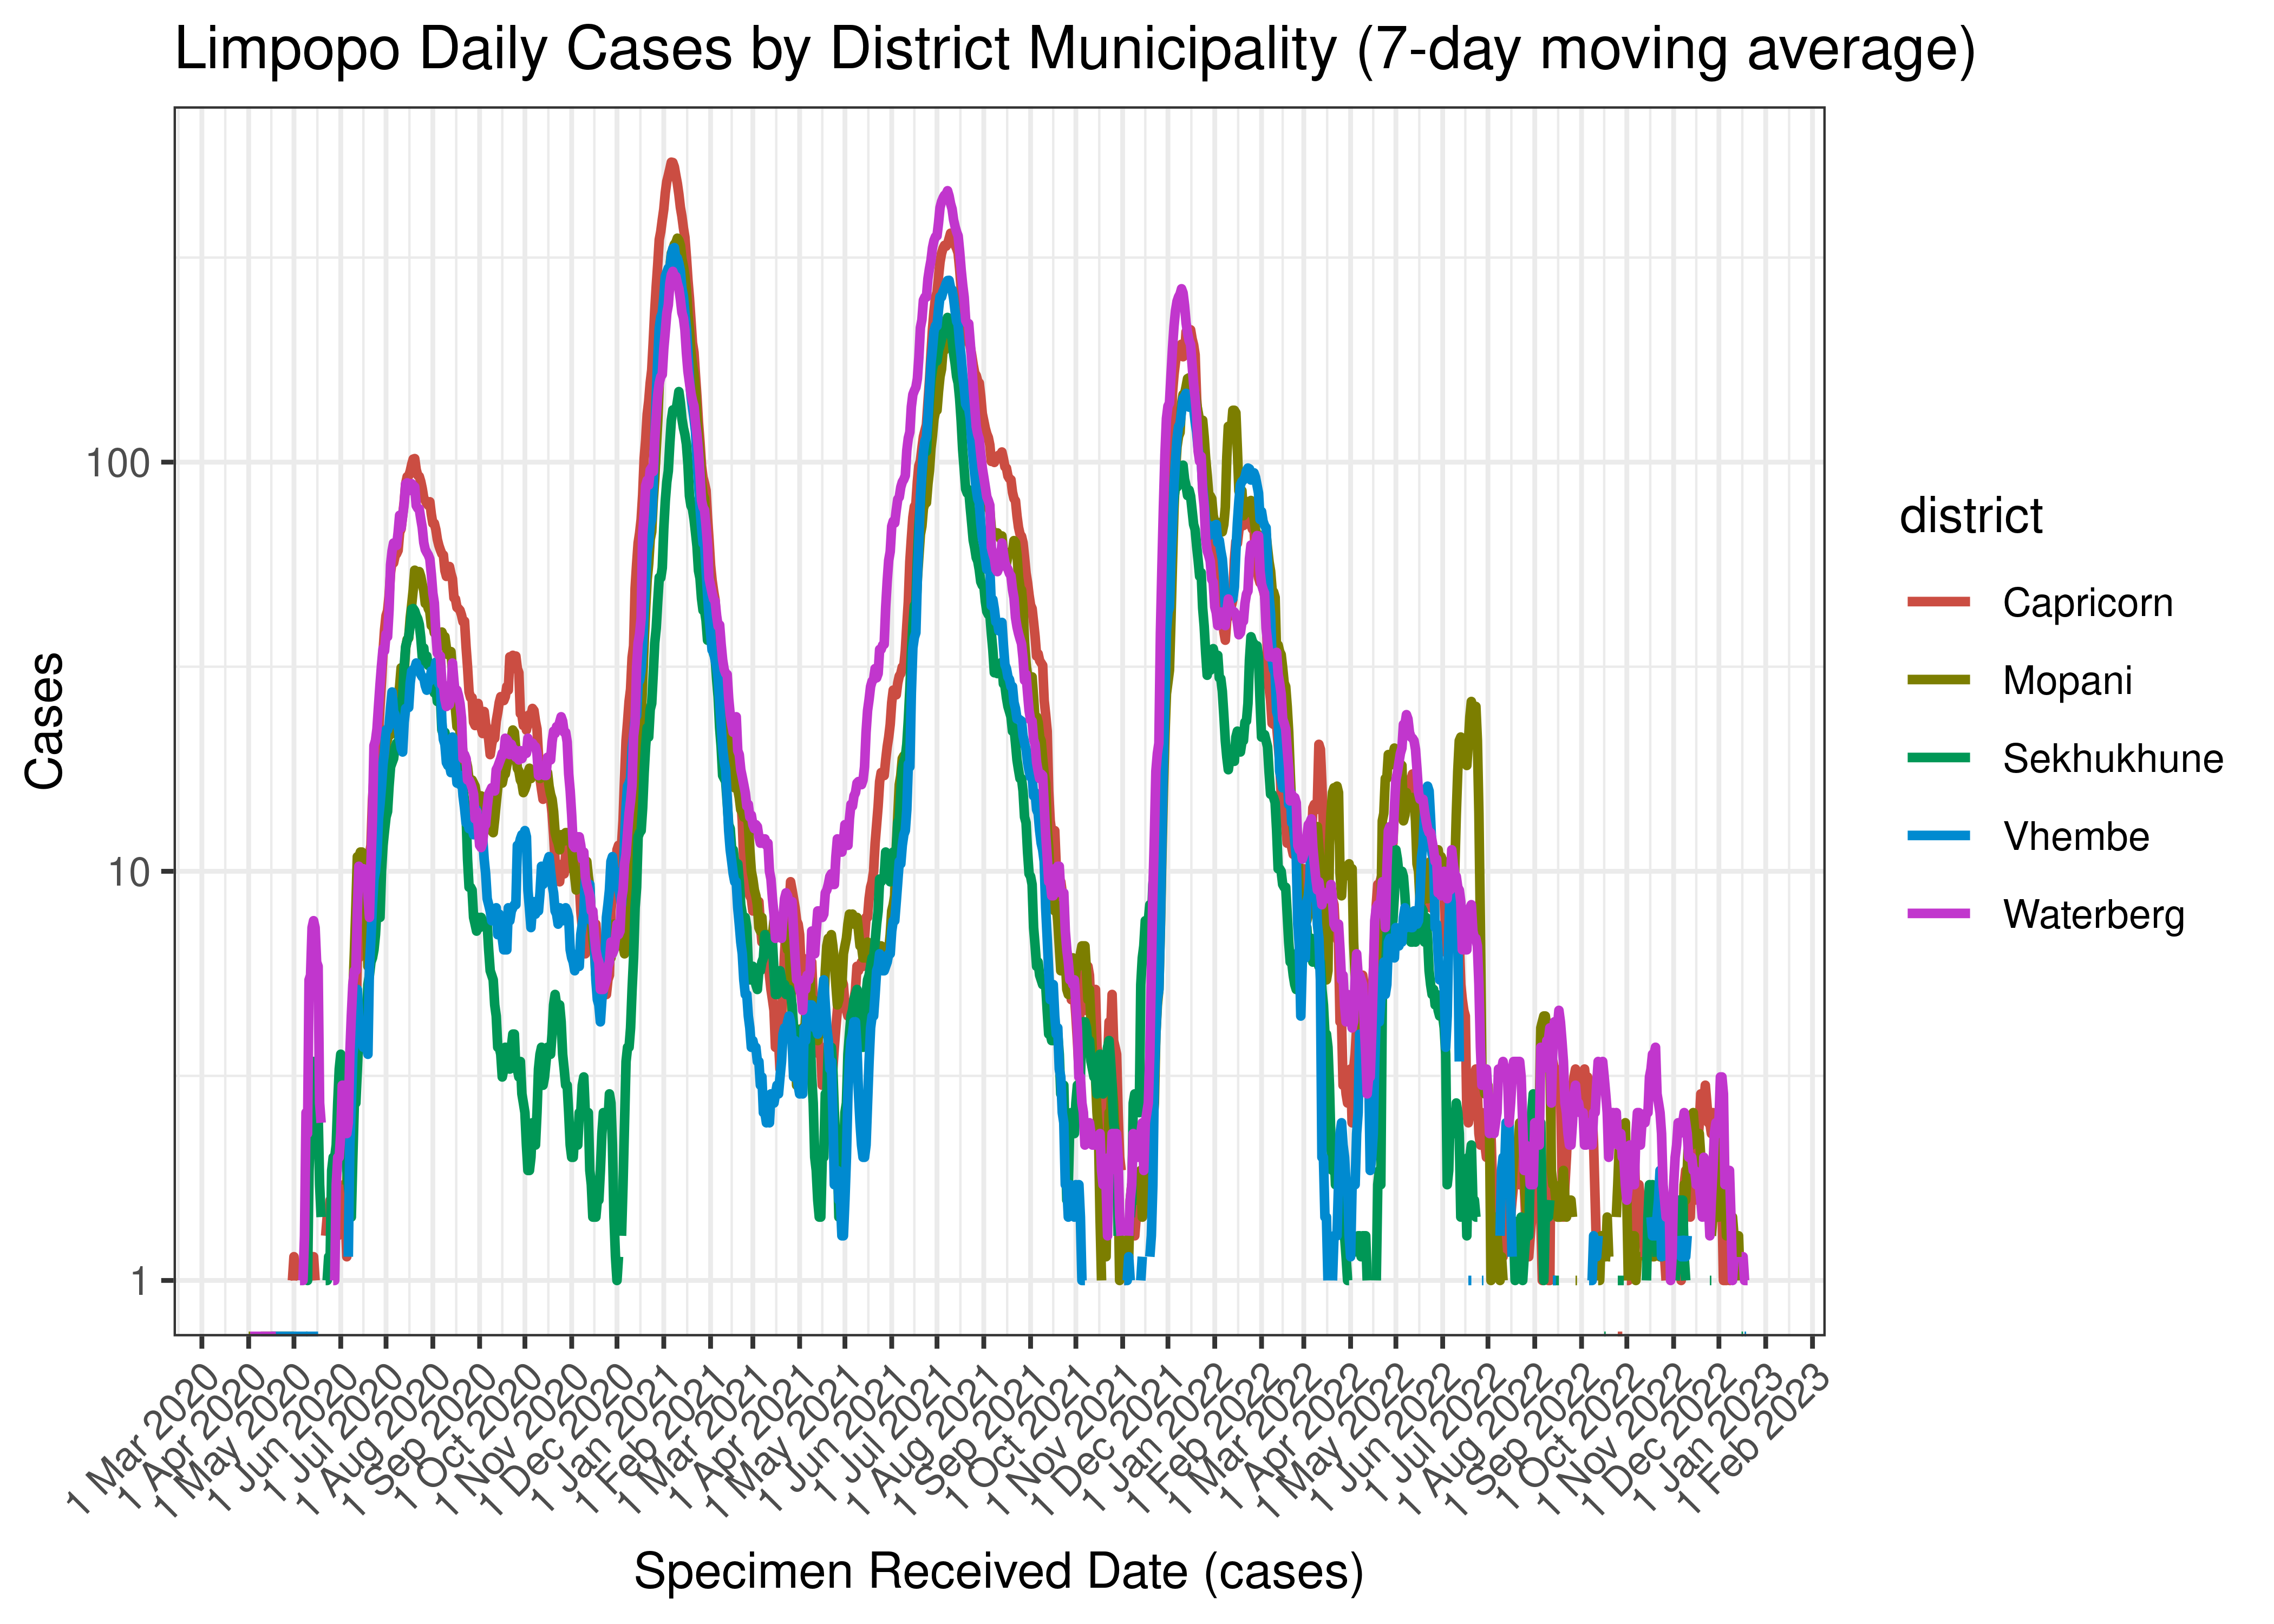
Limpopo Daily Cases by District Municipality (7-day moving average)
Below the above chart is repeated for the last 30-days:

Limpopo Daily Cases for Last 30-days by District Municipality (7-day moving average)
6.6.2 Hospital Admissions
Hospital admissions are tabulated by reported date below. The peak daily admissions in previous waves (as measured by the moving average) is also shown.
| Reported Date | Hospital Admissions | 7-day Moving Average | Comment |
|---|---|---|---|
| 2020-09-18 | 49 | 41 | Wave 1 Peak |
| 2021-01-24 | 10 | 158 | Wave 2 Peak |
| 2021-07-12 | 174 | 158 | Wave 3 Peak |
| 2021-12-20 | 85 | 69 | Wave 4 Peak |
| 2022-05-15 | 0 | 9 | Wave 5 Peak (to date) |
| 2022-12-16 | 0 | 0 | |
| 2022-12-17 | 0 | 0 | |
| 2022-12-18 | 1 | 0 | |
| 2022-12-19 | 0 | 0 | |
| 2022-12-20 | 1 | 1 | |
| 2022-12-21 | 0 | NA | |
| 2022-12-22 | 1 | NA | |
| 2022-12-23 | 1 | NA |
Below a 7-day moving average daily hospital admissions count is plotted for Limpopo on a log scale since start of the epidemic:
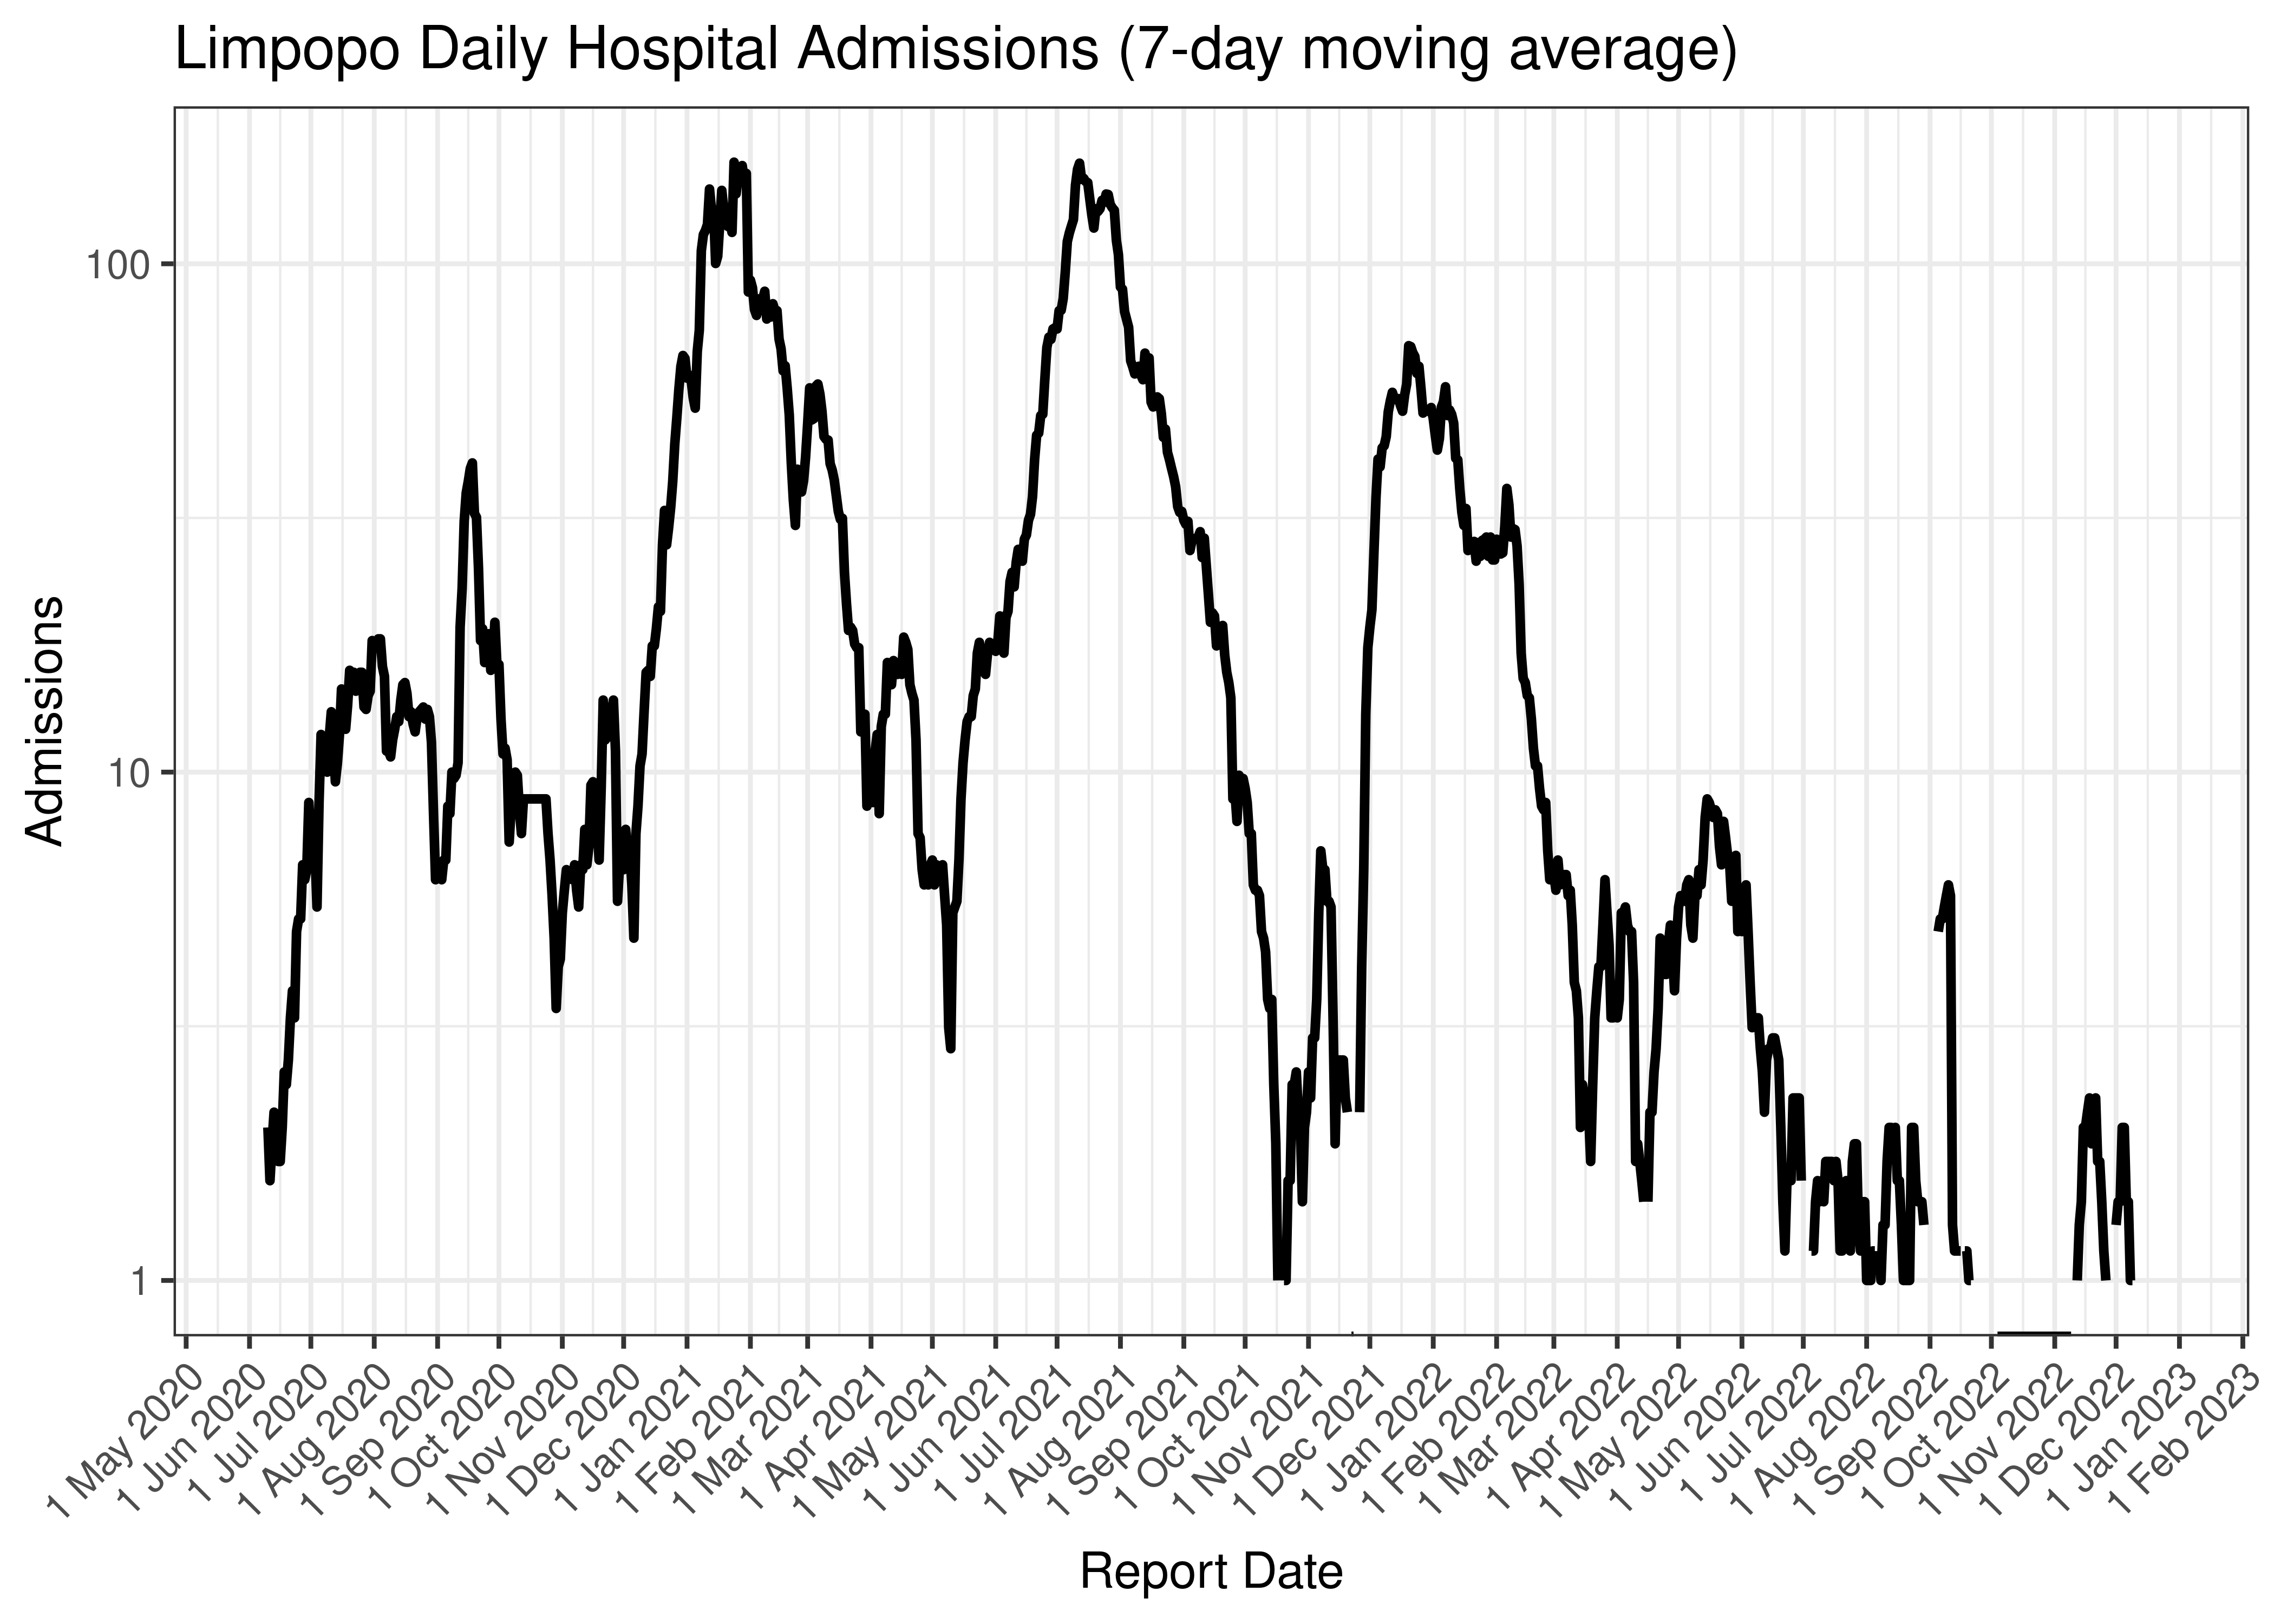
Limpopo Daily Hospital Admissions (7-day moving average)
Below the above chart is repeated for the last 30-days:
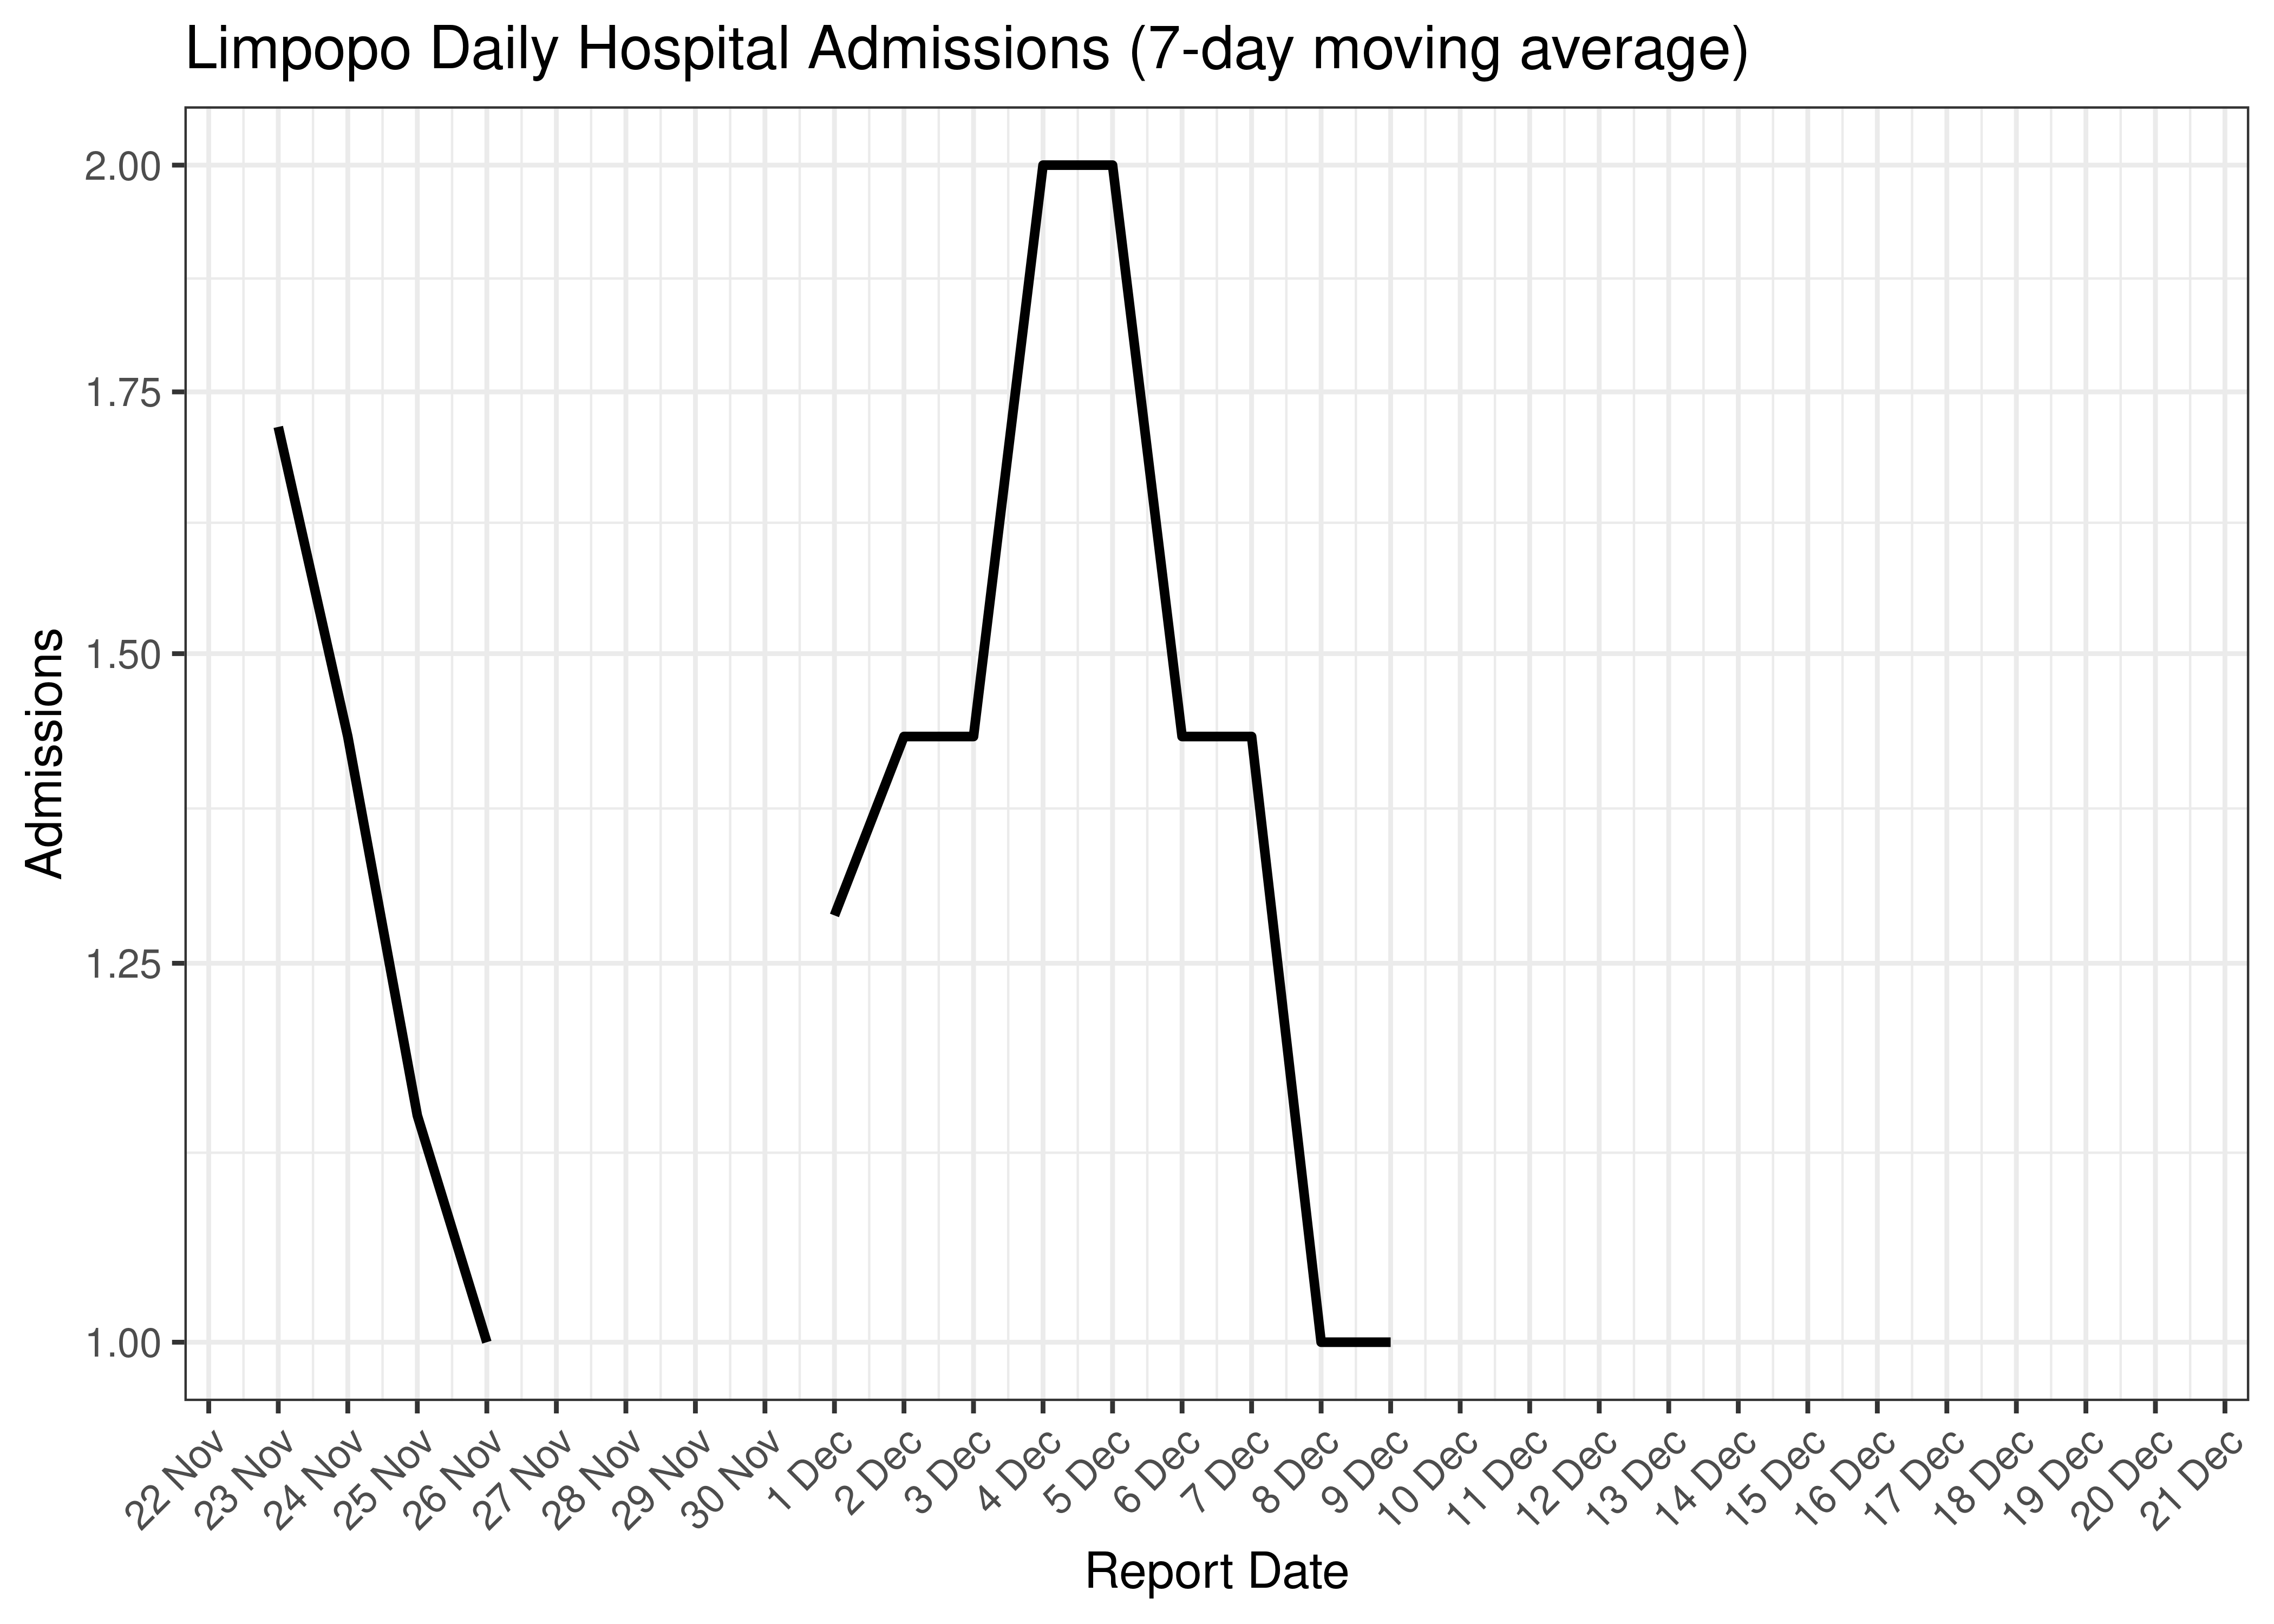
Limpopo Daily Hospital Admissions for Last 30-days (7-day moving average)
6.6.3 Hospital Deaths
Hospital deaths are tabulated by reported date below. The peak daily deaths in previous waves (as measured by the moving average) is also shown.
Note that hospital deaths underestimates total COVID-19 deaths in South Africa.
| Reported Date | Hospital Deaths | 7-day Moving Average | Comment |
|---|---|---|---|
| 2020-09-18 | 11 | 8 | Wave 1 Peak |
| 2021-01-24 | 10 | 44 | Wave 2 Peak |
| 2021-07-25 | 18 | 47 | Wave 3 Peak |
| 2022-01-06 | 12 | 12 | Wave 4 Peak |
| 2022-05-21 | 0 | 1 | Wave 5 Peak (to date) |
| 2022-05-23 | 2 | 1 | Wave 5 Peak (to date) |
| 2022-05-24 | 2 | 1 | Wave 5 Peak (to date) |
| 2022-05-25 | 0 | 1 | Wave 5 Peak (to date) |
| 2022-05-26 | 4 | 1 | Wave 5 Peak (to date) |
Below a 7-day moving average daily hospital deaths count is plotted for Limpopo on a log scale since start of the epidemic:
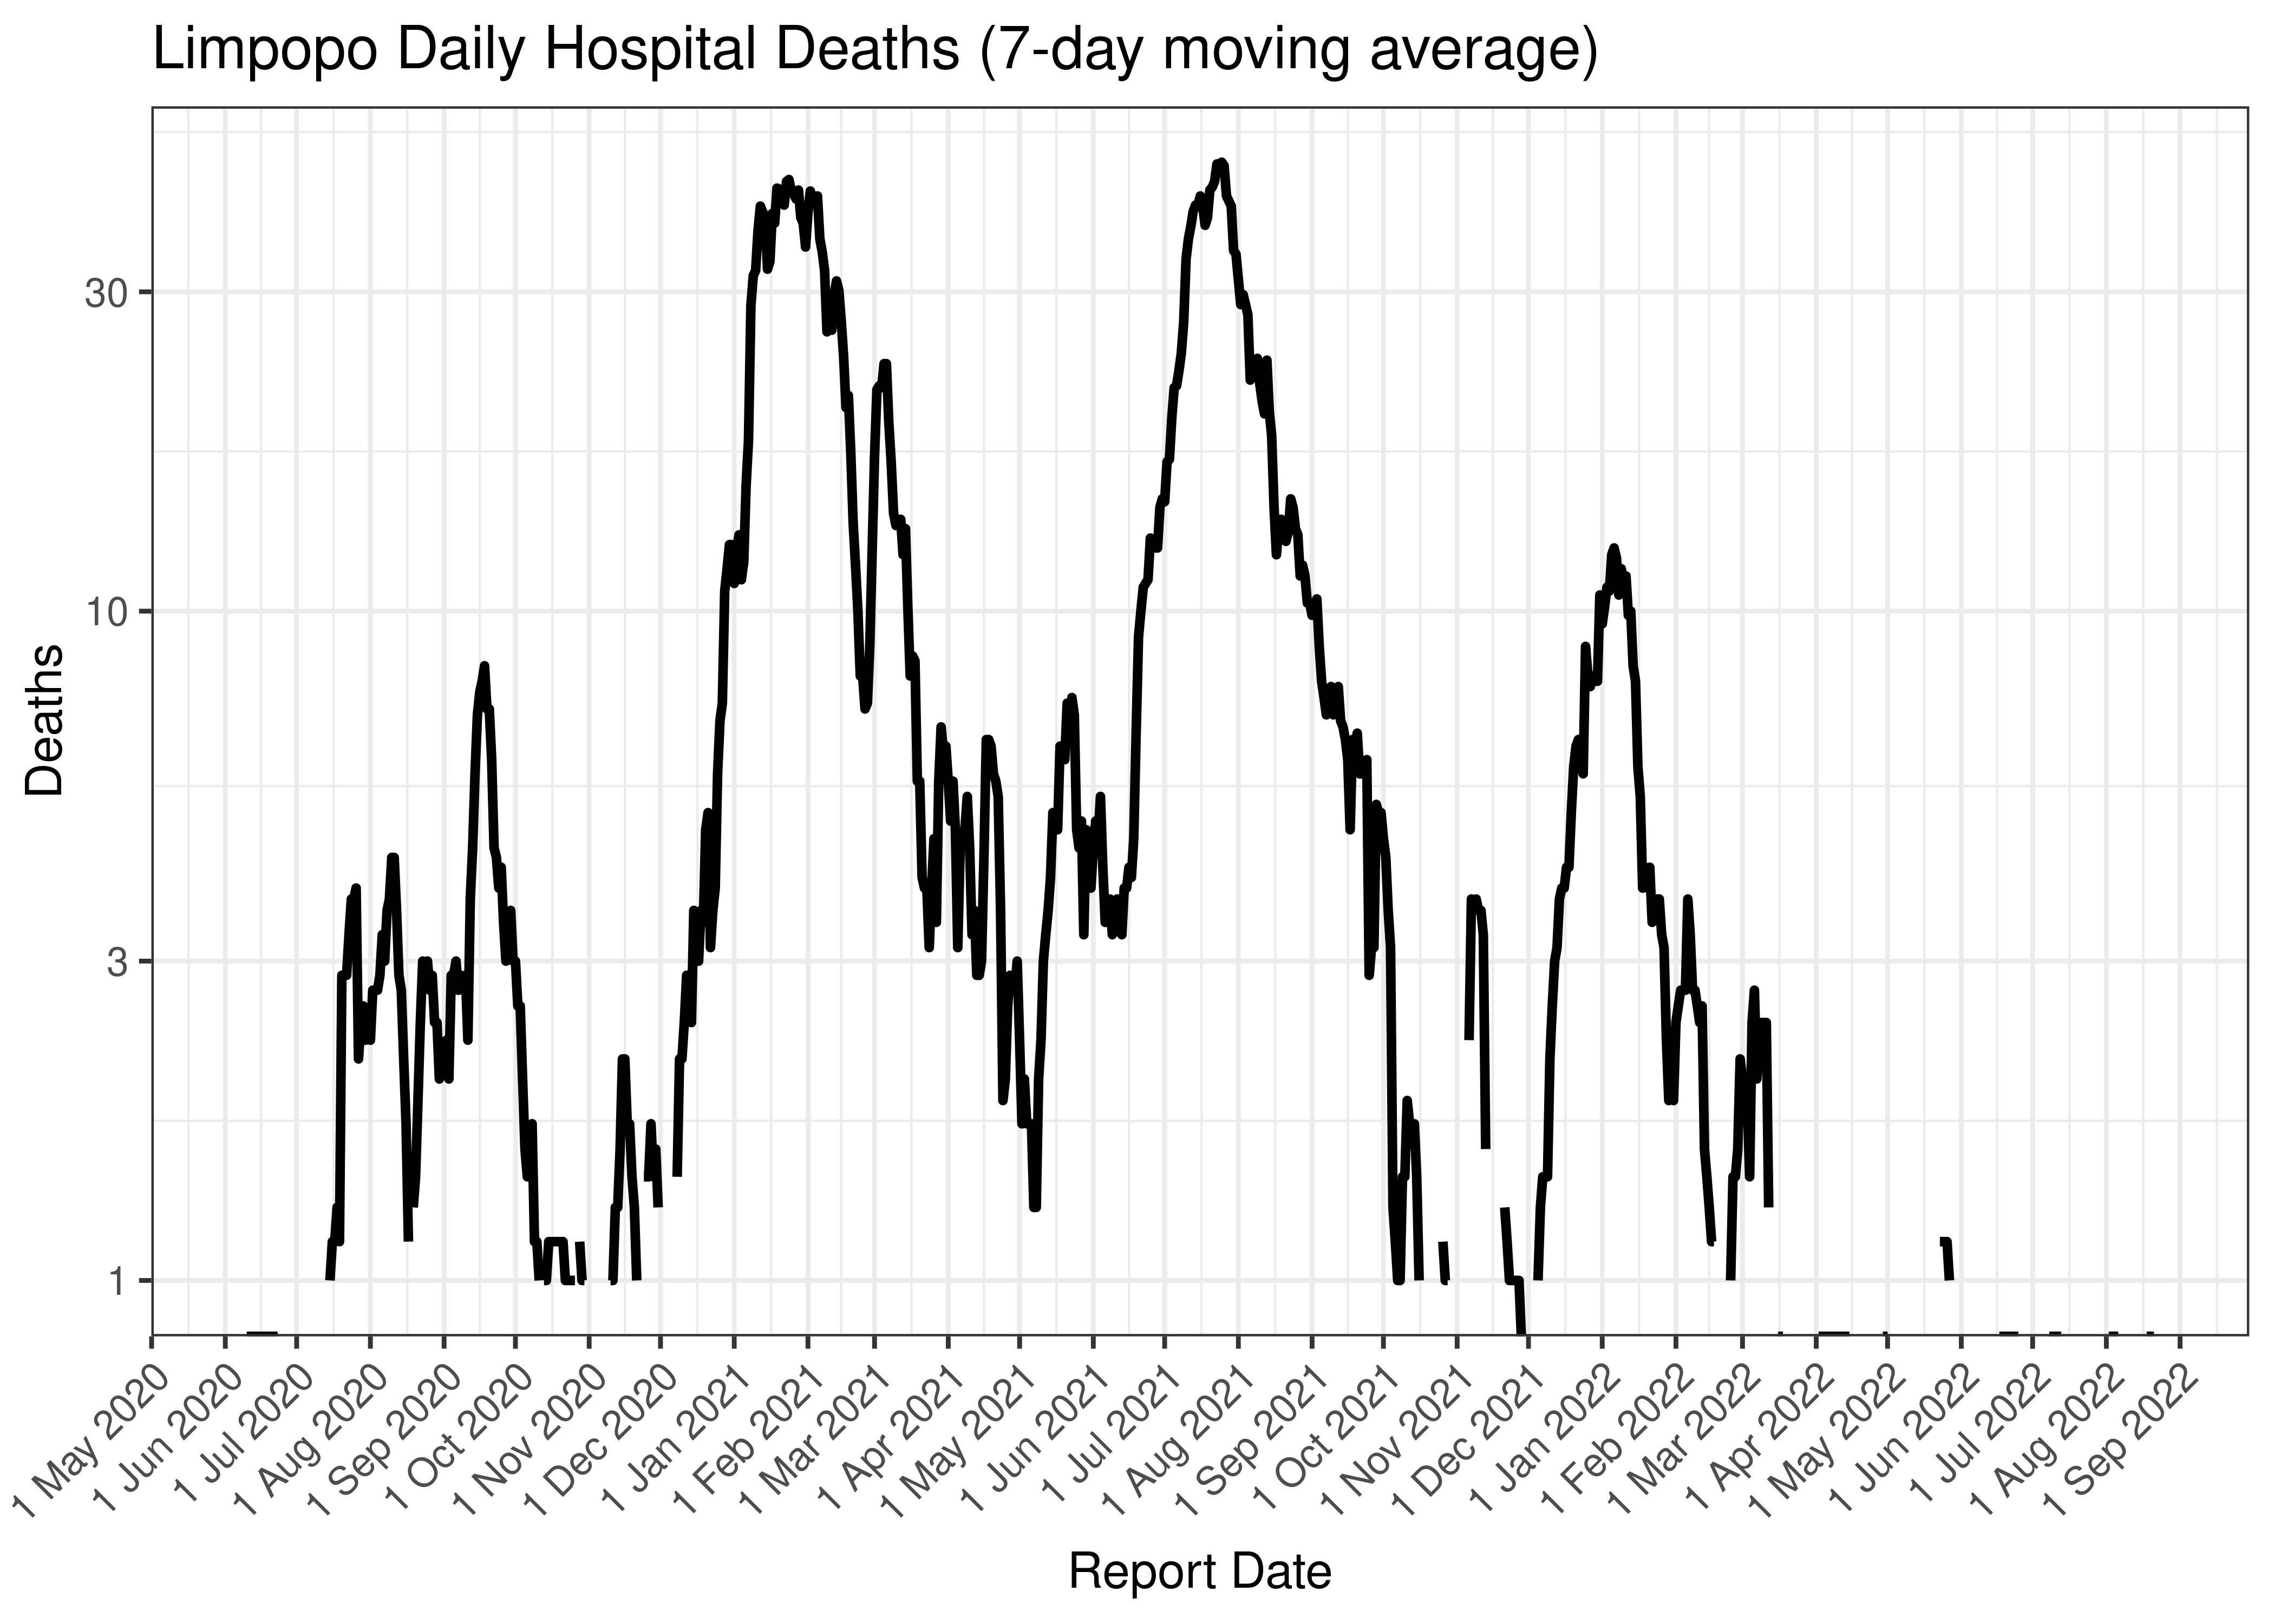
Limpopo Daily Hospital Deaths (7-day moving average)
Below the above chart is repeated for the last 30-days:
Limpopo Daily Hospital Deaths for Last 30-days (7-day moving average)
6.6.4 Excess Deaths
Excess deaths are tabulated by date of death below. The peak daily deaths in previous waves (as measured by the moving average) is also shown.
| Date of Death | Excess Deaths | 7-day Moving Average | Comment |
|---|---|---|---|
| 2020-07-29 | 42 | 42 | Wave 1 Peak |
| 2021-01-13 | 377 | 377 | Wave 2 Peak |
| 2021-07-21 | 238 | 238 | Wave 3 Peak |
| 2021-12-22 | 64 | 64 | Wave 4 Peak |
| 2022-05-25 | 48 | 48 | Wave 5 Peak (to date) |
| 2022-12-03 | 8 | 8 | |
| 2022-12-04 | 9 | 8 | |
| 2022-12-05 | 9 | 9 | |
| 2022-12-06 | 9 | 9 | |
| 2022-12-07 | 9 | 9 | |
| 2022-12-08 | 9 | NA | |
| 2022-12-09 | 9 | NA | |
| 2022-12-10 | 9 | NA |
Below a 7-day moving average daily excess deaths count is plotted for Limpopo on a log scale since start of the epidemic:
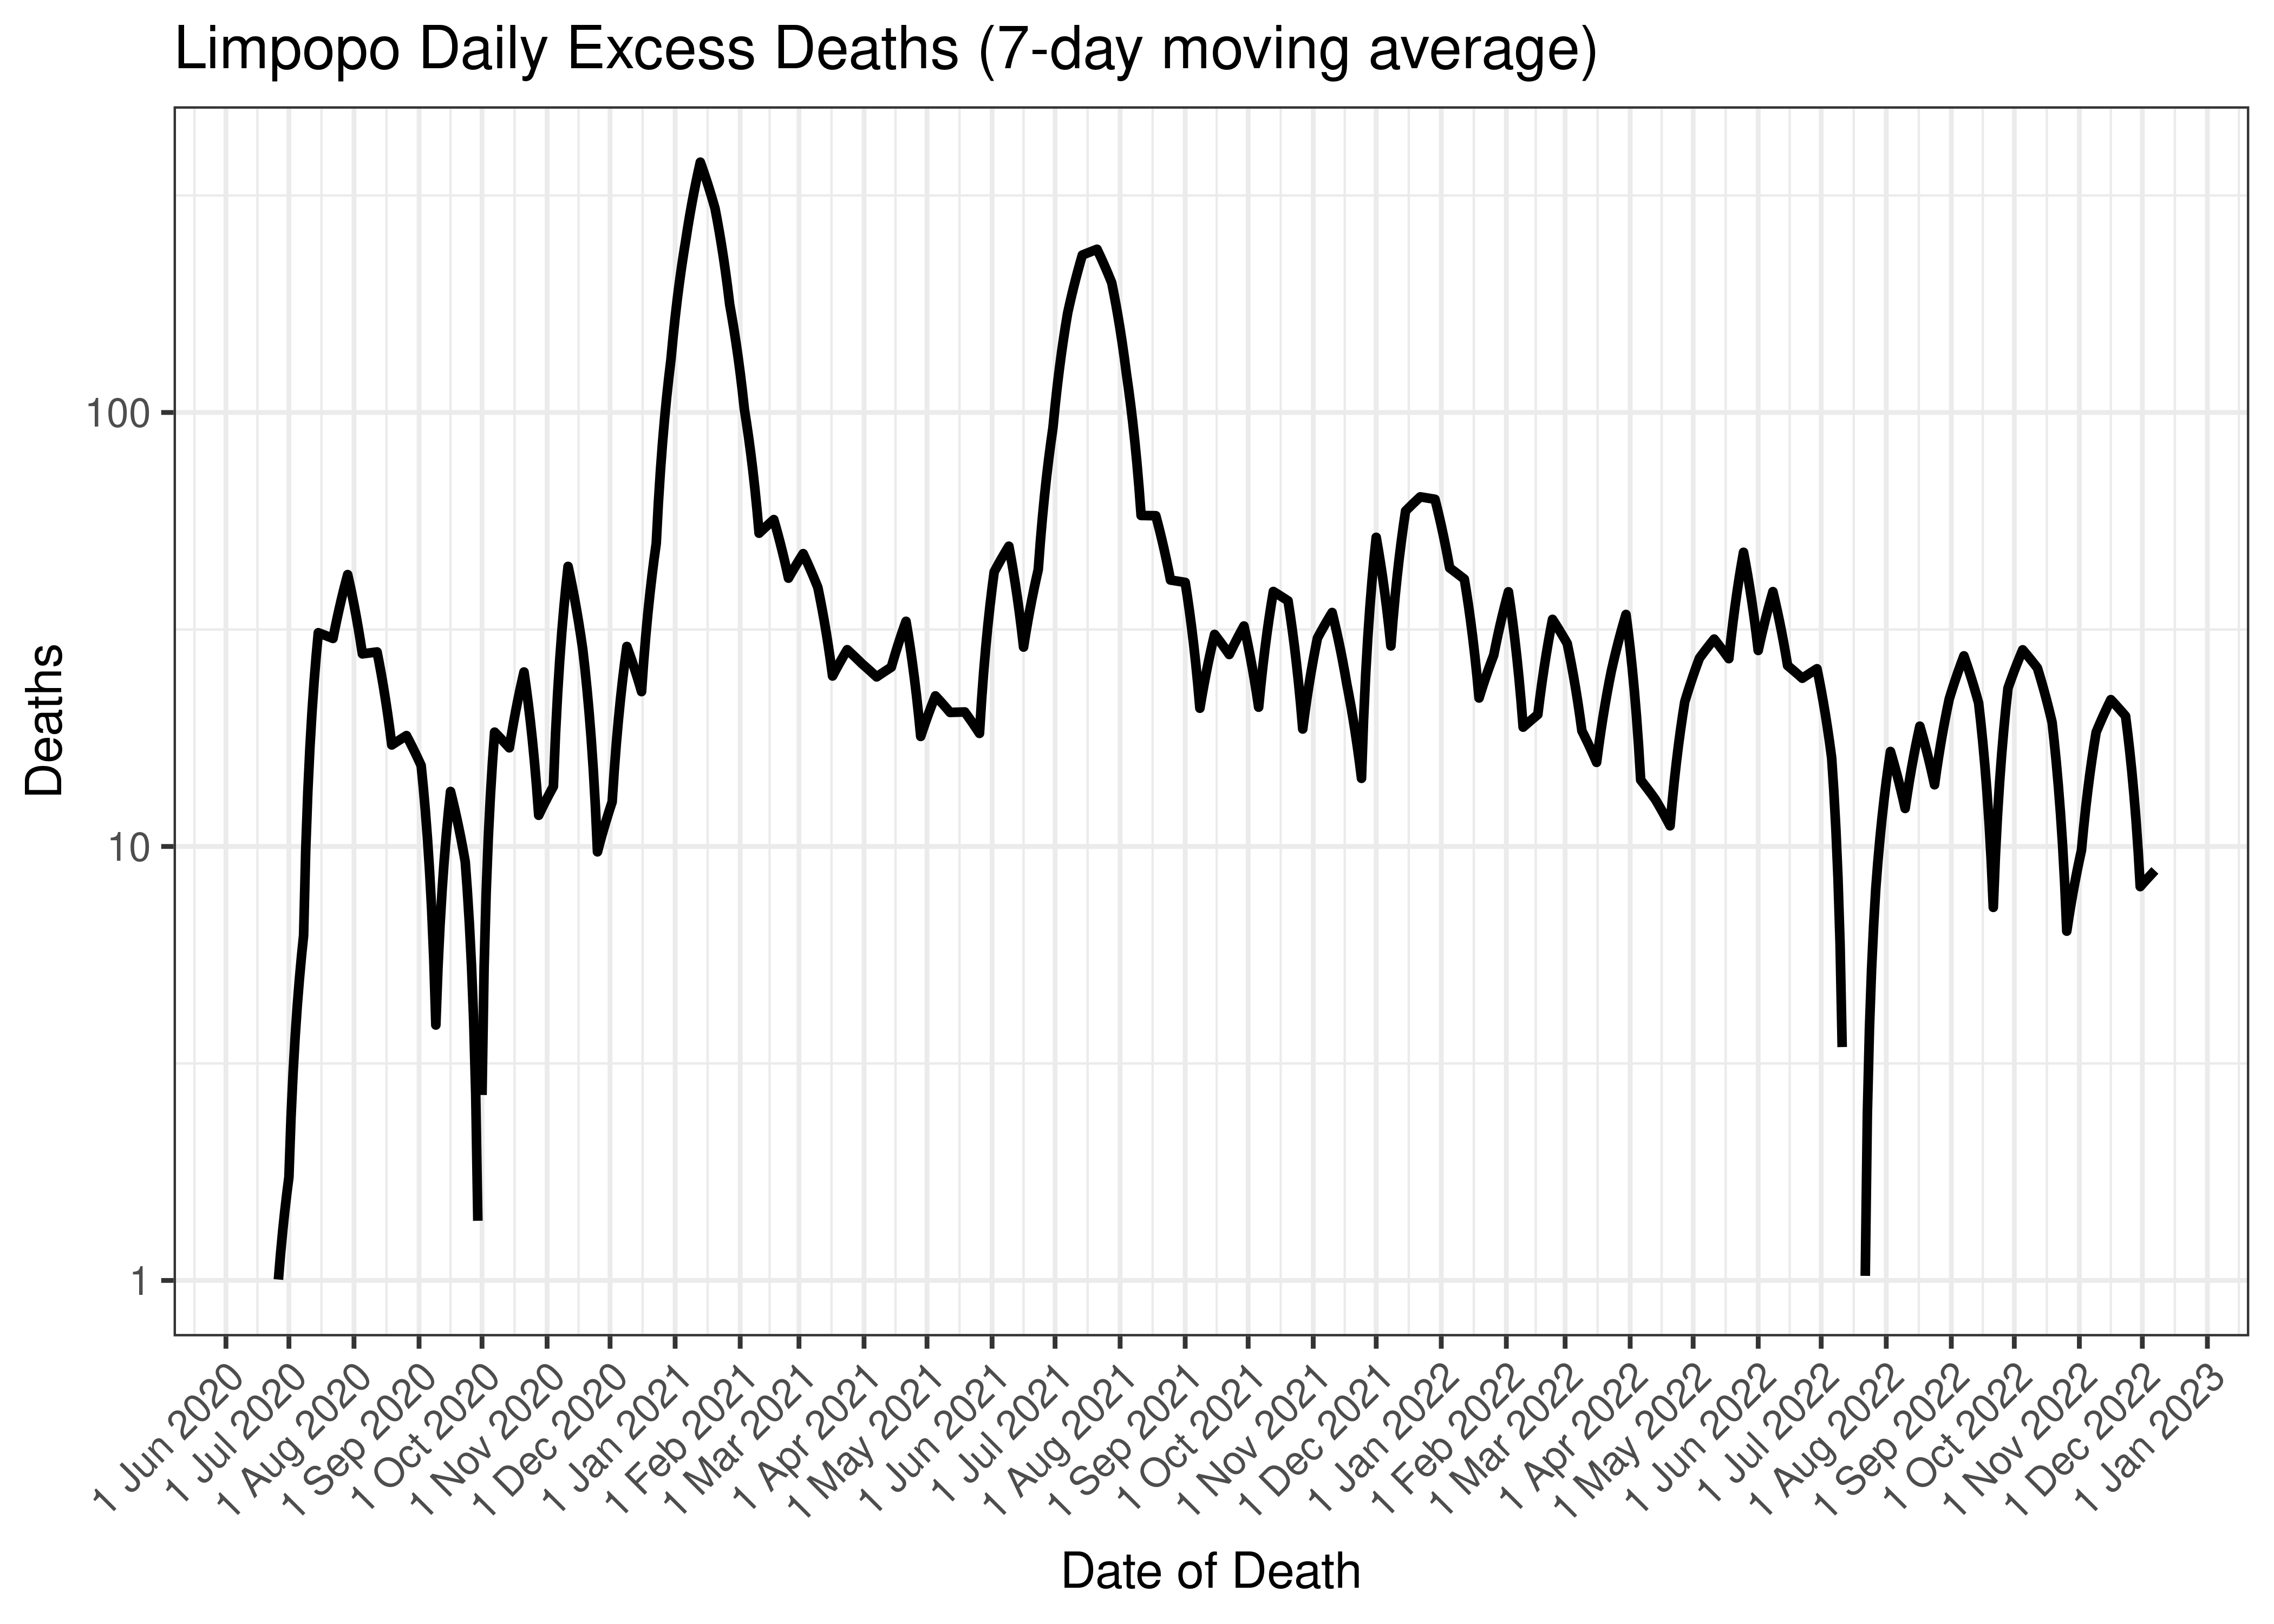
Limpopo Daily Excess Deaths (7-day moving average)
Below the above chart is repeated for the last 30-days:
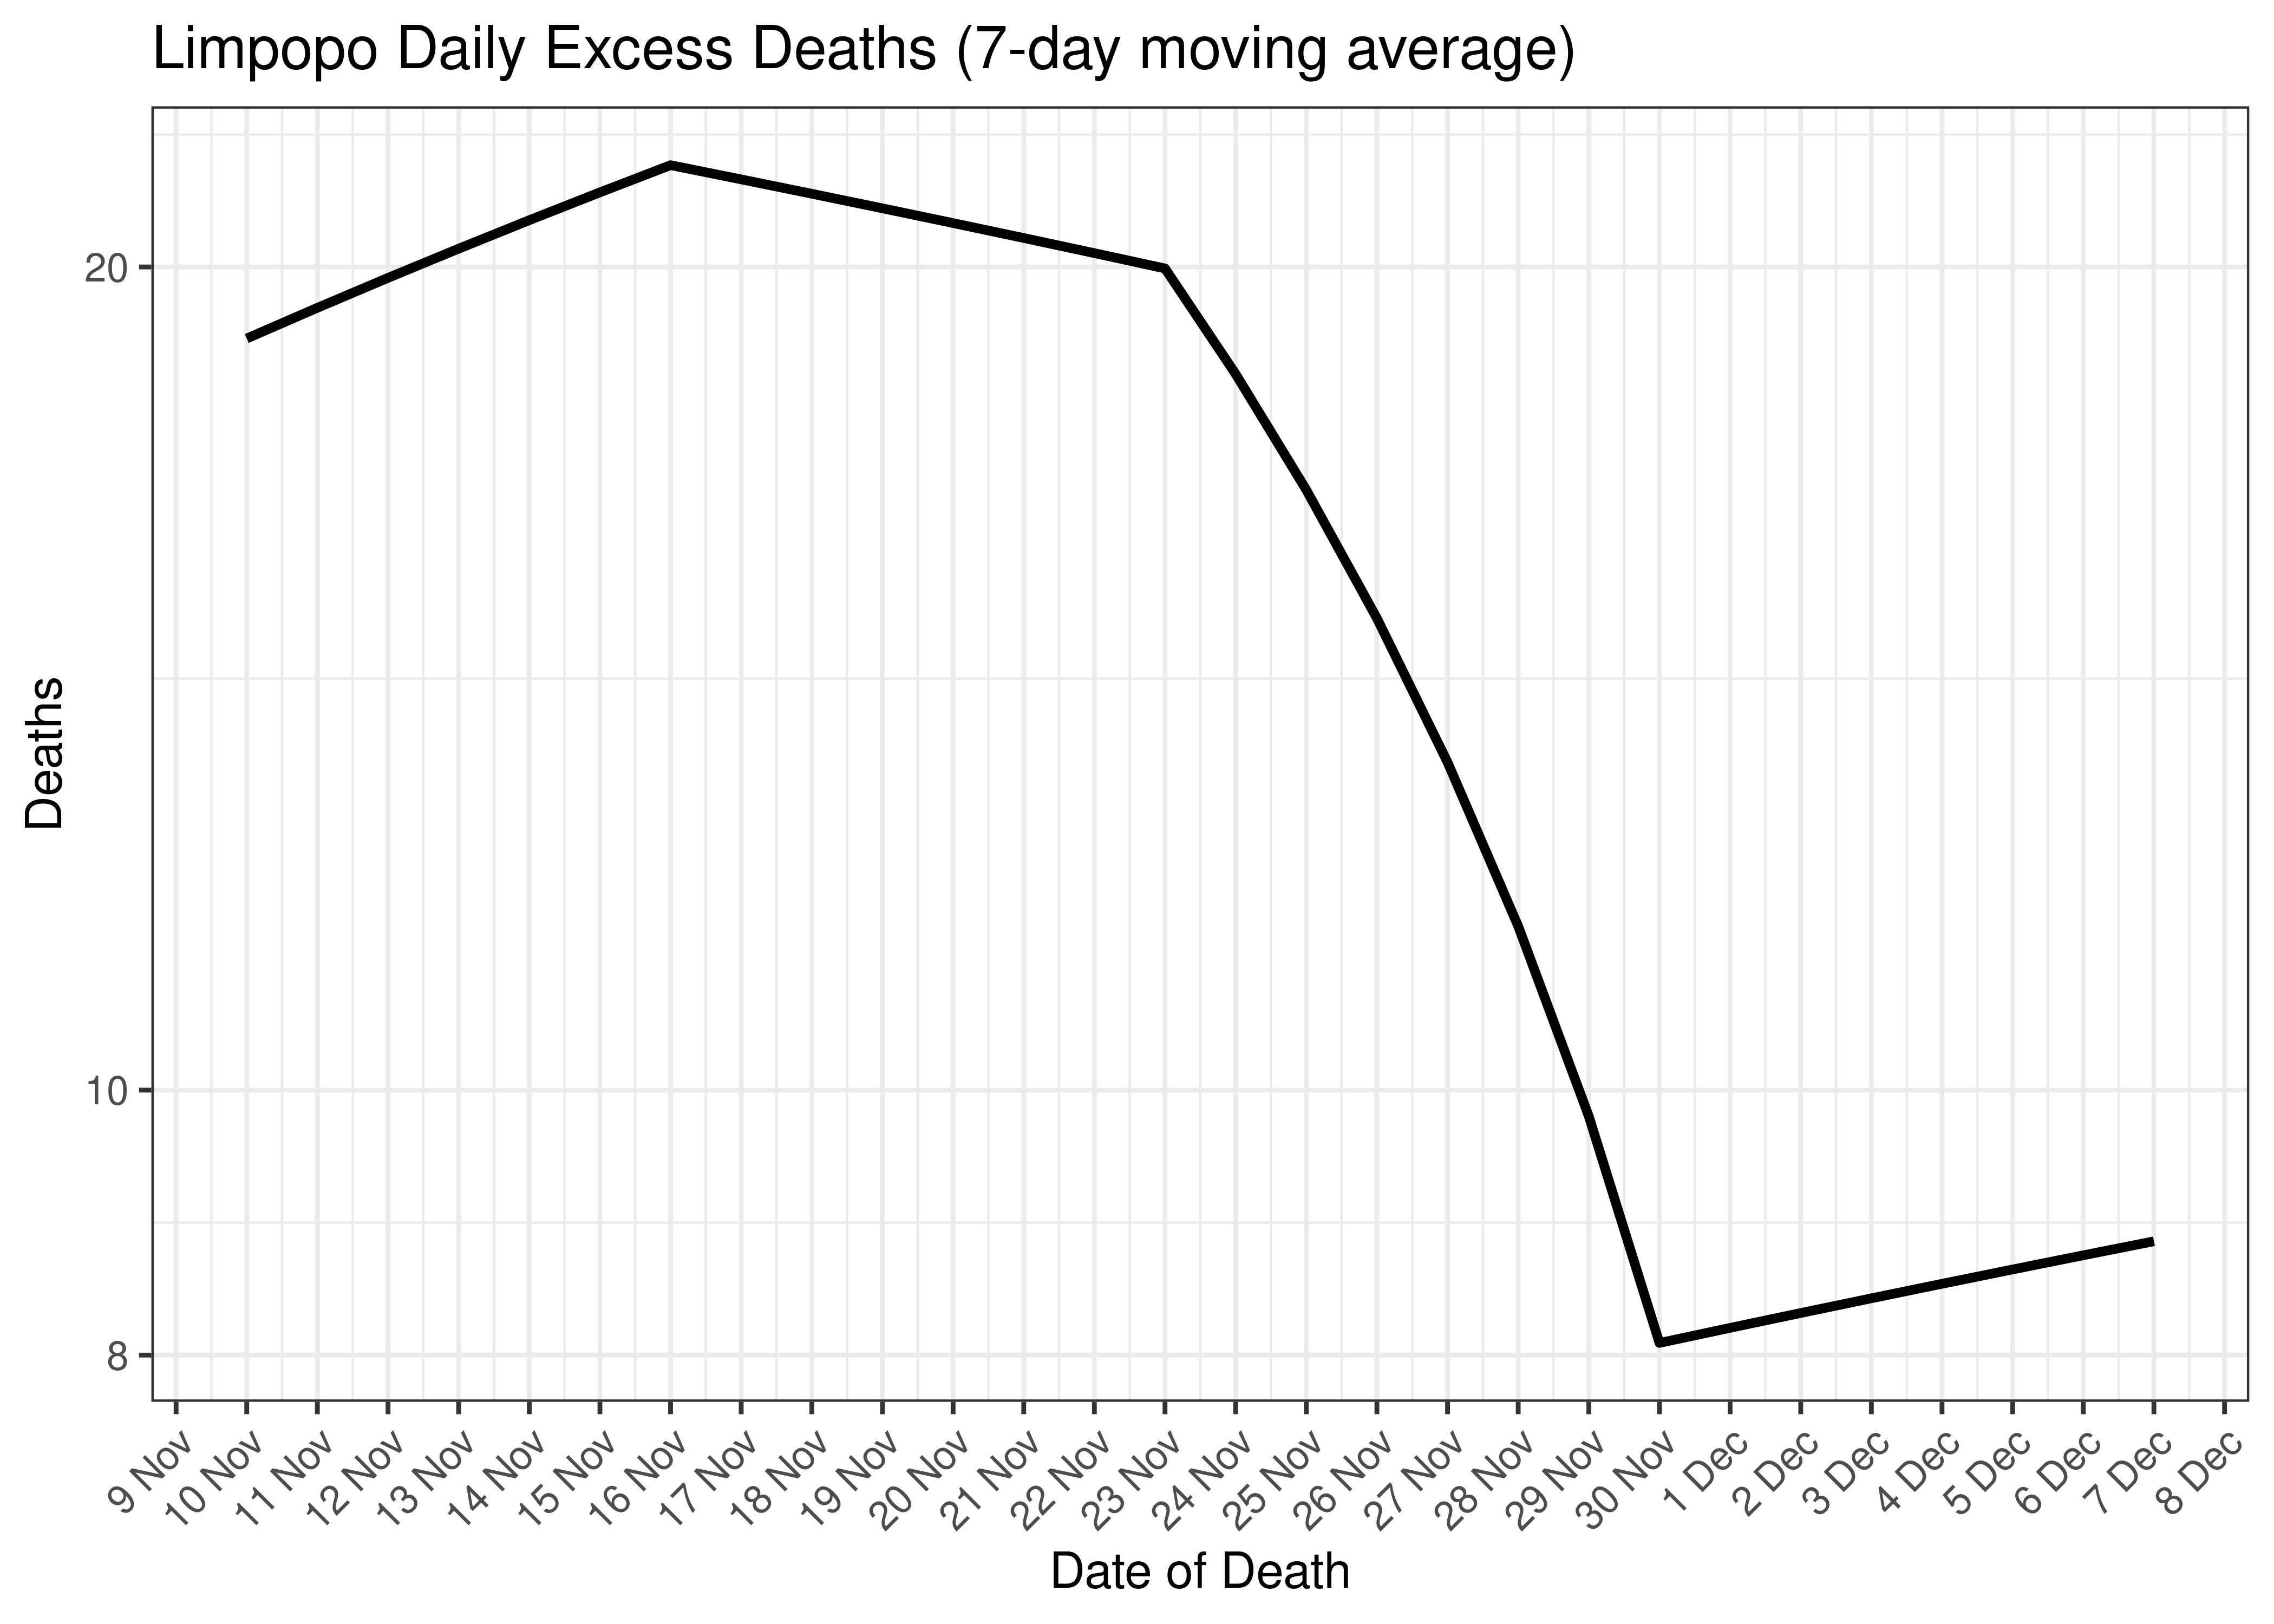
Limpopo Daily Excess Deaths for Last 30-days (7-day moving average)
6.6.5 Cases, Admissions and Deaths Combined
Below a 7-day moving average daily case, admission and excess death counts are plotted for Limpopo on a log scale since start of the epidemic. Note admissions and excess deaths are plotted by reported date, whereas cases are plotted by specimen received date.
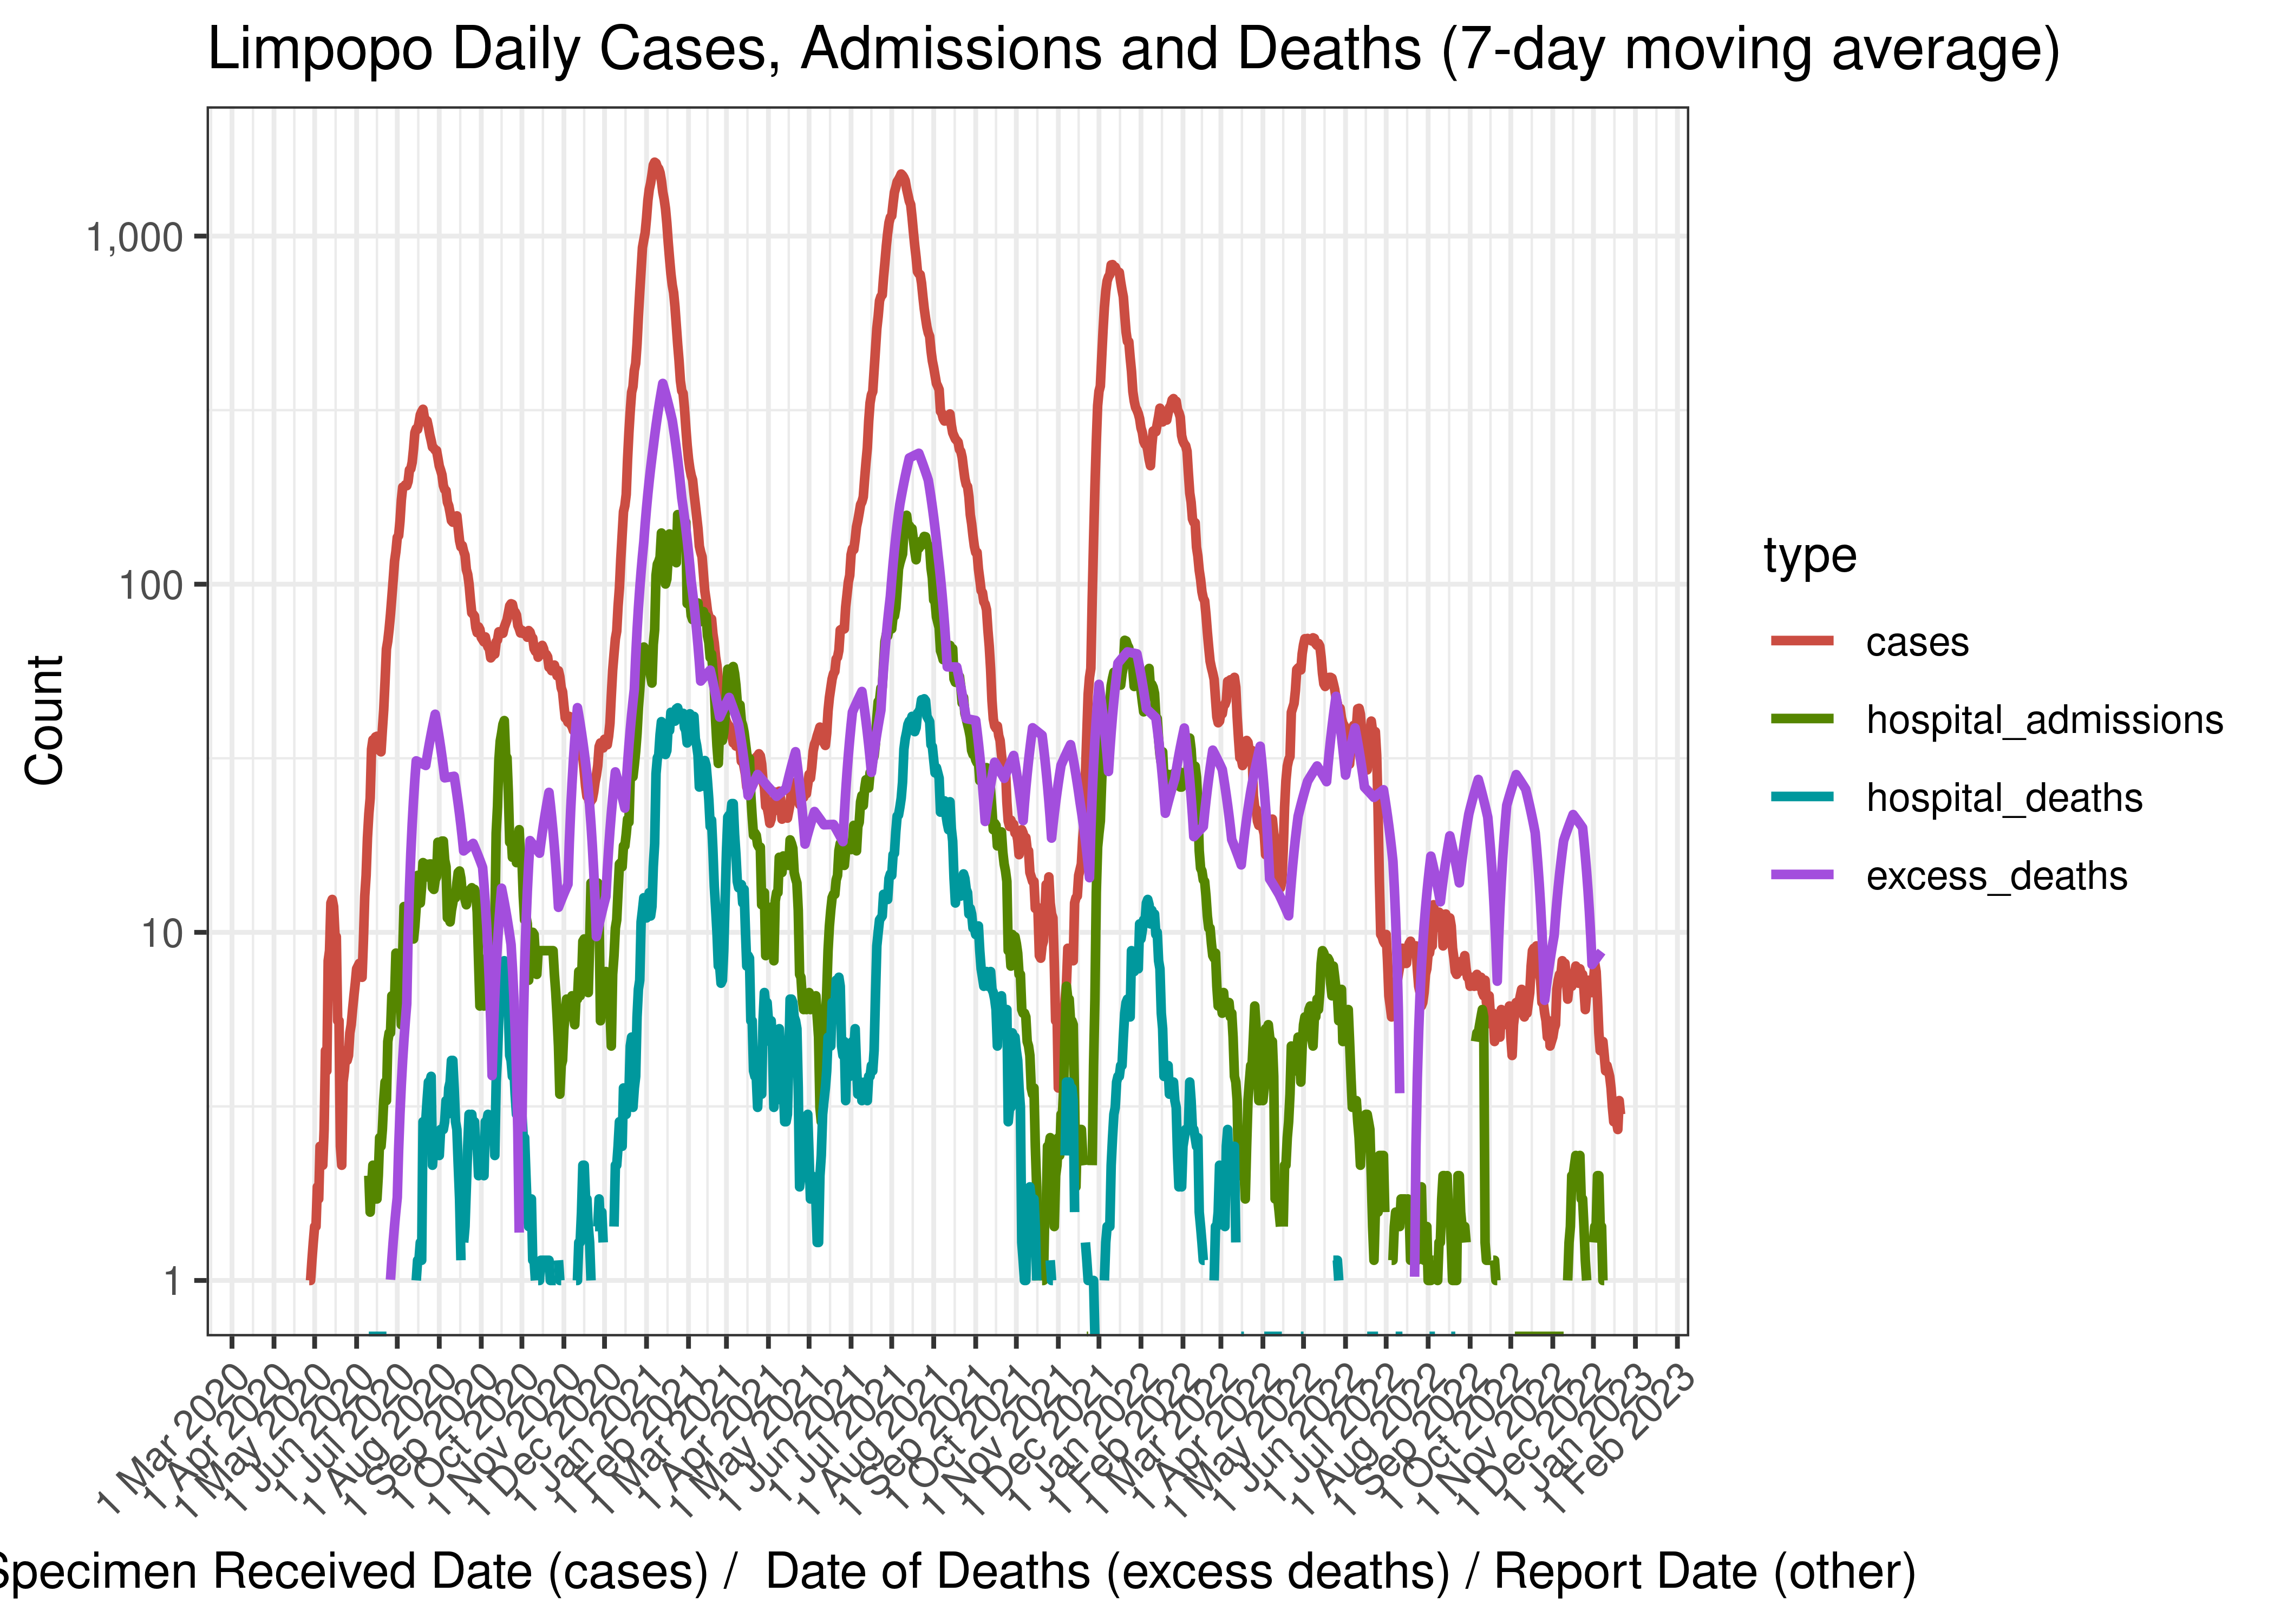
Limpopo Daily Cases, Admissions and Deaths (7-day moving average)
Below the above chart is repeated for the last 30-days:

Limpopo Daily Cases, Admissions and Deaths for Last 30-days (7-day moving average)
6.6.6 Crude Ratios per Wave
Below crude rations are calculated between the waves. It’s based on the following starting dates:
- Wave 1 started on 2020-01-01.
- Wave 2 started on 2020-10-01.
- Wave 3 started on 2021-04-01.
- Wave 4 started on 2021-11-01.
- Wave 5 started on 2022-04-01.
Below crude ratios are tabulated and plotted. These ratios are:
- Case admissions ratio calculated as admissions divided by cases.
- Case fatality ratio calculated as hospital deaths divided by cases (Note that COVID-19 deaths are under-reported by a significant factor in South Africa).
- Case excess deaths ratio calculated as excess deaths divided by cases.
- Hospital fatality ratio calculated as hospital deaths divided by admissions (Note that COVID-19 deaths are under-reported by a significant factor in South Africa).
- Death reporting ratio calculated as hospital deaths divided by excess deaths.
| Wave | Case Admission Ratio | Case Fatality Ratio | Case Excess Deaths Ratio | Hospital Fatality Ratio | Death Reporting Ratio | |
|---|---|---|---|---|---|---|
| Limpopo | Wave 1 | 9.4% | 1.69% | 11.20% | 18.0% | 15.1% |
| Limpopo | Wave 2 | 16.2% | 4.78% | 28.68% | 29.4% | 16.7% |
| Limpopo | Wave 3 | 14.0% | 4.03% | 22.23% | 28.7% | 18.1% |
| Limpopo | Wave 4 | 10.6% | 1.43% | 15.39% | 13.5% | 9.3% |
| Limpopo | Wave 5 | 12.0% | 0.85% | 100.28% | 7.0% | 0.8% |
Below the rations above are plotted graphically:
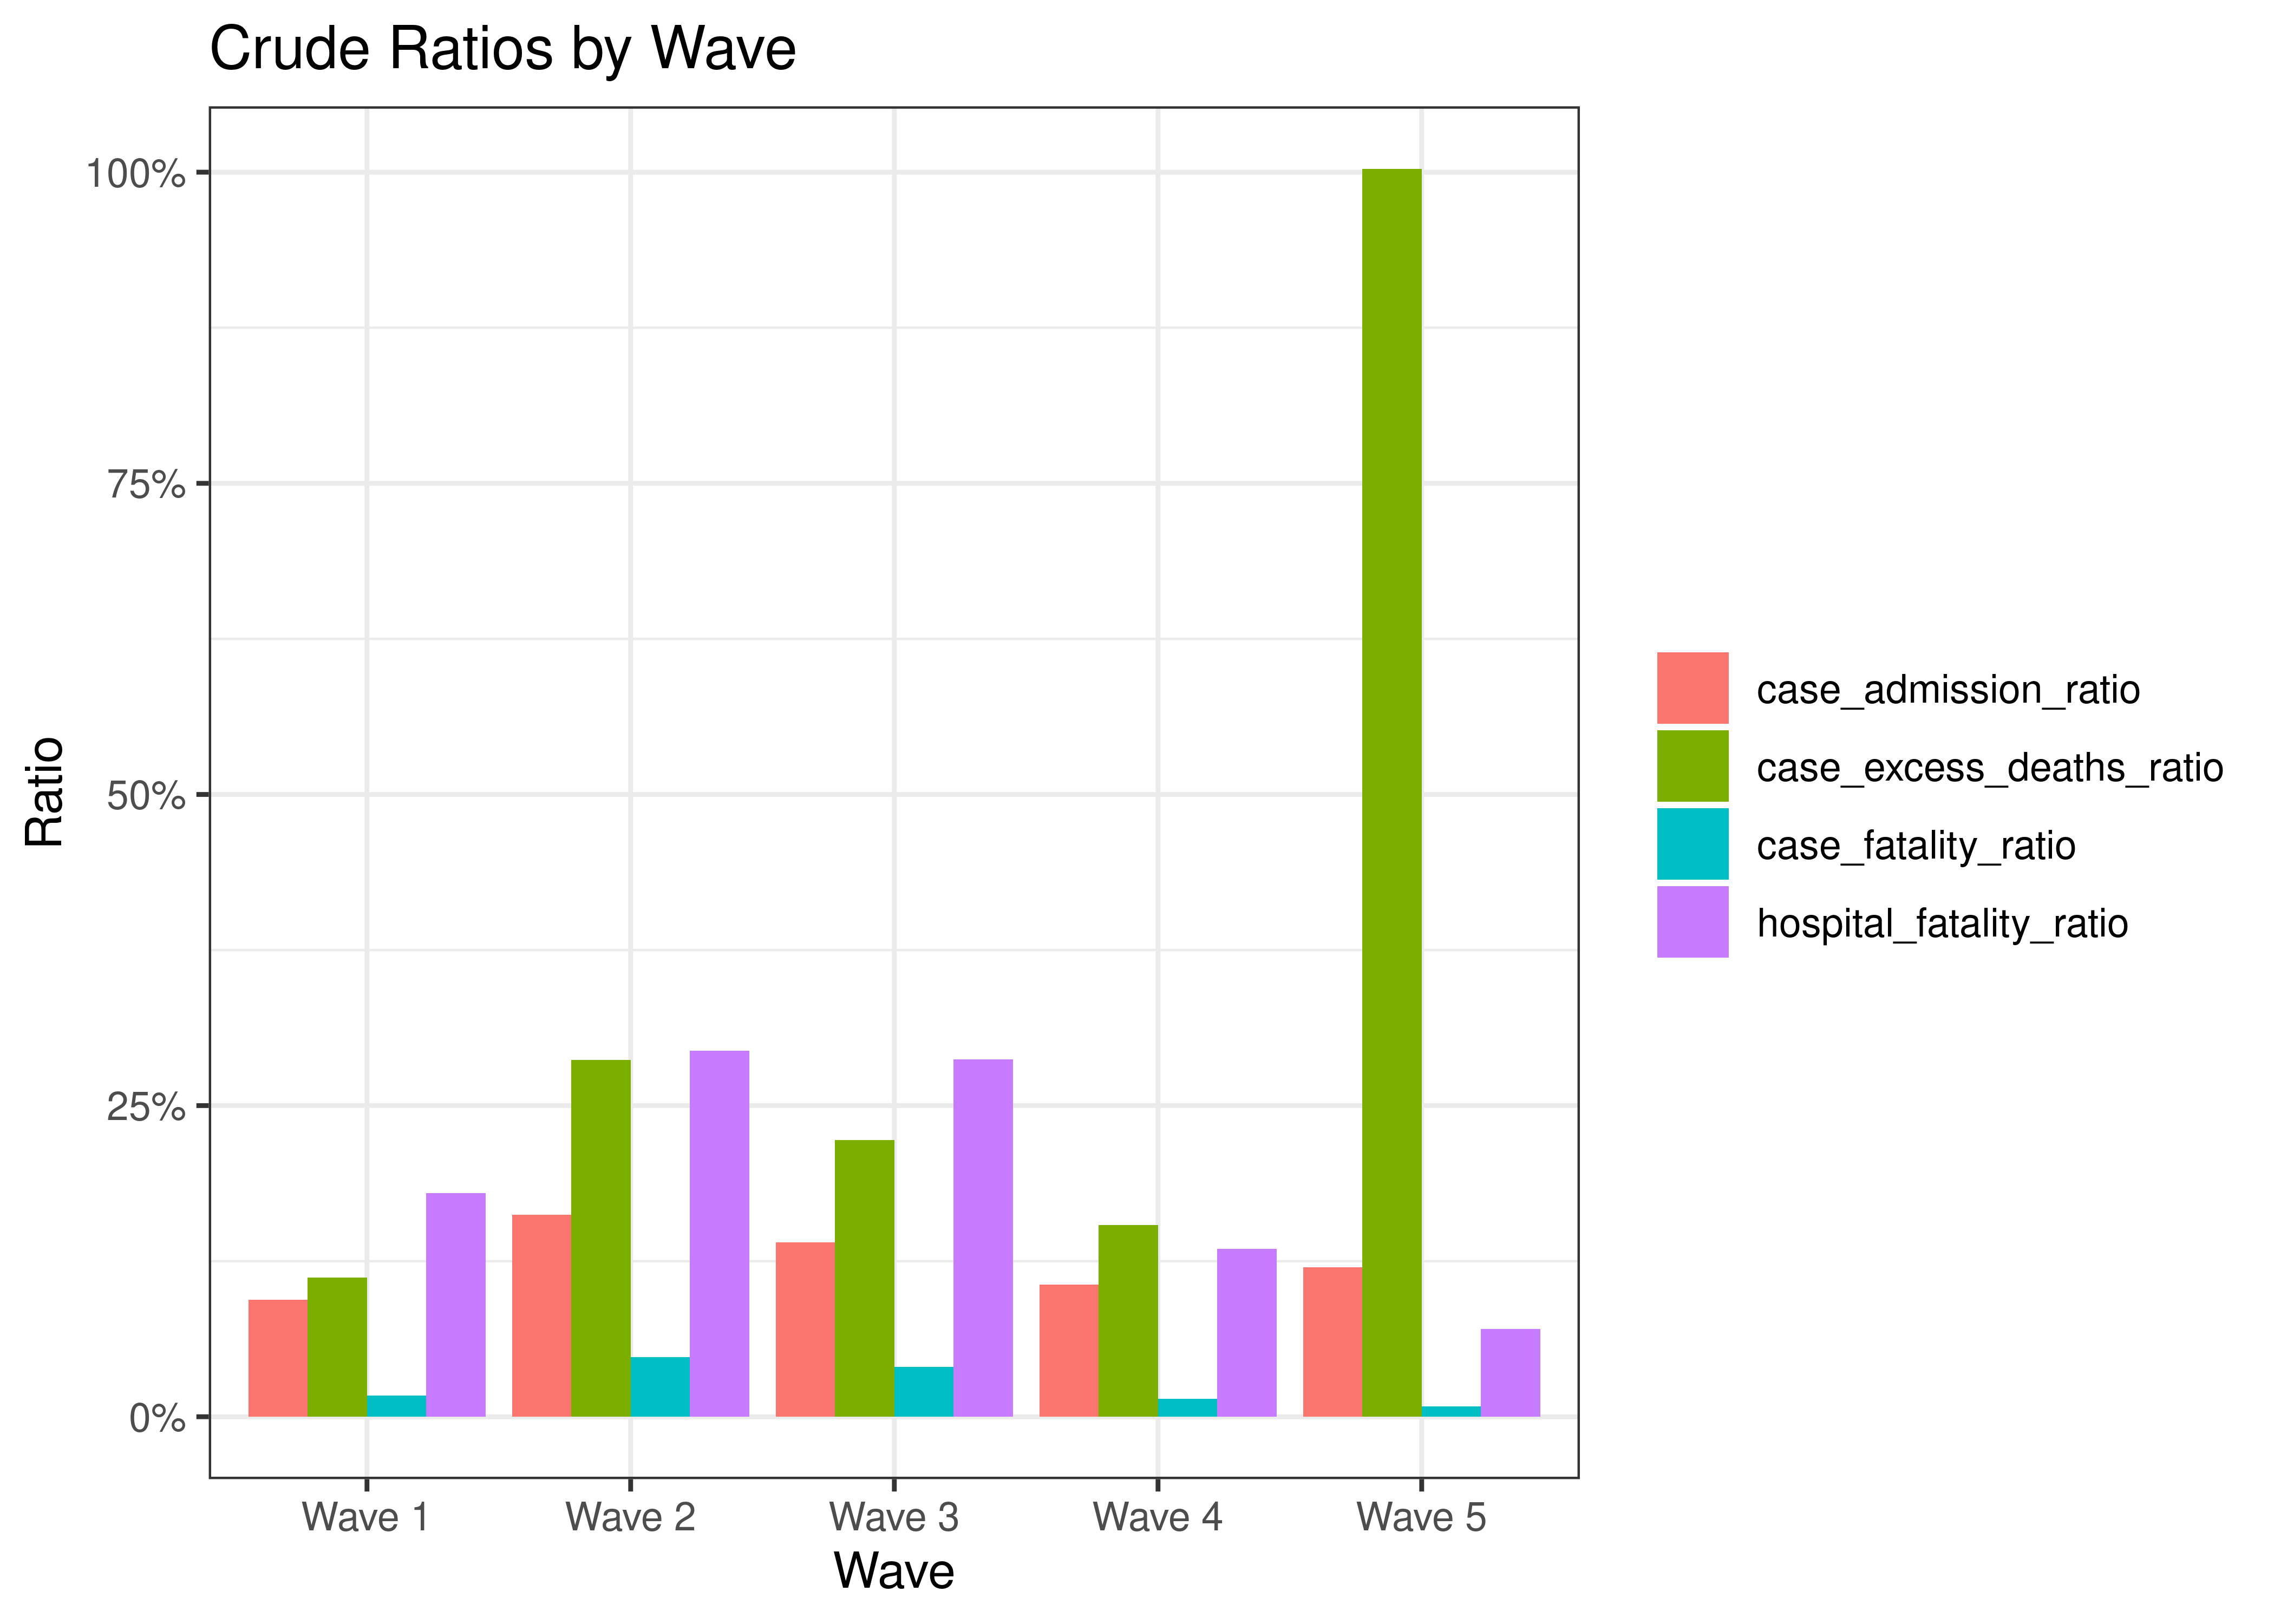
Crude Ratios by Wave
6.6.7 Reproduction Number
Below current (last weekly) effective reproduction number estimates are tabulated for Limpopo and by district municipality.
| Type | Count (Per Day) | Week Ending | Reproduction Number [95% Confidence Interval] | |
|---|---|---|---|---|
| Limpopo | cases | 3.0 | 2022-12-25 | 1.02 [0.63 - 1.49] |
| Limpopo | hospital_admissions | 0.6 | 2022-12-23 | 2.45 [0.77 - 5.15] |
| District Municipality | Type | Count (Per Day) | Week Ending | Reproduction Number [95% Confidence Interval] |
|---|---|---|---|---|
| Capricorn | cases | 0.7 | 2022-12-25 | 1.26 [0.46 - 2.46] |
| Mopani | cases | 0.7 | 2022-12-25 | 0.95 [0.34 - 1.85] |
| Sekhukhune | cases | 0.1 | 2022-12-25 | 2.24 [0.27 - 6.36] |
| Vhembe | cases | 0.7 | 2022-12-25 | 2.14 [0.76 - 4.30] |
| Waterberg | cases | 0.7 | 2022-12-25 | 0.81 [0.29 - 1.58] |
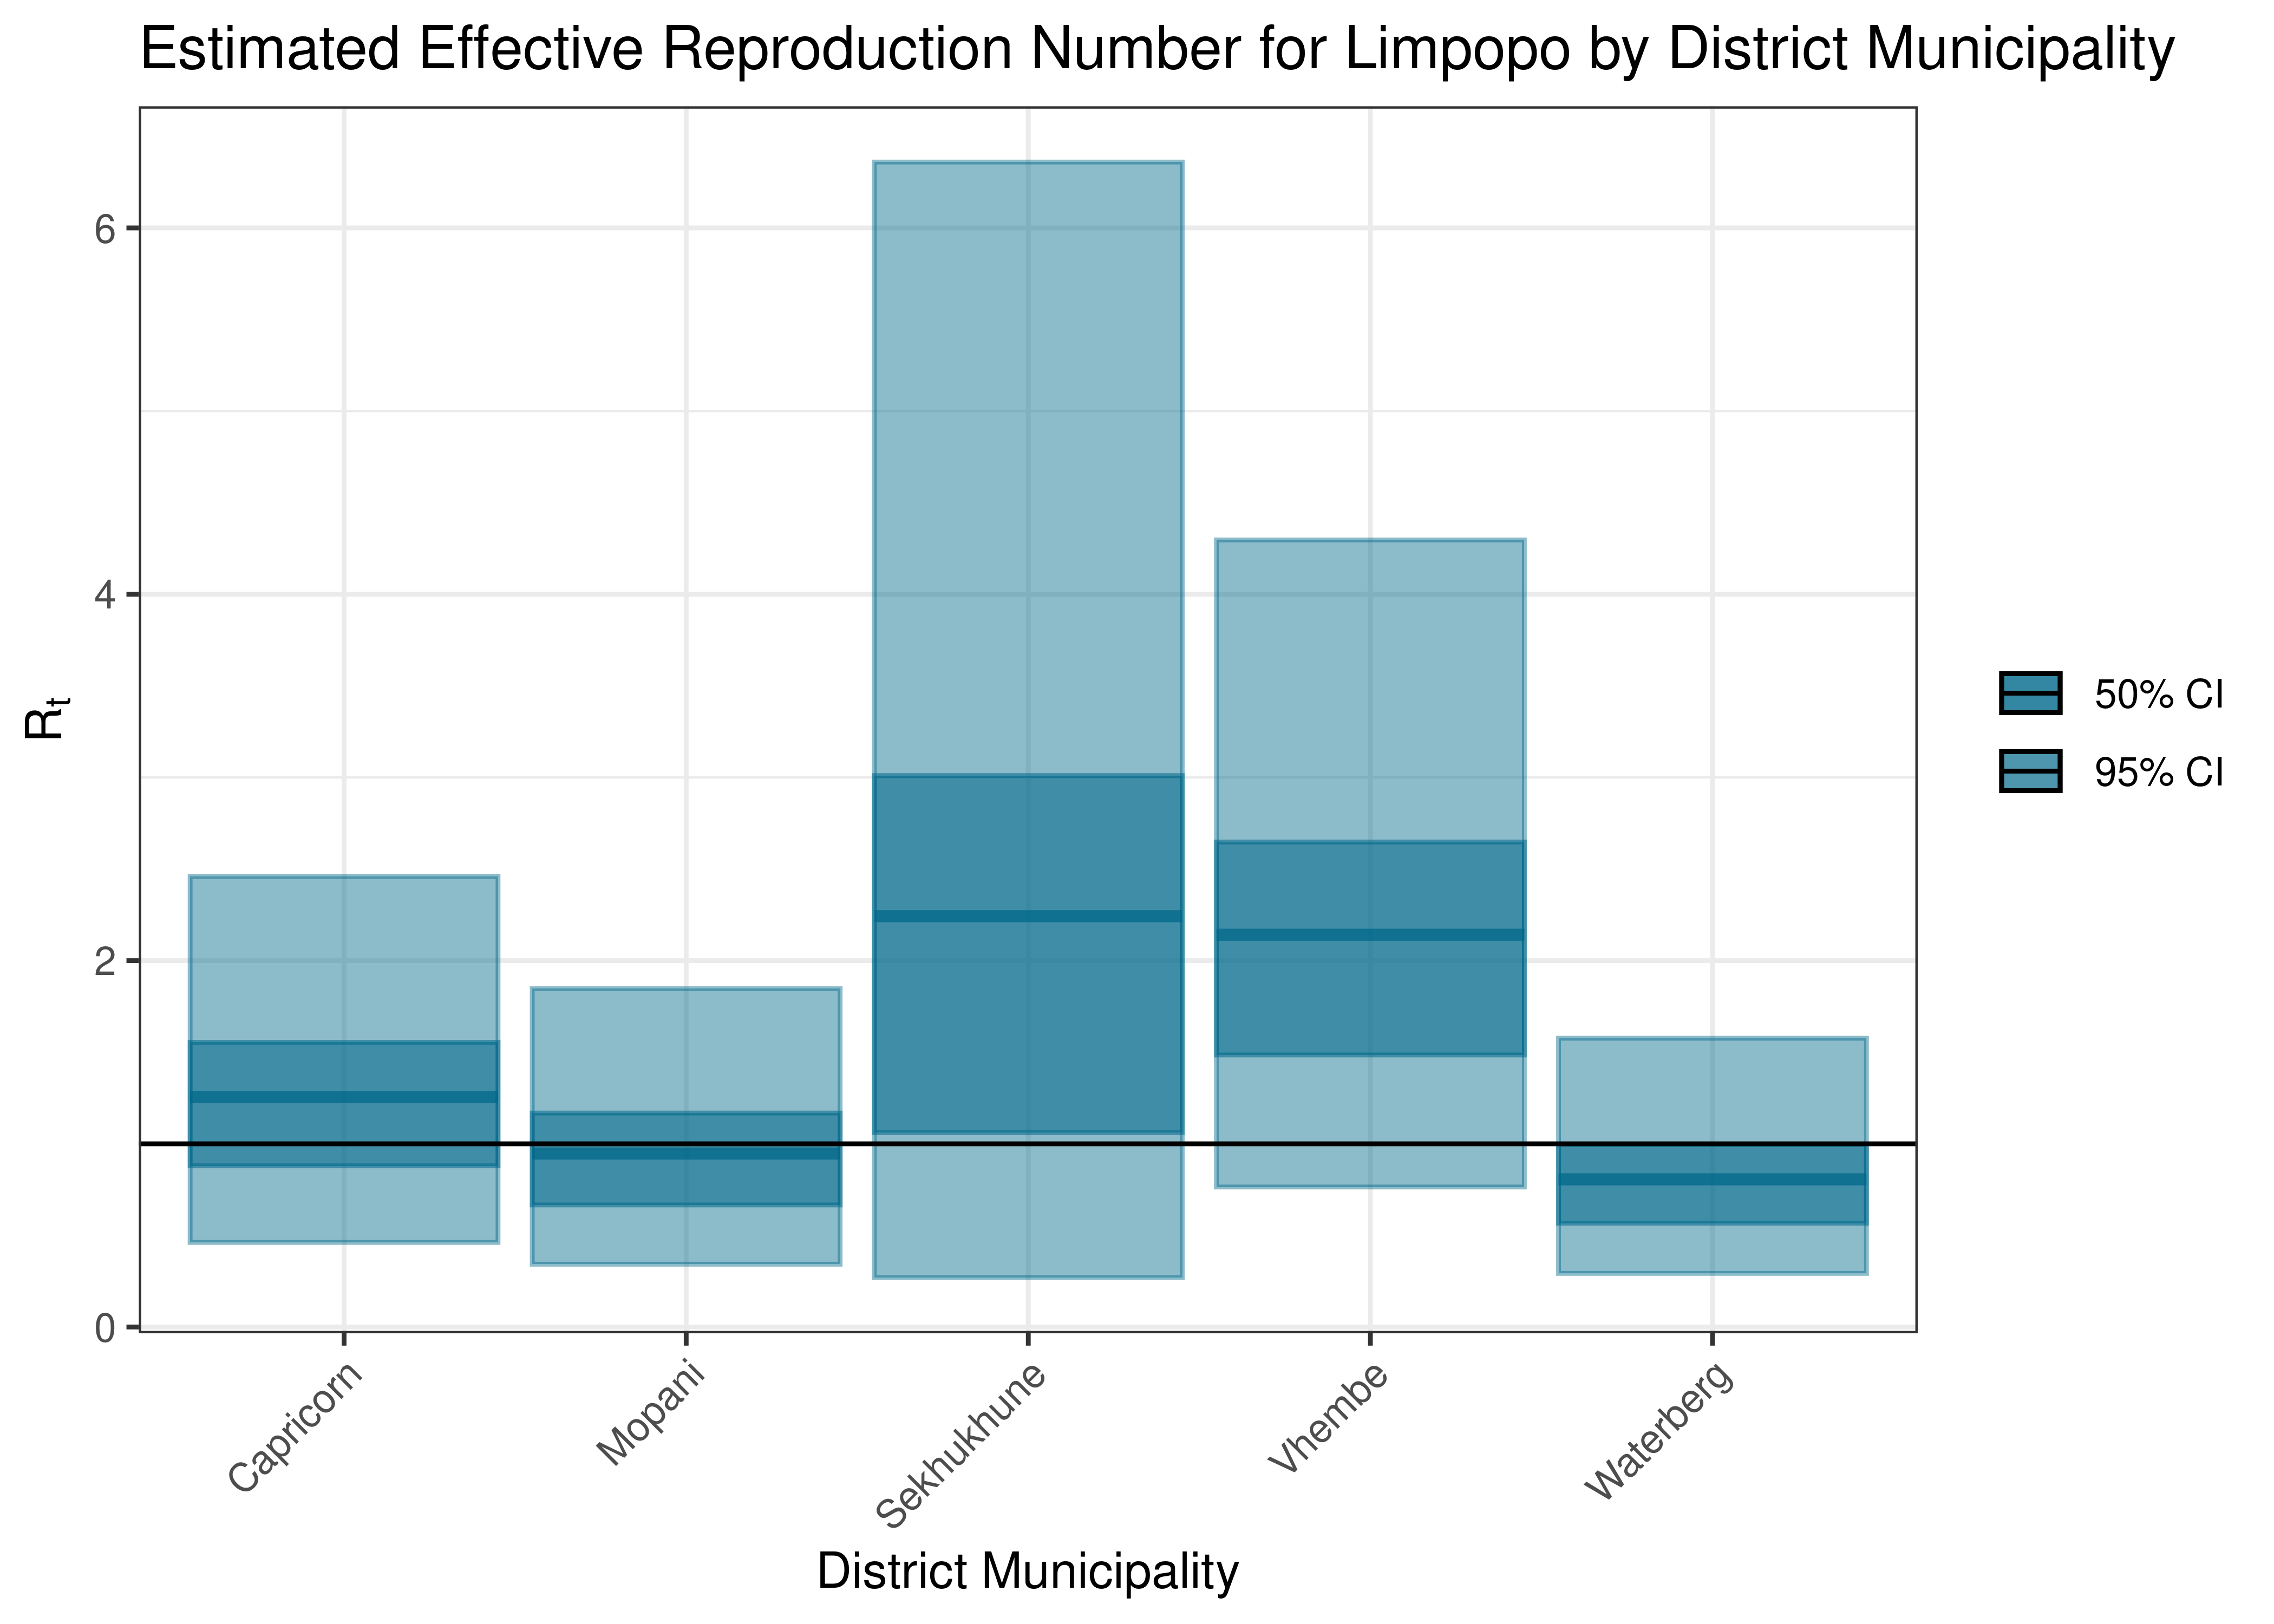
Estimated Effective Reproduction Number for Limpopo by District Municipality
Below the effective reproduction number for Limpopo over the last 90 days are plotted together with a plot since start of the pandemic.
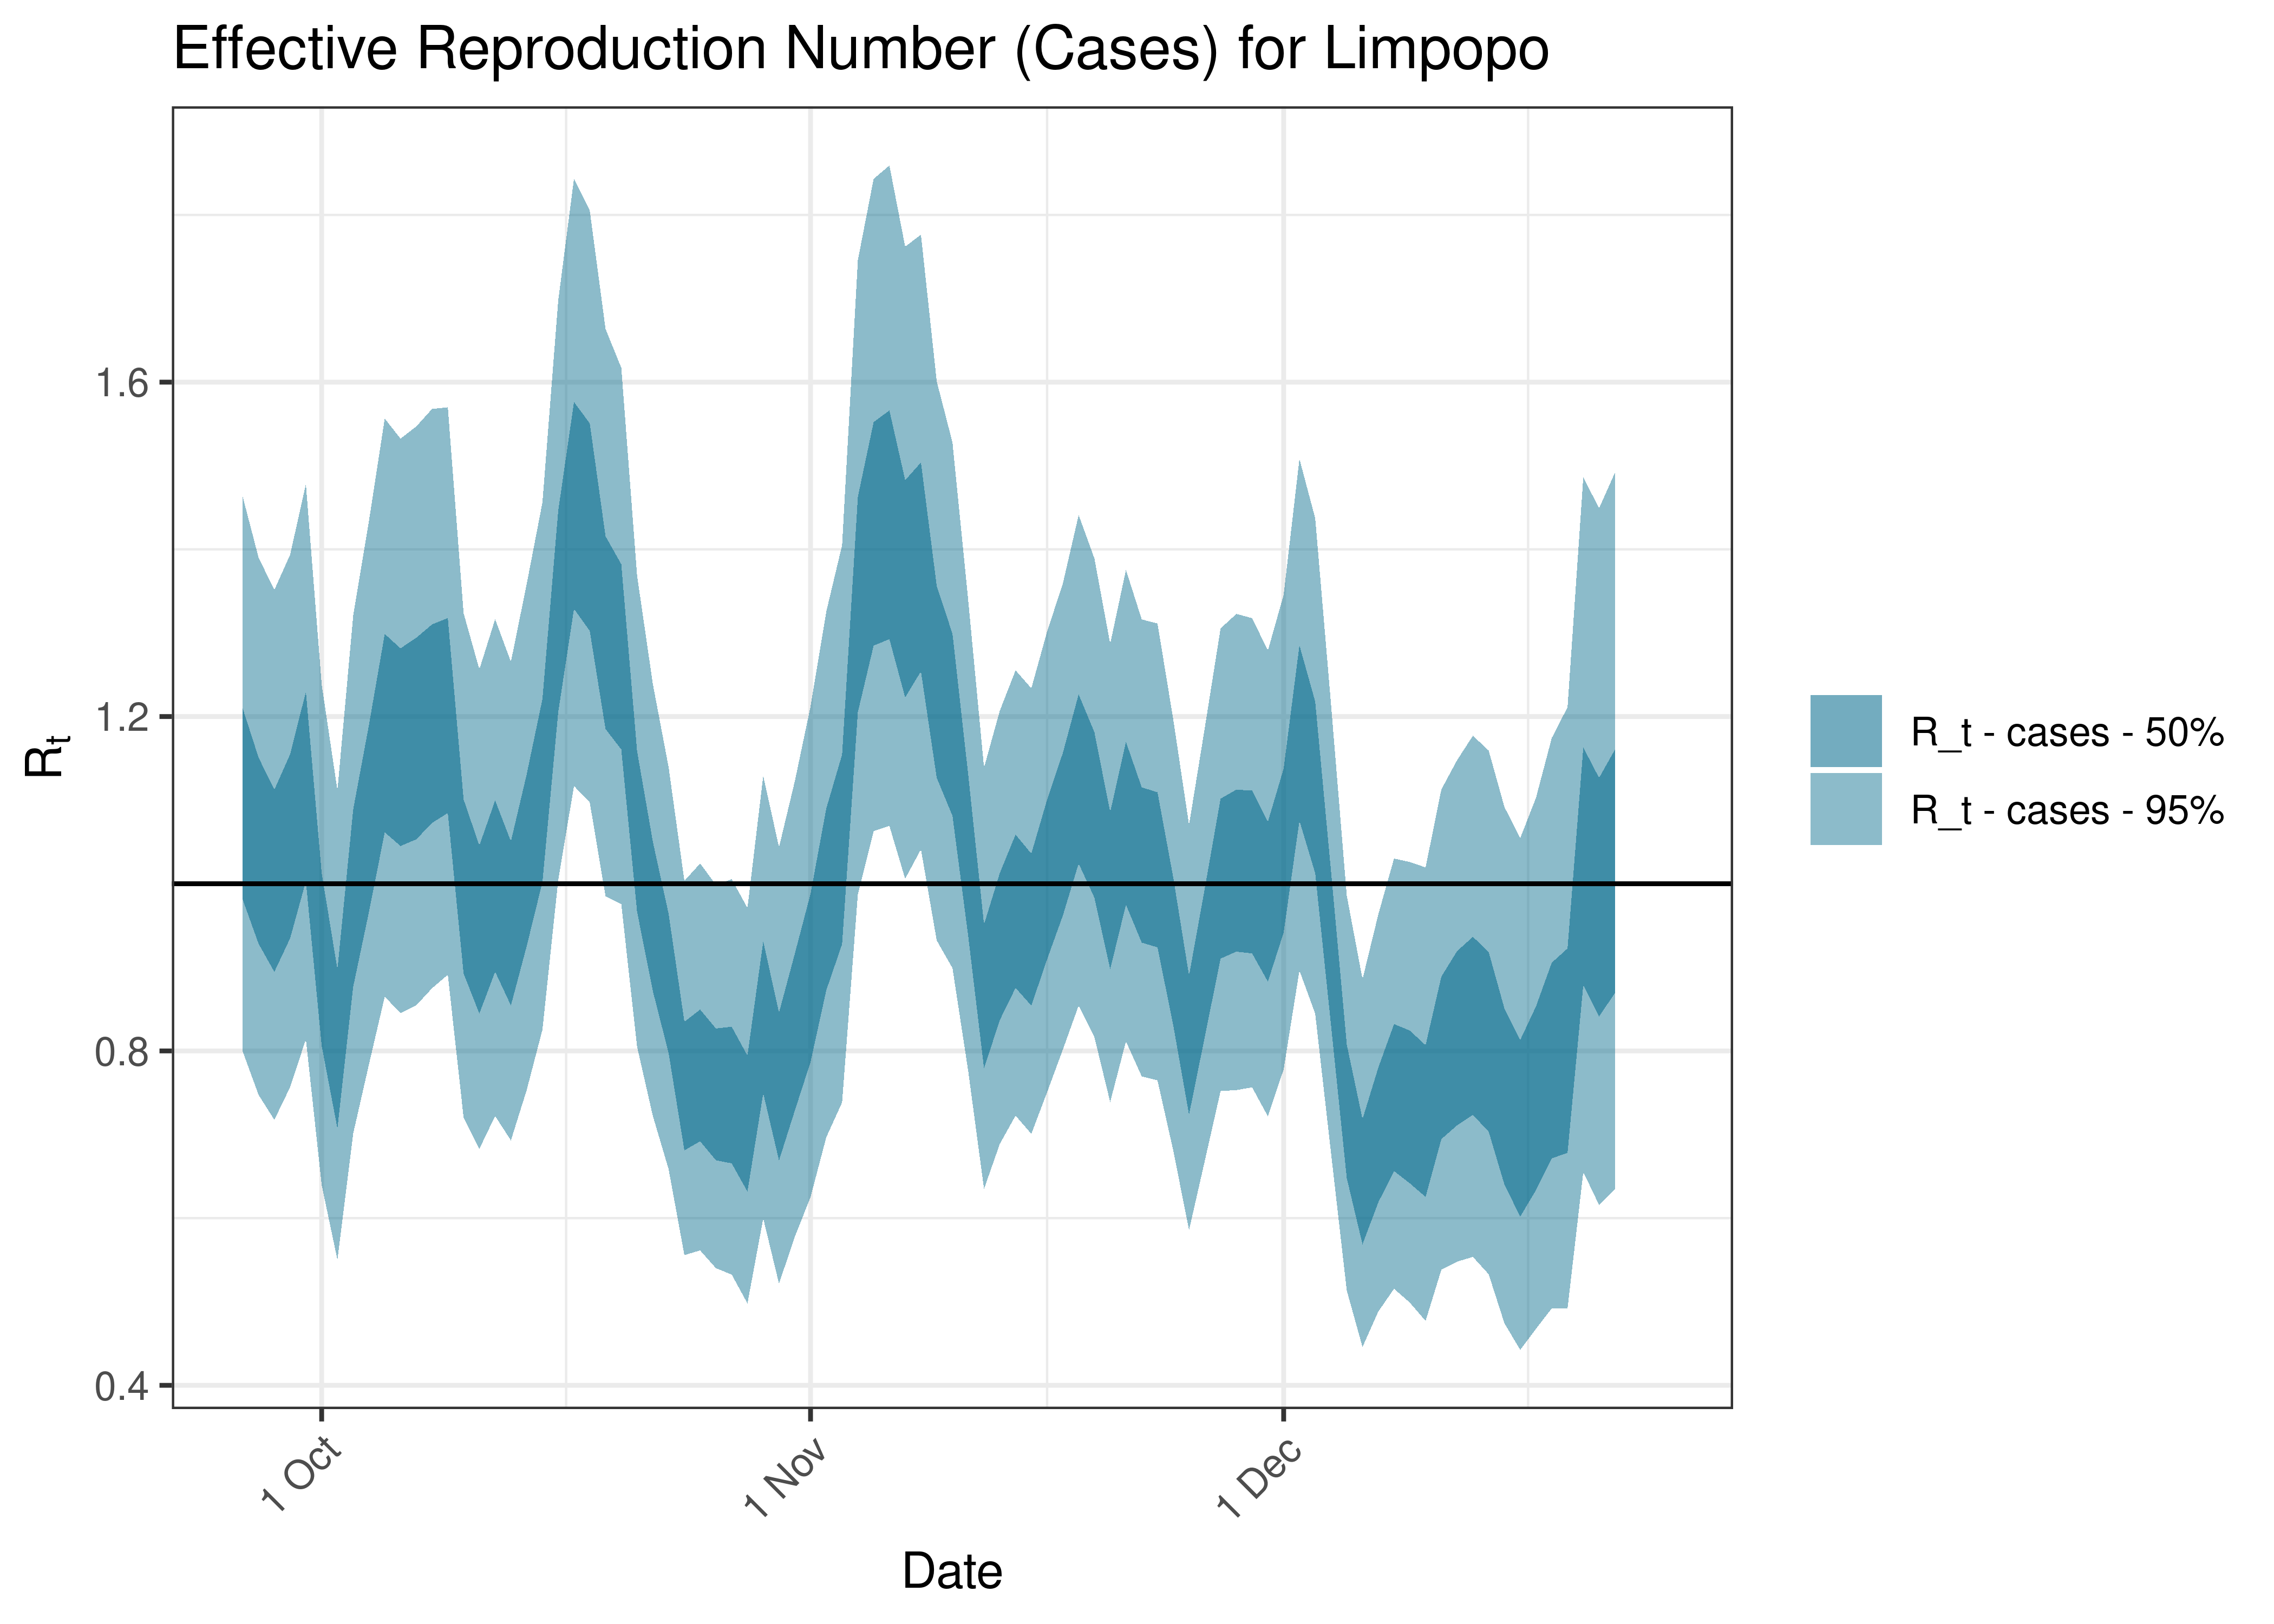
Estimated Effective Reproduction Number Based on Cases for Limpopo over last 90 days
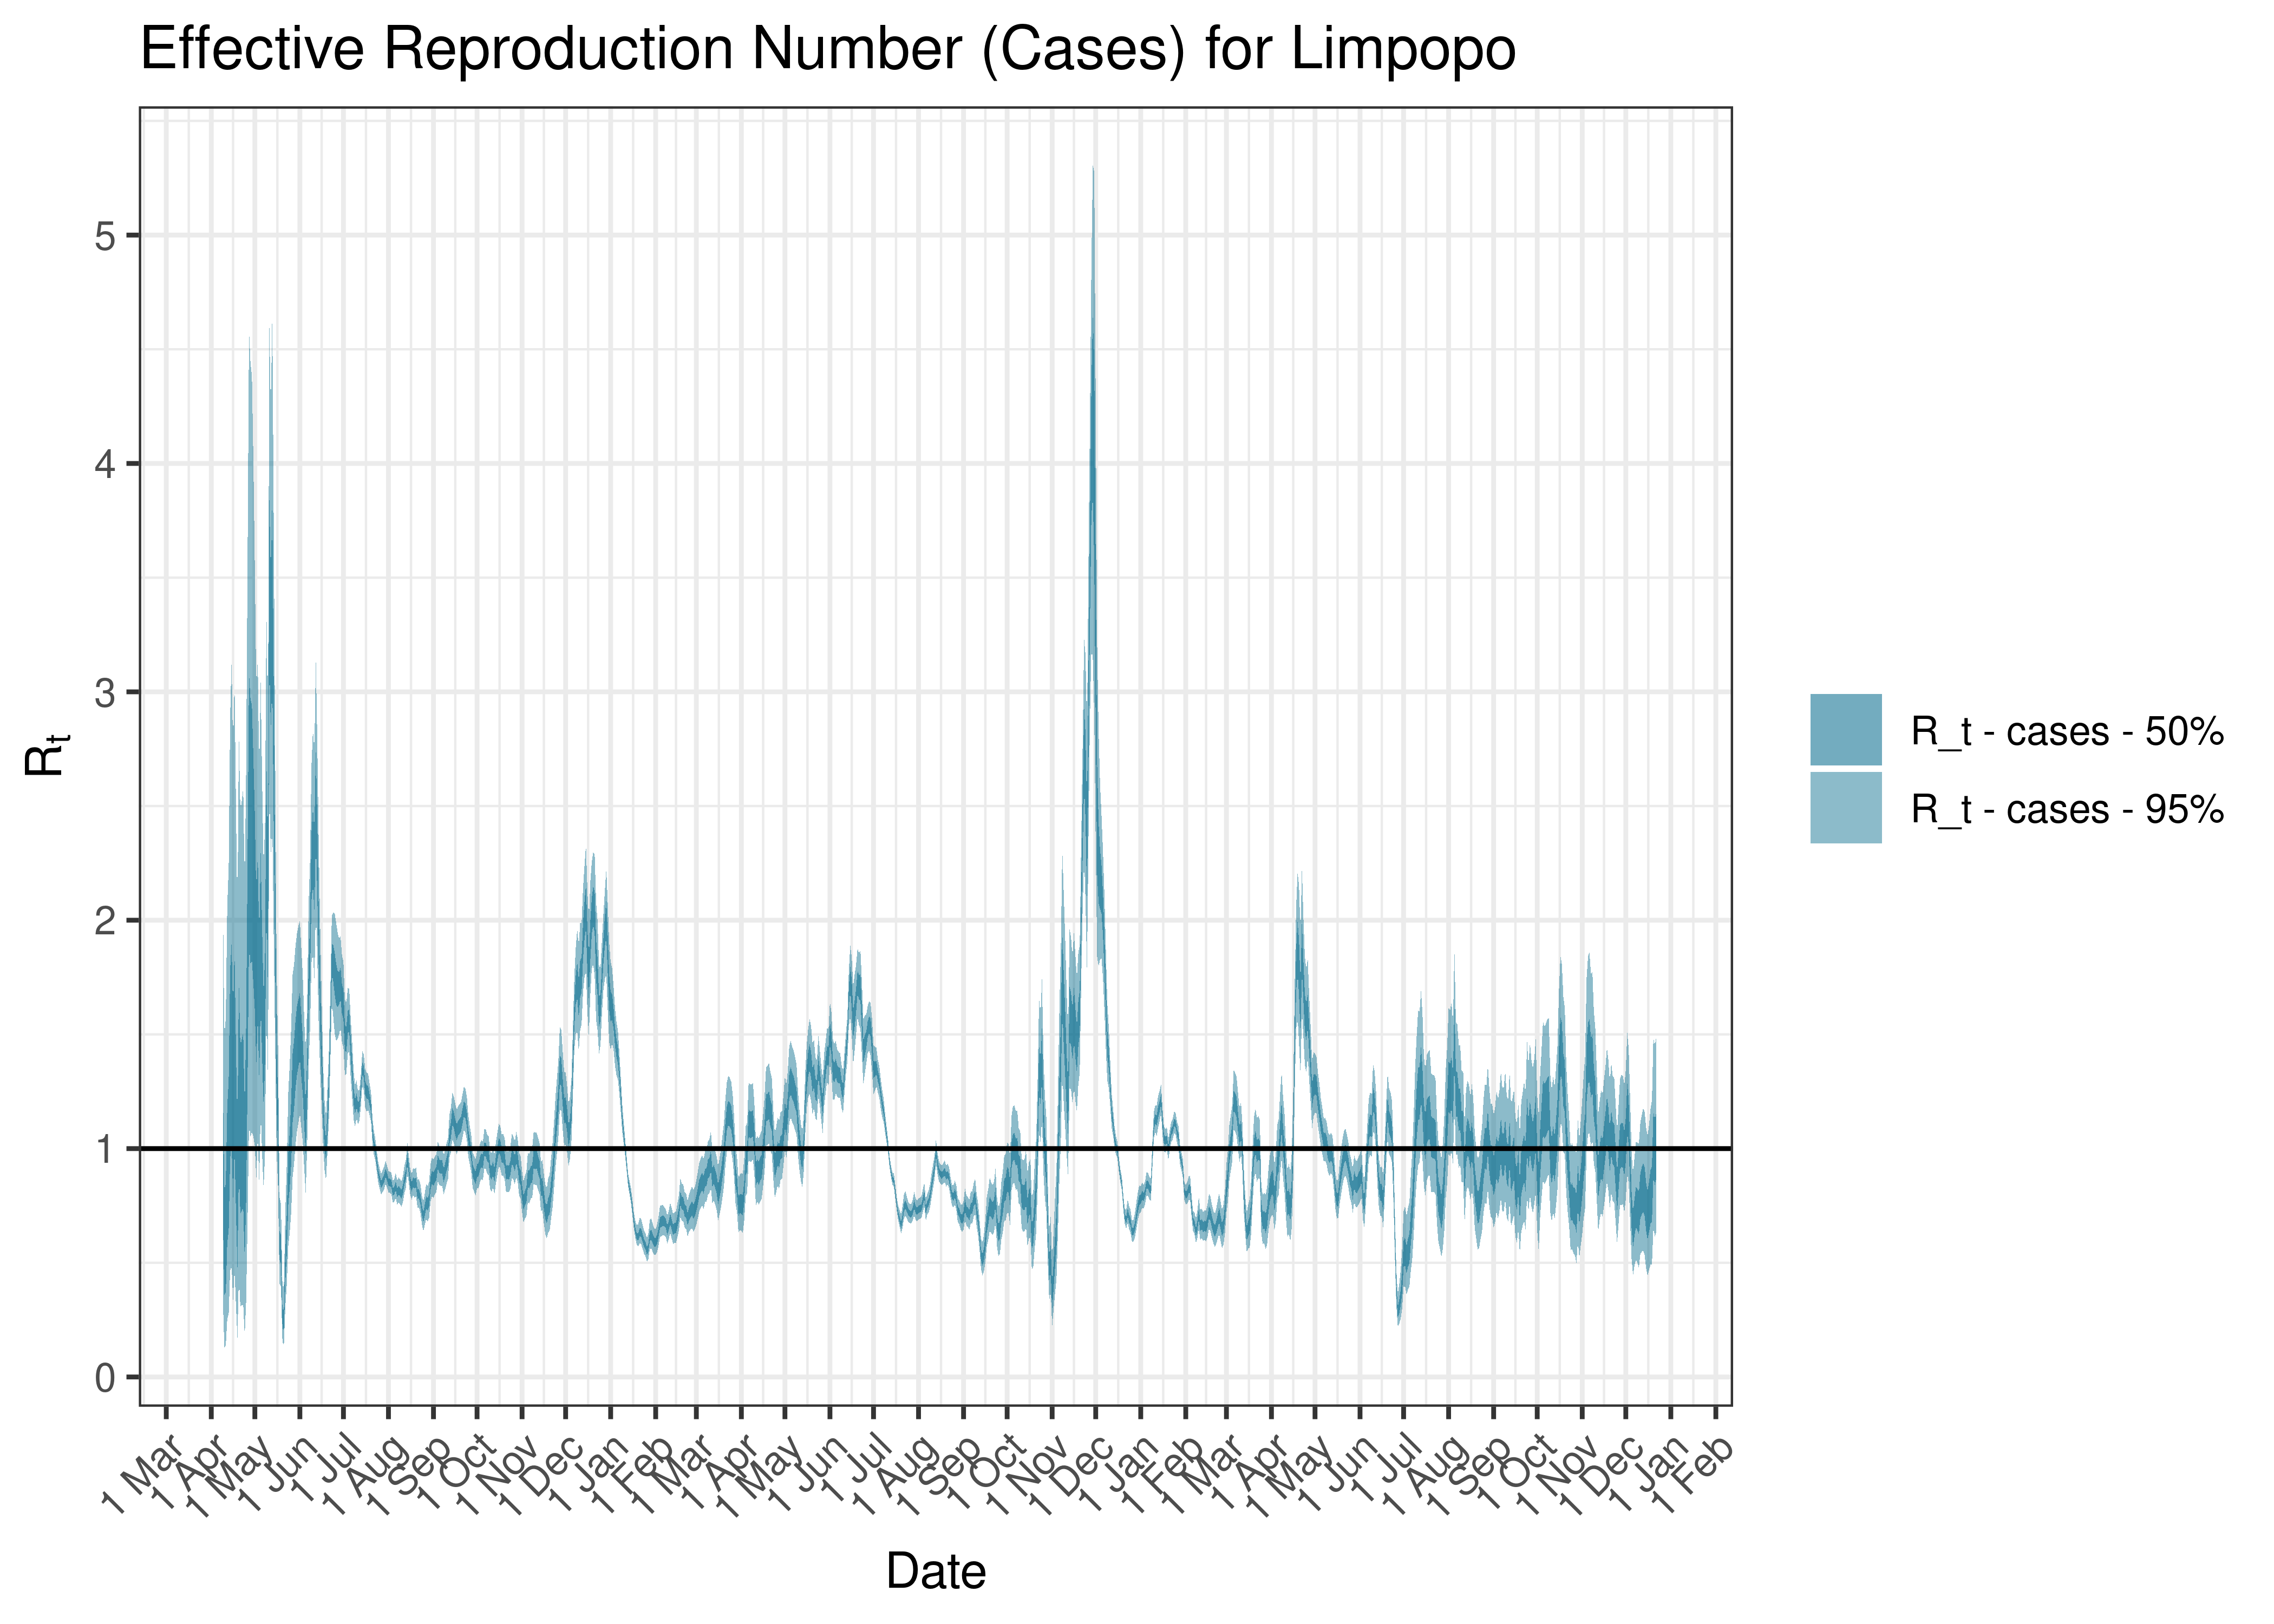
Estimated Effective Reproduction Number Based on Cases for Limpopo since 1 April 2020
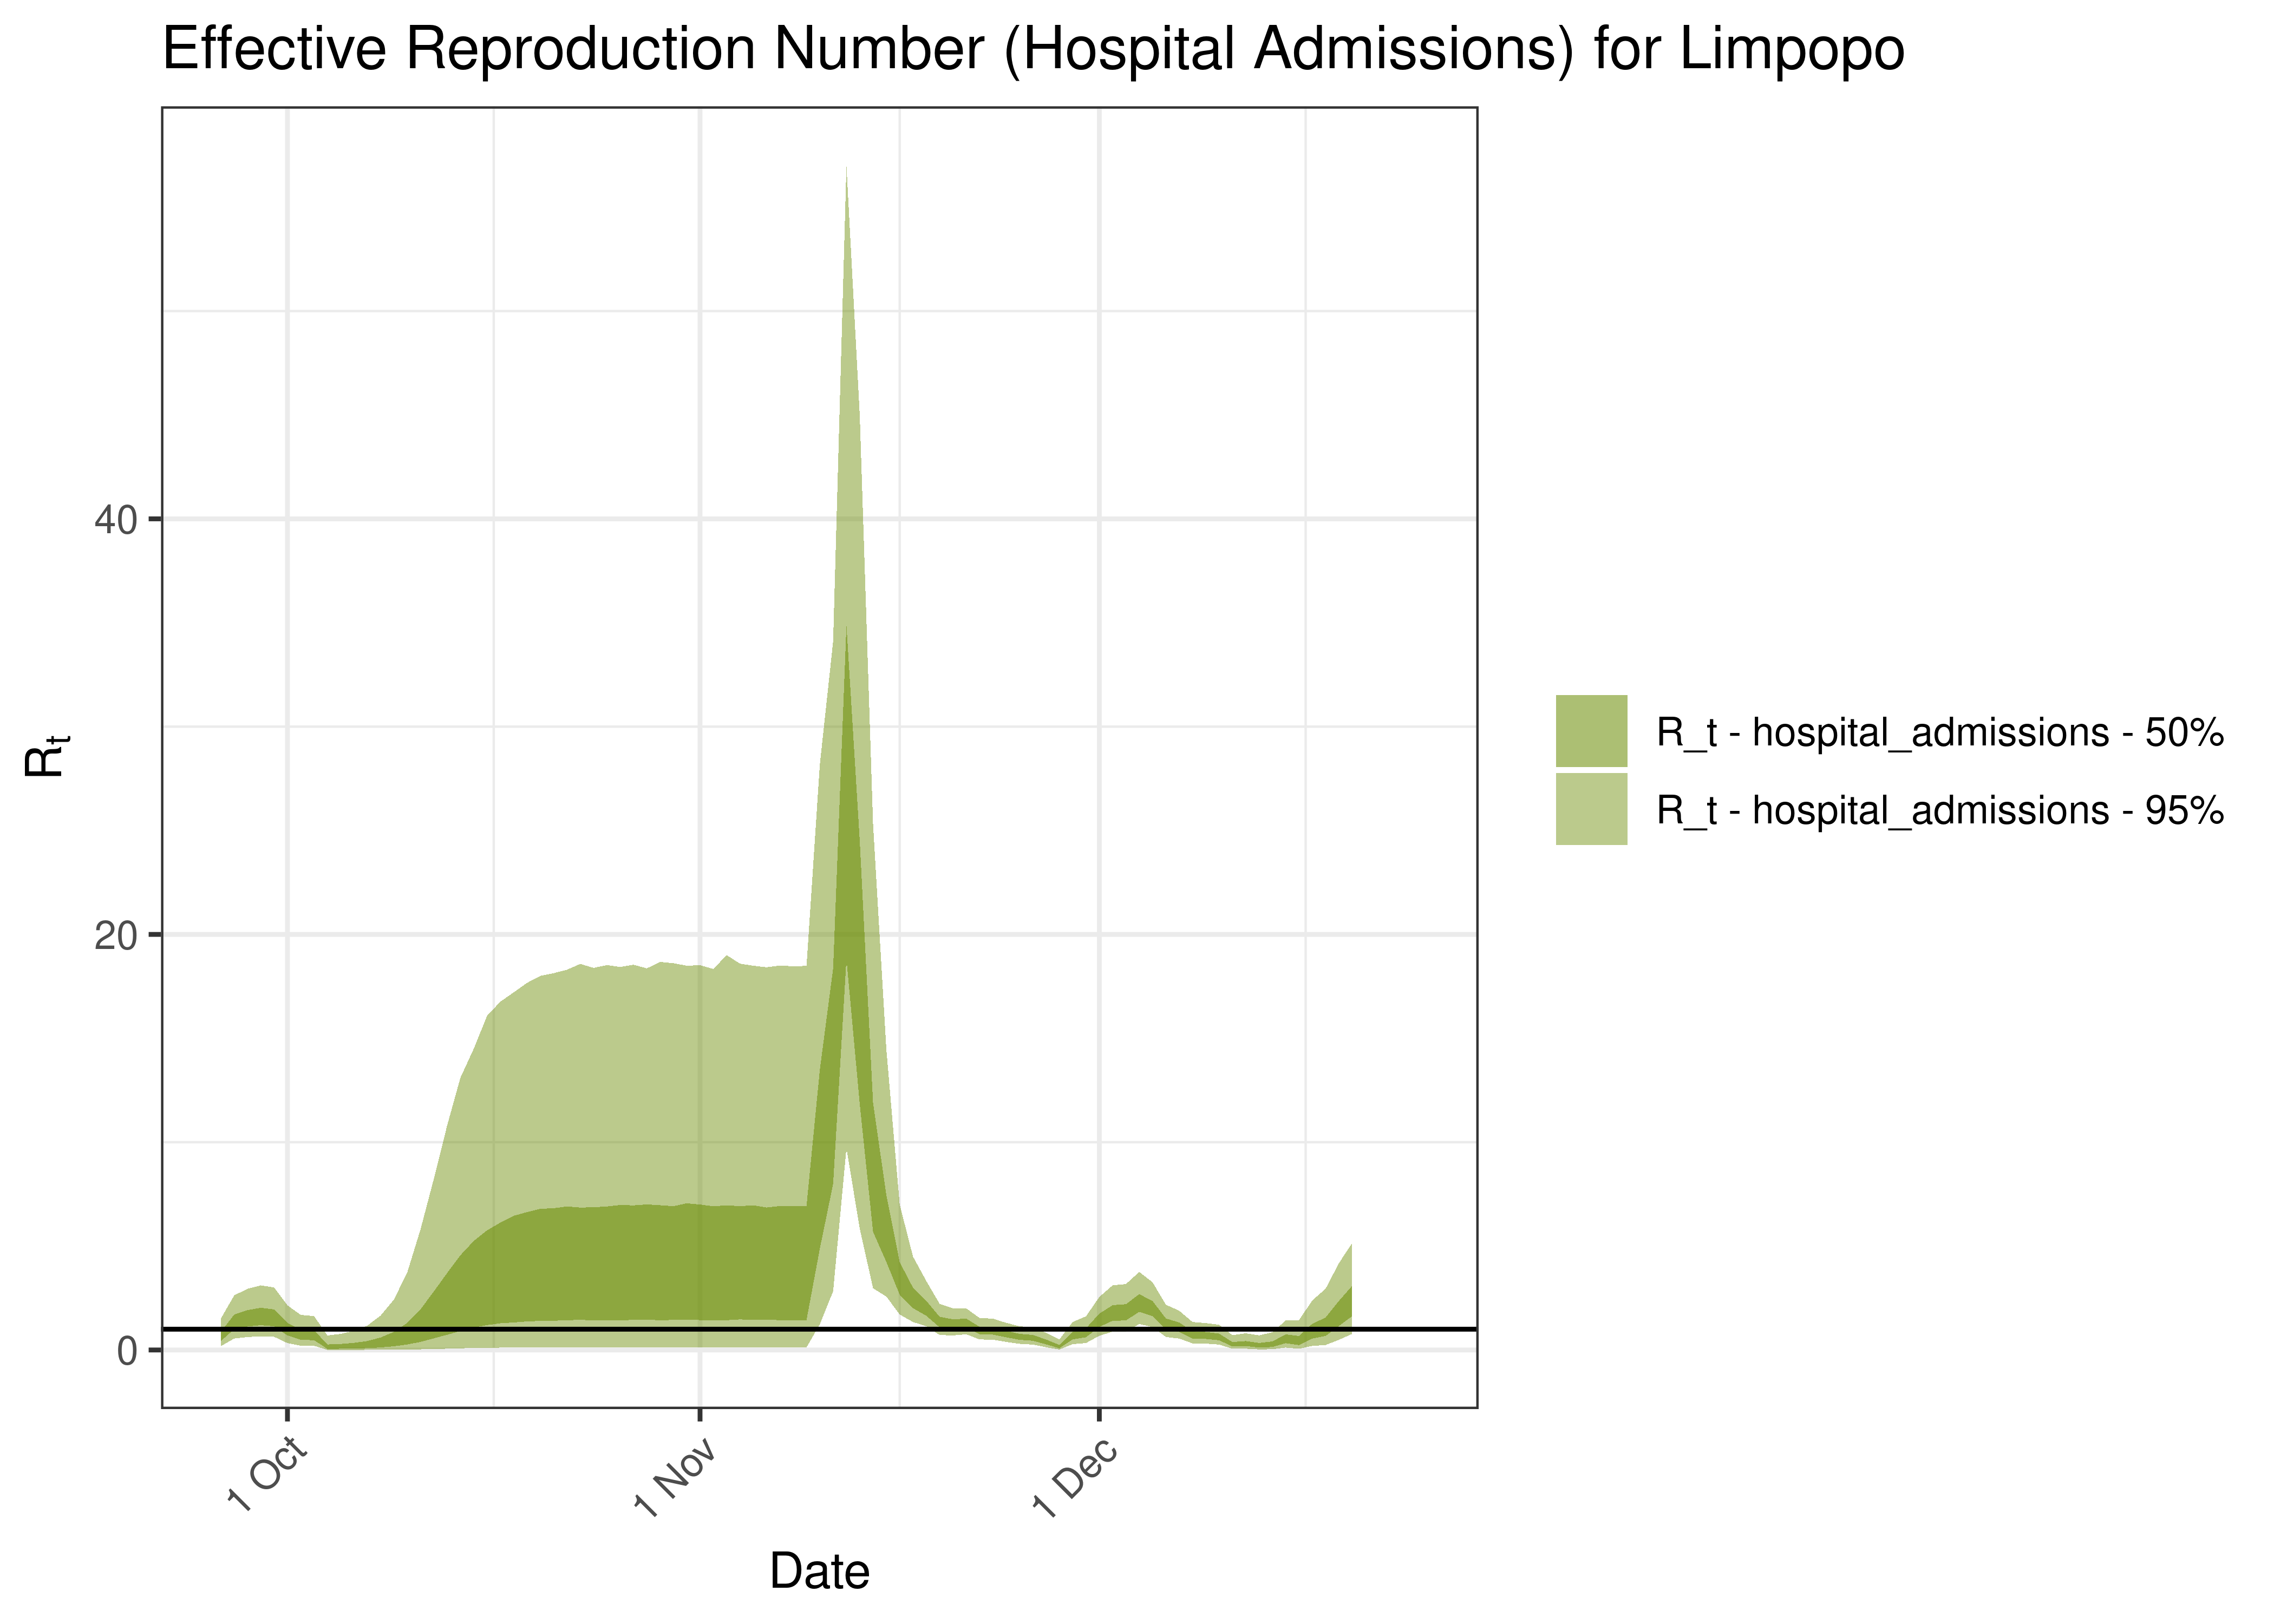
Estimated Effective Reproduction Number Based on Hospital Admissions for Limpopo over last 90 days
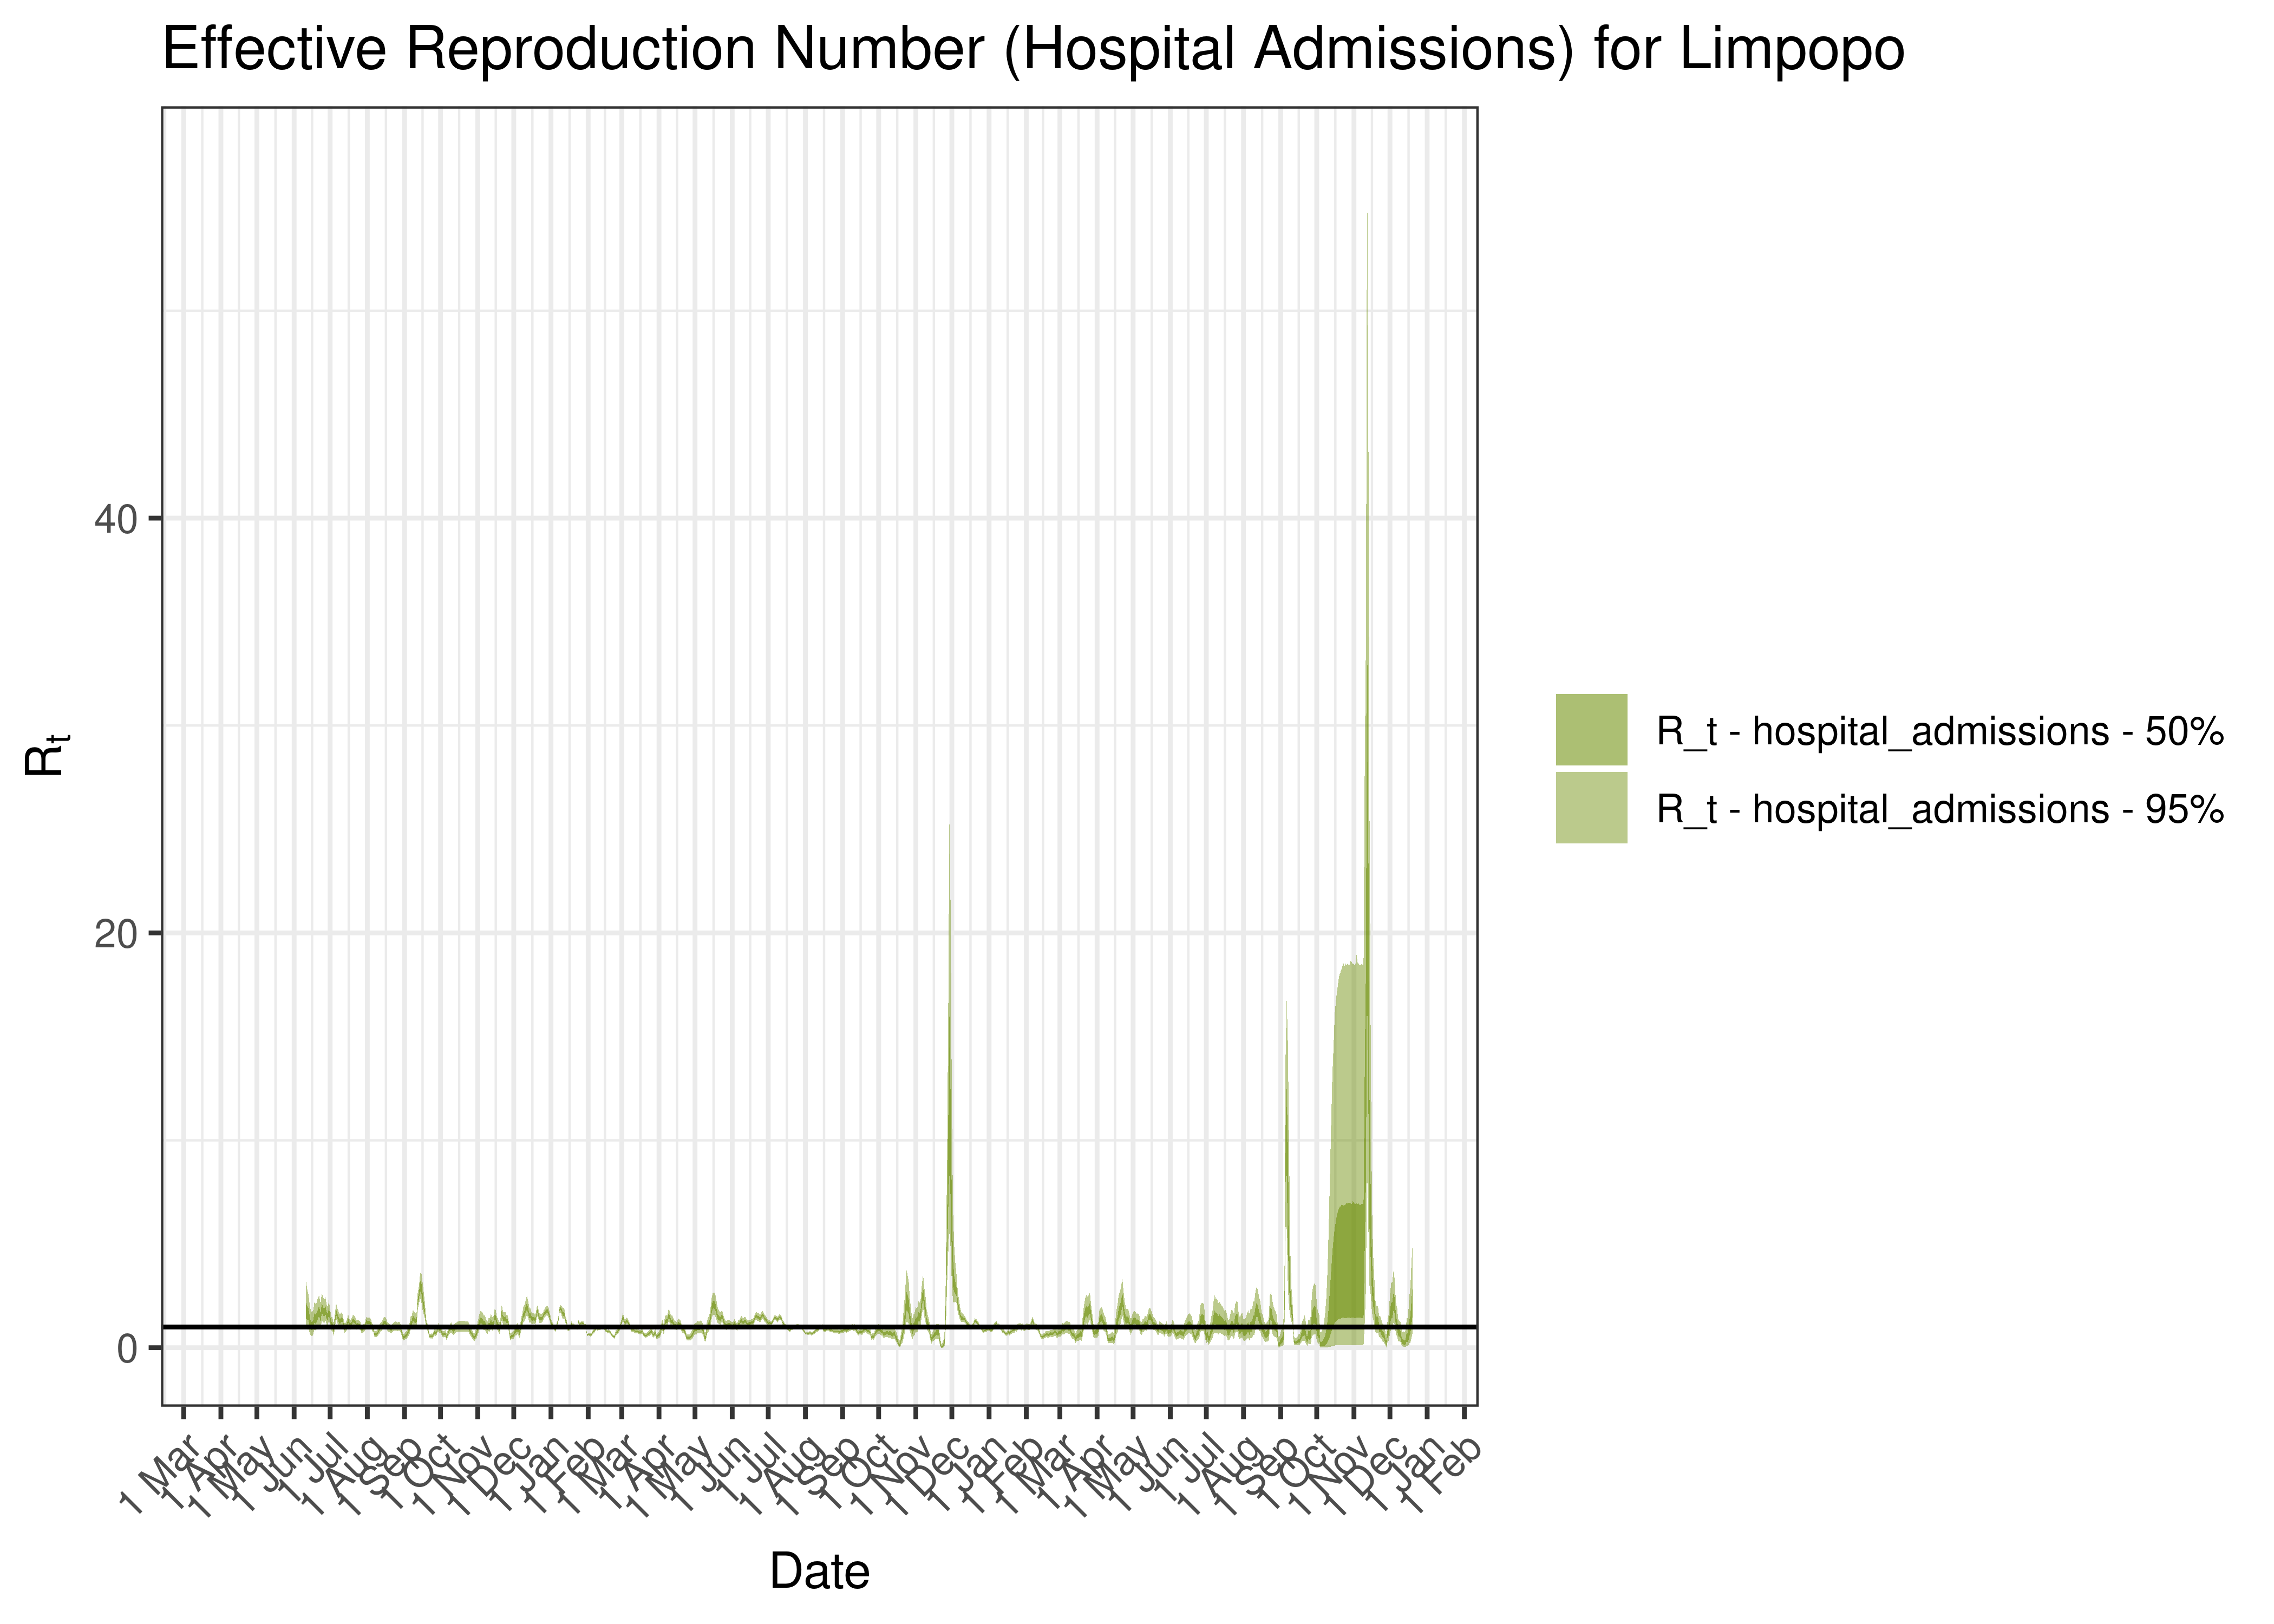
Estimated Effective Reproduction Number Based on Hospital Admissions for Limpopo since 1 April 2020
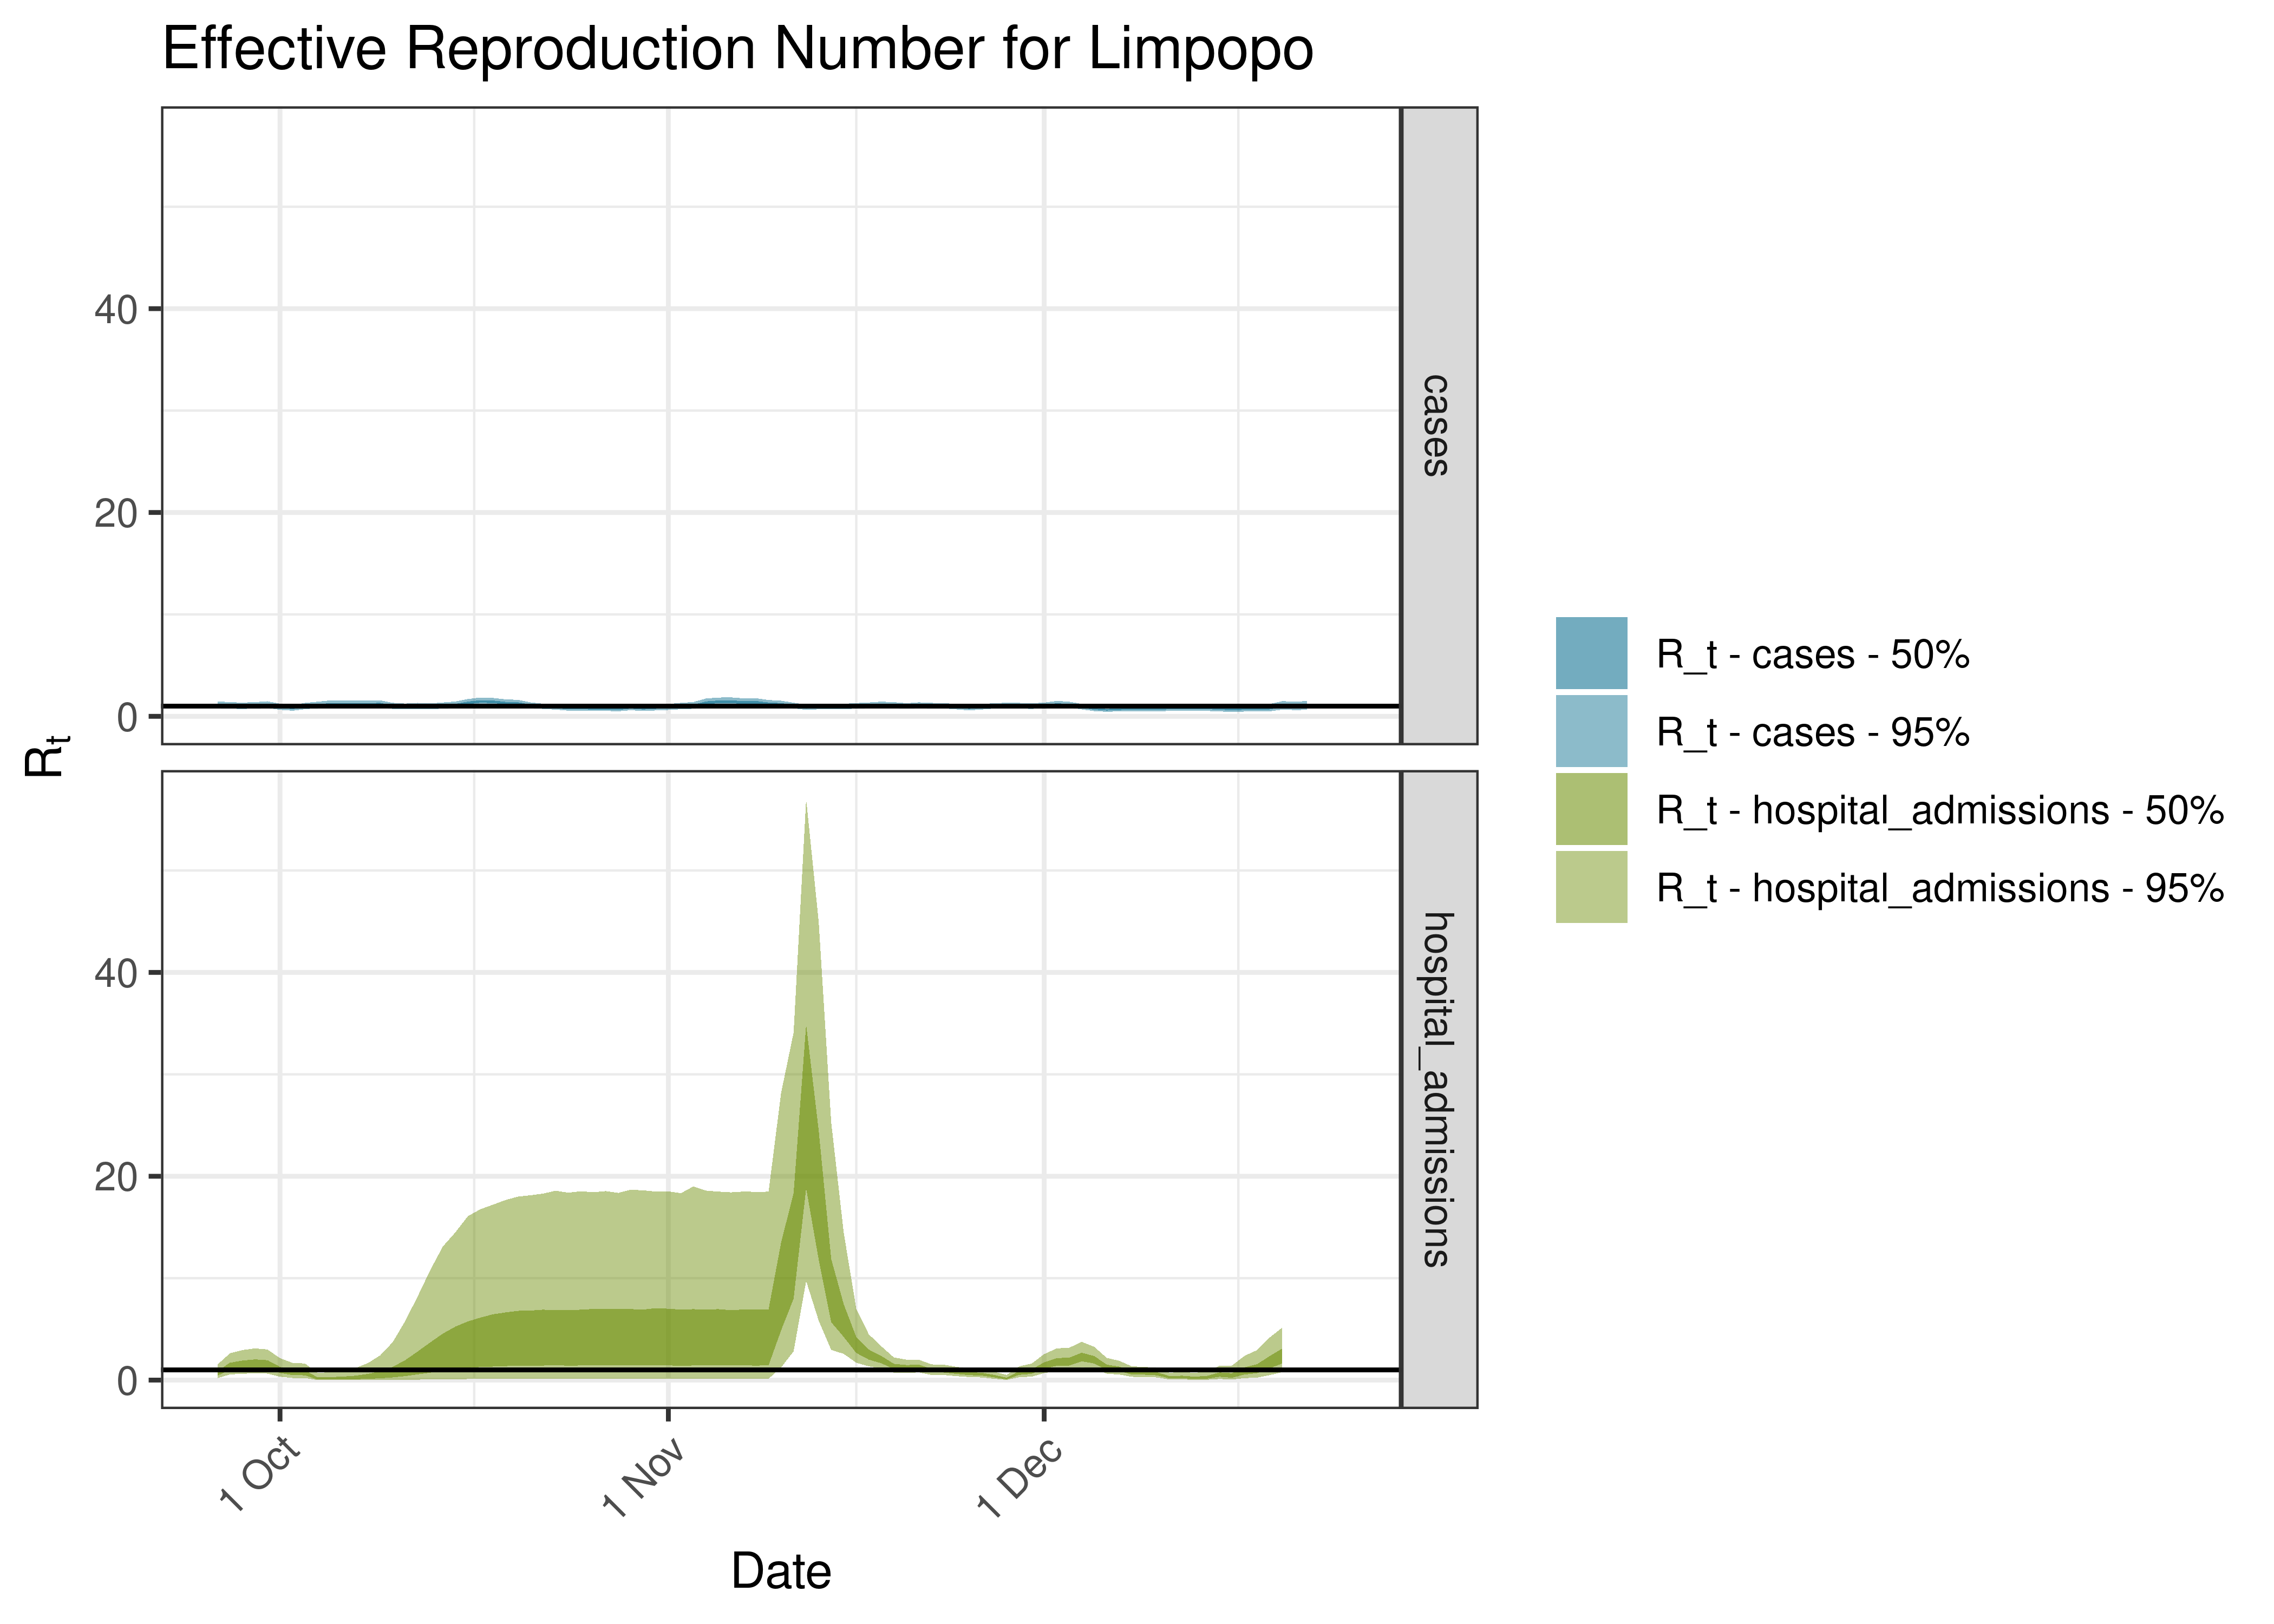
Estimated Effective Reproduction Number for Limpopo over last 90 days
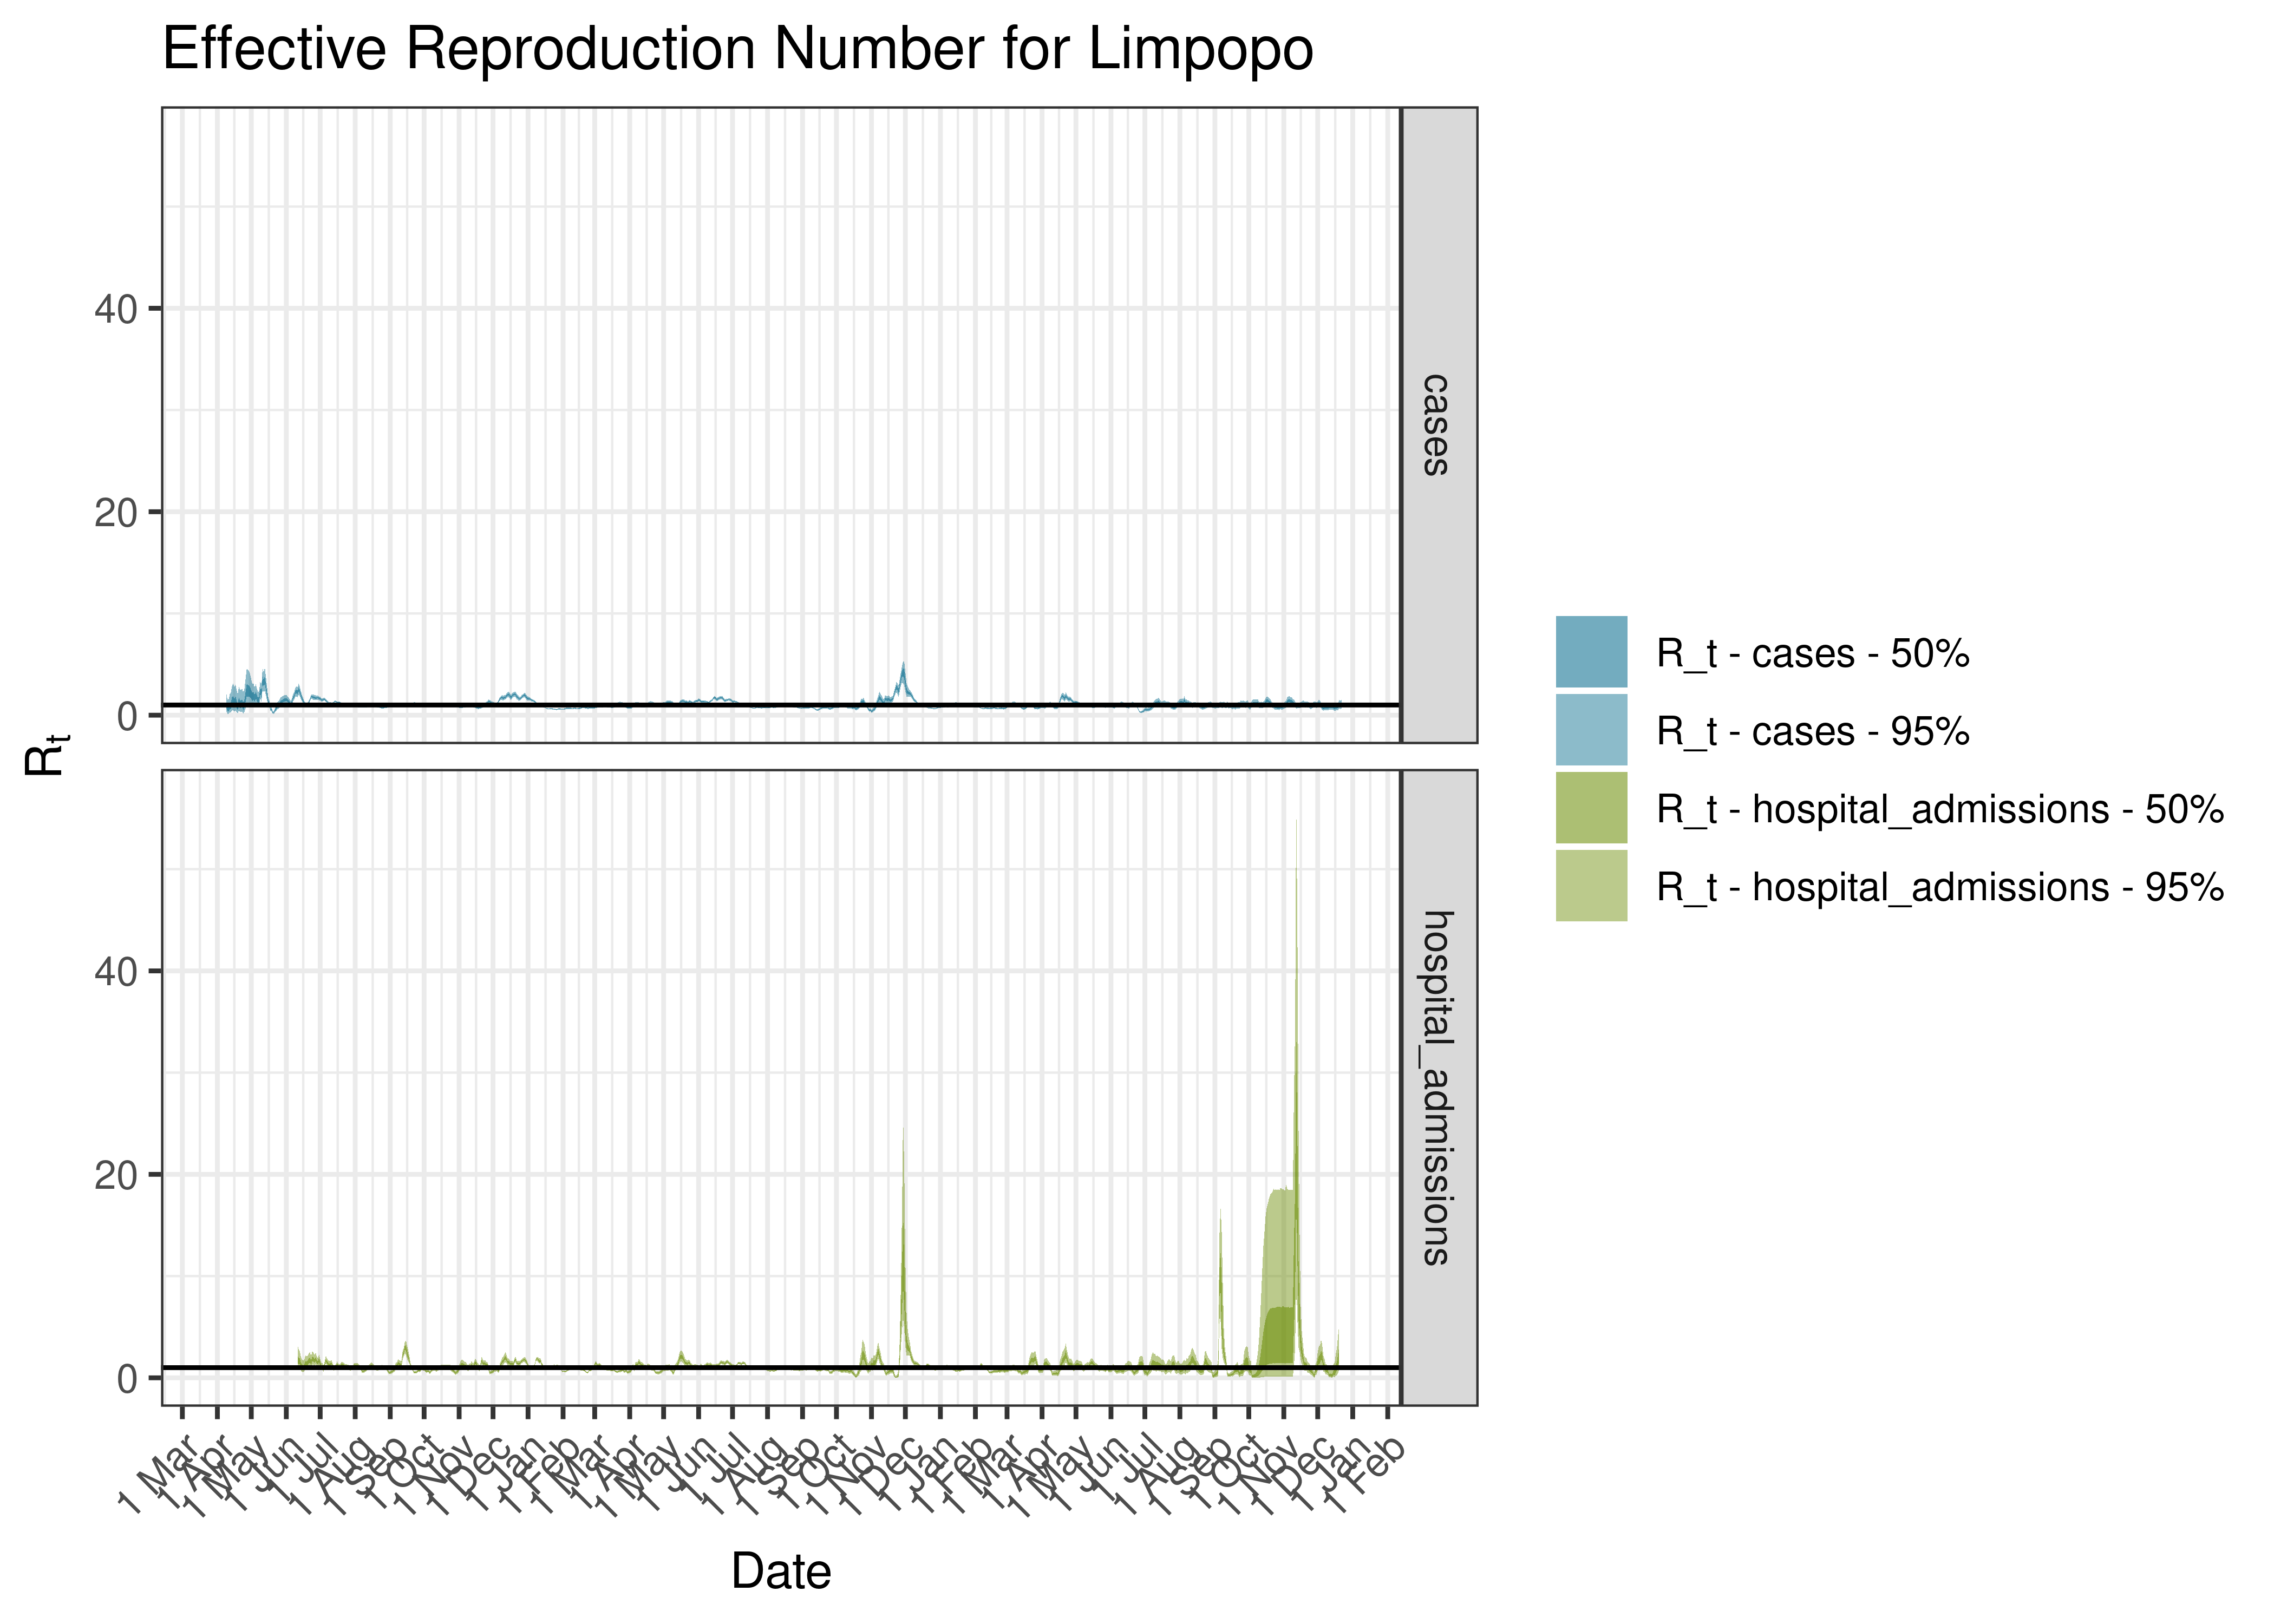
Estimated Effective Reproduction Number for Limpopo since 1 April 2020
6.6.8 Capricorn
6.6.8.1 Cases
Cases are tabulated by specimen received date below. Cases include estimates for late reporting in recent days as well as adjustments for any public holidays. A centred 7-day moving average is also shown. The peak daily cases in previous waves (as measured by the moving average) is also shown.
| Specimen Received Date | Cases | 7-day Moving Average | Comment |
|---|---|---|---|
| 2020-07-20 | 127 | 102 | Wave 1 Peak |
| 2021-01-06 | 663 | 541 | Wave 2 Peak |
| 2021-07-10 | 199 | 363 | Wave 3 Peak |
| 2021-12-16 | 400 | 211 | Wave 4 Peak |
| 2022-05-12 | 27 | 17 | Wave 5 Peak (to date) |
Below a 7-day moving average daily case count are plotted for Capricorn on a log scale since start of the epidemic:
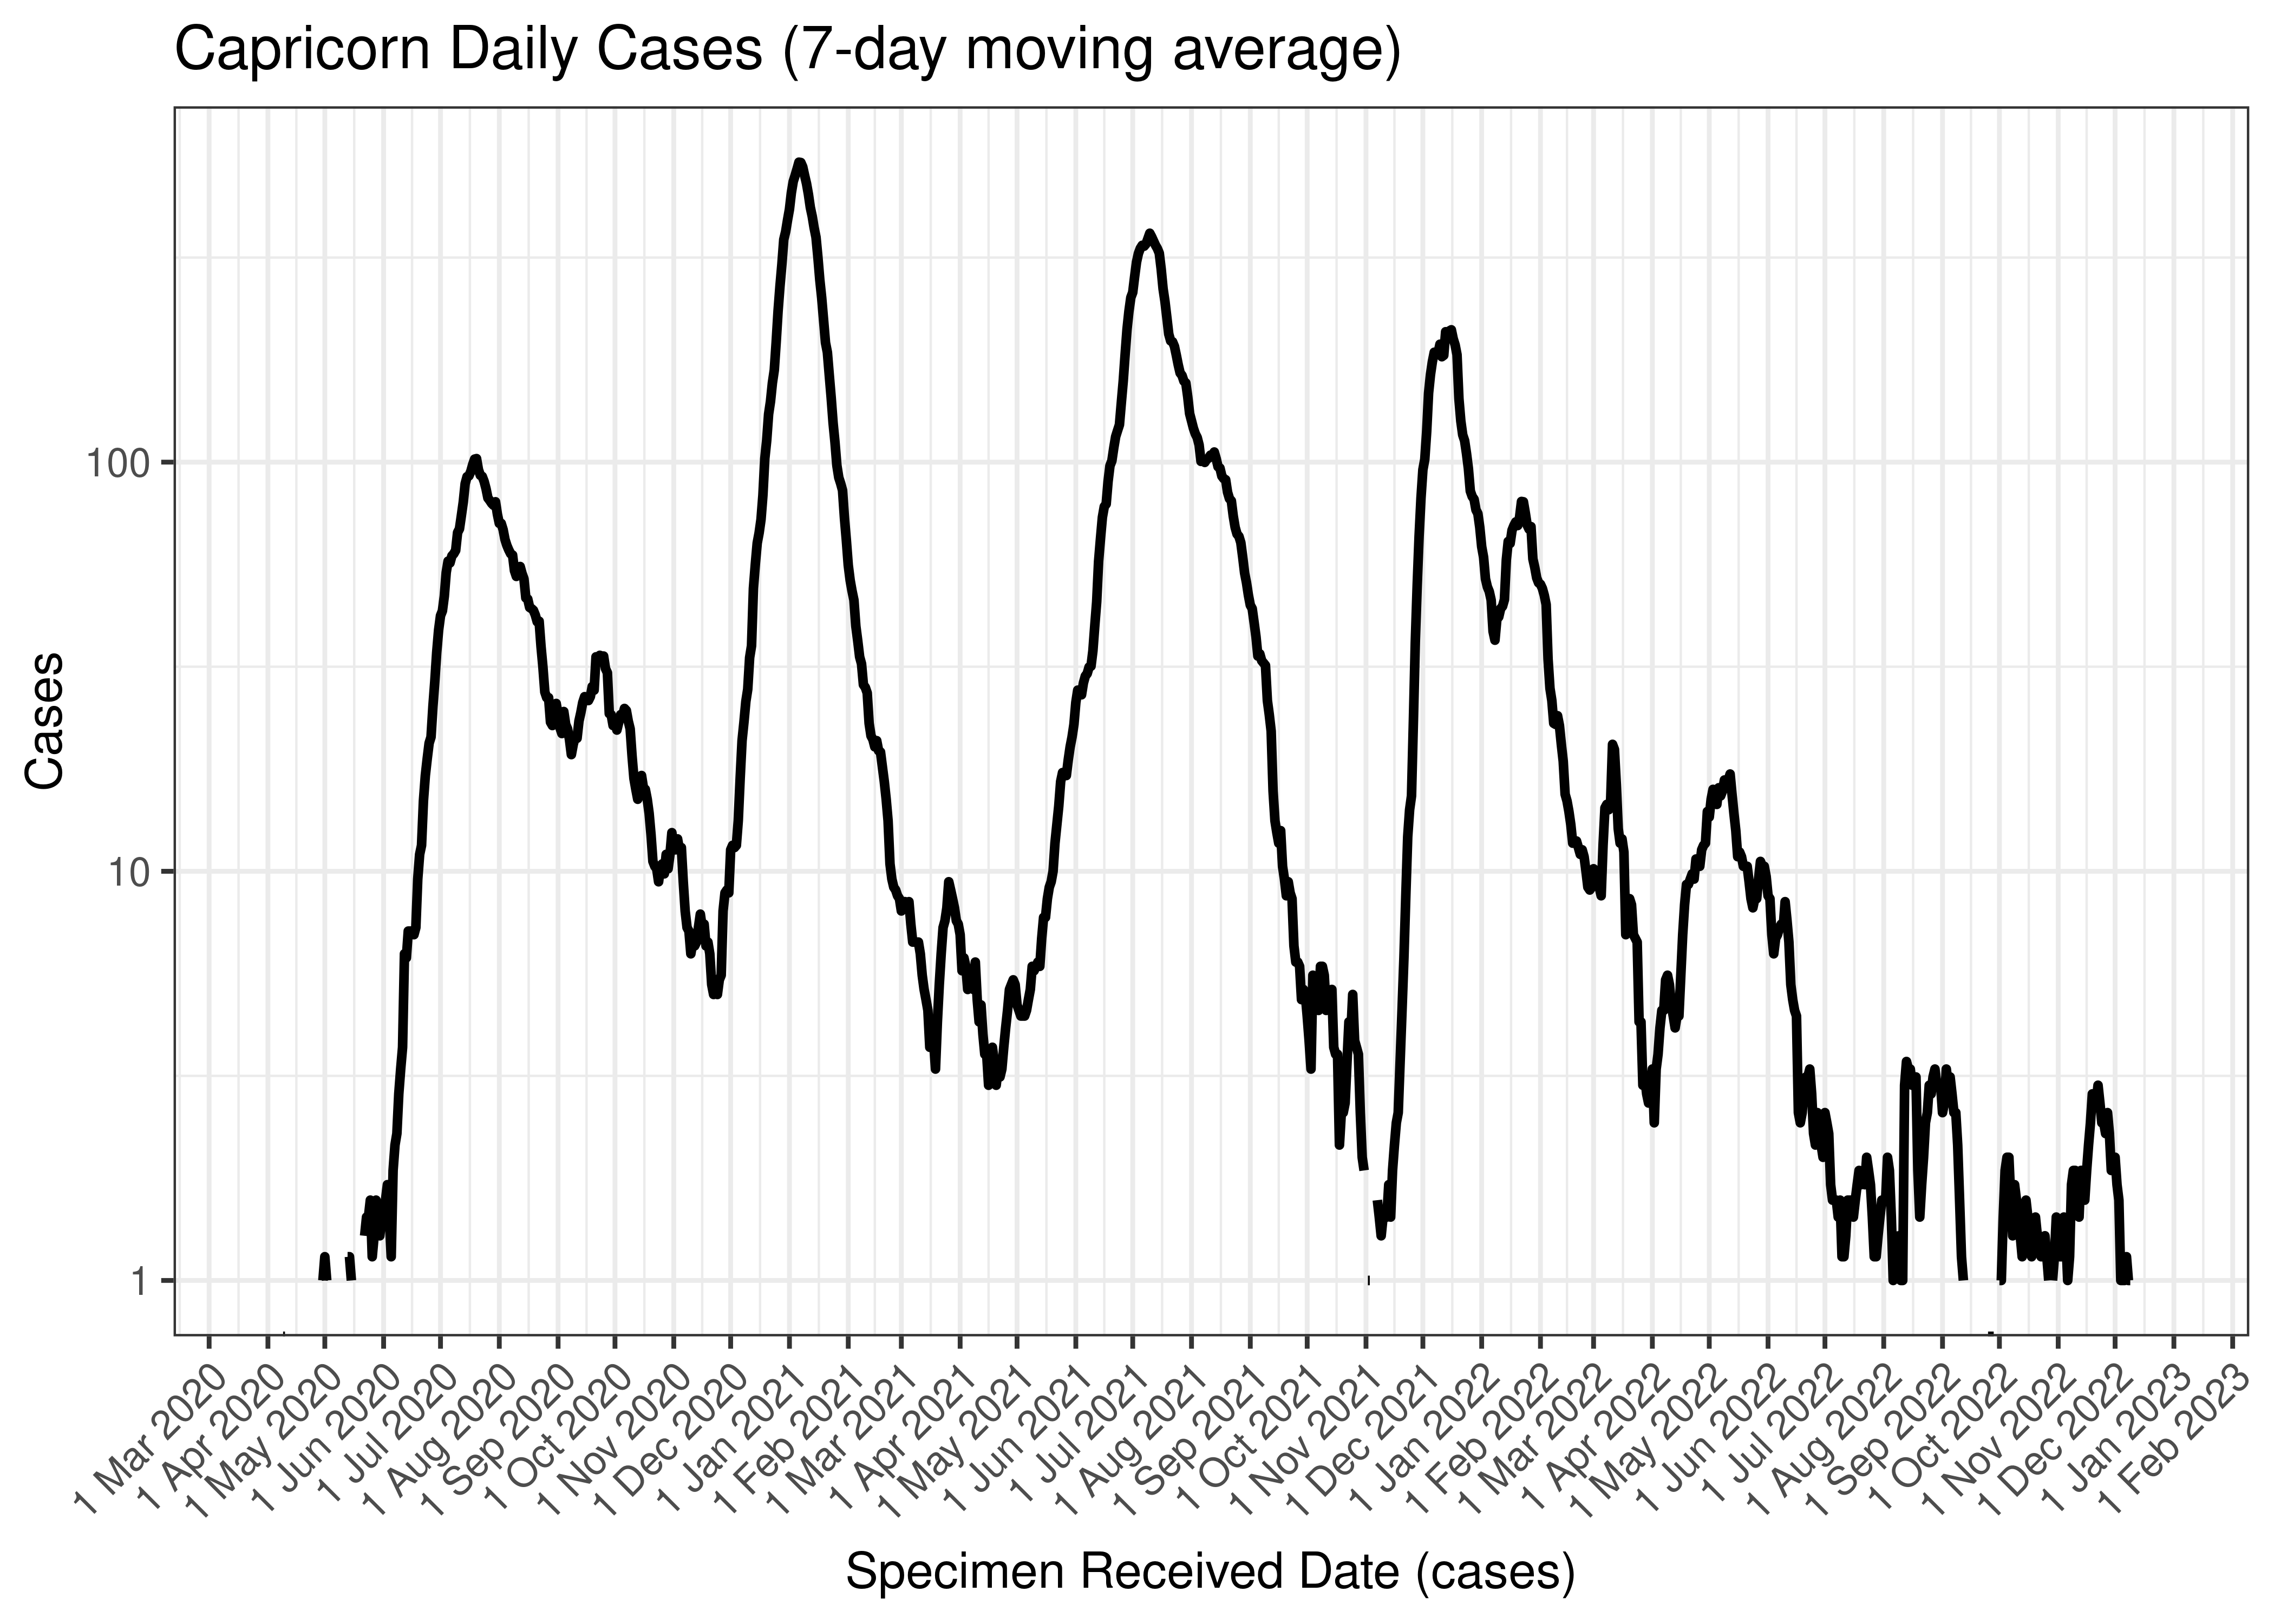
Capricorn Daily Cases (7-day moving average)
Below the above chart is repeated for the last 30-days:
Capricorn Daily Cases for Last 30-days (7-day moving average)
6.6.8.2 Reproduction Number
Below current (last weekly) reproduction number estimates are tabulated for Capricorn.
| Count (Per Day) | Week Ending | Reproduction Number [95% Confidence Interval] | |
|---|---|---|---|
| Capricorn | 0.7 | 2022-12-25 | 1.26 [0.46 - 2.46] |
Below the effective reproduction number for Capricorn over the last 90 days are plotted together with a plot since start of the pandemic.
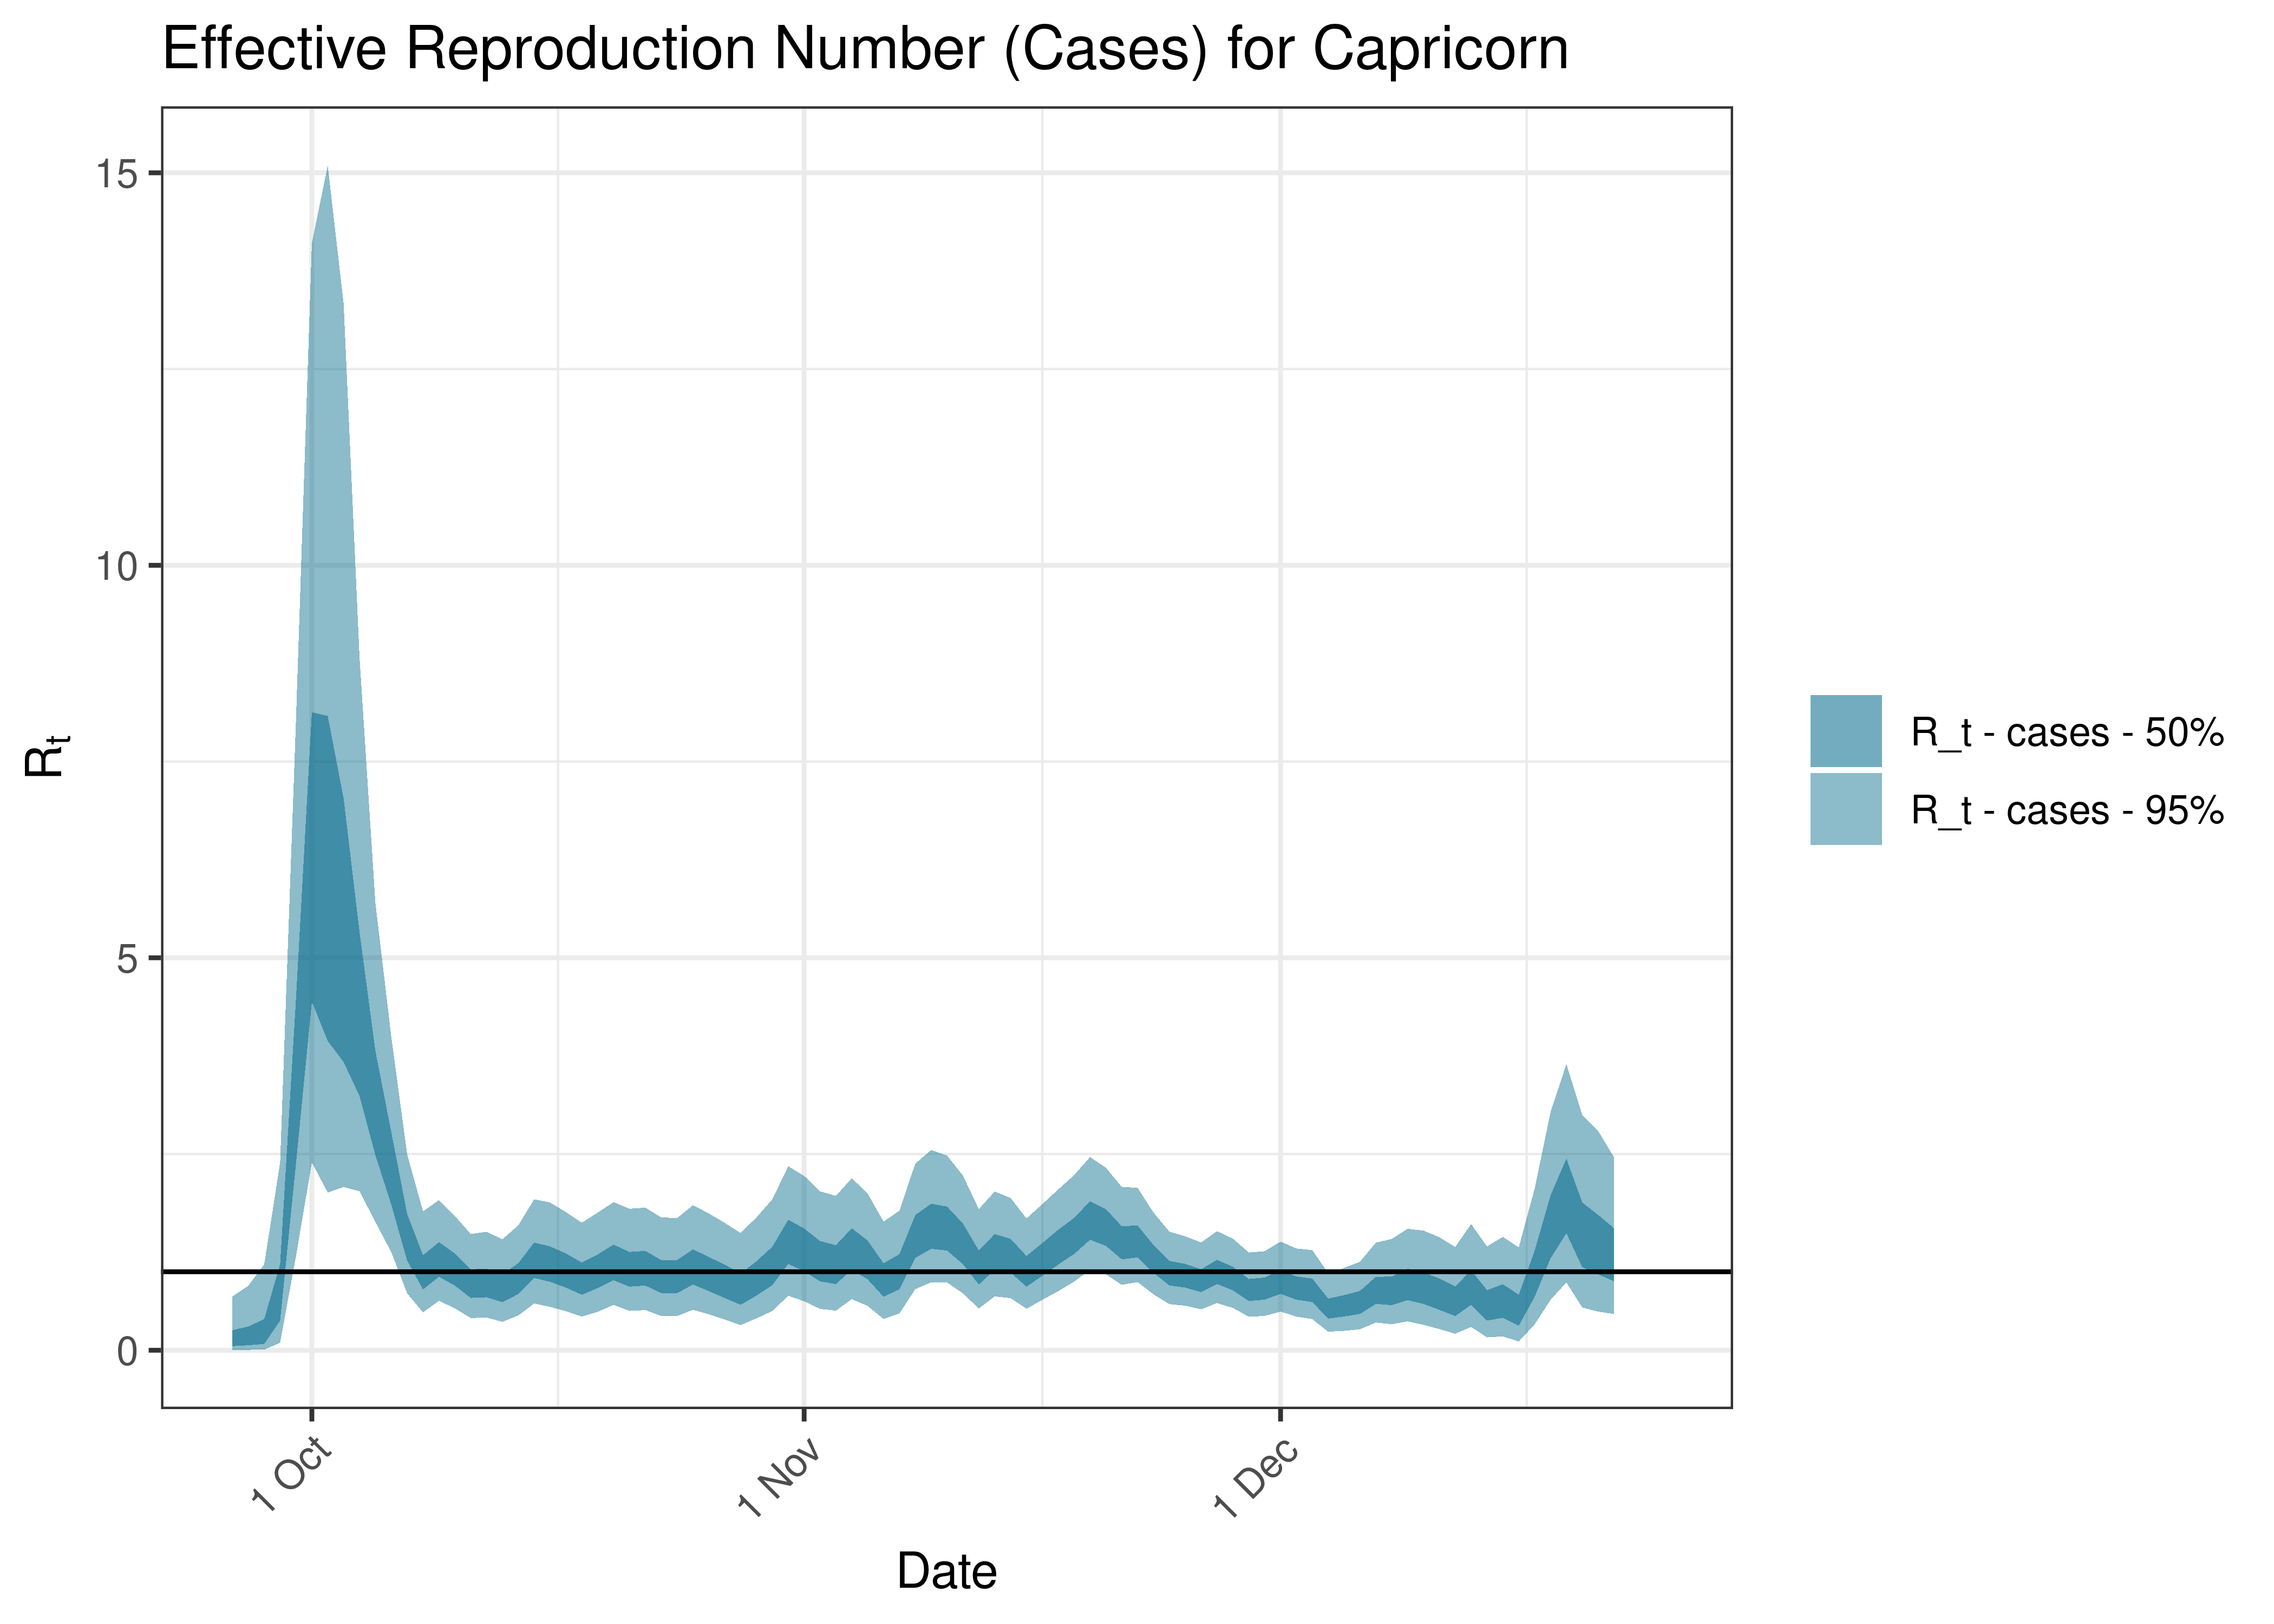
Estimated Effective Reproduction Number Based on Cases for Capricorn over last 90 days
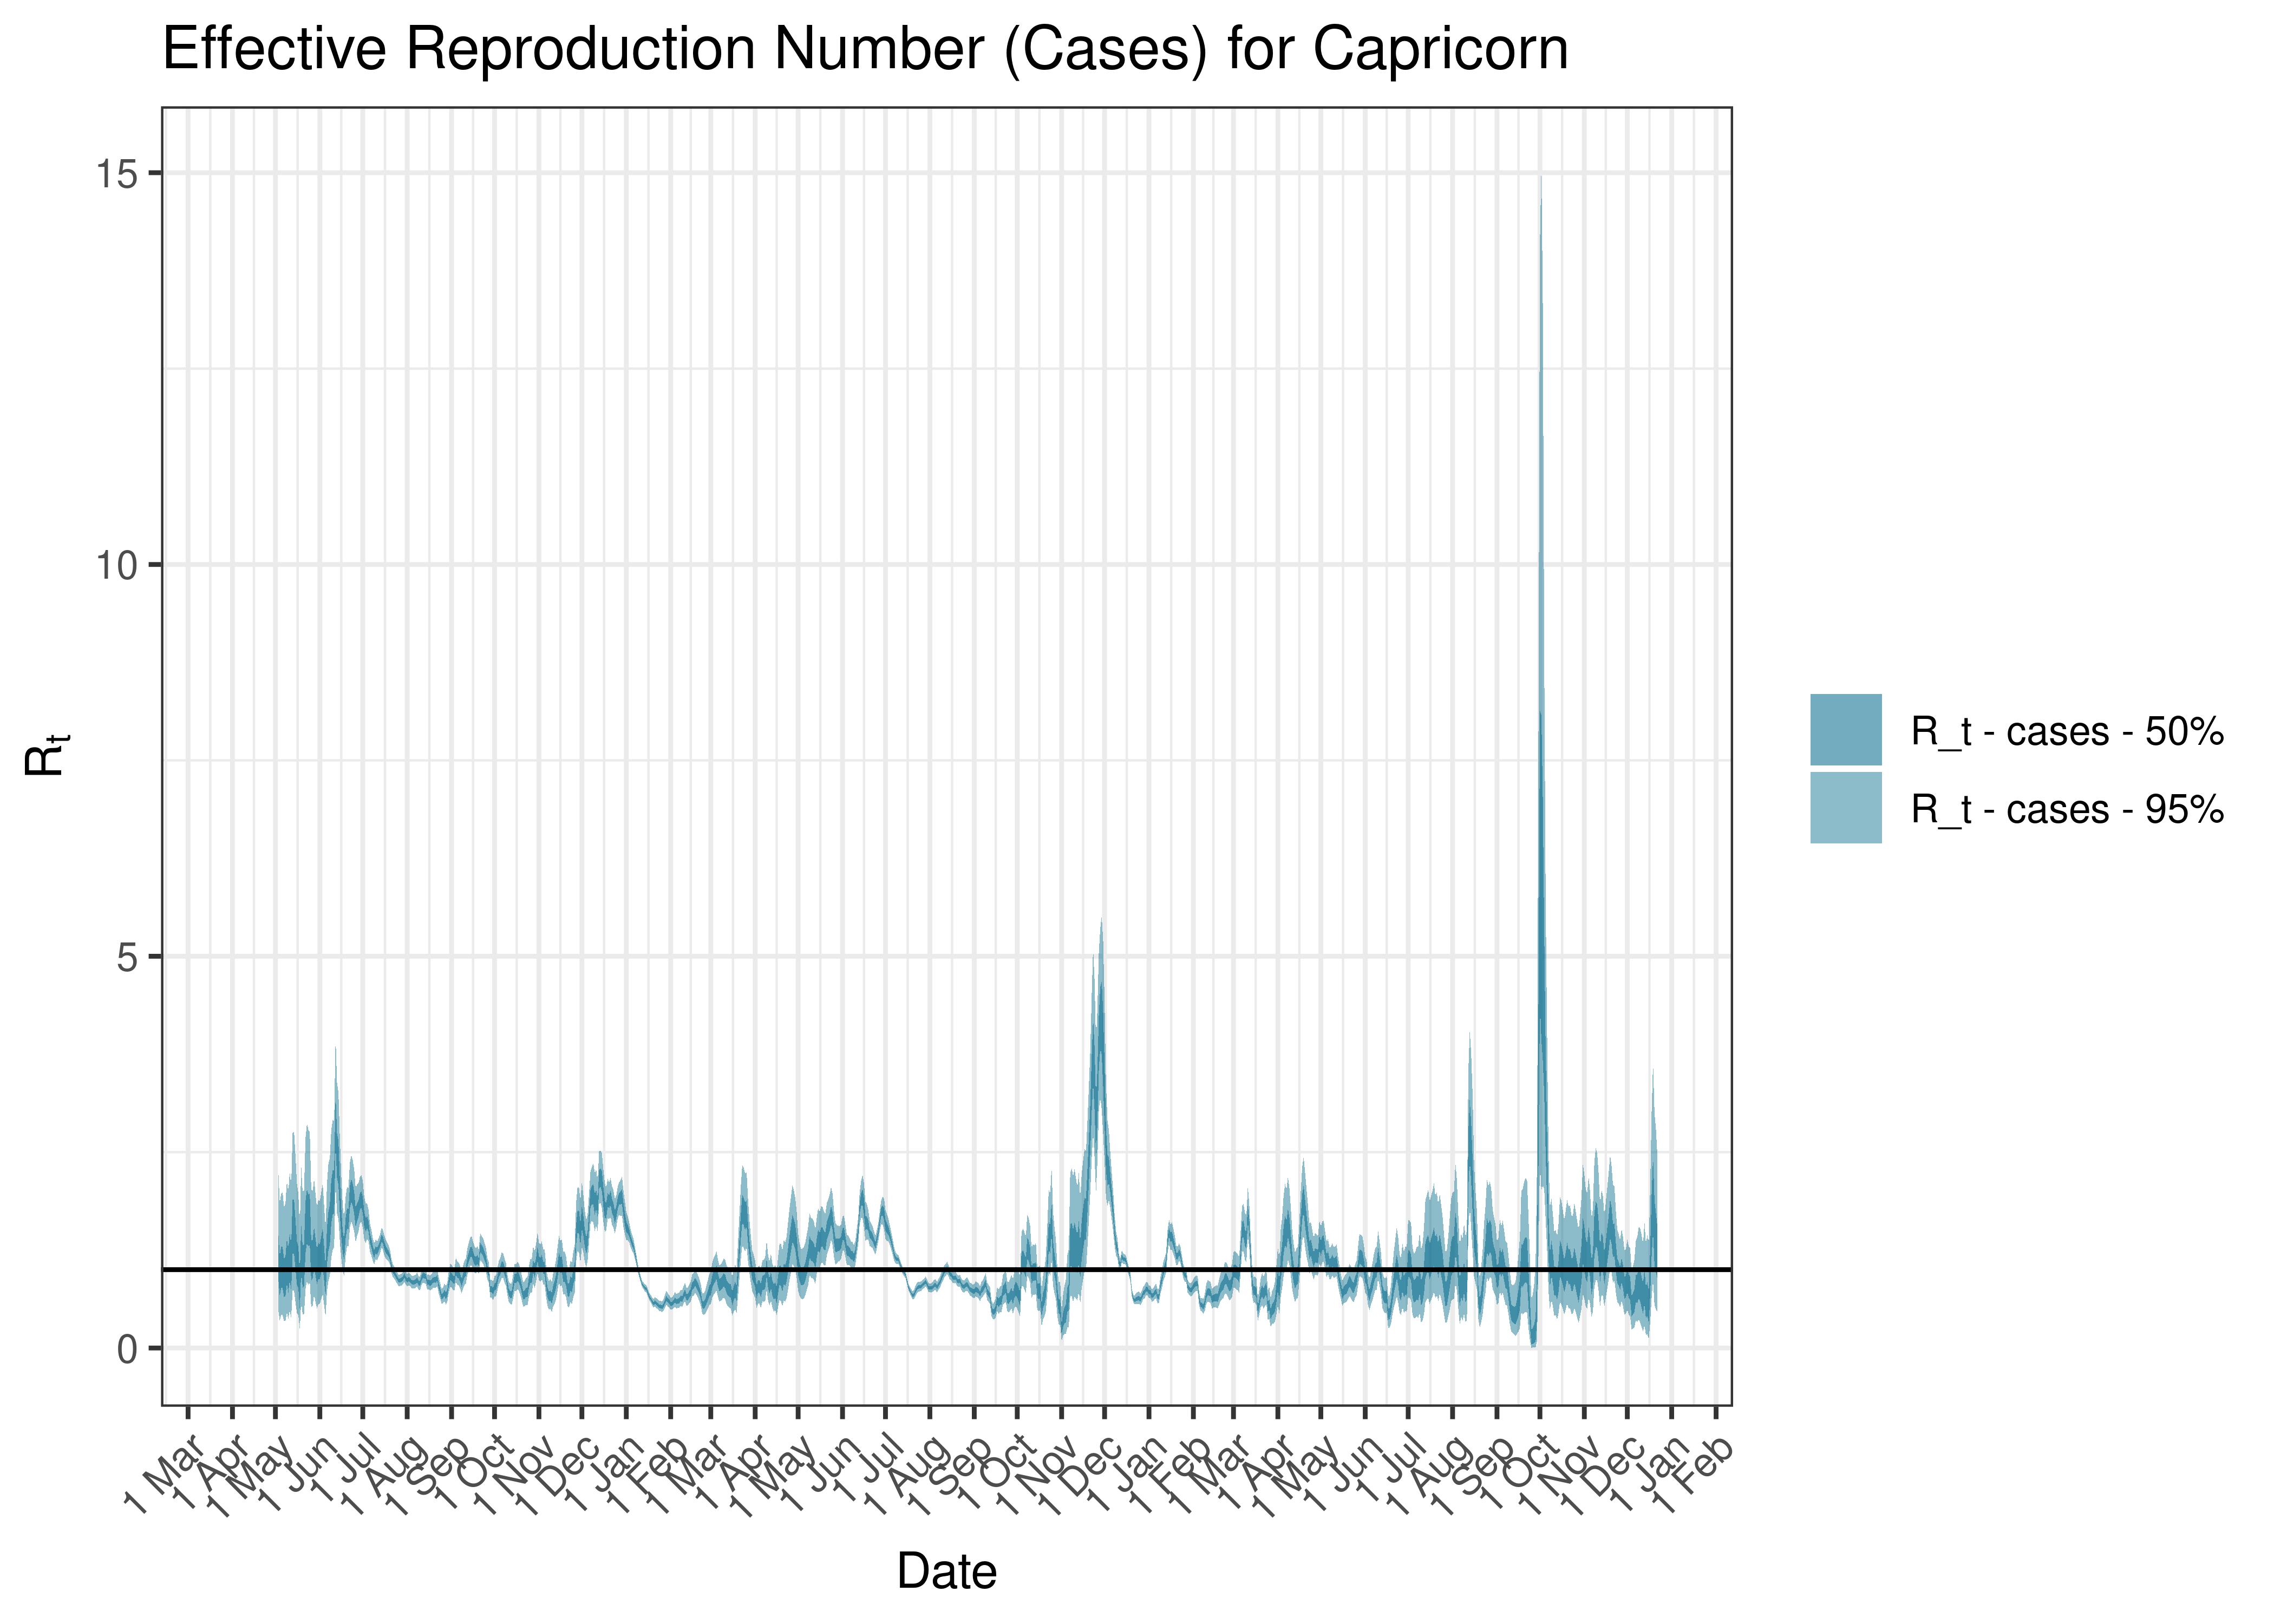
Estimated Effective Reproduction Number Based on Cases for Capricorn since 1 April 2020
6.6.9 Mopani
6.6.9.1 Cases
Cases are tabulated by specimen received date below. Cases include estimates for late reporting in recent days as well as adjustments for any public holidays. A centred 7-day moving average is also shown. The peak daily cases in previous waves (as measured by the moving average) is also shown.
| Specimen Received Date | Cases | 7-day Moving Average | Comment |
|---|---|---|---|
| 2020-07-20 | 75 | 54 | Wave 1 Peak |
| 2021-01-10 | 169 | 353 | Wave 2 Peak |
| 2021-07-10 | 128 | 209 | Wave 3 Peak |
| 2021-12-16 | 217 | 161 | Wave 4 Peak |
| 2022-06-20 | 32 | 26 | Wave 5 Peak (to date) |
Below a 7-day moving average daily case count are plotted for Mopani on a log scale since start of the epidemic:
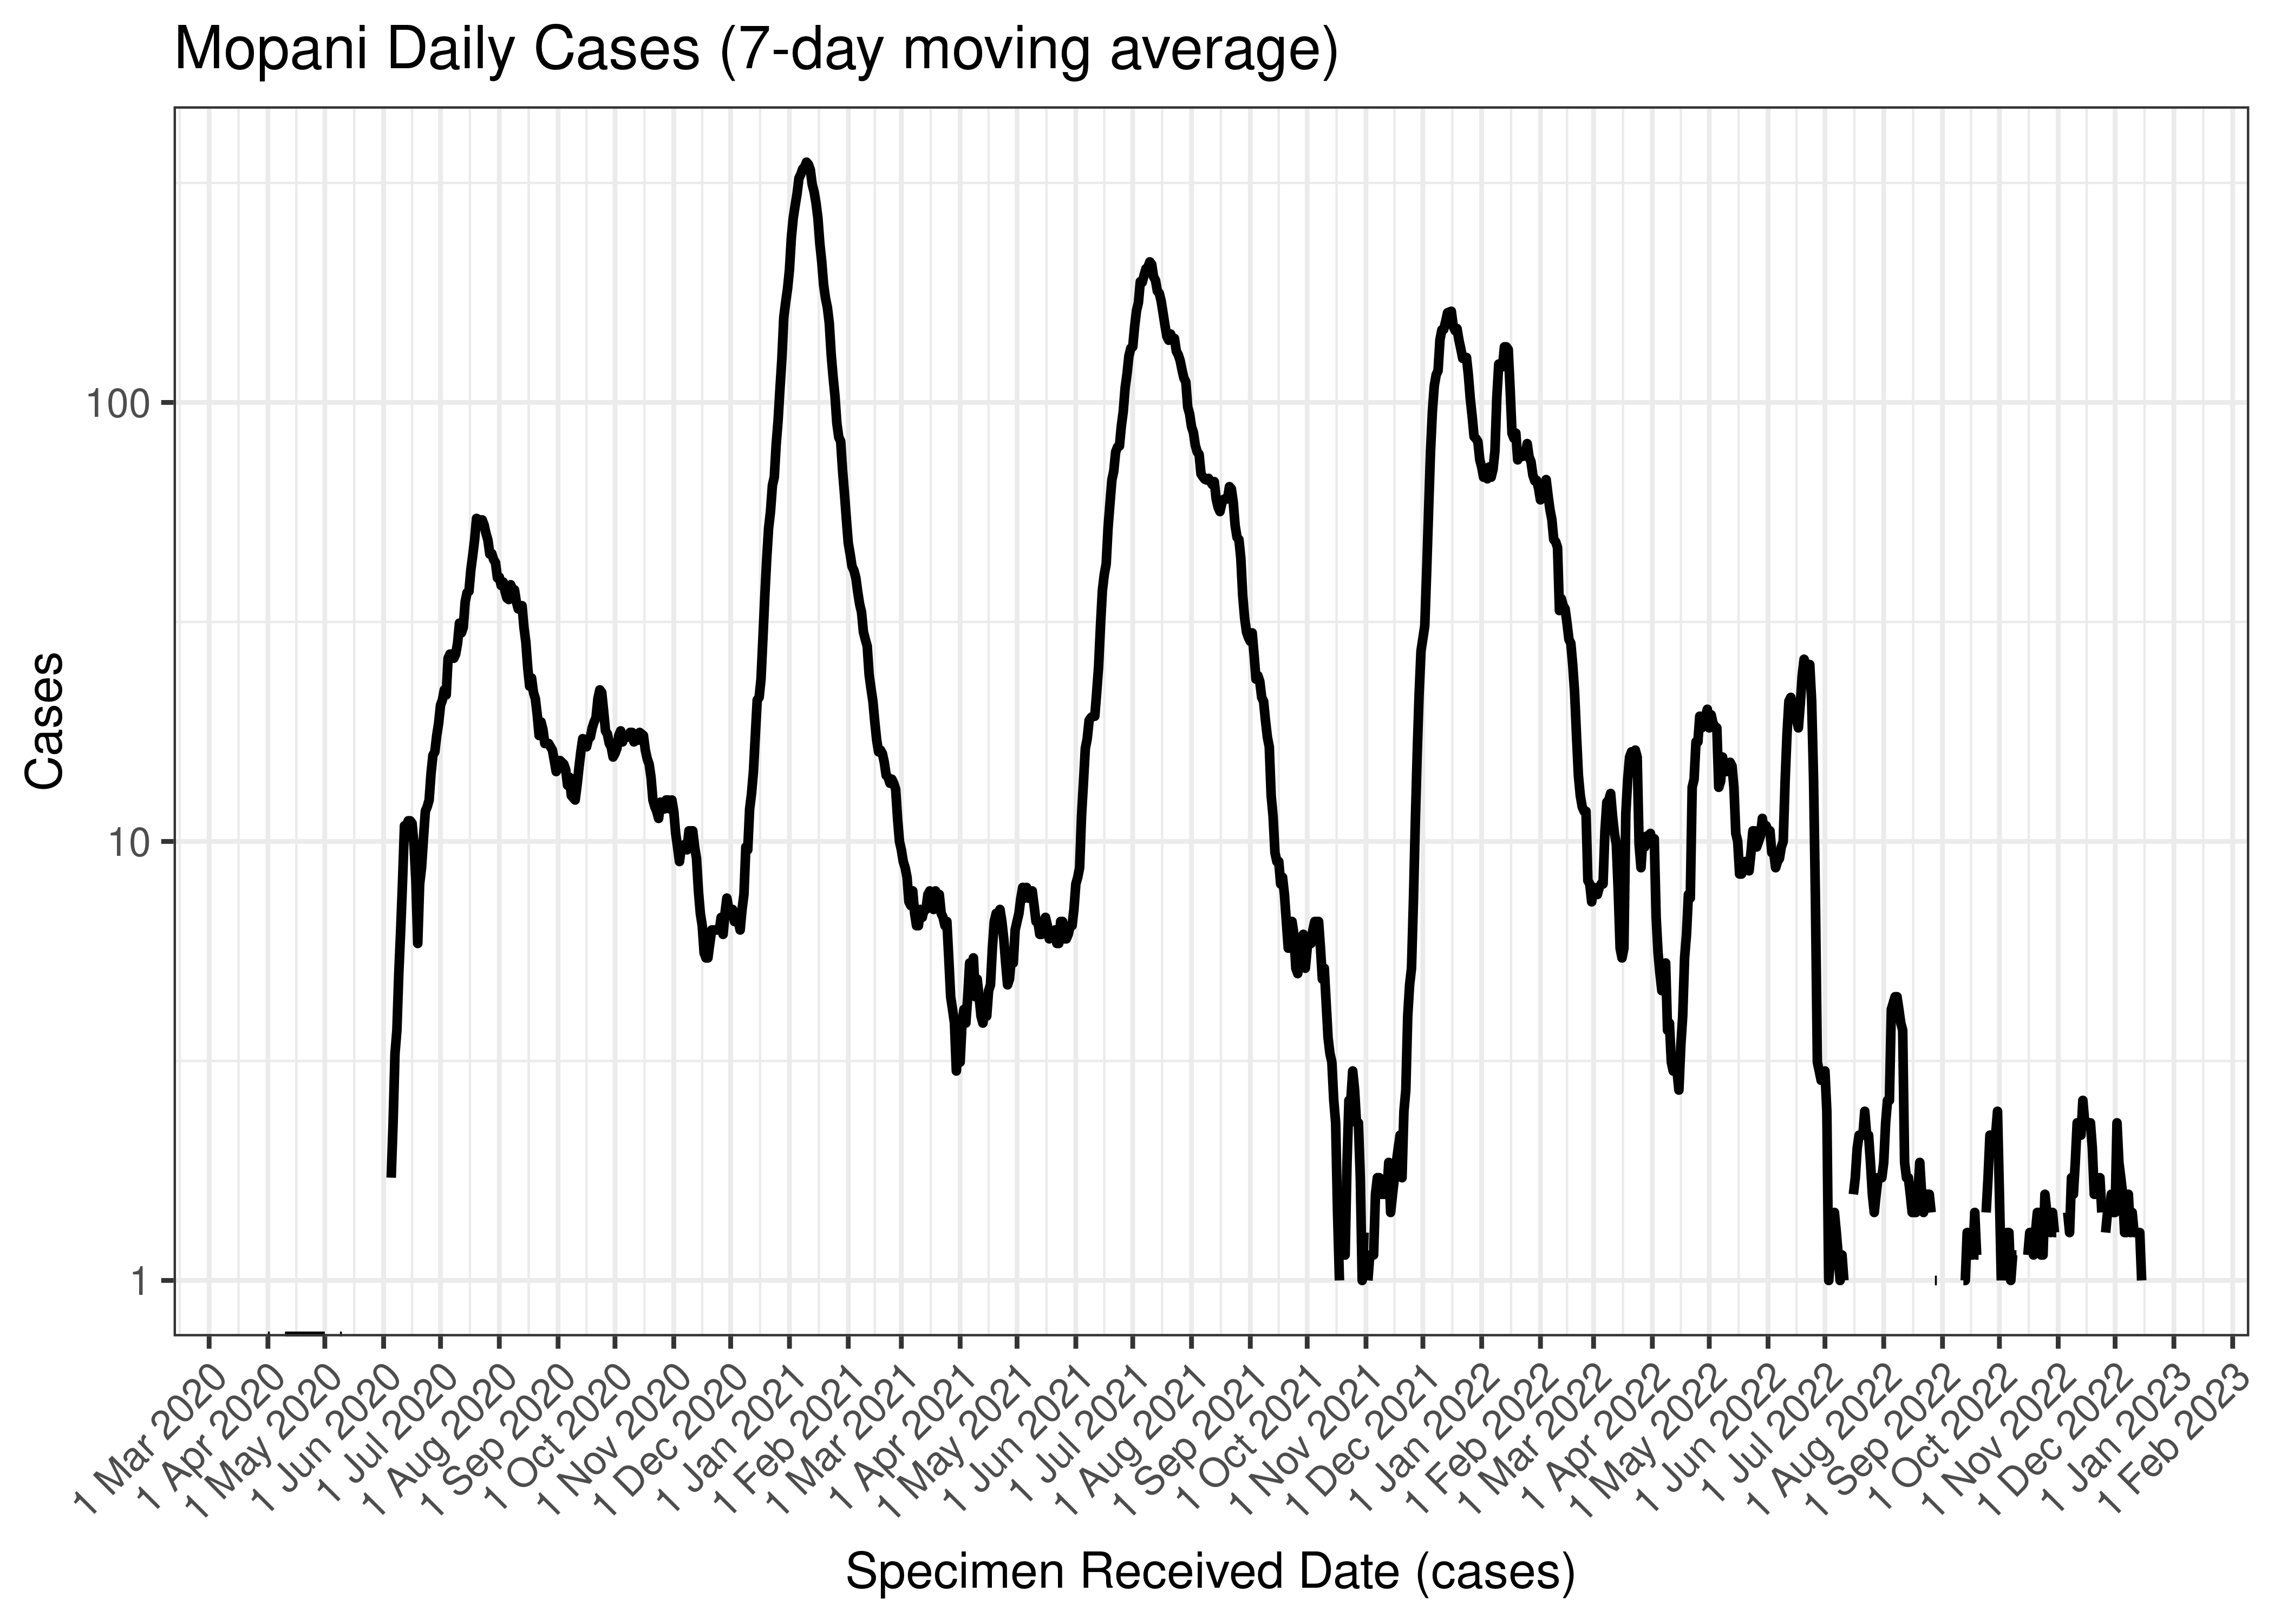
Mopani Daily Cases (7-day moving average)
Below the above chart is repeated for the last 30-days:

Mopani Daily Cases for Last 30-days (7-day moving average)
6.6.9.2 Reproduction Number
Below current (last weekly) reproduction number estimates are tabulated for Mopani.
| Count (Per Day) | Week Ending | Reproduction Number [95% Confidence Interval] | |
|---|---|---|---|
| Mopani | 0.7 | 2022-12-25 | 0.95 [0.34 - 1.85] |
Below the effective reproduction number for Mopani over the last 90 days are plotted together with a plot since start of the pandemic.
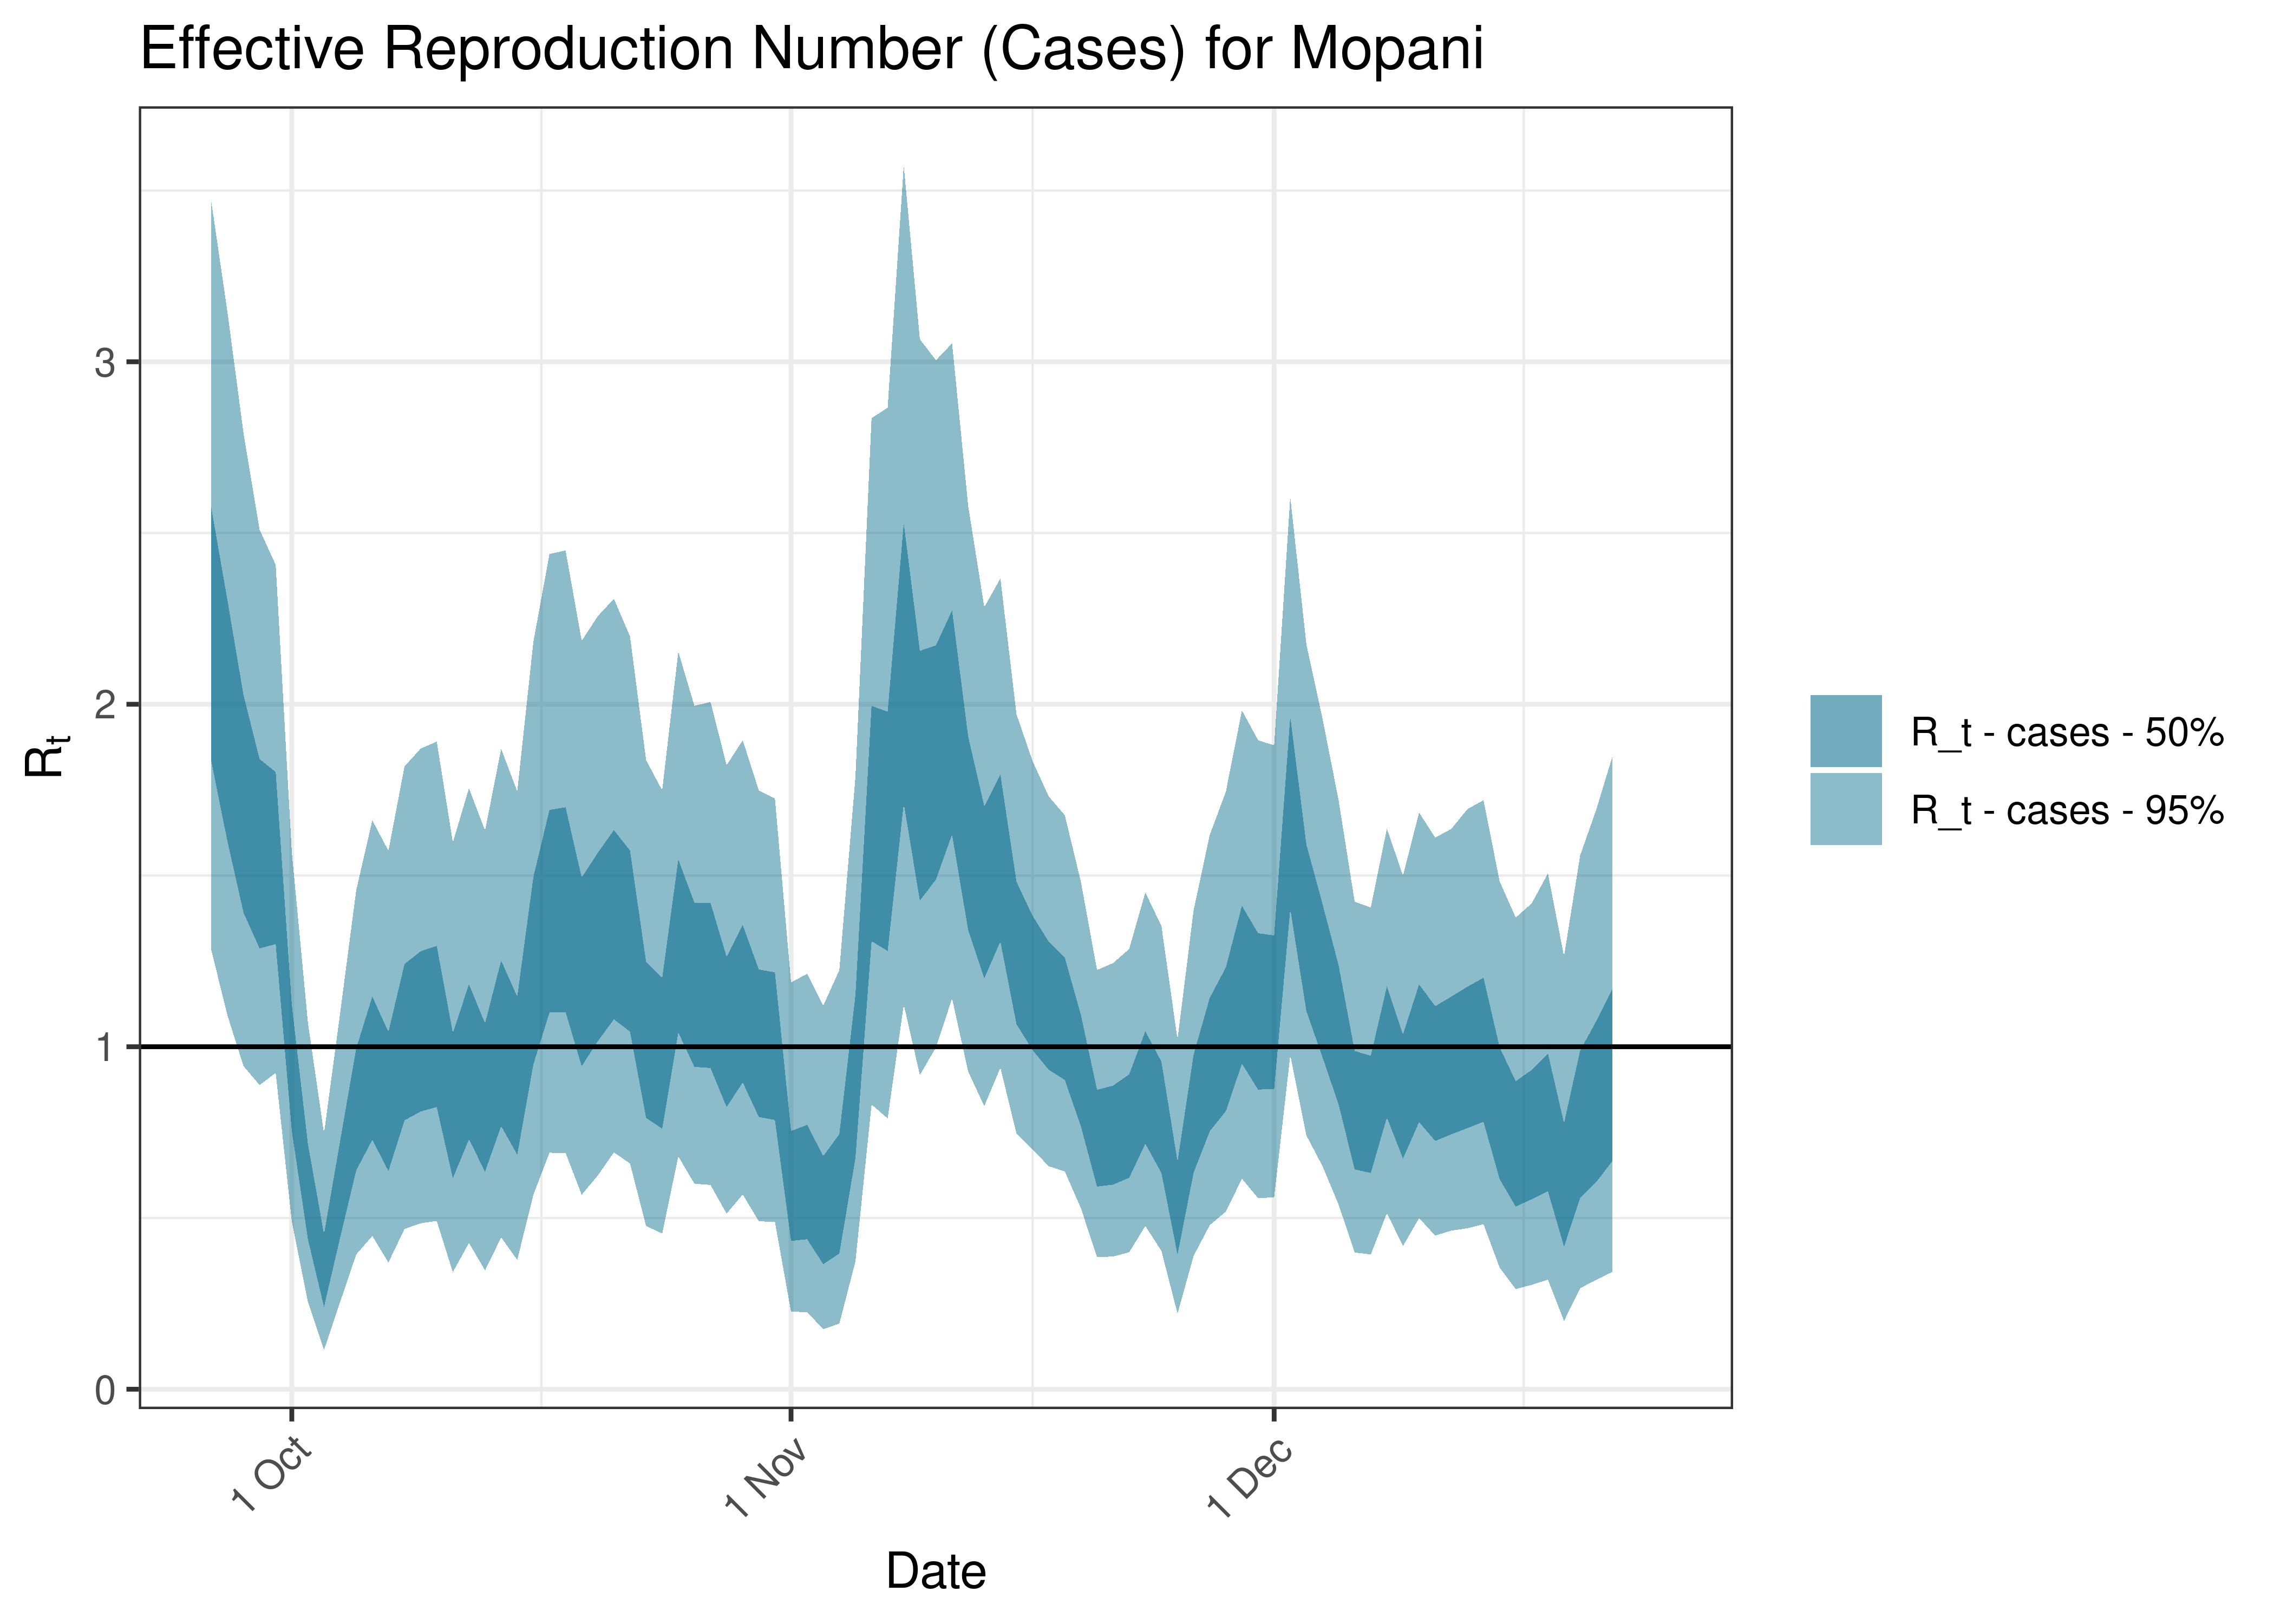
Estimated Effective Reproduction Number Based on Cases for Mopani over last 90 days
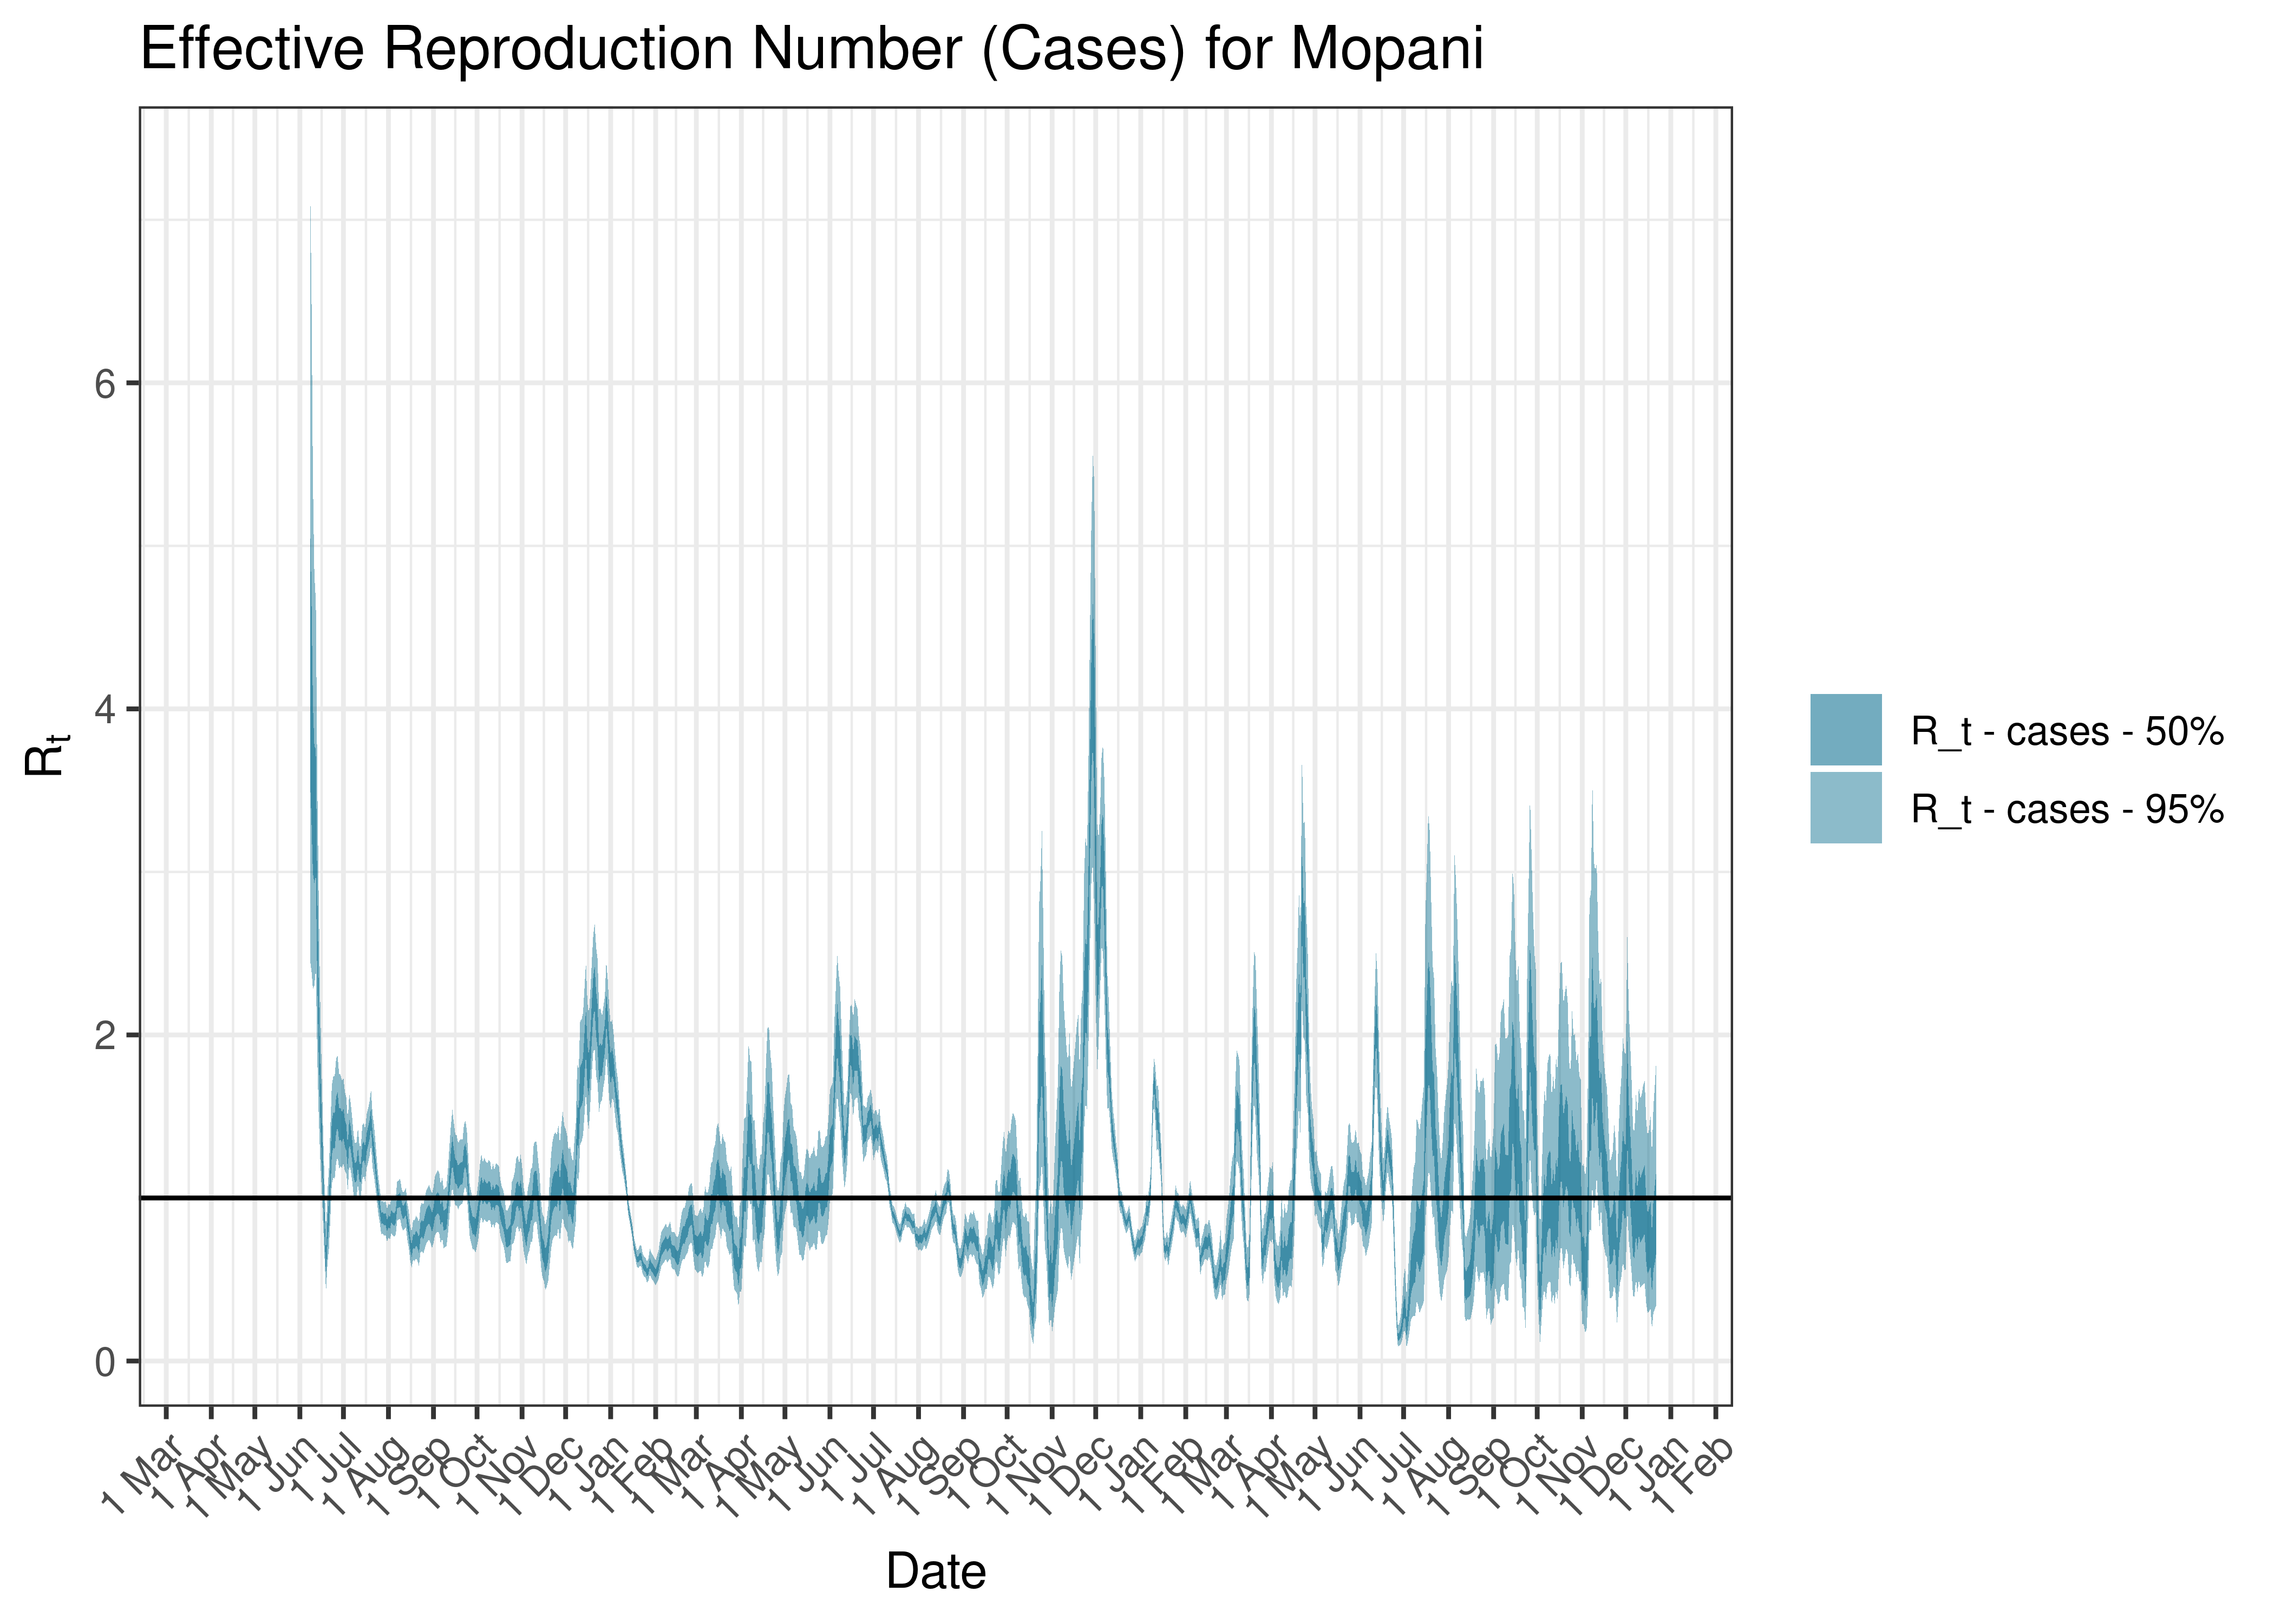
Estimated Effective Reproduction Number Based on Cases for Mopani since 1 April 2020
6.6.10 Sekhukhune
6.6.10.1 Cases
Cases are tabulated by specimen received date below. Cases include estimates for late reporting in recent days as well as adjustments for any public holidays. A centred 7-day moving average is also shown. The peak daily cases in previous waves (as measured by the moving average) is also shown.
| Specimen Received Date | Cases | 7-day Moving Average | Comment |
|---|---|---|---|
| 2020-07-19 | 14 | 44 | Wave 1 Peak |
| 2021-01-11 | 143 | 149 | Wave 2 Peak |
| 2021-07-08 | 289 | 226 | Wave 3 Peak |
| 2021-12-11 | 34 | 98 | Wave 4 Peak |
| 2022-05-01 | 2 | 11 | Wave 5 Peak (to date) |
Below a 7-day moving average daily case count are plotted for Sekhukhune on a log scale since start of the epidemic:
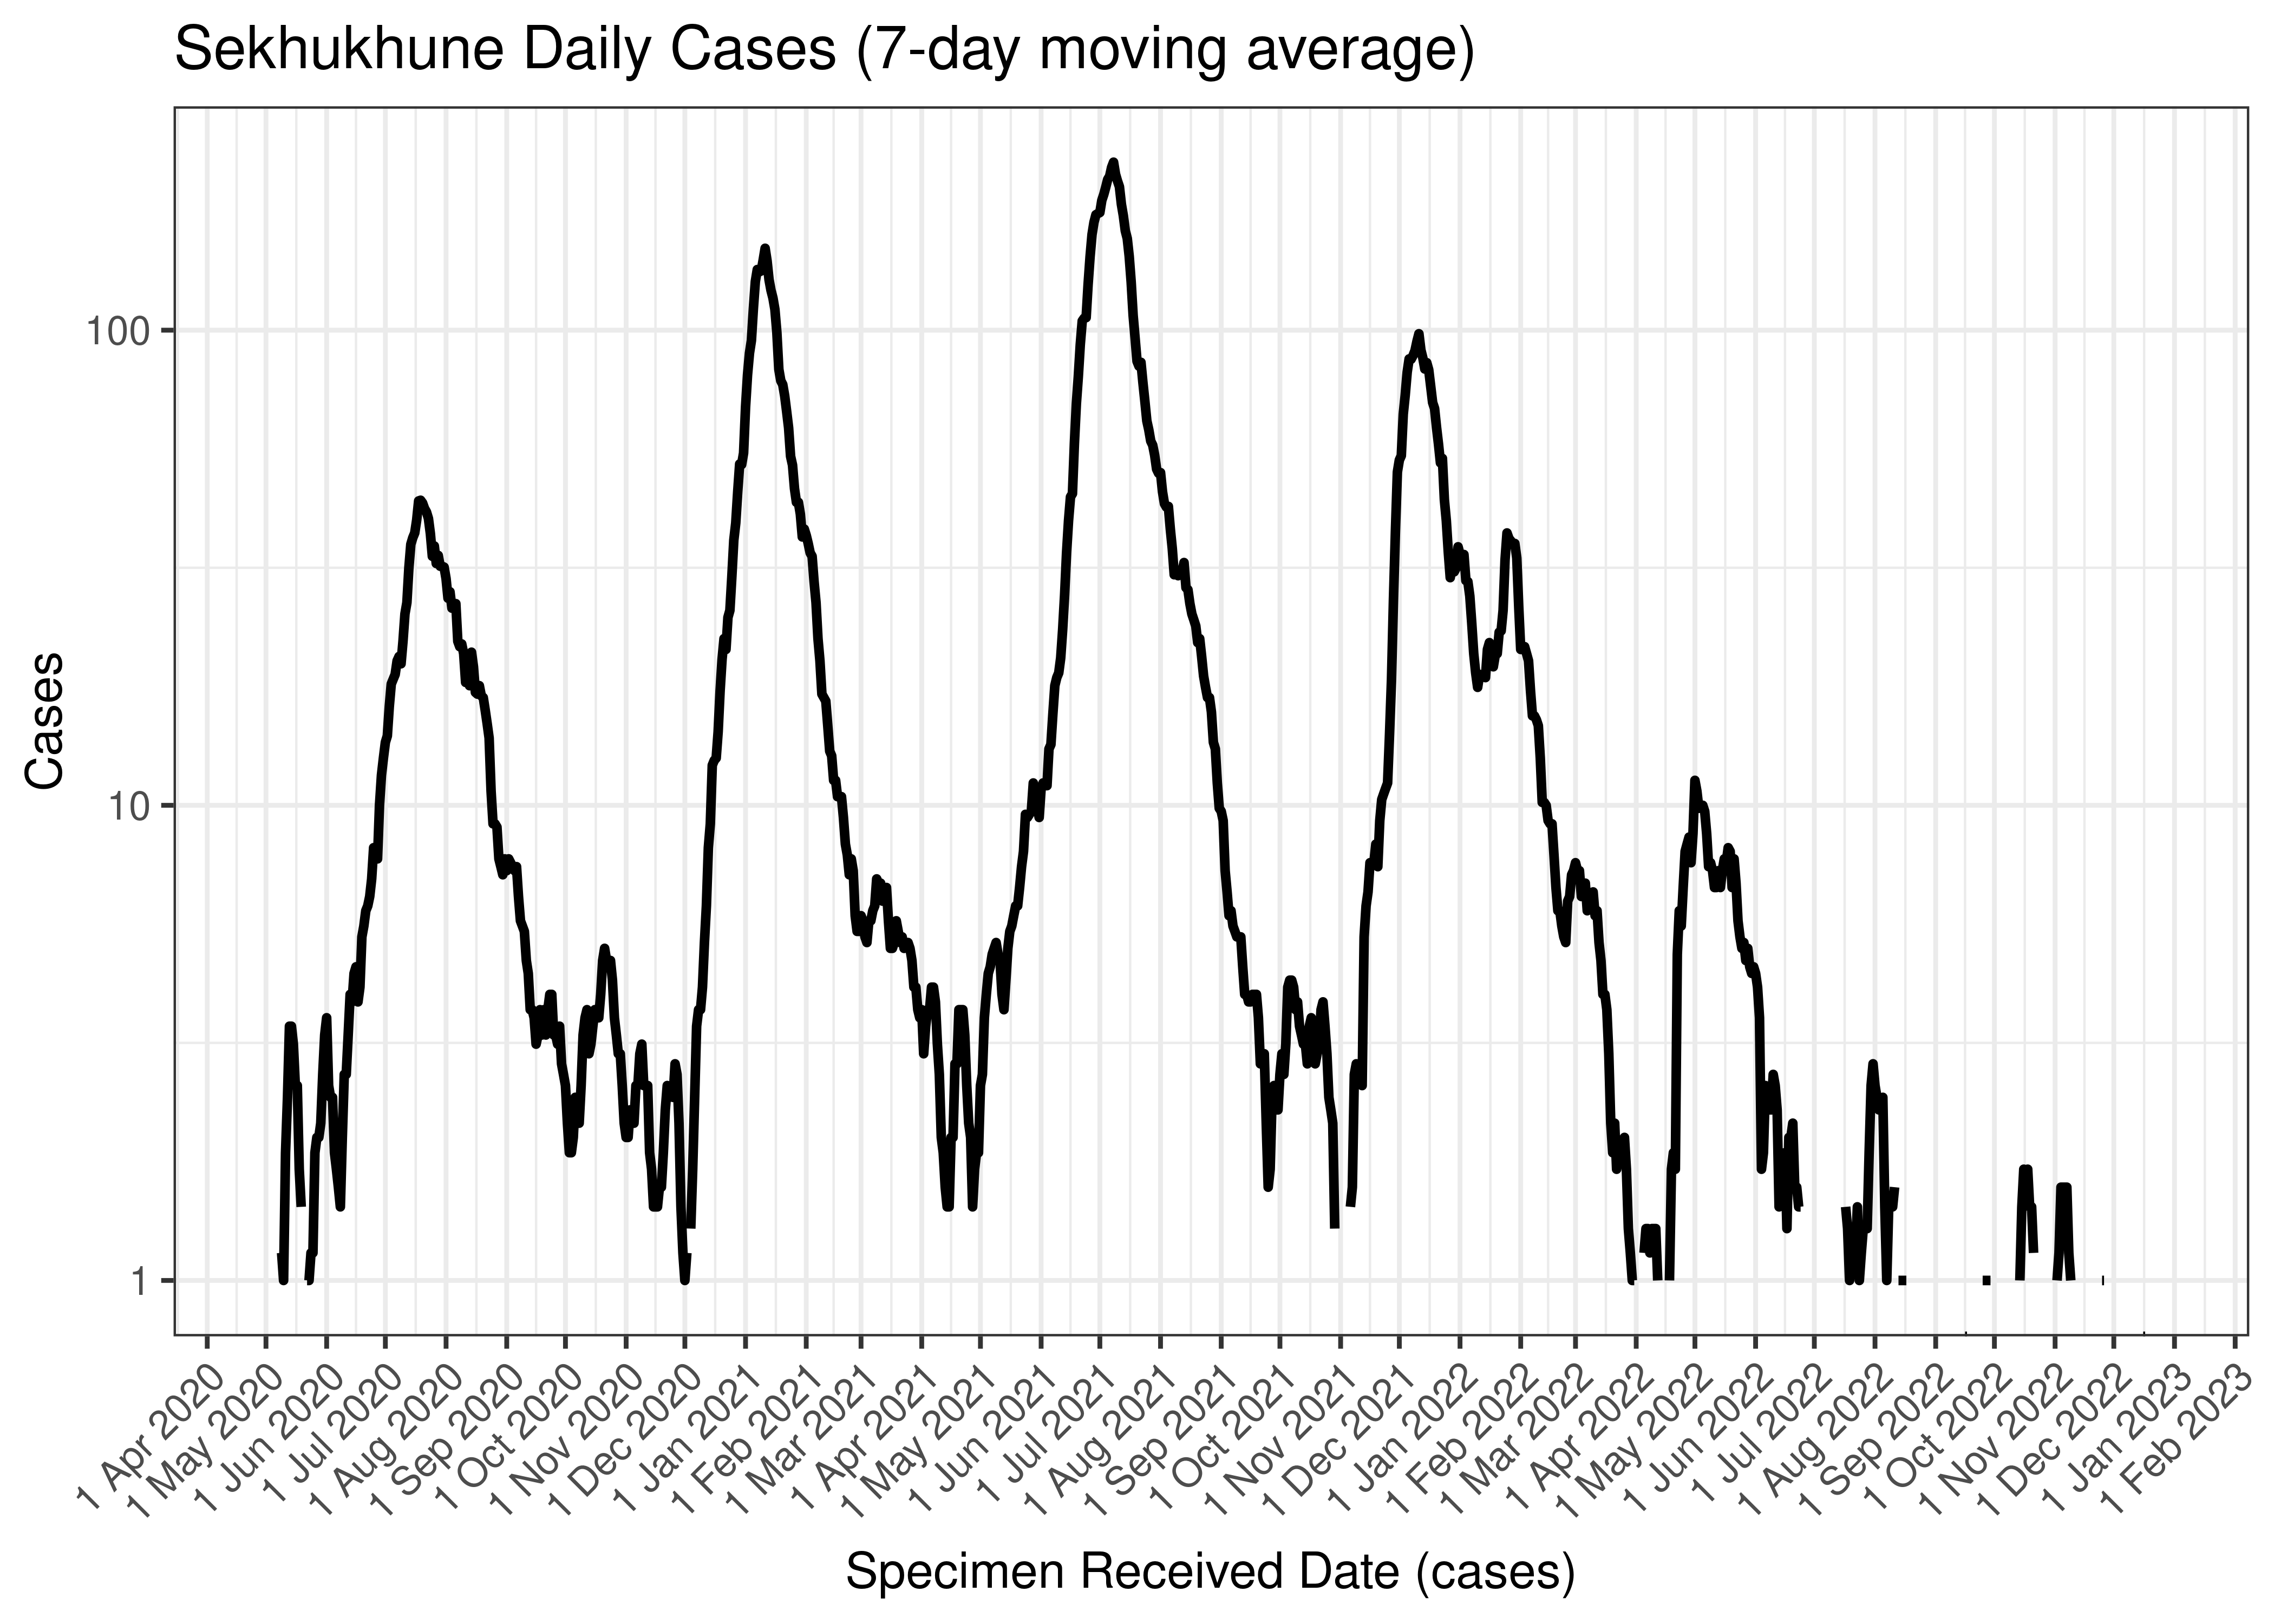
Sekhukhune Daily Cases (7-day moving average)
Below the above chart is repeated for the last 30-days:

Sekhukhune Daily Cases for Last 30-days (7-day moving average)
6.6.10.2 Reproduction Number
Below current (last weekly) reproduction number estimates are tabulated for Sekhukhune.
| Count (Per Day) | Week Ending | Reproduction Number [95% Confidence Interval] | |
|---|---|---|---|
| Sekhukhune | 0.1 | 2022-12-25 | 2.24 [0.27 - 6.36] |
Below the effective reproduction number for Sekhukhune over the last 90 days are plotted together with a plot since start of the pandemic.
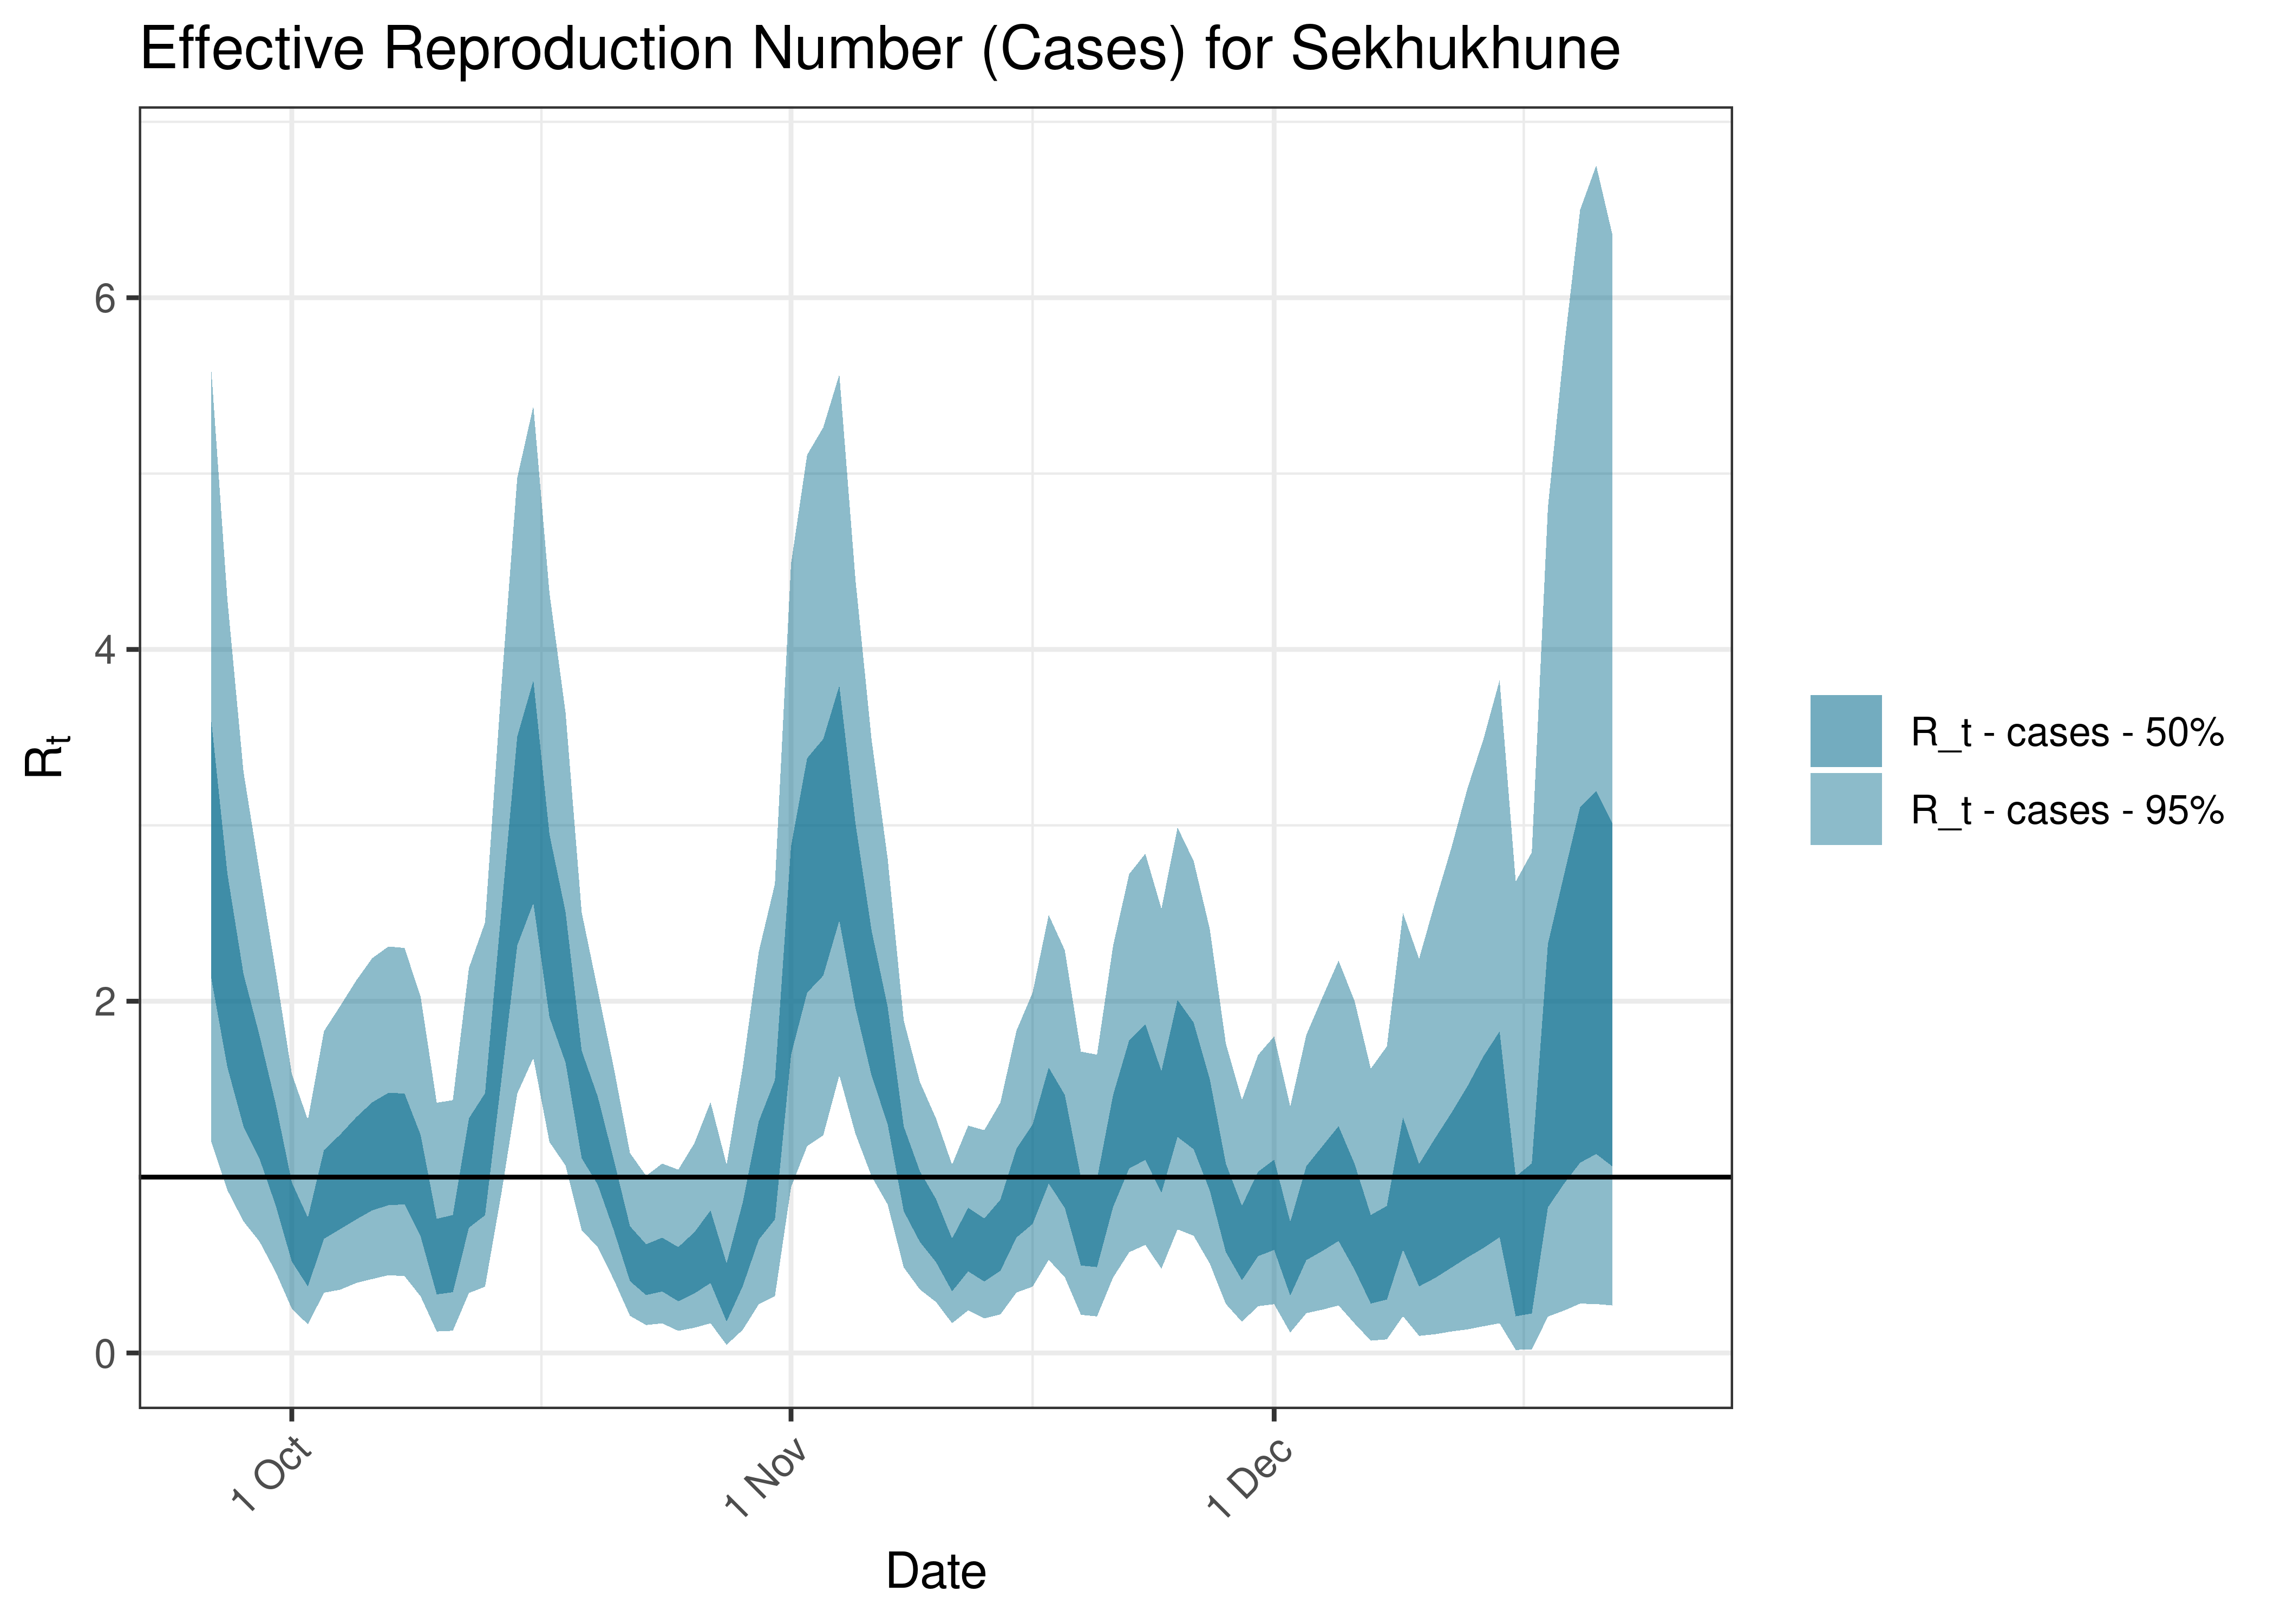
Estimated Effective Reproduction Number Based on Cases for Sekhukhune over last 90 days
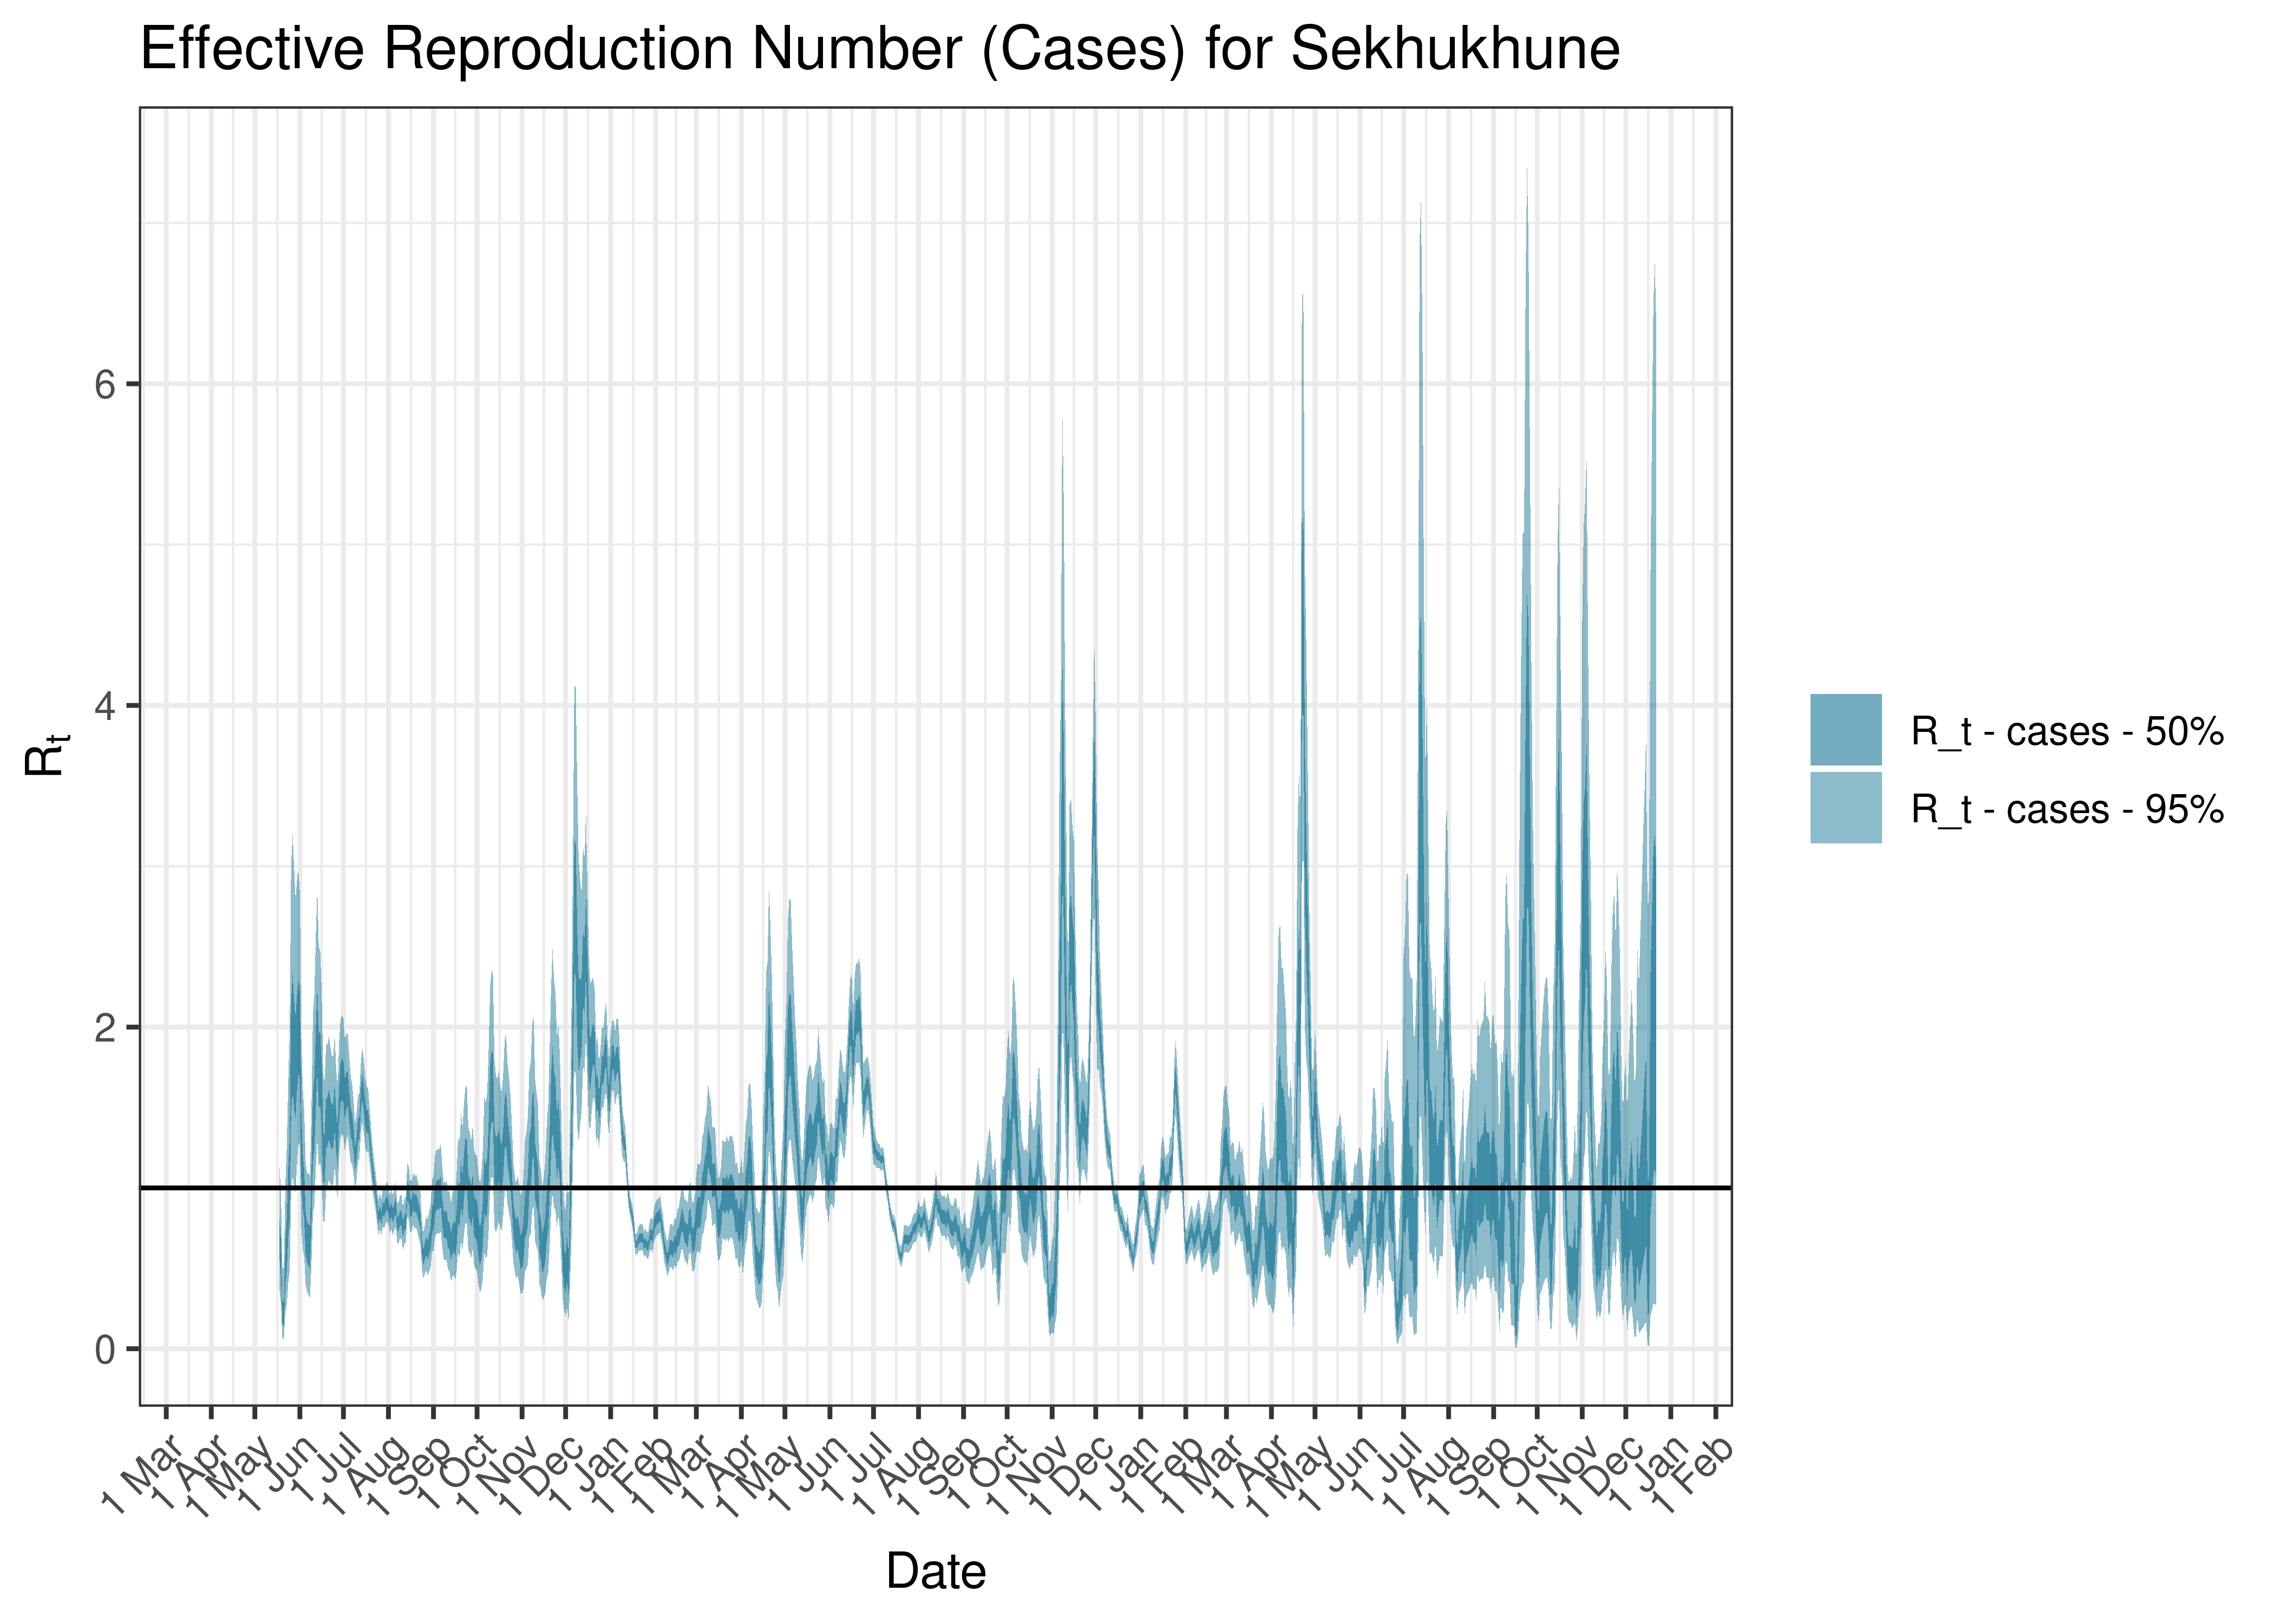
Estimated Effective Reproduction Number Based on Cases for Sekhukhune since 1 April 2020
6.6.11 Vhembe
6.6.11.1 Cases
Cases are tabulated by specimen received date below. Cases include estimates for late reporting in recent days as well as adjustments for any public holidays. A centred 7-day moving average is also shown. The peak daily cases in previous waves (as measured by the moving average) is also shown.
| Specimen Received Date | Cases | 7-day Moving Average | Comment |
|---|---|---|---|
| 2020-08-03 | 50 | 32 | Wave 1 Peak |
| 2021-01-08 | 312 | 334 | Wave 2 Peak |
| 2021-07-09 | 326 | 278 | Wave 3 Peak |
| 2021-12-13 | 179 | 147 | Wave 4 Peak |
| 2022-05-22 | 5 | 16 | Wave 5 Peak (to date) |
Below a 7-day moving average daily case count are plotted for Vhembe on a log scale since start of the epidemic:
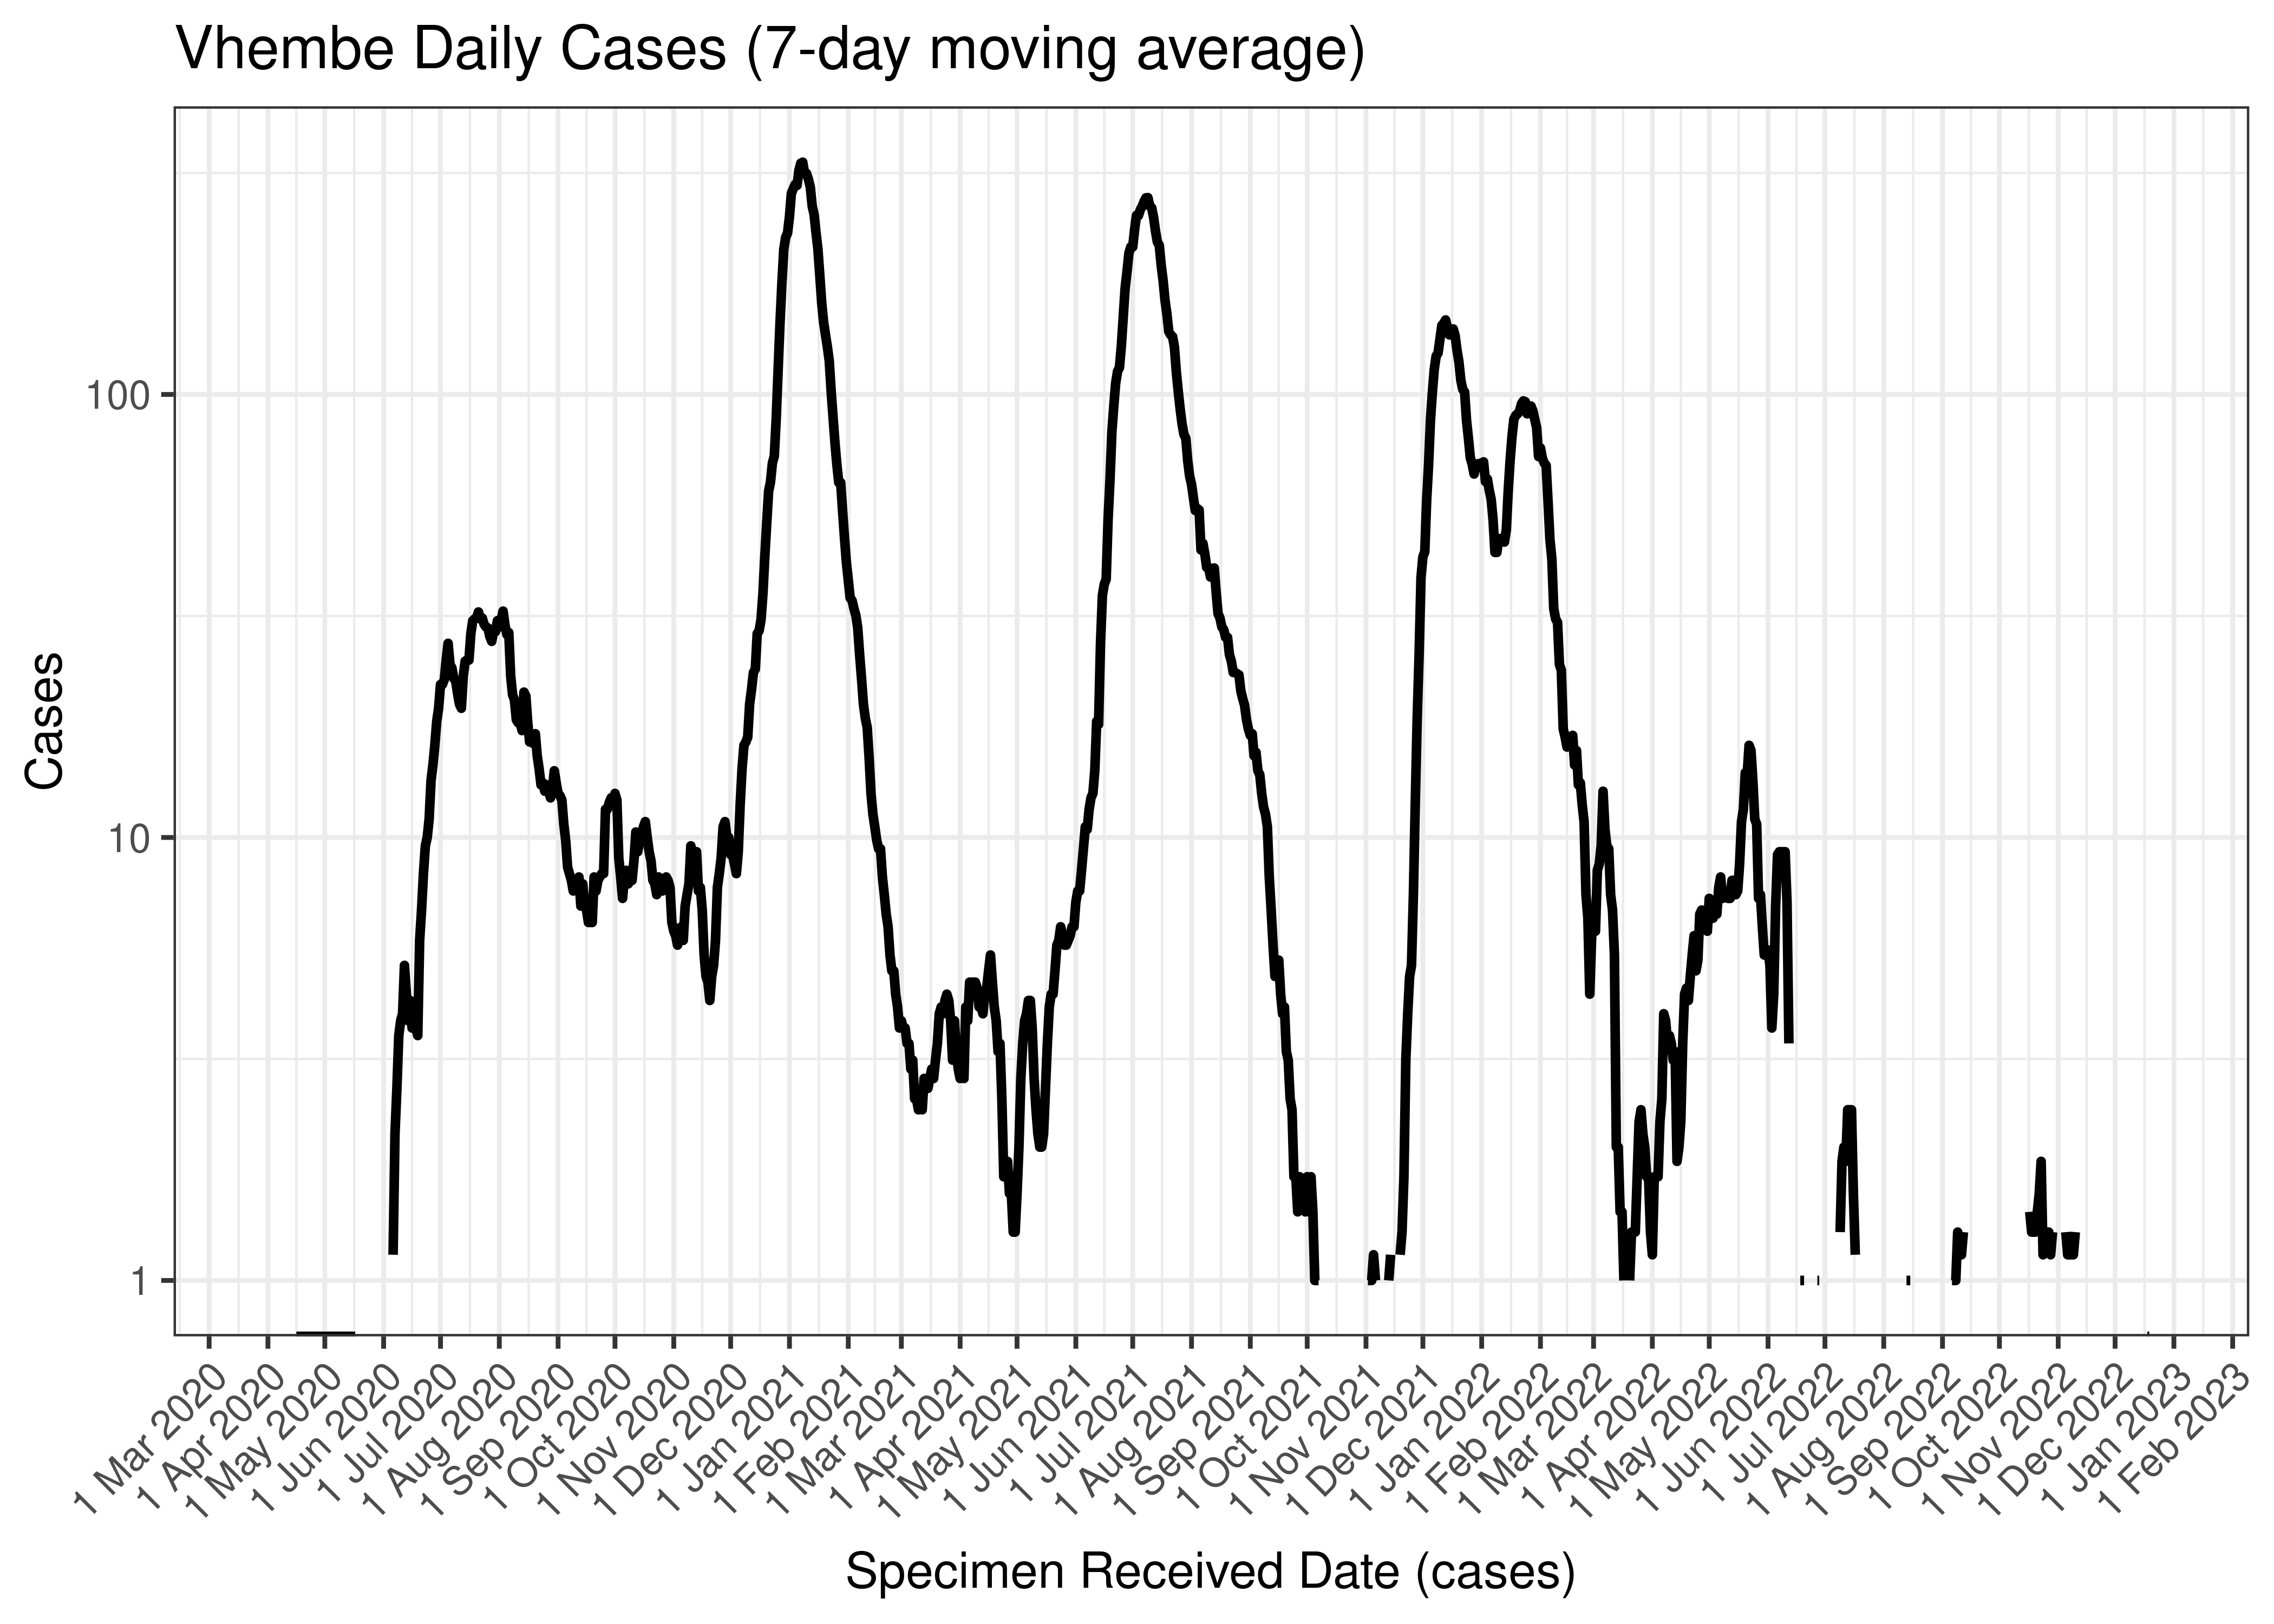
Vhembe Daily Cases (7-day moving average)
Below the above chart is repeated for the last 30-days:

Vhembe Daily Cases for Last 30-days (7-day moving average)
6.6.11.2 Reproduction Number
Below current (last weekly) reproduction number estimates are tabulated for Vhembe.
| Count (Per Day) | Week Ending | Reproduction Number [95% Confidence Interval] | |
|---|---|---|---|
| Vhembe | 0.7 | 2022-12-25 | 2.14 [0.76 - 4.30] |
Below the effective reproduction number for Vhembe over the last 90 days are plotted together with a plot since start of the pandemic.
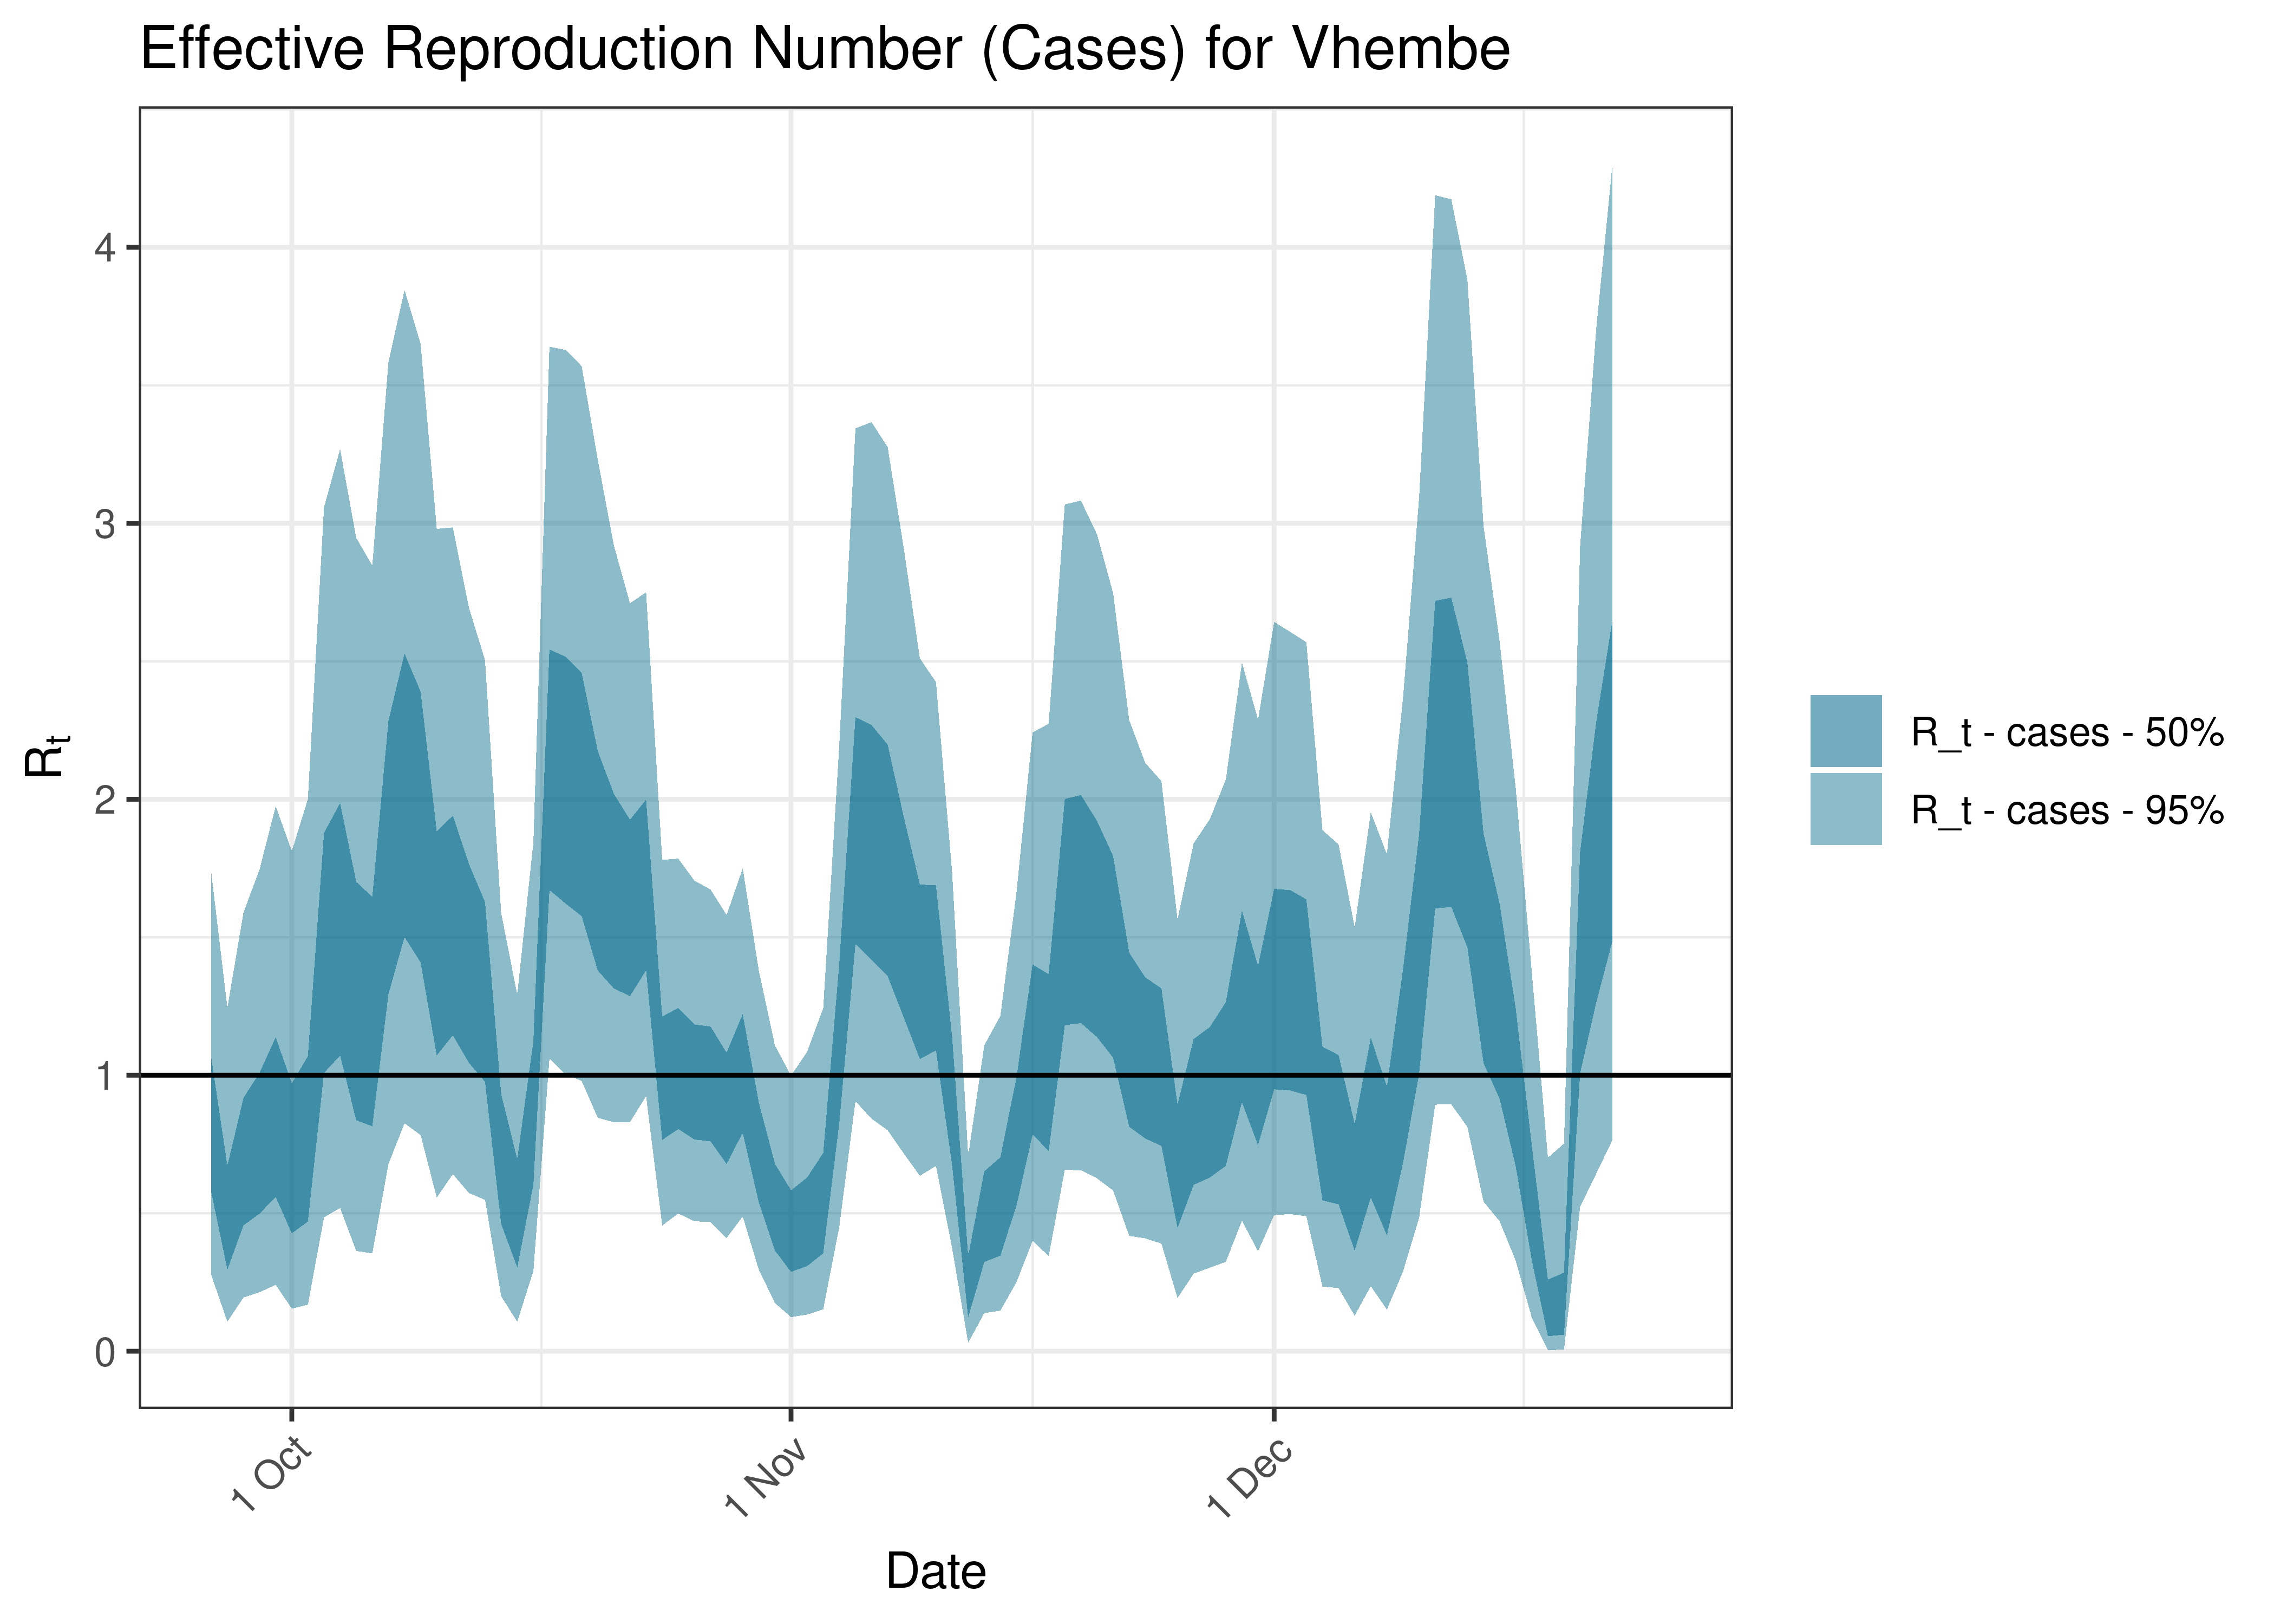
Estimated Effective Reproduction Number Based on Cases for Vhembe over last 90 days
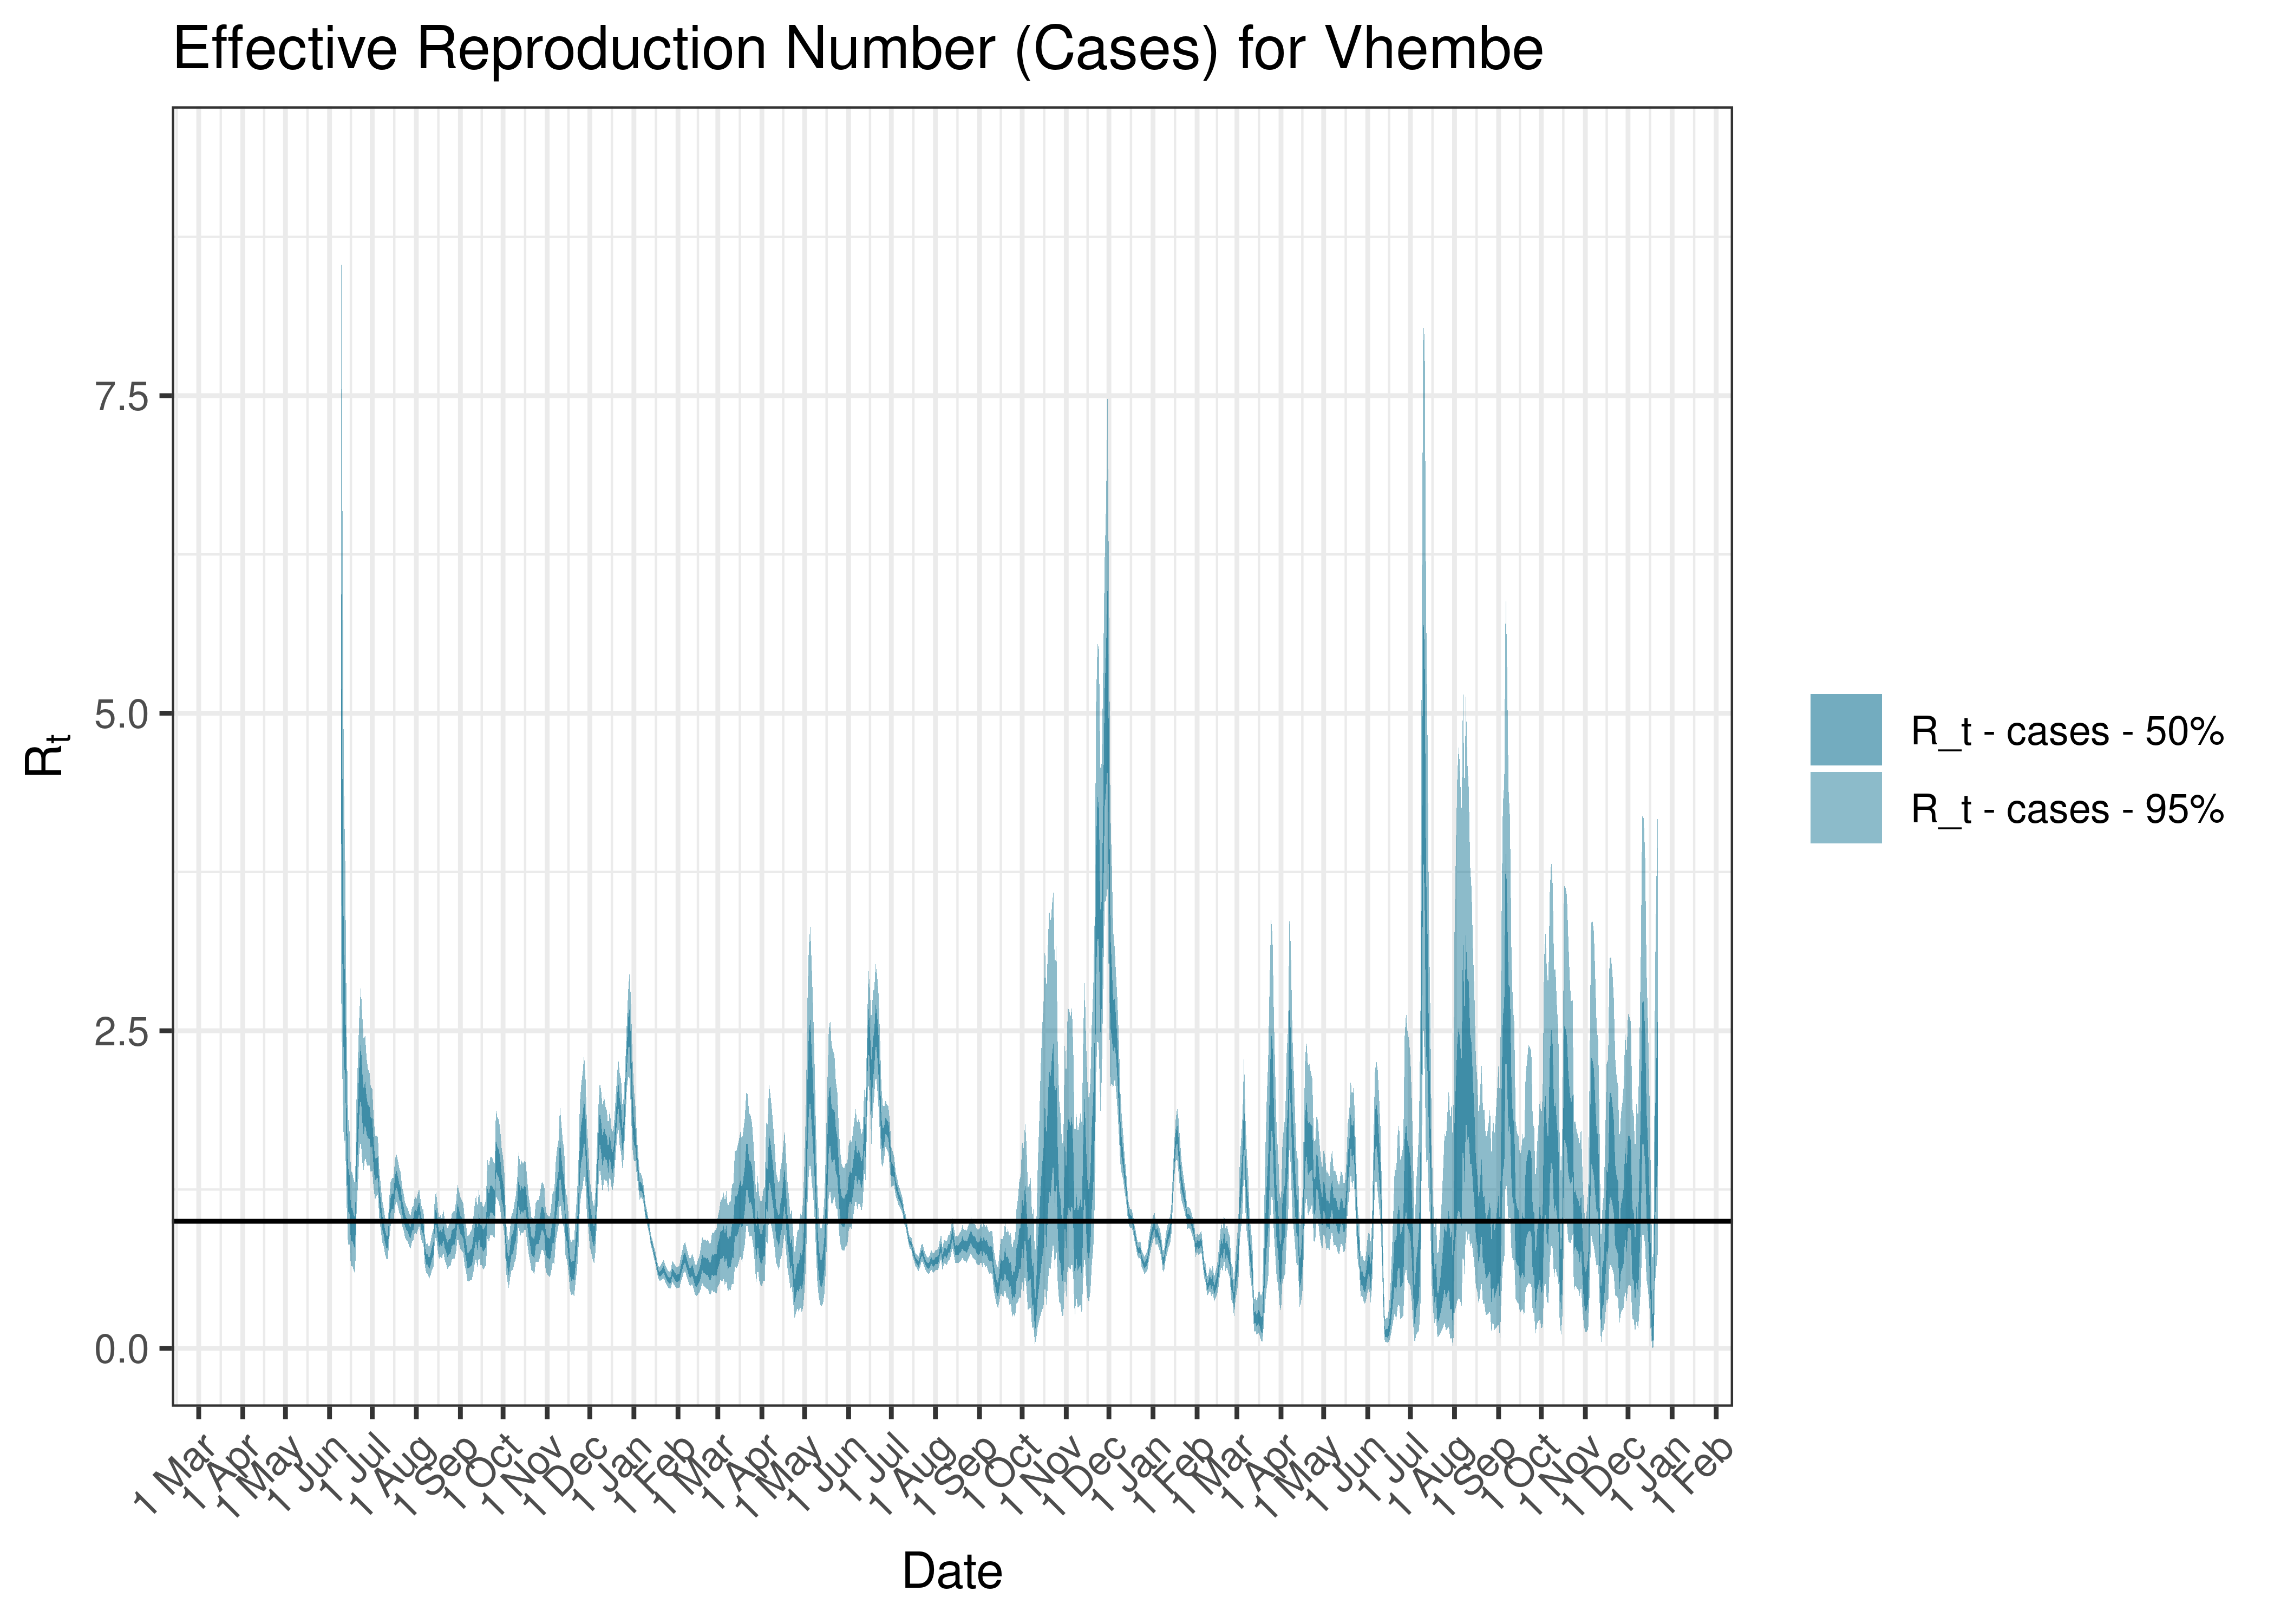
Estimated Effective Reproduction Number Based on Cases for Vhembe since 1 April 2020
6.6.12 Waterberg
6.6.12.1 Cases
Cases are tabulated by specimen received date below. Cases include estimates for late reporting in recent days as well as adjustments for any public holidays. A centred 7-day moving average is also shown. The peak daily cases in previous waves (as measured by the moving average) is also shown.
| Specimen Received Date | Cases | 7-day Moving Average | Comment |
|---|---|---|---|
| 2020-07-15 | 113 | 89 | Wave 1 Peak |
| 2021-01-07 | 288 | 293 | Wave 2 Peak |
| 2021-07-08 | 535 | 461 | Wave 3 Peak |
| 2021-12-10 | 297 | 265 | Wave 4 Peak |
| 2022-05-08 | 5 | 24 | Wave 5 Peak (to date) |
Below a 7-day moving average daily case count are plotted for Waterberg on a log scale since start of the epidemic:
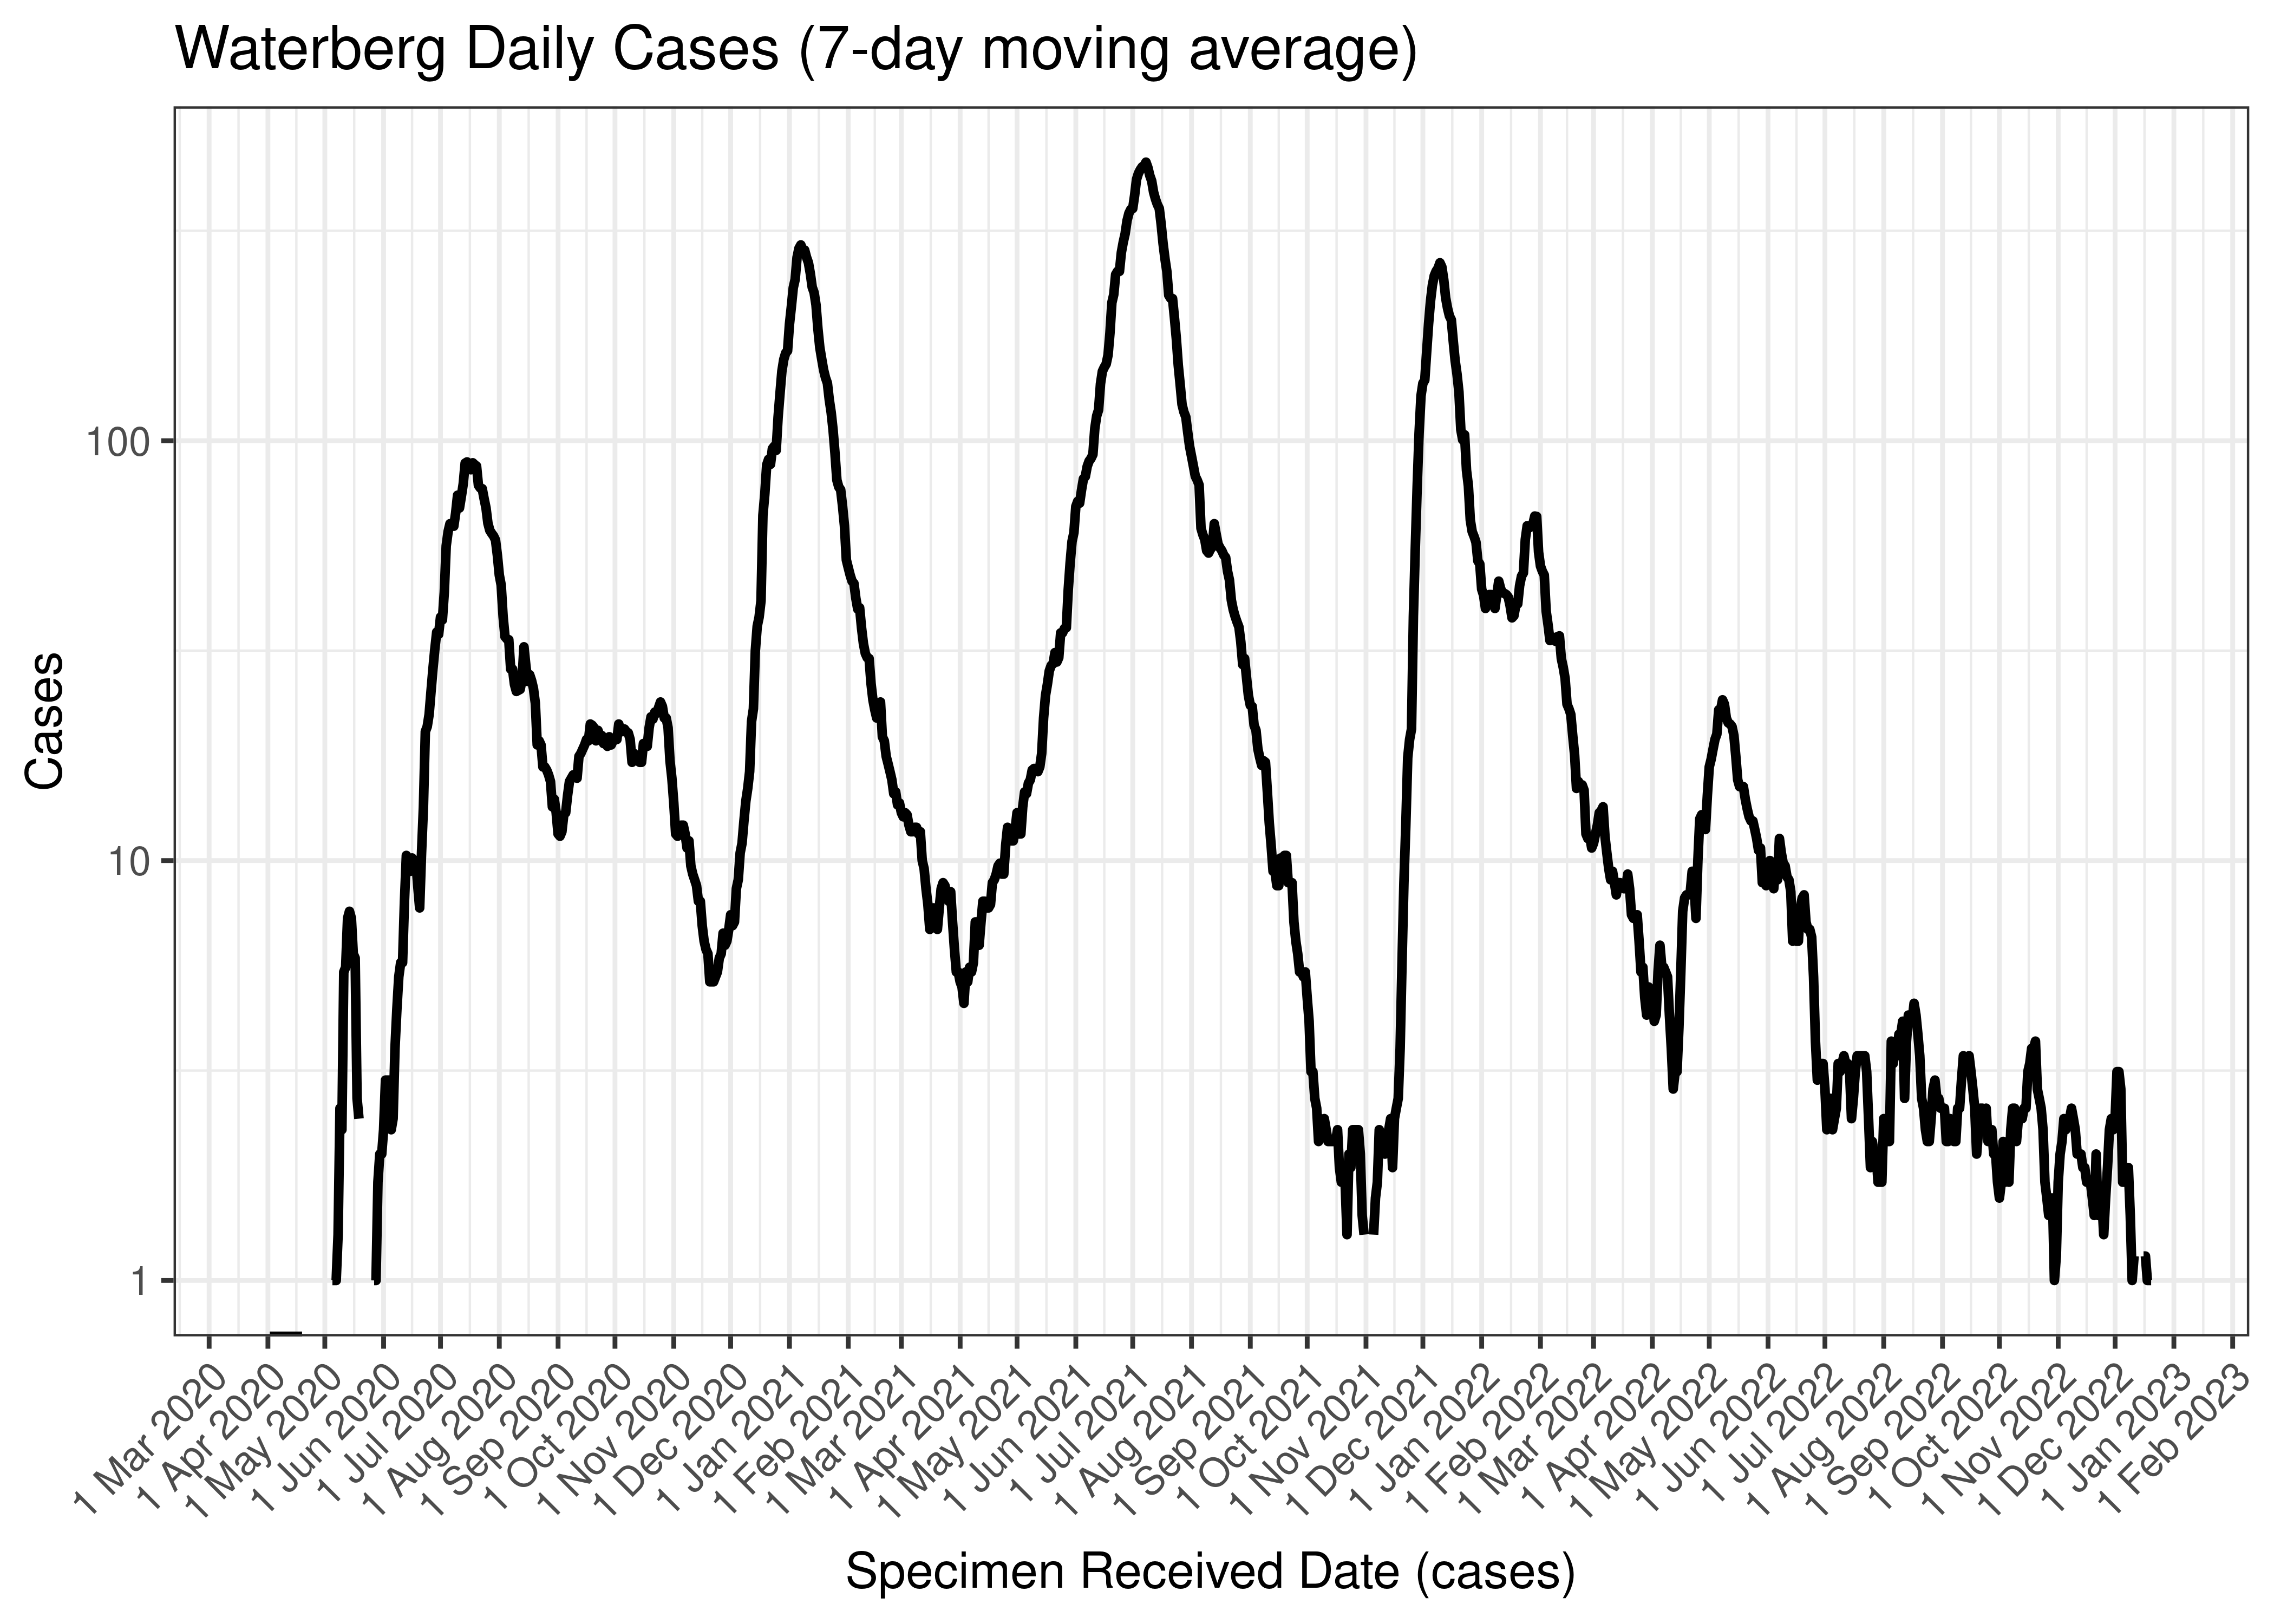
Waterberg Daily Cases (7-day moving average)
Below the above chart is repeated for the last 30-days:
Waterberg Daily Cases for Last 30-days (7-day moving average)
6.6.12.2 Reproduction Number
Below current (last weekly) reproduction number estimates are tabulated for Waterberg.
| Count (Per Day) | Week Ending | Reproduction Number [95% Confidence Interval] | |
|---|---|---|---|
| Waterberg | 0.7 | 2022-12-25 | 0.81 [0.29 - 1.58] |
Below the effective reproduction number for Waterberg over the last 90 days are plotted together with a plot since start of the pandemic.
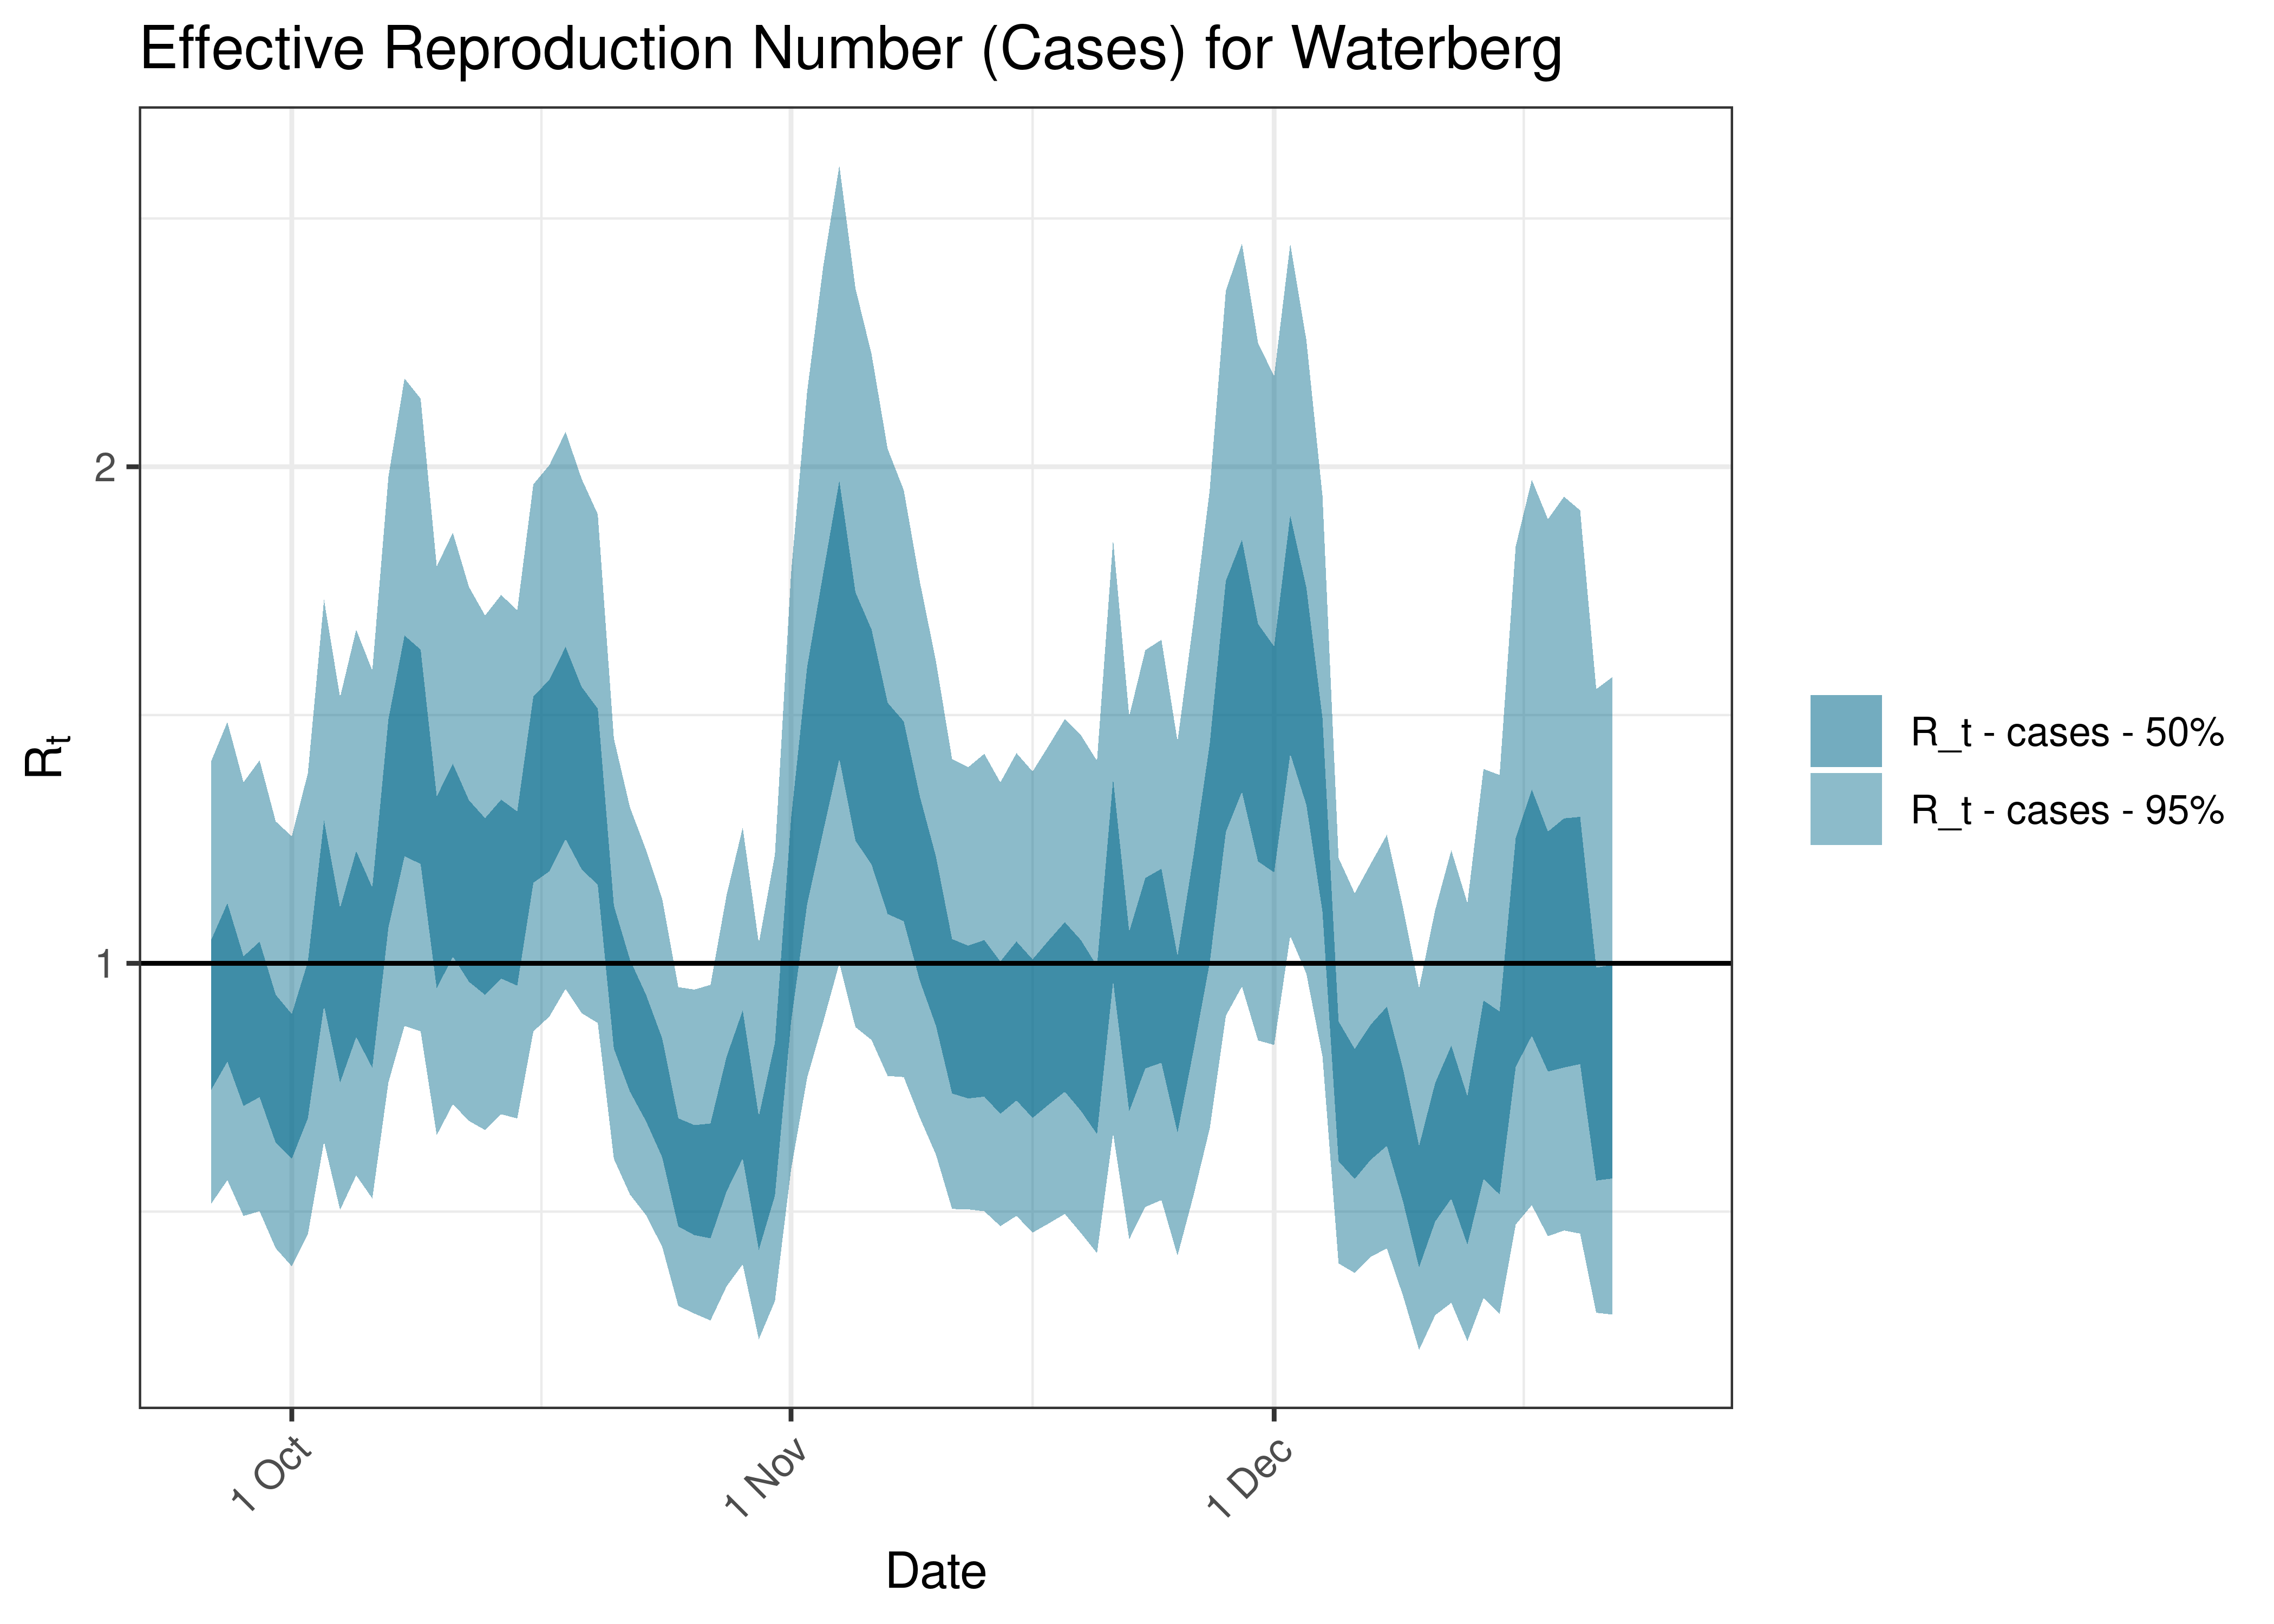
Estimated Effective Reproduction Number Based on Cases for Waterberg over last 90 days
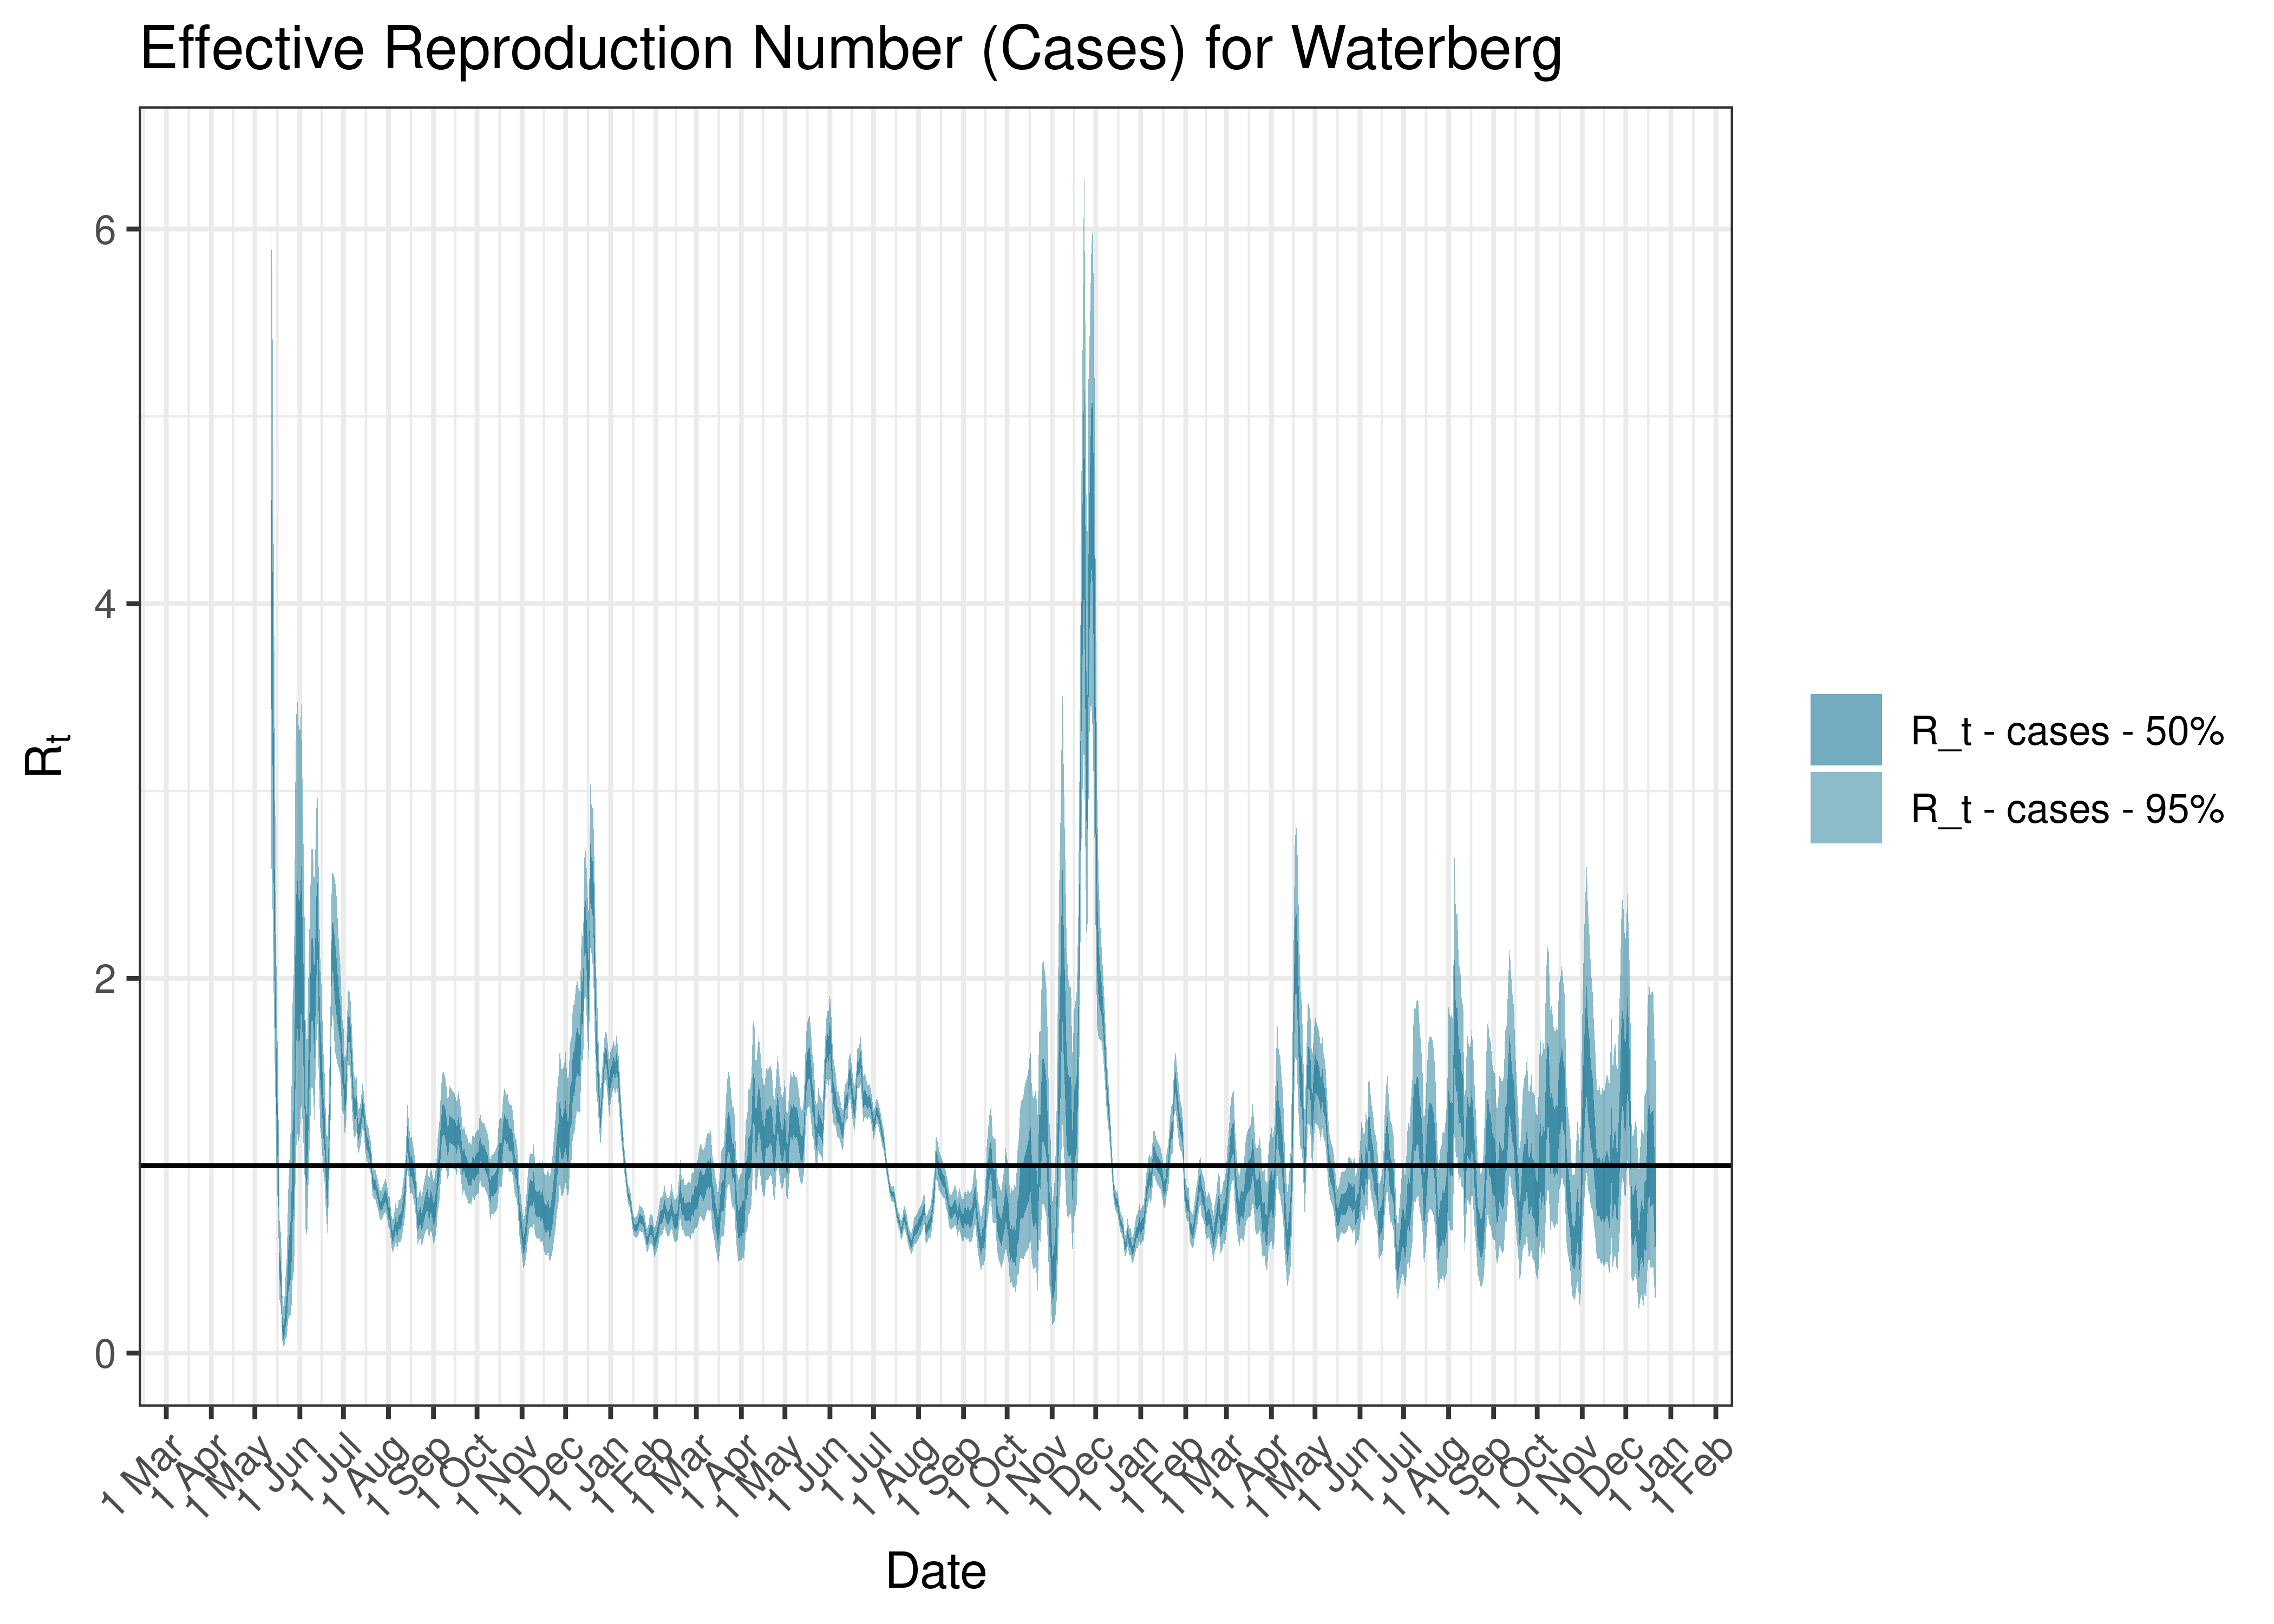
Estimated Effective Reproduction Number Based on Cases for Waterberg since 1 April 2020
6.7 Mpumalanga
6.7.1 Cases
Cases are tabulated by specimen received date below. Cases include estimates for late reporting in recent days as well as adjustments for any public holidays. A centred 7-day moving average is also shown. The peak daily cases in previous waves (as measured by the moving average) is also shown.
| Specimen Received Date | Cases | 7-day Moving Average | Comment |
|---|---|---|---|
| 2020-07-21 | 723 | 592 | Wave 1 Peak |
| 2021-01-12 | 1,628 | 1,196 | Wave 2 Peak |
| 2021-07-10 | 670 | 1,118 | Wave 3 Peak |
| 2021-12-12 | 328 | 1,134 | Wave 4 Peak |
| 2022-05-08 | 46 | 201 | Wave 5 Peak (to date) |
Below a 7-day moving average daily case count is plotted for Mpumalanga on a log scale since start of the epidemic:
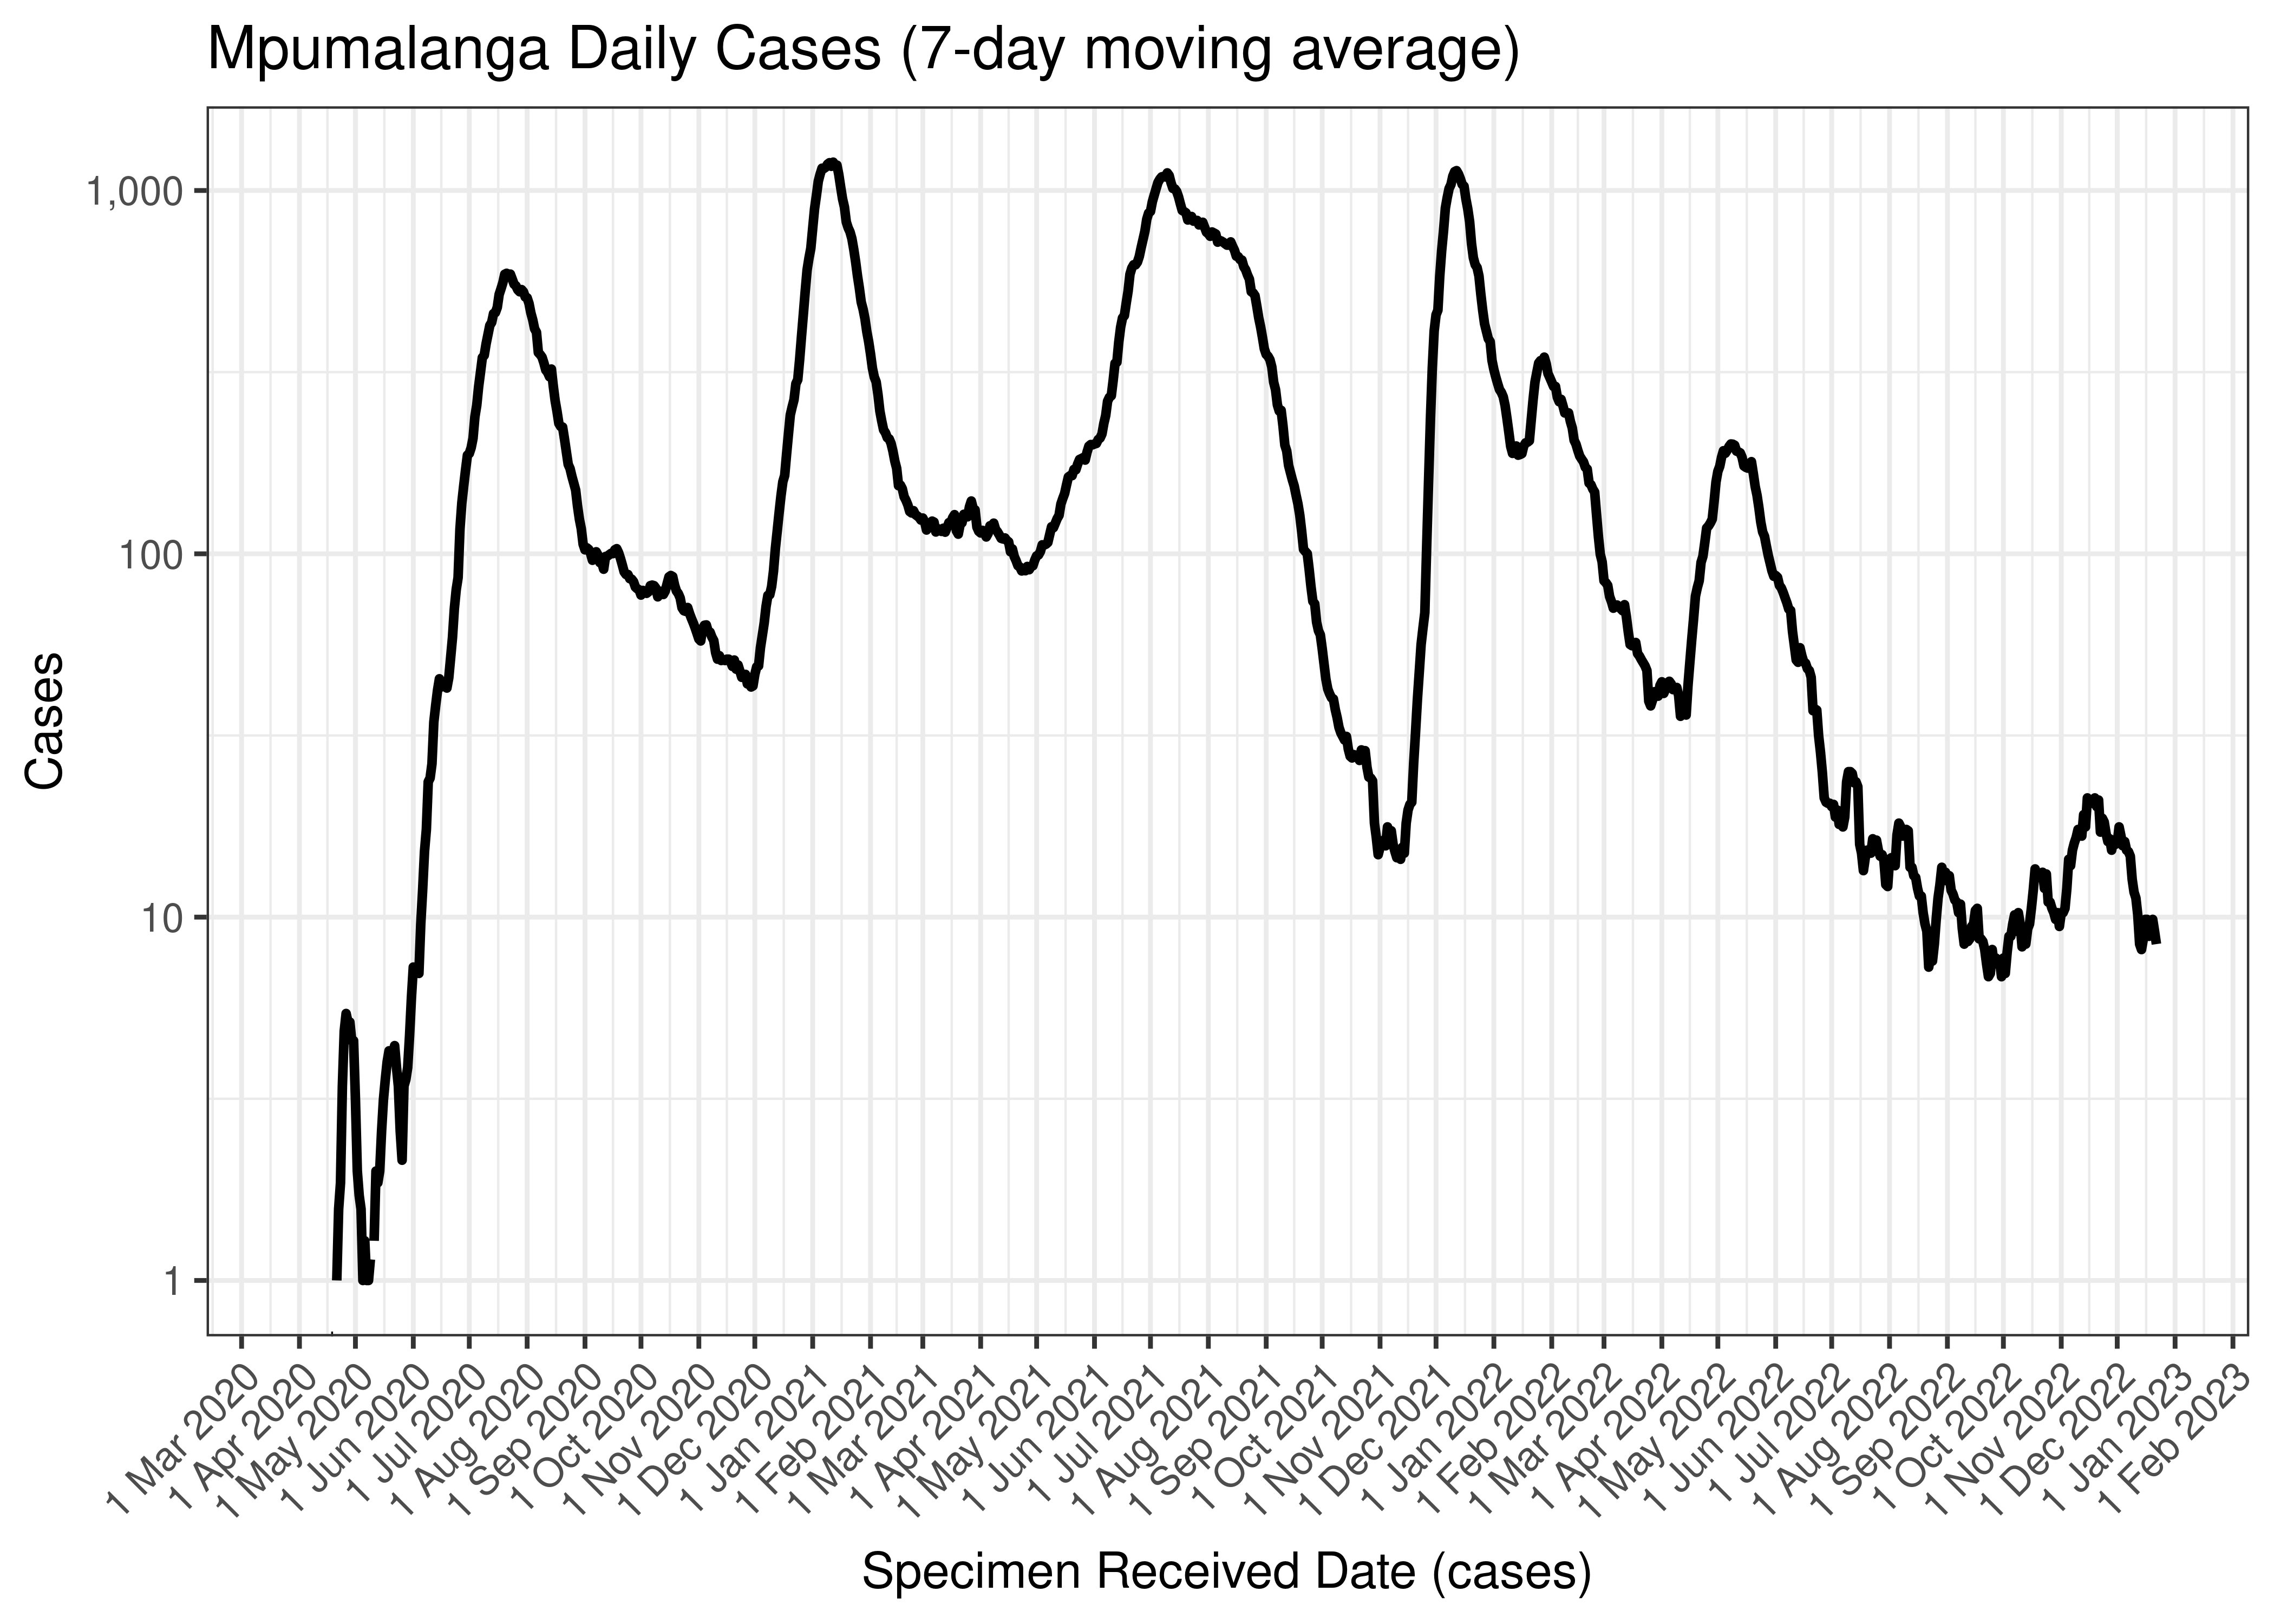
Mpumalanga Daily Cases (7-day moving average)
Below the above chart is repeated for the last 30-days:

Mpumalanga Daily Cases for Last 30-days (7-day moving average)
Below a 7-day moving average daily case count is plotted for Mpumalanga by district municipality on a log scale since start of the epidemic:
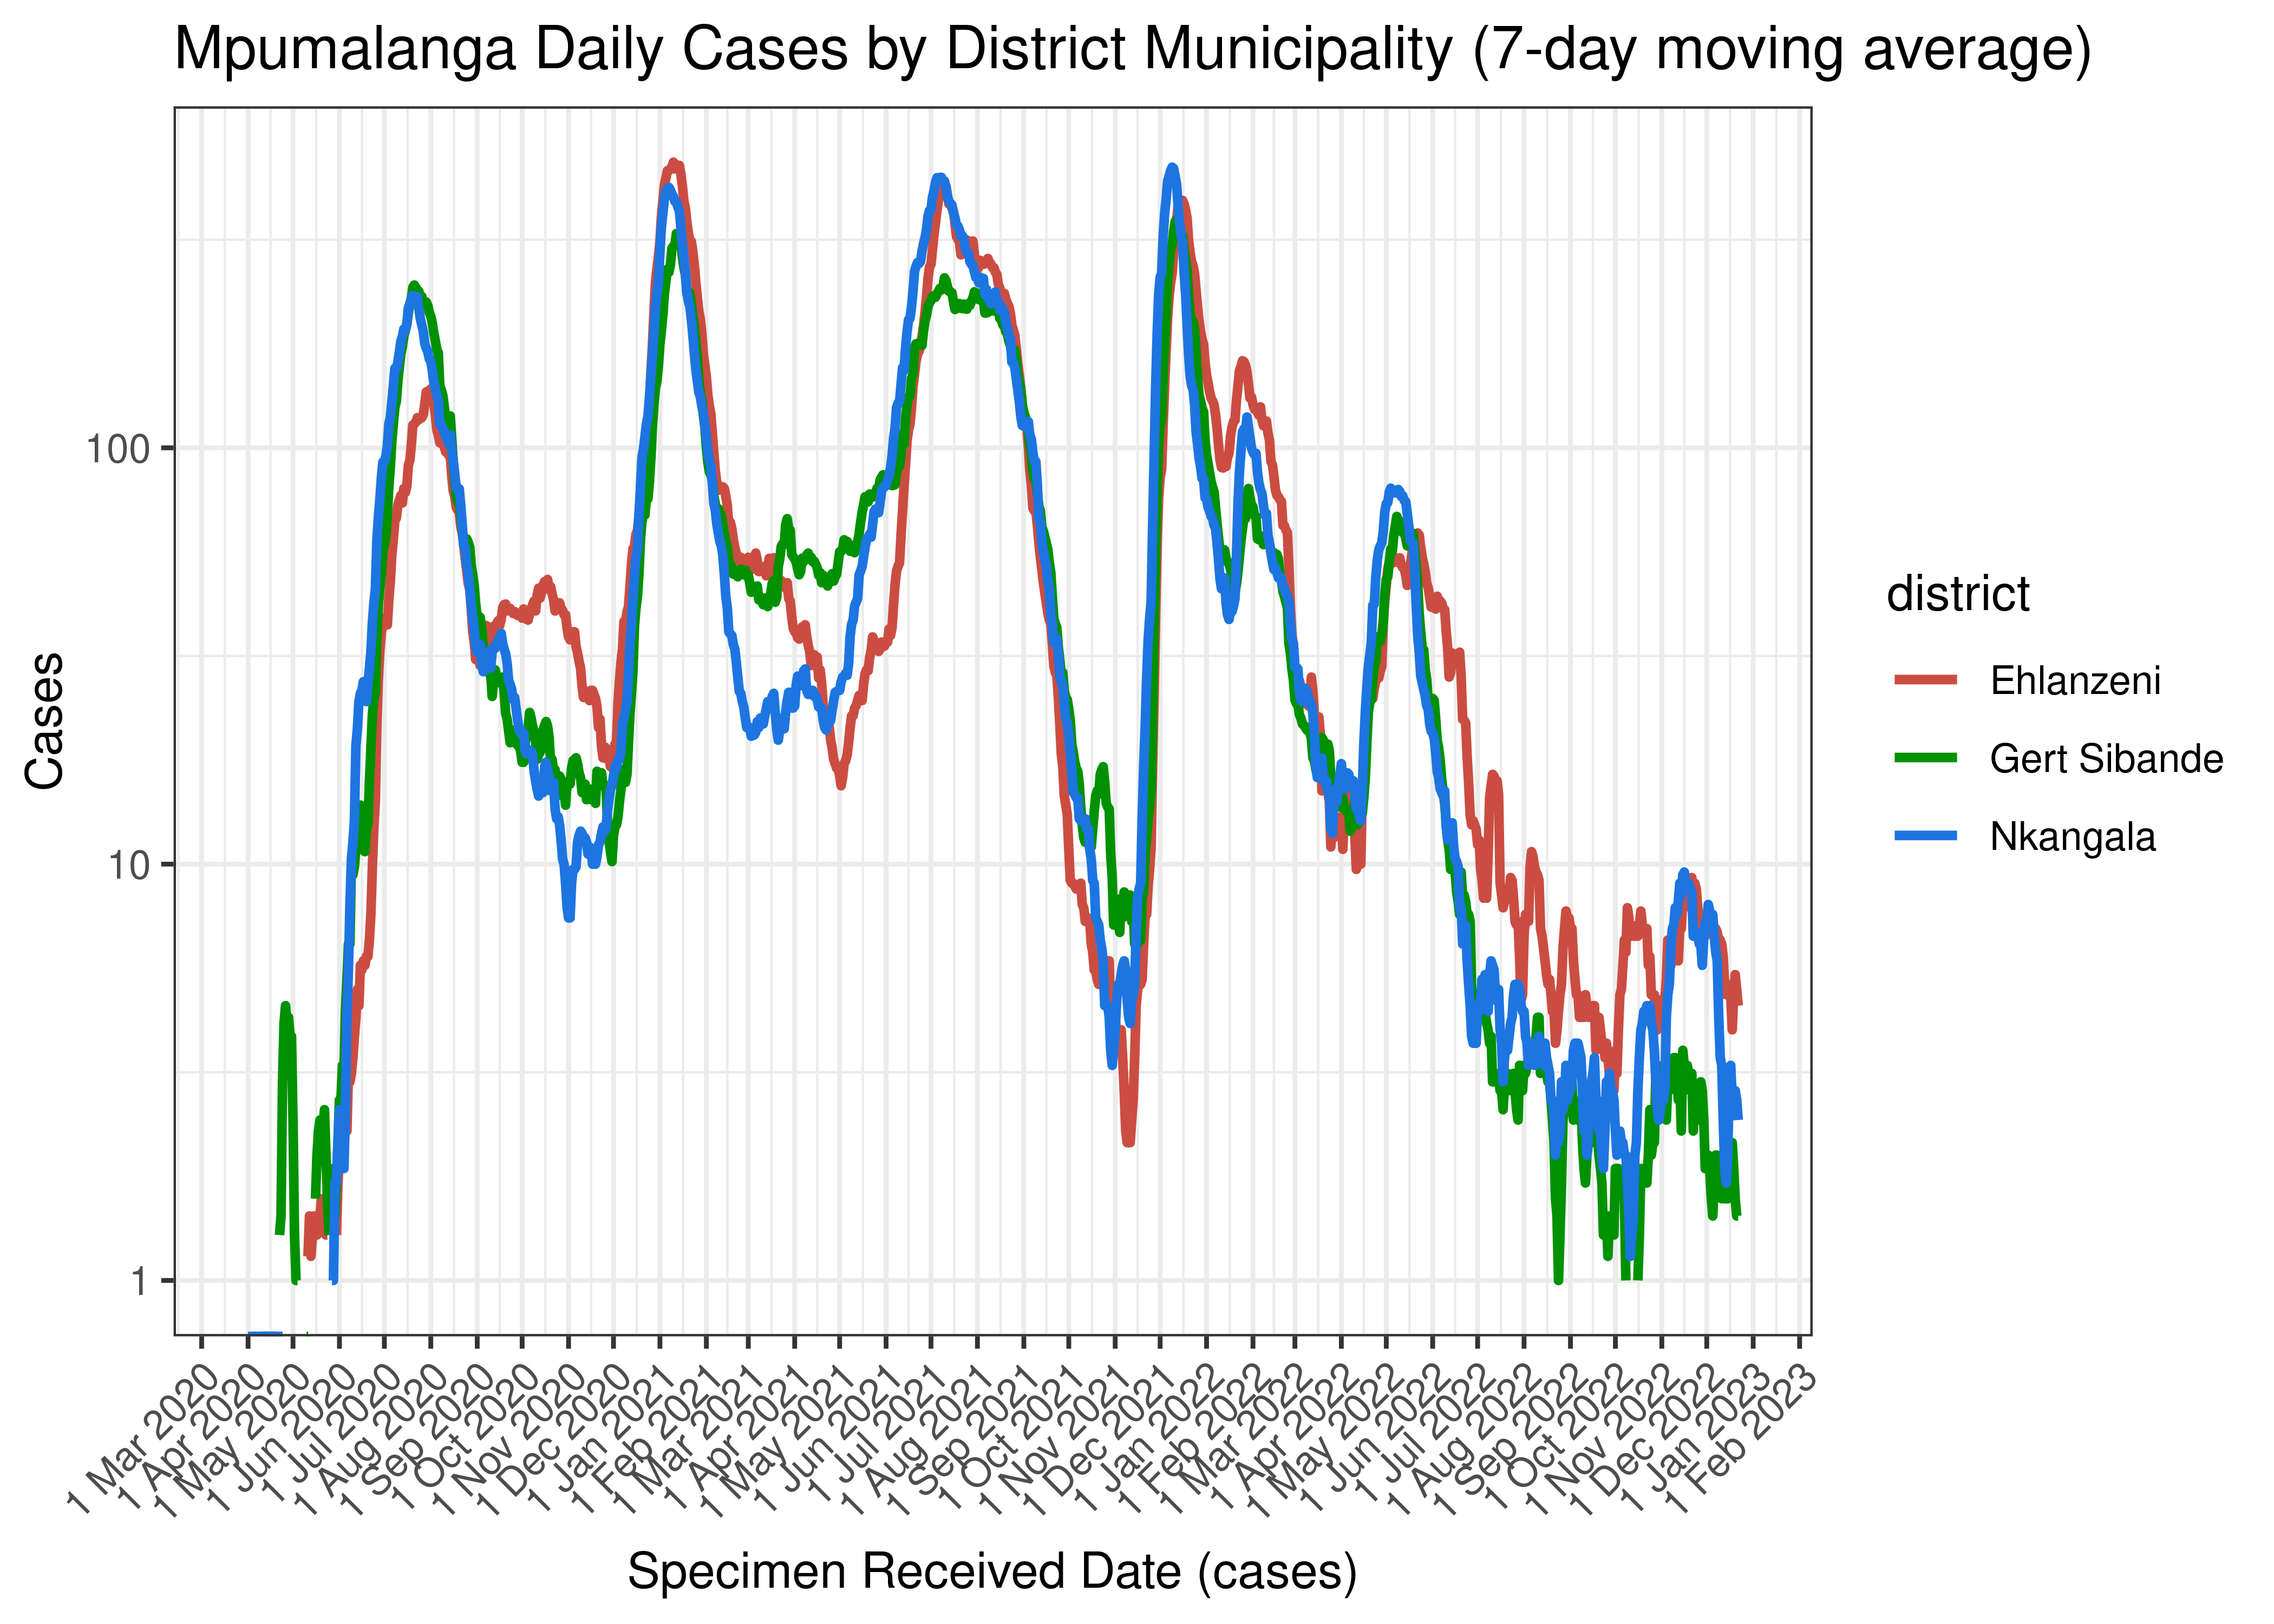
Mpumalanga Daily Cases by District Municipality (7-day moving average)
Below the above chart is repeated for the last 30-days:
Mpumalanga Daily Cases for Last 30-days by District Municipality (7-day moving average)
6.7.2 Hospital Admissions
Hospital admissions are tabulated by reported date below. The peak daily admissions in previous waves (as measured by the moving average) is also shown.
| Reported Date | Hospital Admissions | 7-day Moving Average | Comment |
|---|---|---|---|
| 2020-08-04 | 25 | 62 | Wave 1 Peak |
| 2021-01-24 | 40 | 163 | Wave 2 Peak |
| 2021-07-12 | 53 | 103 | Wave 3 Peak |
| 2021-12-12 | 12 | 65 | Wave 4 Peak |
| 2022-05-19 | 15 | 15 | Wave 5 Peak (to date) |
Below a 7-day moving average daily hospital admissions count is plotted for Mpumalanga on a log scale since start of the epidemic:
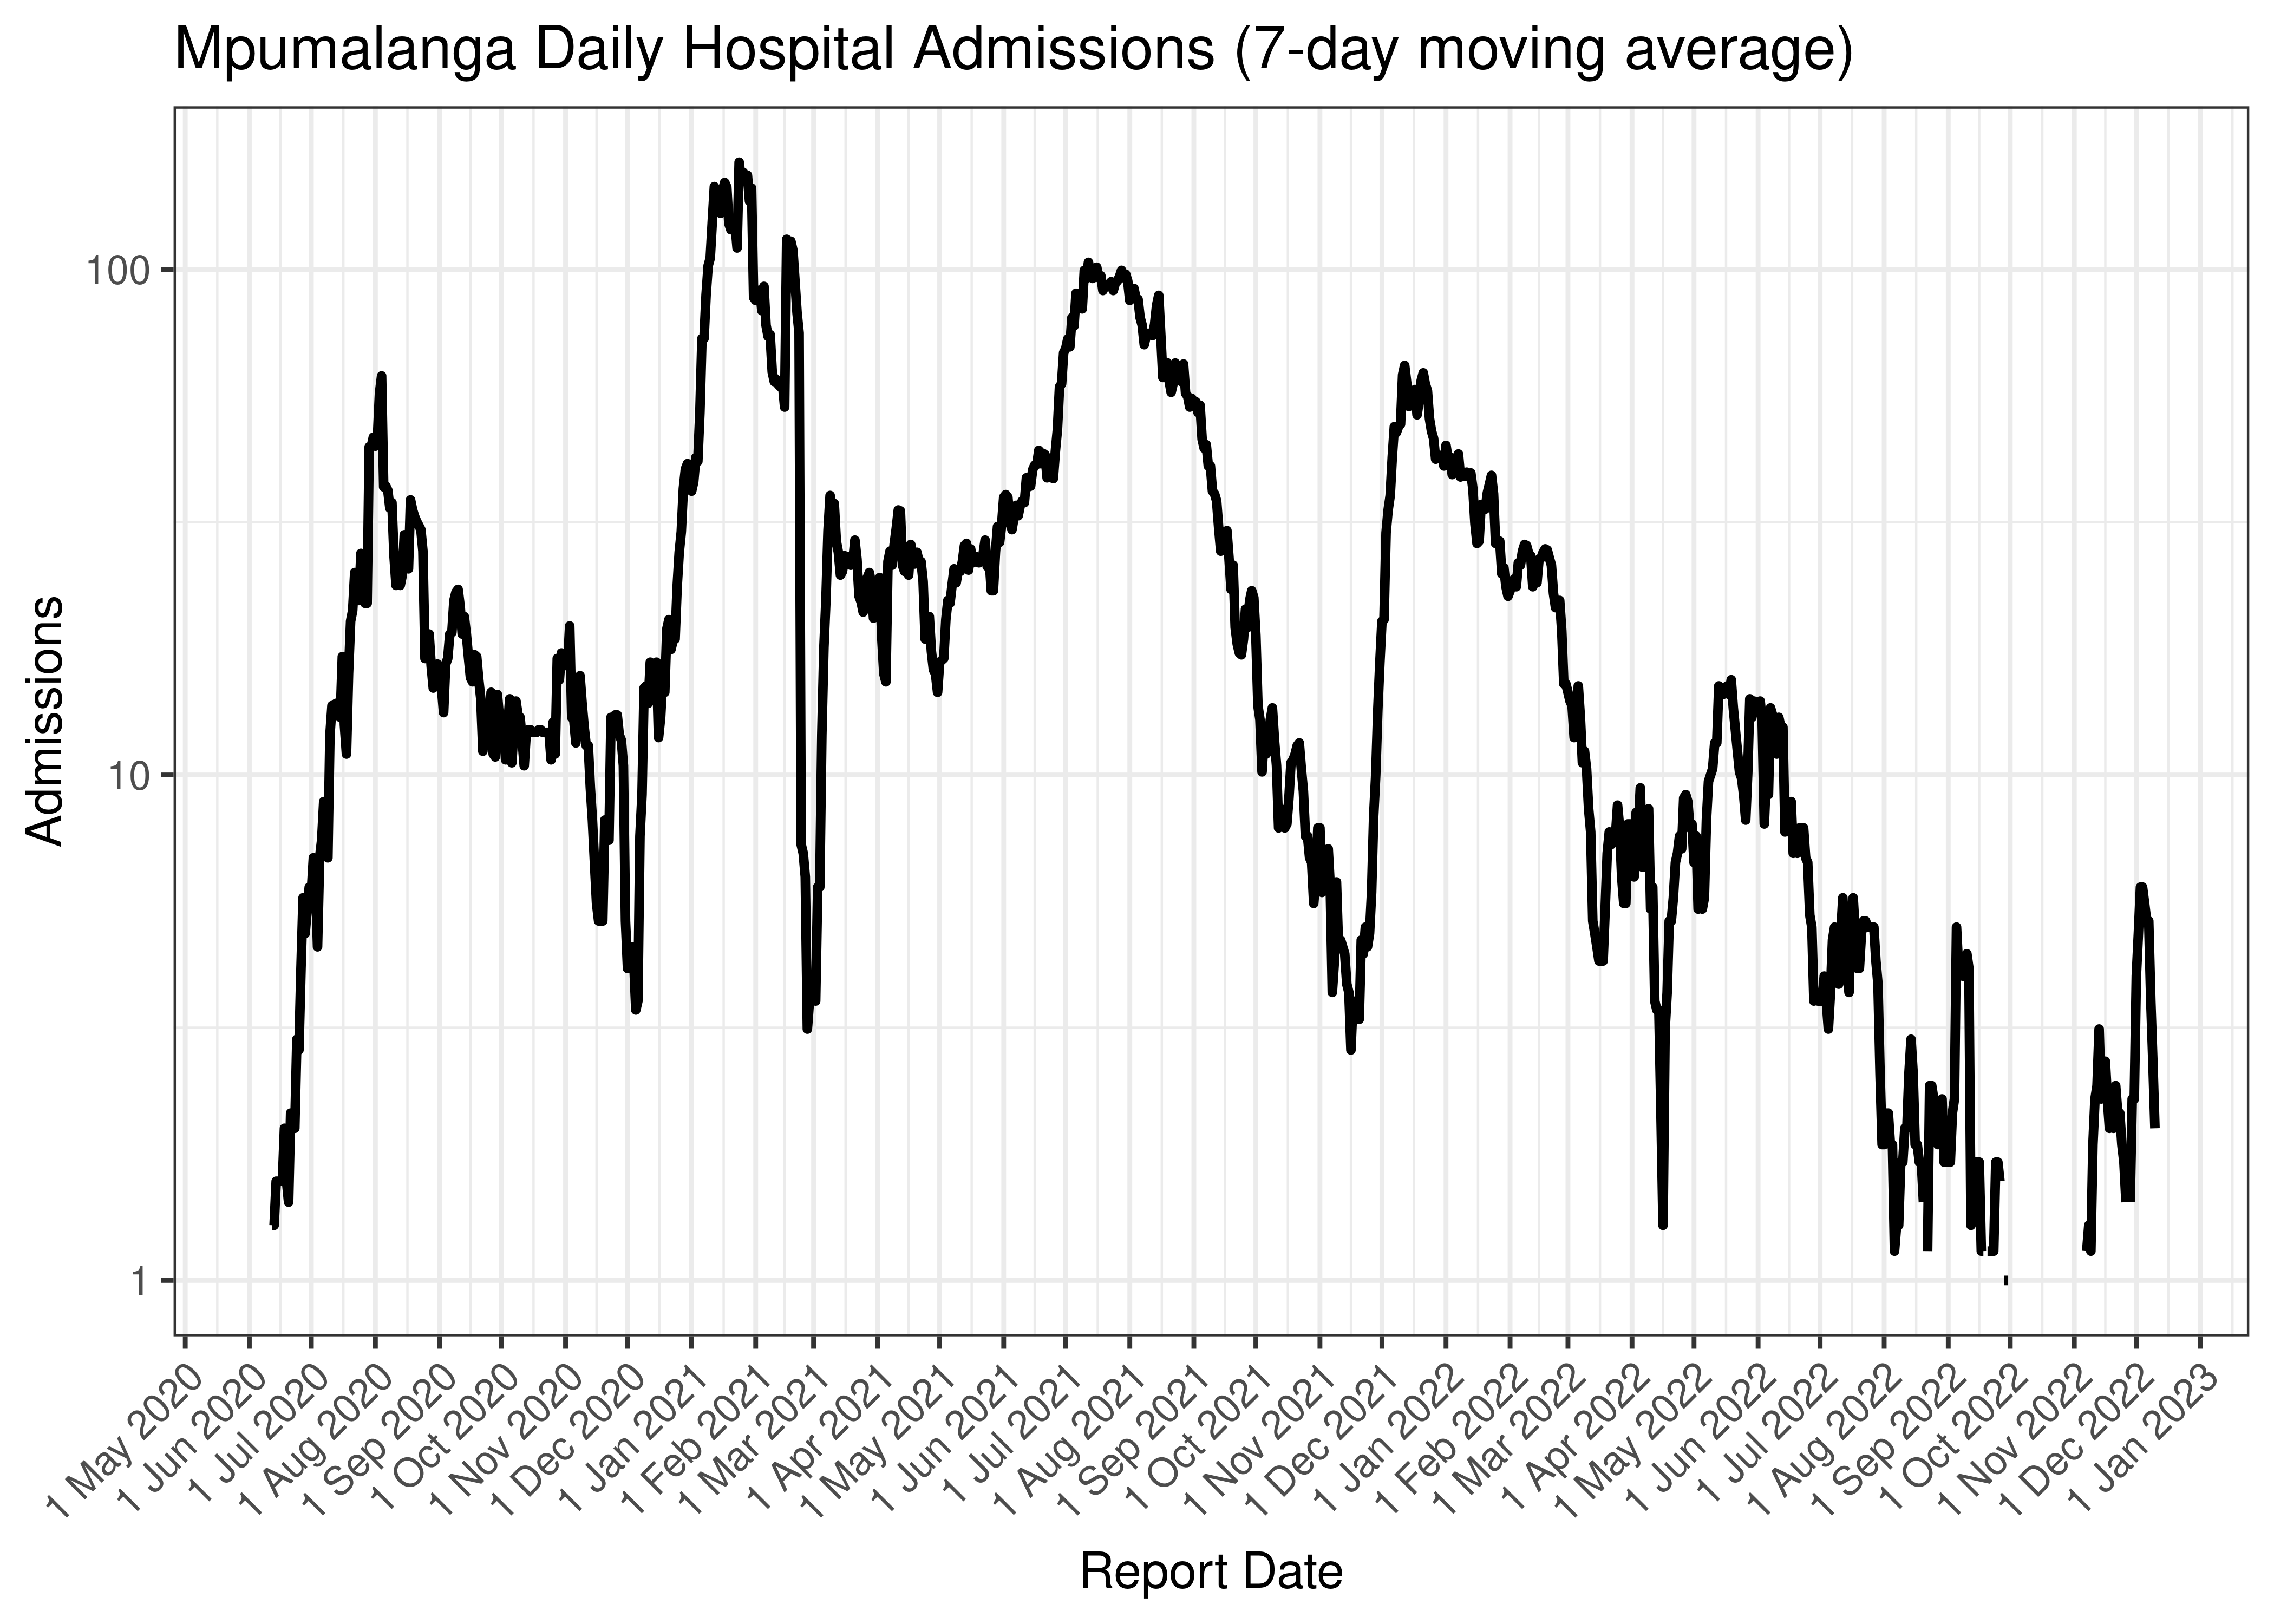
Mpumalanga Daily Hospital Admissions (7-day moving average)
Below the above chart is repeated for the last 30-days:
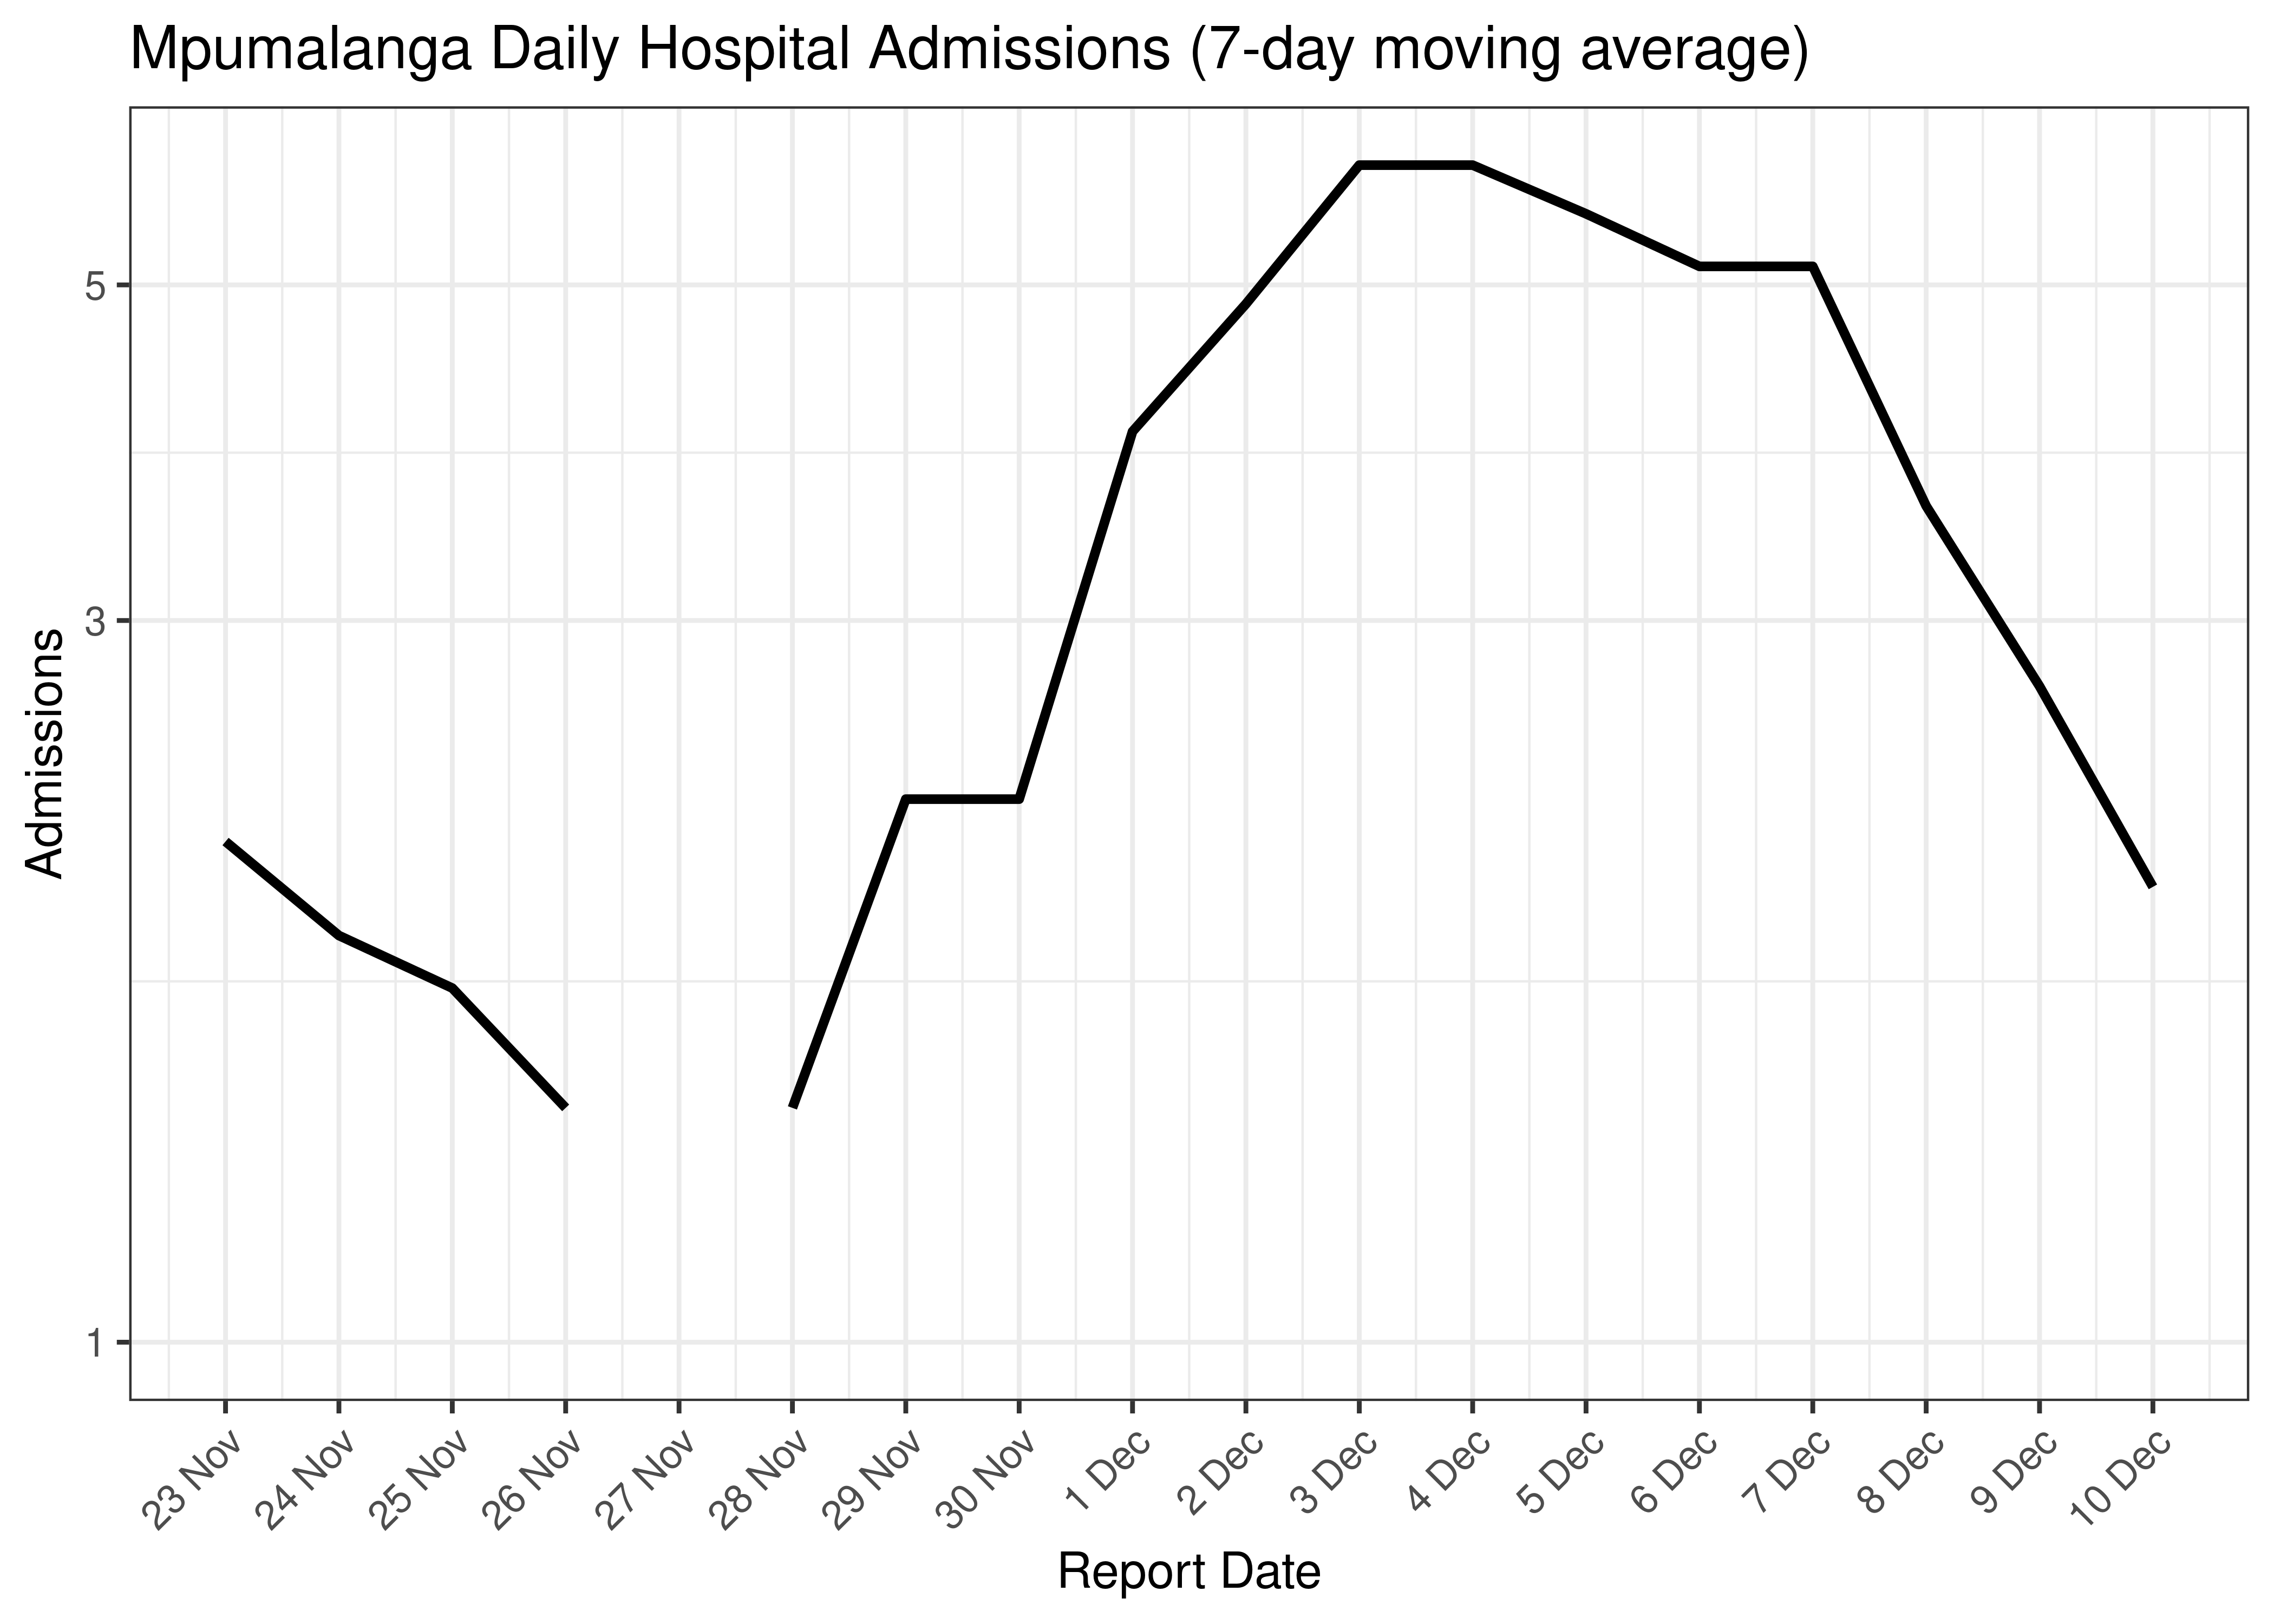
Mpumalanga Daily Hospital Admissions for Last 30-days (7-day moving average)
6.7.3 Hospital Deaths
Hospital deaths are tabulated by reported date below. The peak daily deaths in previous waves (as measured by the moving average) is also shown.
Note that hospital deaths underestimates total COVID-19 deaths in South Africa.
| Reported Date | Hospital Deaths | 7-day Moving Average | Comment |
|---|---|---|---|
| 2020-08-20 | 4 | 6 | Wave 1 Peak |
| 2020-09-14 | 4 | 6 | Wave 1 Peak |
| 2021-01-24 | 9 | 47 | Wave 2 Peak |
| 2021-07-30 | 43 | 34 | Wave 3 Peak |
| 2022-01-08 | 1 | 8 | Wave 4 Peak |
| 2022-05-28 | 0 | 4 | Wave 5 Peak (to date) |
| 2022-05-29 | 1 | 4 | Wave 5 Peak (to date) |
Below a 7-day moving average daily hospital deaths count is plotted for Mpumalanga on a log scale since start of the epidemic:
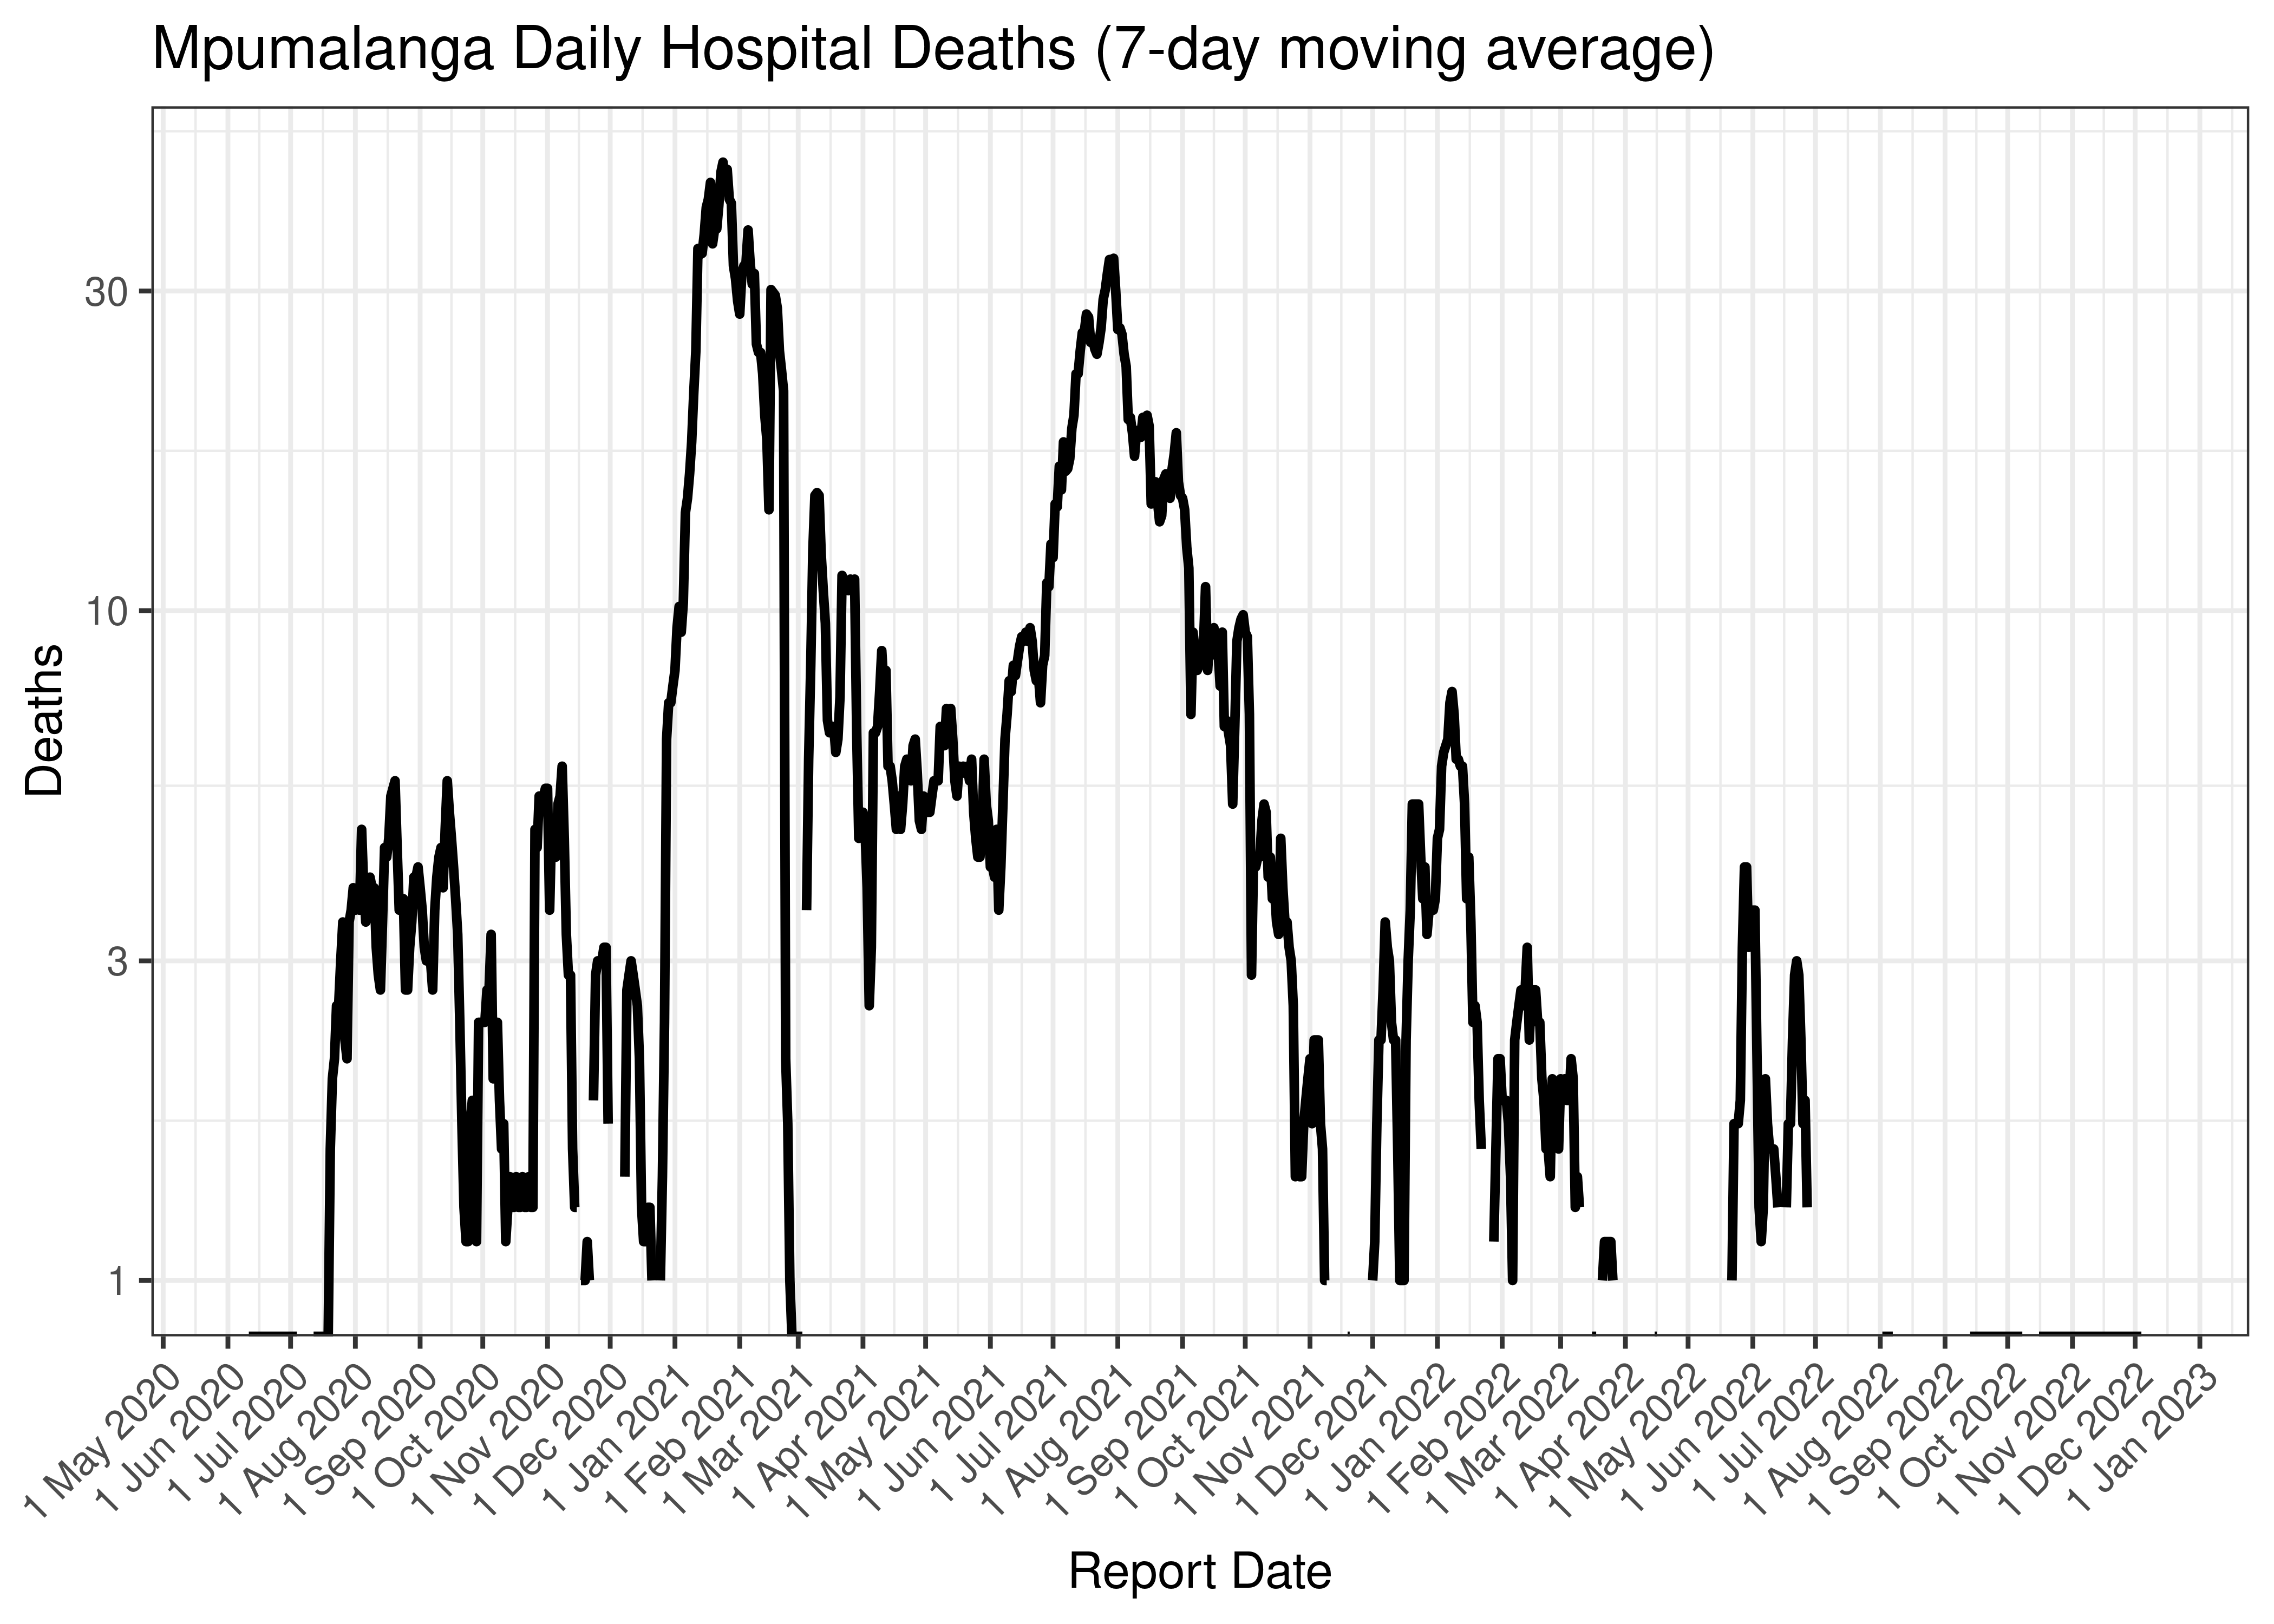
Mpumalanga Daily Hospital Deaths (7-day moving average)
Below the above chart is repeated for the last 30-days:
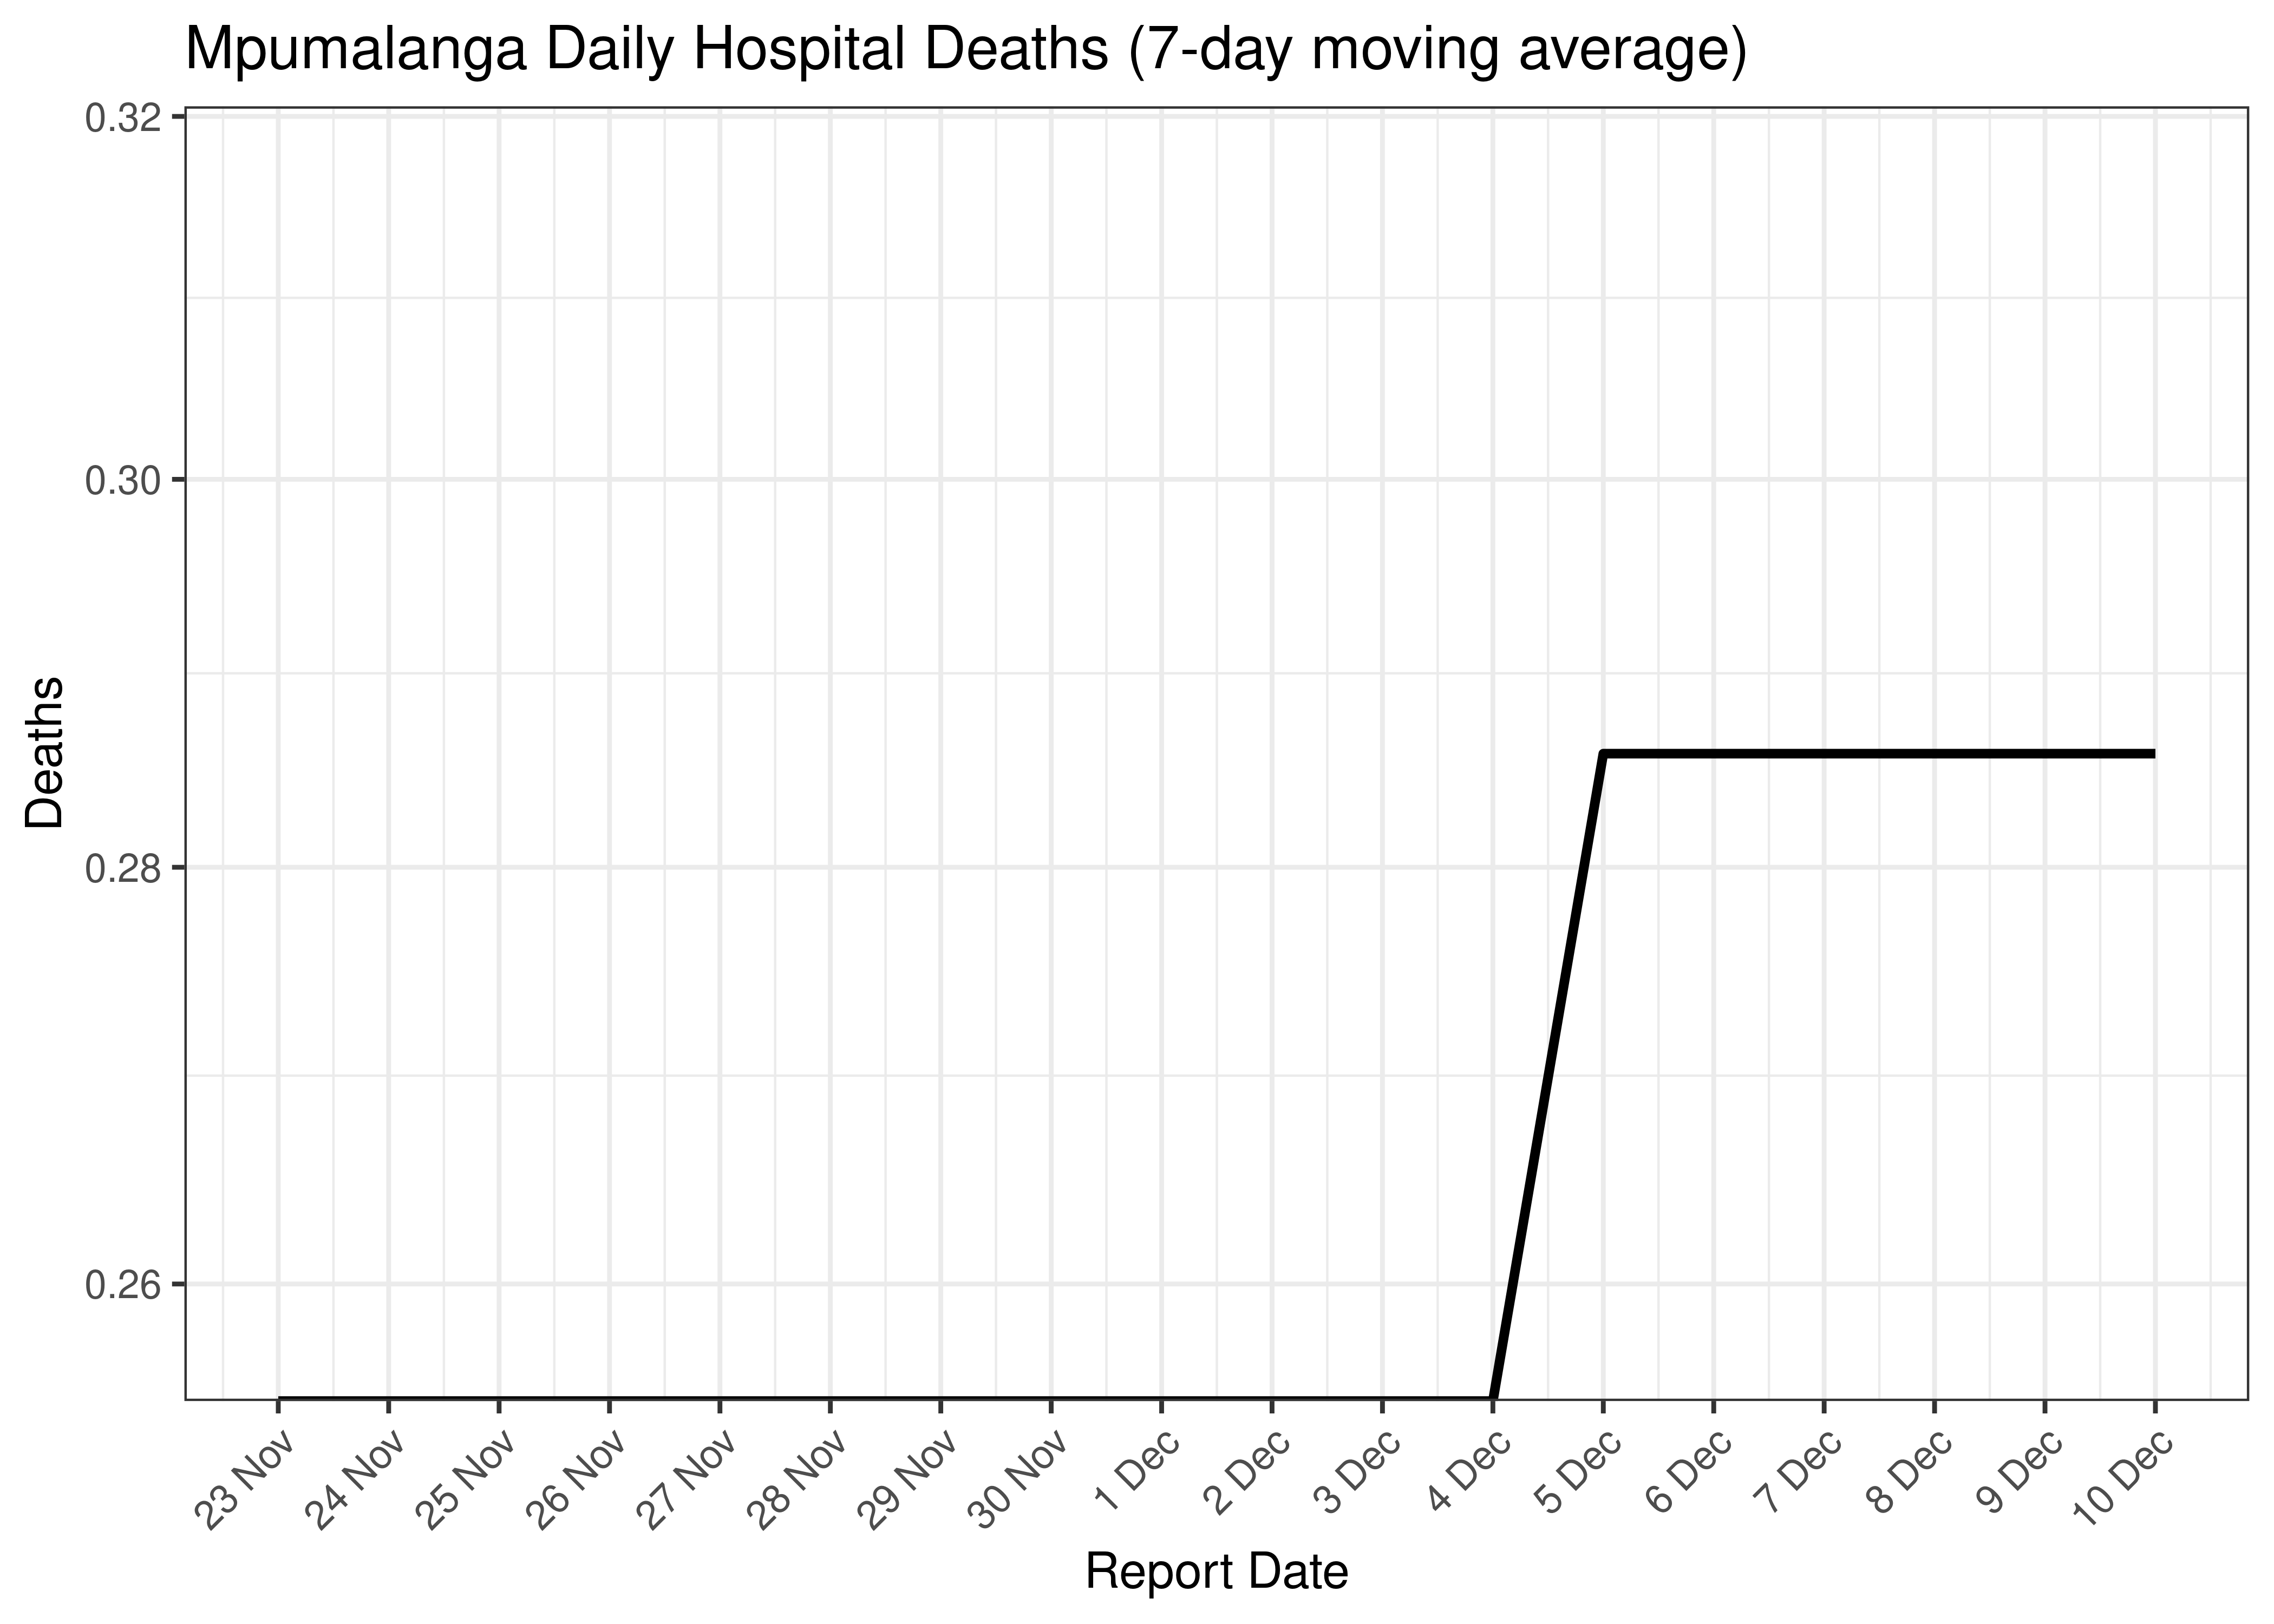
Mpumalanga Daily Hospital Deaths for Last 30-days (7-day moving average)
6.7.4 Excess Deaths
Excess deaths are tabulated by date of death below. The peak daily deaths in previous waves (as measured by the moving average) is also shown.
| Date of Death | Excess Deaths | 7-day Moving Average | Comment |
|---|---|---|---|
| 2020-07-22 | 65 | 65 | Wave 1 Peak |
| 2021-01-13 | 213 | 213 | Wave 2 Peak |
| 2021-07-21 | 154 | 154 | Wave 3 Peak |
| 2021-12-22 | 36 | 36 | Wave 4 Peak |
| 2022-05-11 | 24 | 24 | Wave 5 Peak (to date) |
| 2022-12-03 | 9 | 1 | |
| 2022-12-04 | -10 | -2 | |
| 2022-12-05 | -10 | -4 | |
| 2022-12-06 | -10 | -7 | |
| 2022-12-07 | -10 | -10 | |
| 2022-12-08 | -10 | NA | |
| 2022-12-09 | -10 | NA | |
| 2022-12-10 | -10 | NA |
Below a 7-day moving average daily excess deaths count is plotted for Mpumalanga on a log scale since start of the epidemic:
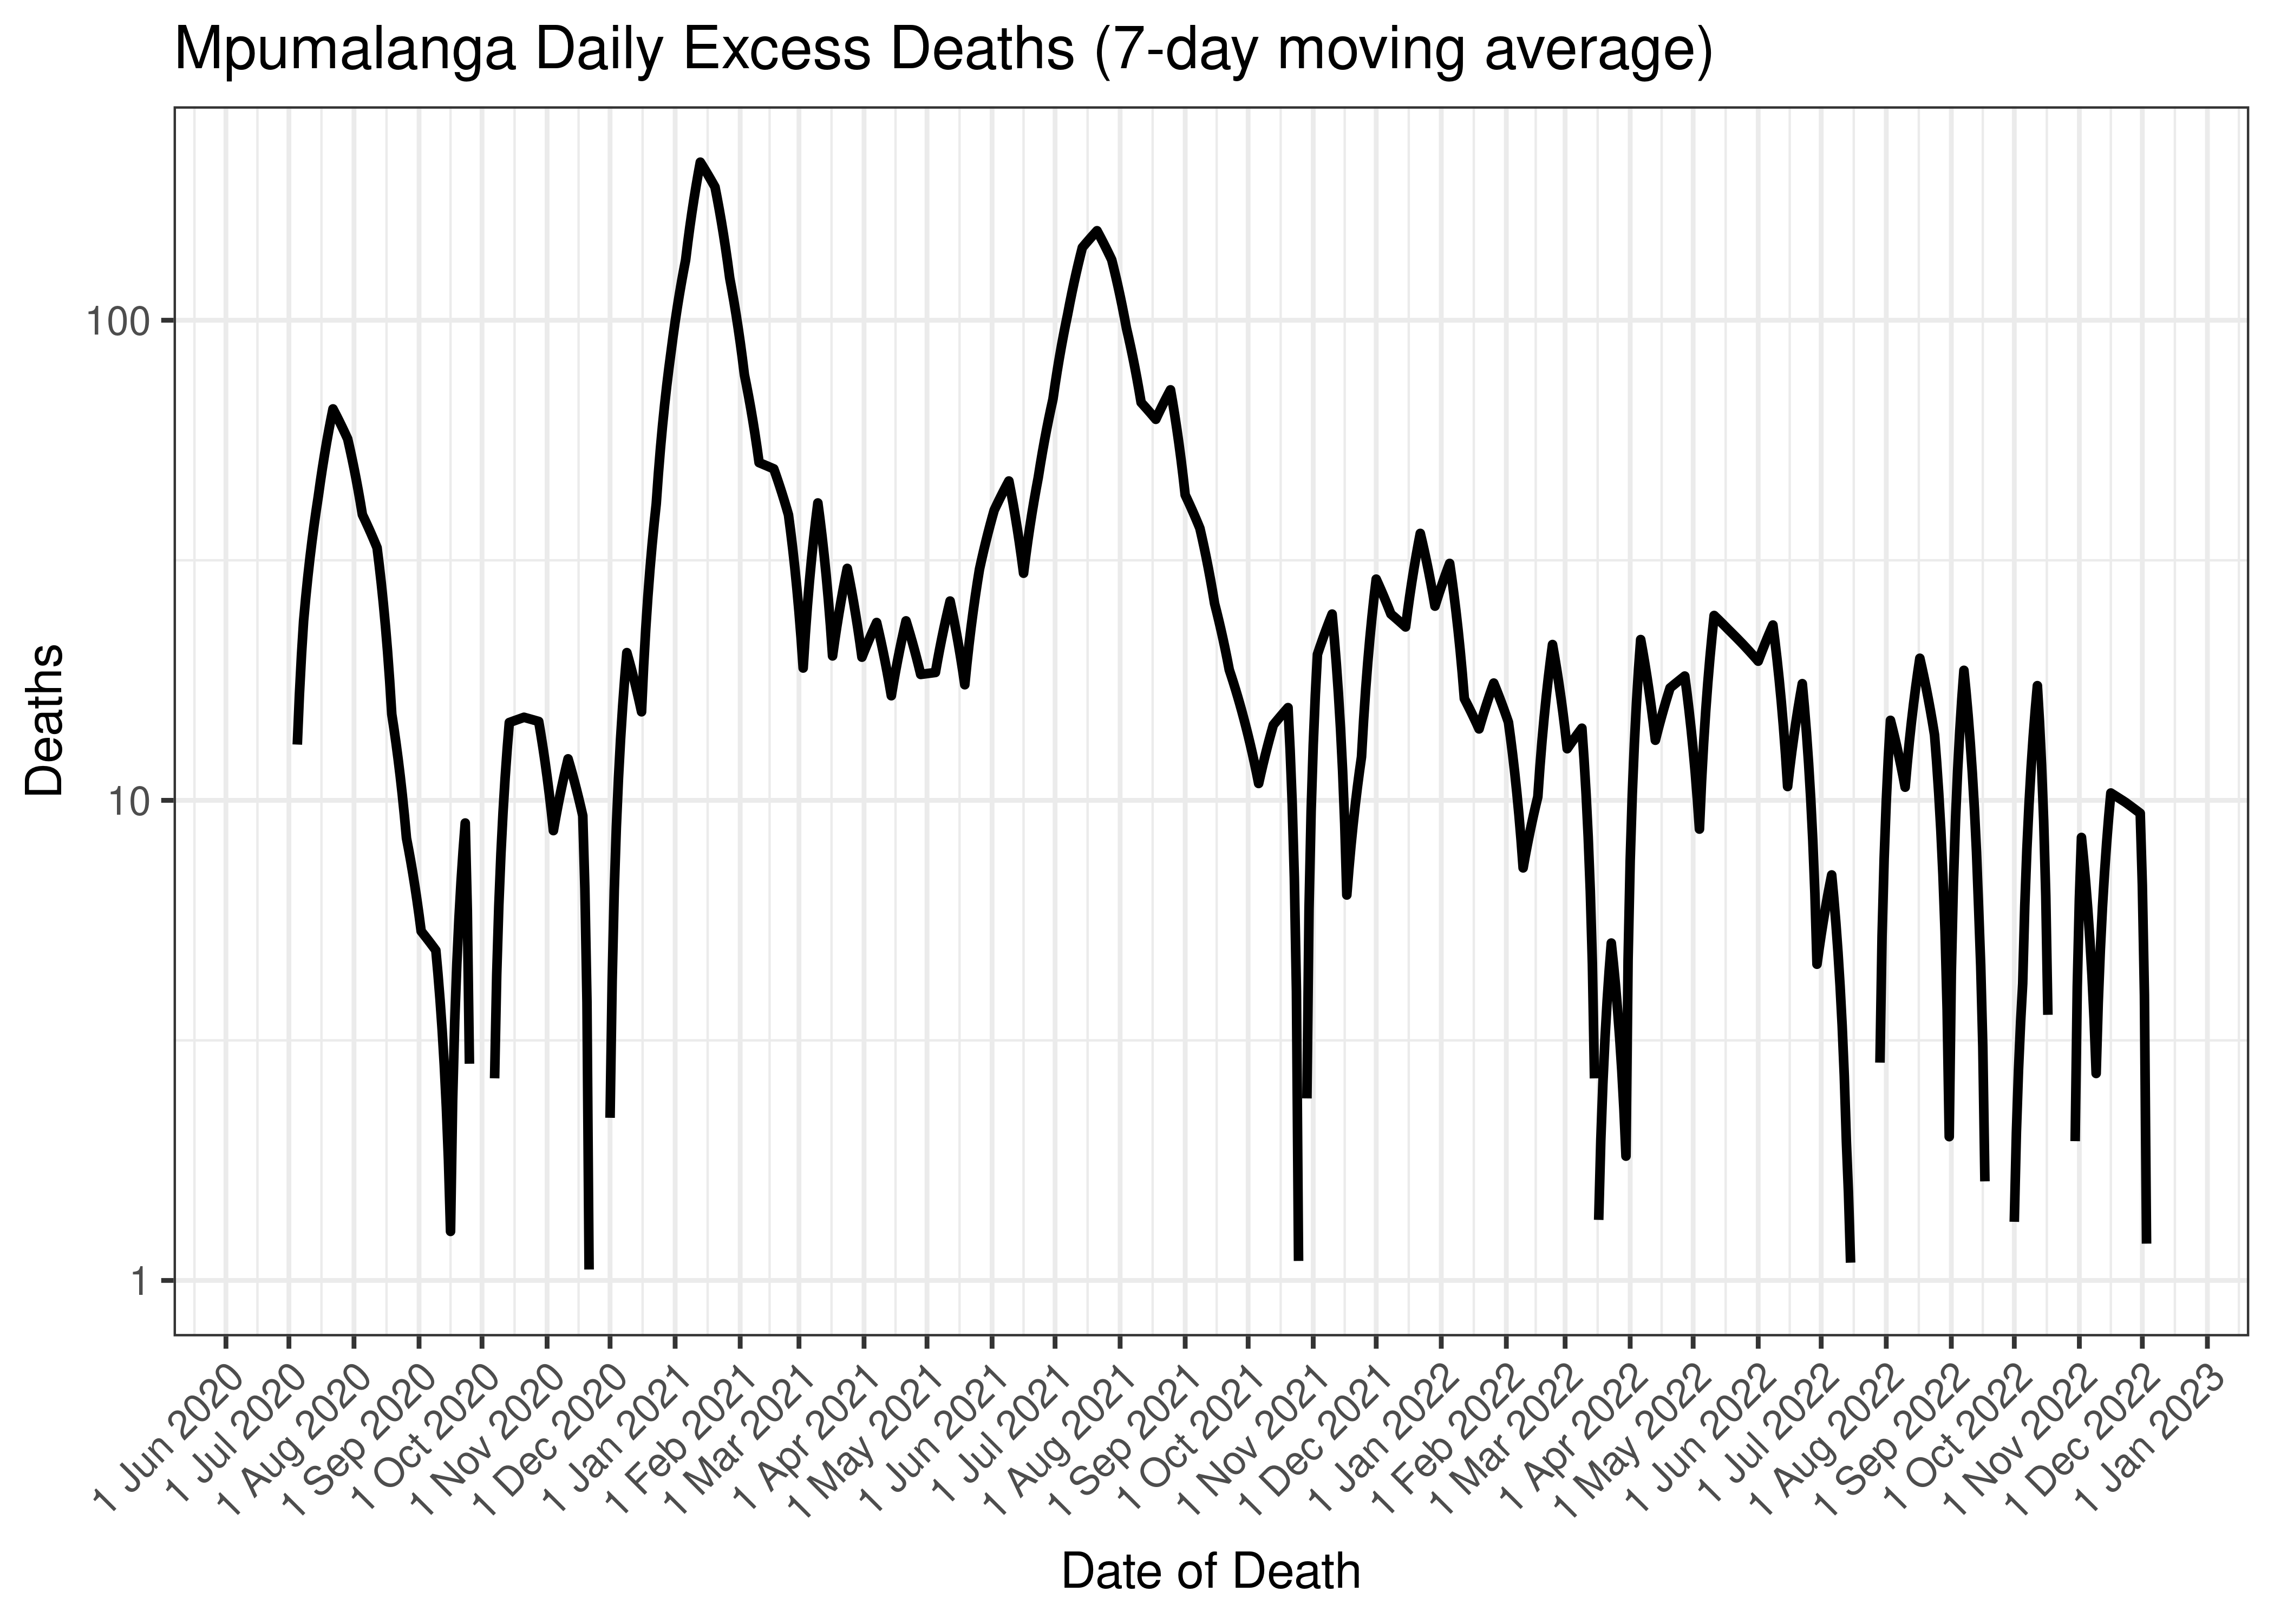
Mpumalanga Daily Excess Deaths (7-day moving average)
Below the above chart is repeated for the last 30-days:
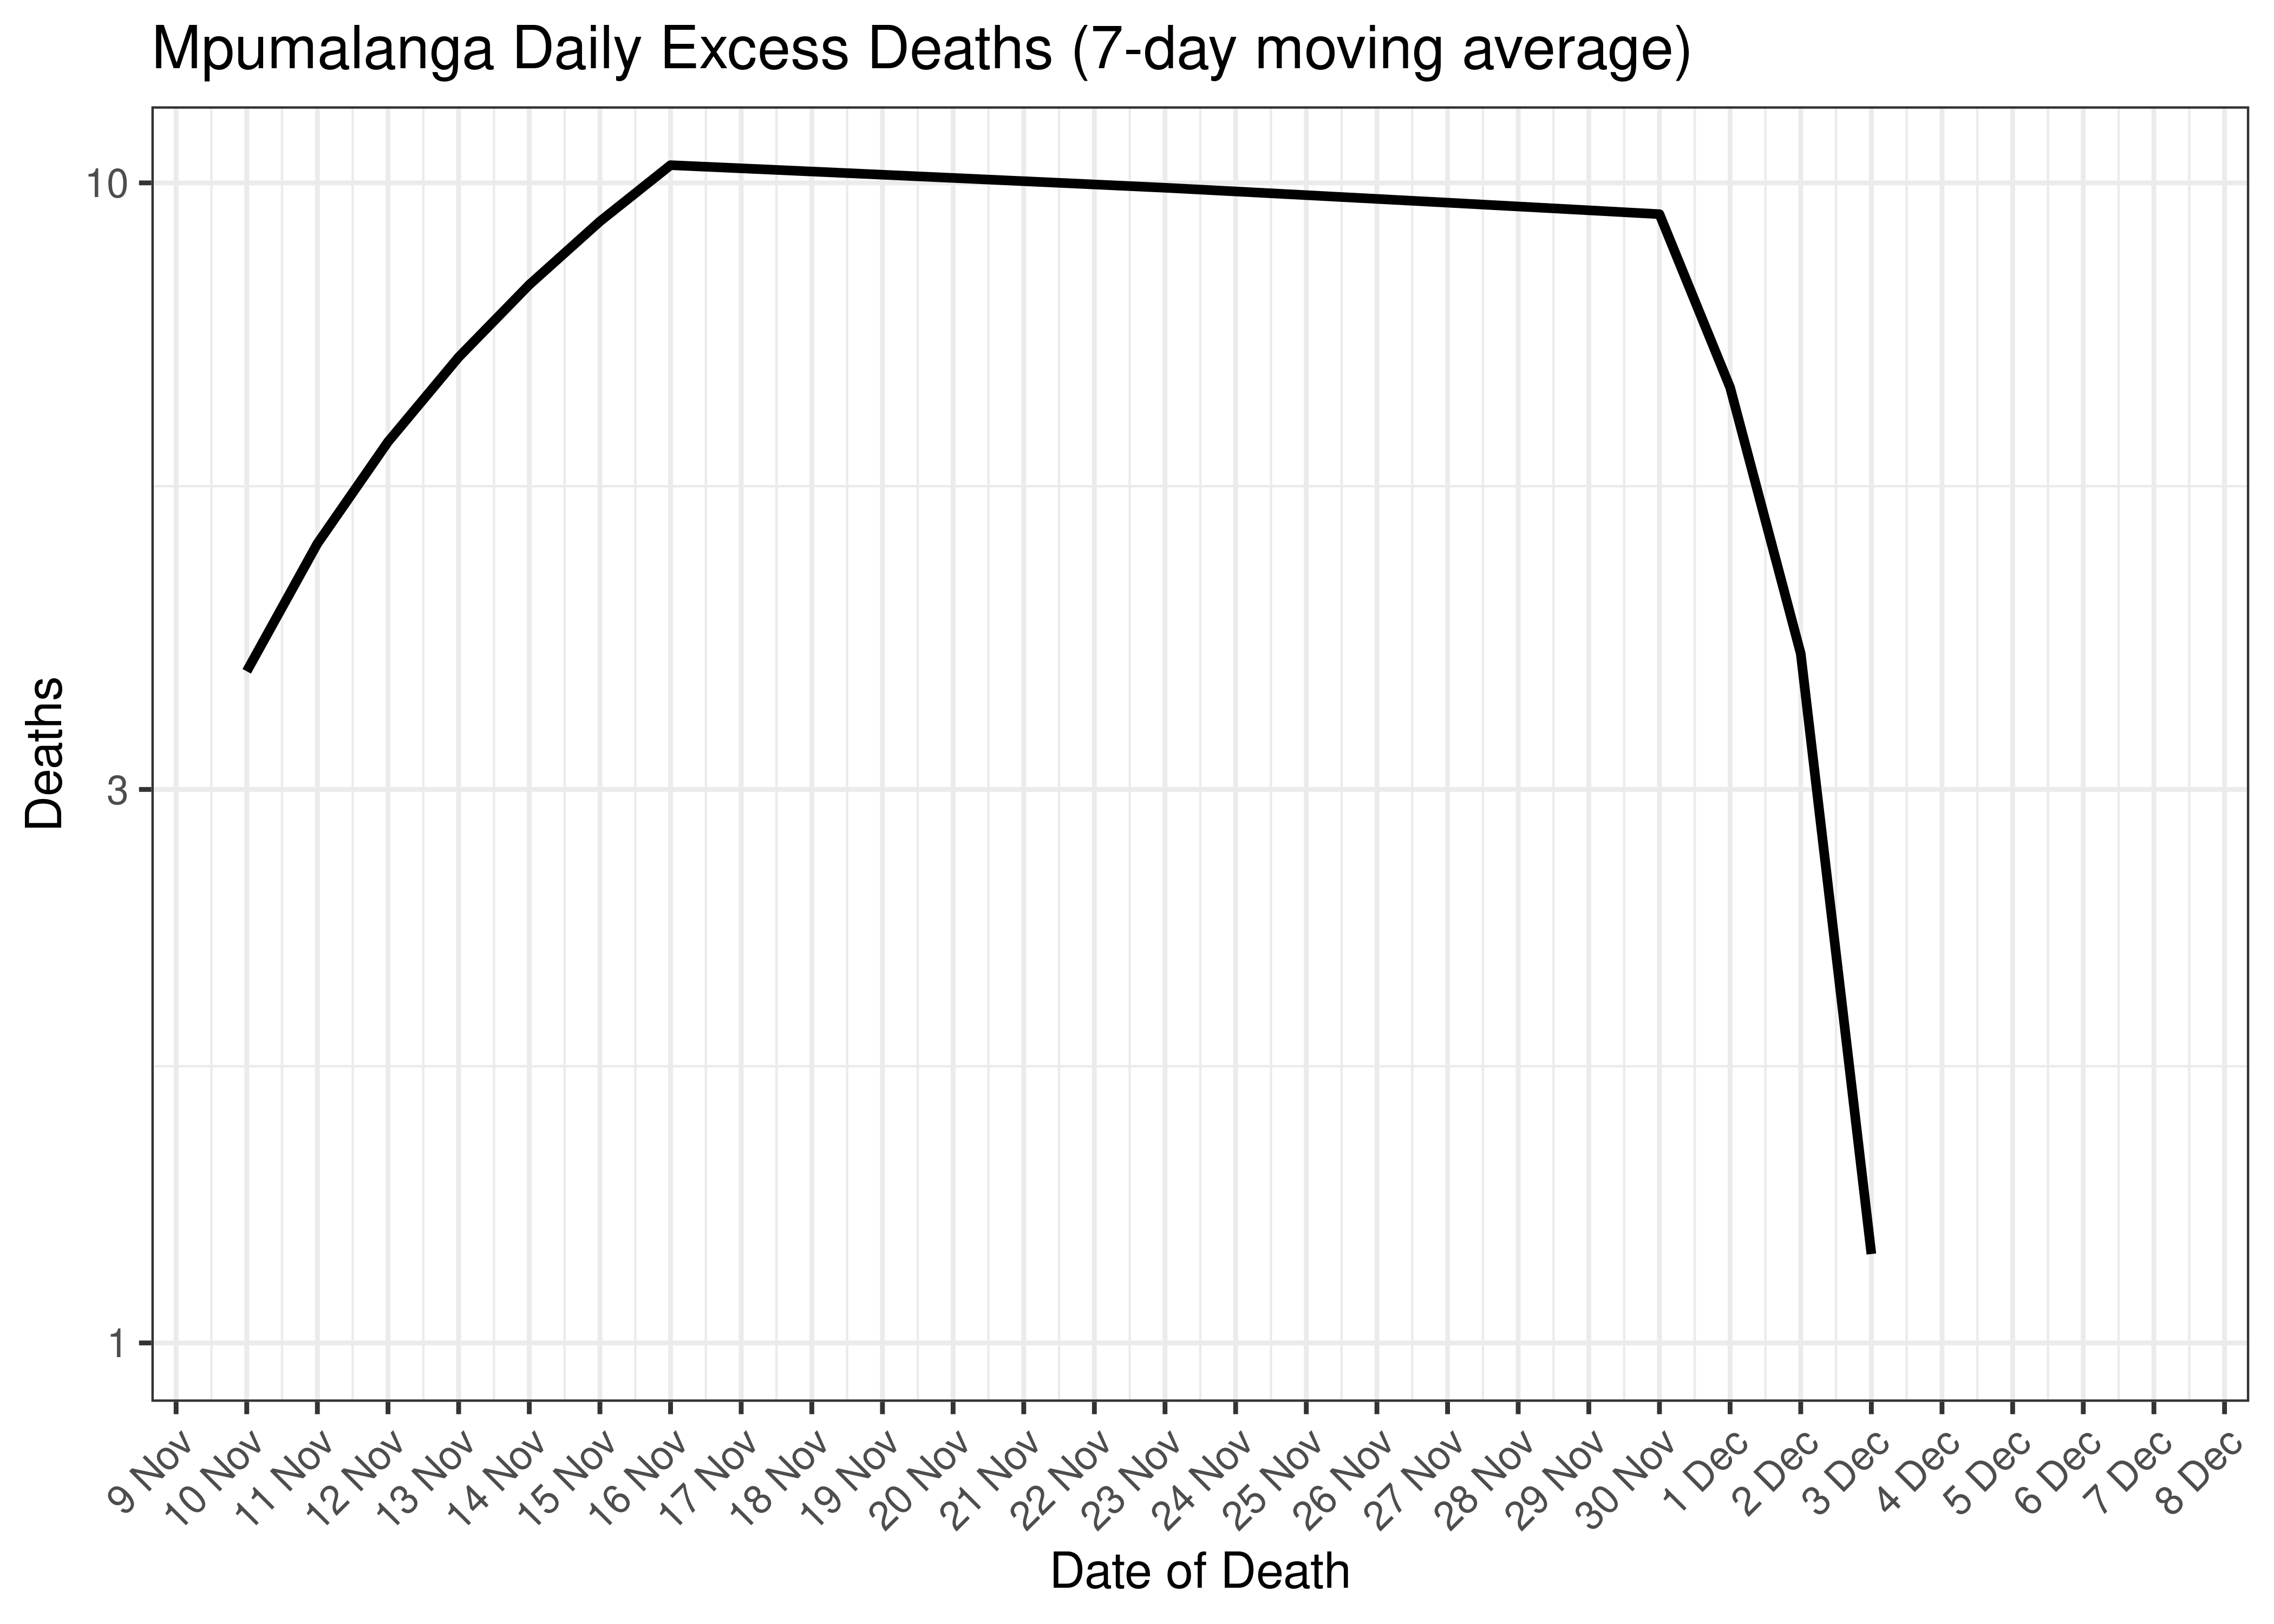
Mpumalanga Daily Excess Deaths for Last 30-days (7-day moving average)
6.7.5 Cases, Admissions and Deaths Combined
Below a 7-day moving average daily case, admission and excess death counts are plotted for Mpumalanga on a log scale since start of the epidemic. Note admissions and excess deaths are plotted by reported date, whereas cases are plotted by specimen received date.
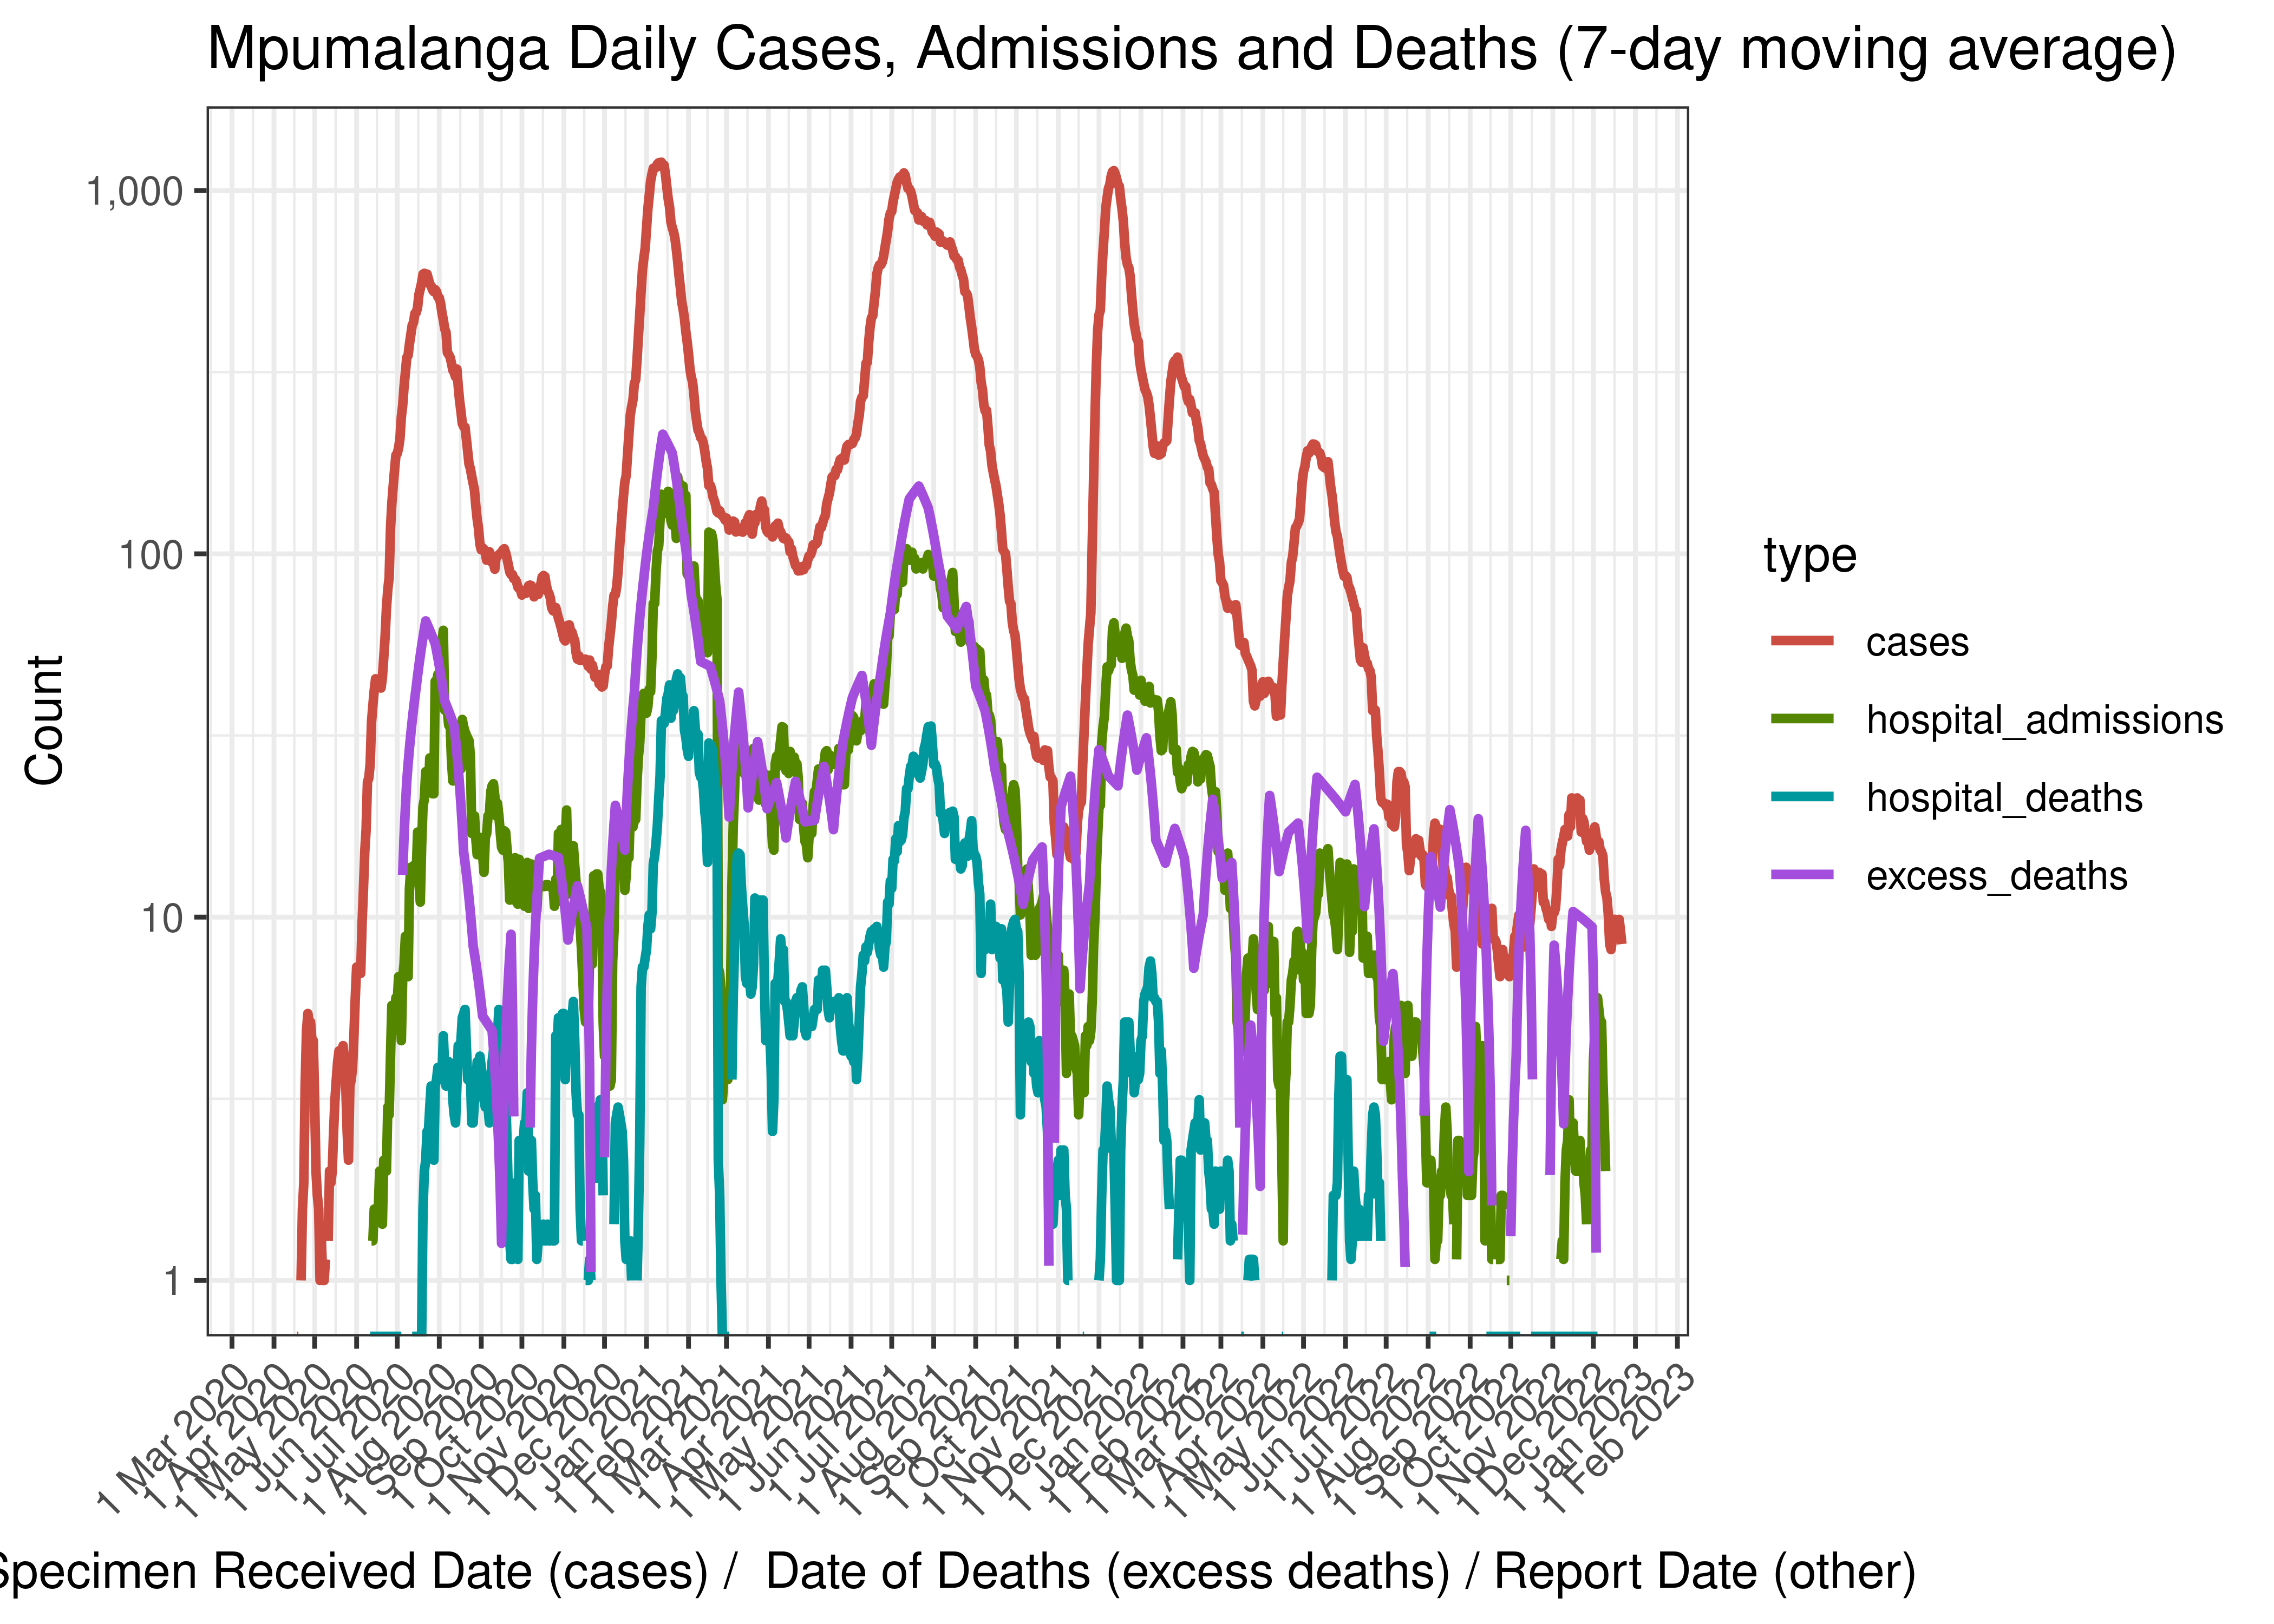
Mpumalanga Daily Cases, Admissions and Deaths (7-day moving average)
Below the above chart is repeated for the last 30-days:

Mpumalanga Daily Cases, Admissions and Deaths for Last 30-days (7-day moving average)
6.7.6 Crude Ratios per Wave
Below crude rations are calculated between the waves. It’s based on the following starting dates:
- Wave 1 started on 2020-01-01.
- Wave 2 started on 2020-10-01.
- Wave 3 started on 2021-04-01.
- Wave 4 started on 2021-11-01.
- Wave 5 started on 2022-04-01.
Below crude ratios are tabulated and plotted. These ratios are:
- Case admissions ratio calculated as admissions divided by cases.
- Case fatality ratio calculated as hospital deaths divided by cases (Note that COVID-19 deaths are under-reported by a significant factor in South Africa).
- Case excess deaths ratio calculated as excess deaths divided by cases.
- Hospital fatality ratio calculated as hospital deaths divided by admissions (Note that COVID-19 deaths are under-reported by a significant factor in South Africa).
- Death reporting ratio calculated as hospital deaths divided by excess deaths.
| Wave | Case Admission Ratio | Case Fatality Ratio | Case Excess Deaths Ratio | Hospital Fatality Ratio | Death Reporting Ratio | |
|---|---|---|---|---|---|---|
| Mpumalanga | Wave 1 | 7.5% | 0.91% | 7.75% | 12.2% | 11.8% |
| Mpumalanga | Wave 2 | 15.4% | 4.24% | 18.17% | 27.5% | 23.4% |
| Mpumalanga | Wave 3 | 11.8% | 2.94% | 13.08% | 24.9% | 22.5% |
| Mpumalanga | Wave 4 | 9.1% | 0.79% | 6.27% | 8.7% | 12.6% |
| Mpumalanga | Wave 5 | 10.7% | 1.12% | 22.62% | 10.5% | 4.9% |
Below the rations above are plotted graphically:
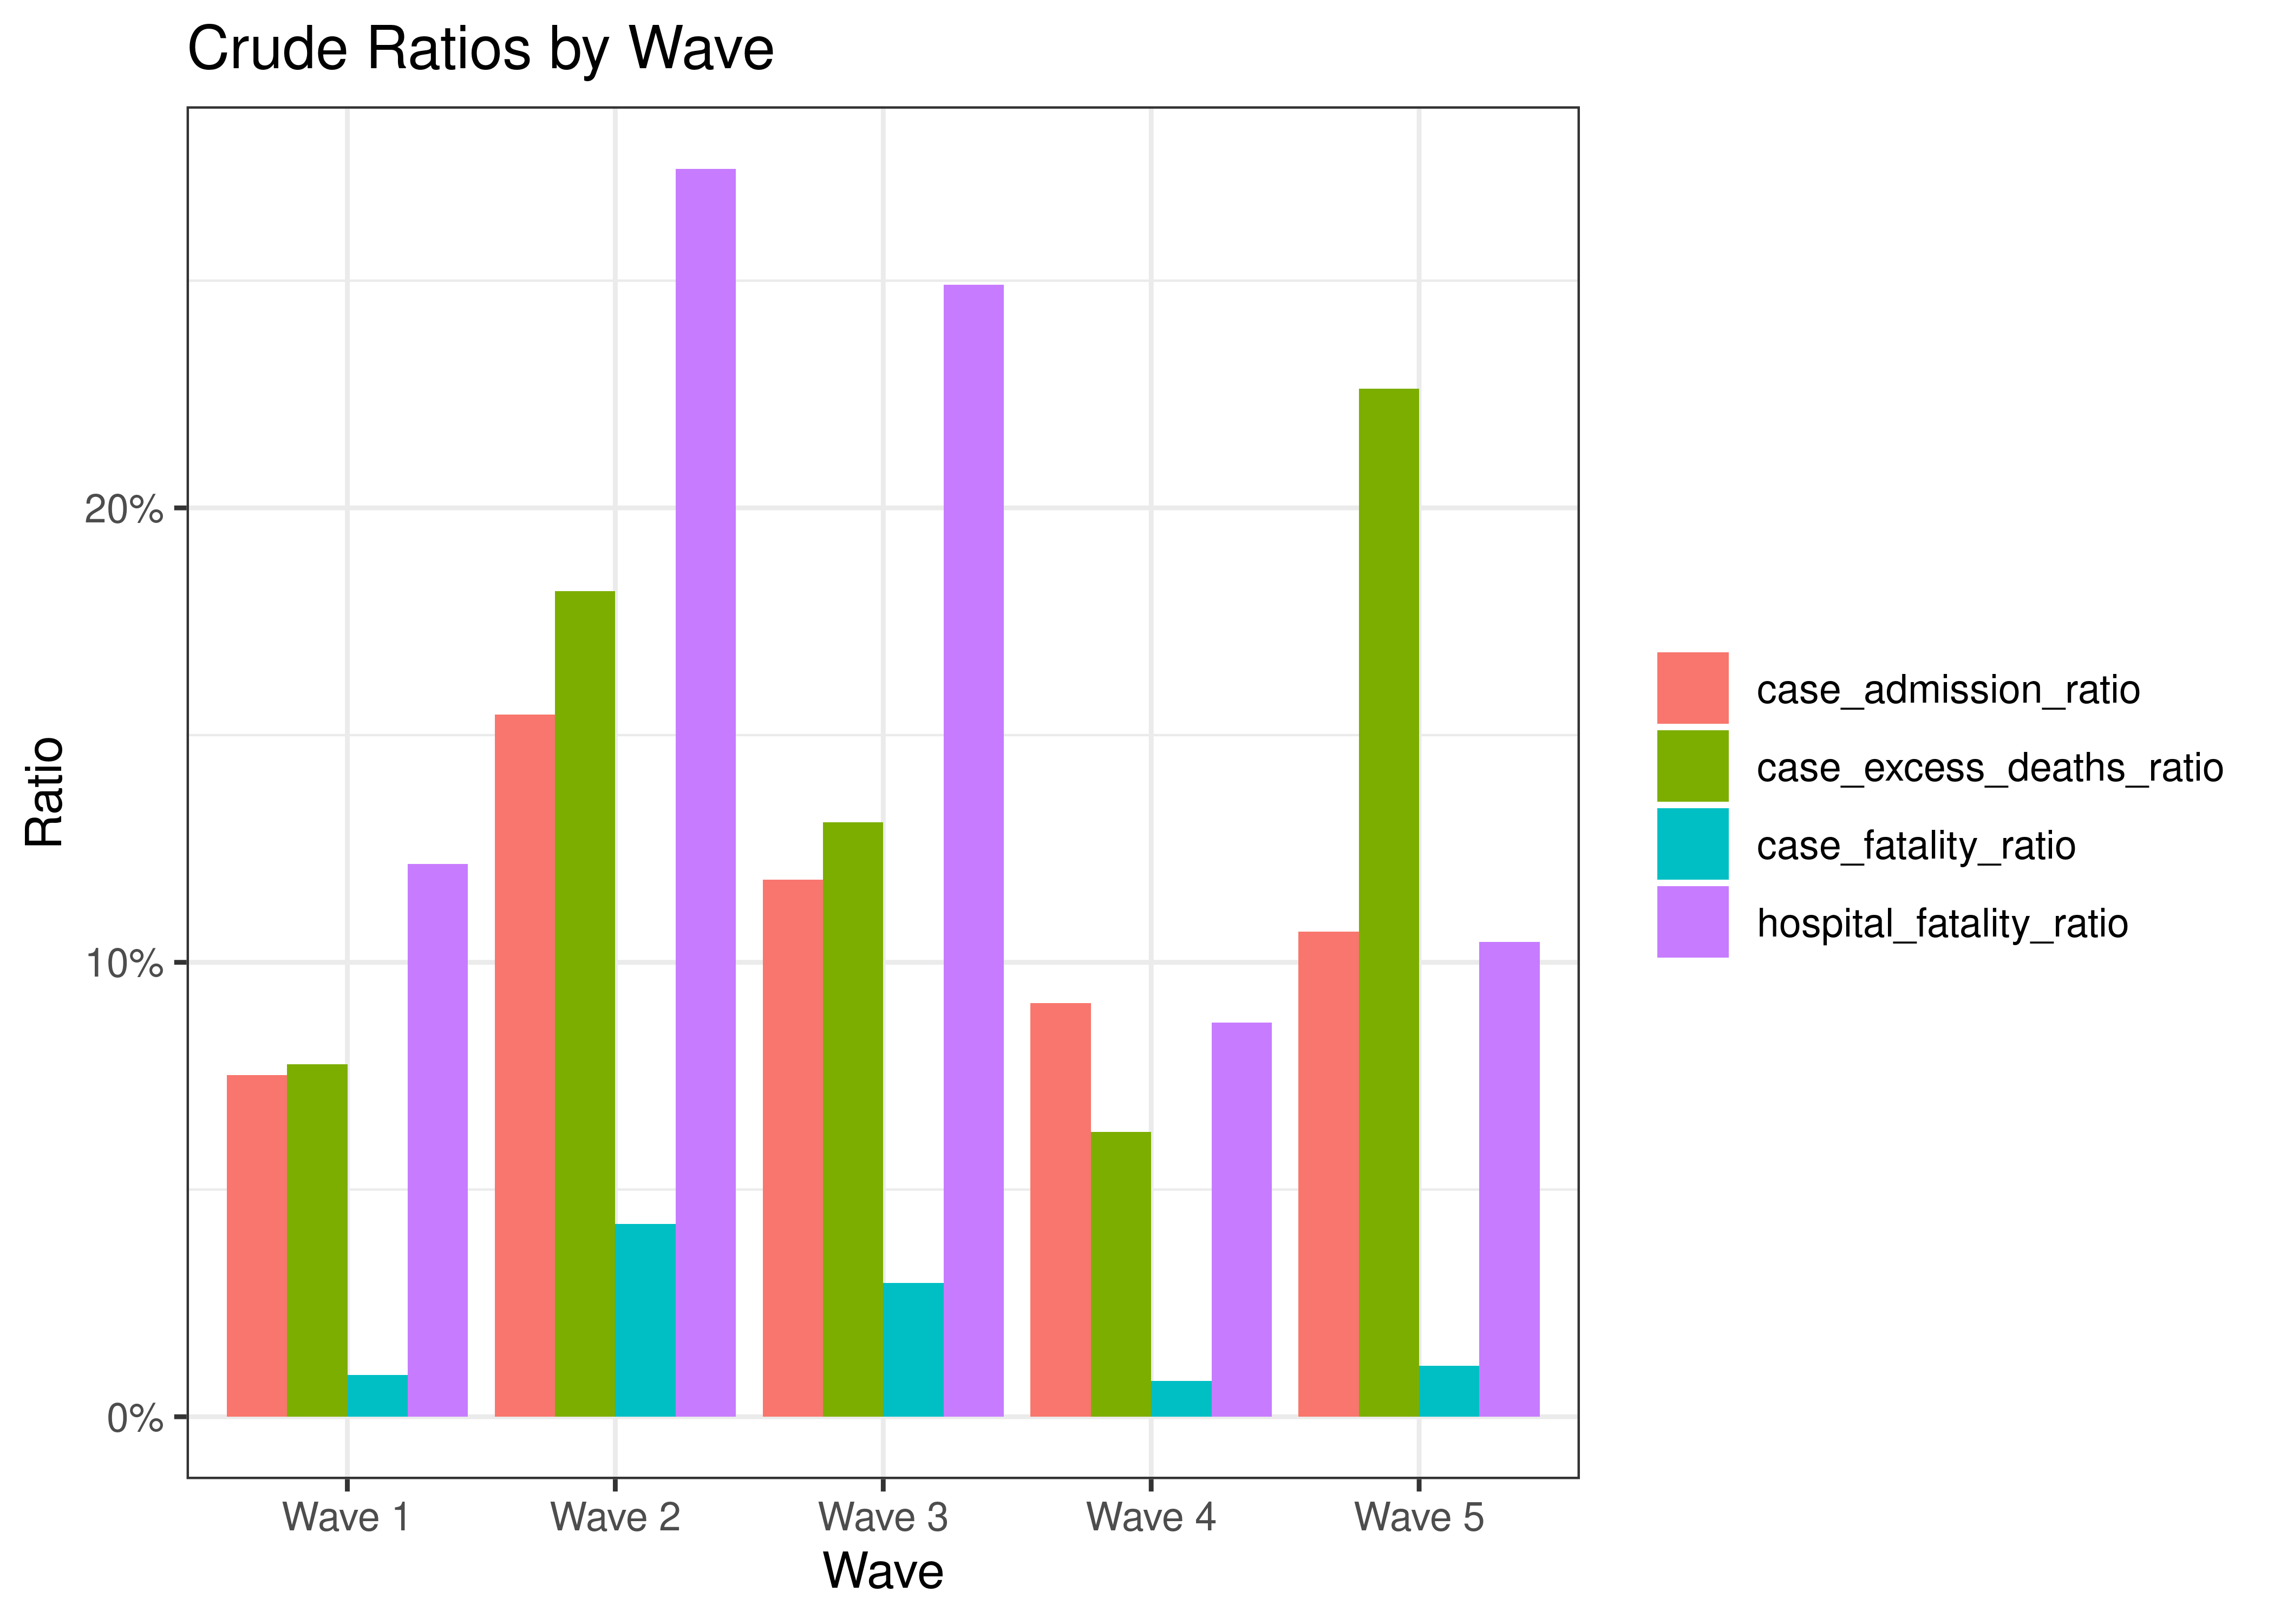
Crude Ratios by Wave
6.7.7 Reproduction Number
Below current (last weekly) effective reproduction number estimates are tabulated for Mpumalanga and by district municipality.
| Type | Count (Per Day) | Week Ending | Reproduction Number [95% Confidence Interval] | |
|---|---|---|---|---|
| Mpumalanga | cases | 8.4 | 2022-12-25 | 0.91 [0.69 - 1.15] |
| Mpumalanga | hospital_admissions | 2.0 | 2022-12-13 | 0.42 [0.24 - 0.67] |
| District Municipality | Type | Count (Per Day) | Week Ending | Reproduction Number [95% Confidence Interval] |
|---|---|---|---|---|
| Ehlanzeni | cases | 4.6 | 2022-12-25 | 0.96 [0.66 - 1.32] |
| Gert Sibande | cases | 1.4 | 2022-12-25 | 0.86 [0.43 - 1.45] |
| Nkangala | cases | 2.4 | 2022-12-25 | 0.93 [0.55 - 1.40] |
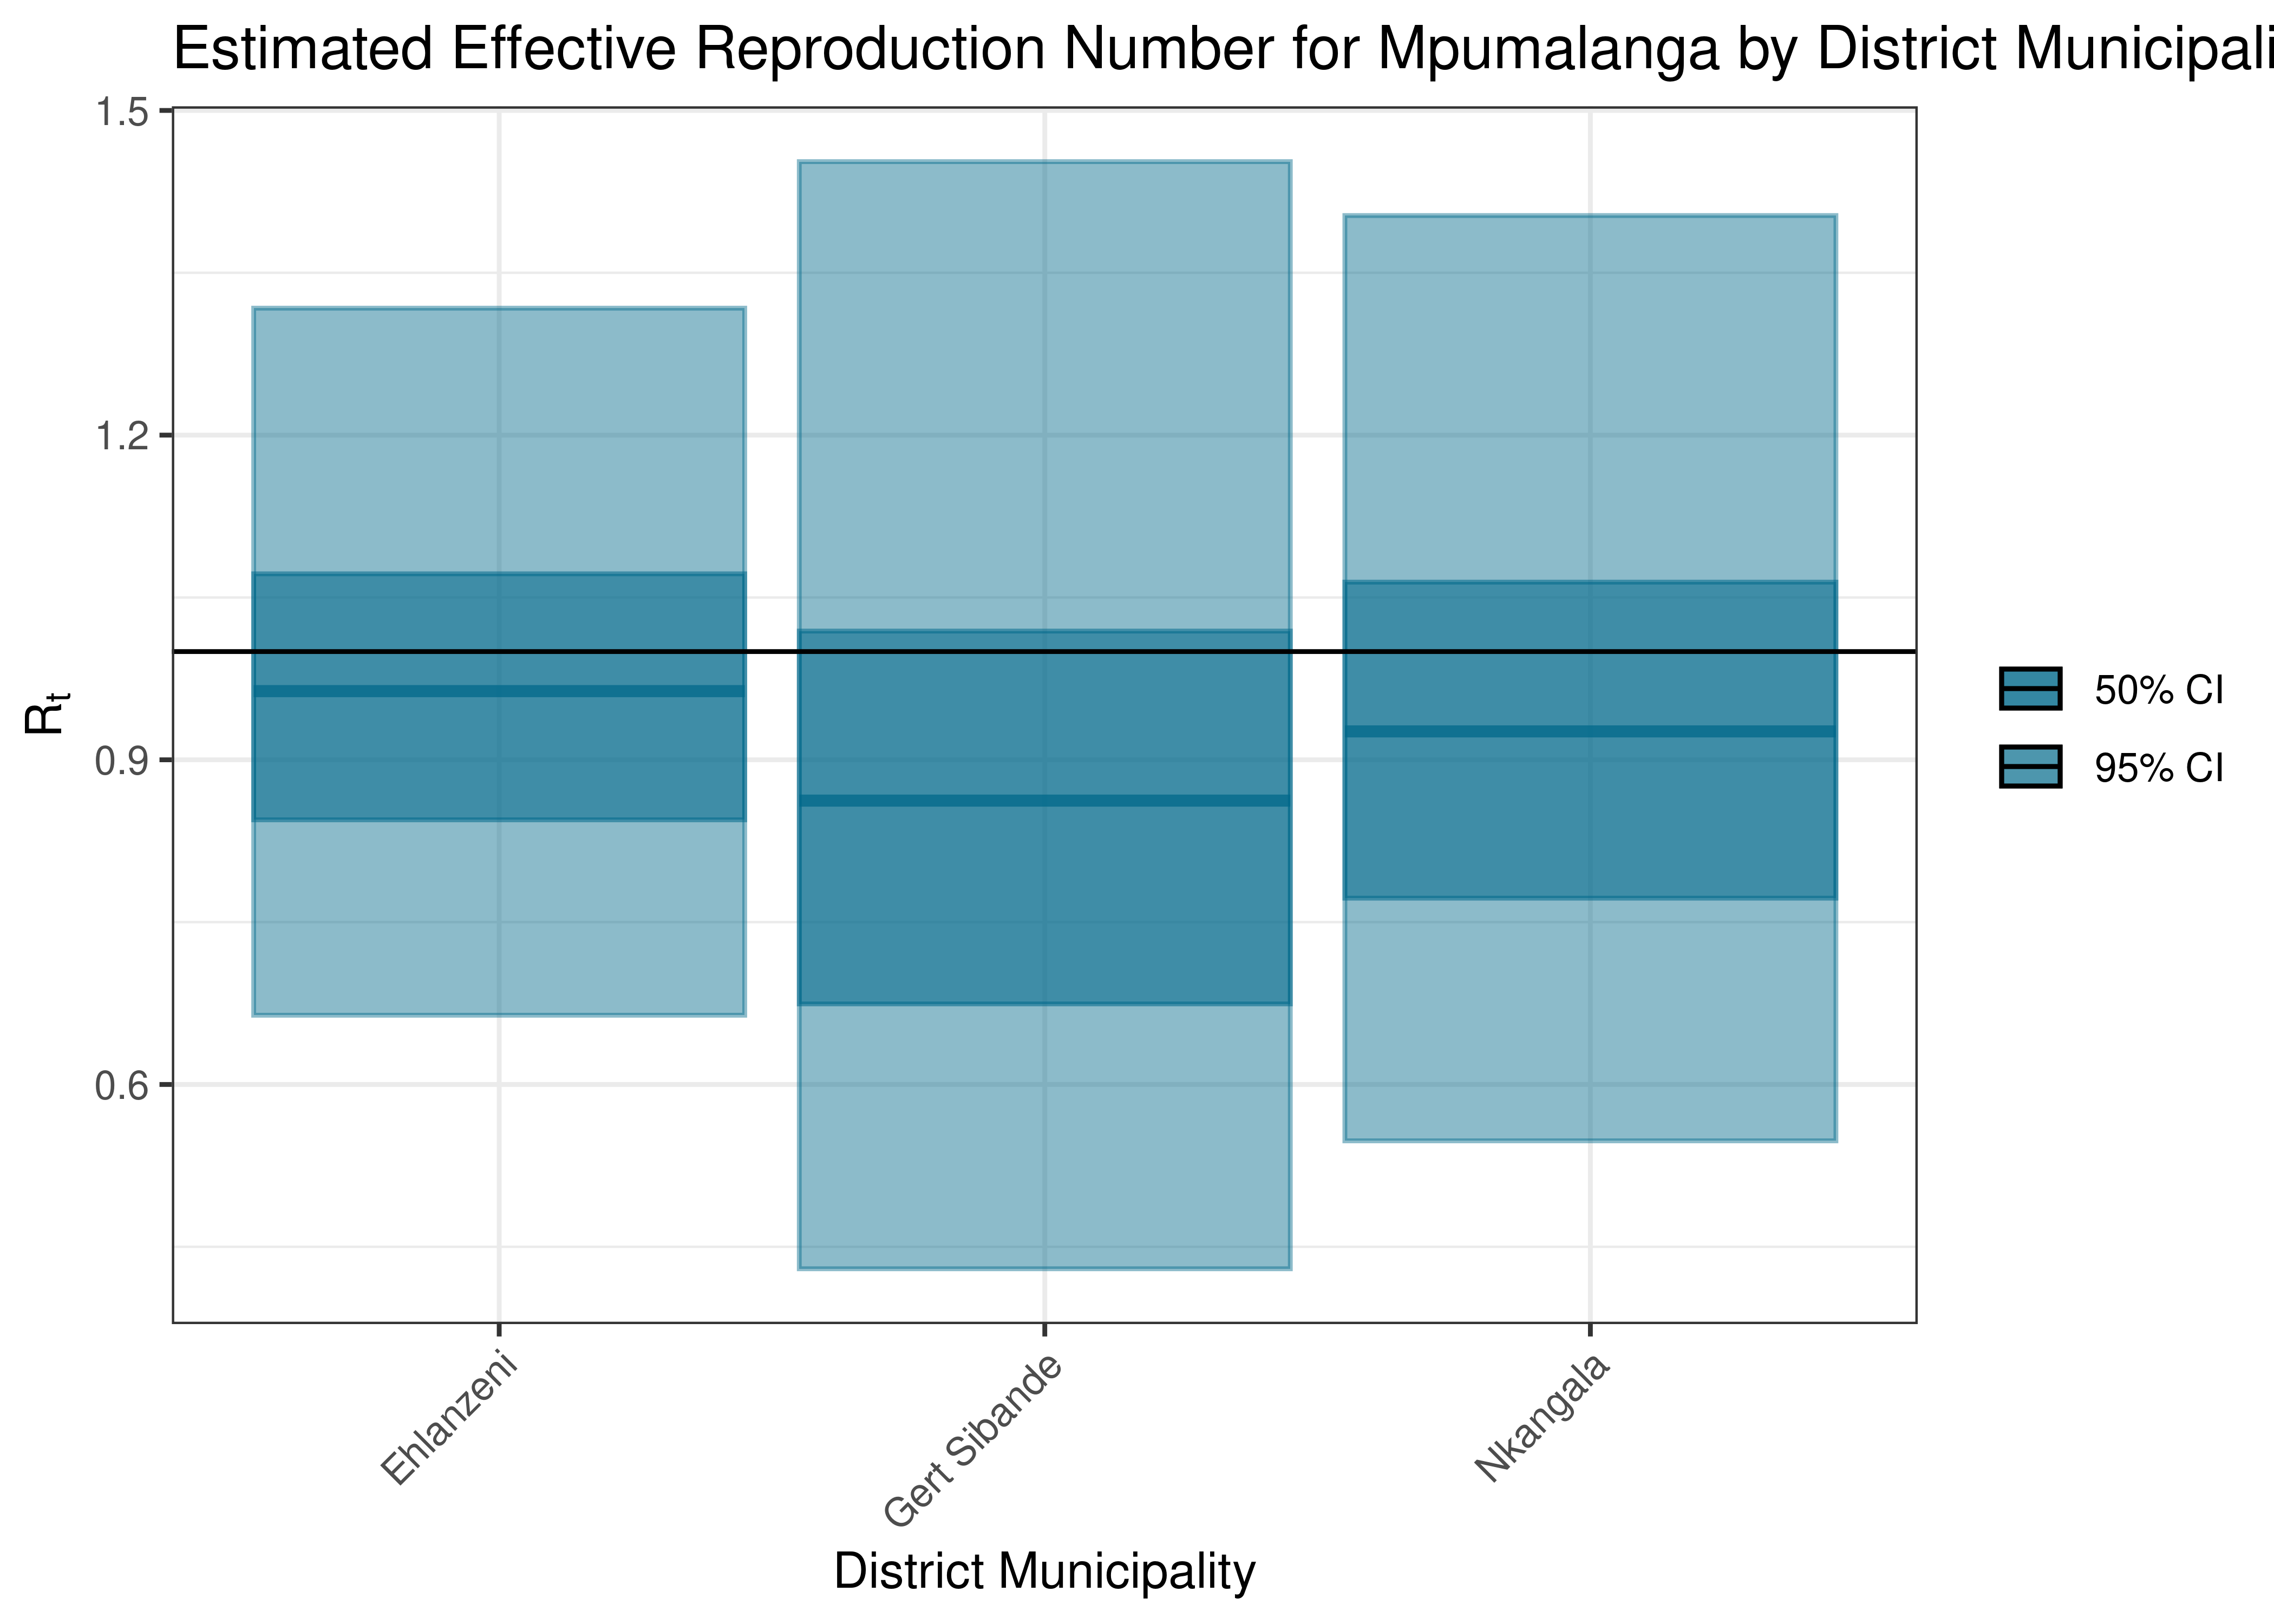
Estimated Effective Reproduction Number for Mpumalanga by District Municipality
Below the effective reproduction number for Mpumalanga over the last 90 days are plotted together with a plot since start of the pandemic.
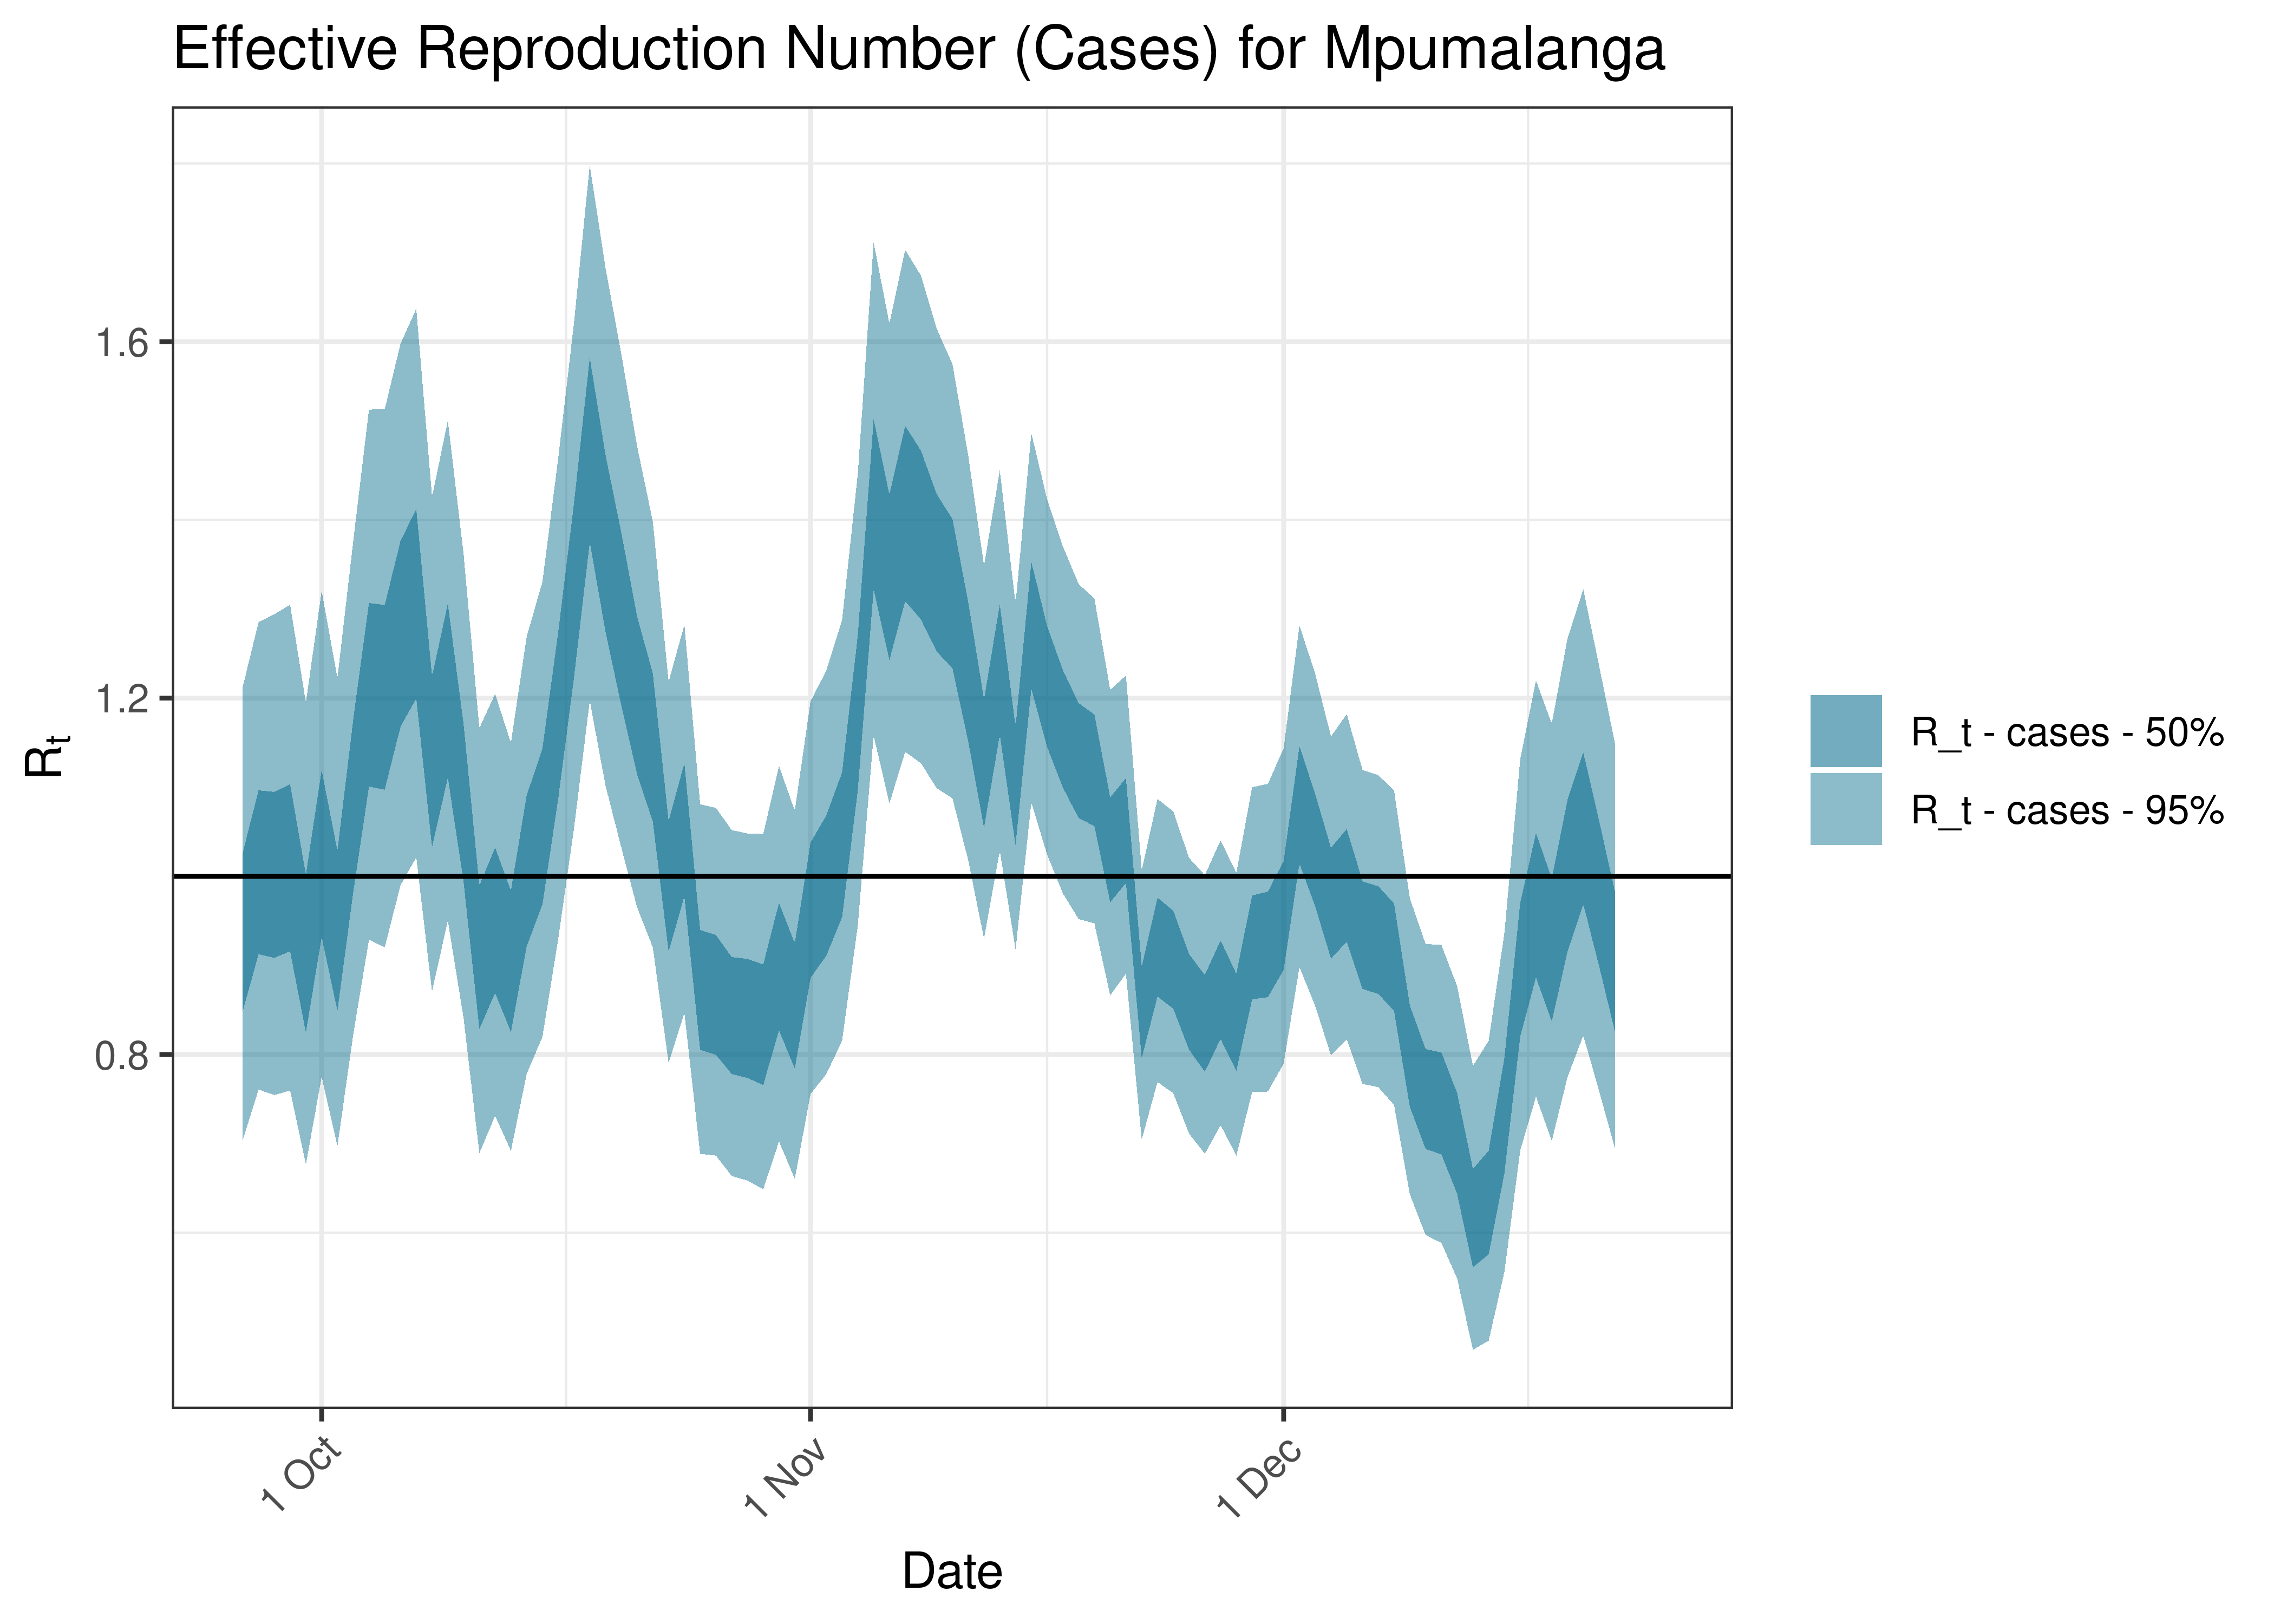
Estimated Effective Reproduction Number Based on Cases for Mpumalanga over last 90 days
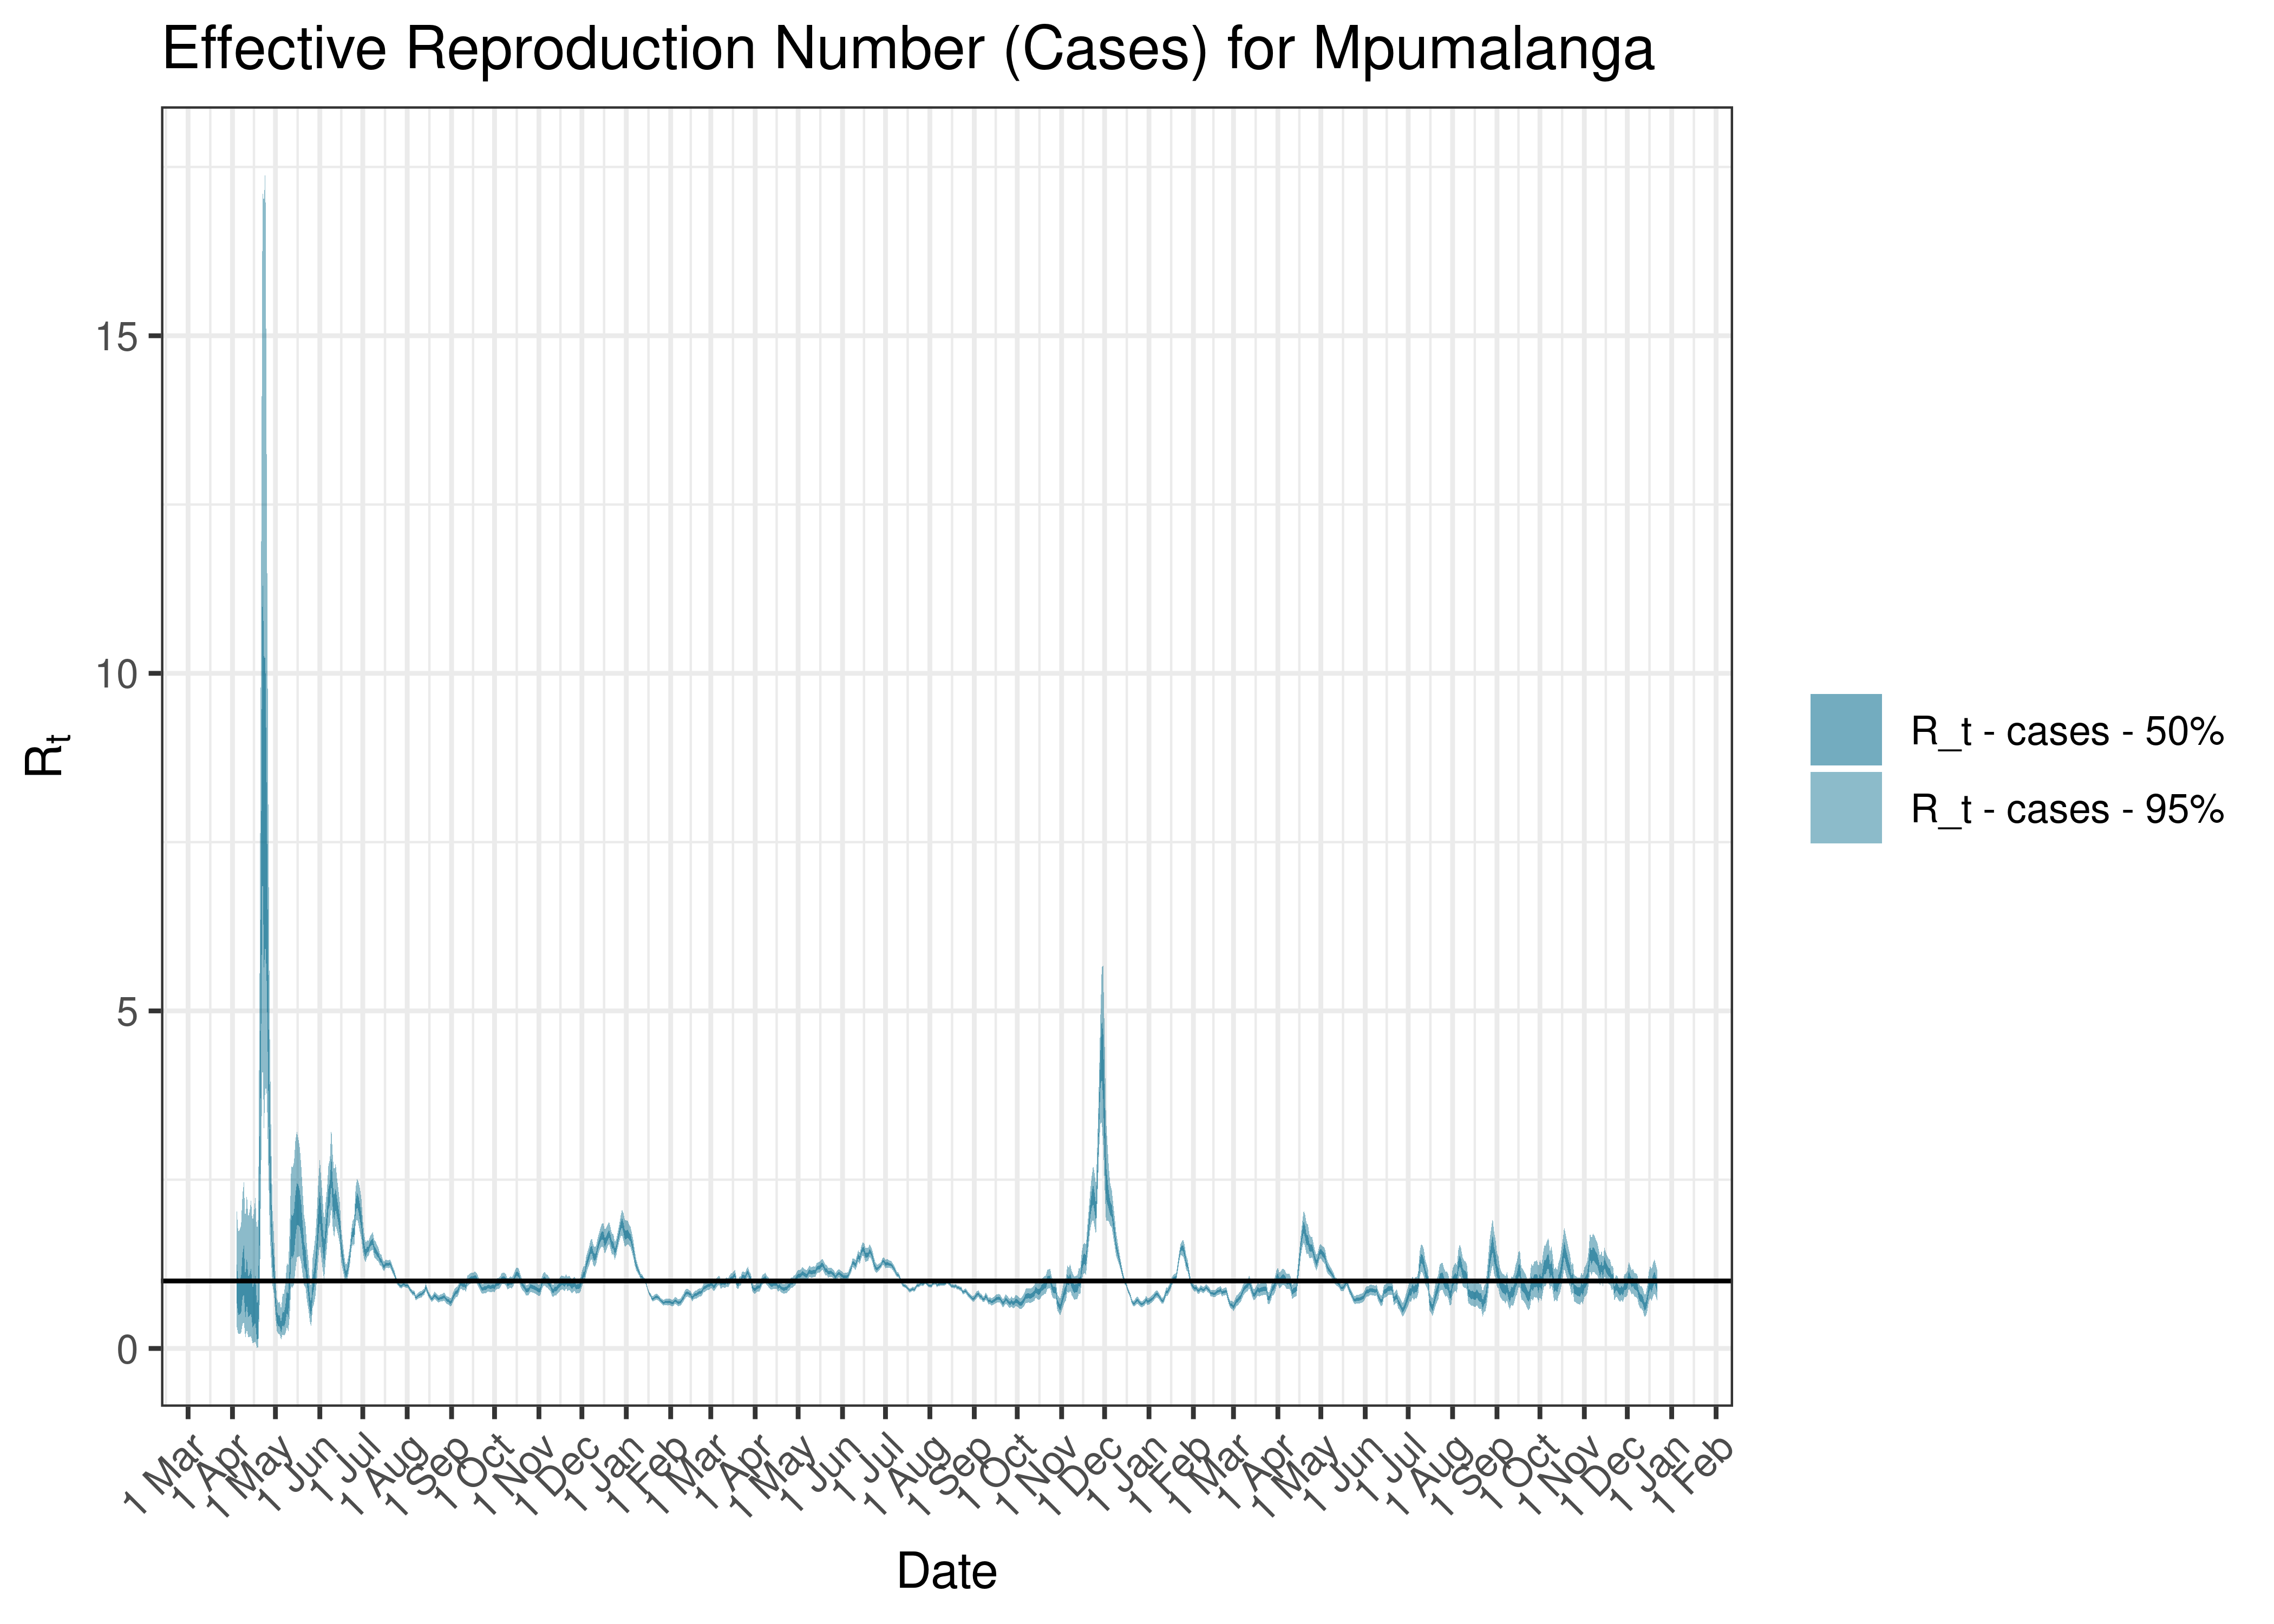
Estimated Effective Reproduction Number Based on Cases for Mpumalanga since 1 April 2020
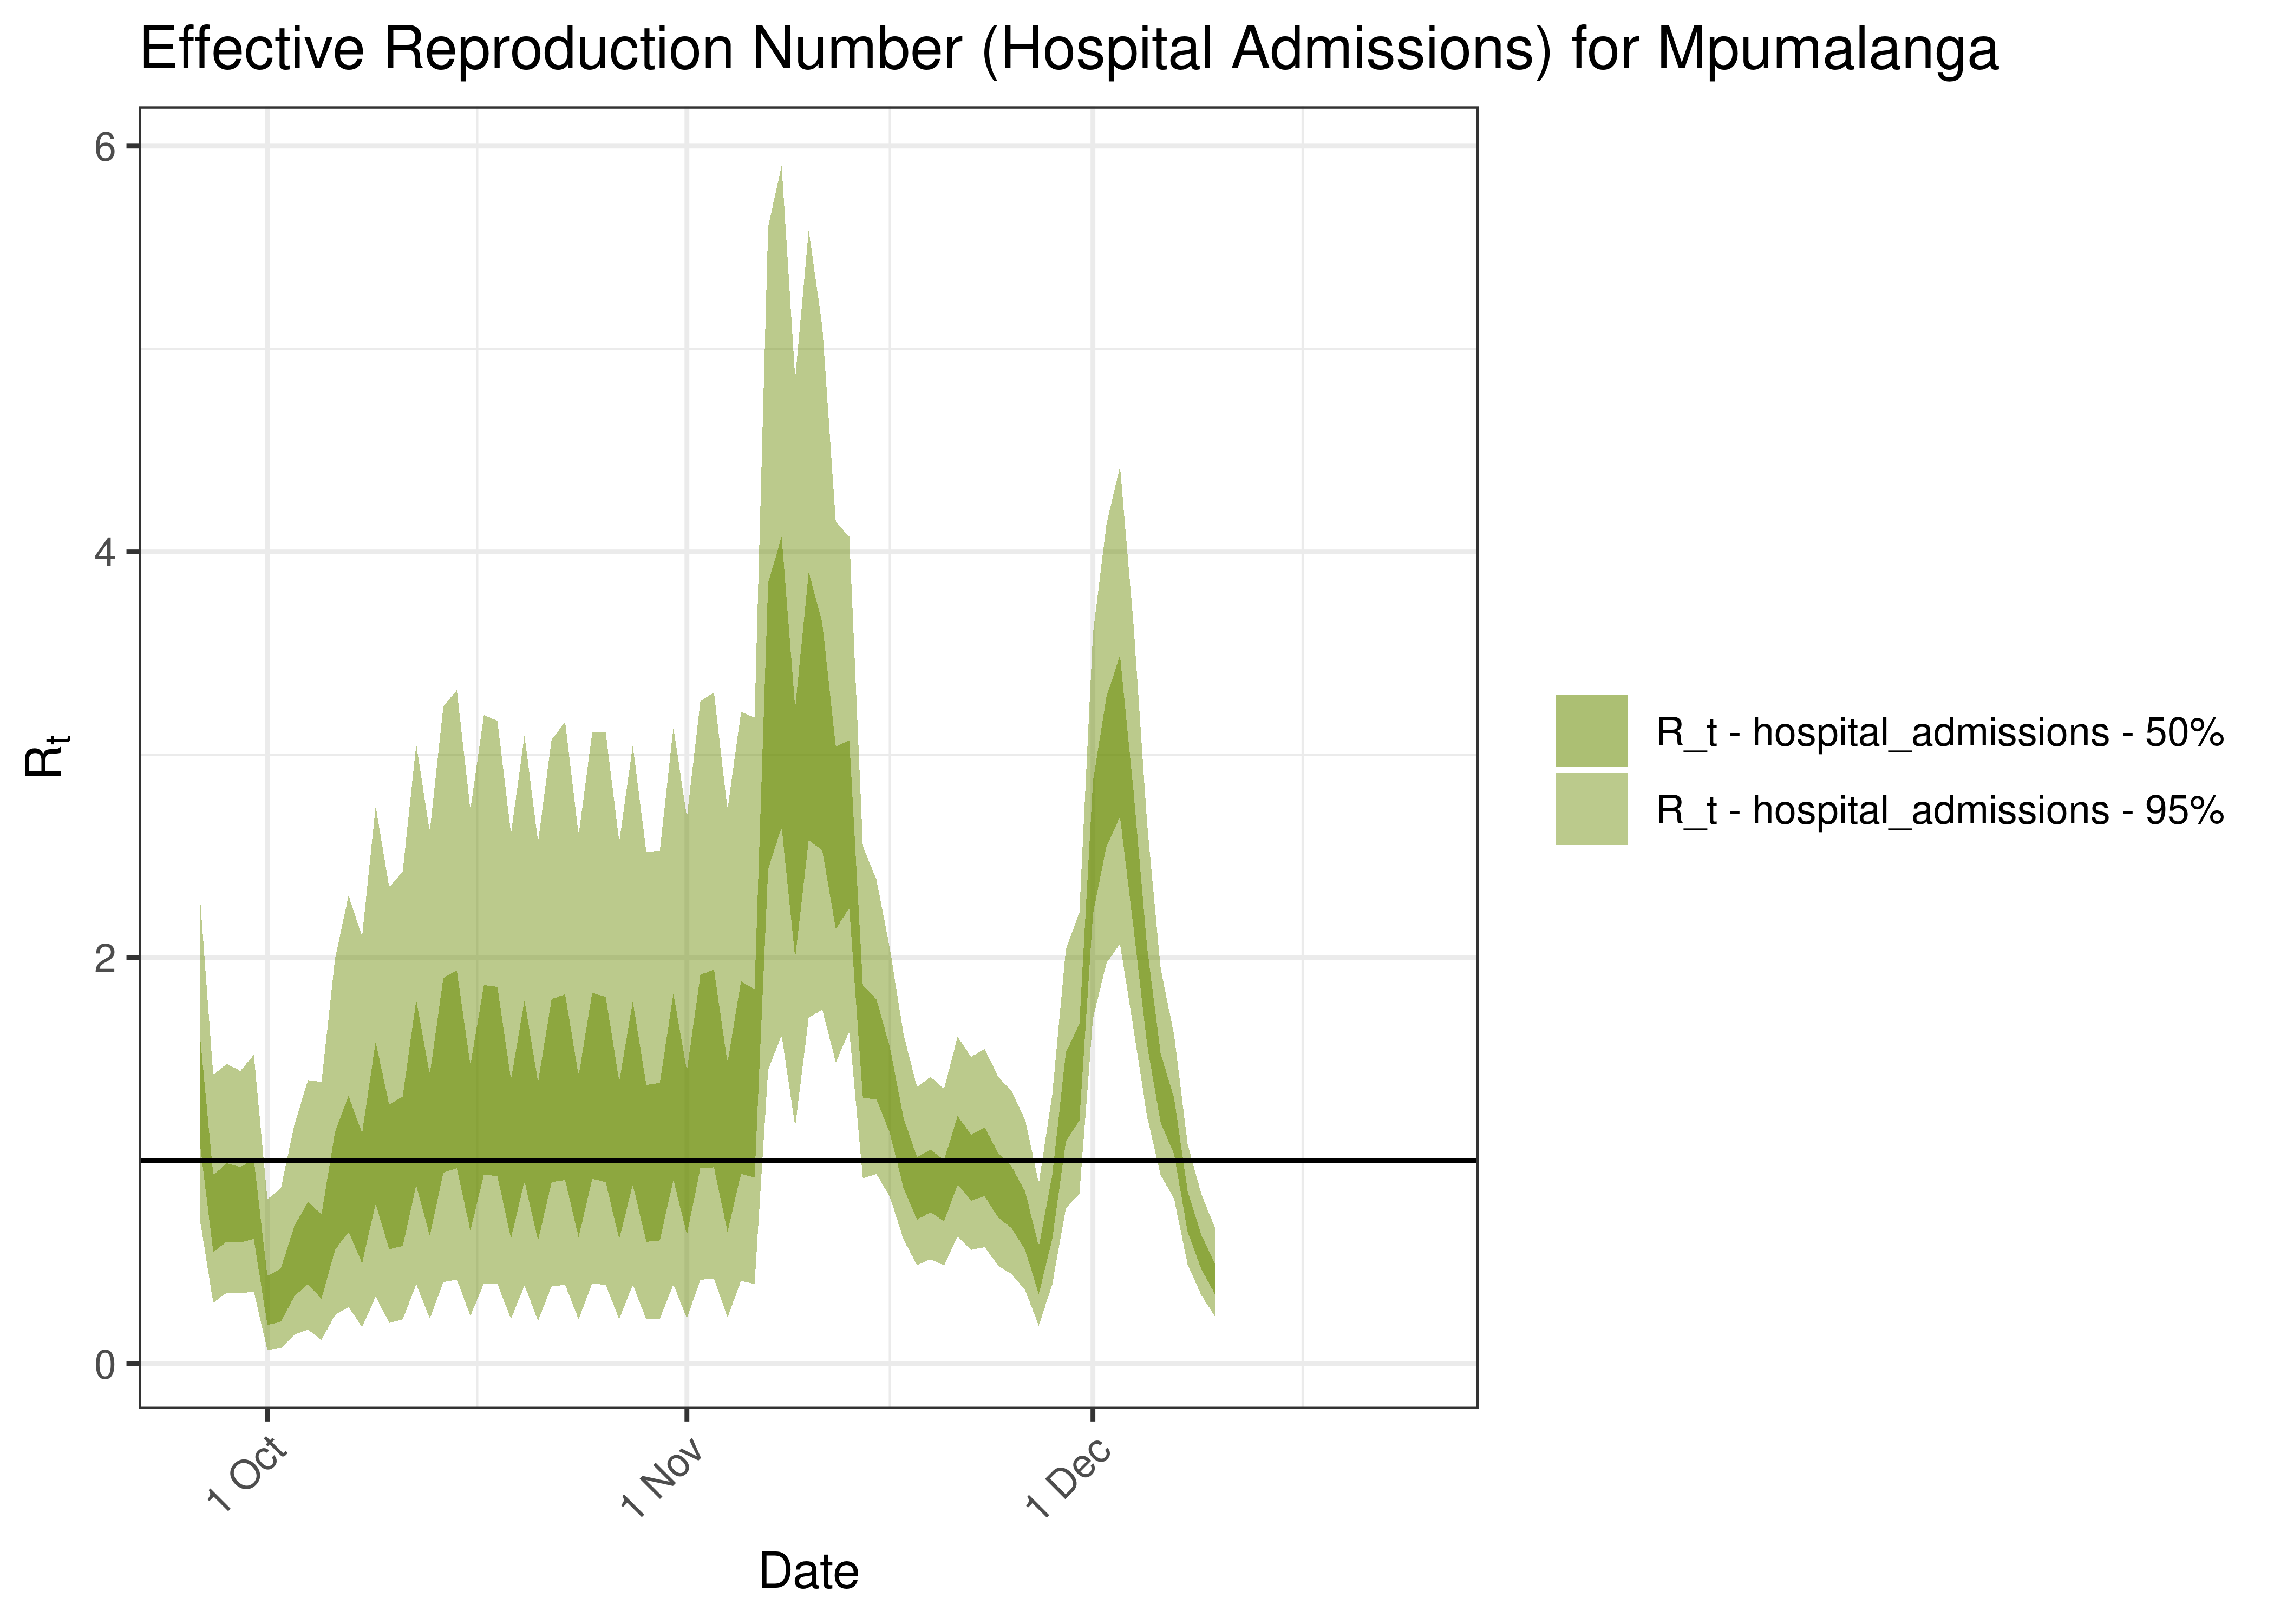
Estimated Effective Reproduction Number Based on Hospital Admissions for Mpumalanga over last 90 days
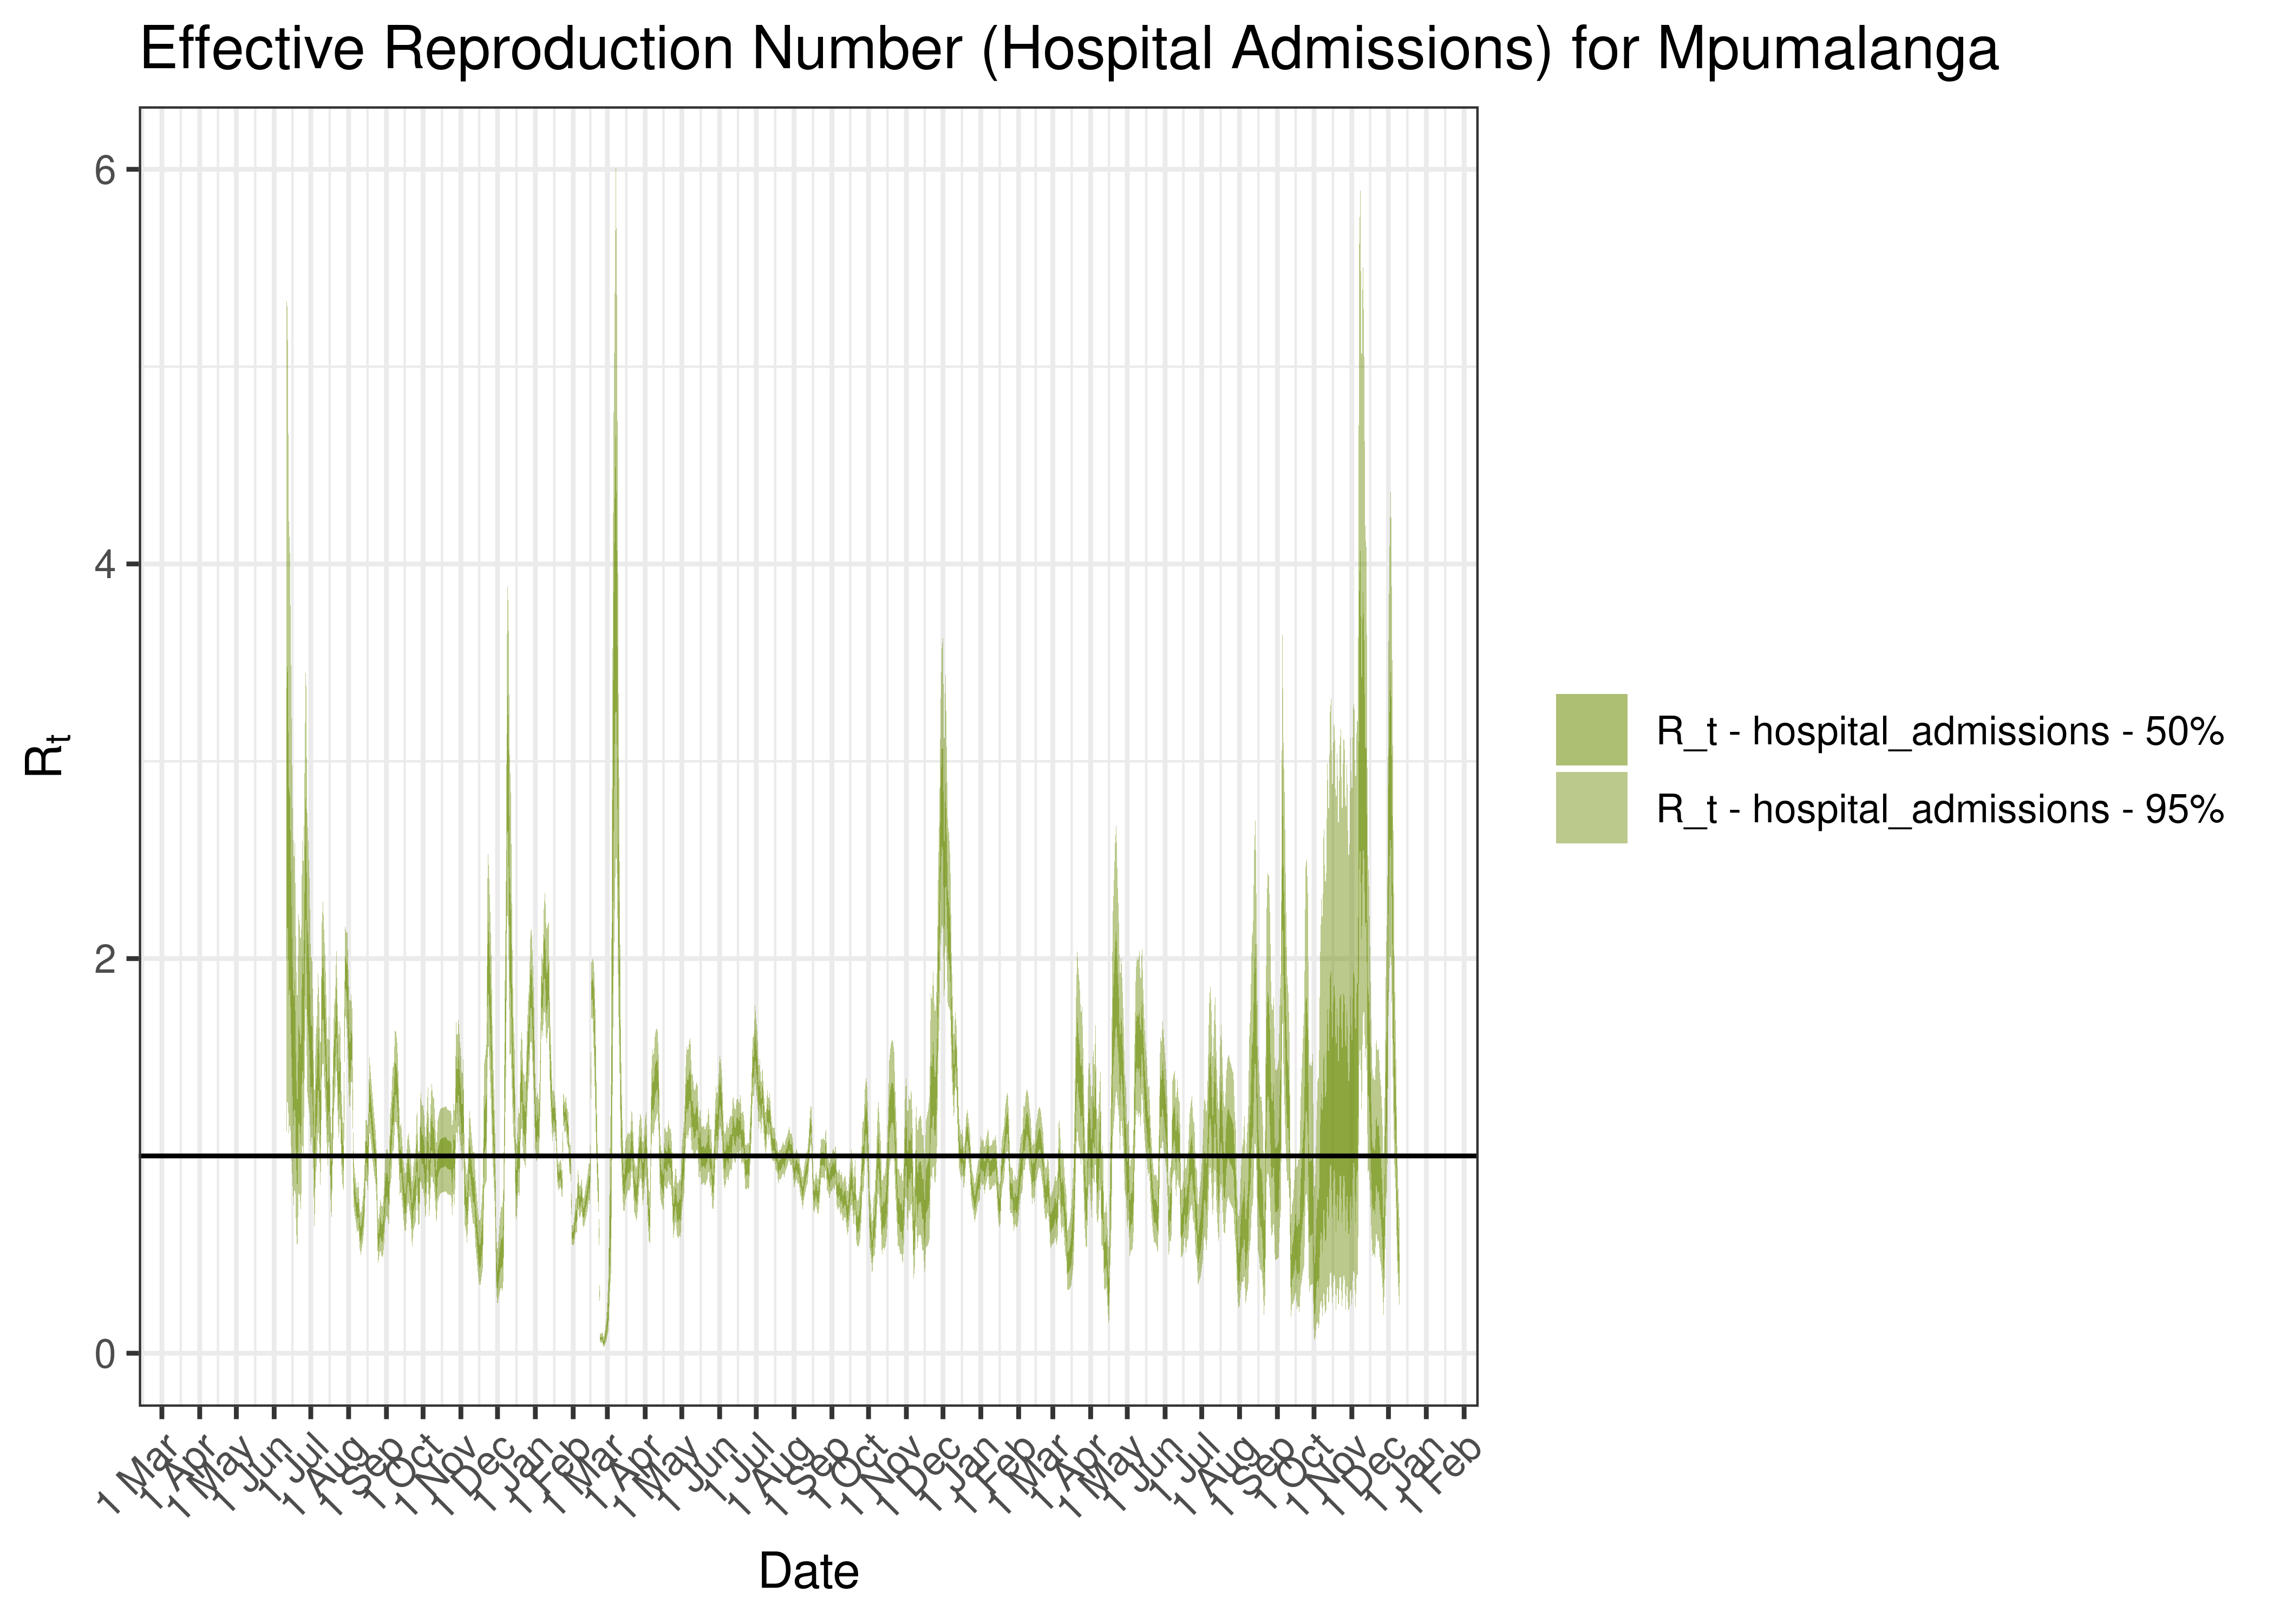
Estimated Effective Reproduction Number Based on Hospital Admissions for Mpumalanga since 1 April 2020
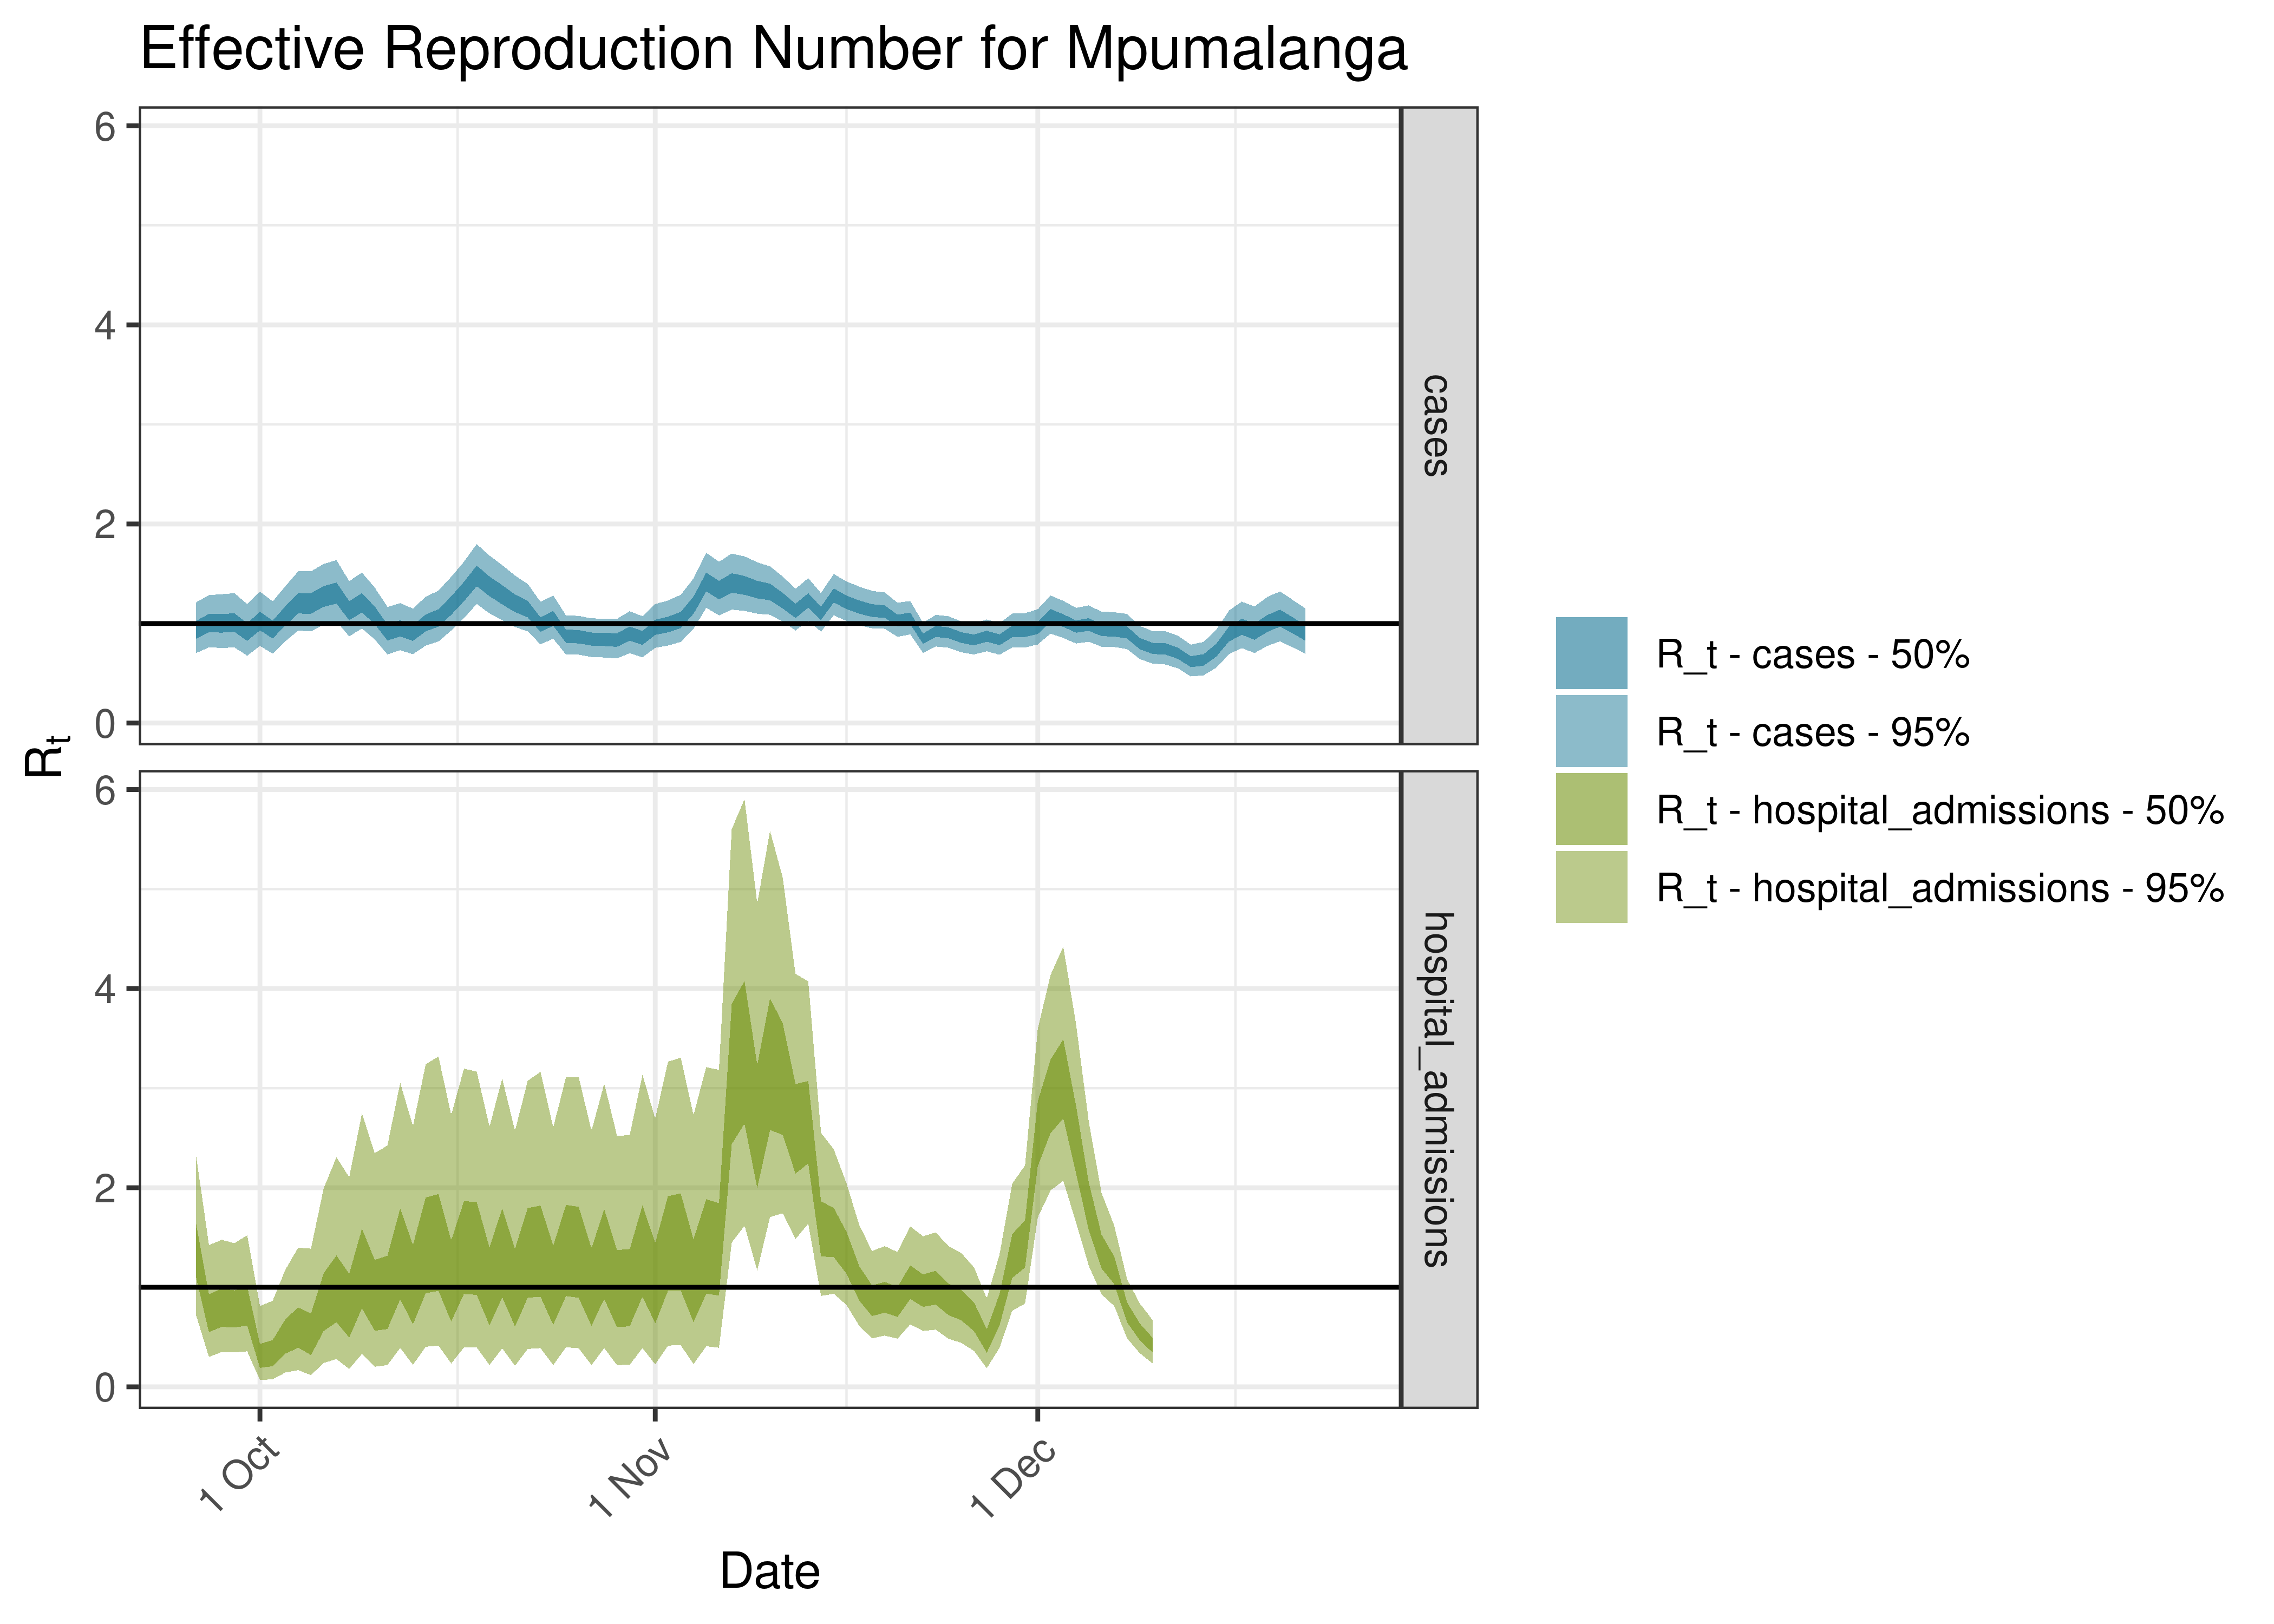
Estimated Effective Reproduction Number for Mpumalanga over last 90 days
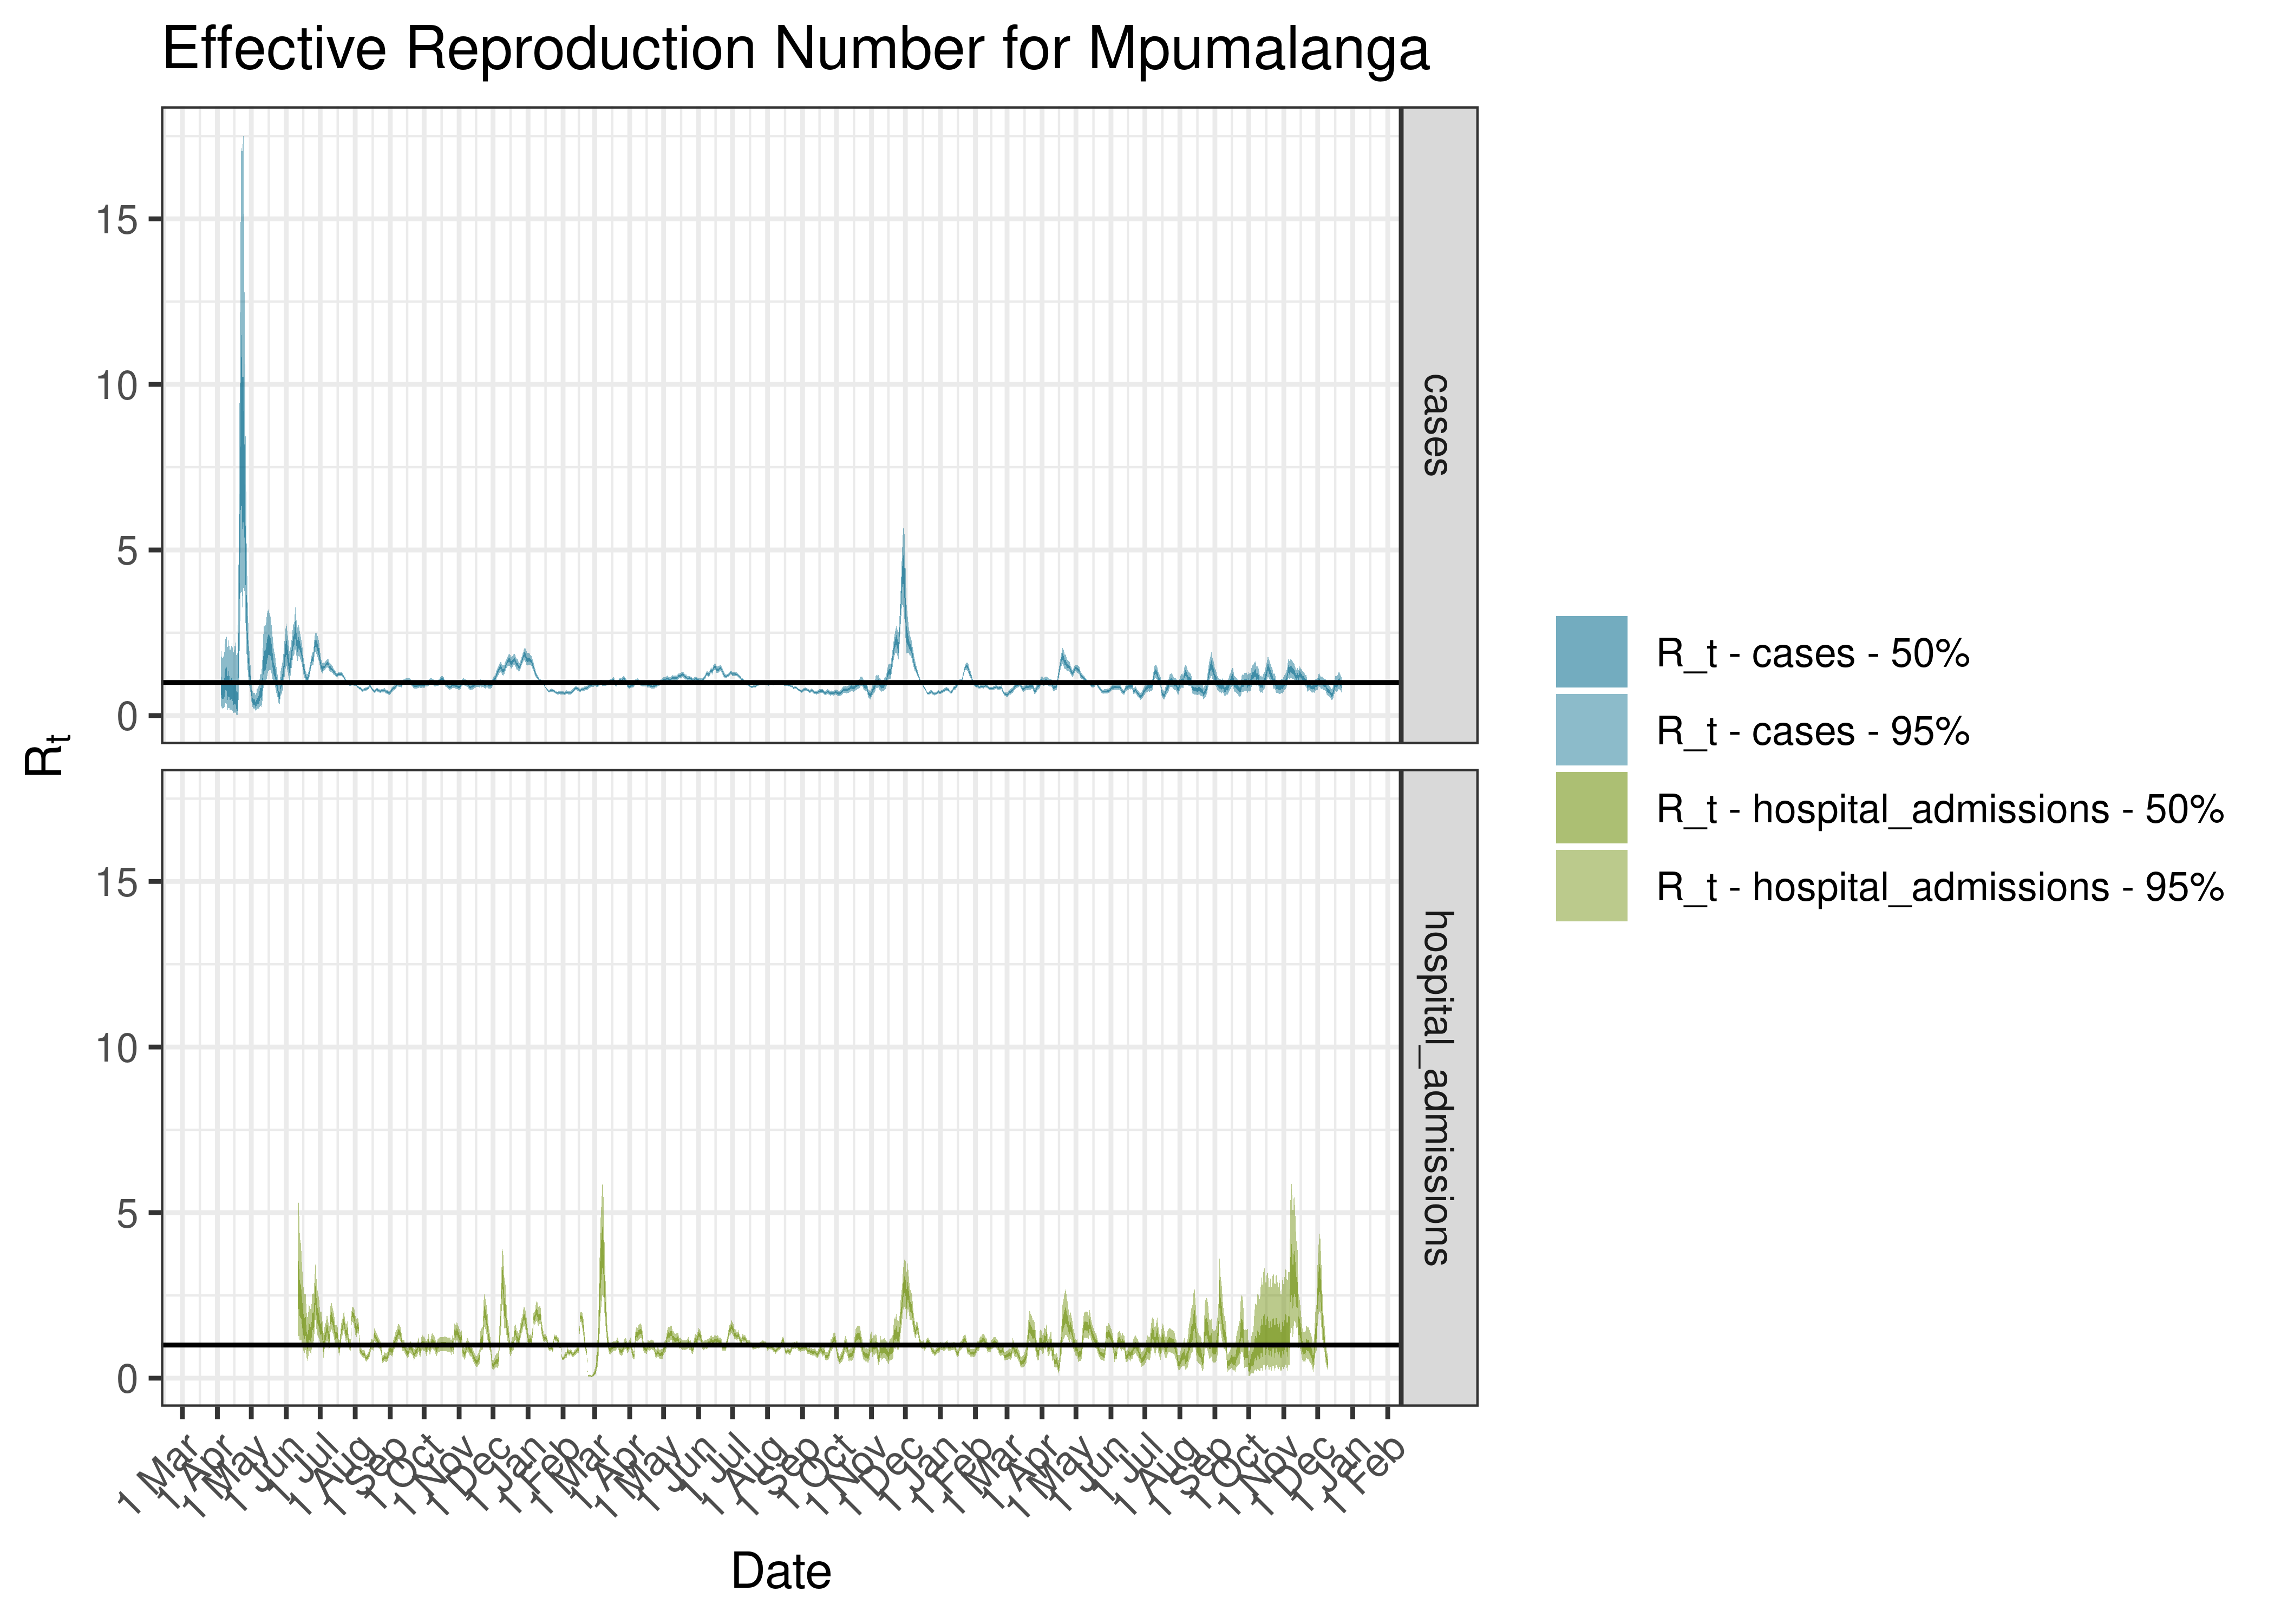
Estimated Effective Reproduction Number for Mpumalanga since 1 April 2020
6.7.8 Ehlanzeni
6.7.8.1 Cases
Cases are tabulated by specimen received date below. Cases include estimates for late reporting in recent days as well as adjustments for any public holidays. A centred 7-day moving average is also shown. The peak daily cases in previous waves (as measured by the moving average) is also shown.
| Specimen Received Date | Cases | 7-day Moving Average | Comment |
|---|---|---|---|
| 2020-08-01 | 120 | 138 | Wave 1 Peak |
| 2021-01-10 | 181 | 485 | Wave 2 Peak |
| 2021-07-10 | 267 | 425 | Wave 3 Peak |
| 2021-07-11 | 155 | 425 | Wave 3 Peak |
| 2021-12-16 | 599 | 393 | Wave 4 Peak |
| 2022-05-22 | 30 | 62 | Wave 5 Peak (to date) |
Below a 7-day moving average daily case count are plotted for Ehlanzeni on a log scale since start of the epidemic:
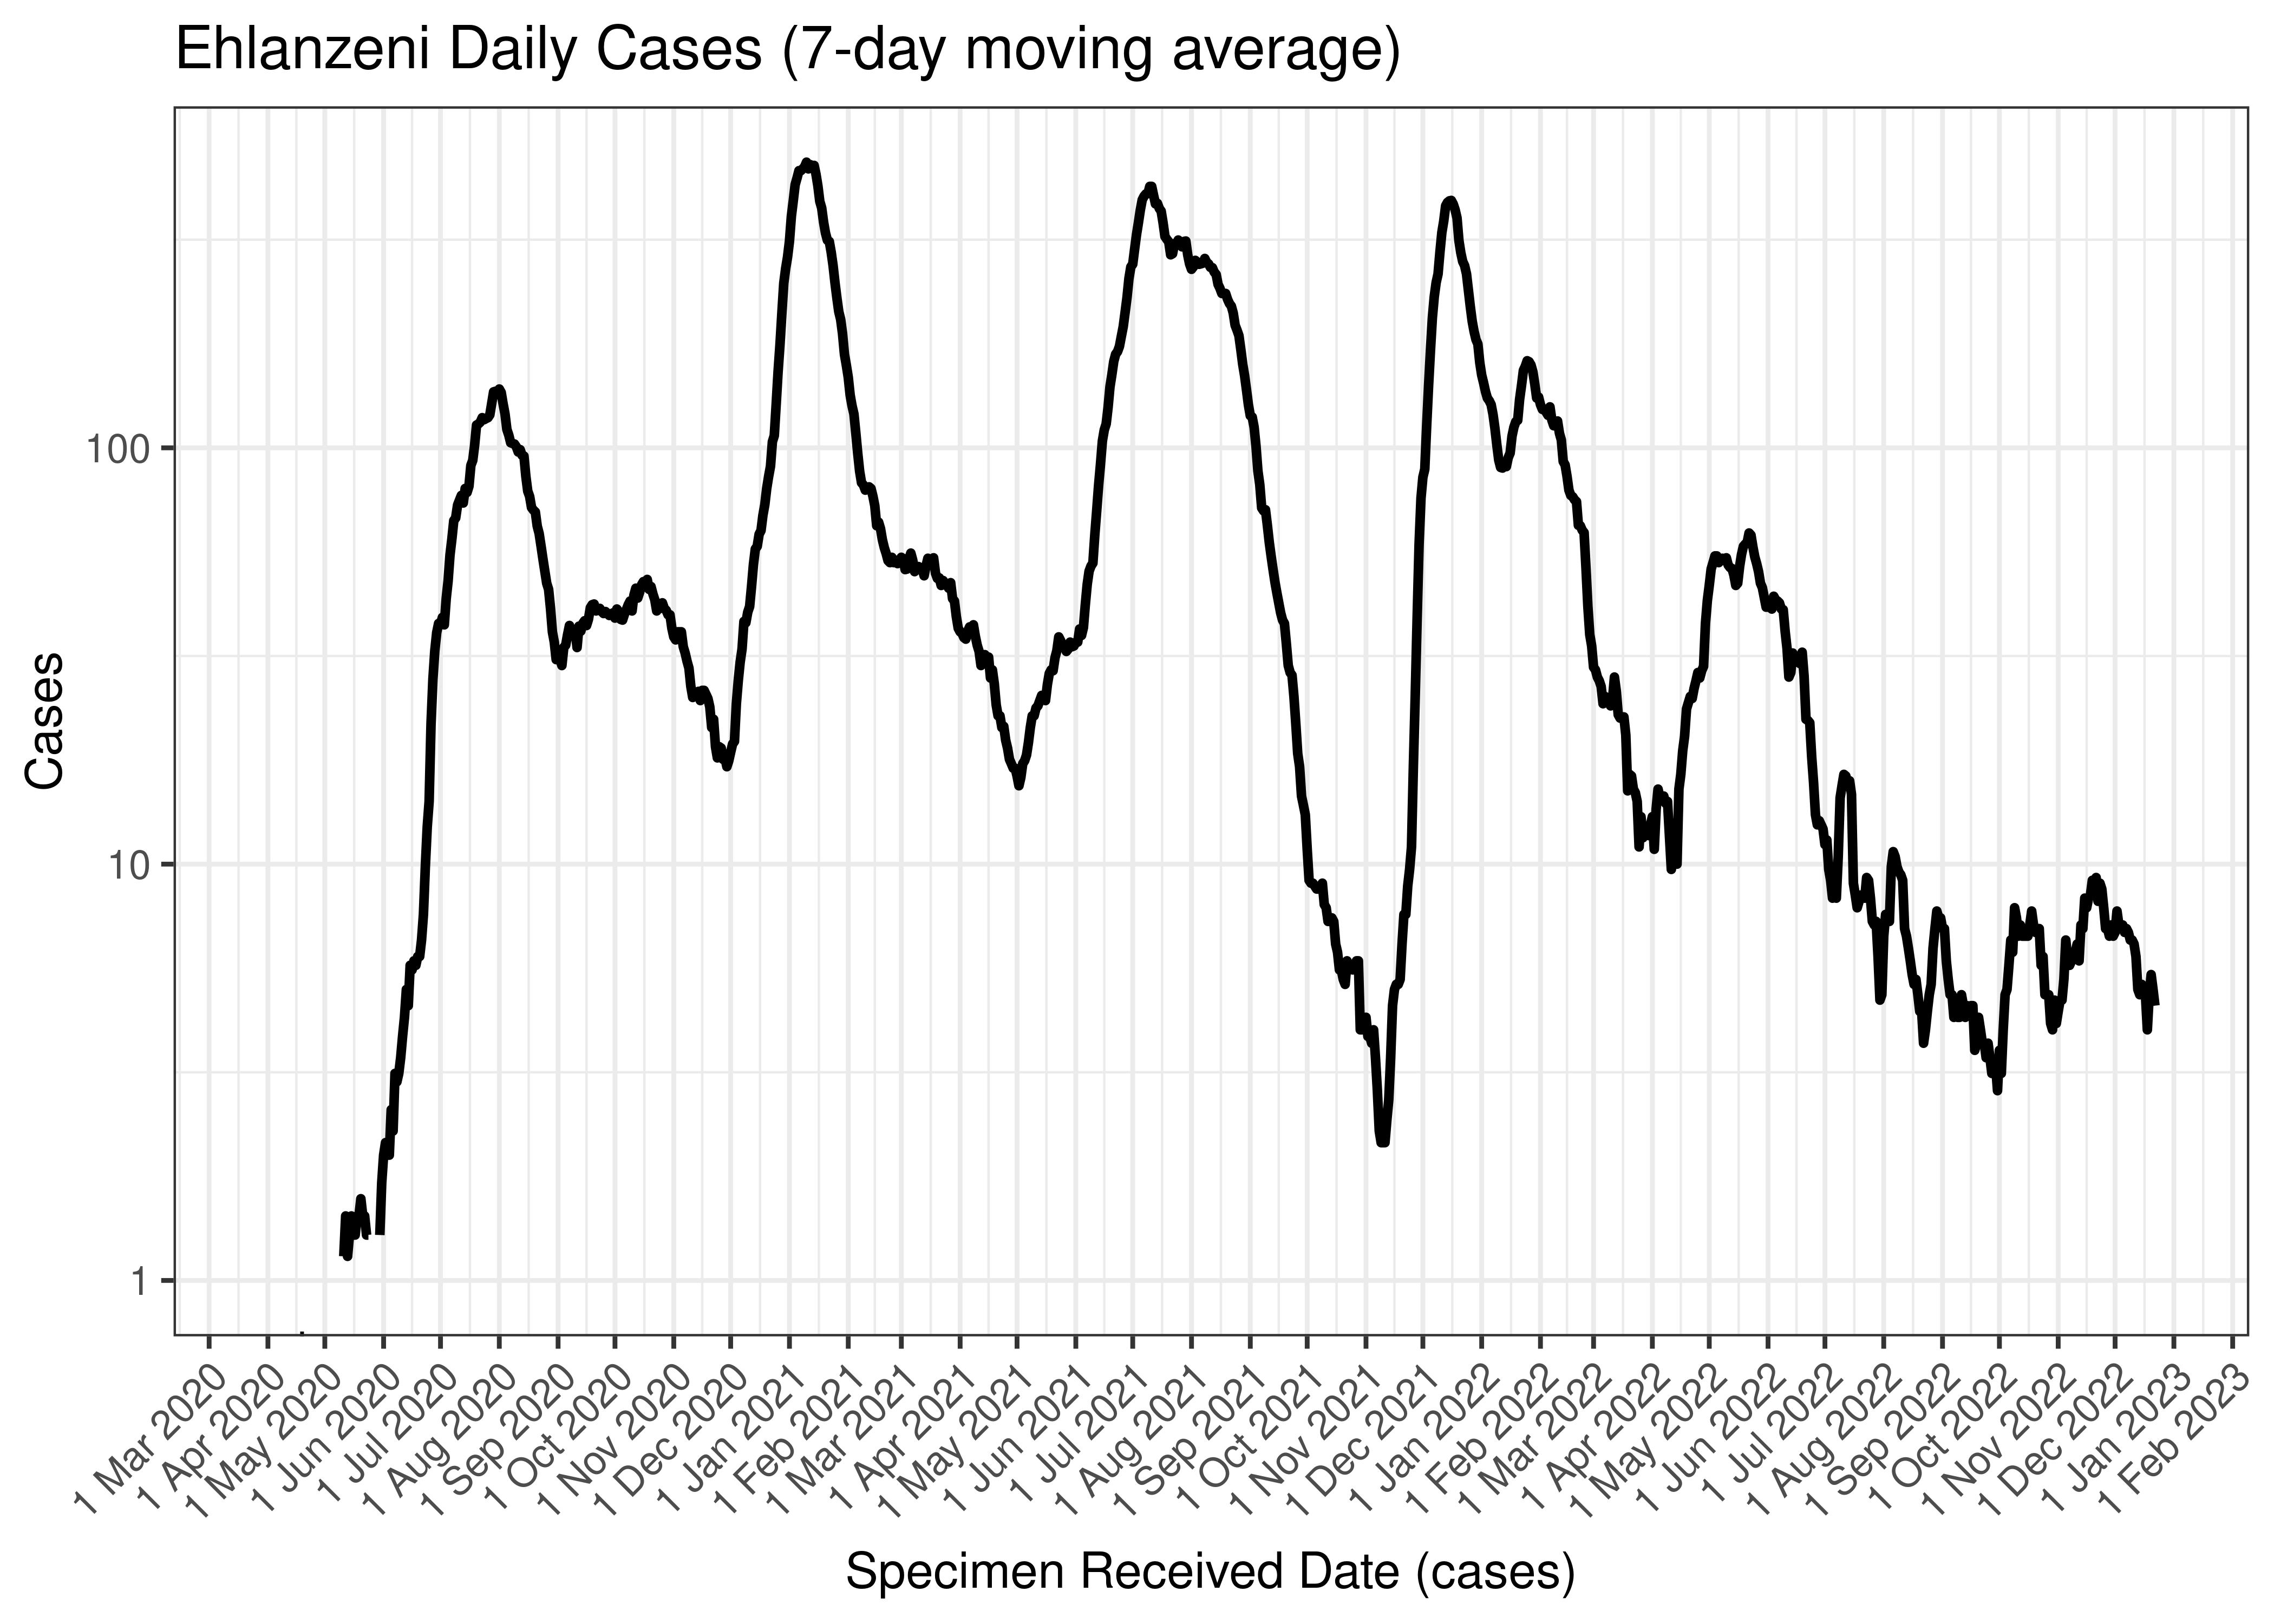
Ehlanzeni Daily Cases (7-day moving average)
Below the above chart is repeated for the last 30-days:

Ehlanzeni Daily Cases for Last 30-days (7-day moving average)
6.7.8.2 Reproduction Number
Below current (last weekly) reproduction number estimates are tabulated for Ehlanzeni.
| Count (Per Day) | Week Ending | Reproduction Number [95% Confidence Interval] | |
|---|---|---|---|
| Ehlanzeni | 4.6 | 2022-12-25 | 0.96 [0.66 - 1.32] |
Below the effective reproduction number for Ehlanzeni over the last 90 days are plotted together with a plot since start of the pandemic.
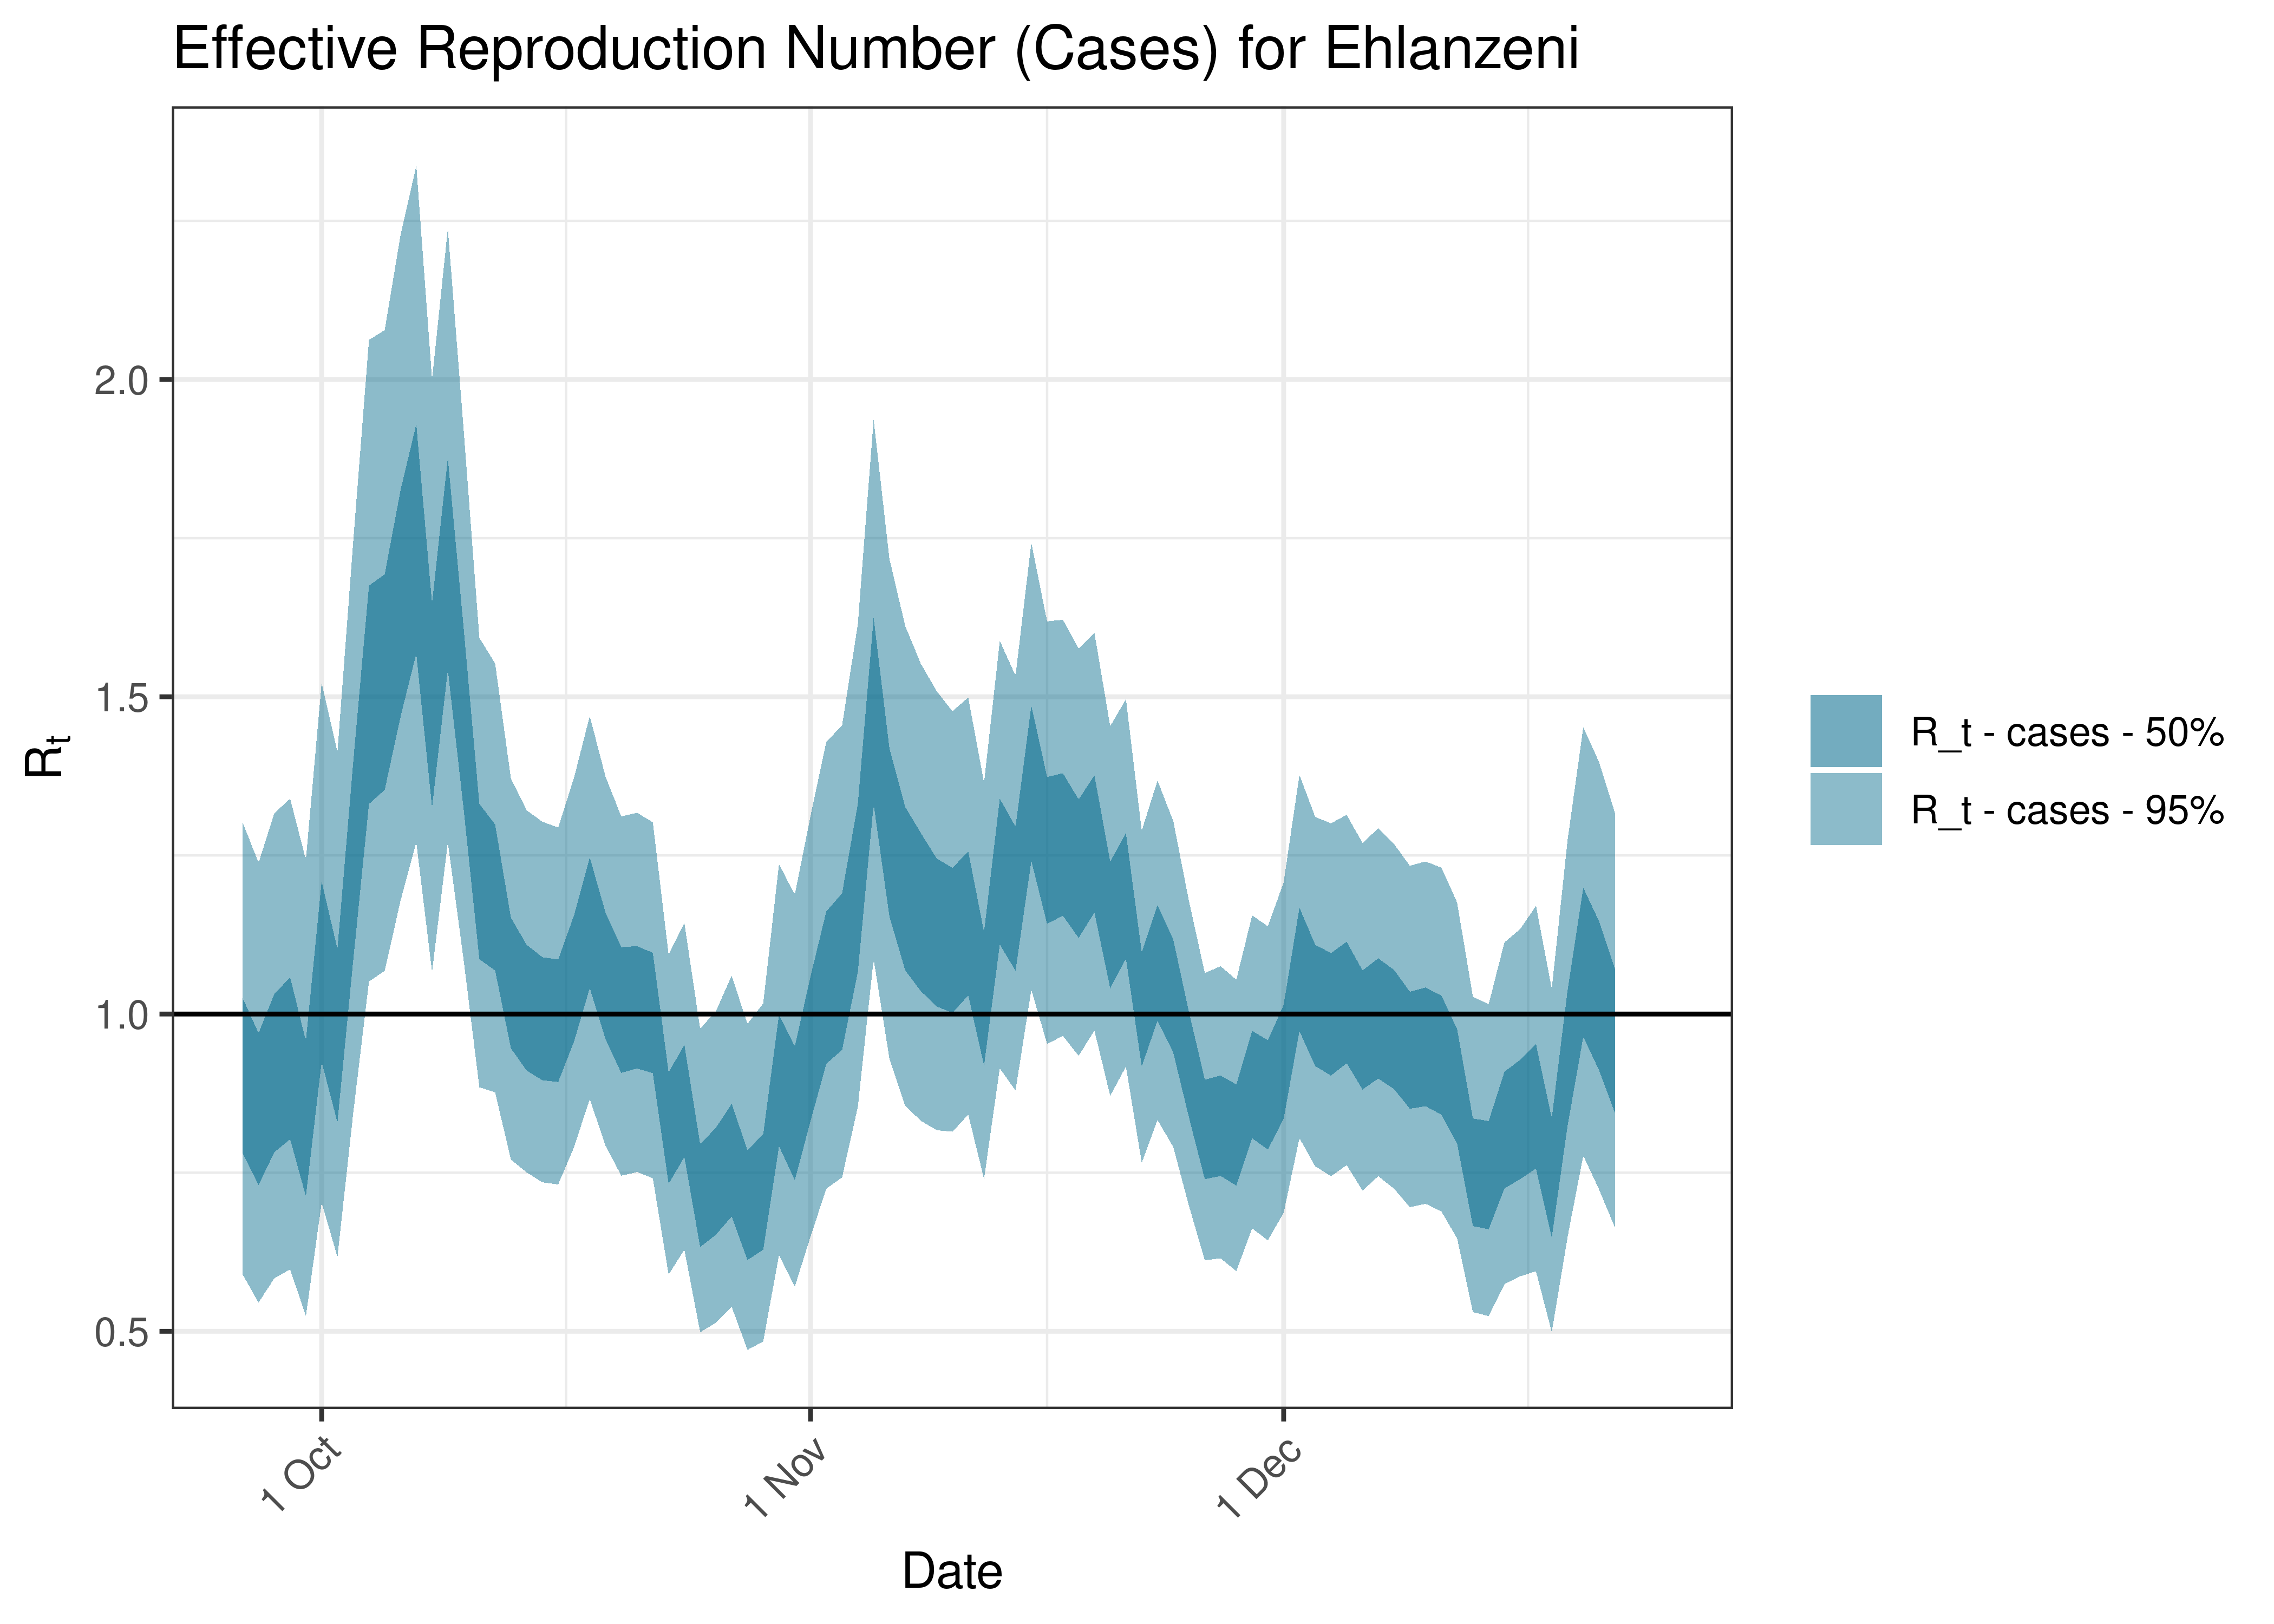
Estimated Effective Reproduction Number Based on Cases for Ehlanzeni over last 90 days
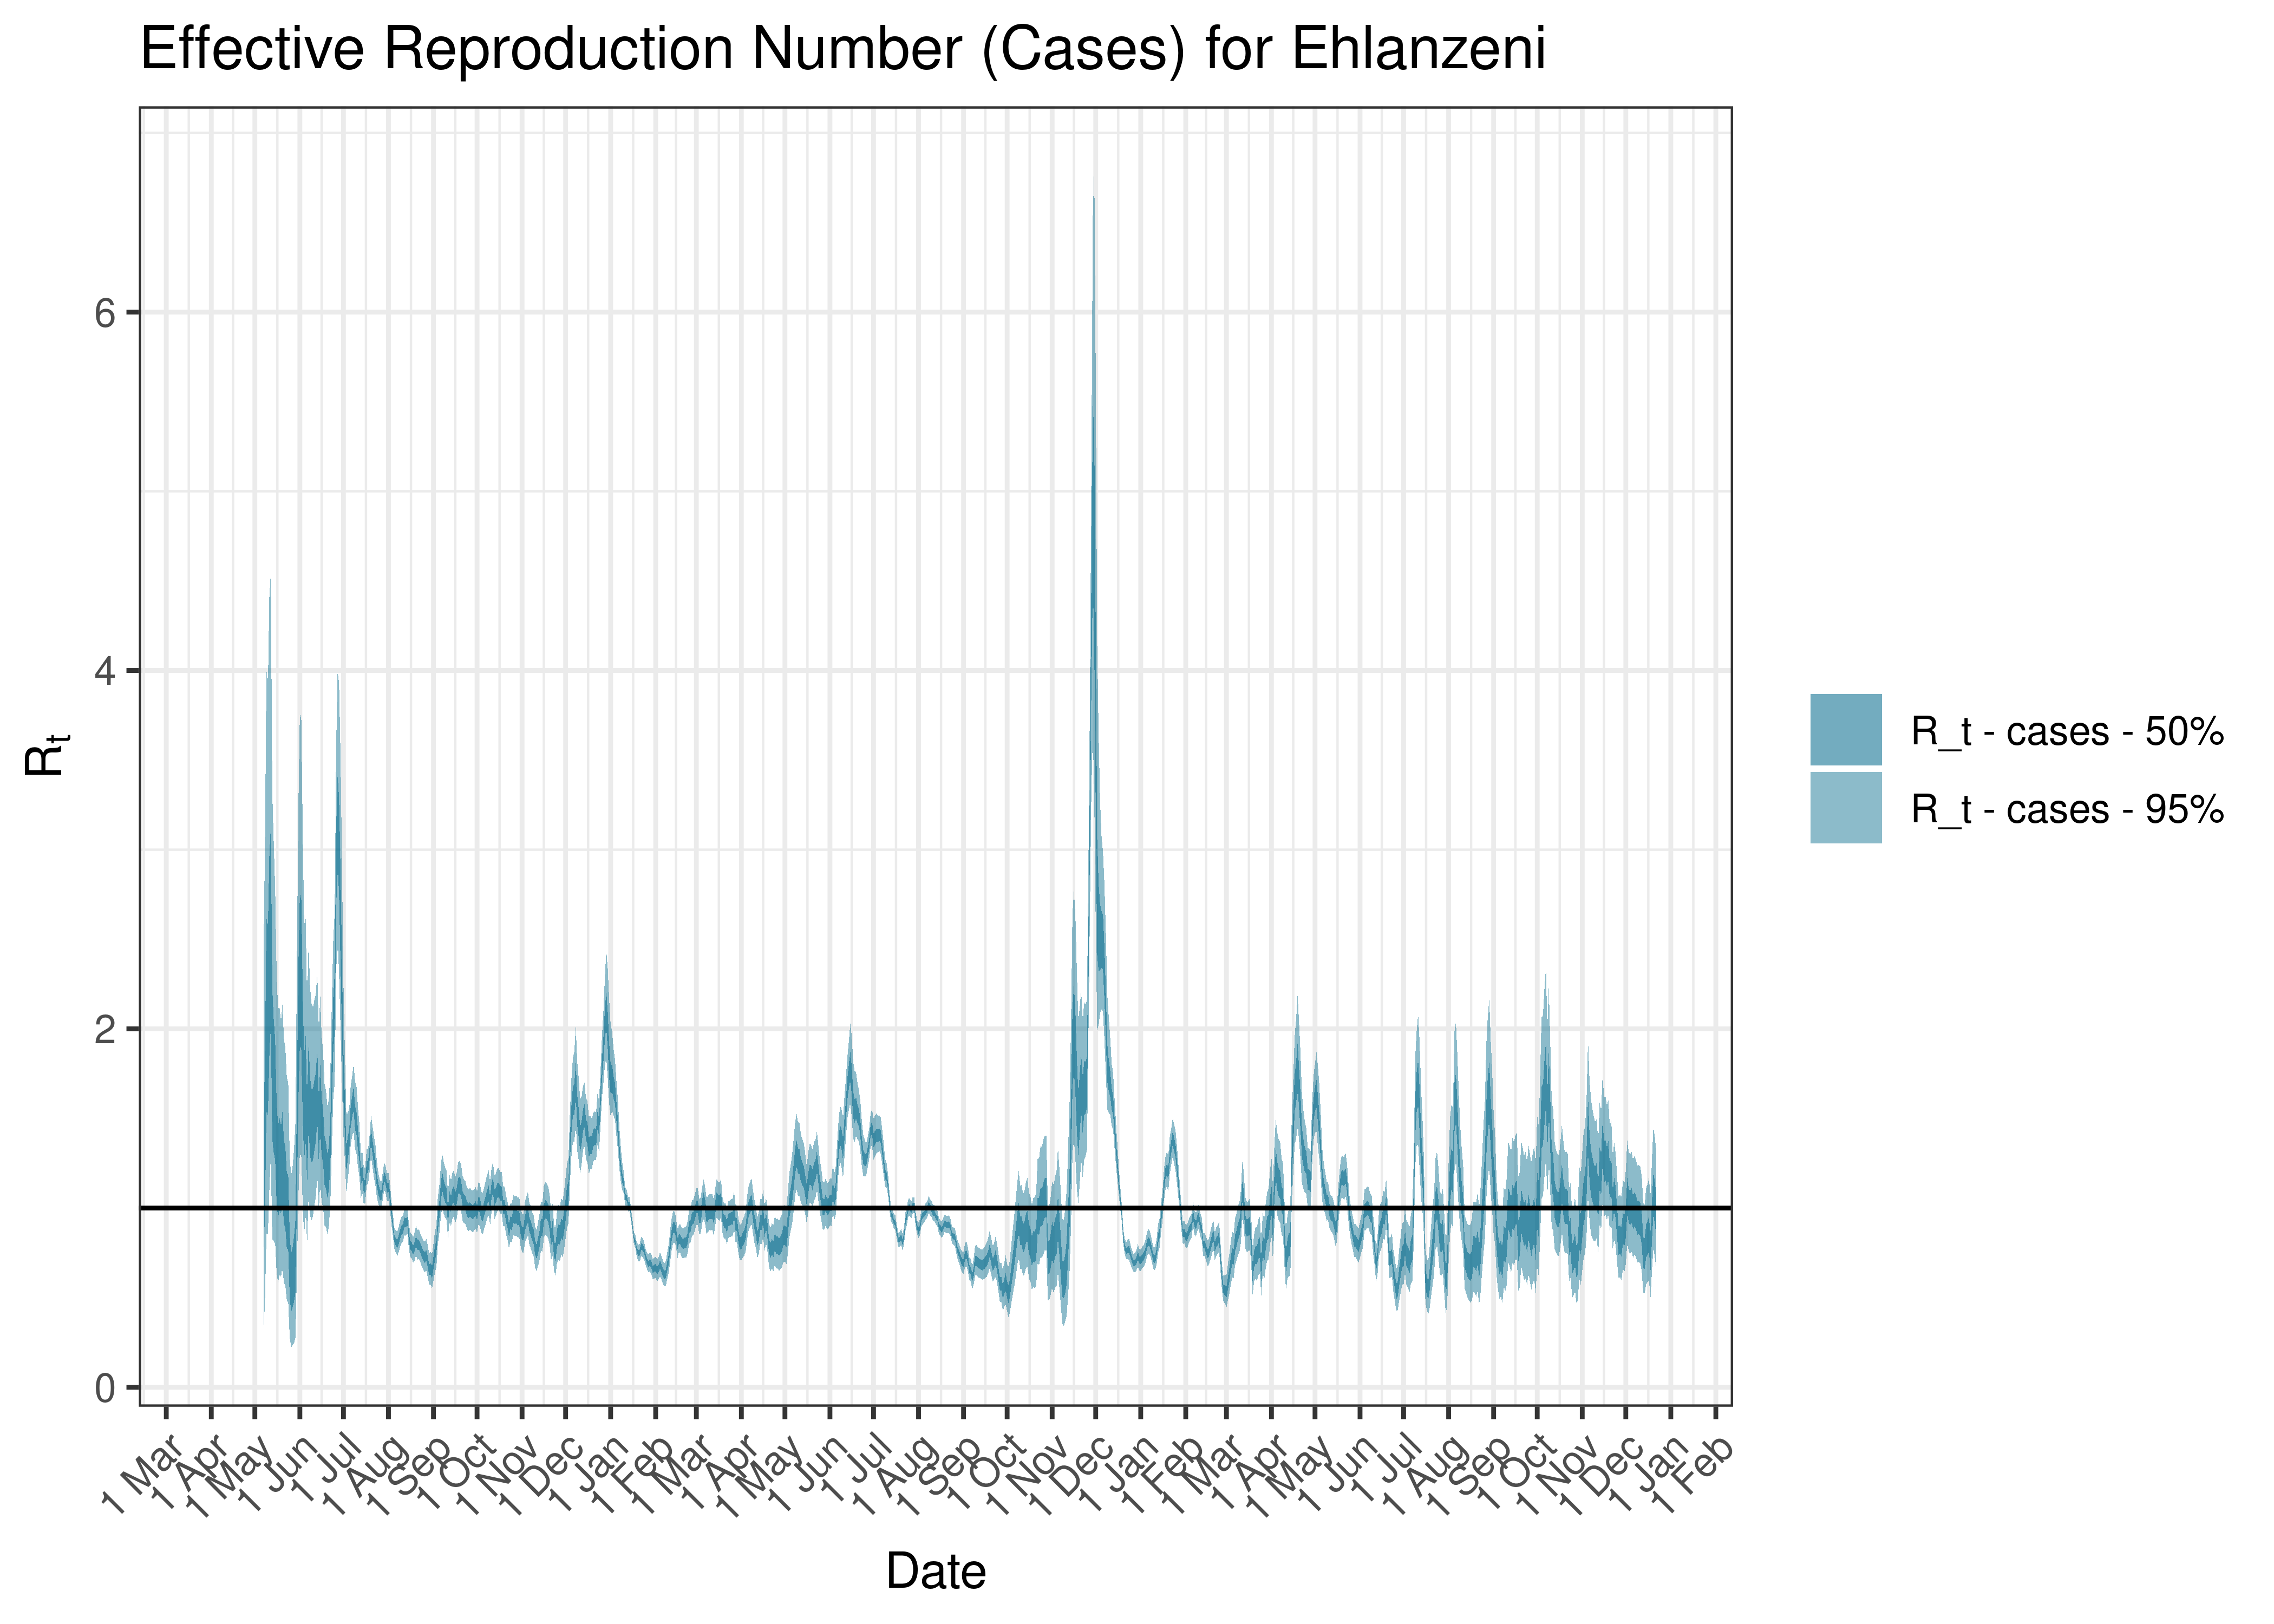
Estimated Effective Reproduction Number Based on Cases for Ehlanzeni since 1 April 2020
6.7.9 Gert Sibande
6.7.9.1 Cases
Cases are tabulated by specimen received date below. Cases include estimates for late reporting in recent days as well as adjustments for any public holidays. A centred 7-day moving average is also shown. The peak daily cases in previous waves (as measured by the moving average) is also shown.
| Specimen Received Date | Cases | 7-day Moving Average | Comment |
|---|---|---|---|
| 2020-07-21 | 317 | 246 | Wave 1 Peak |
| 2021-01-12 | 477 | 327 | Wave 2 Peak |
| 2021-07-10 | 142 | 256 | Wave 3 Peak |
| 2021-12-12 | 71 | 354 | Wave 4 Peak |
| 2022-05-08 | 15 | 68 | Wave 5 Peak (to date) |
Below a 7-day moving average daily case count are plotted for Gert Sibande on a log scale since start of the epidemic:
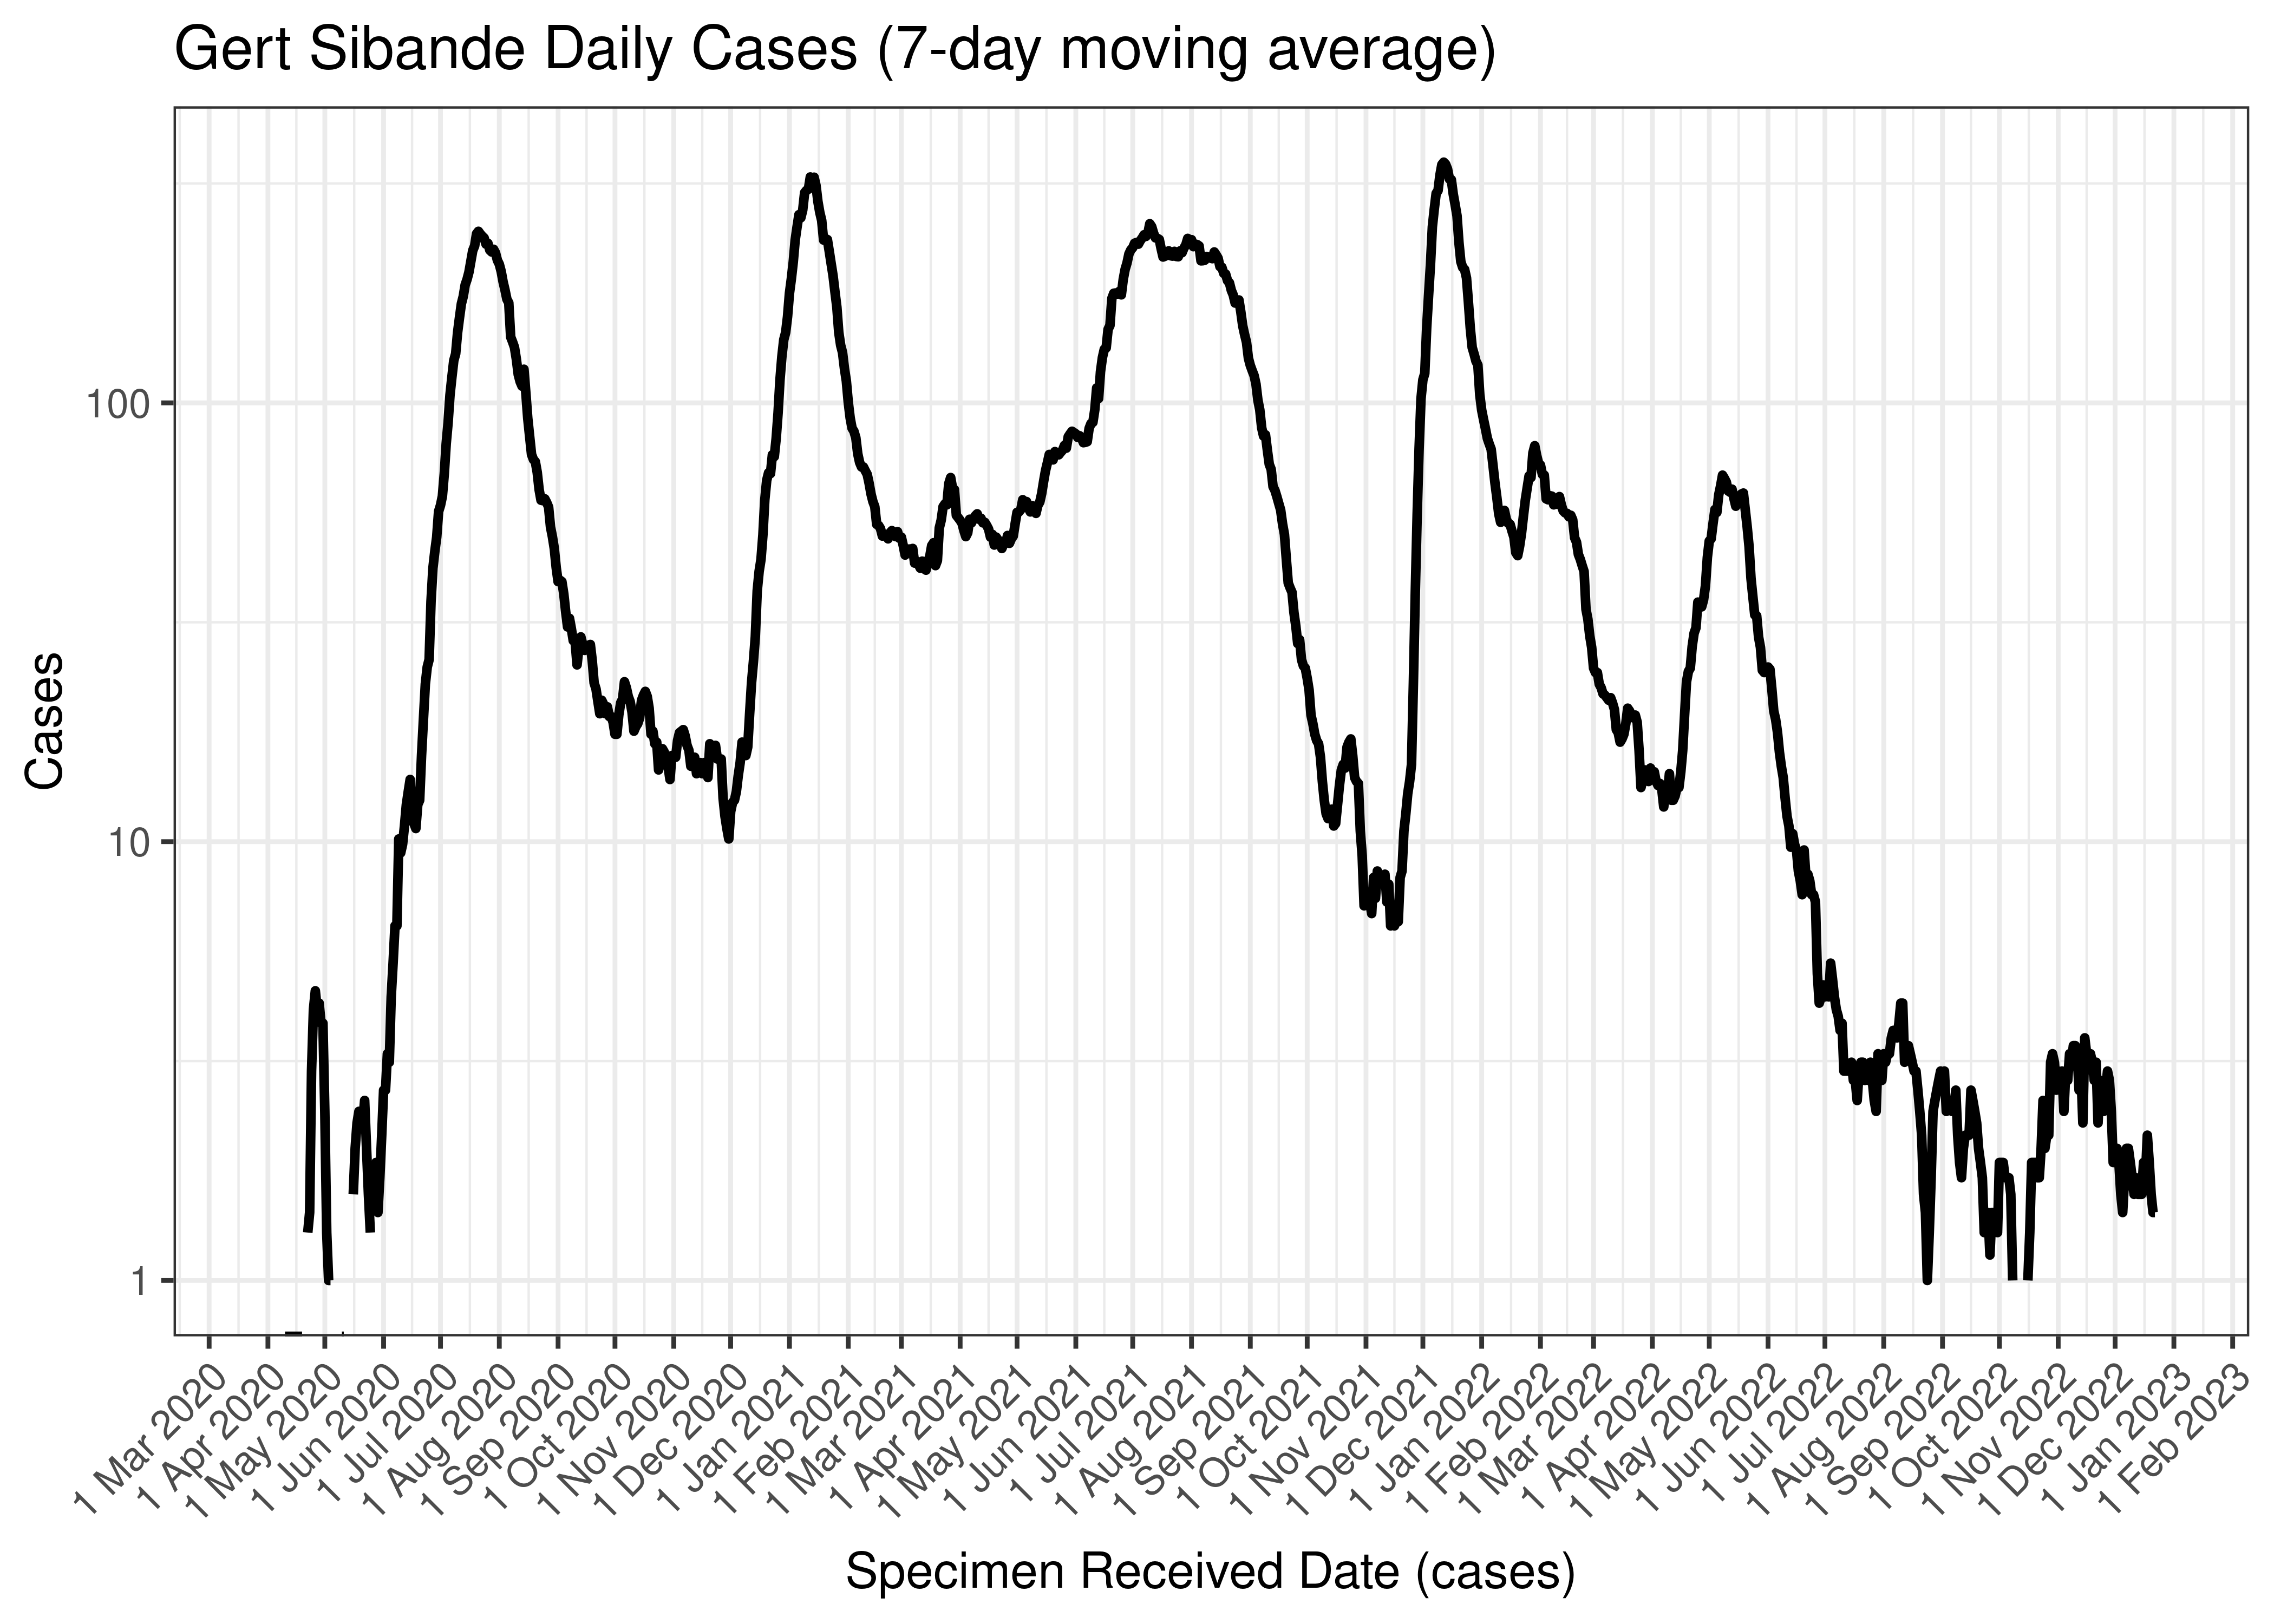
Gert Sibande Daily Cases (7-day moving average)
Below the above chart is repeated for the last 30-days:

Gert Sibande Daily Cases for Last 30-days (7-day moving average)
6.7.9.2 Reproduction Number
Below current (last weekly) reproduction number estimates are tabulated for Gert Sibande.
| Count (Per Day) | Week Ending | Reproduction Number [95% Confidence Interval] | |
|---|---|---|---|
| Gert Sibande | 1.4 | 2022-12-25 | 0.86 [0.43 - 1.45] |
Below the effective reproduction number for Gert Sibande over the last 90 days are plotted together with a plot since start of the pandemic.
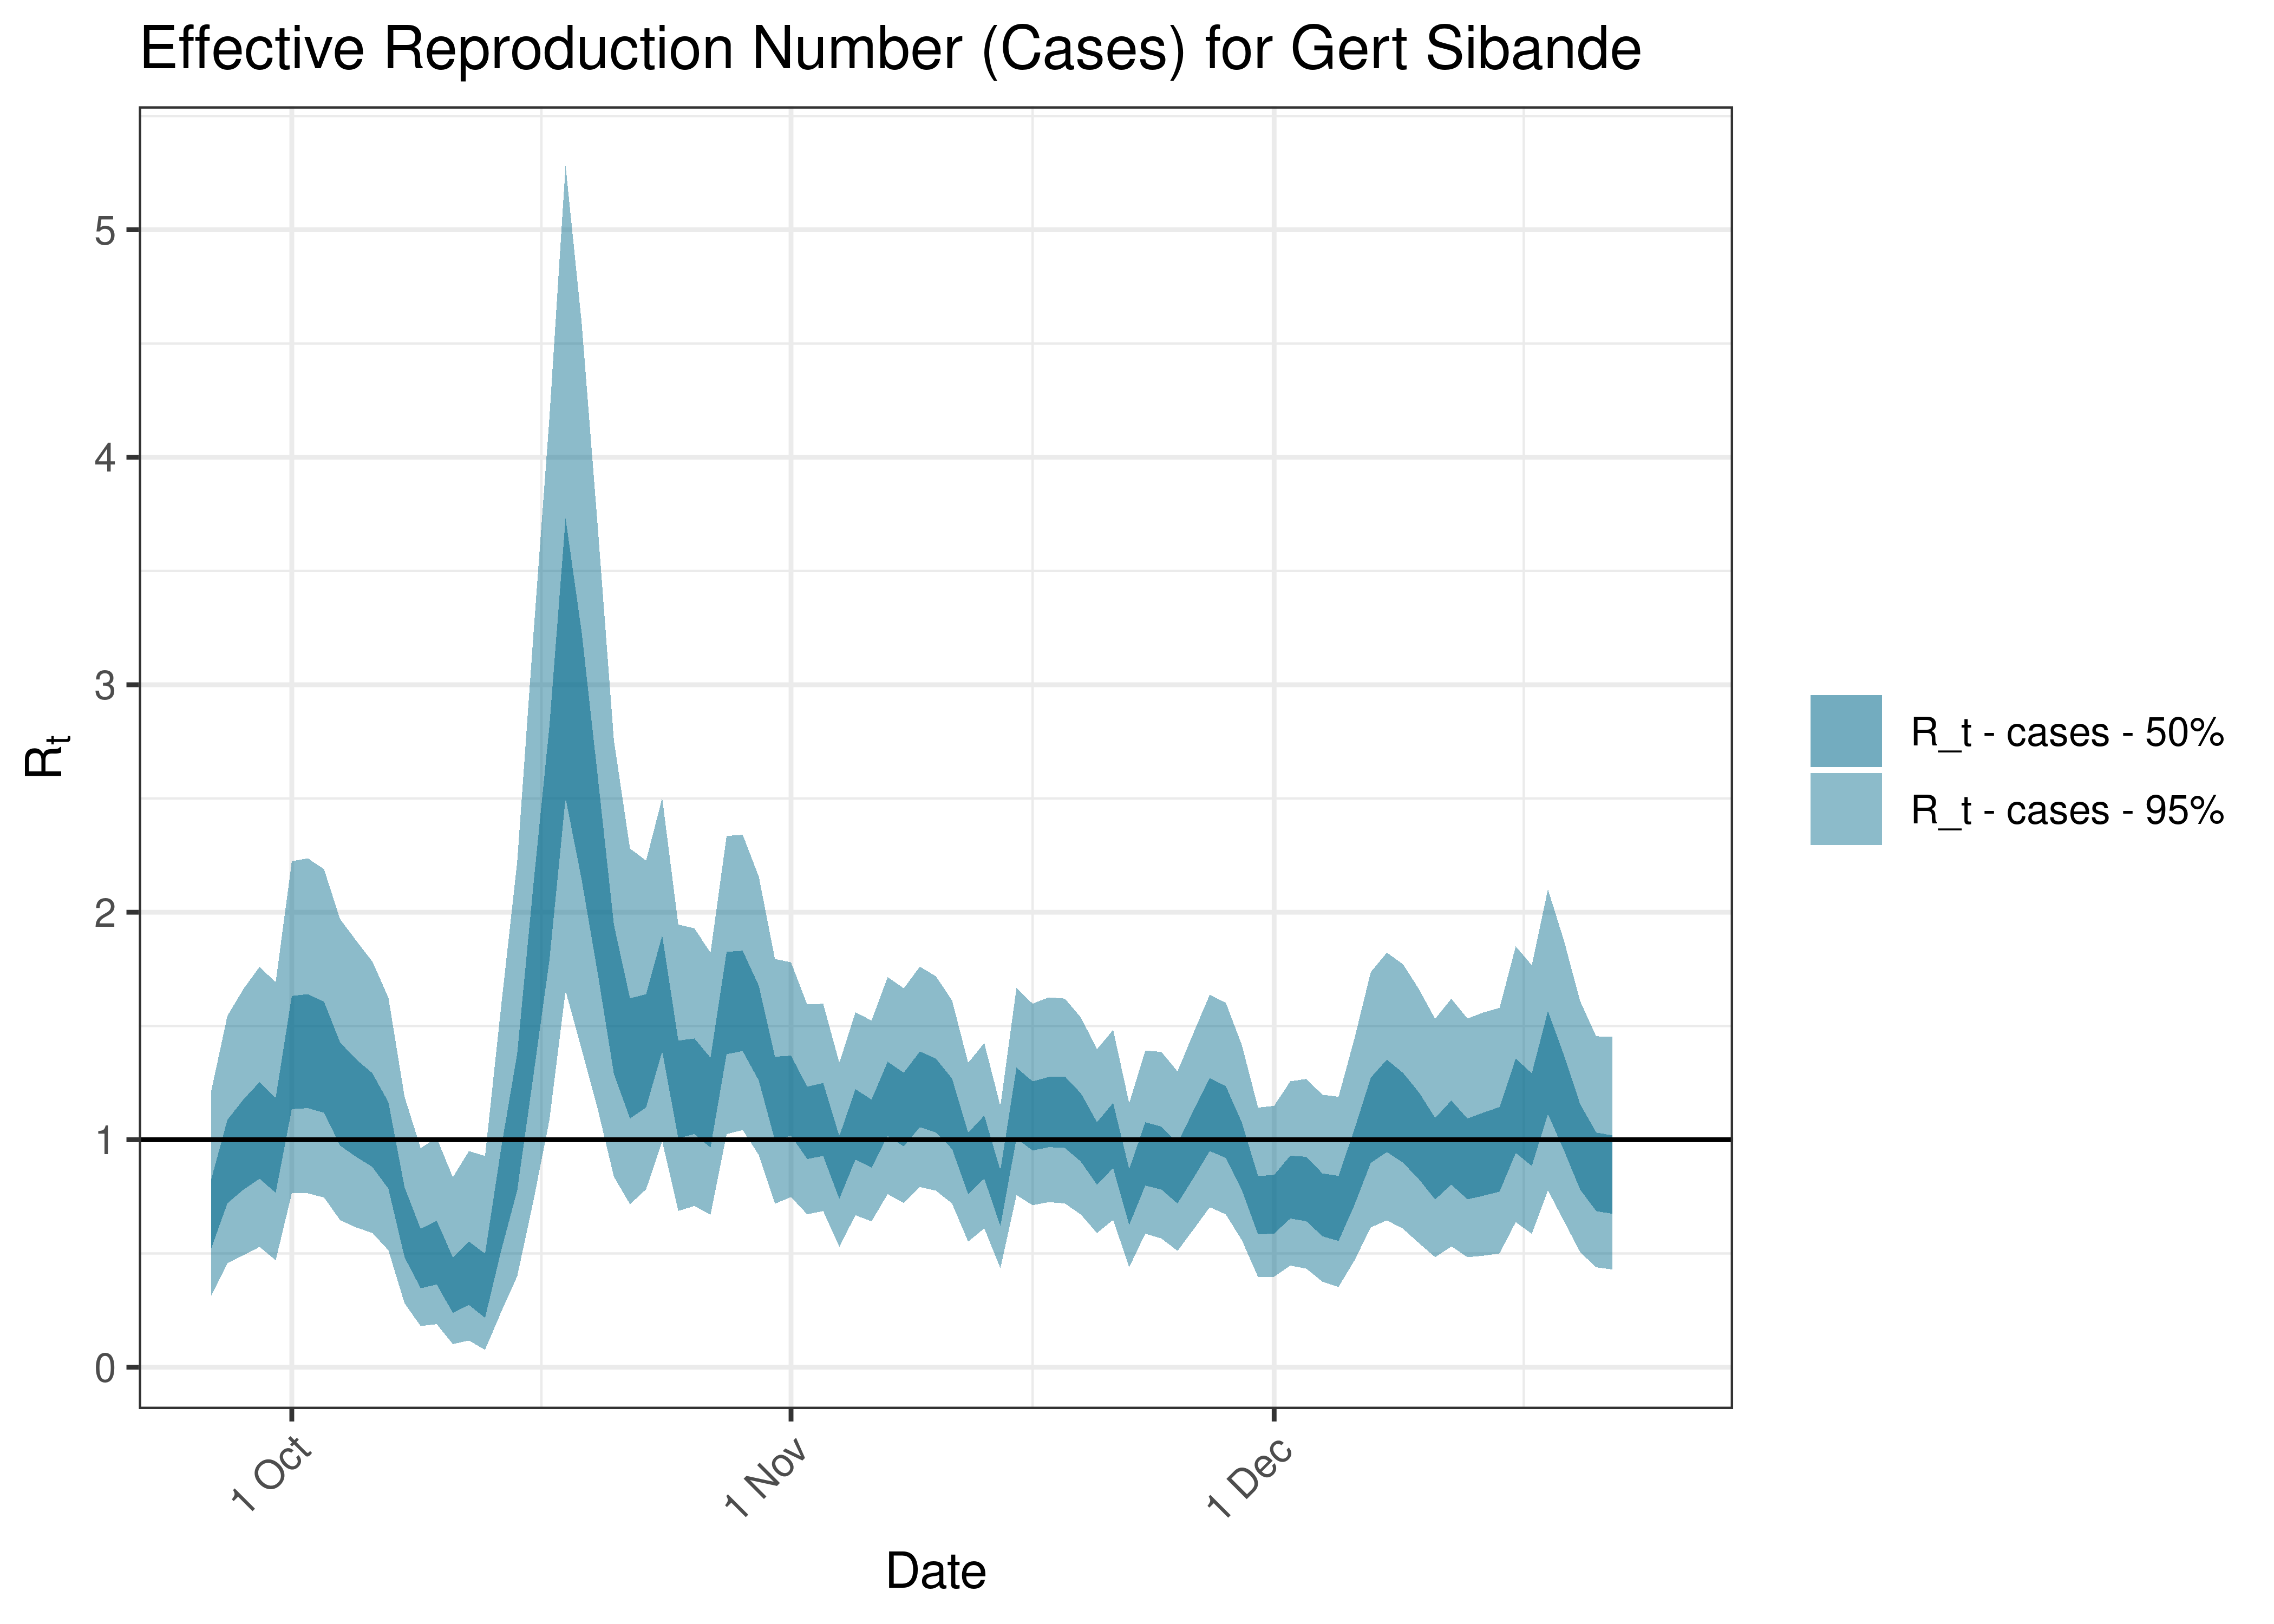
Estimated Effective Reproduction Number Based on Cases for Gert Sibande over last 90 days
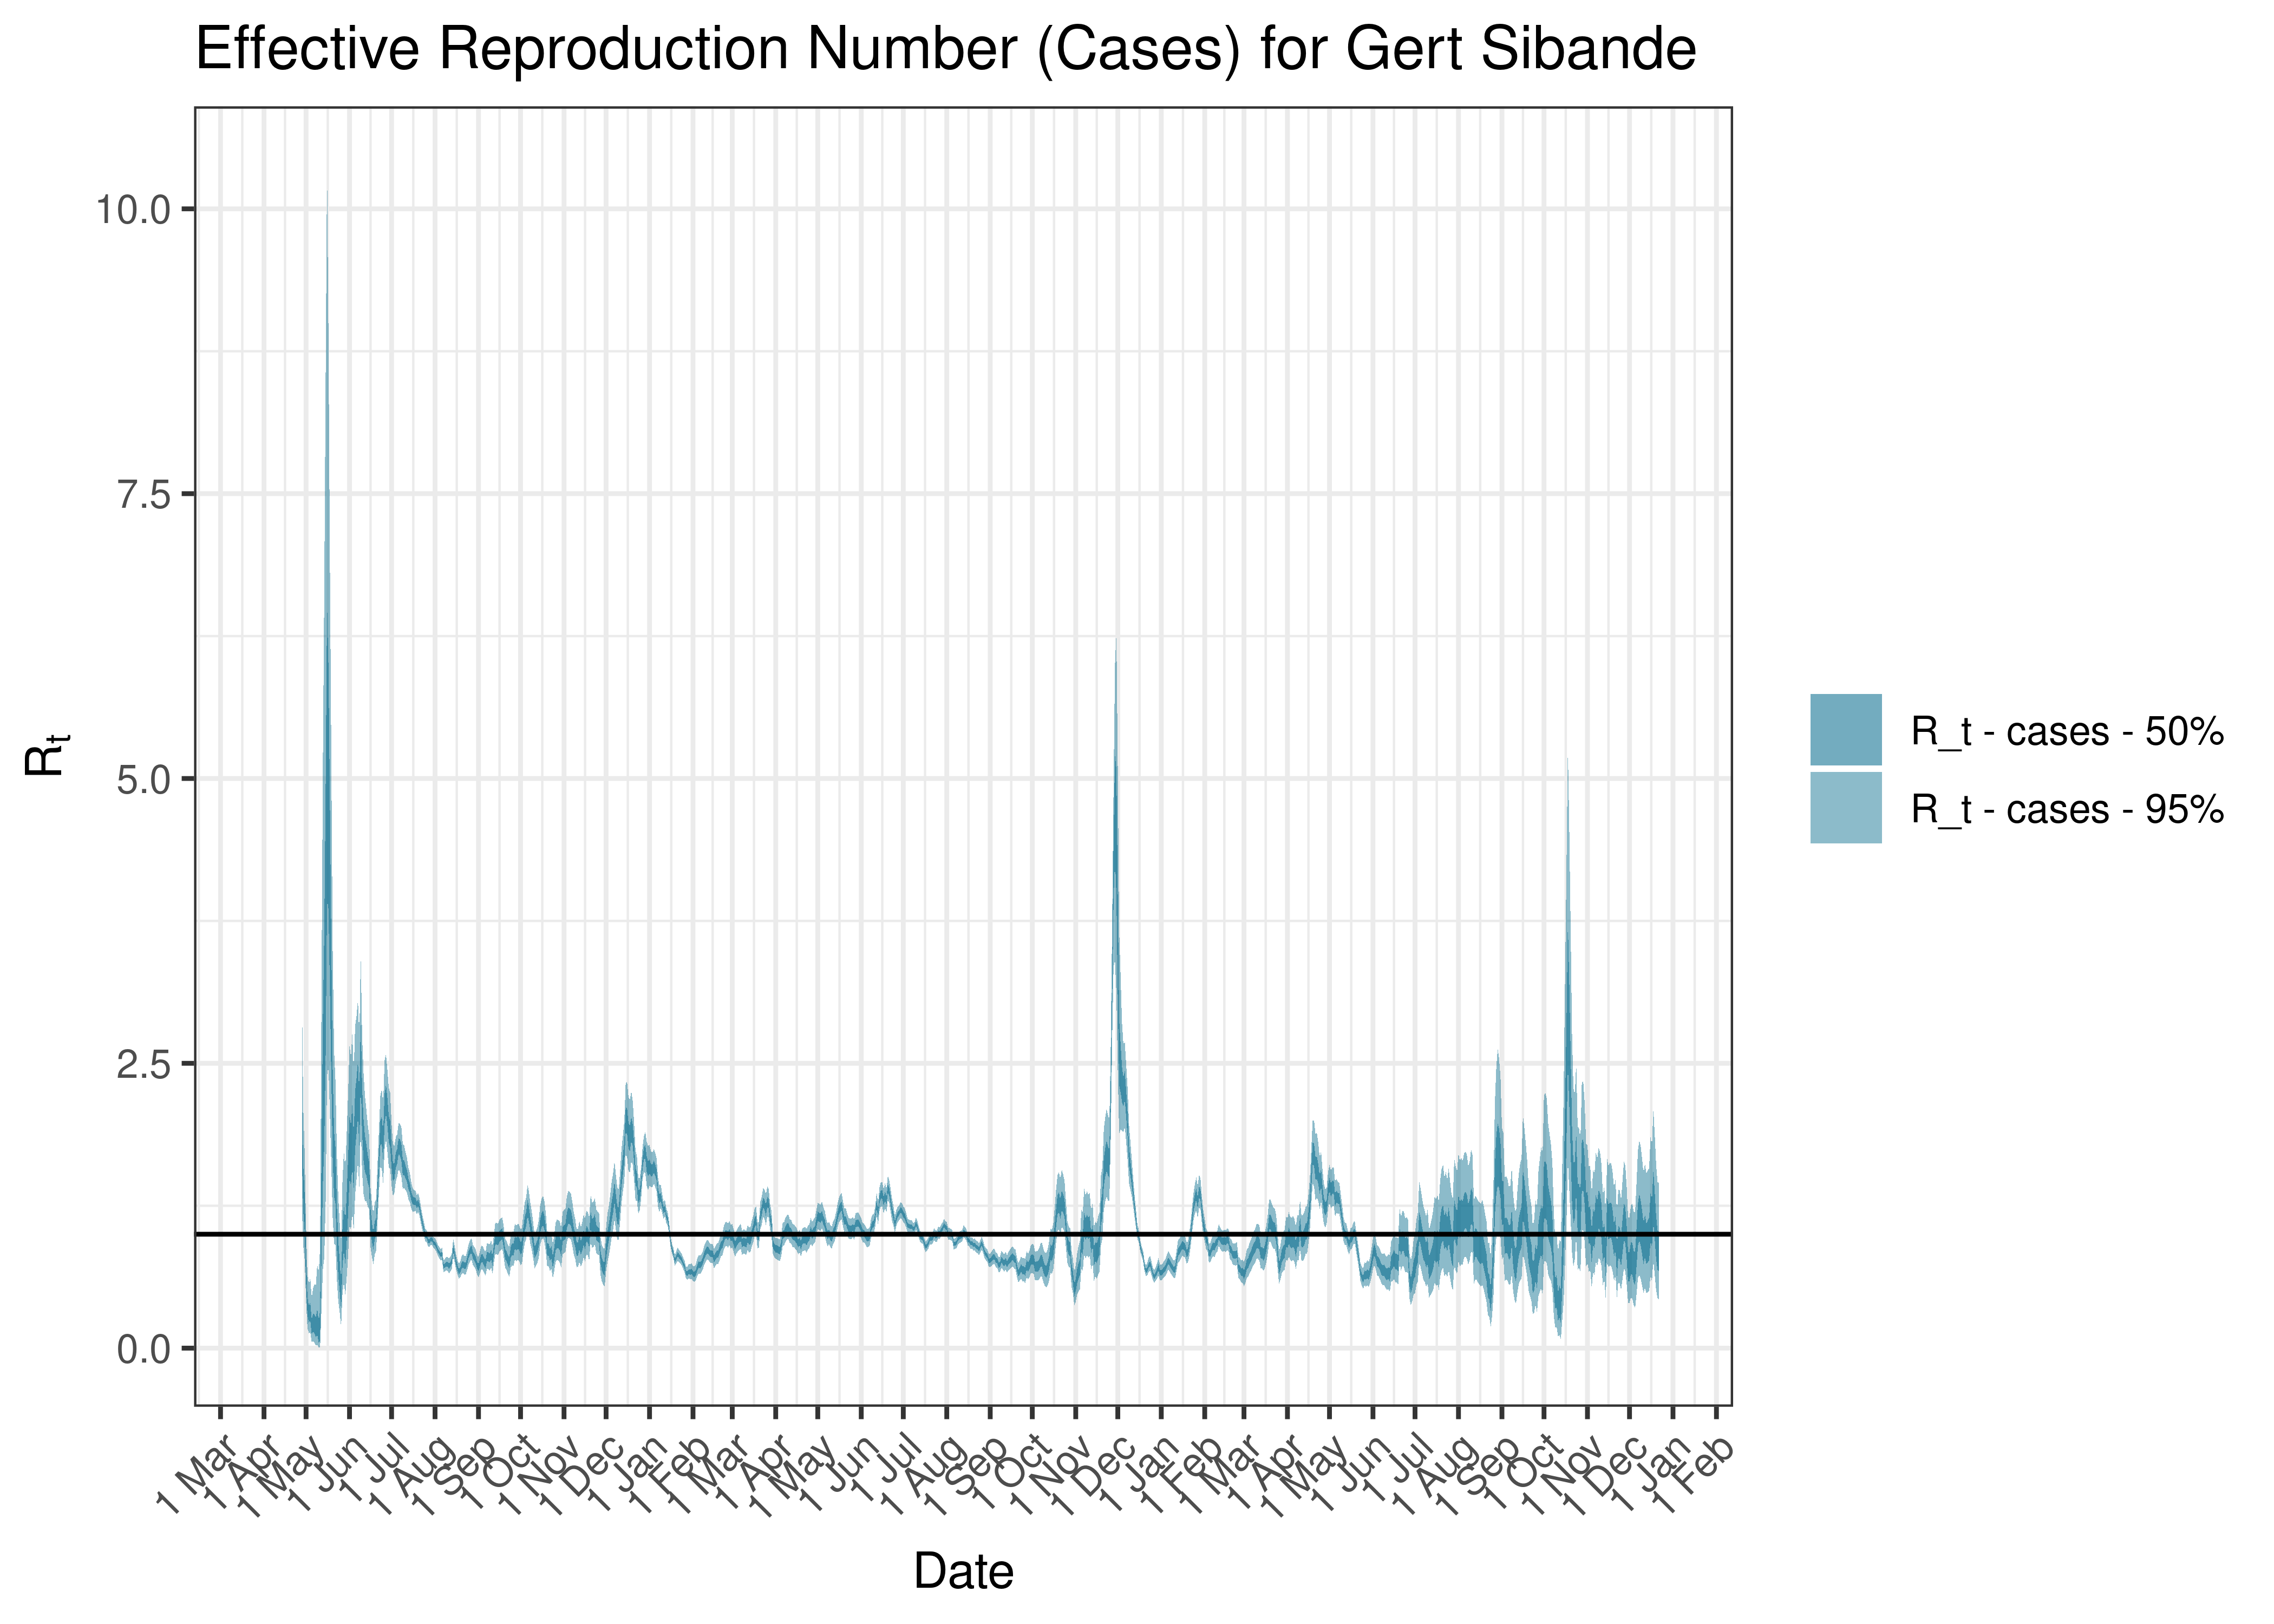
Estimated Effective Reproduction Number Based on Cases for Gert Sibande since 1 April 2020
6.7.10 Nkangala
6.7.10.1 Cases
Cases are tabulated by specimen received date below. Cases include estimates for late reporting in recent days as well as adjustments for any public holidays. A centred 7-day moving average is also shown. The peak daily cases in previous waves (as measured by the moving average) is also shown.
| Specimen Received Date | Cases | 7-day Moving Average | Comment |
|---|---|---|---|
| 2020-07-20 | 358 | 232 | Wave 1 Peak |
| 2021-01-07 | 481 | 422 | Wave 2 Peak |
| 2021-07-08 | 521 | 446 | Wave 3 Peak |
| 2021-12-09 | 698 | 472 | Wave 4 Peak |
| 2022-05-04 | 109 | 80 | Wave 5 Peak (to date) |
Below a 7-day moving average daily case count are plotted for Nkangala on a log scale since start of the epidemic:
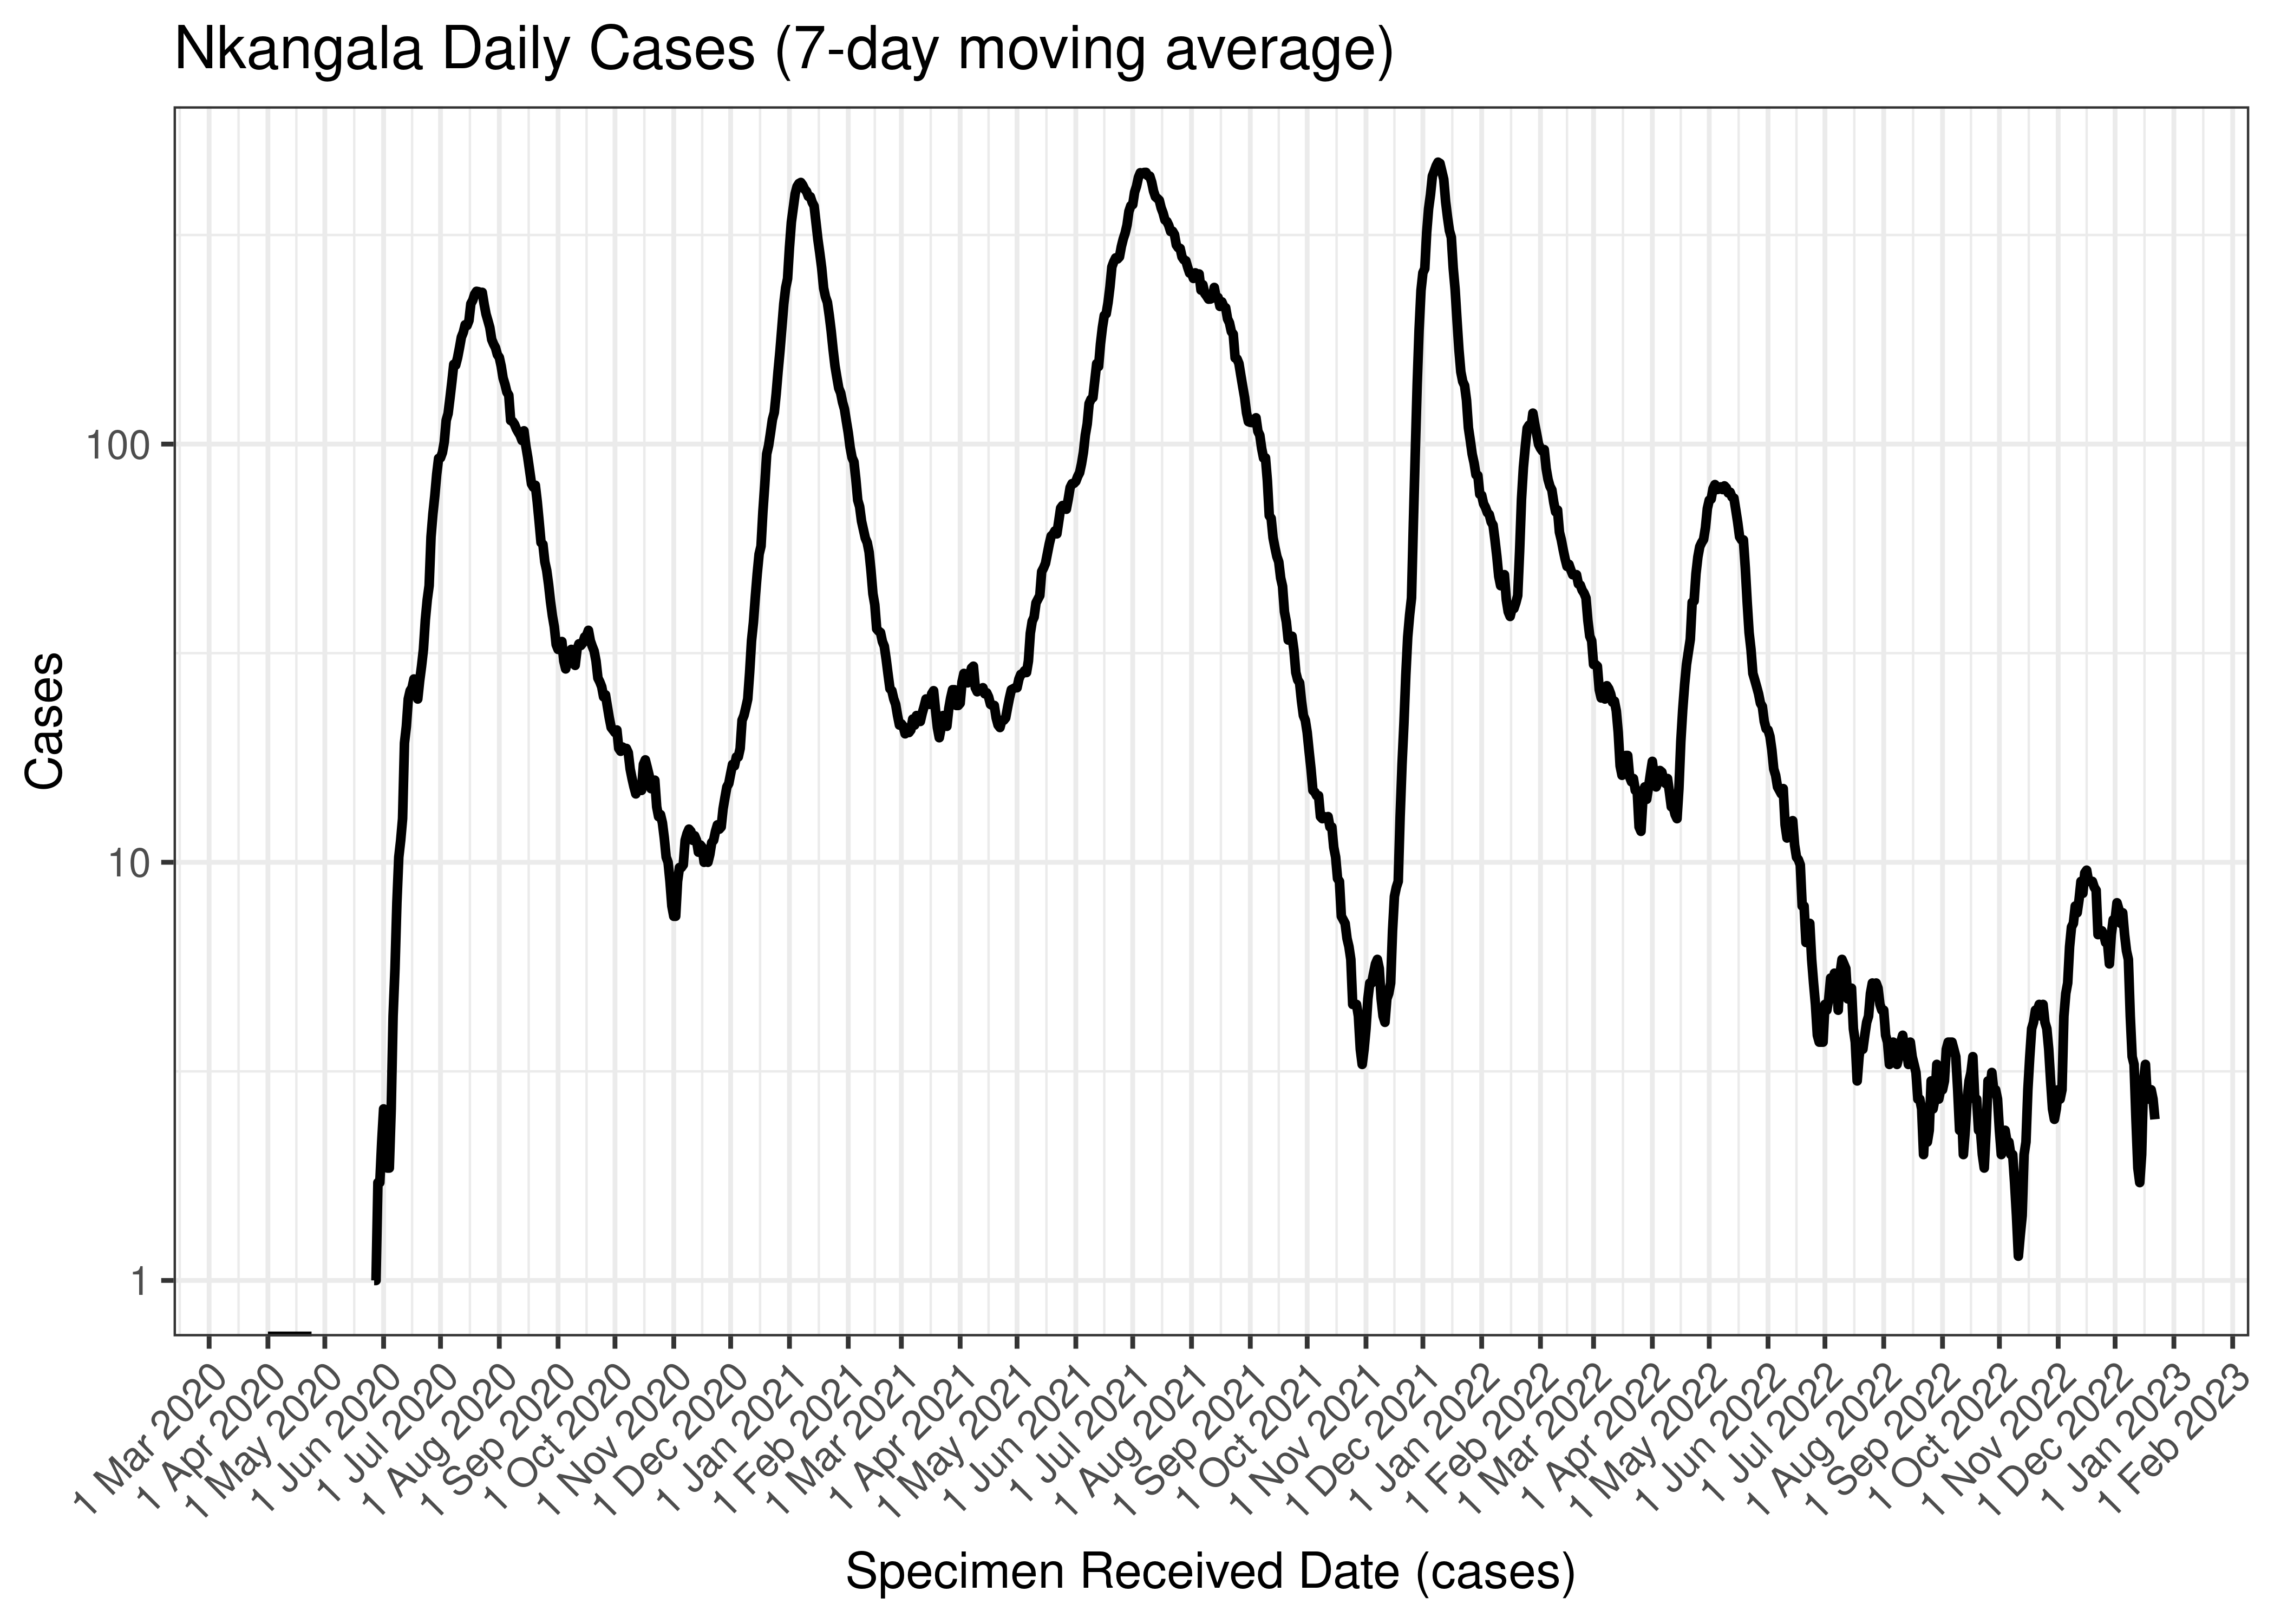
Nkangala Daily Cases (7-day moving average)
Below the above chart is repeated for the last 30-days:

Nkangala Daily Cases for Last 30-days (7-day moving average)
6.7.10.2 Reproduction Number
Below current (last weekly) reproduction number estimates are tabulated for Nkangala.
| Count (Per Day) | Week Ending | Reproduction Number [95% Confidence Interval] | |
|---|---|---|---|
| Nkangala | 2.4 | 2022-12-25 | 0.93 [0.55 - 1.40] |
Below the effective reproduction number for Nkangala over the last 90 days are plotted together with a plot since start of the pandemic.
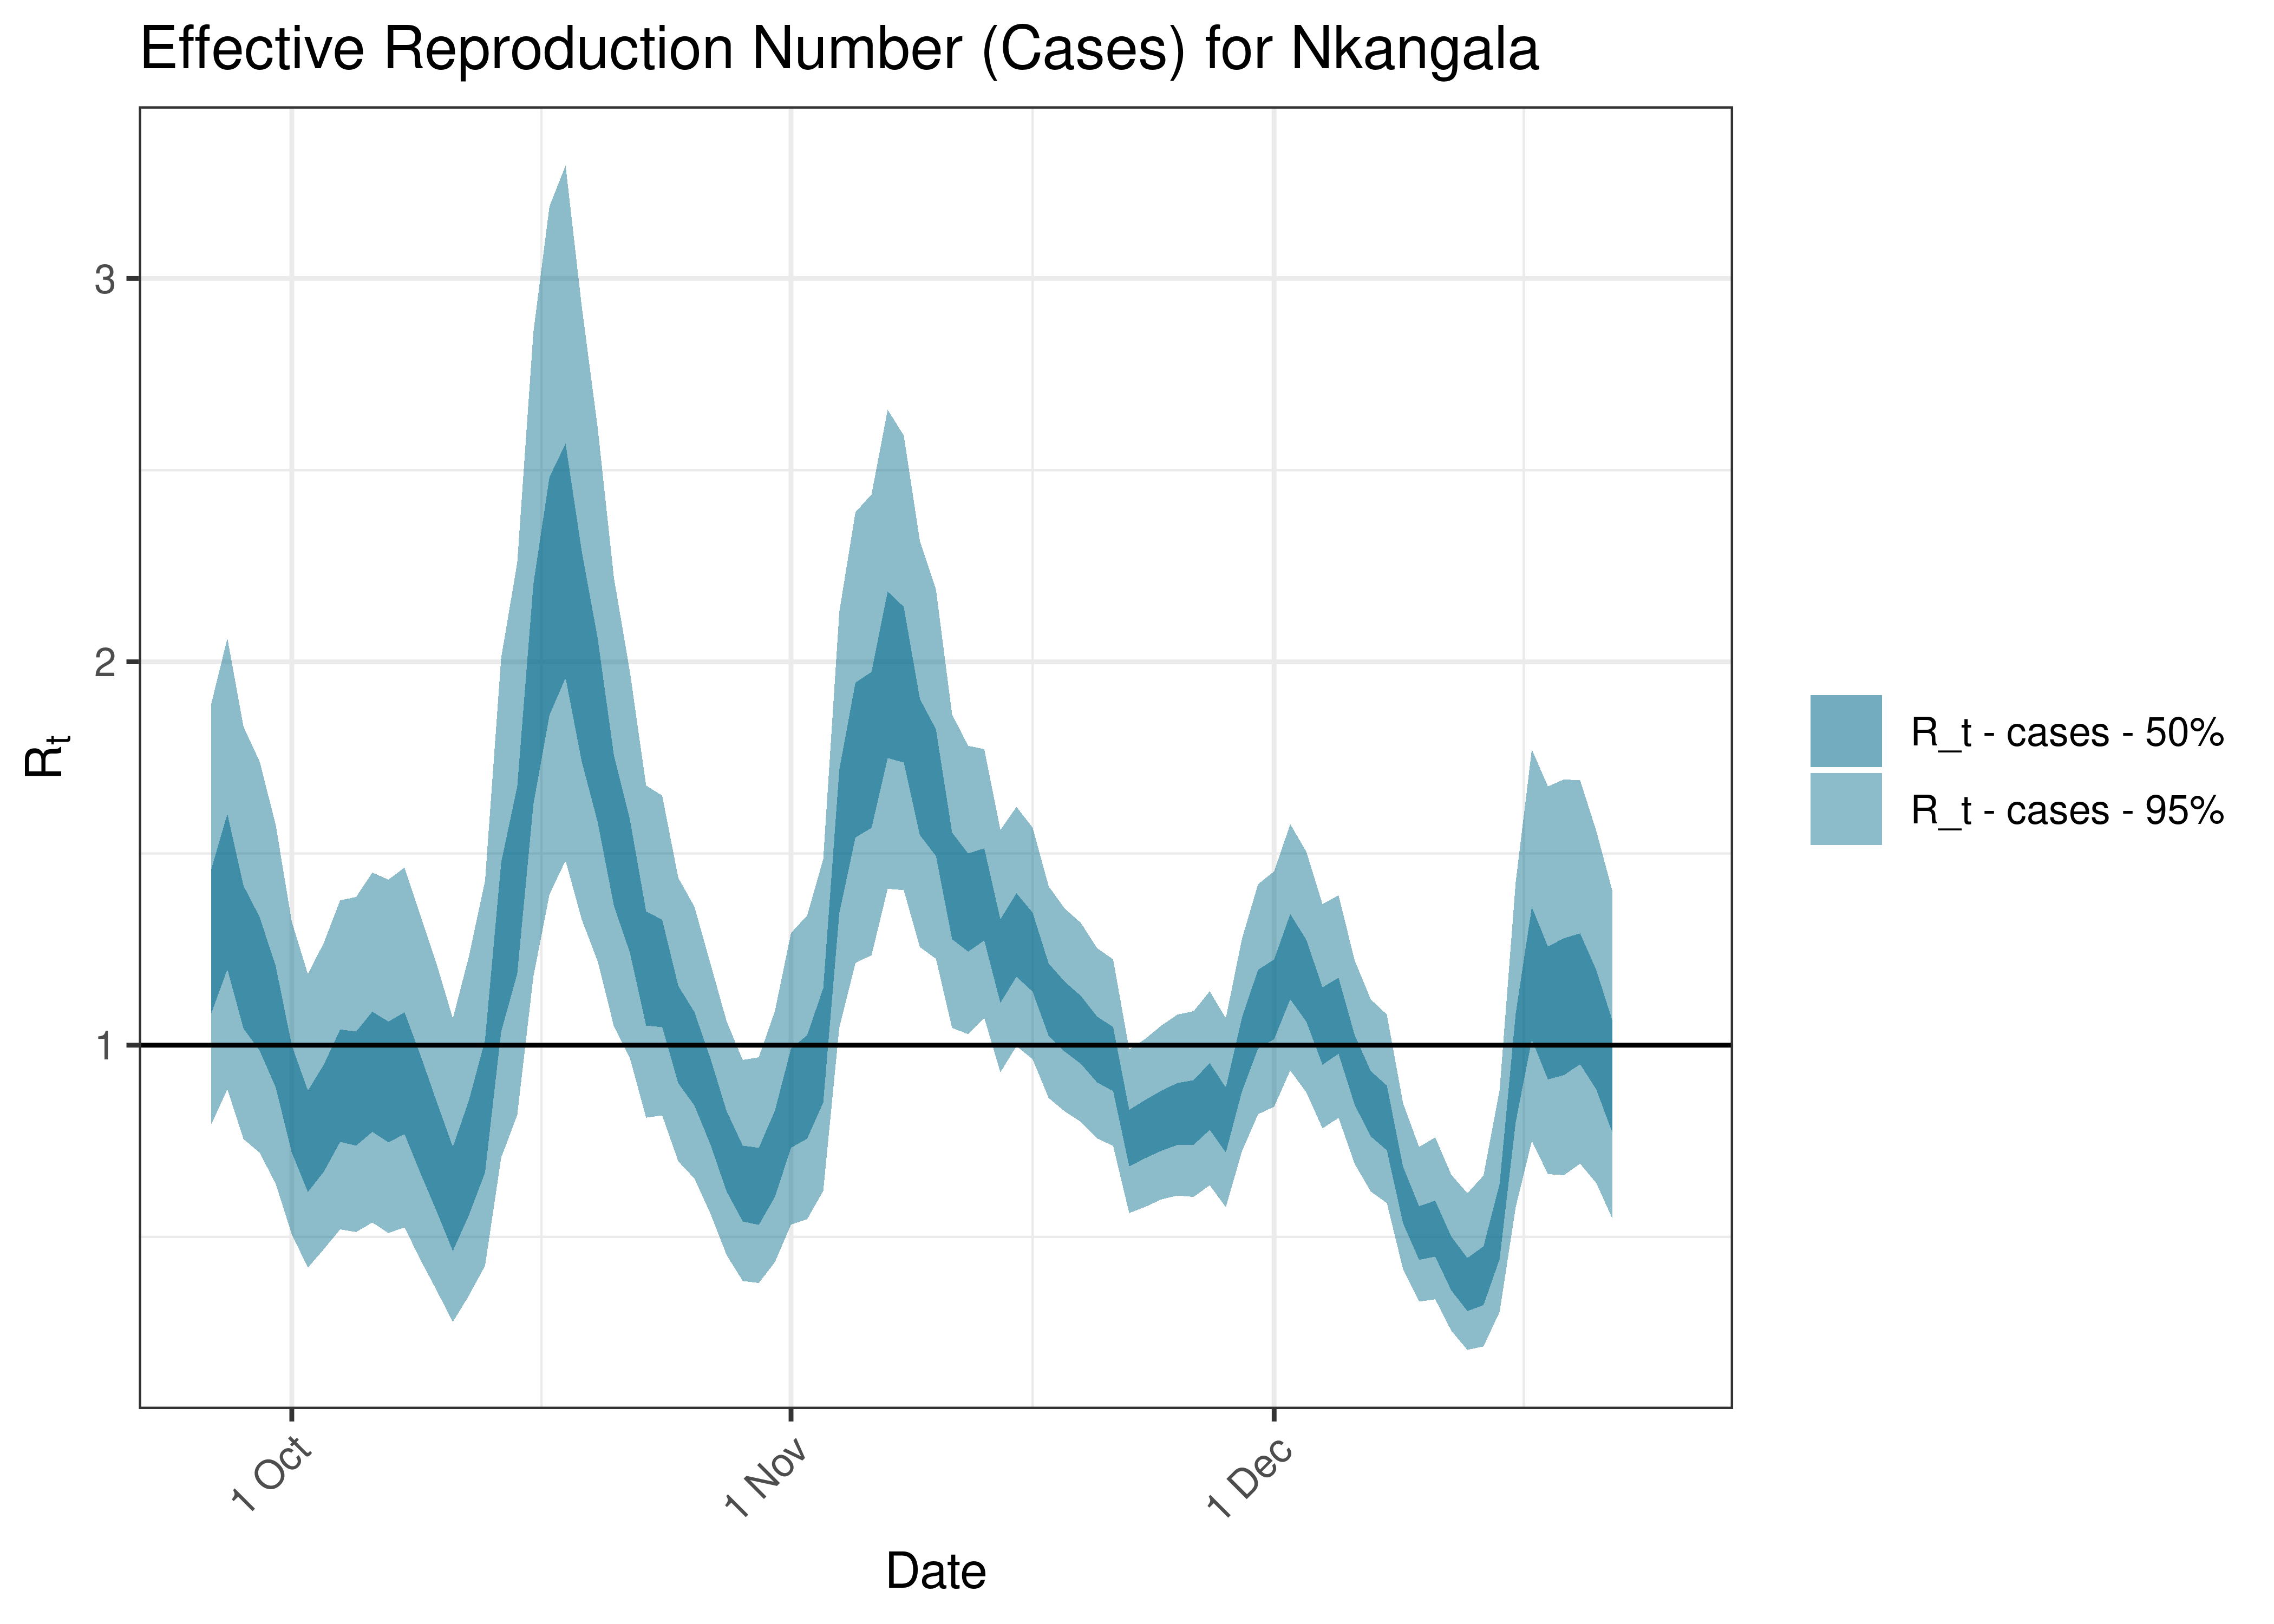
Estimated Effective Reproduction Number Based on Cases for Nkangala over last 90 days
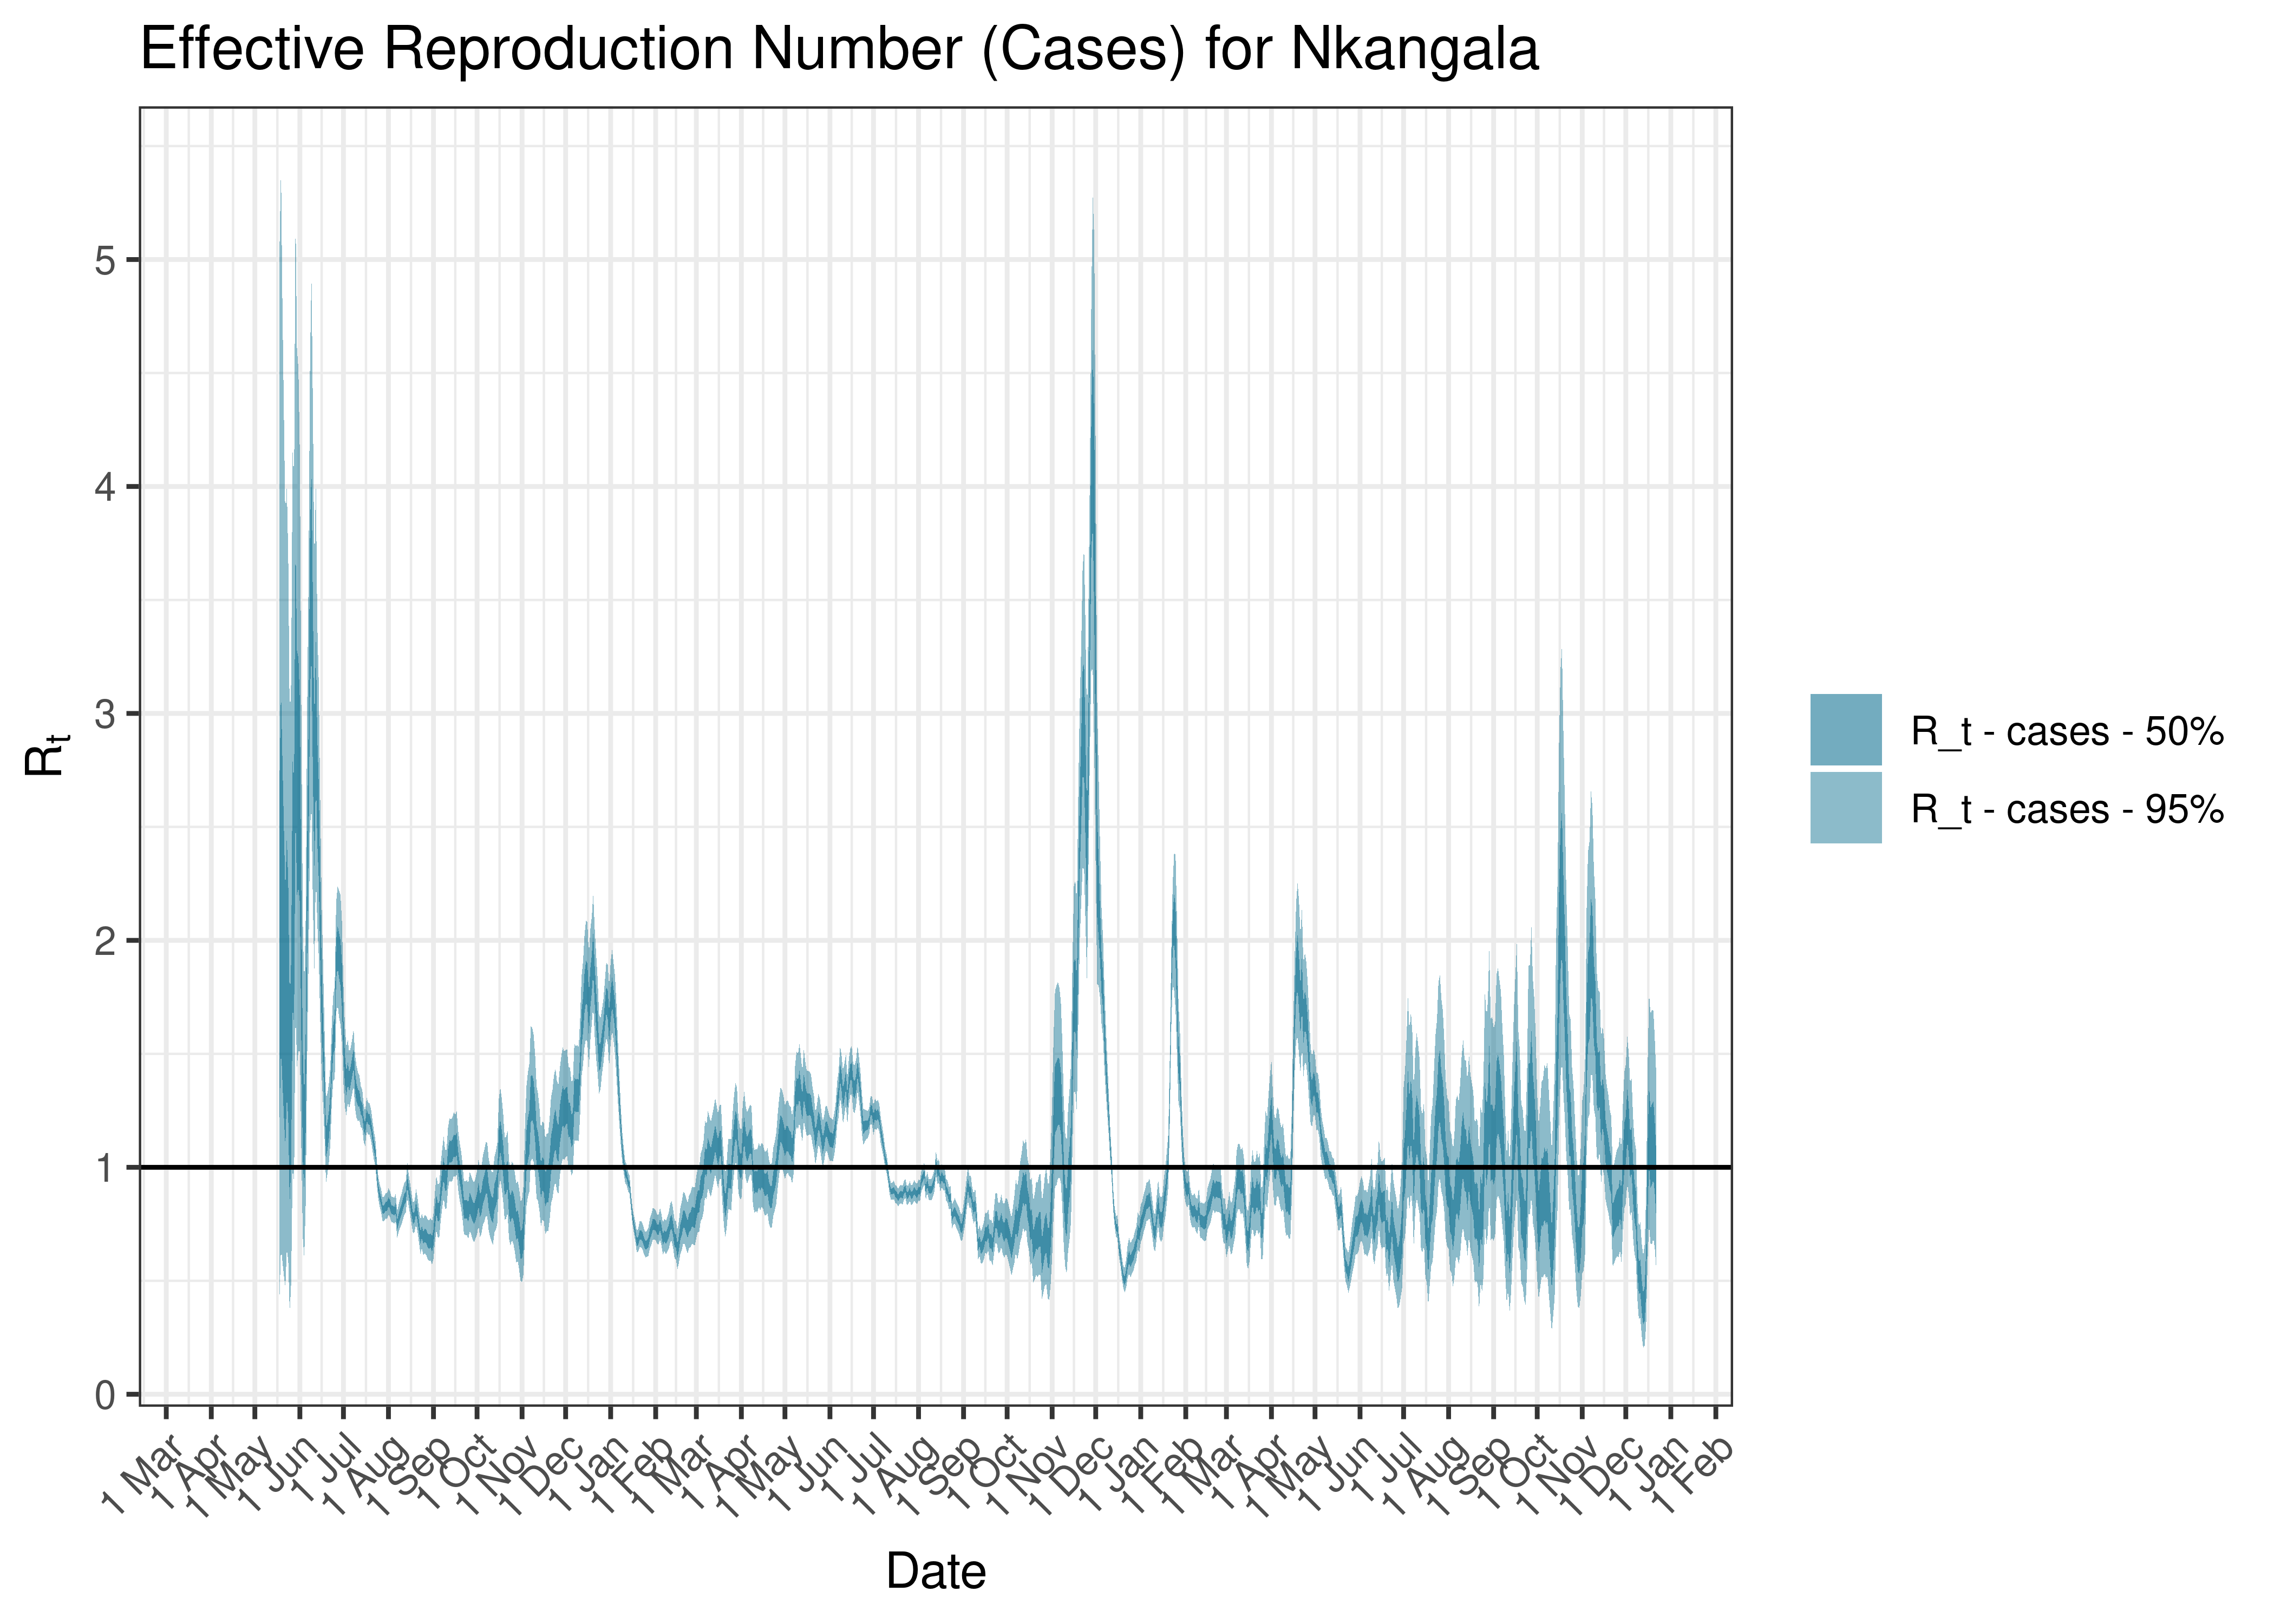
Estimated Effective Reproduction Number Based on Cases for Nkangala since 1 April 2020
6.8 North West
6.8.1 Cases
Cases are tabulated by specimen received date below. Cases include estimates for late reporting in recent days as well as adjustments for any public holidays. A centred 7-day moving average is also shown. The peak daily cases in previous waves (as measured by the moving average) is also shown.
| Specimen Received Date | Cases | 7-day Moving Average | Comment |
|---|---|---|---|
| 2020-07-10 | 620 | 516 | Wave 1 Peak |
| 2020-07-11 | 337 | 516 | Wave 1 Peak |
| 2021-01-07 | 790 | 820 | Wave 2 Peak |
| 2021-07-04 | 556 | 1,297 | Wave 3 Peak |
| 2021-12-10 | 1,402 | 1,293 | Wave 4 Peak |
| 2022-05-09 | 363 | 229 | Wave 5 Peak (to date) |
Below a 7-day moving average daily case count is plotted for North West on a log scale since start of the epidemic:
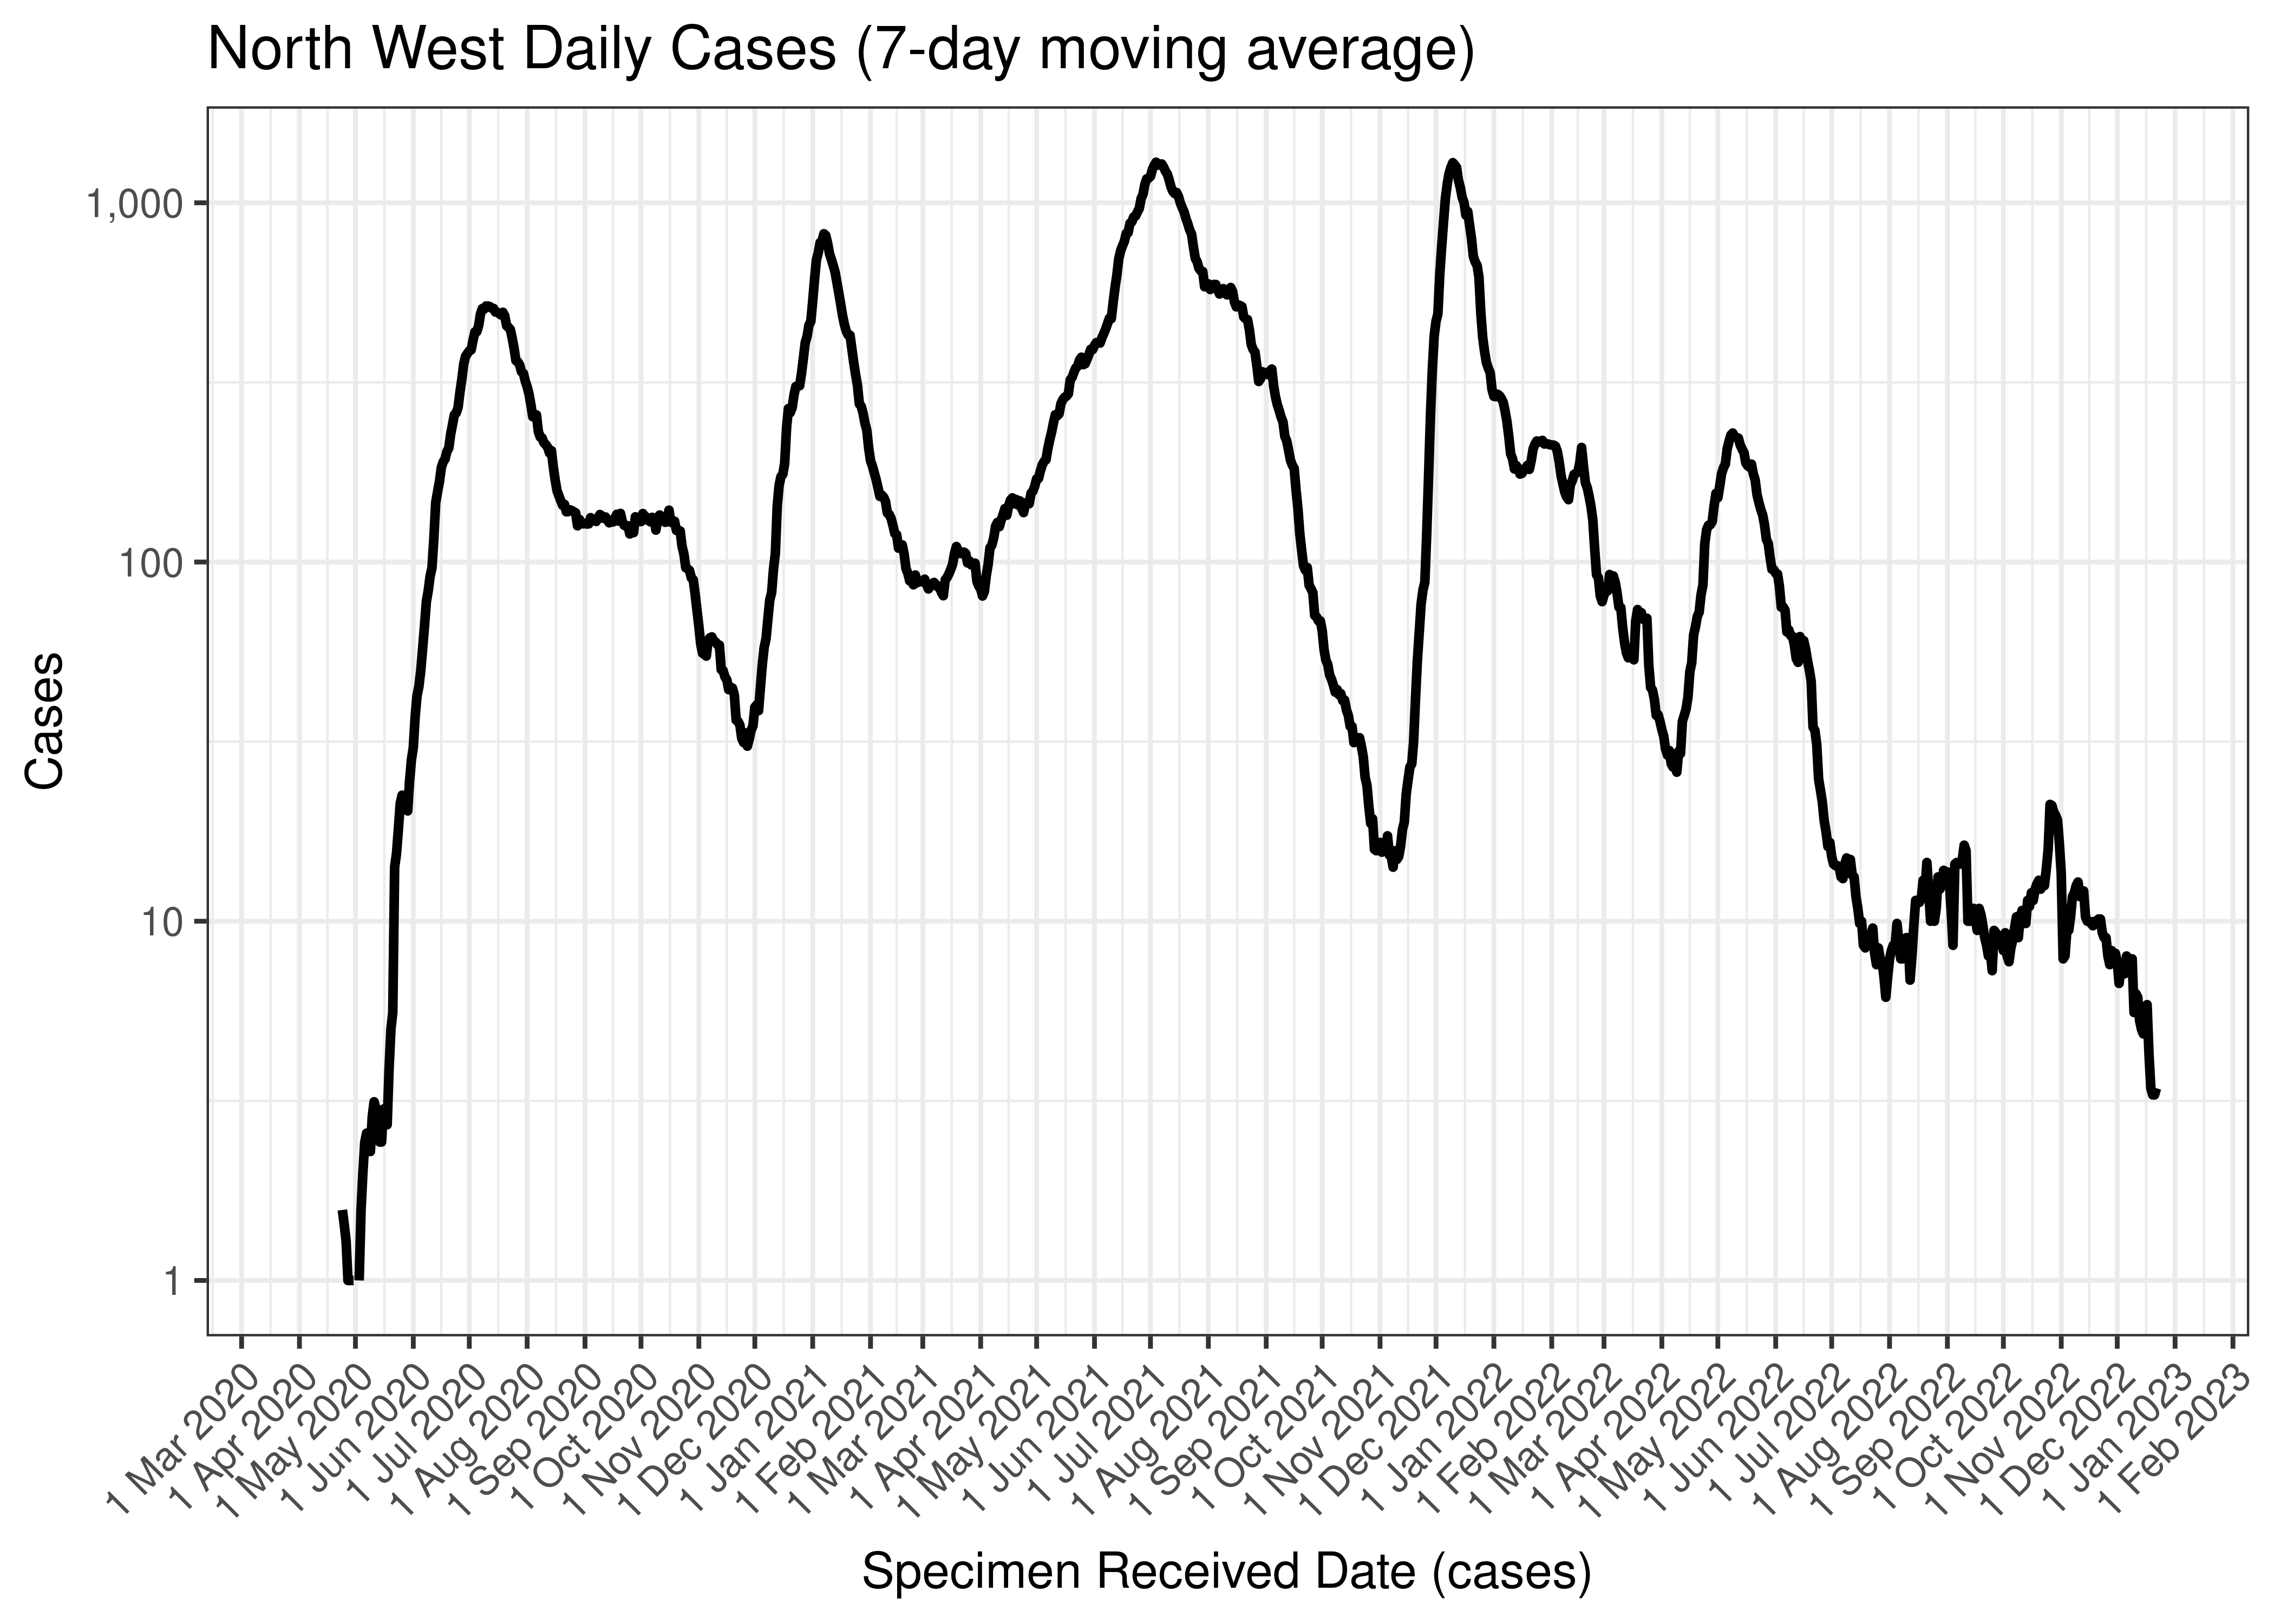
North West Daily Cases (7-day moving average)
Below the above chart is repeated for the last 30-days:

North West Daily Cases for Last 30-days (7-day moving average)
Below a 7-day moving average daily case count is plotted for North West by district municipality on a log scale since start of the epidemic:
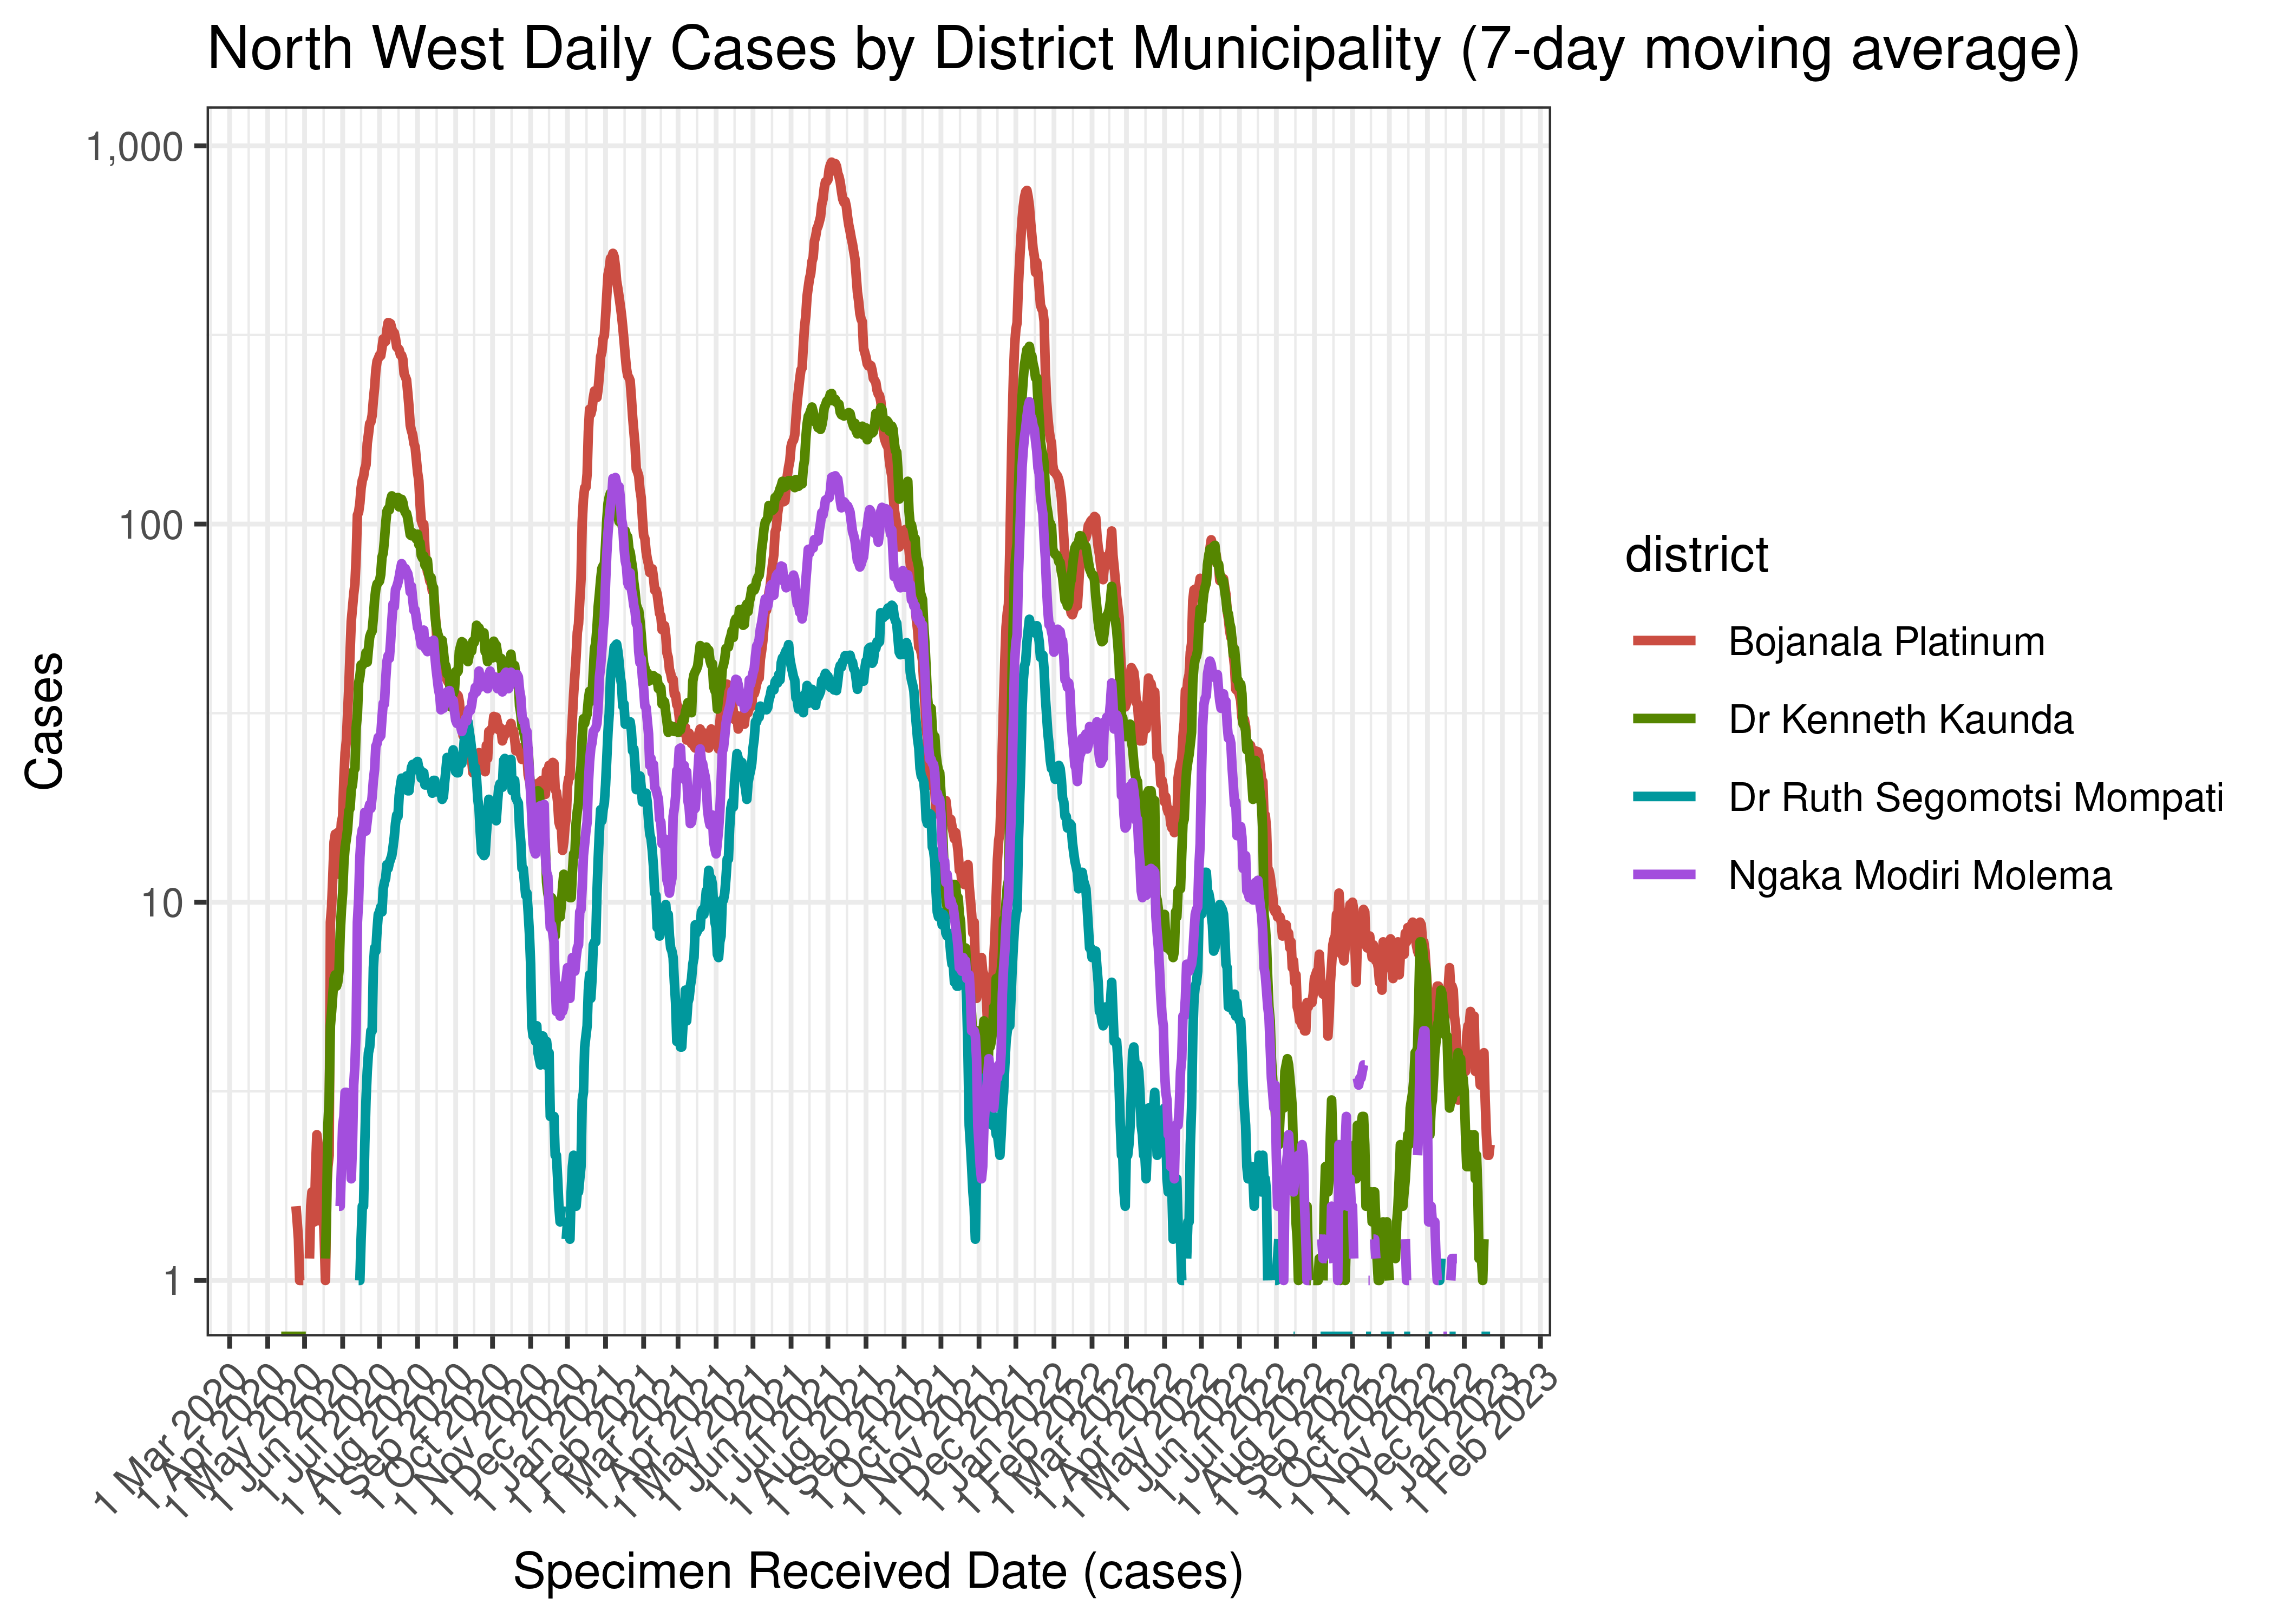
North West Daily Cases by District Municipality (7-day moving average)
Below the above chart is repeated for the last 30-days:
North West Daily Cases for Last 30-days by District Municipality (7-day moving average)
6.8.2 Hospital Admissions
Hospital admissions are tabulated by reported date below. The peak daily admissions in previous waves (as measured by the moving average) is also shown.
| Reported Date | Hospital Admissions | 7-day Moving Average | Comment |
|---|---|---|---|
| 2020-07-31 | 31 | 87 | Wave 1 Peak |
| 2021-01-24 | 64 | 212 | Wave 2 Peak |
| 2021-07-12 | 249 | 162 | Wave 3 Peak |
| 2021-12-12 | 41 | 83 | Wave 4 Peak |
| 2022-04-16 | 0 | 67 | Wave 5 Peak (to date) |
Below a 7-day moving average daily hospital admissions count is plotted for North West on a log scale since start of the epidemic:
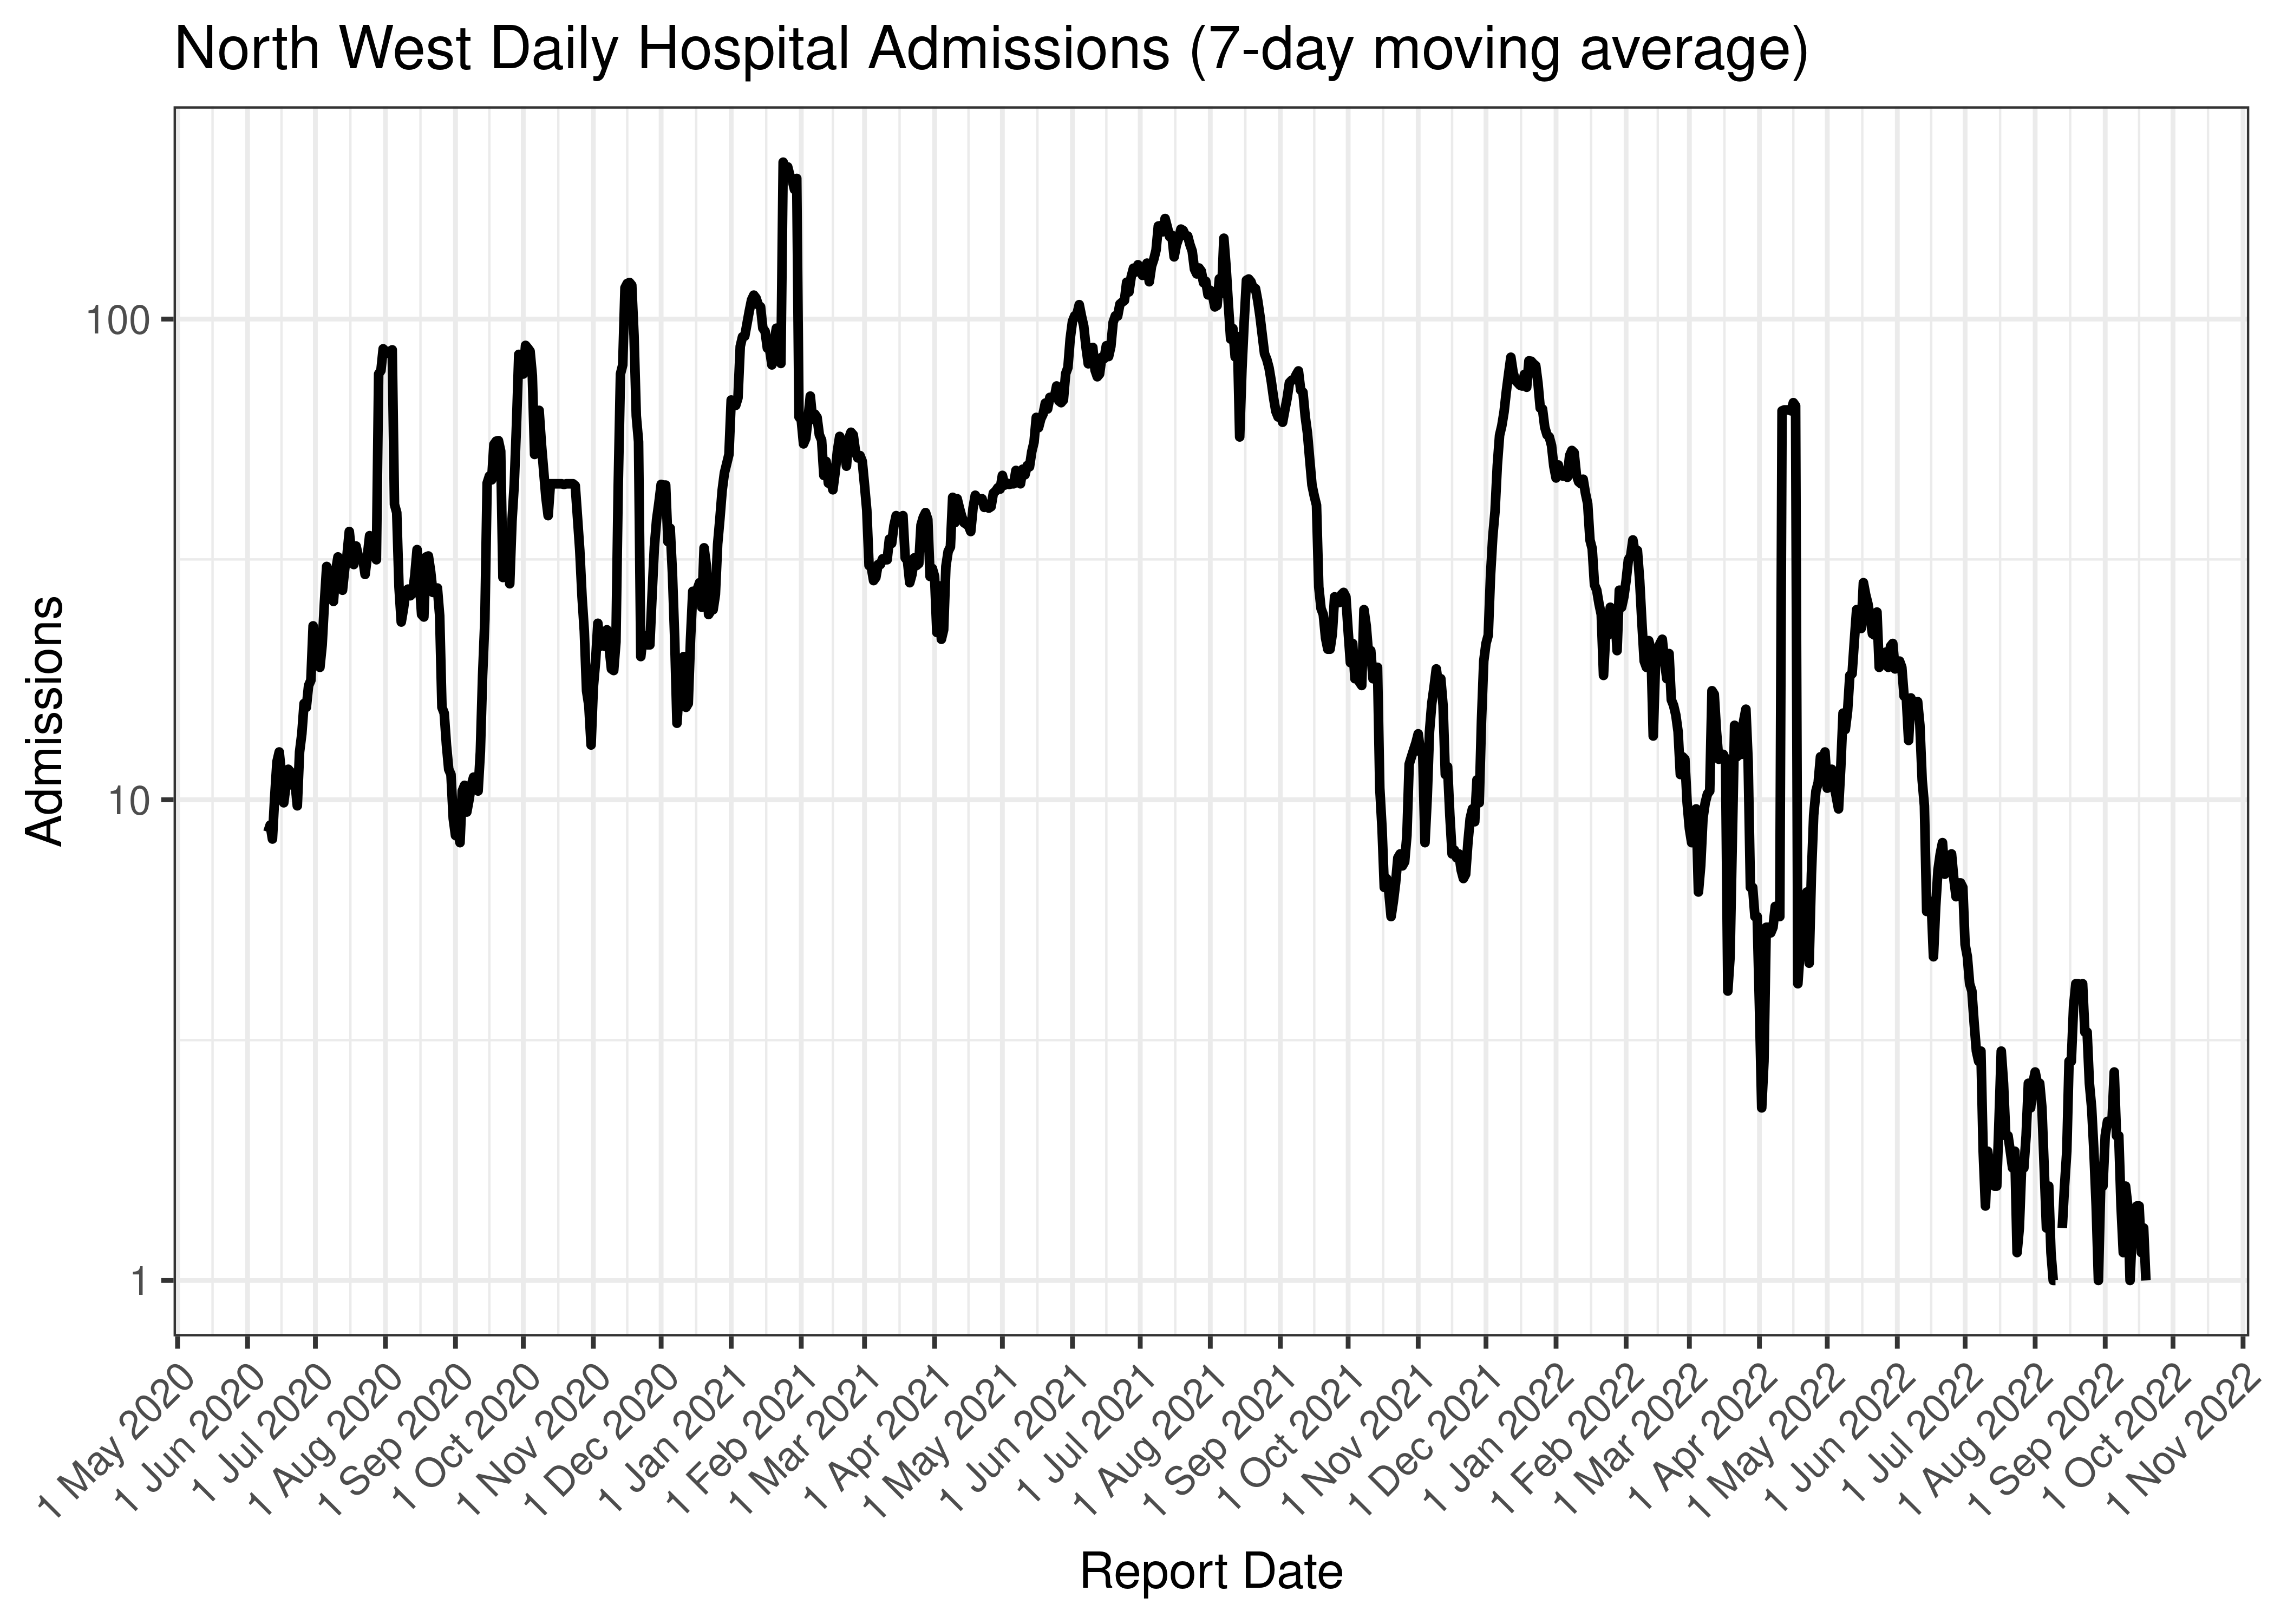
North West Daily Hospital Admissions (7-day moving average)
Below the above chart is repeated for the last 30-days:
North West Daily Hospital Admissions for Last 30-days (7-day moving average)
6.8.3 Hospital Deaths
Hospital deaths are tabulated by reported date below. The peak daily deaths in previous waves (as measured by the moving average) is also shown.
Note that hospital deaths underestimates total COVID-19 deaths in South Africa.
| Reported Date | Hospital Deaths | 7-day Moving Average | Comment |
|---|---|---|---|
| 2020-08-04 | 7 | 11 | Wave 1 Peak |
| 2021-01-28 | 9 | 22 | Wave 2 Peak |
| 2021-07-18 | 21 | 40 | Wave 3 Peak |
| 2021-12-26 | 3 | 7 | Wave 4 Peak |
| 2022-04-17 | 0 | 11 | Wave 5 Peak (to date) |
| 2022-12-16 | 0 | 0 | |
| 2022-12-17 | 0 | 0 | |
| 2022-12-18 | 0 | 0 | |
| 2022-12-19 | 0 | 0 | |
| 2022-12-20 | 2 | 0 | |
| 2022-12-21 | 0 | NA | |
| 2022-12-22 | 0 | NA | |
| 2022-12-23 | 0 | NA |
Below a 7-day moving average daily hospital deaths count is plotted for North West on a log scale since start of the epidemic:
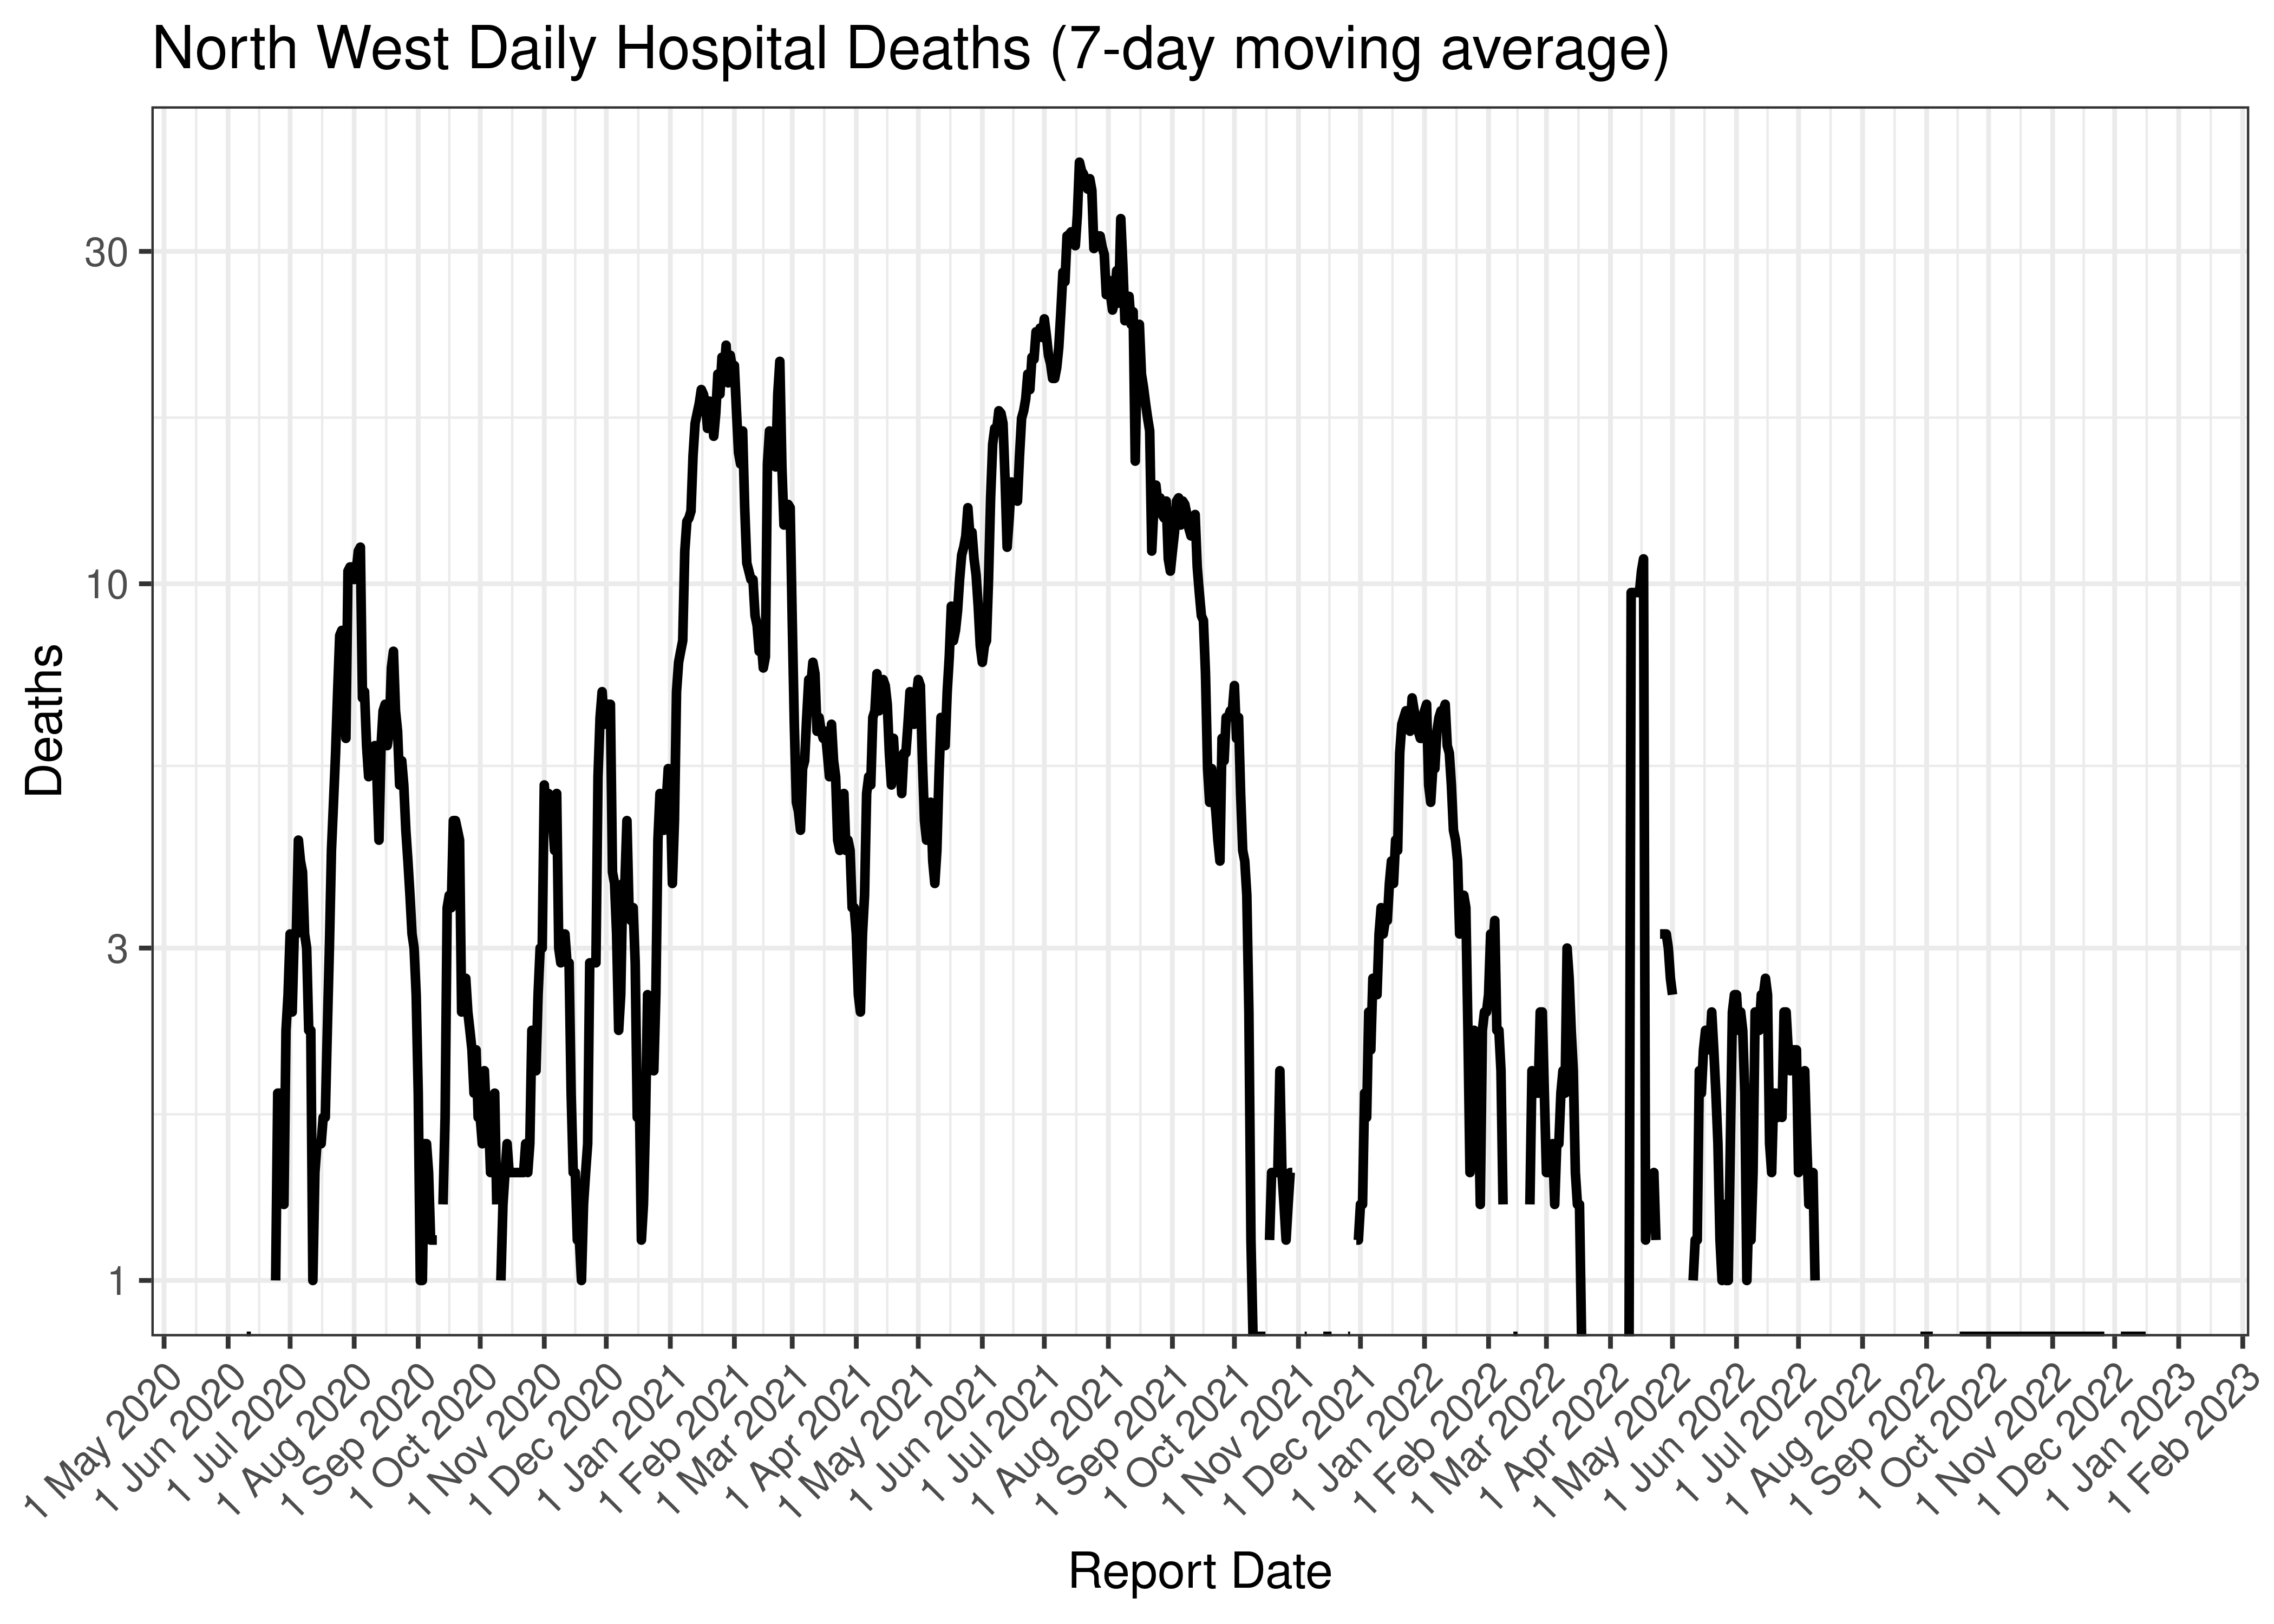
North West Daily Hospital Deaths (7-day moving average)
Below the above chart is repeated for the last 30-days:
North West Daily Hospital Deaths for Last 30-days (7-day moving average)
6.8.4 Excess Deaths
Excess deaths are tabulated by date of death below. The peak daily deaths in previous waves (as measured by the moving average) is also shown.
| Date of Death | Excess Deaths | 7-day Moving Average | Comment |
|---|---|---|---|
| 2020-07-22 | 41 | 41 | Wave 1 Peak |
| 2021-01-20 | 102 | 102 | Wave 2 Peak |
| 2021-07-21 | 141 | 141 | Wave 3 Peak |
| 2021-12-29 | 37 | 37 | Wave 4 Peak |
| 2022-05-25 | 26 | 26 | Wave 5 Peak (to date) |
| 2022-12-03 | 0 | -4 | |
| 2022-12-04 | -10 | -5 | |
| 2022-12-05 | -10 | -7 | |
| 2022-12-06 | -10 | -8 | |
| 2022-12-07 | -10 | -10 | |
| 2022-12-08 | -10 | NA | |
| 2022-12-09 | -10 | NA | |
| 2022-12-10 | -10 | NA |
Below a 7-day moving average daily excess deaths count is plotted for North West on a log scale since start of the epidemic:
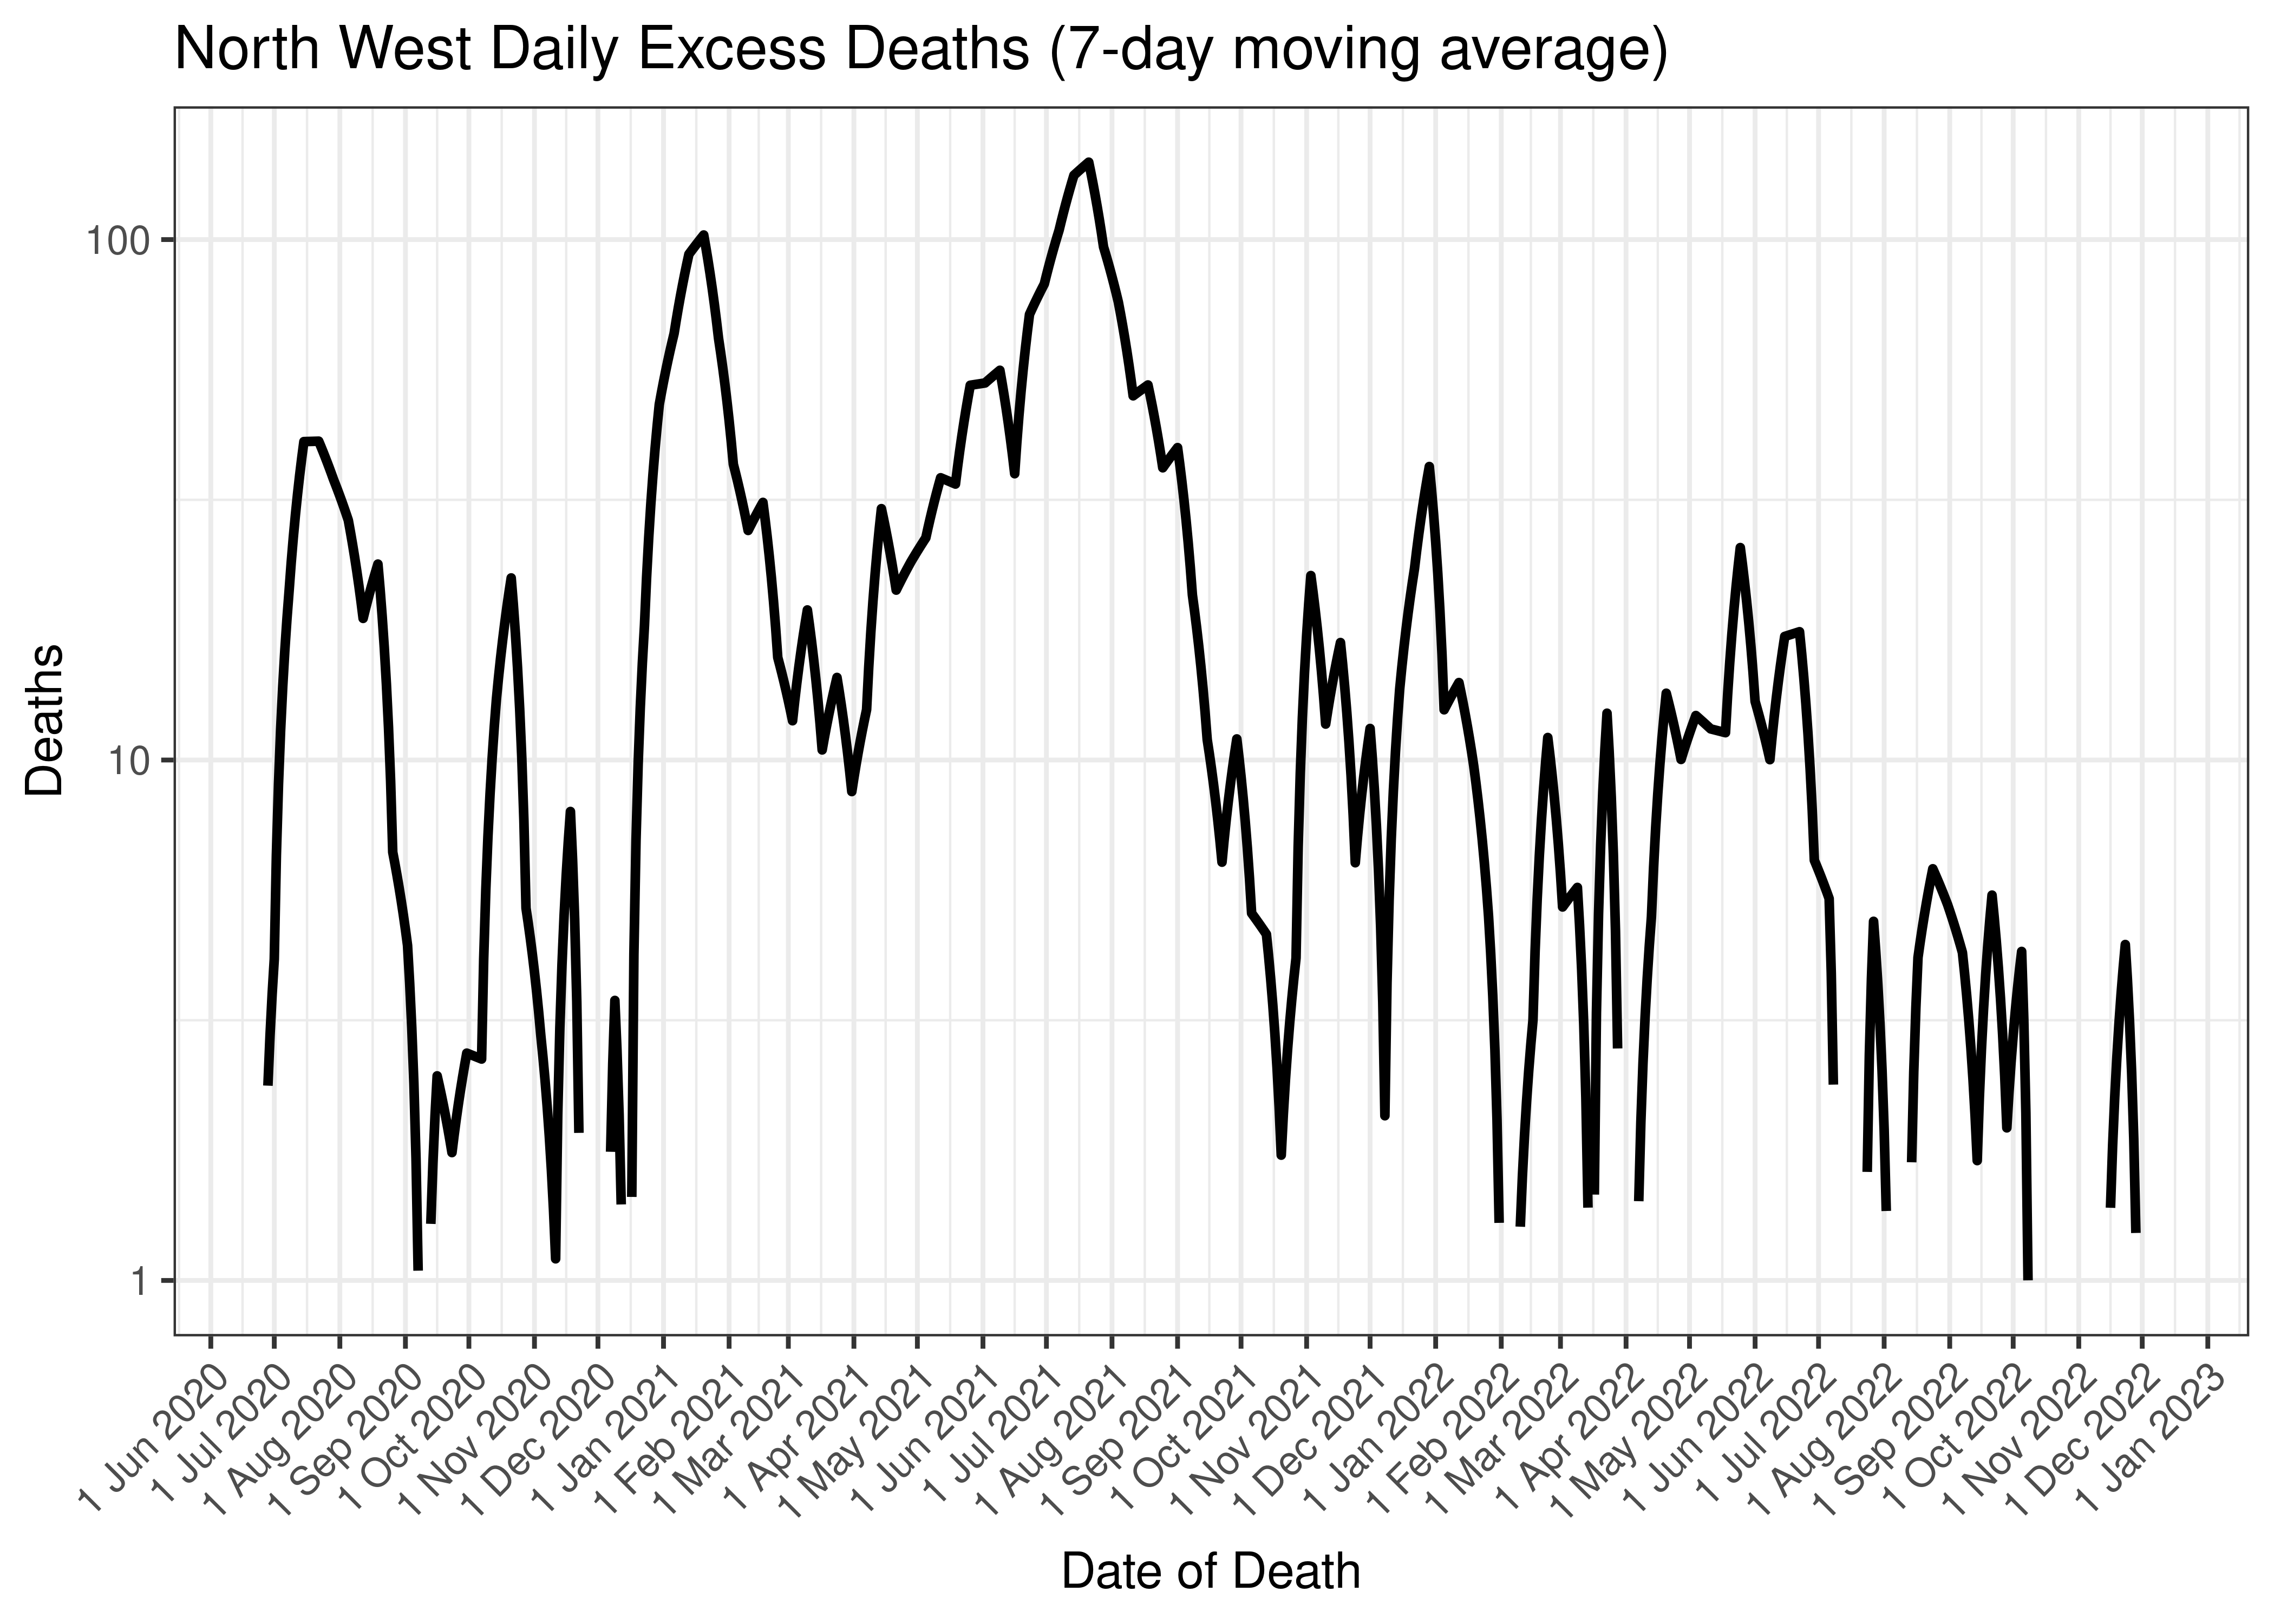
North West Daily Excess Deaths (7-day moving average)
Below the above chart is repeated for the last 30-days:
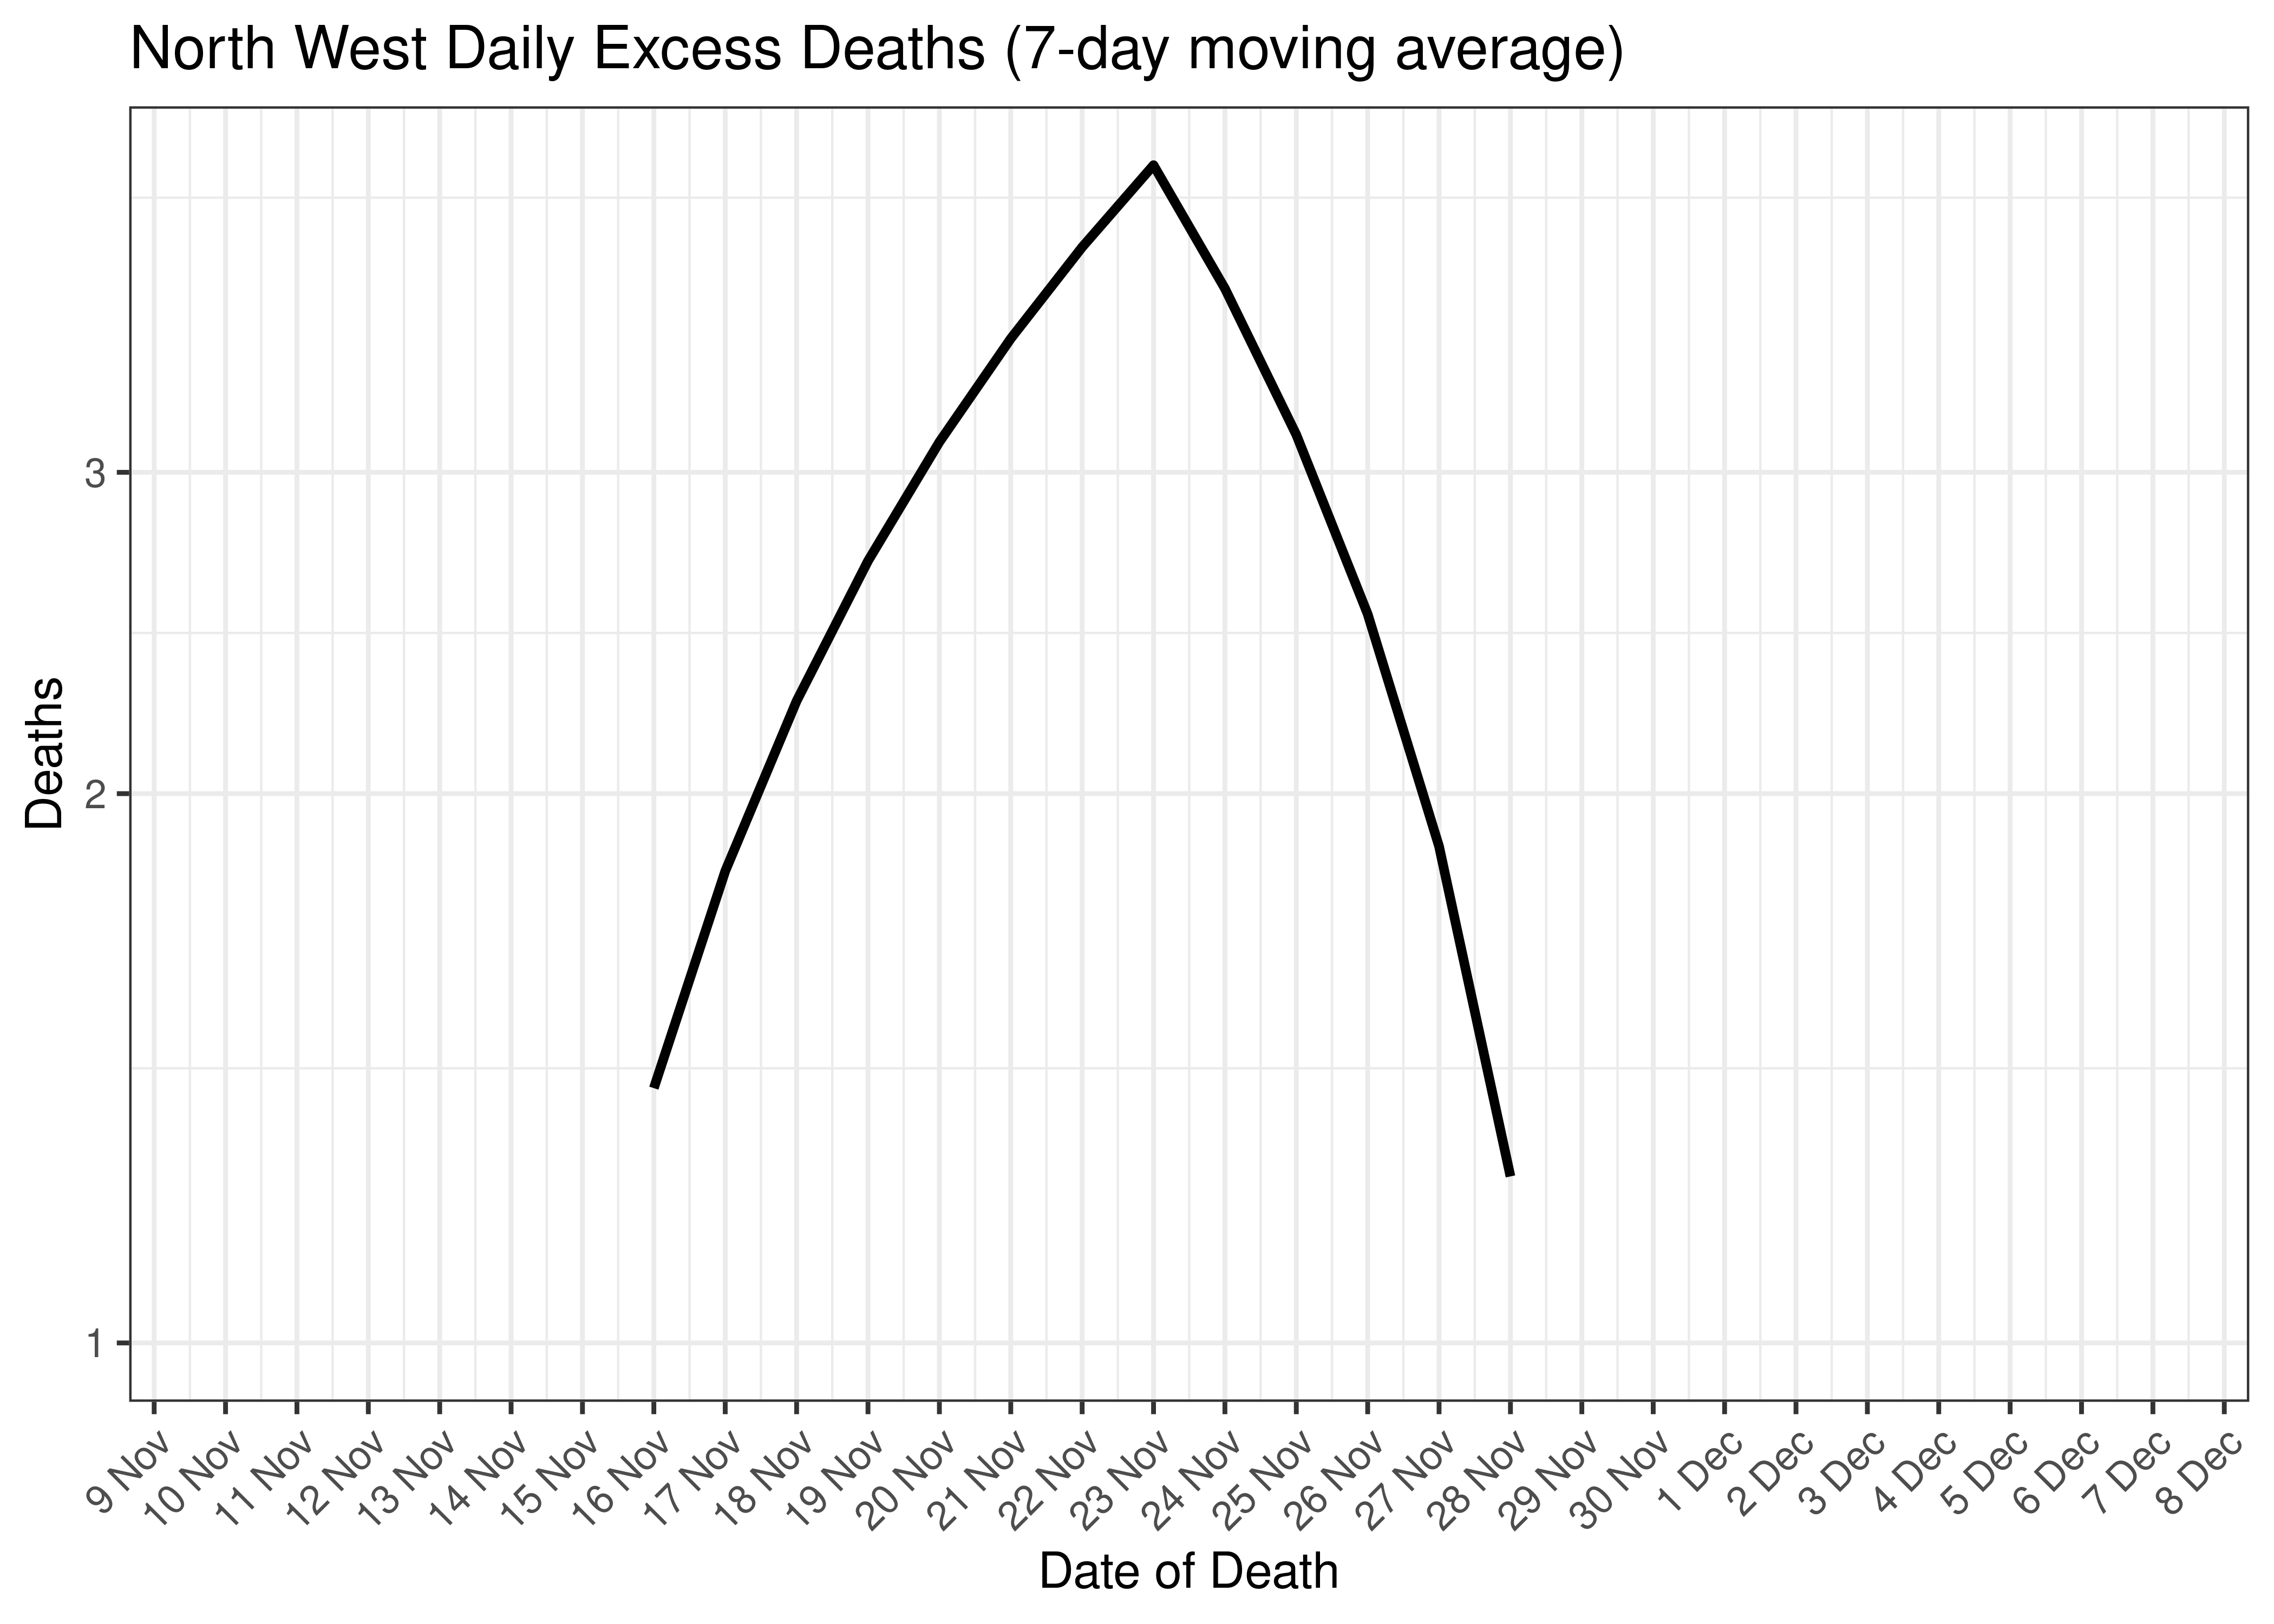
North West Daily Excess Deaths for Last 30-days (7-day moving average)
6.8.5 Cases, Admissions and Deaths Combined
Below a 7-day moving average daily case, admission and excess death counts are plotted for North West on a log scale since start of the epidemic. Note admissions and excess deaths are plotted by reported date, whereas cases are plotted by specimen received date.
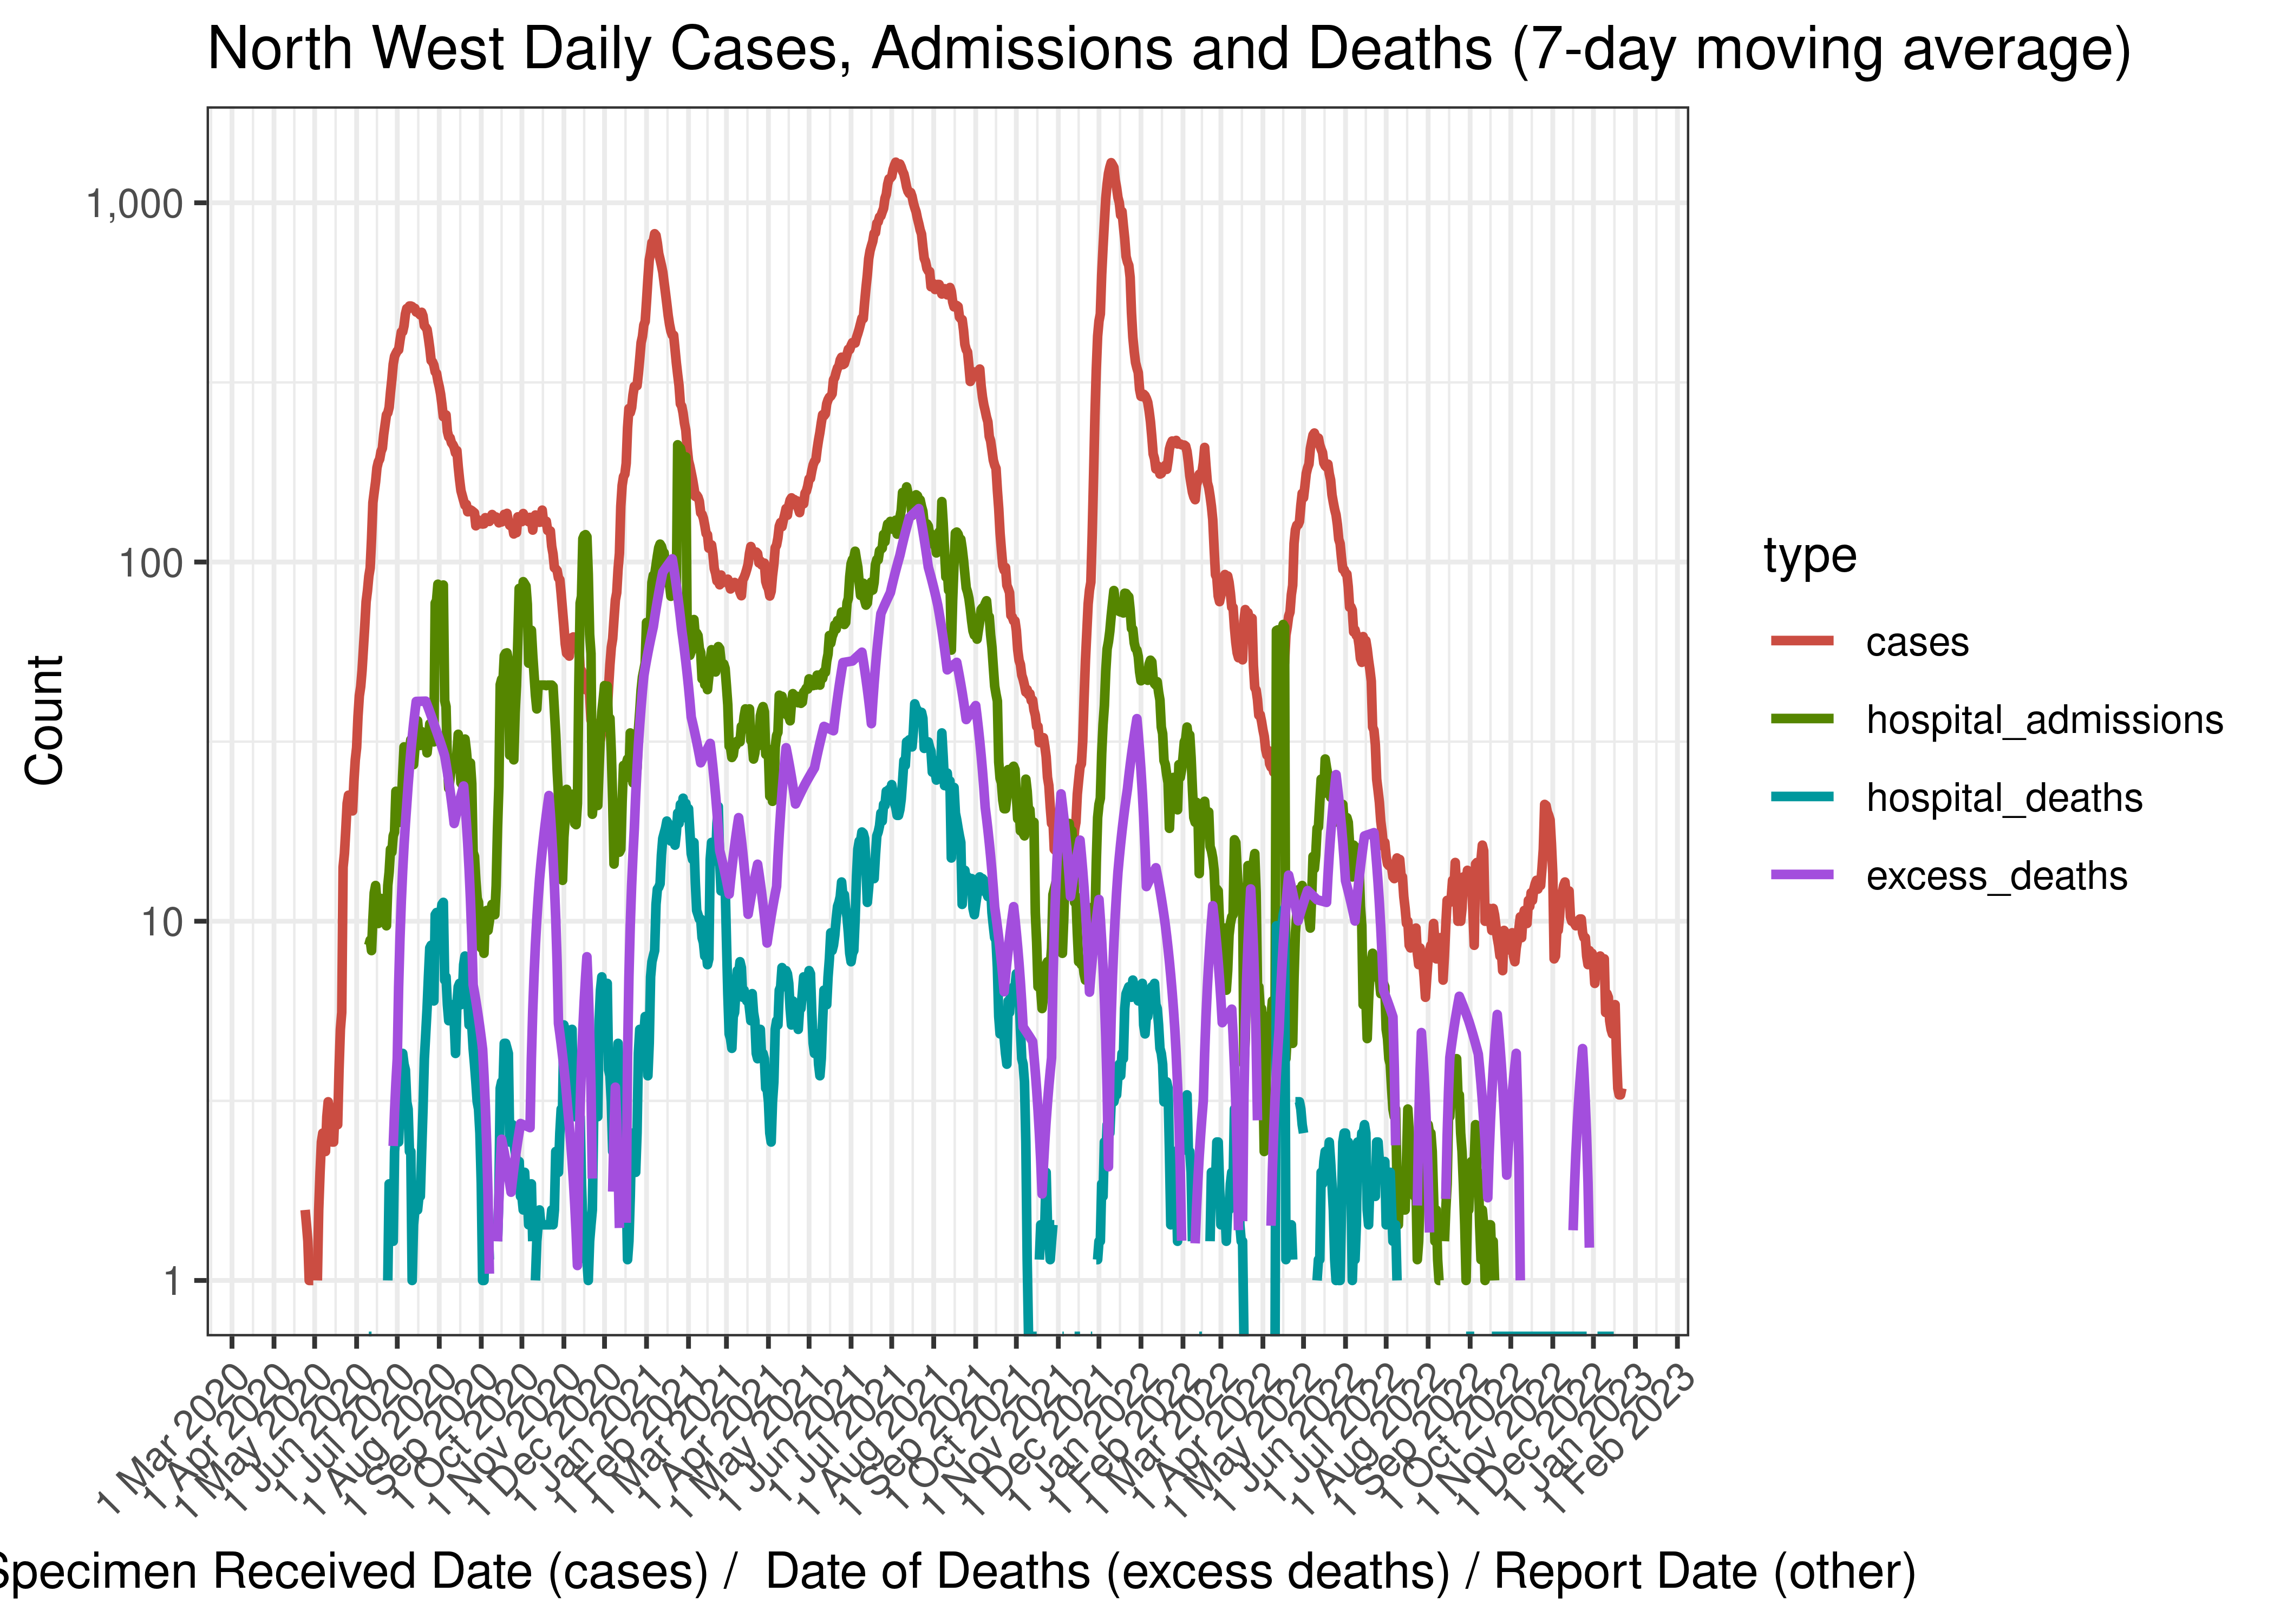
North West Daily Cases, Admissions and Deaths (7-day moving average)
Below the above chart is repeated for the last 30-days:
North West Daily Cases, Admissions and Deaths for Last 30-days (7-day moving average)
6.8.6 Crude Ratios per Wave
Below crude rations are calculated between the waves. It’s based on the following starting dates:
- Wave 1 started on 2020-01-01.
- Wave 2 started on 2020-10-01.
- Wave 3 started on 2021-04-01.
- Wave 4 started on 2021-11-01.
- Wave 5 started on 2022-04-01.
Below crude ratios are tabulated and plotted. These ratios are:
- Case admissions ratio calculated as admissions divided by cases.
- Case fatality ratio calculated as hospital deaths divided by cases (Note that COVID-19 deaths are under-reported by a significant factor in South Africa).
- Case excess deaths ratio calculated as excess deaths divided by cases.
- Hospital fatality ratio calculated as hospital deaths divided by admissions (Note that COVID-19 deaths are under-reported by a significant factor in South Africa).
- Death reporting ratio calculated as hospital deaths divided by excess deaths.
| Wave | Case Admission Ratio | Case Fatality Ratio | Case Excess Deaths Ratio | Hospital Fatality Ratio | Death Reporting Ratio | |
|---|---|---|---|---|---|---|
| North West | Wave 1 | 11.3% | 1.41% | 5.54% | 12.5% | 25.5% |
| North West | Wave 2 | 29.4% | 3.74% | 12.77% | 12.7% | 29.3% |
| North West | Wave 3 | 17.3% | 3.16% | 10.74% | 18.3% | 29.4% |
| North West | Wave 4 | 10.7% | 0.85% | 3.83% | 7.9% | 22.1% |
| North West | Wave 5 | 15.8% | 2.30% | 10.28% | 14.6% | 22.4% |
Below the rations above are plotted graphically:
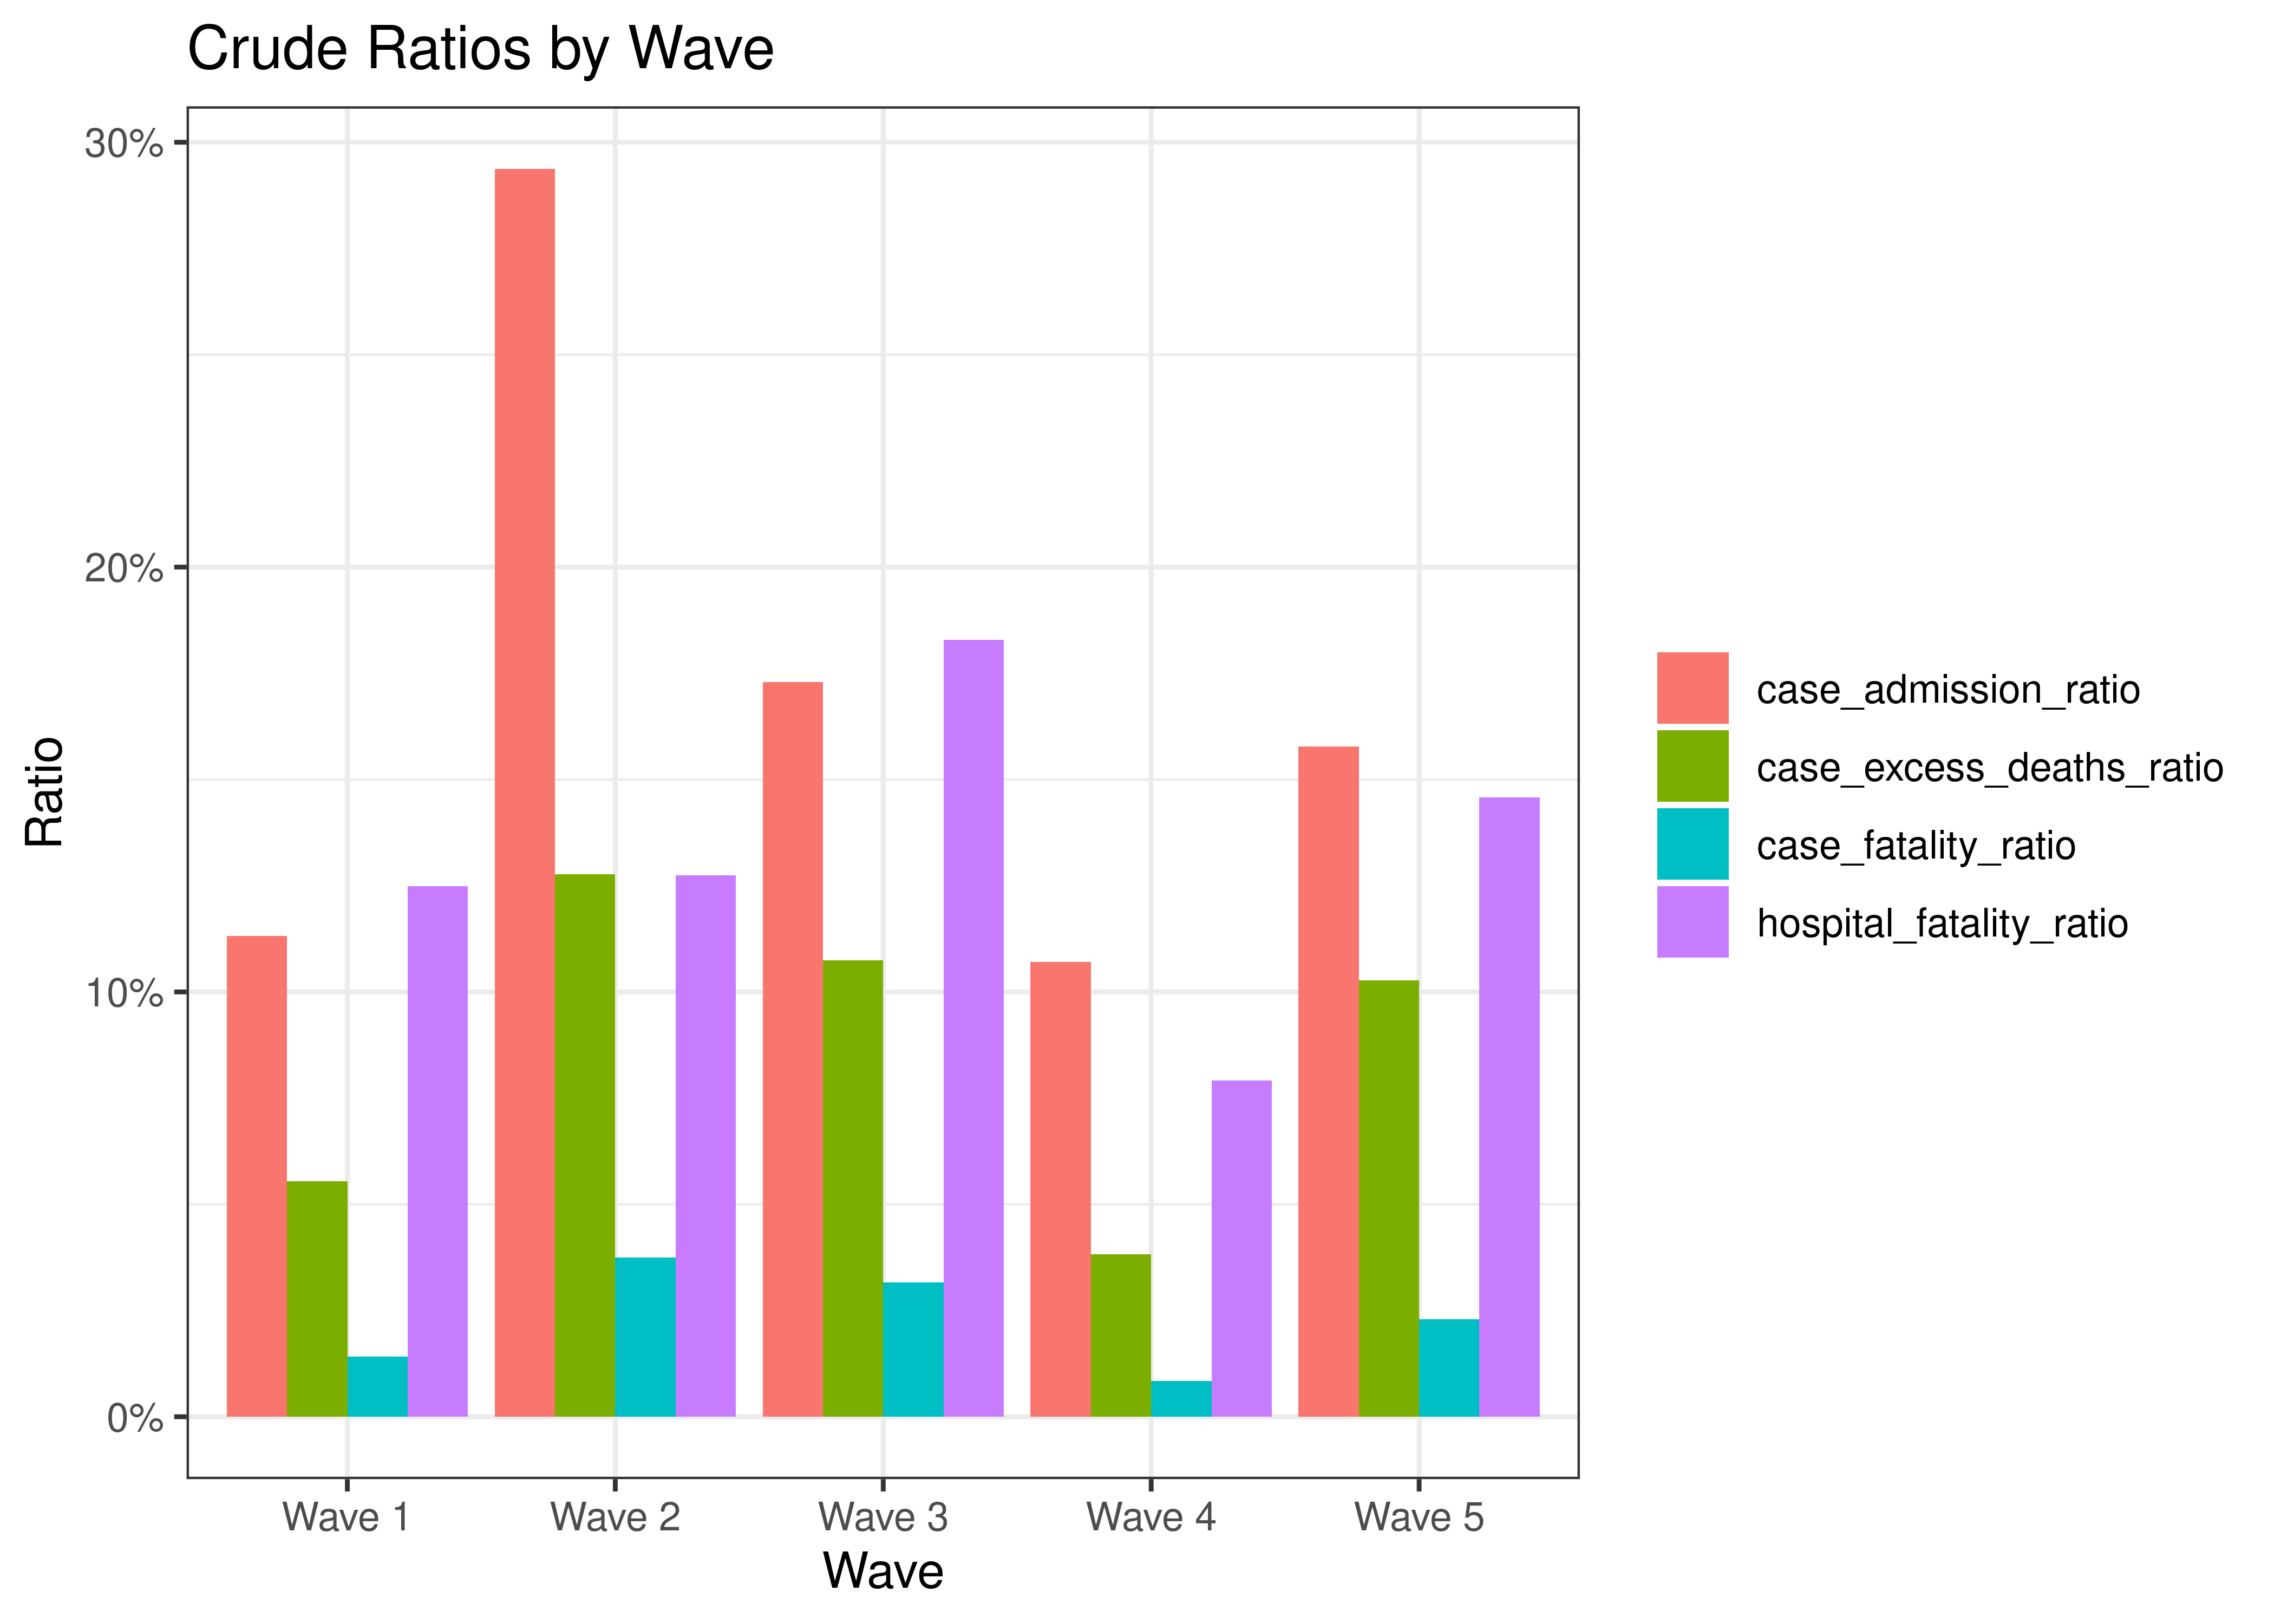
Crude Ratios by Wave
6.8.7 Reproduction Number
Below current (last weekly) effective reproduction number estimates are tabulated for North West and by district municipality.
| Type | Count (Per Day) | Week Ending | Reproduction Number [95% Confidence Interval] | |
|---|---|---|---|---|
| North West | cases | 3.4 | 2022-12-25 | 0.76 [0.49 - 1.10] |
| North West | hospital_admissions | 0.4 | 2022-09-26 | 0.53 [0.14 - 1.17] |
| District Municipality | Type | Count (Per Day) | Week Ending | Reproduction Number [95% Confidence Interval] |
|---|---|---|---|---|
| Bojanala Platinum | cases | 2.3 | 2022-12-25 | 0.76 [0.44 - 1.17] |
| Dr Kenneth Kaunda | cases | 0.7 | 2022-12-25 | 0.85 [0.31 - 1.67] |
| Dr Ruth Segomotsi Mompati | cases | 0.0 | 2022-12-25 | 2.82 [0.07 - 10.65] |
| Ngaka Modiri Molema | cases | 0.4 | 2022-12-25 | 1.11 [0.30 - 2.42] |
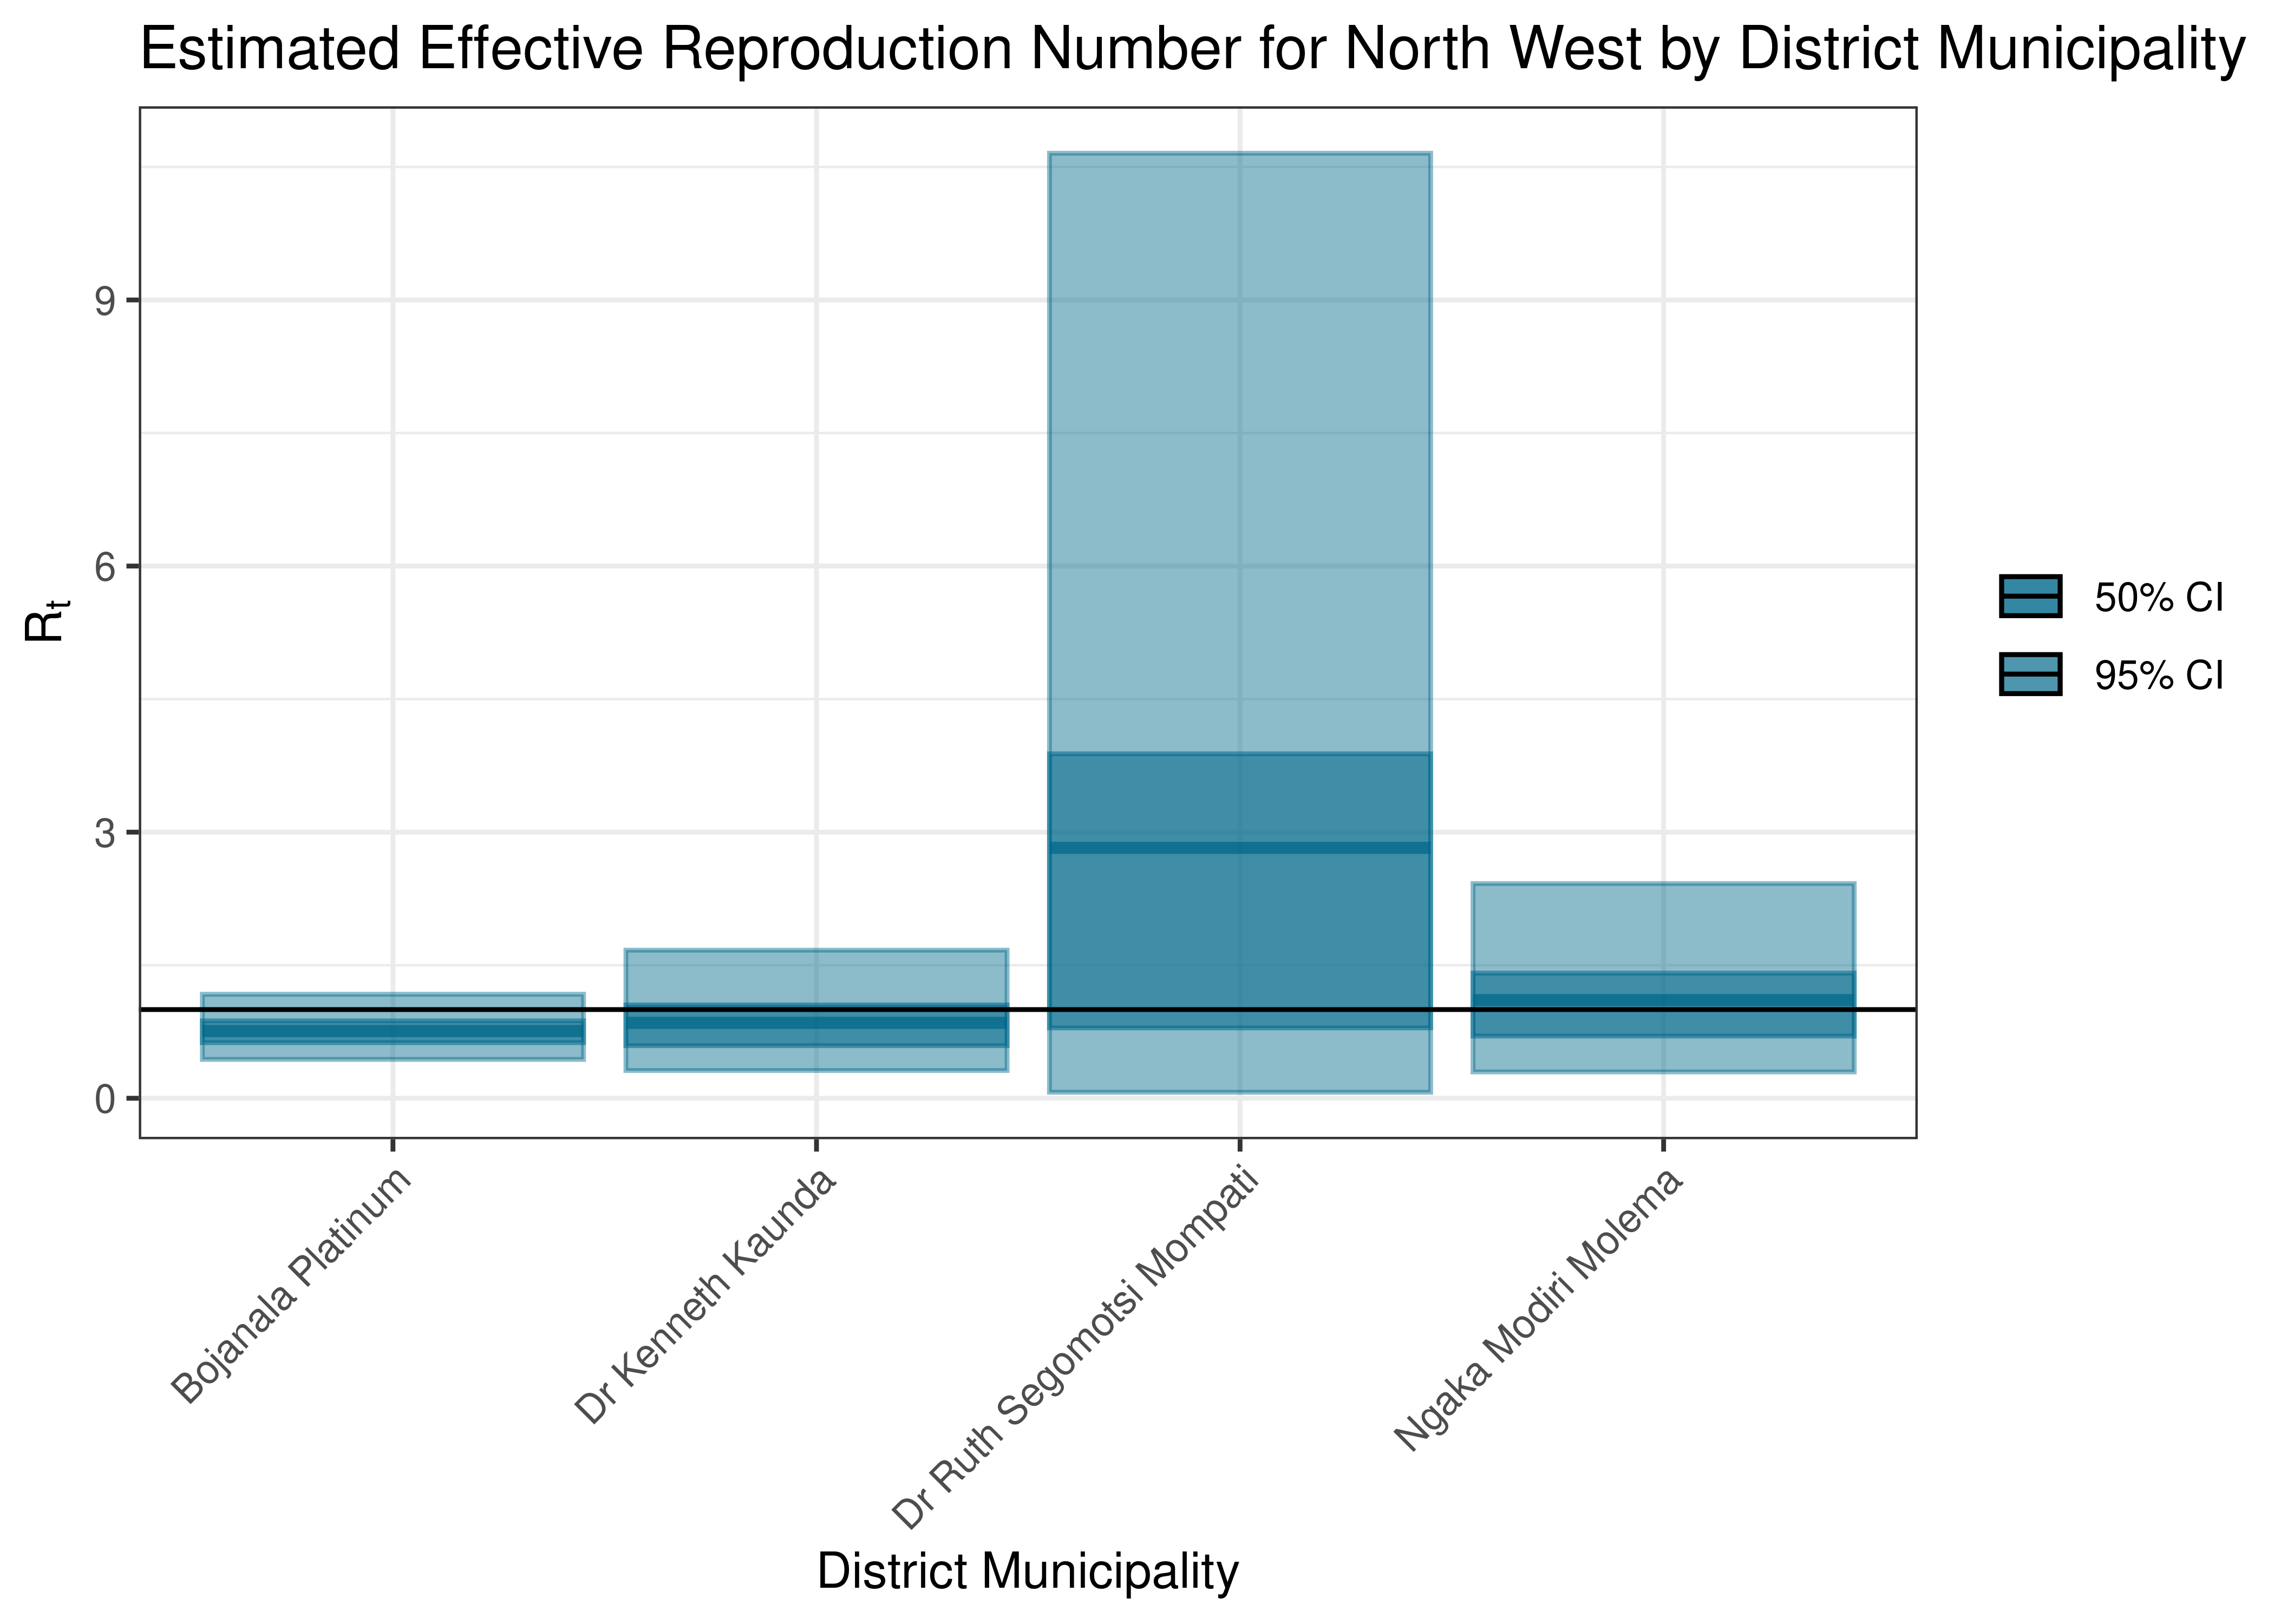
Estimated Effective Reproduction Number for North West by District Municipality
Below the effective reproduction number for North West over the last 90 days are plotted together with a plot since start of the pandemic.
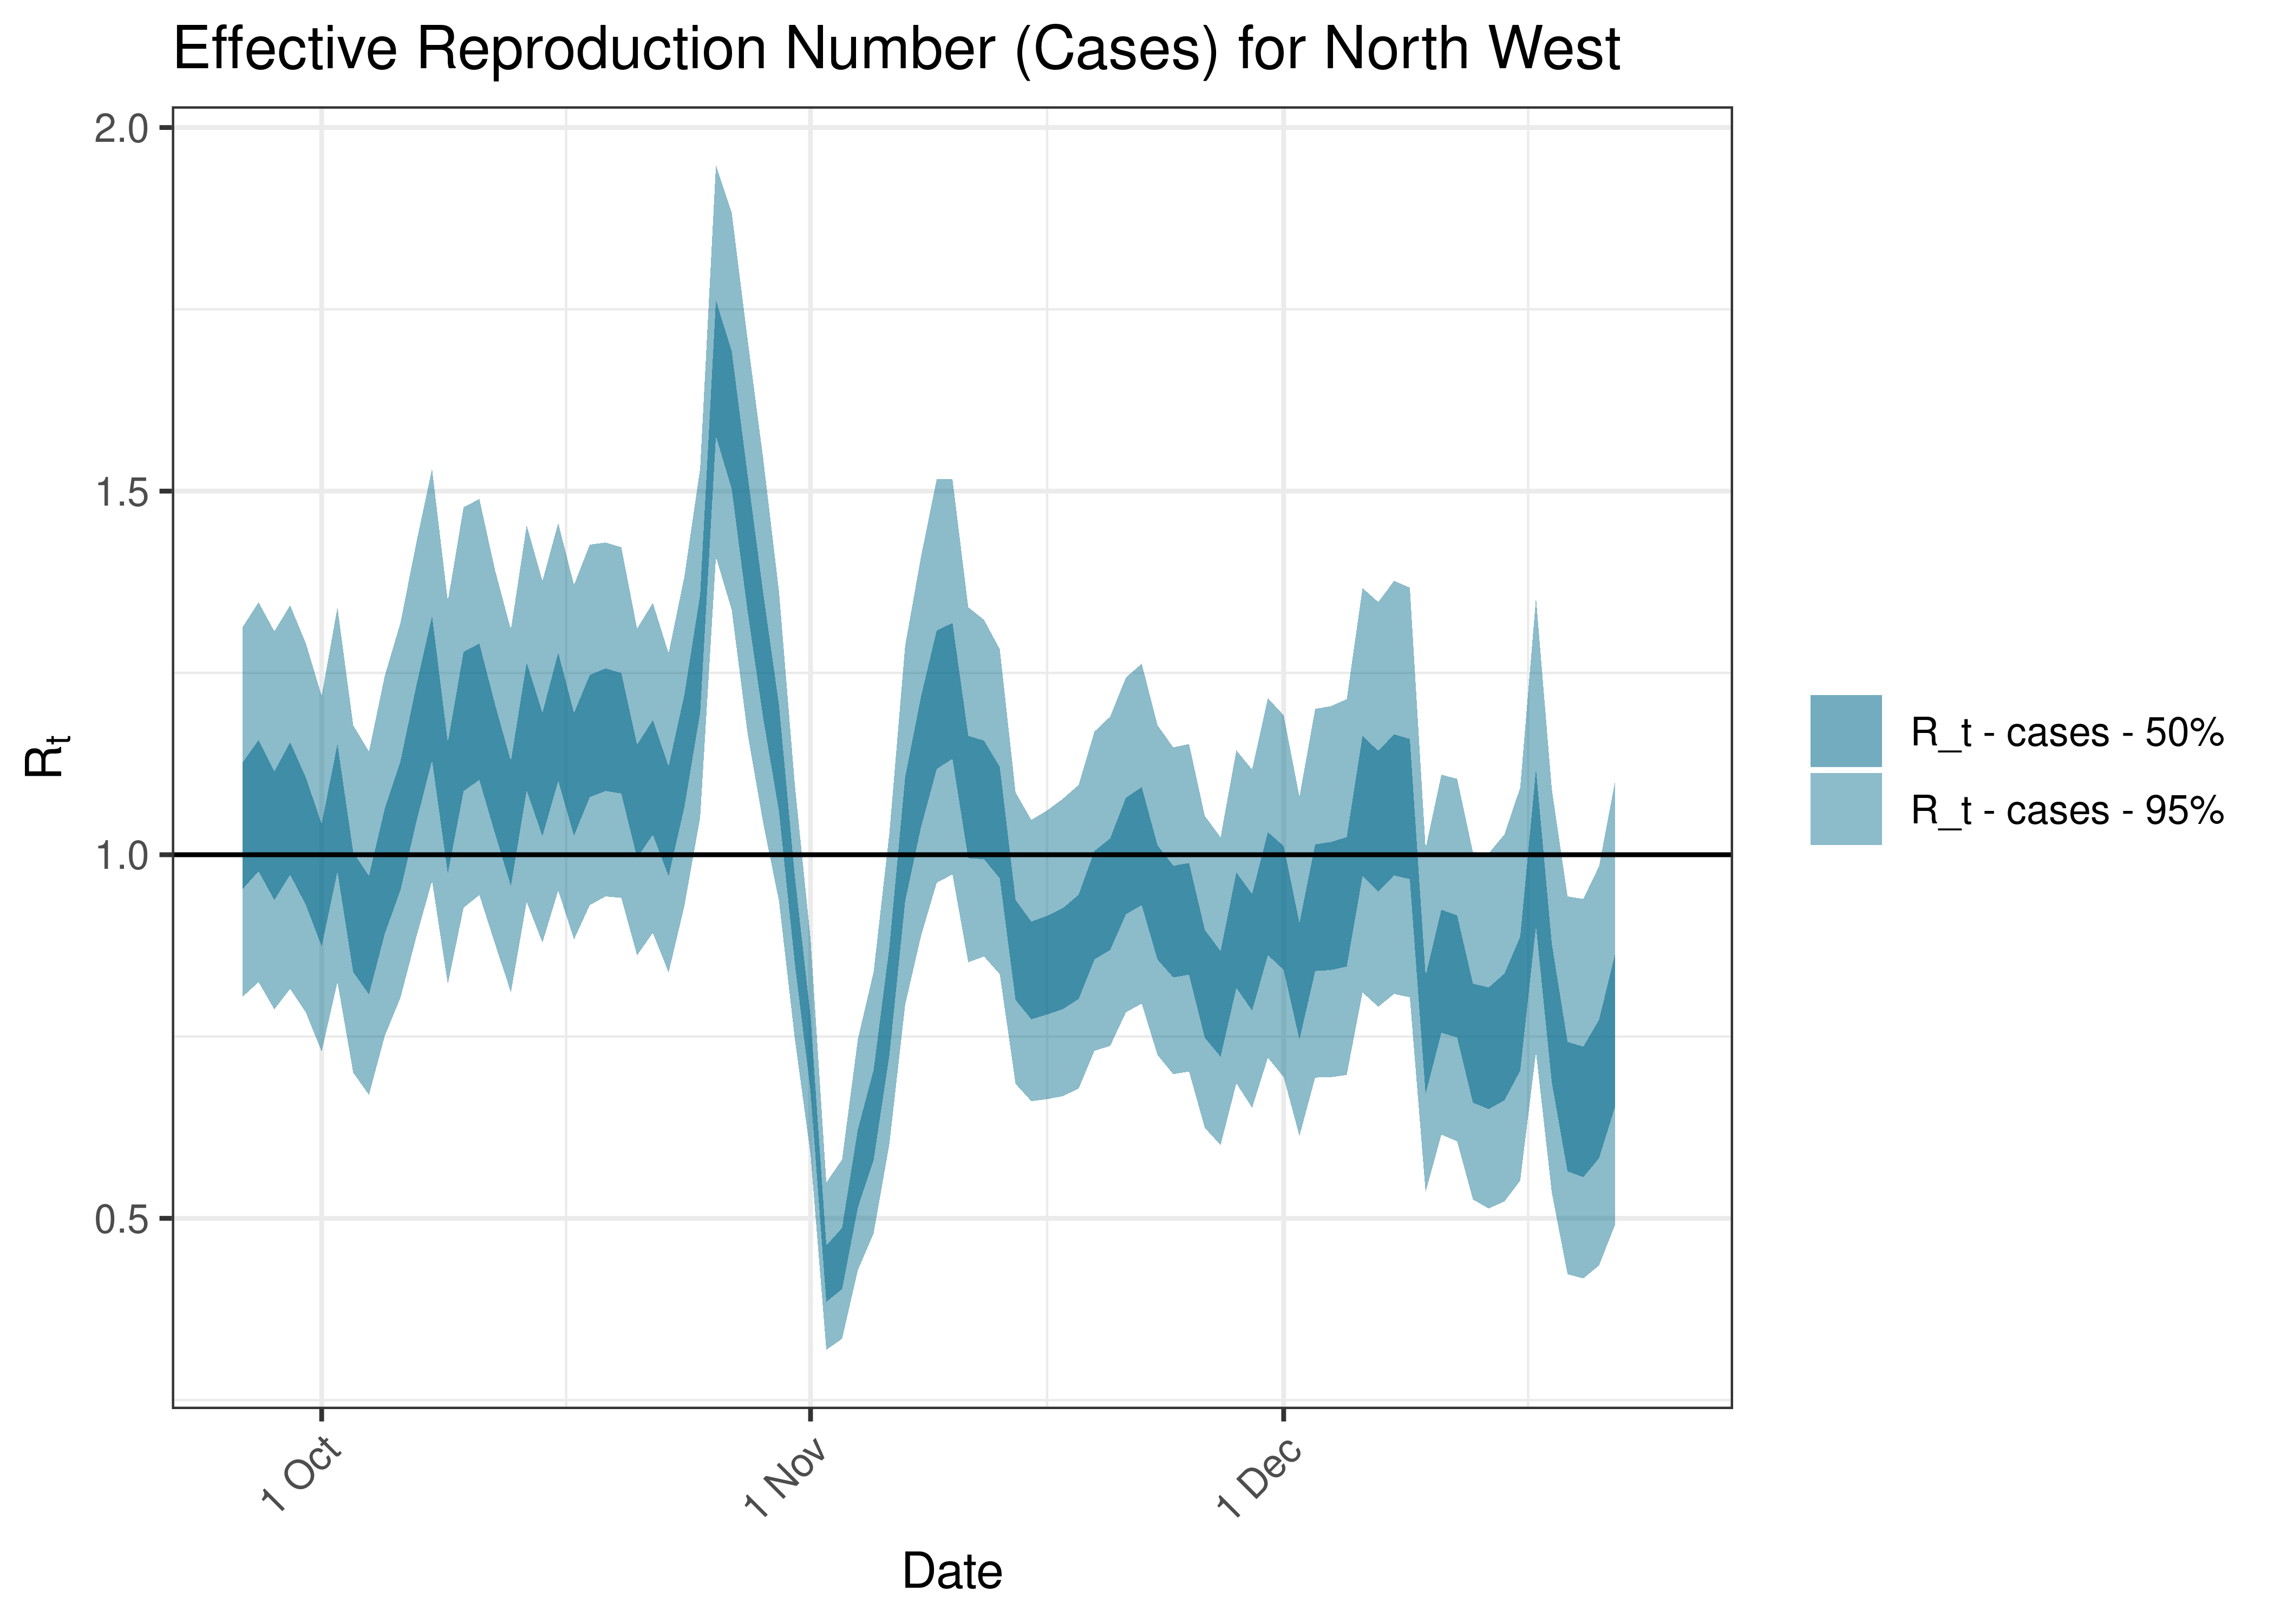
Estimated Effective Reproduction Number Based on Cases for North West over last 90 days
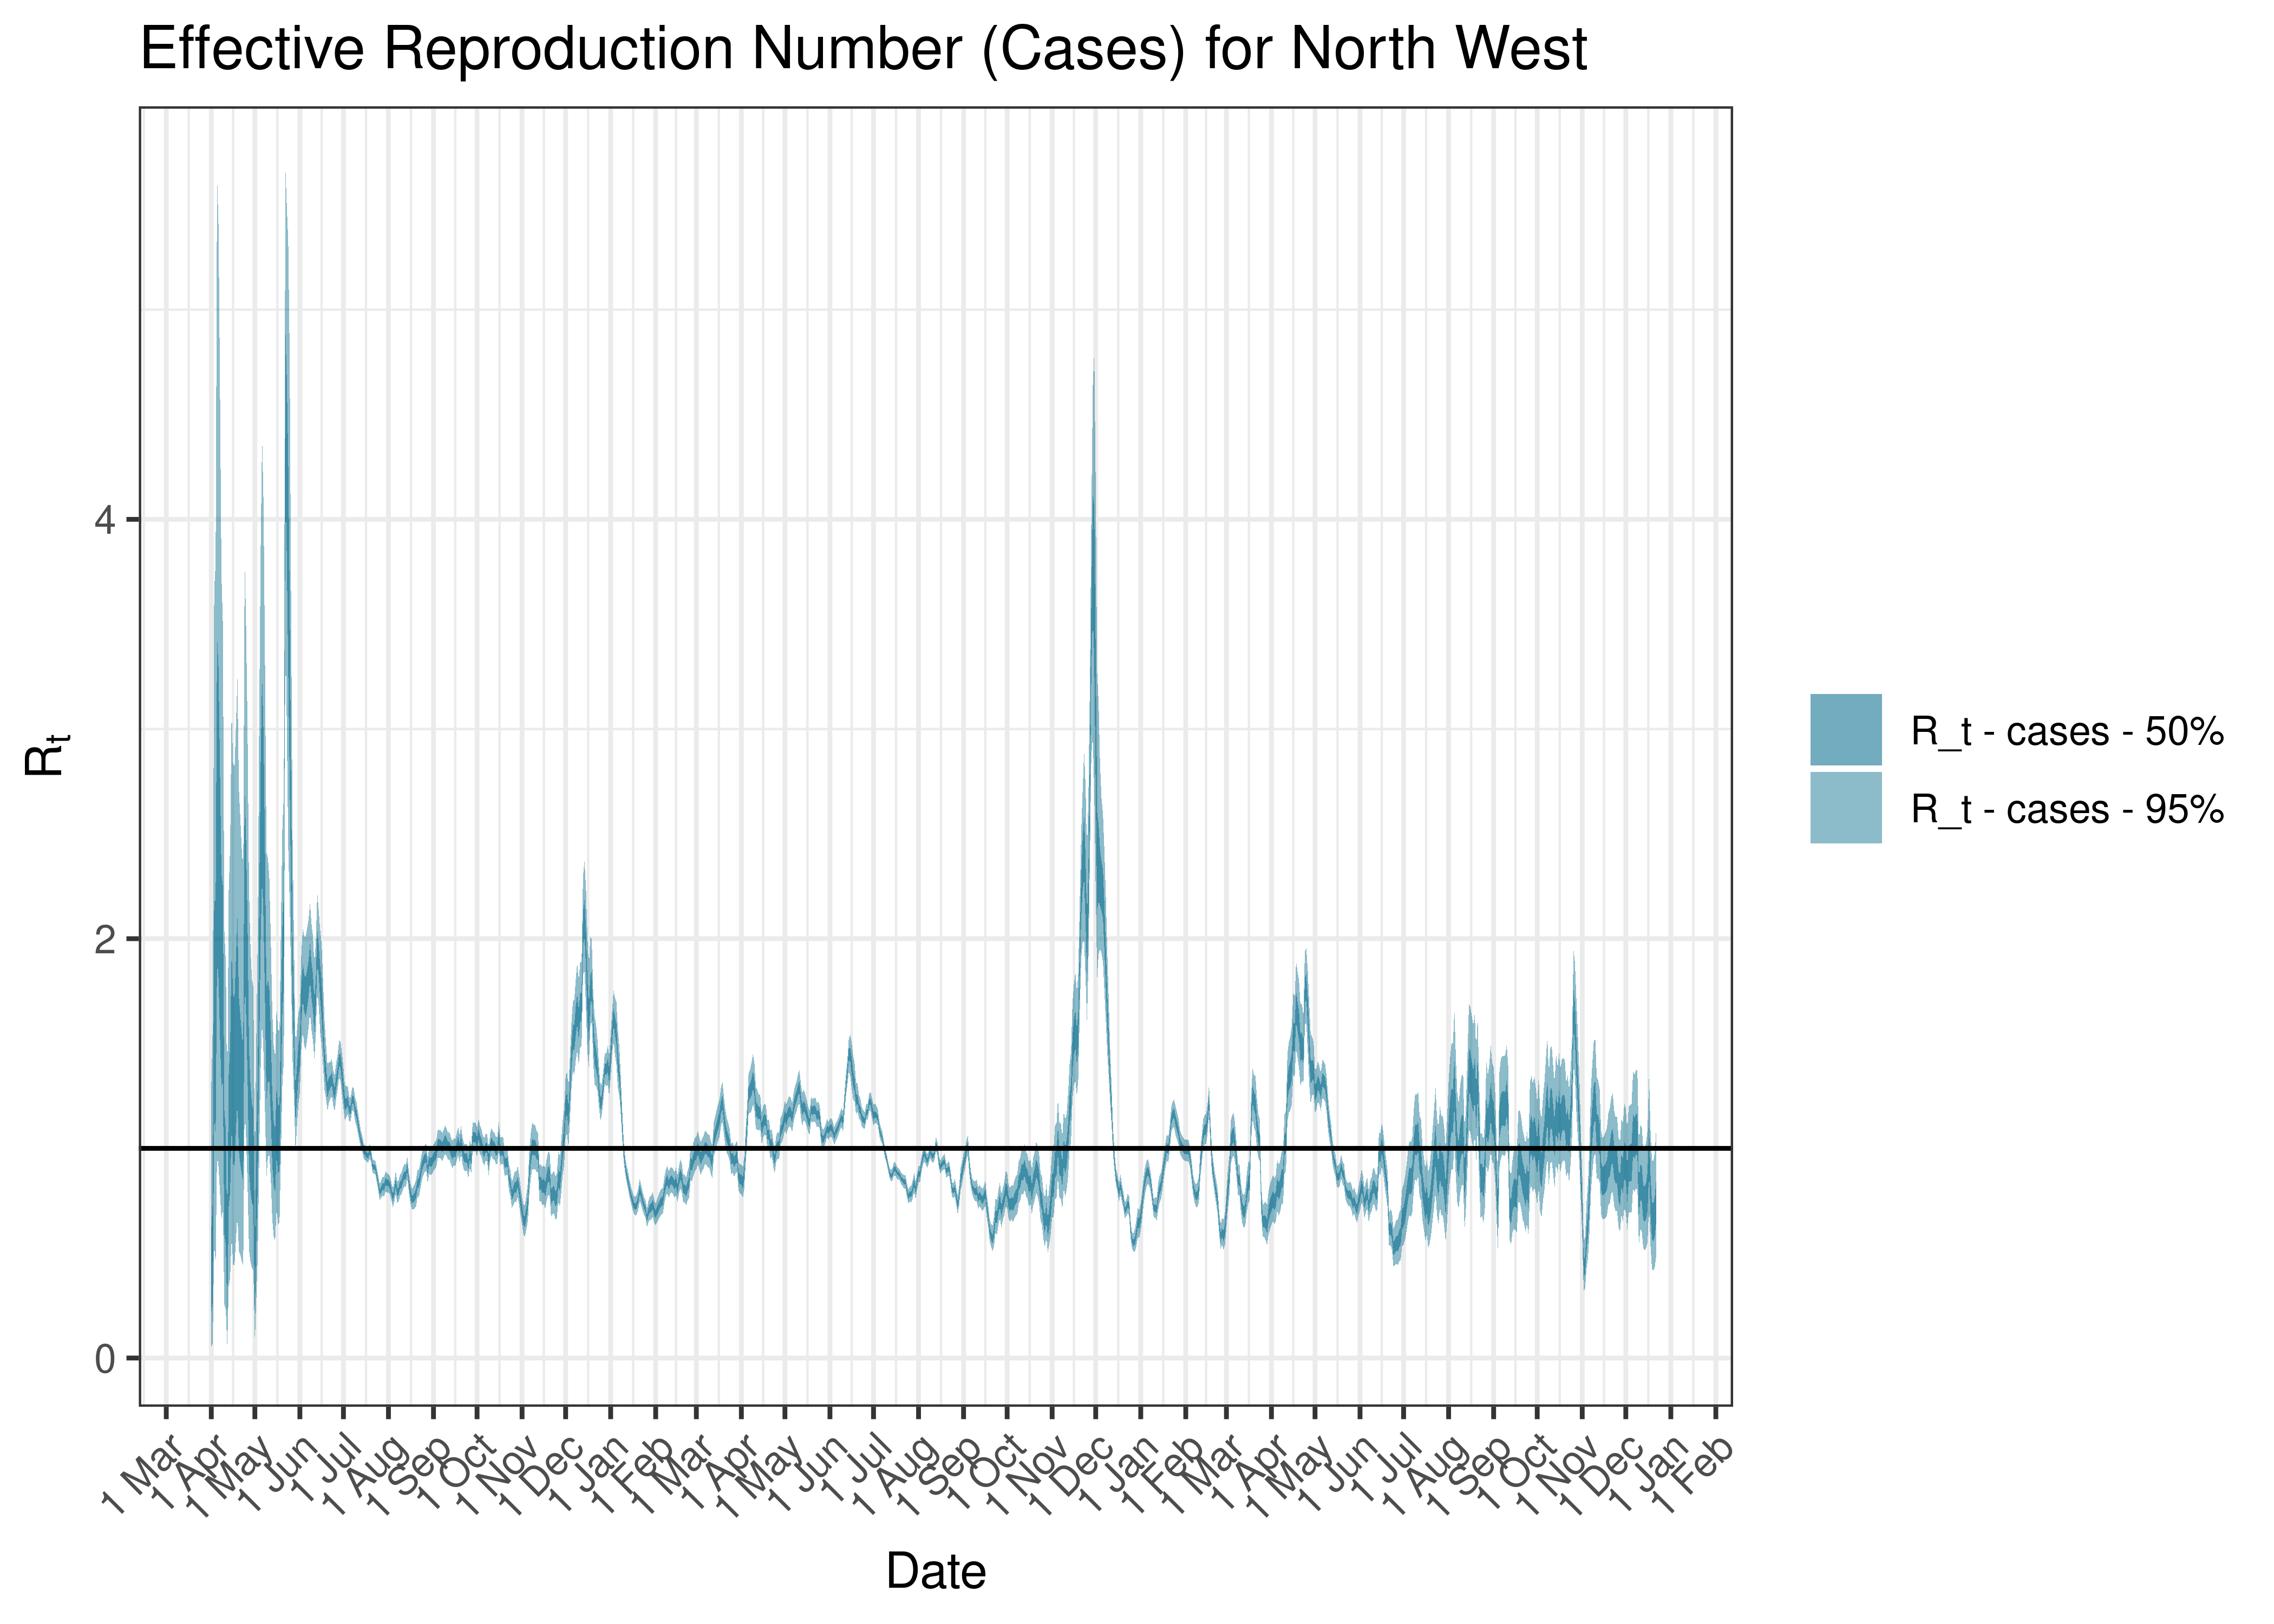
Estimated Effective Reproduction Number Based on Cases for North West since 1 April 2020
Estimated Effective Reproduction Number Based on Hospital Admissions for North West over last 90 days
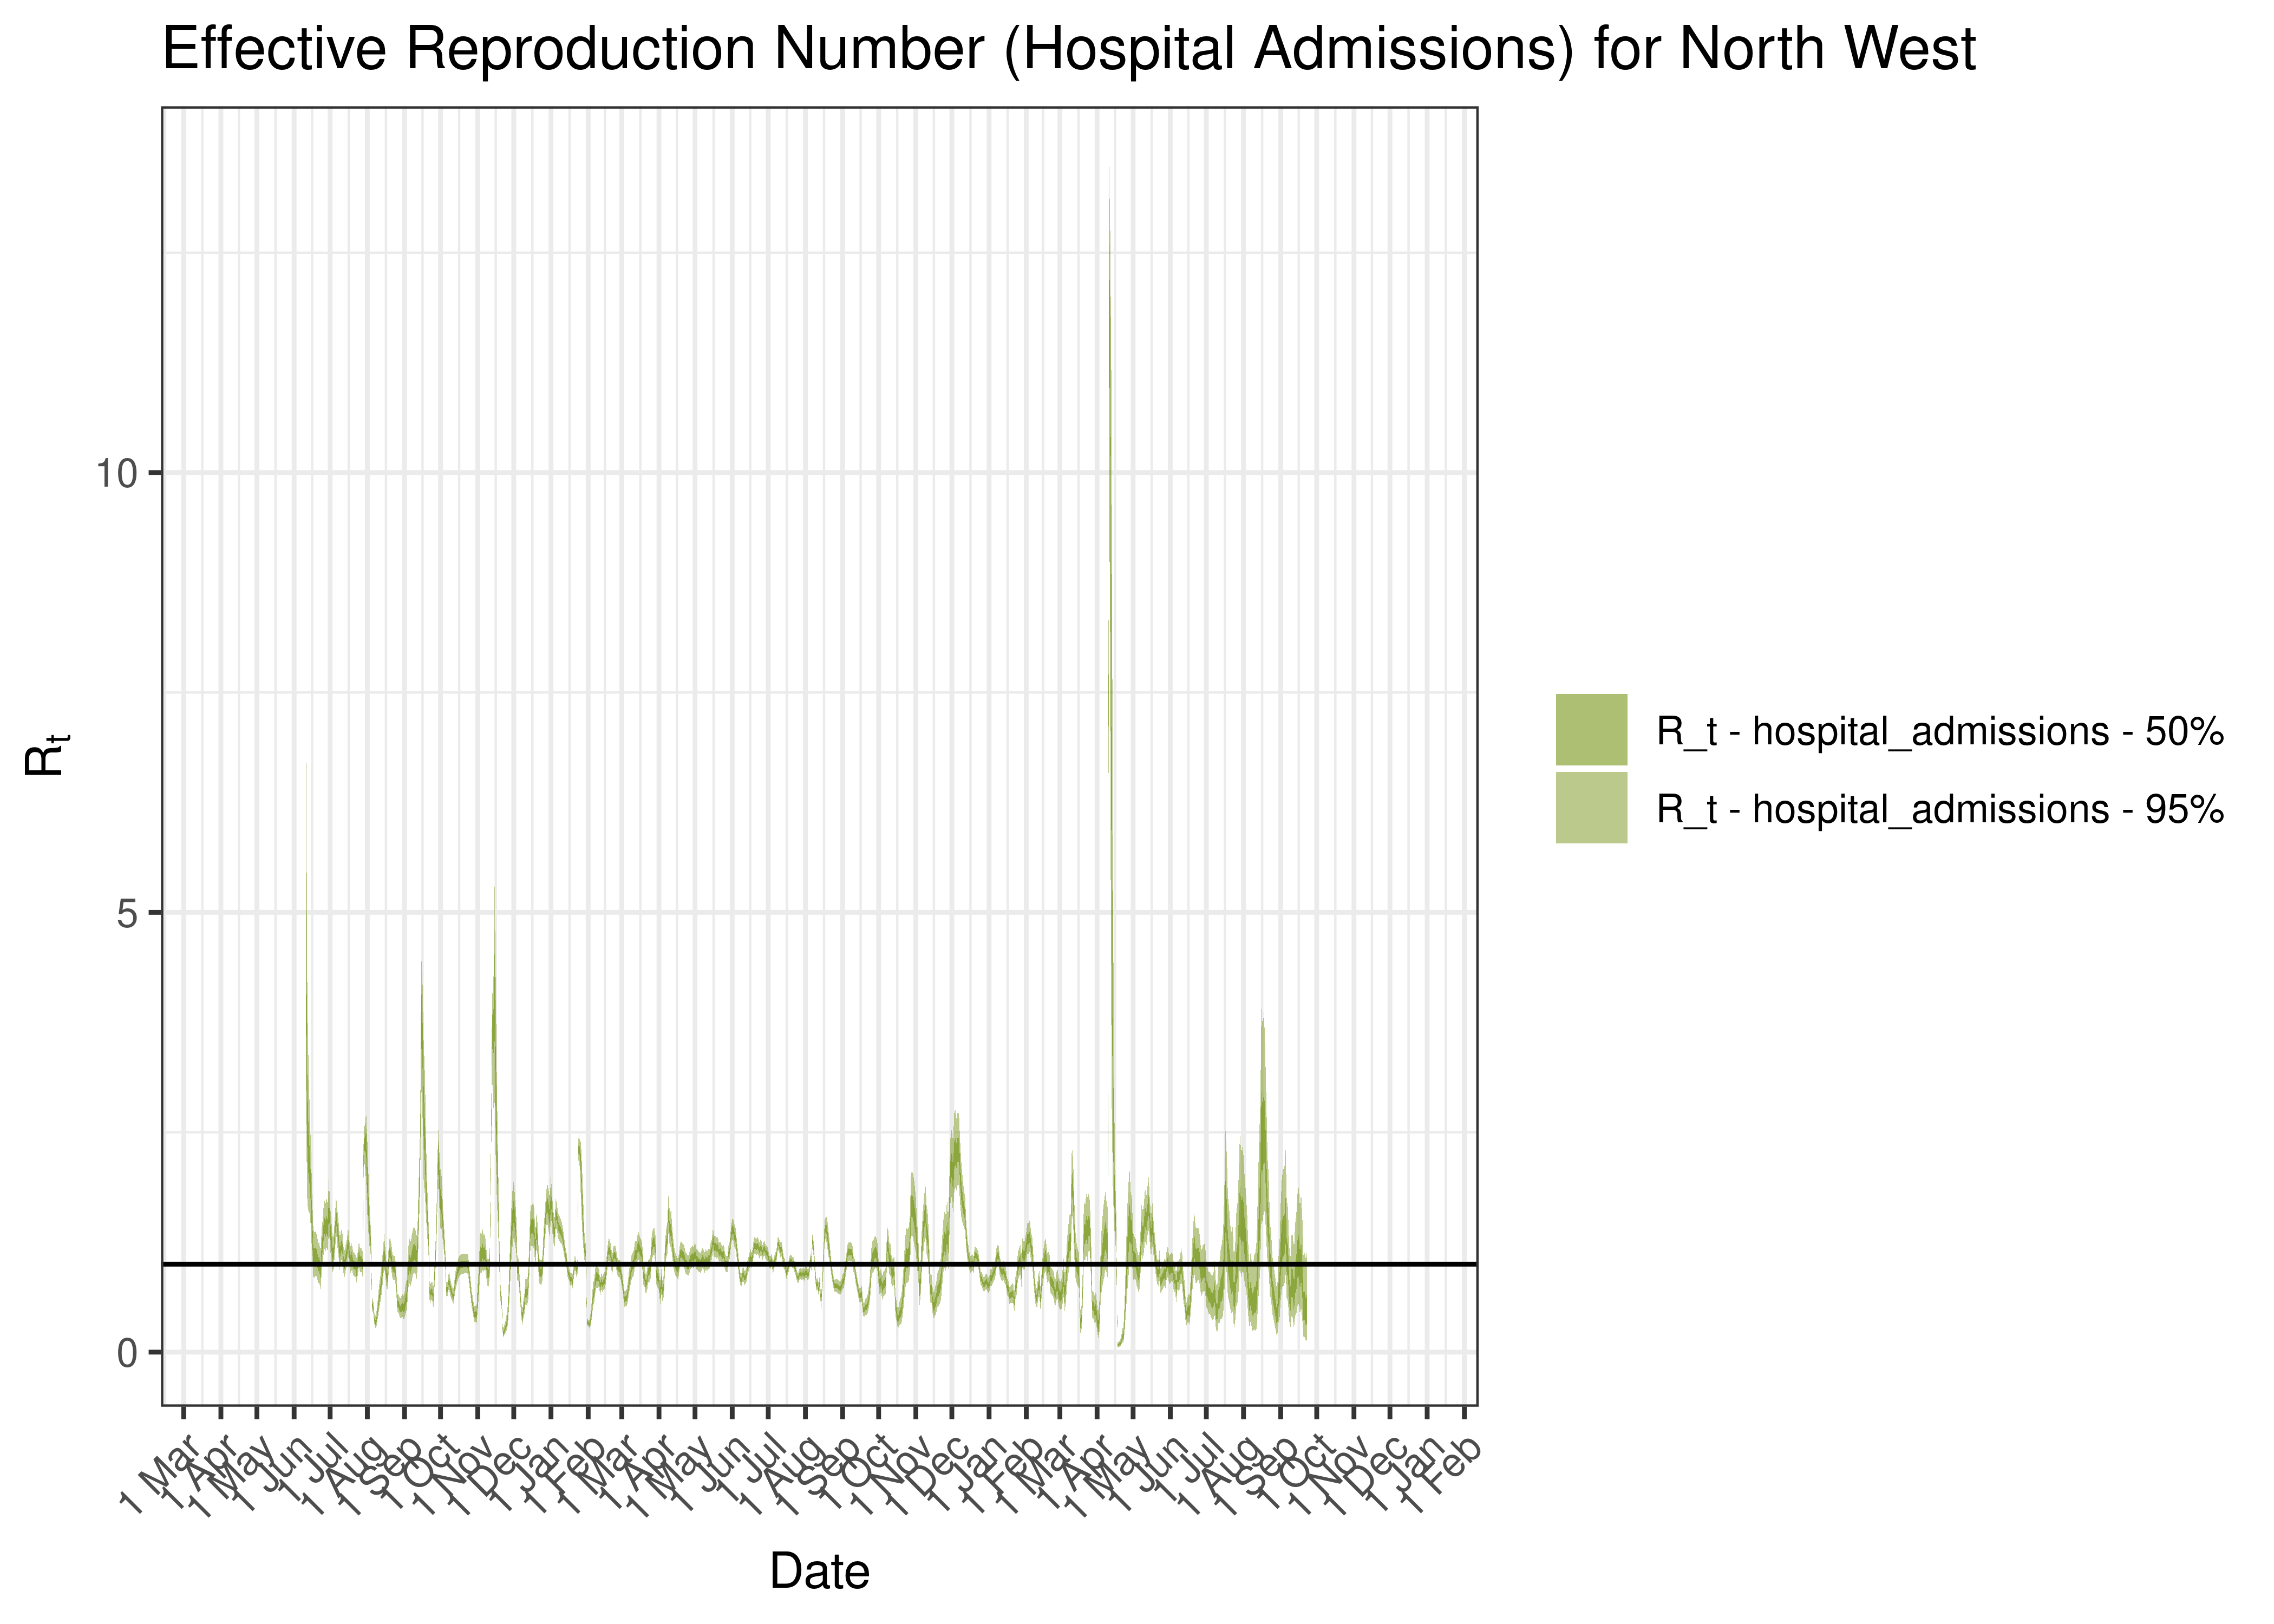
Estimated Effective Reproduction Number Based on Hospital Admissions for North West since 1 April 2020
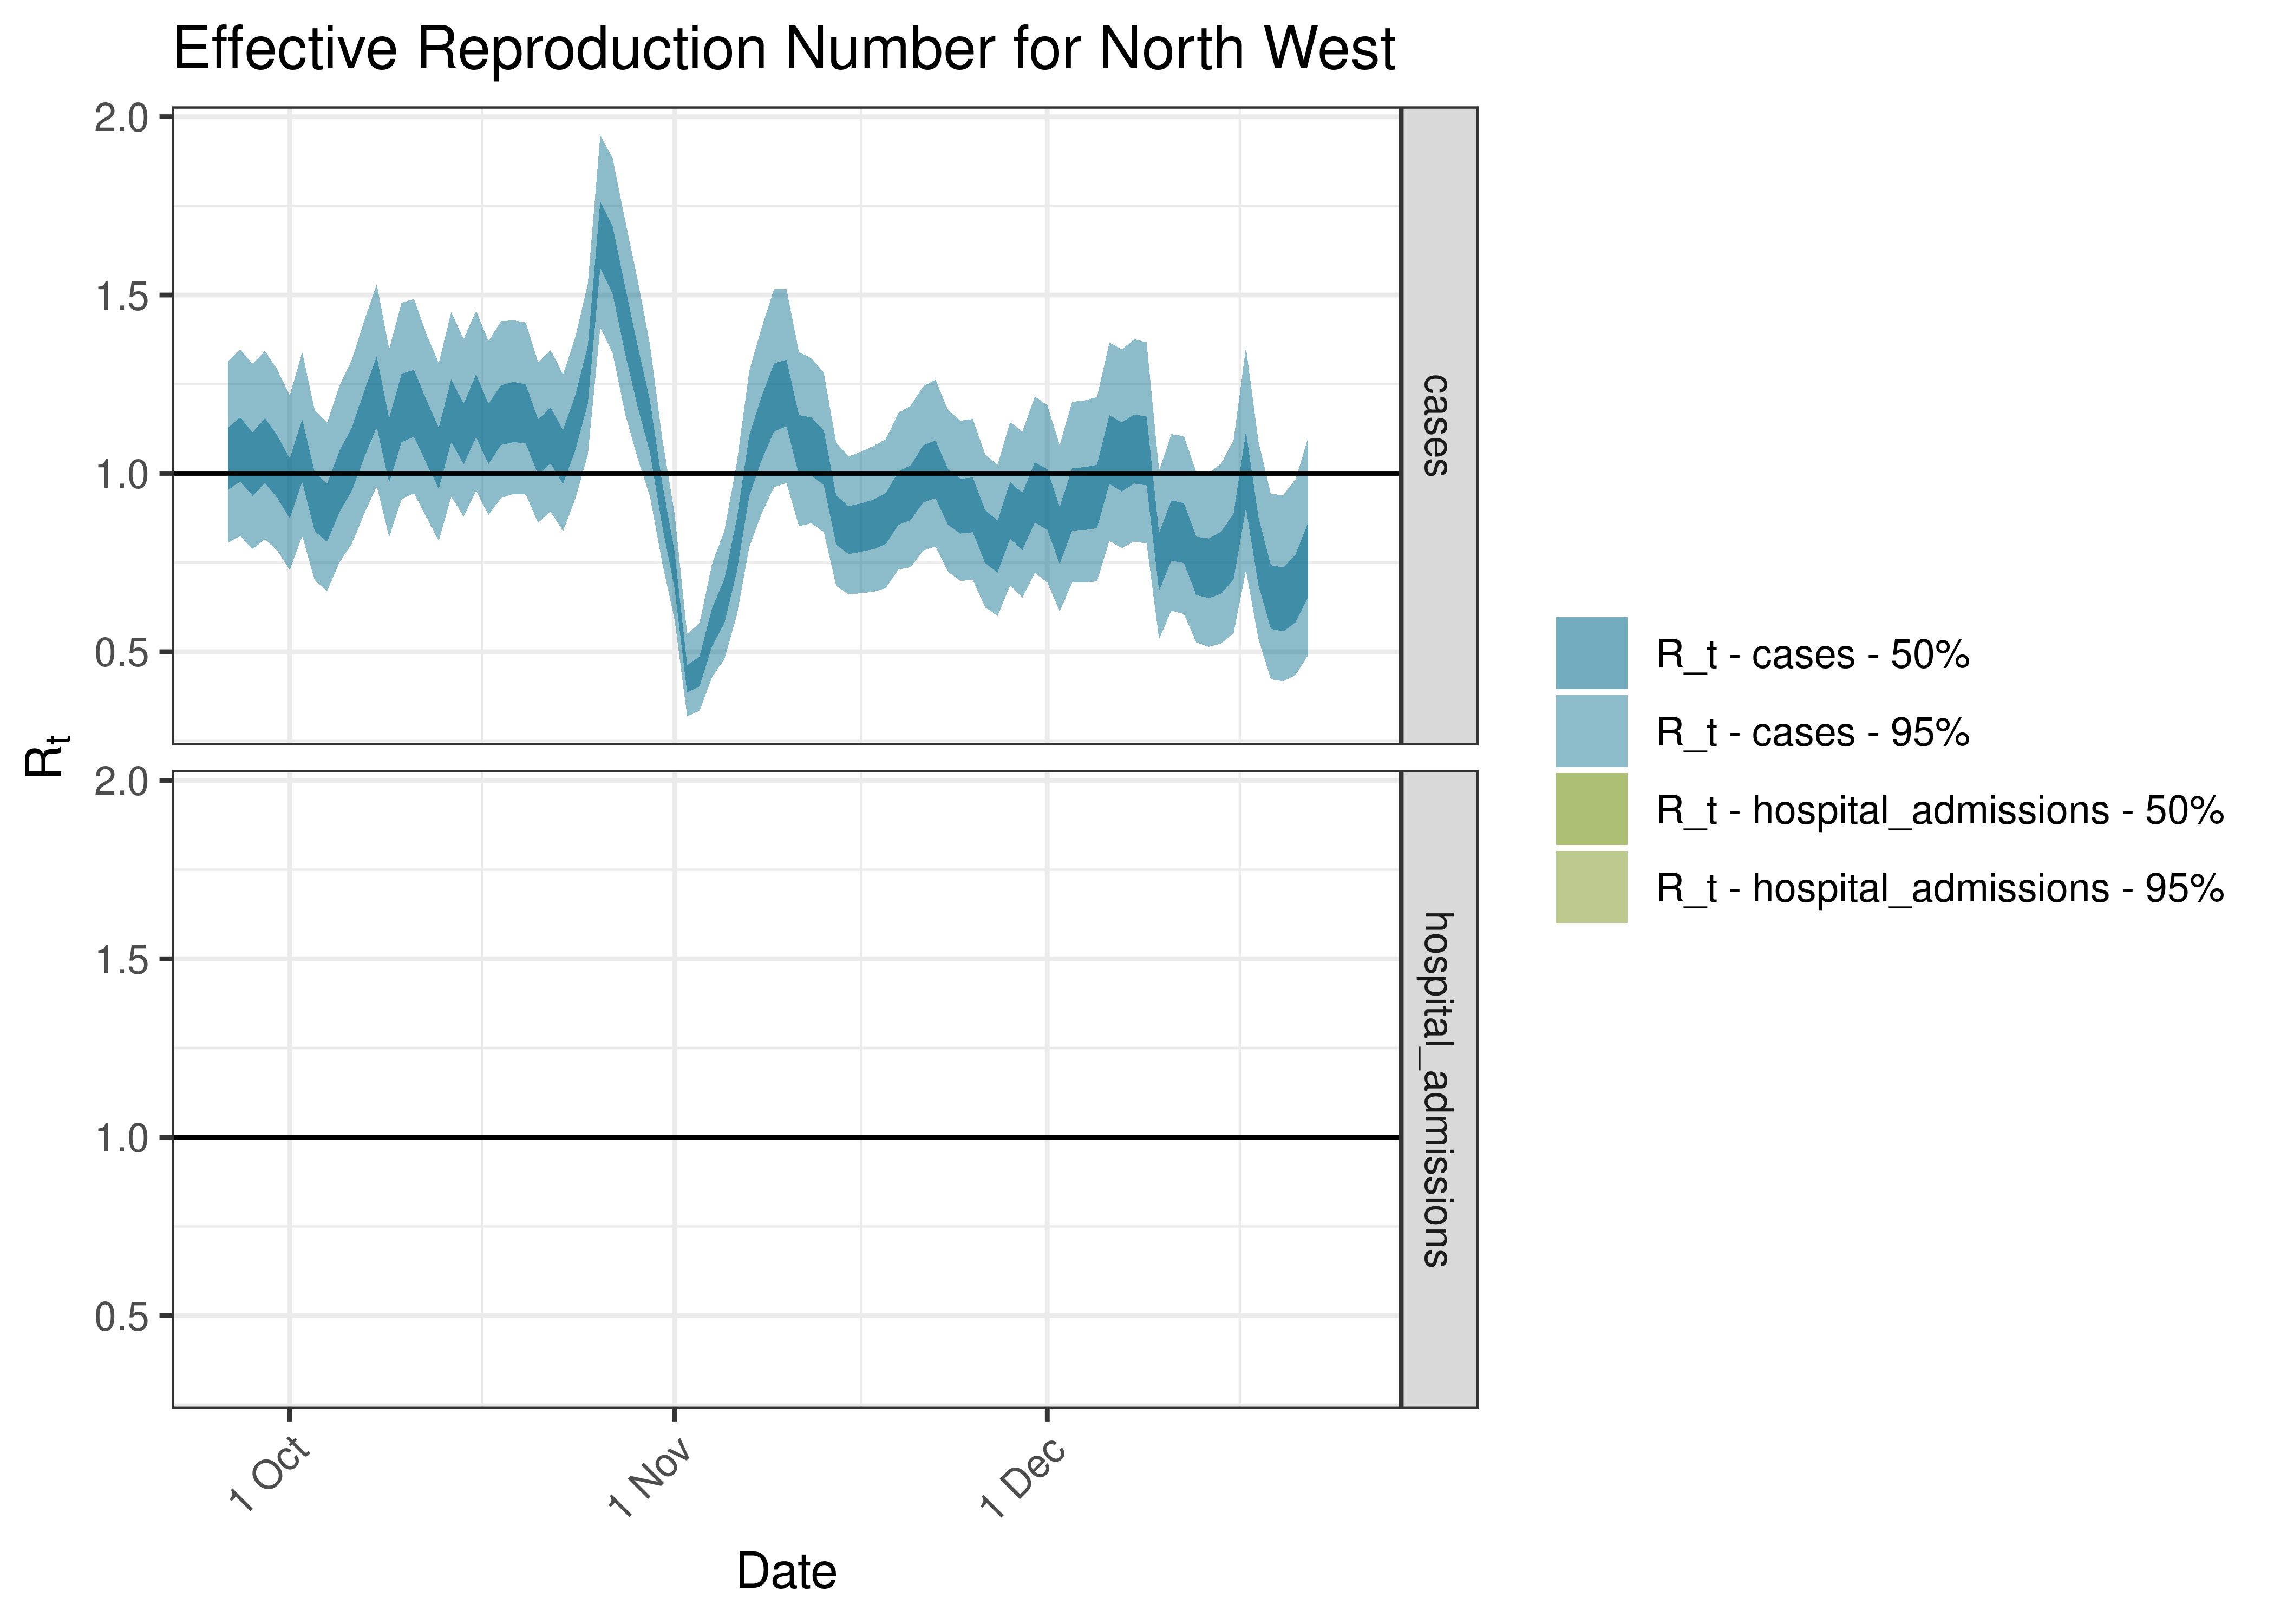
Estimated Effective Reproduction Number for North West over last 90 days
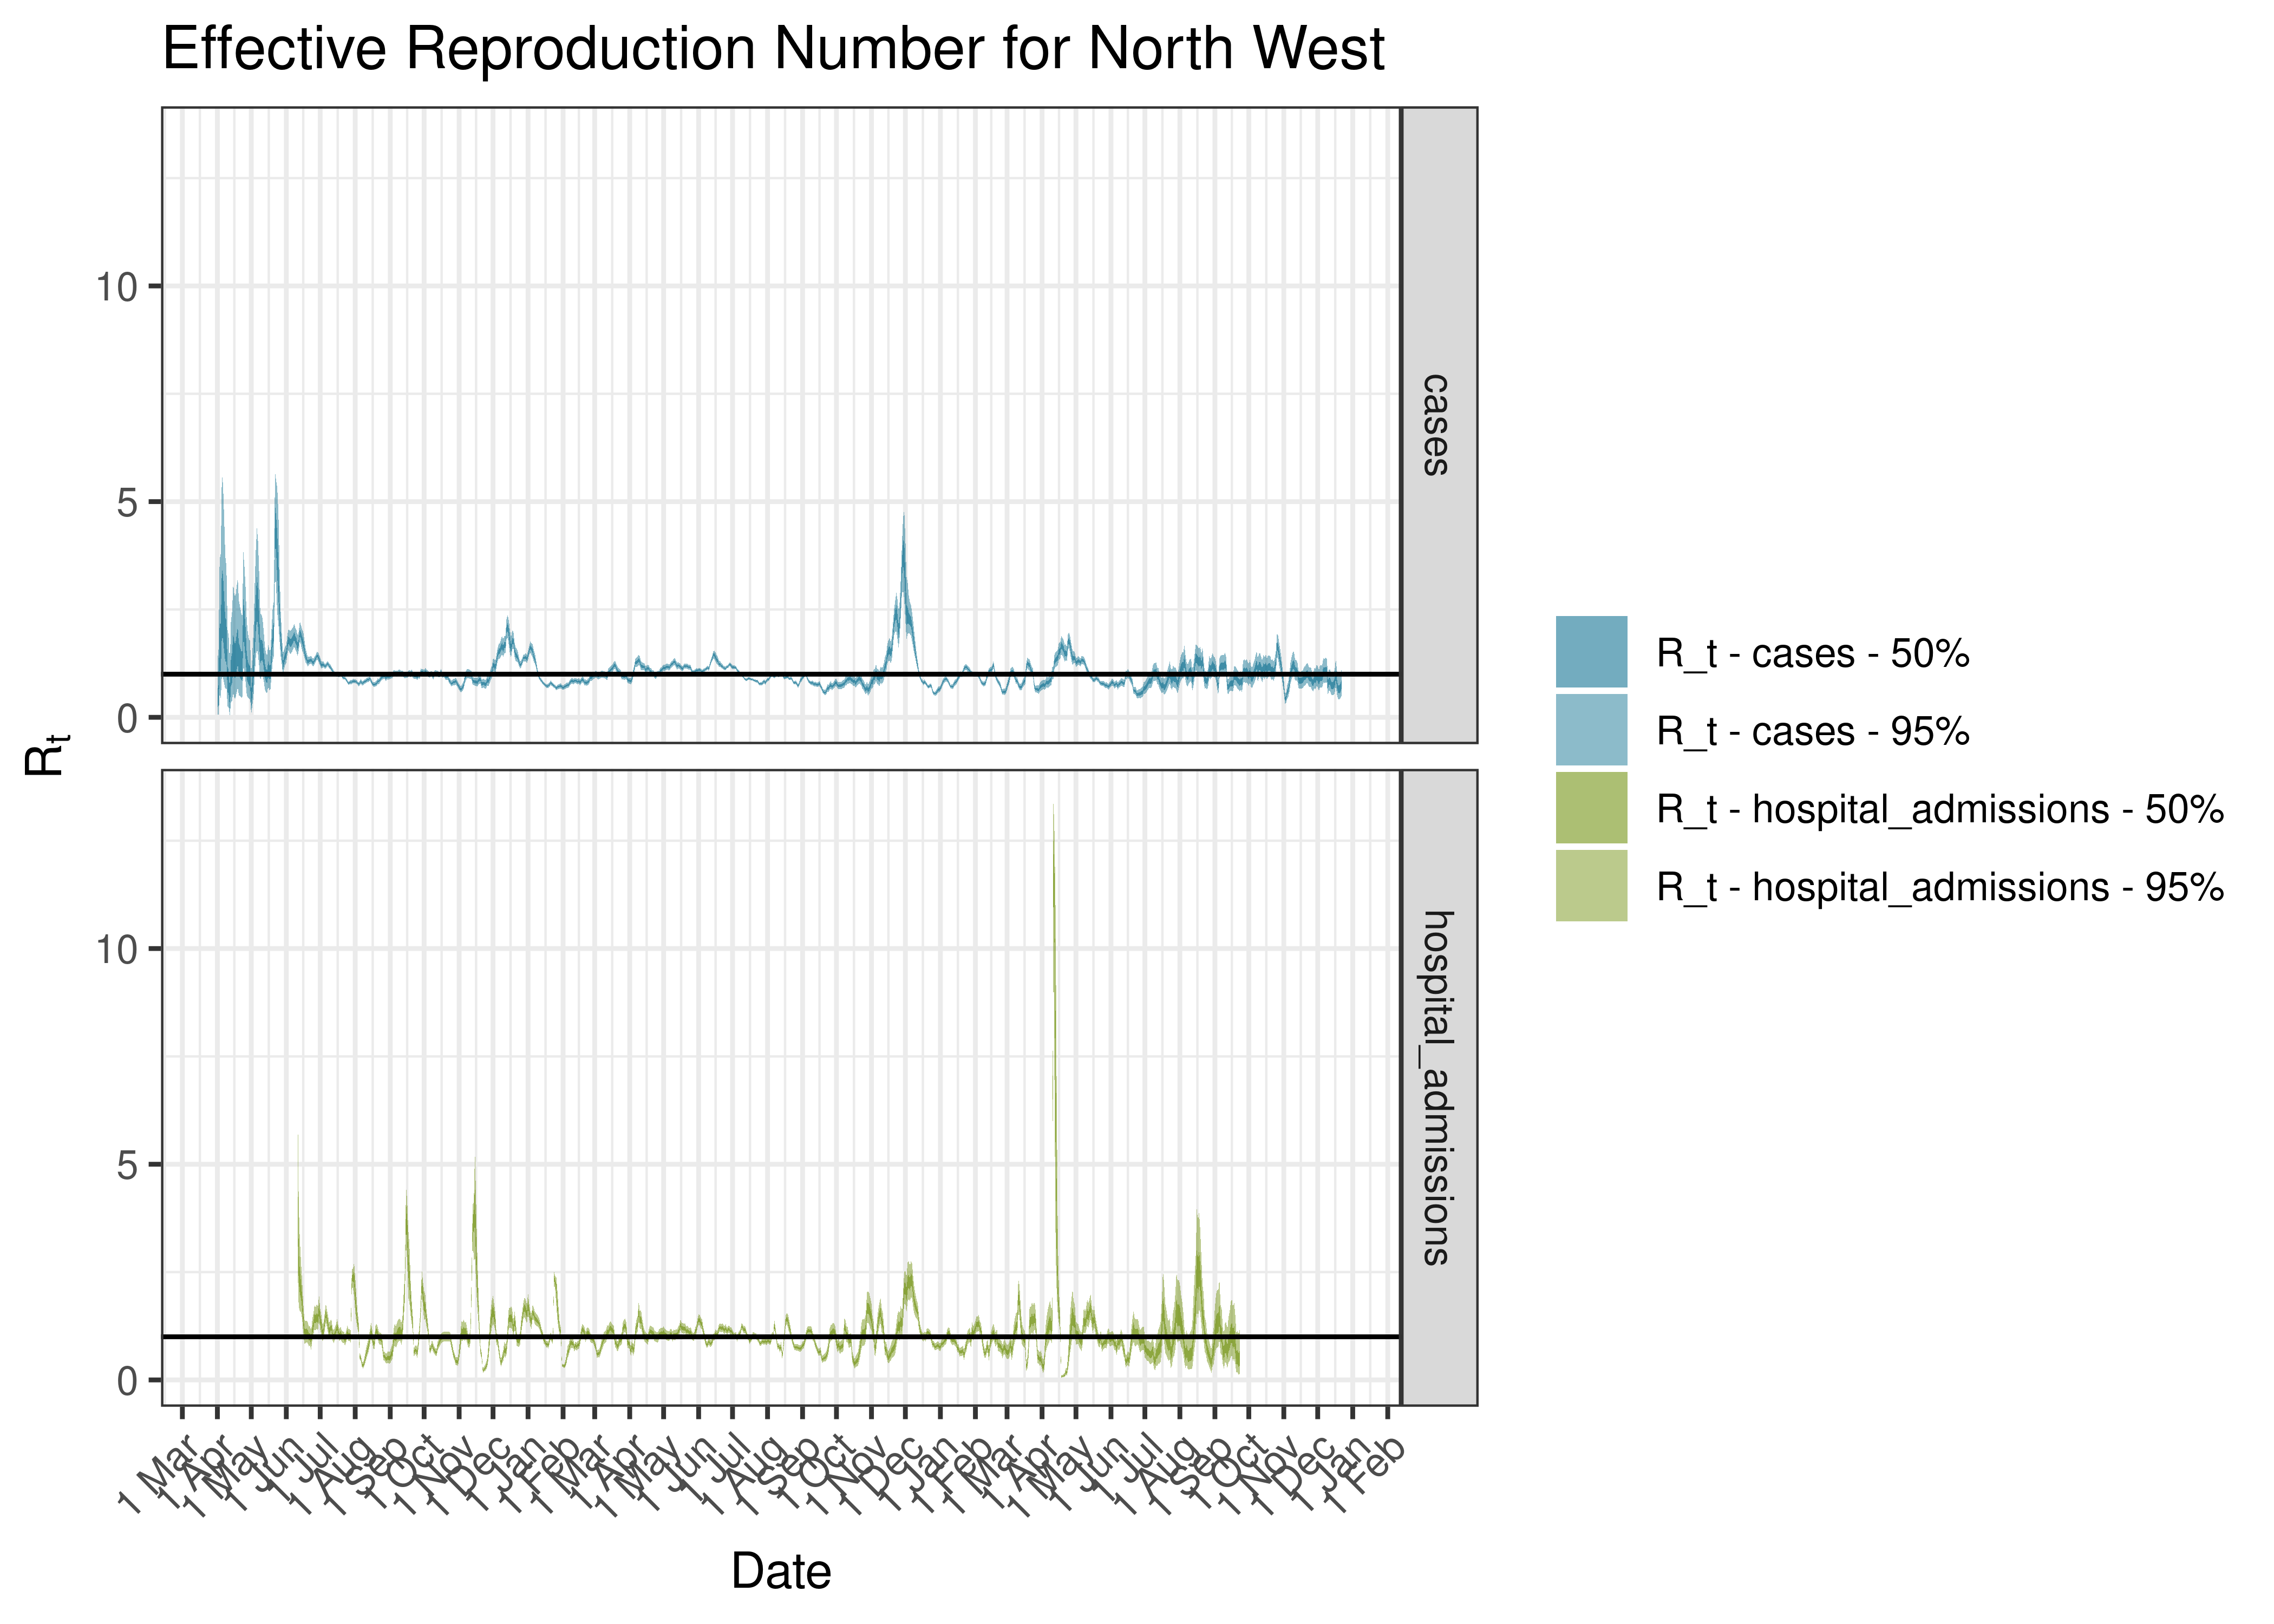
Estimated Effective Reproduction Number for North West since 1 April 2020
6.8.8 Bojanala Platinum
6.8.8.1 Cases
Cases are tabulated by specimen received date below. Cases include estimates for late reporting in recent days as well as adjustments for any public holidays. A centred 7-day moving average is also shown. The peak daily cases in previous waves (as measured by the moving average) is also shown.
| Specimen Received Date | Cases | 7-day Moving Average | Comment |
|---|---|---|---|
| 2020-07-08 | 377 | 341 | Wave 1 Peak |
| 2021-01-07 | 523 | 520 | Wave 2 Peak |
| 2021-07-04 | 369 | 905 | Wave 3 Peak |
| 2021-12-10 | 828 | 762 | Wave 4 Peak |
| 2022-05-09 | 135 | 91 | Wave 5 Peak (to date) |
Below a 7-day moving average daily case count are plotted for Bojanala Platinum on a log scale since start of the epidemic:
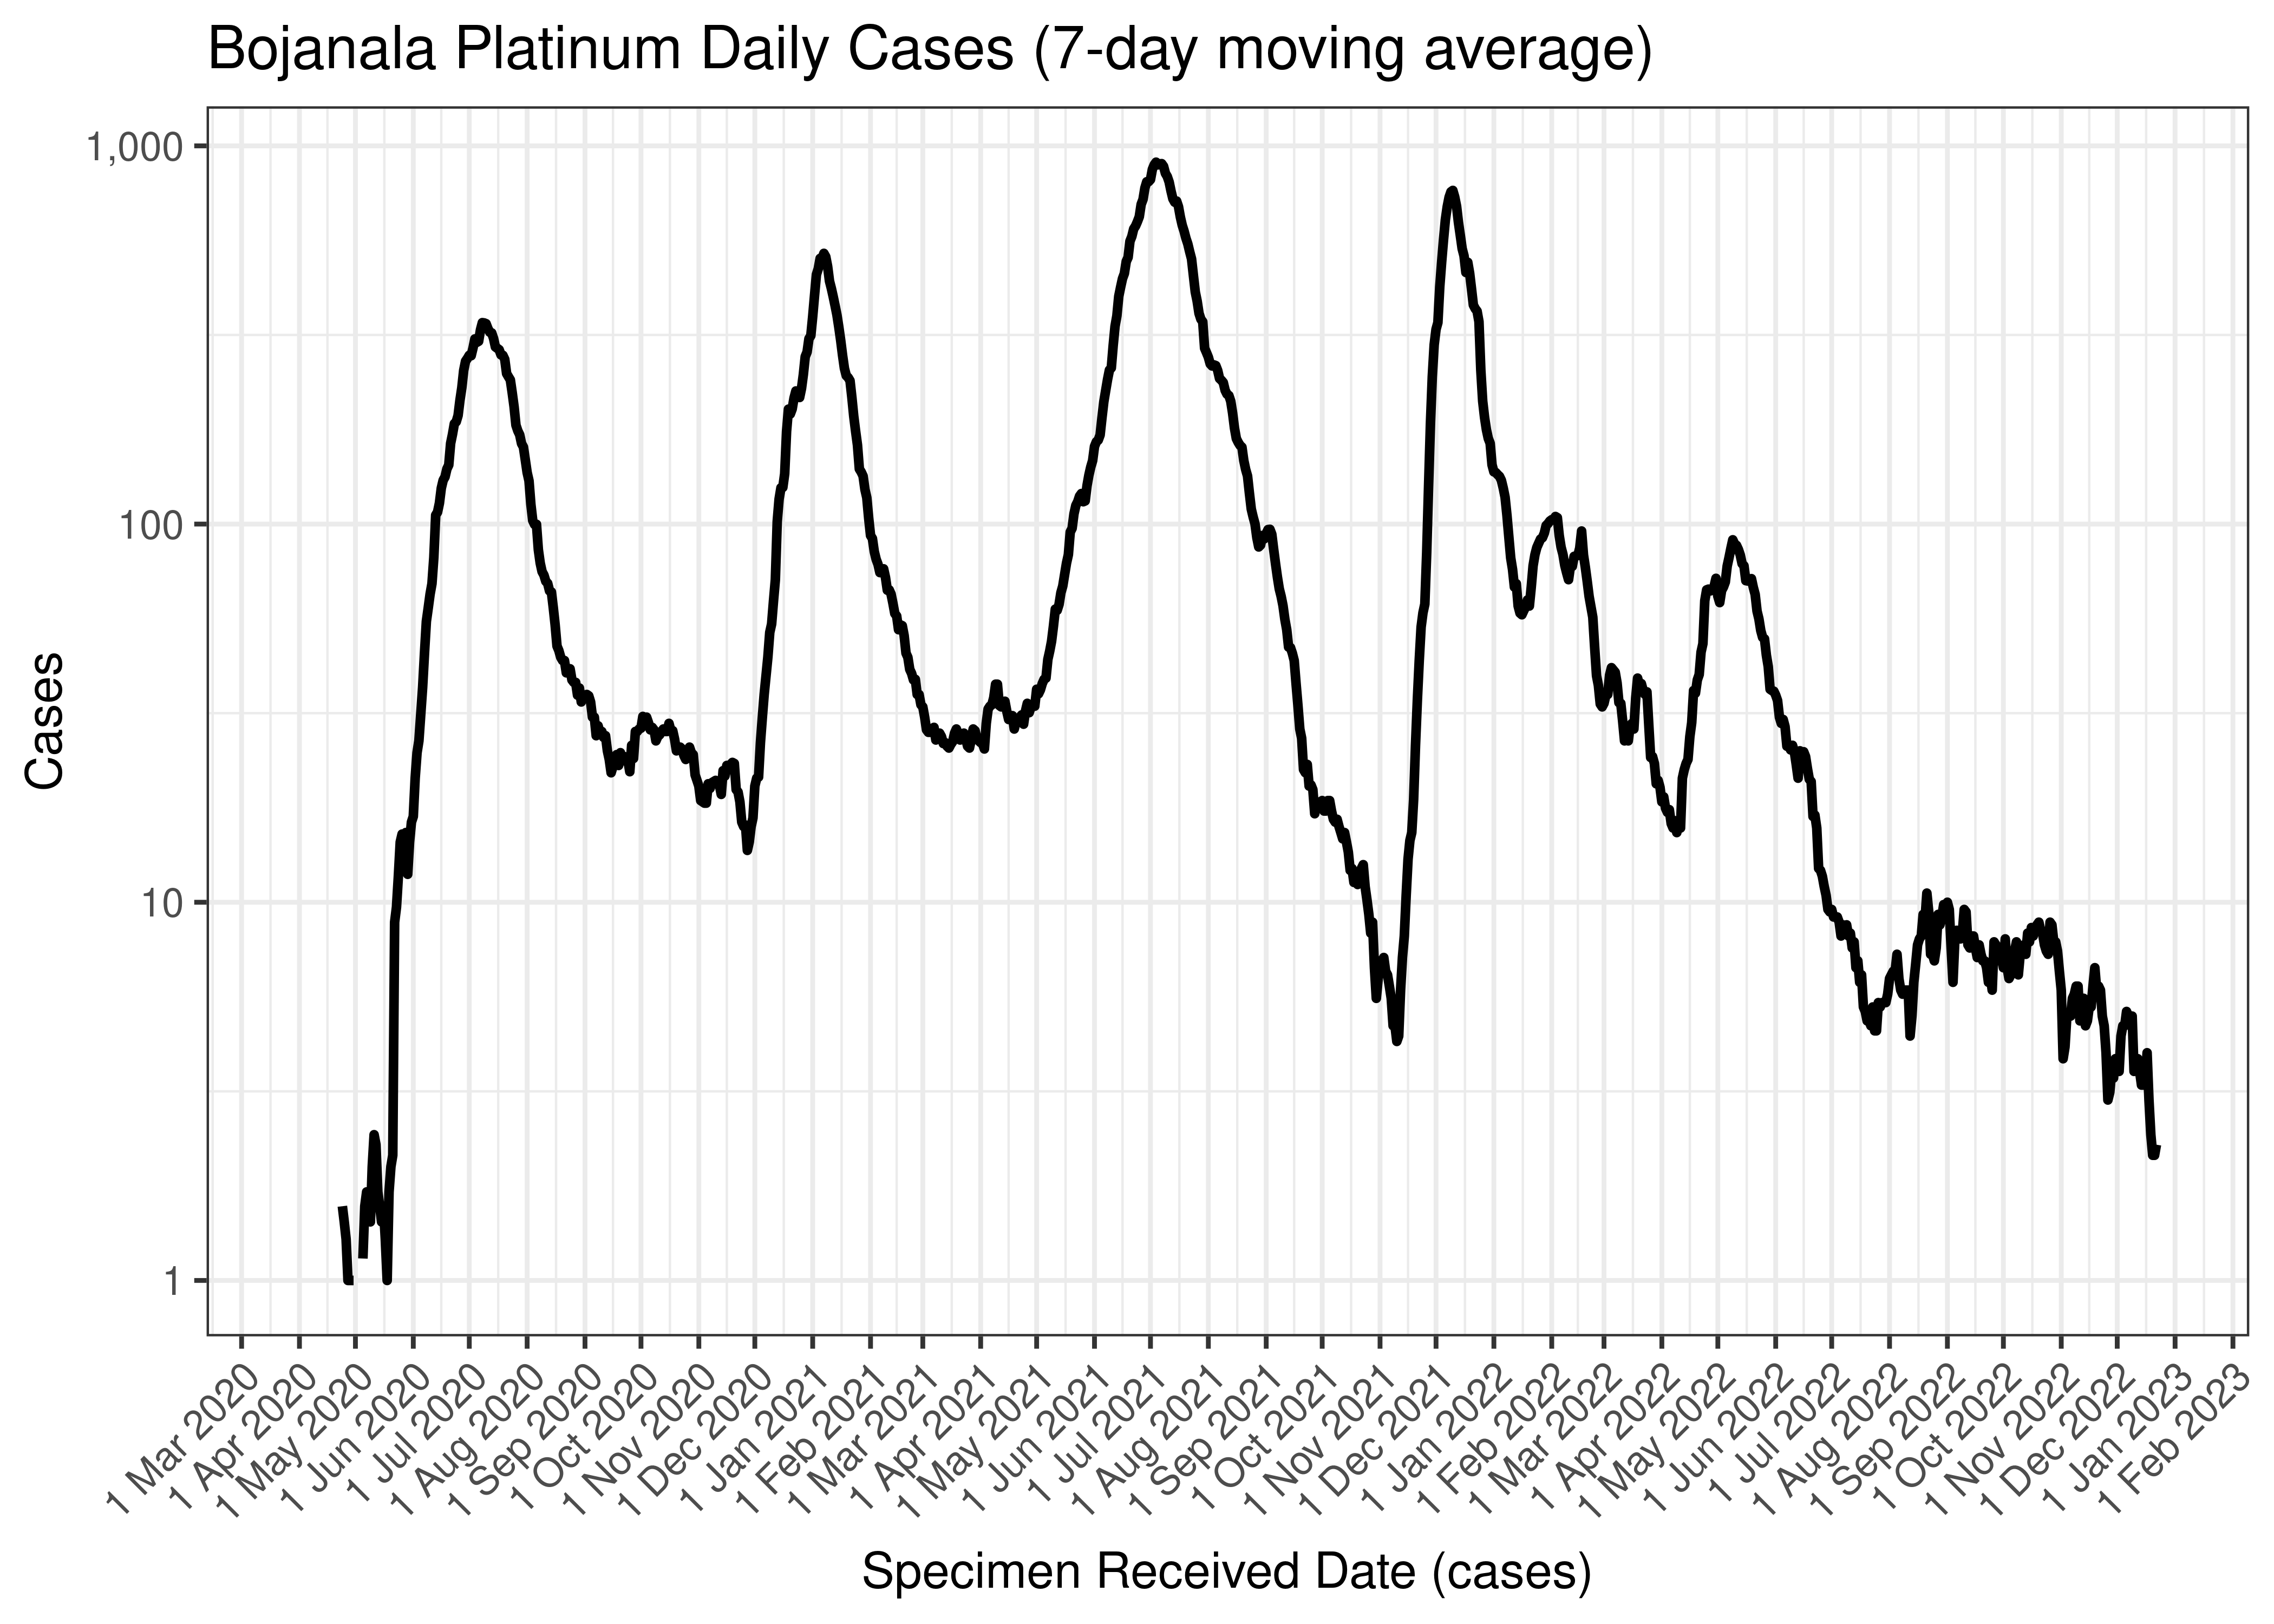
Bojanala Platinum Daily Cases (7-day moving average)
Below the above chart is repeated for the last 30-days:
Bojanala Platinum Daily Cases for Last 30-days (7-day moving average)
6.8.8.2 Reproduction Number
Below current (last weekly) reproduction number estimates are tabulated for Bojanala Platinum.
| Count (Per Day) | Week Ending | Reproduction Number [95% Confidence Interval] | |
|---|---|---|---|
| Bojanala Platinum | 2.3 | 2022-12-25 | 0.76 [0.44 - 1.17] |
Below the effective reproduction number for Bojanala Platinum over the last 90 days are plotted together with a plot since start of the pandemic.
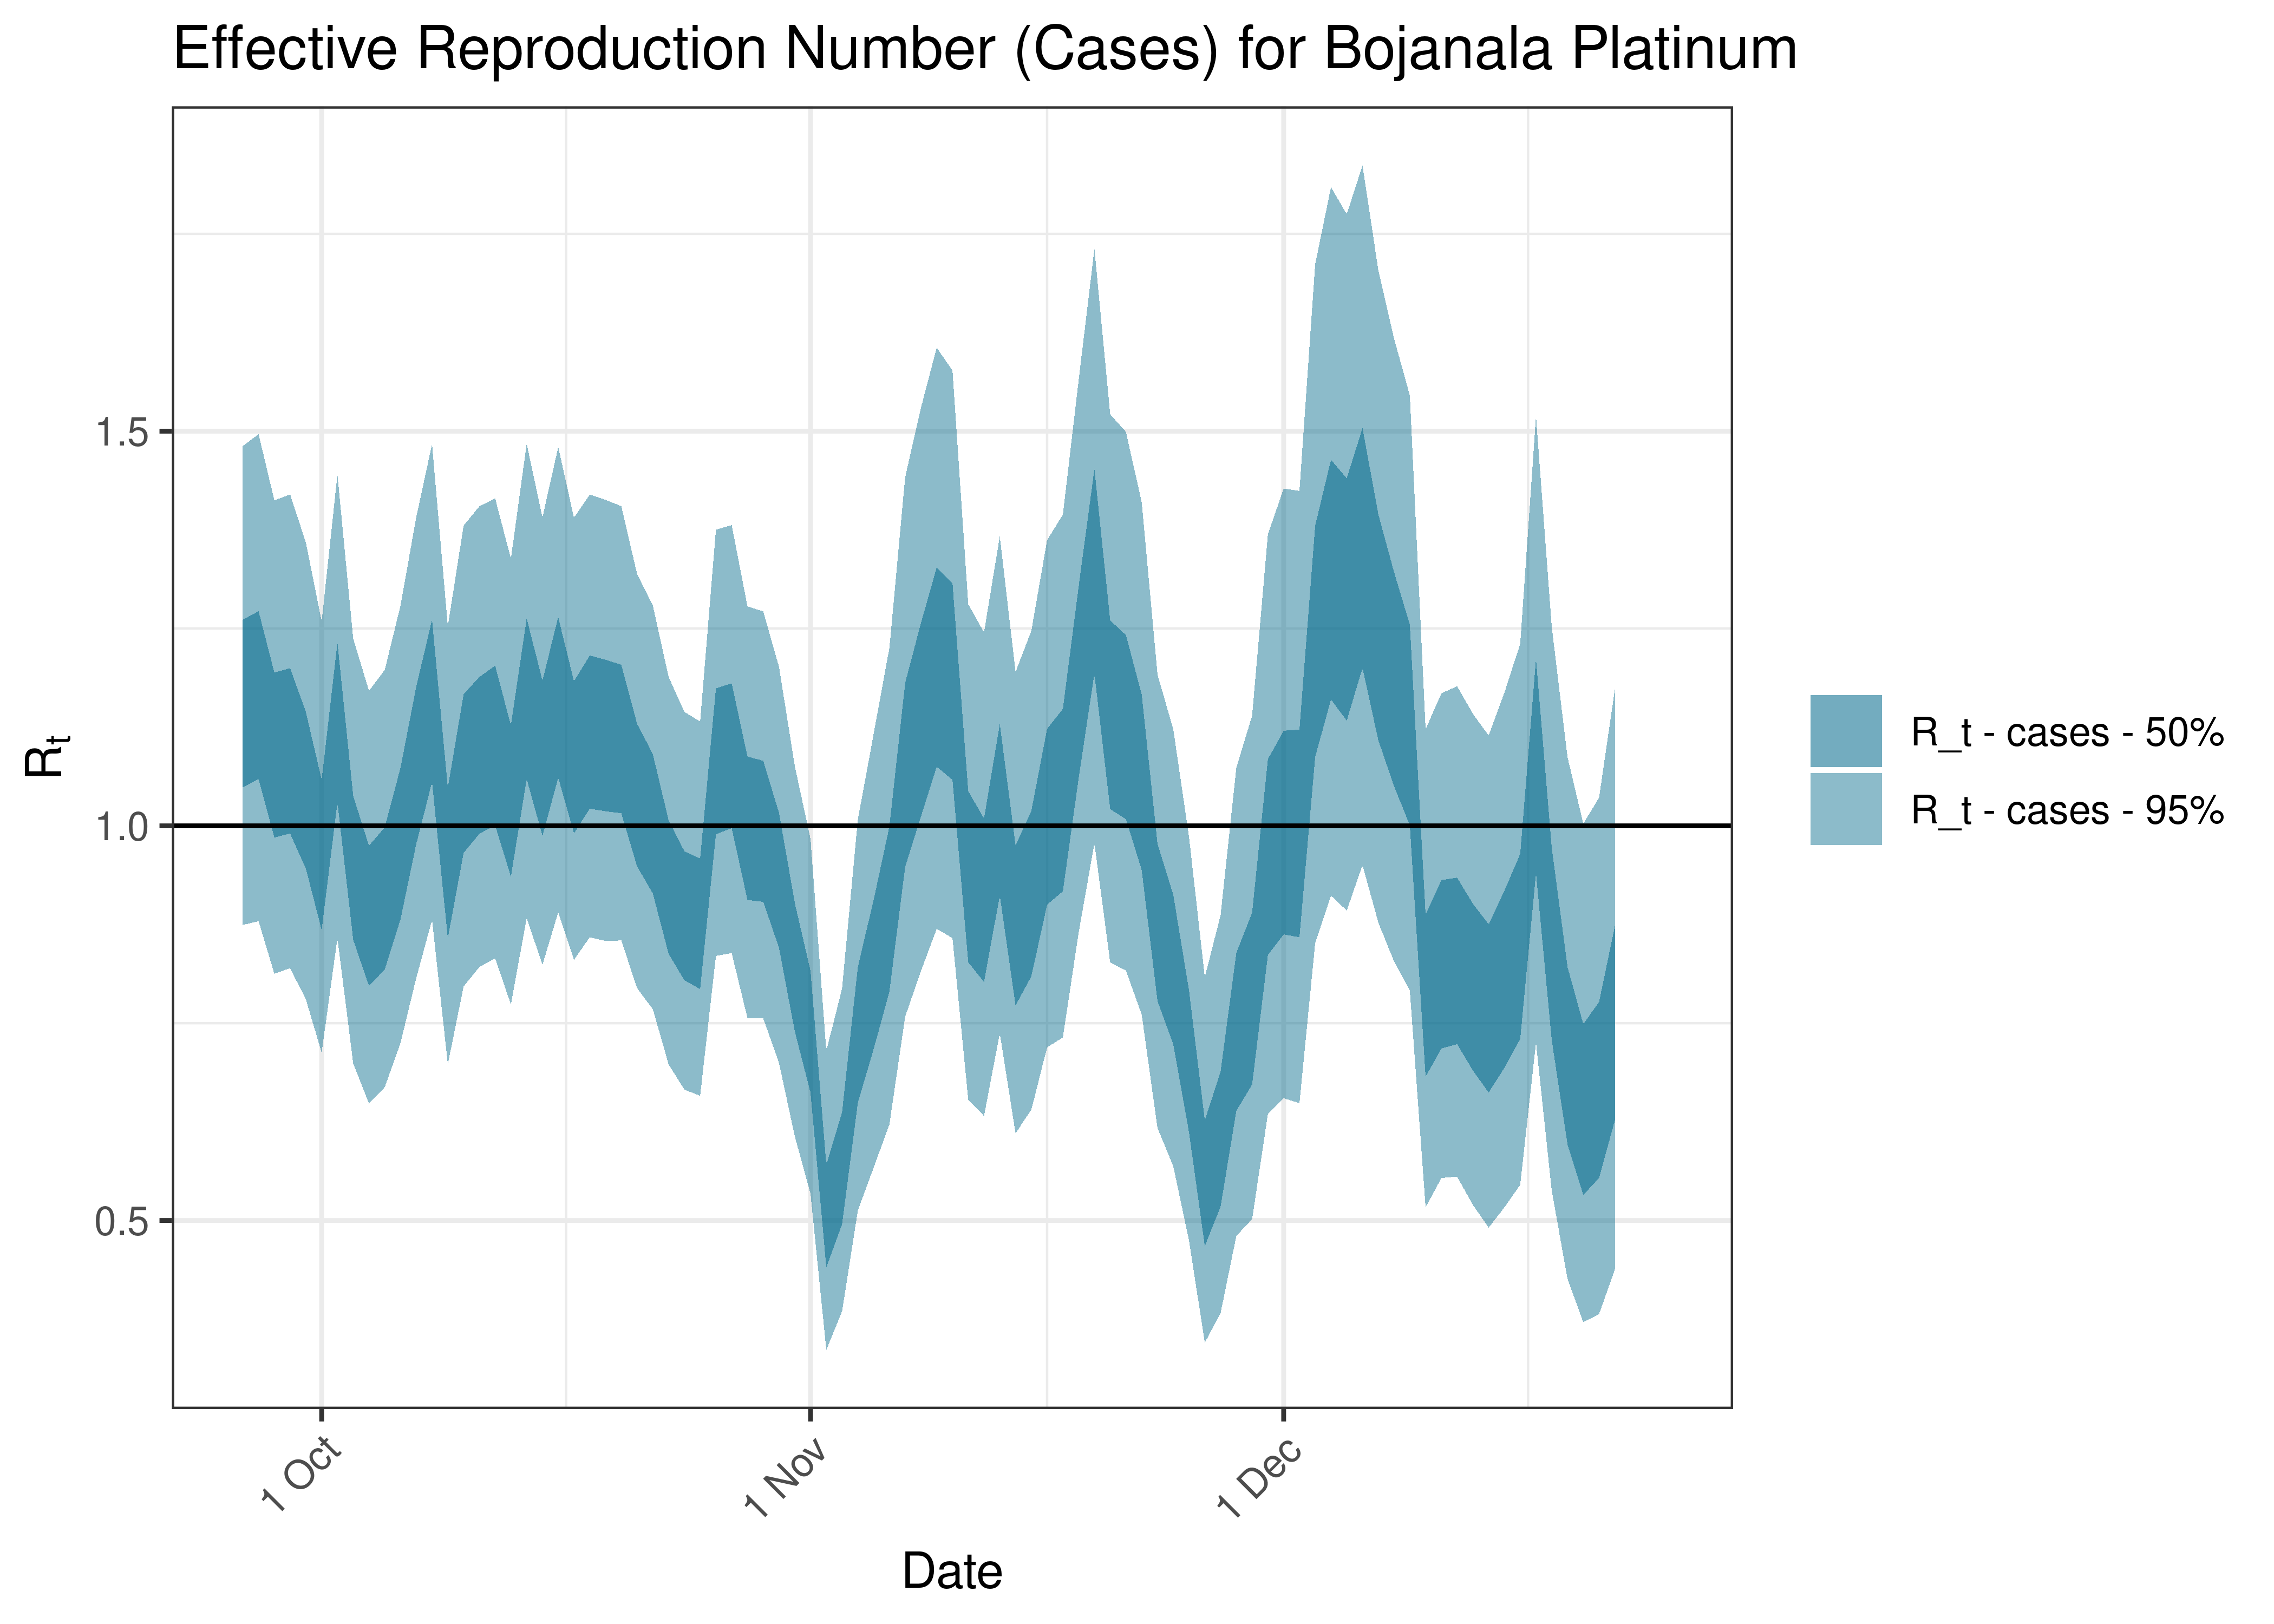
Estimated Effective Reproduction Number Based on Cases for Bojanala Platinum over last 90 days
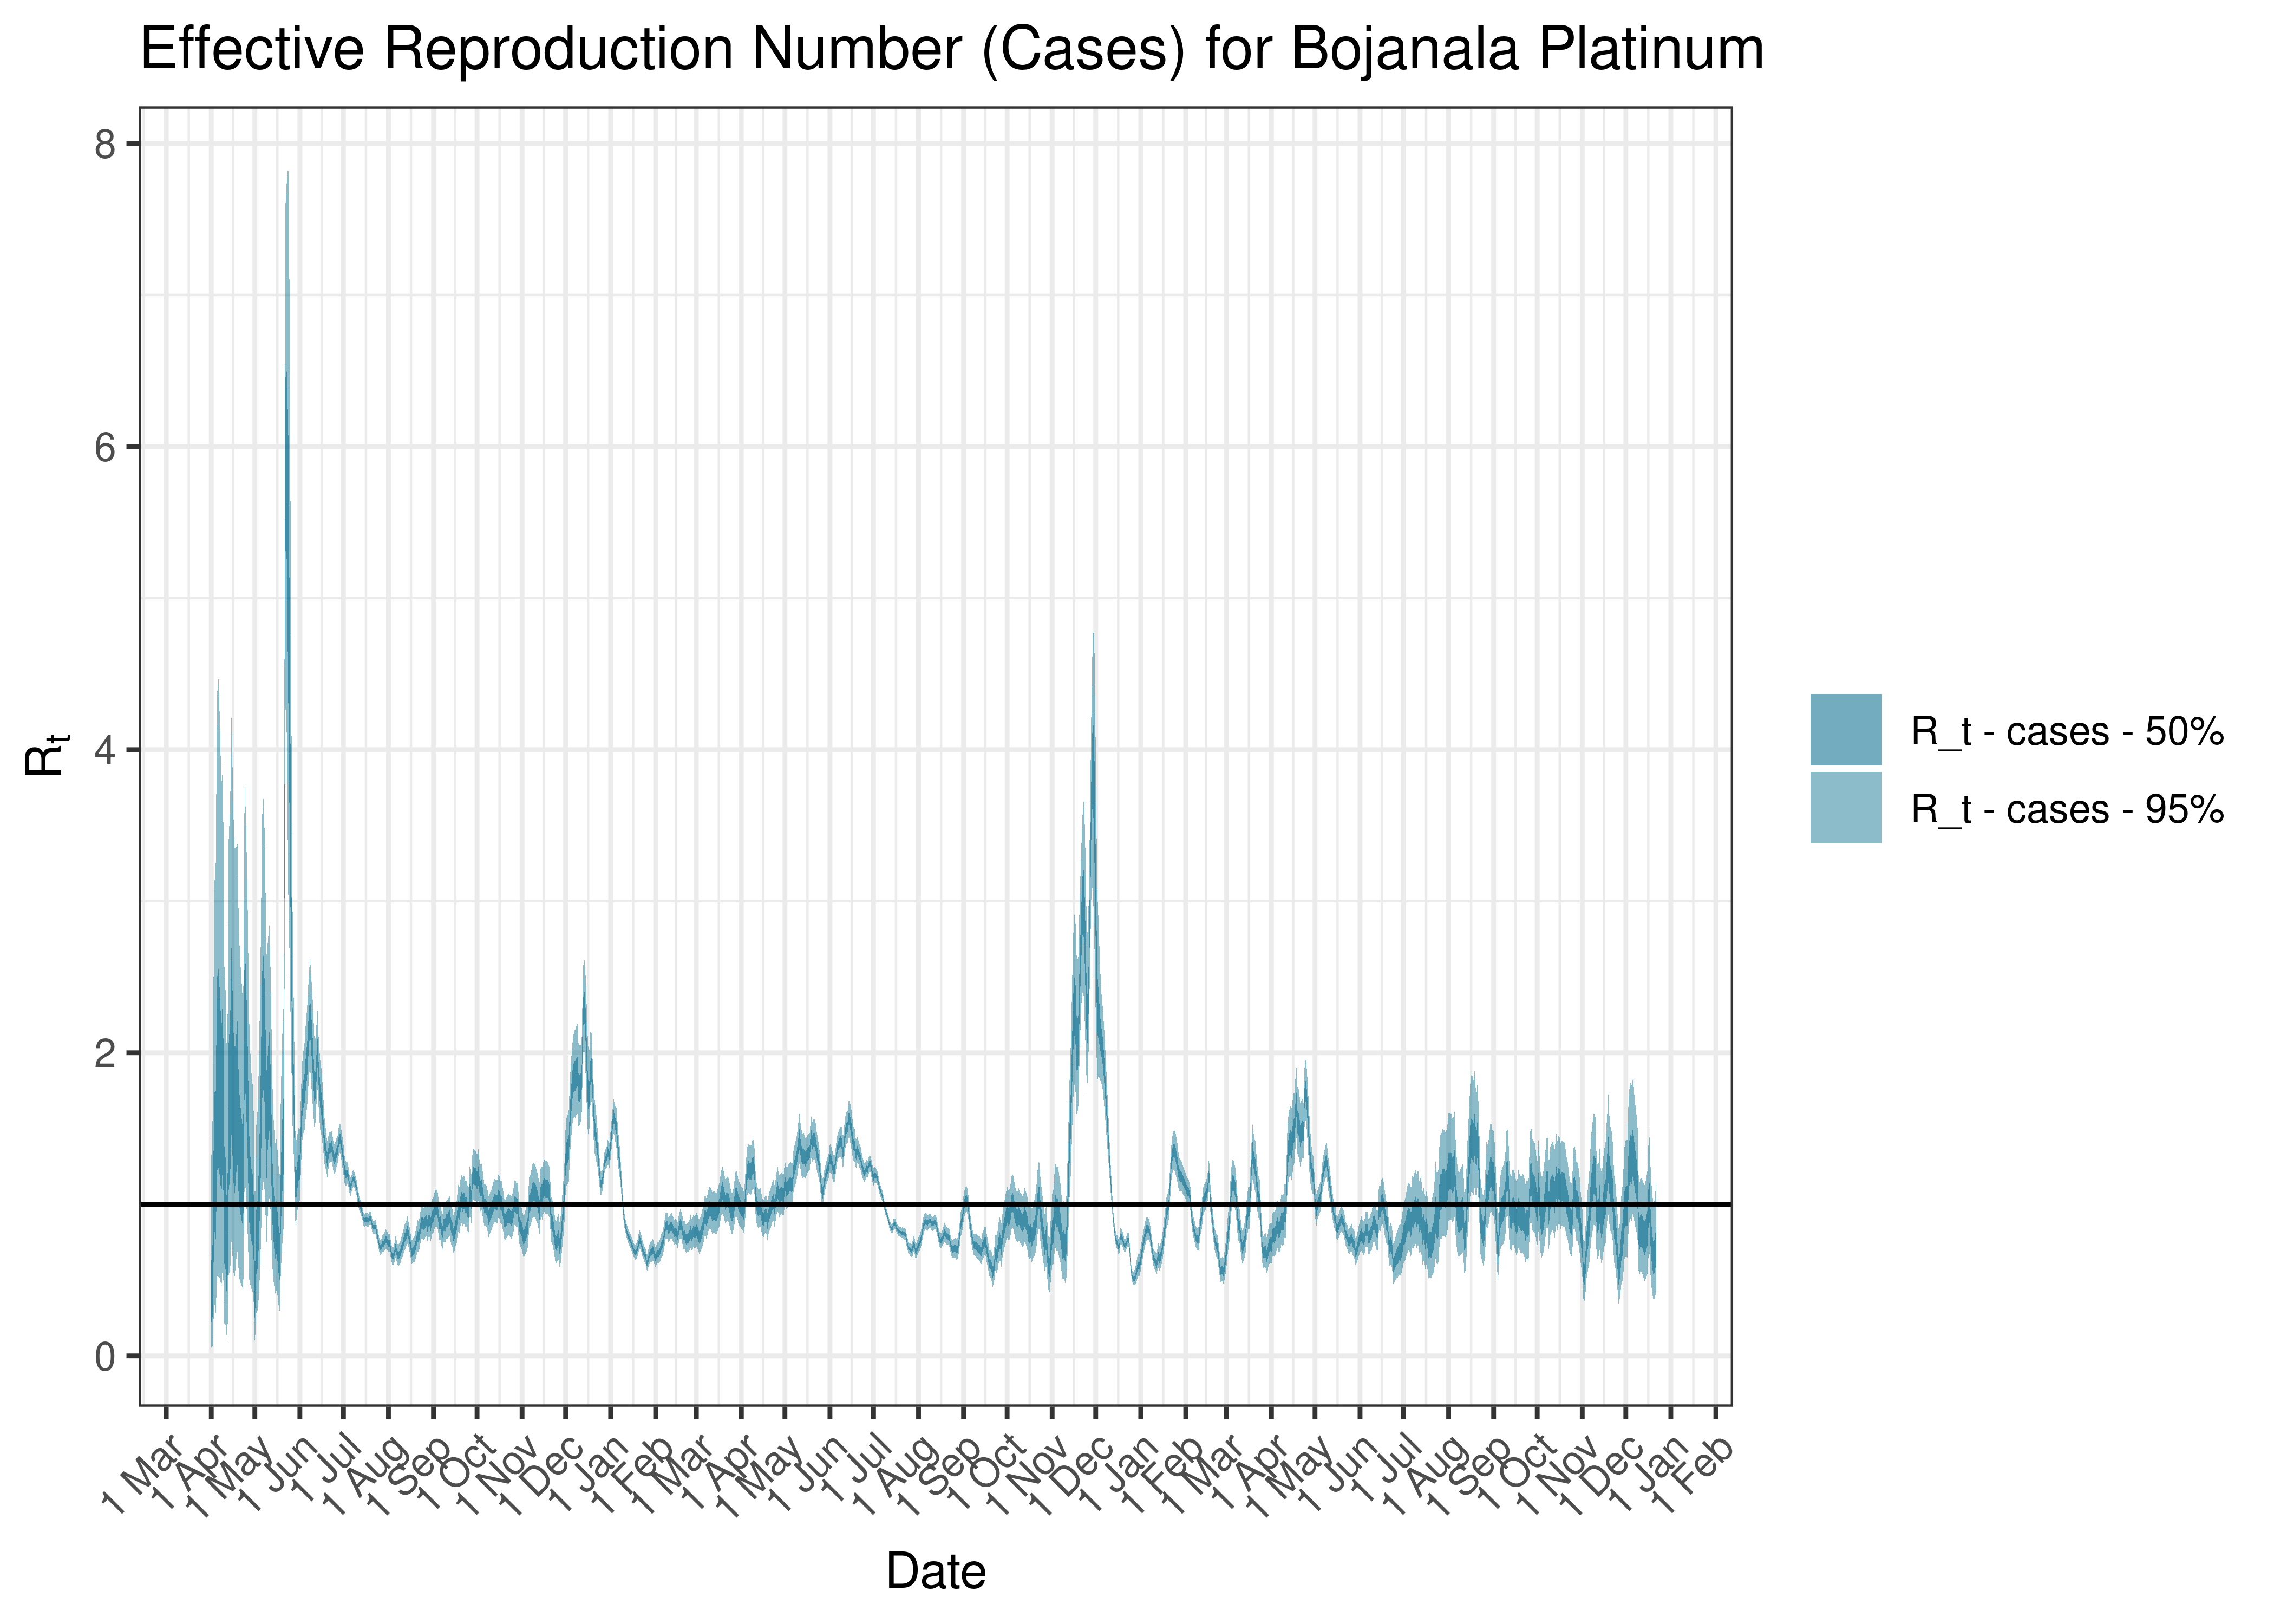
Estimated Effective Reproduction Number Based on Cases for Bojanala Platinum since 1 April 2020
6.8.9 Dr Kenneth Kaunda
6.8.9.1 Cases
Cases are tabulated by specimen received date below. Cases include estimates for late reporting in recent days as well as adjustments for any public holidays. A centred 7-day moving average is also shown. The peak daily cases in previous waves (as measured by the moving average) is also shown.
| Specimen Received Date | Cases | 7-day Moving Average | Comment |
|---|---|---|---|
| 2020-07-11 | 50 | 119 | Wave 1 Peak |
| 2021-01-07 | 114 | 124 | Wave 2 Peak |
| 2021-07-04 | 93 | 221 | Wave 3 Peak |
| 2021-12-12 | 135 | 295 | Wave 4 Peak |
| 2022-05-12 | 95 | 88 | Wave 5 Peak (to date) |
Below a 7-day moving average daily case count are plotted for Dr Kenneth Kaunda on a log scale since start of the epidemic:
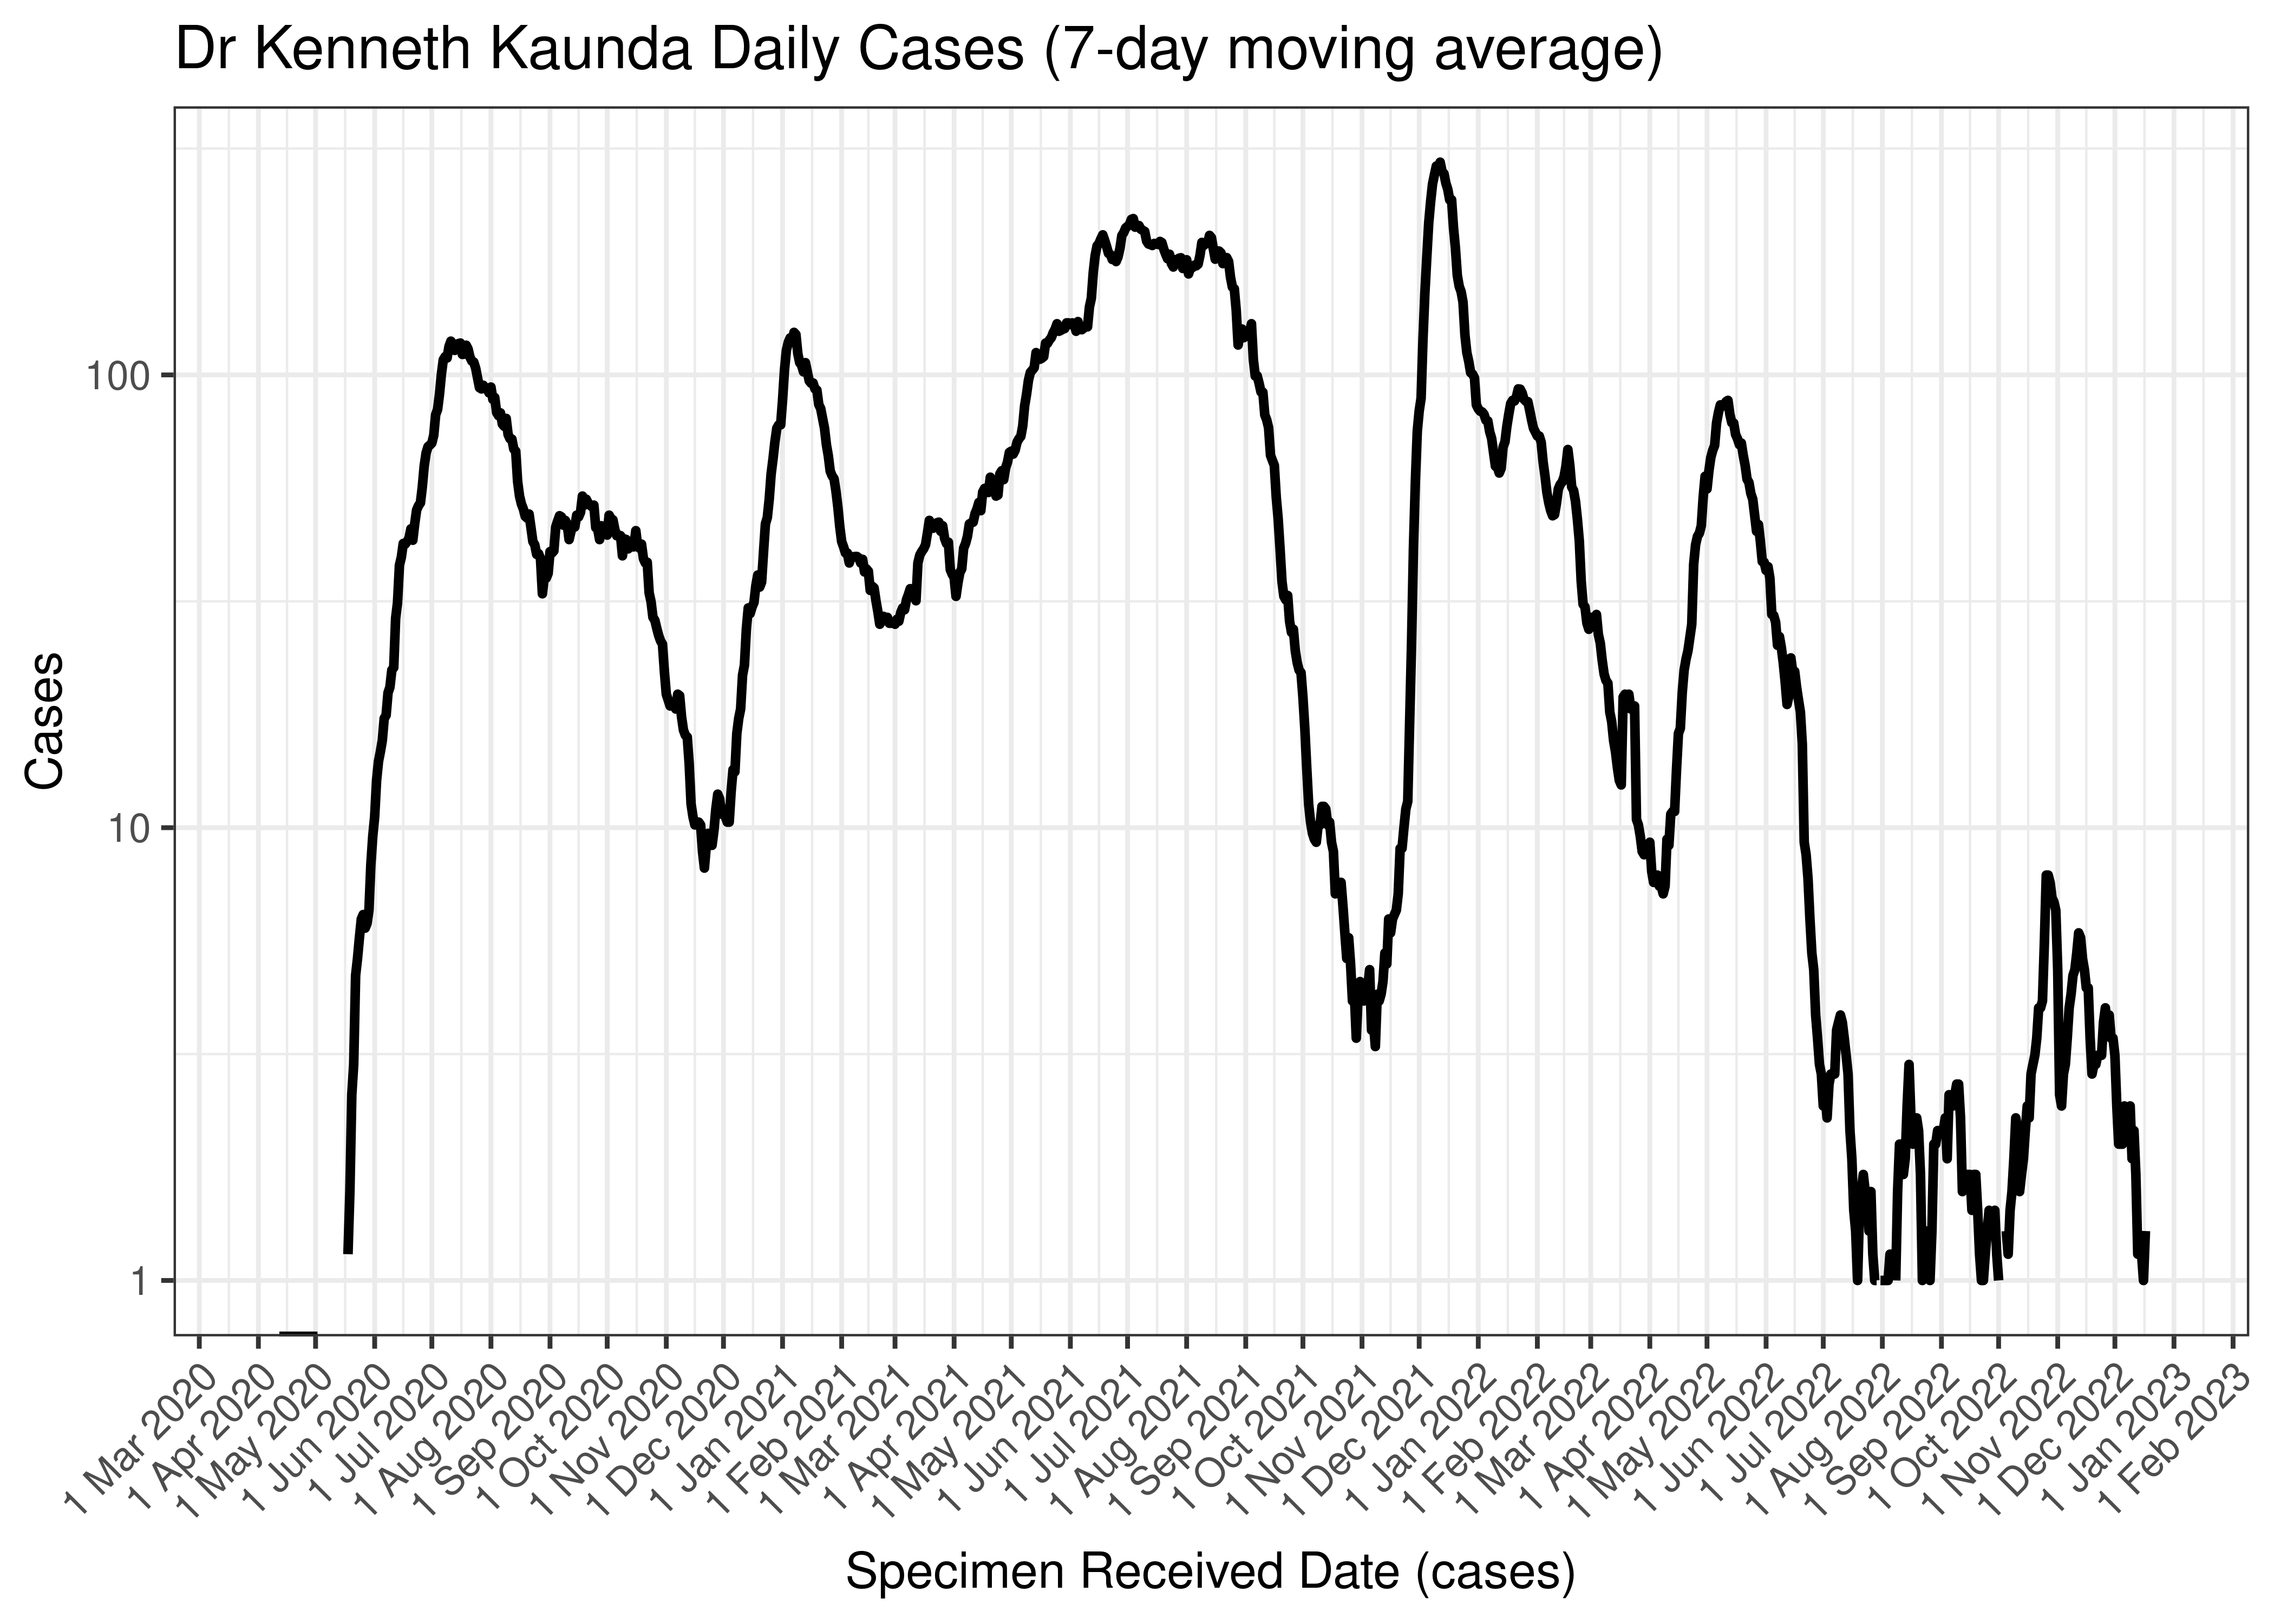
Dr Kenneth Kaunda Daily Cases (7-day moving average)
Below the above chart is repeated for the last 30-days:
Dr Kenneth Kaunda Daily Cases for Last 30-days (7-day moving average)
6.8.9.2 Reproduction Number
Below current (last weekly) reproduction number estimates are tabulated for Dr Kenneth Kaunda.
| Count (Per Day) | Week Ending | Reproduction Number [95% Confidence Interval] | |
|---|---|---|---|
| Dr Kenneth Kaunda | 0.7 | 2022-12-25 | 0.85 [0.31 - 1.67] |
Below the effective reproduction number for Dr Kenneth Kaunda over the last 90 days are plotted together with a plot since start of the pandemic.
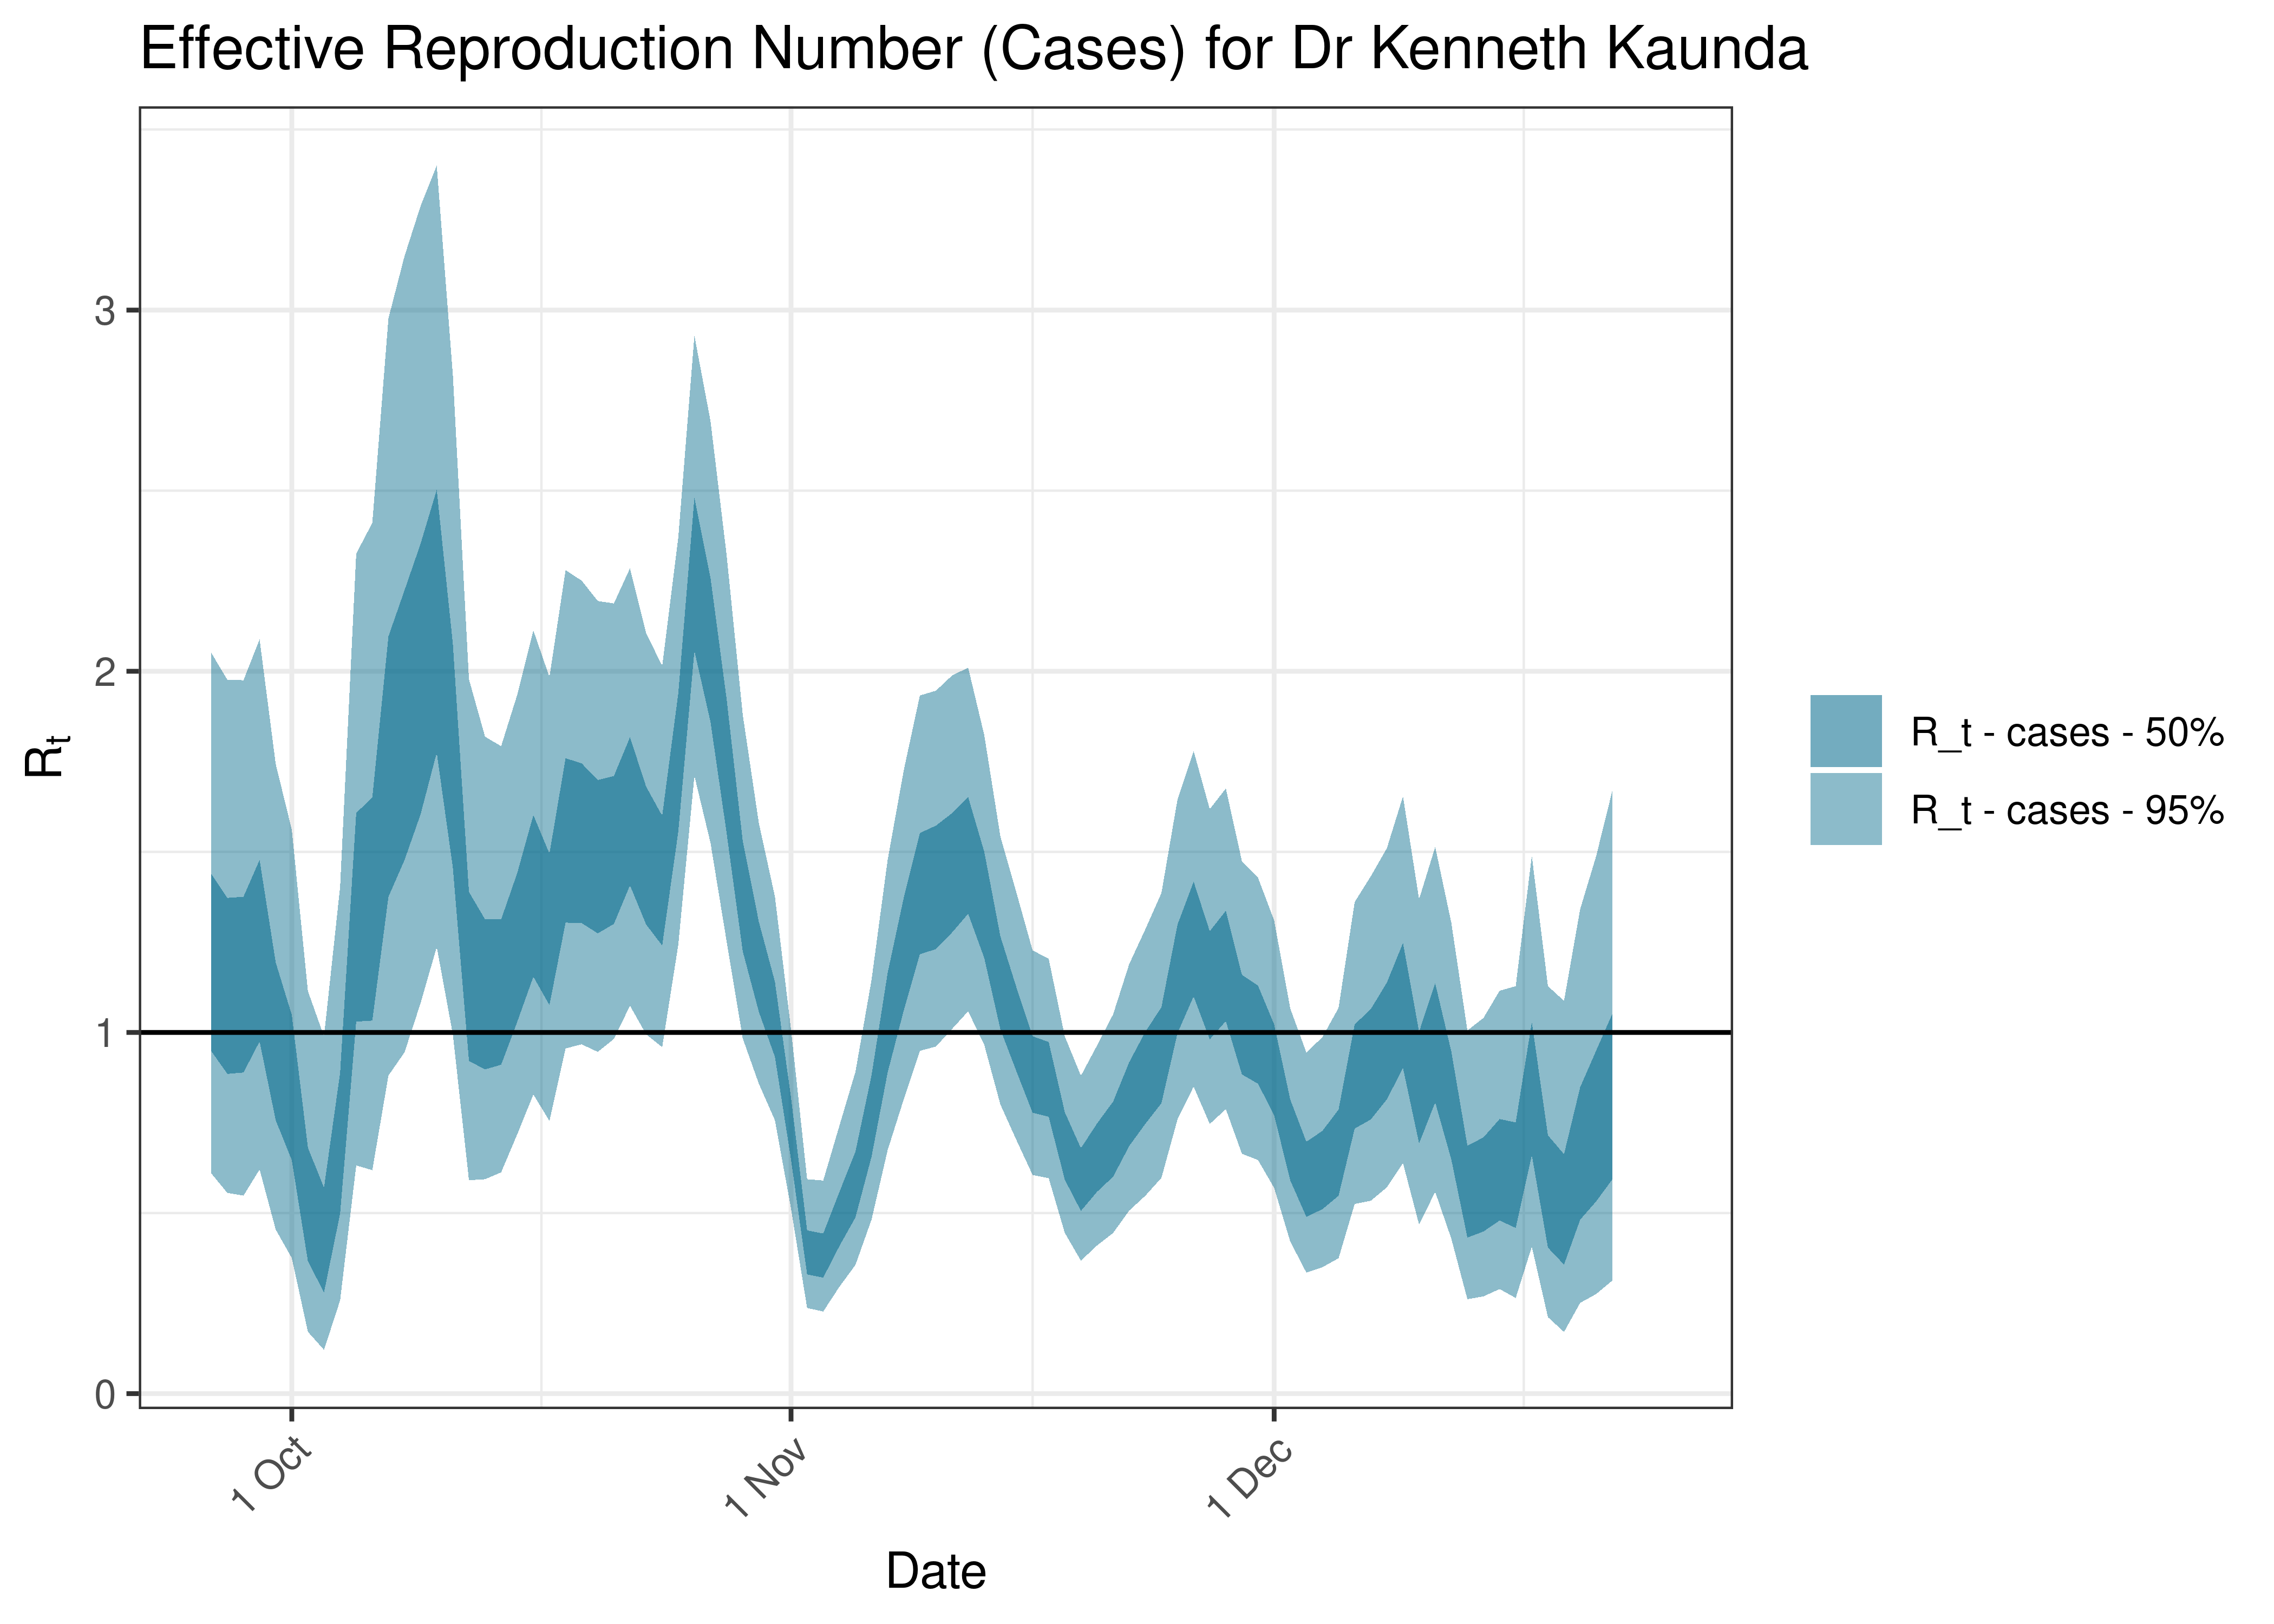
Estimated Effective Reproduction Number Based on Cases for Dr Kenneth Kaunda over last 90 days
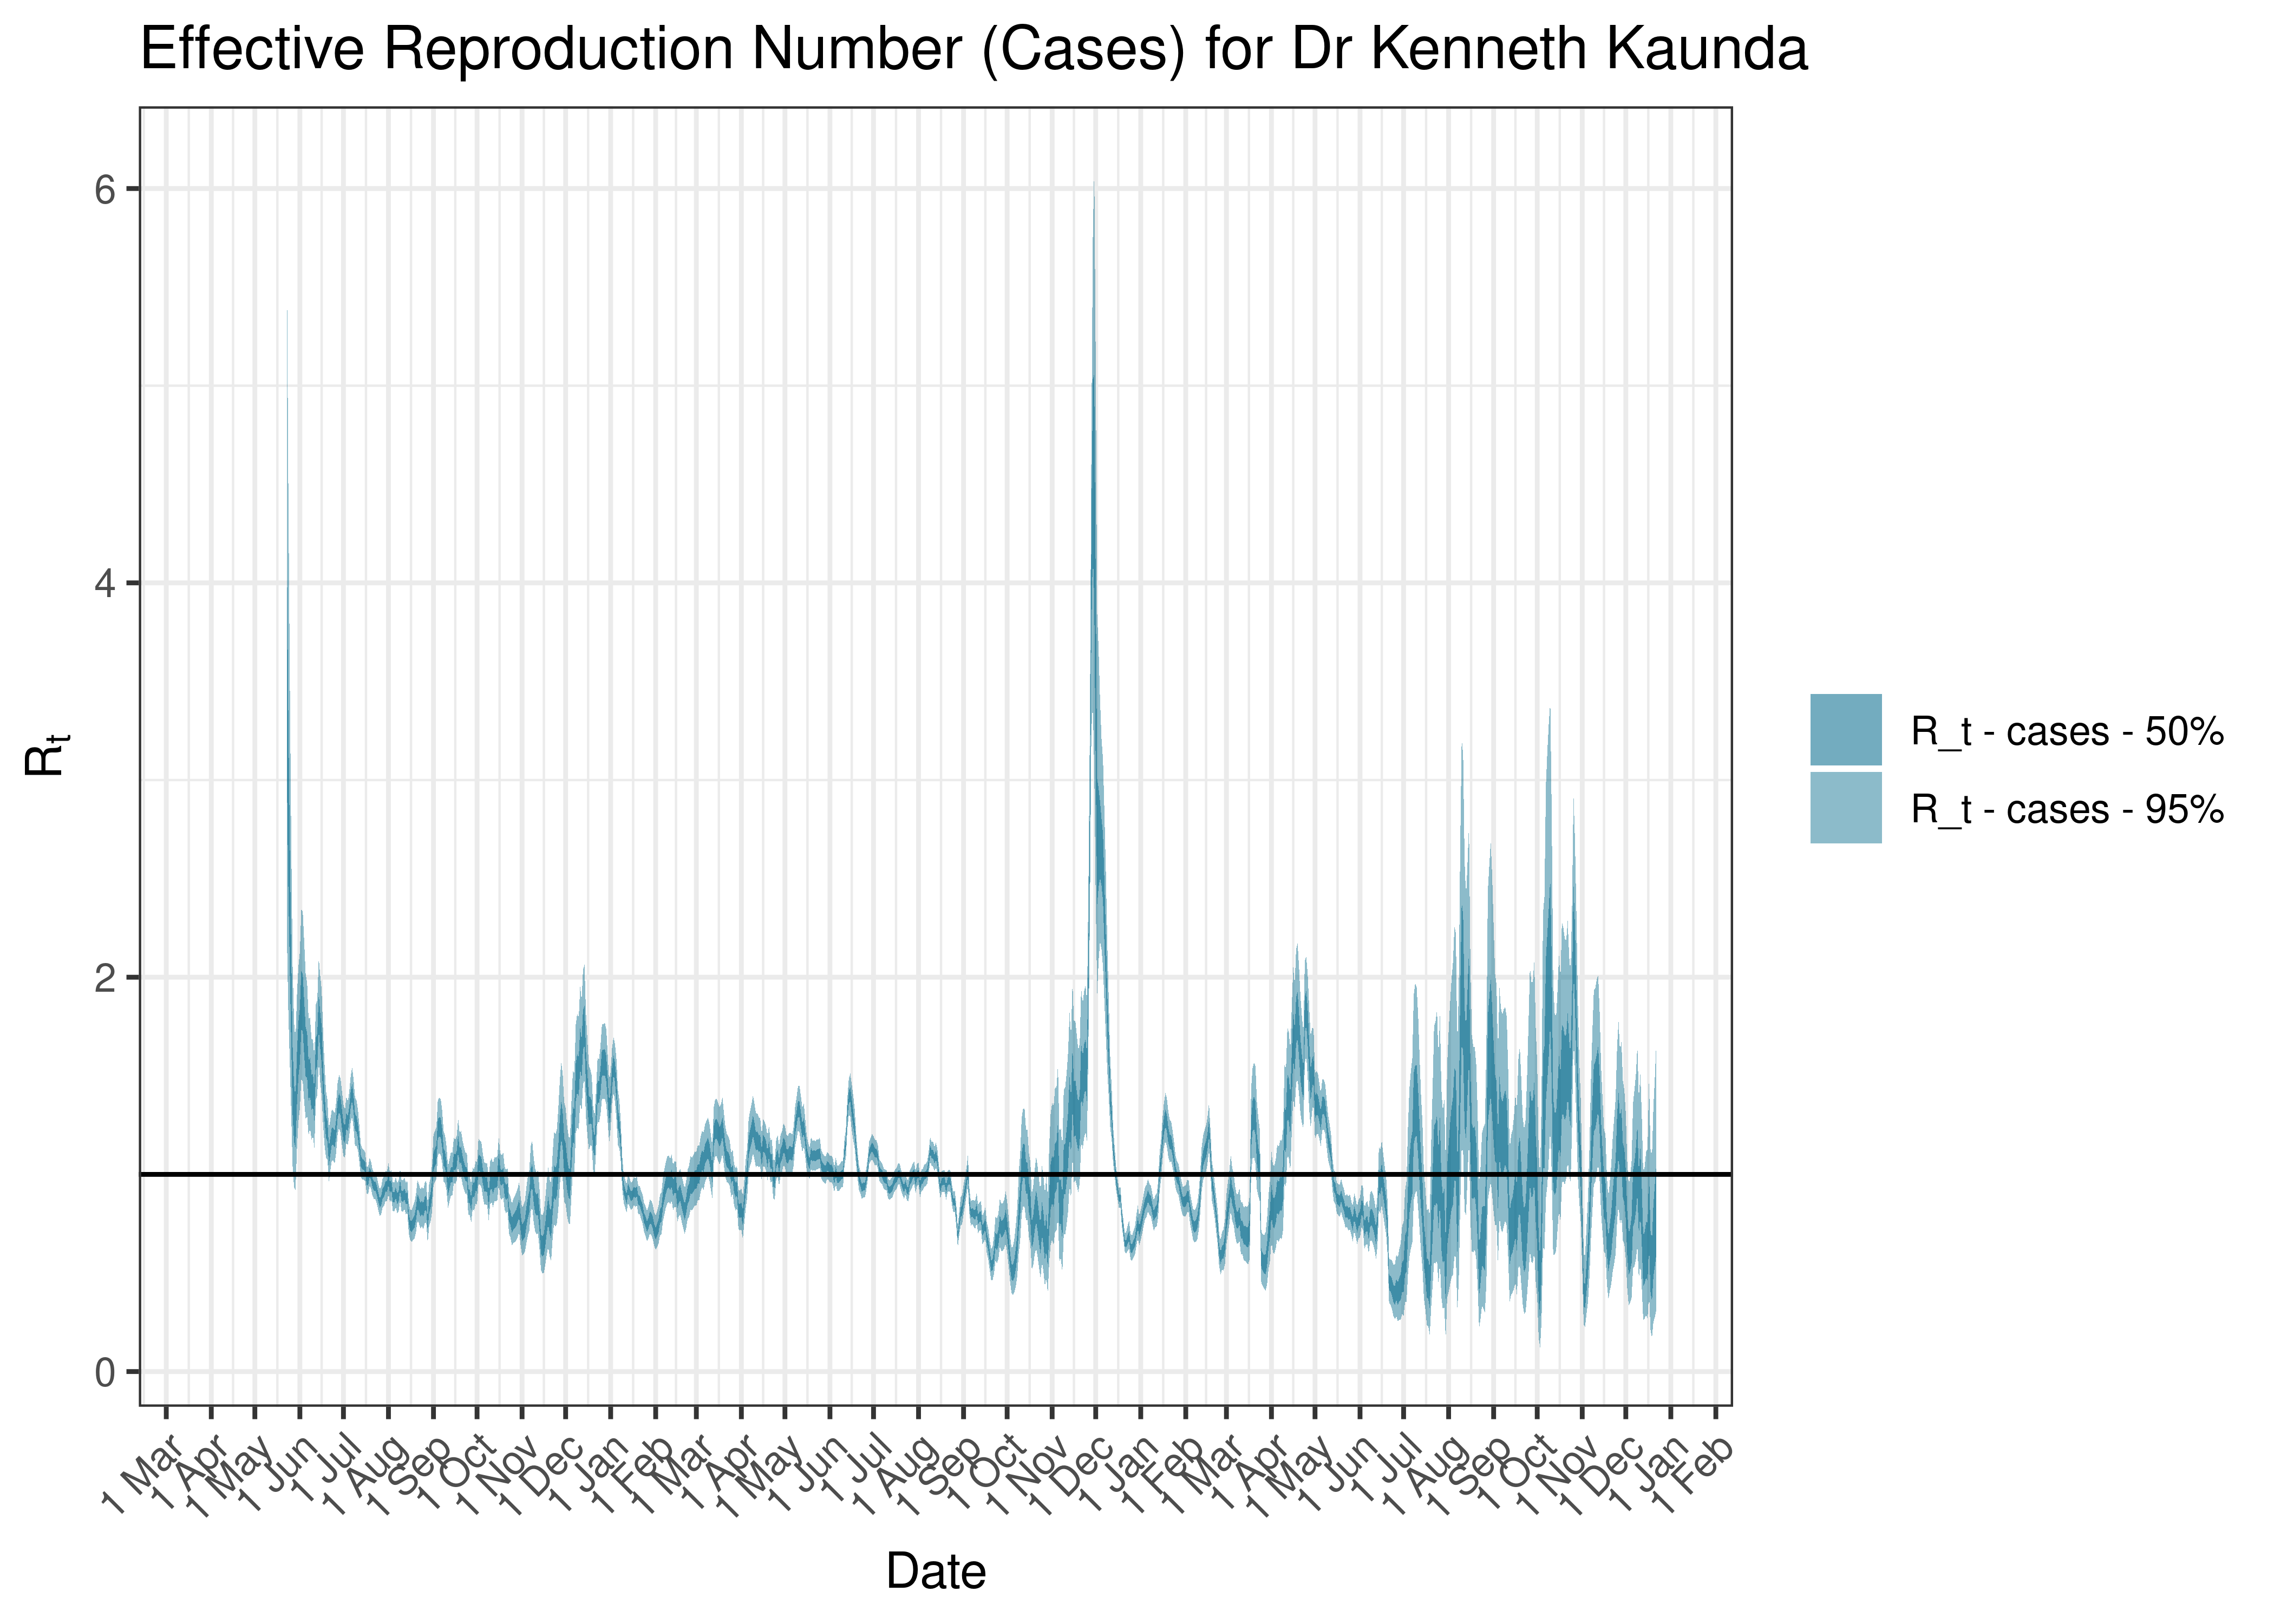
Estimated Effective Reproduction Number Based on Cases for Dr Kenneth Kaunda since 1 April 2020
6.8.10 Dr Ruth Segomotsi Mompati
6.8.10.1 Cases
Cases are tabulated by specimen received date below. Cases include estimates for late reporting in recent days as well as adjustments for any public holidays. A centred 7-day moving average is also shown. The peak daily cases in previous waves (as measured by the moving average) is also shown.
| Specimen Received Date | Cases | 7-day Moving Average | Comment |
|---|---|---|---|
| 2020-09-11 | 39 | 30 | Wave 1 Peak |
| 2021-01-10 | 20 | 48 | Wave 2 Peak |
| 2021-08-22 | 18 | 61 | Wave 3 Peak |
| 2021-12-12 | 11 | 56 | Wave 4 Peak |
| 2022-05-04 | 12 | 12 | Wave 5 Peak (to date) |
| 2022-05-05 | 14 | 12 | Wave 5 Peak (to date) |
Below a 7-day moving average daily case count are plotted for Dr Ruth Segomotsi Mompati on a log scale since start of the epidemic:
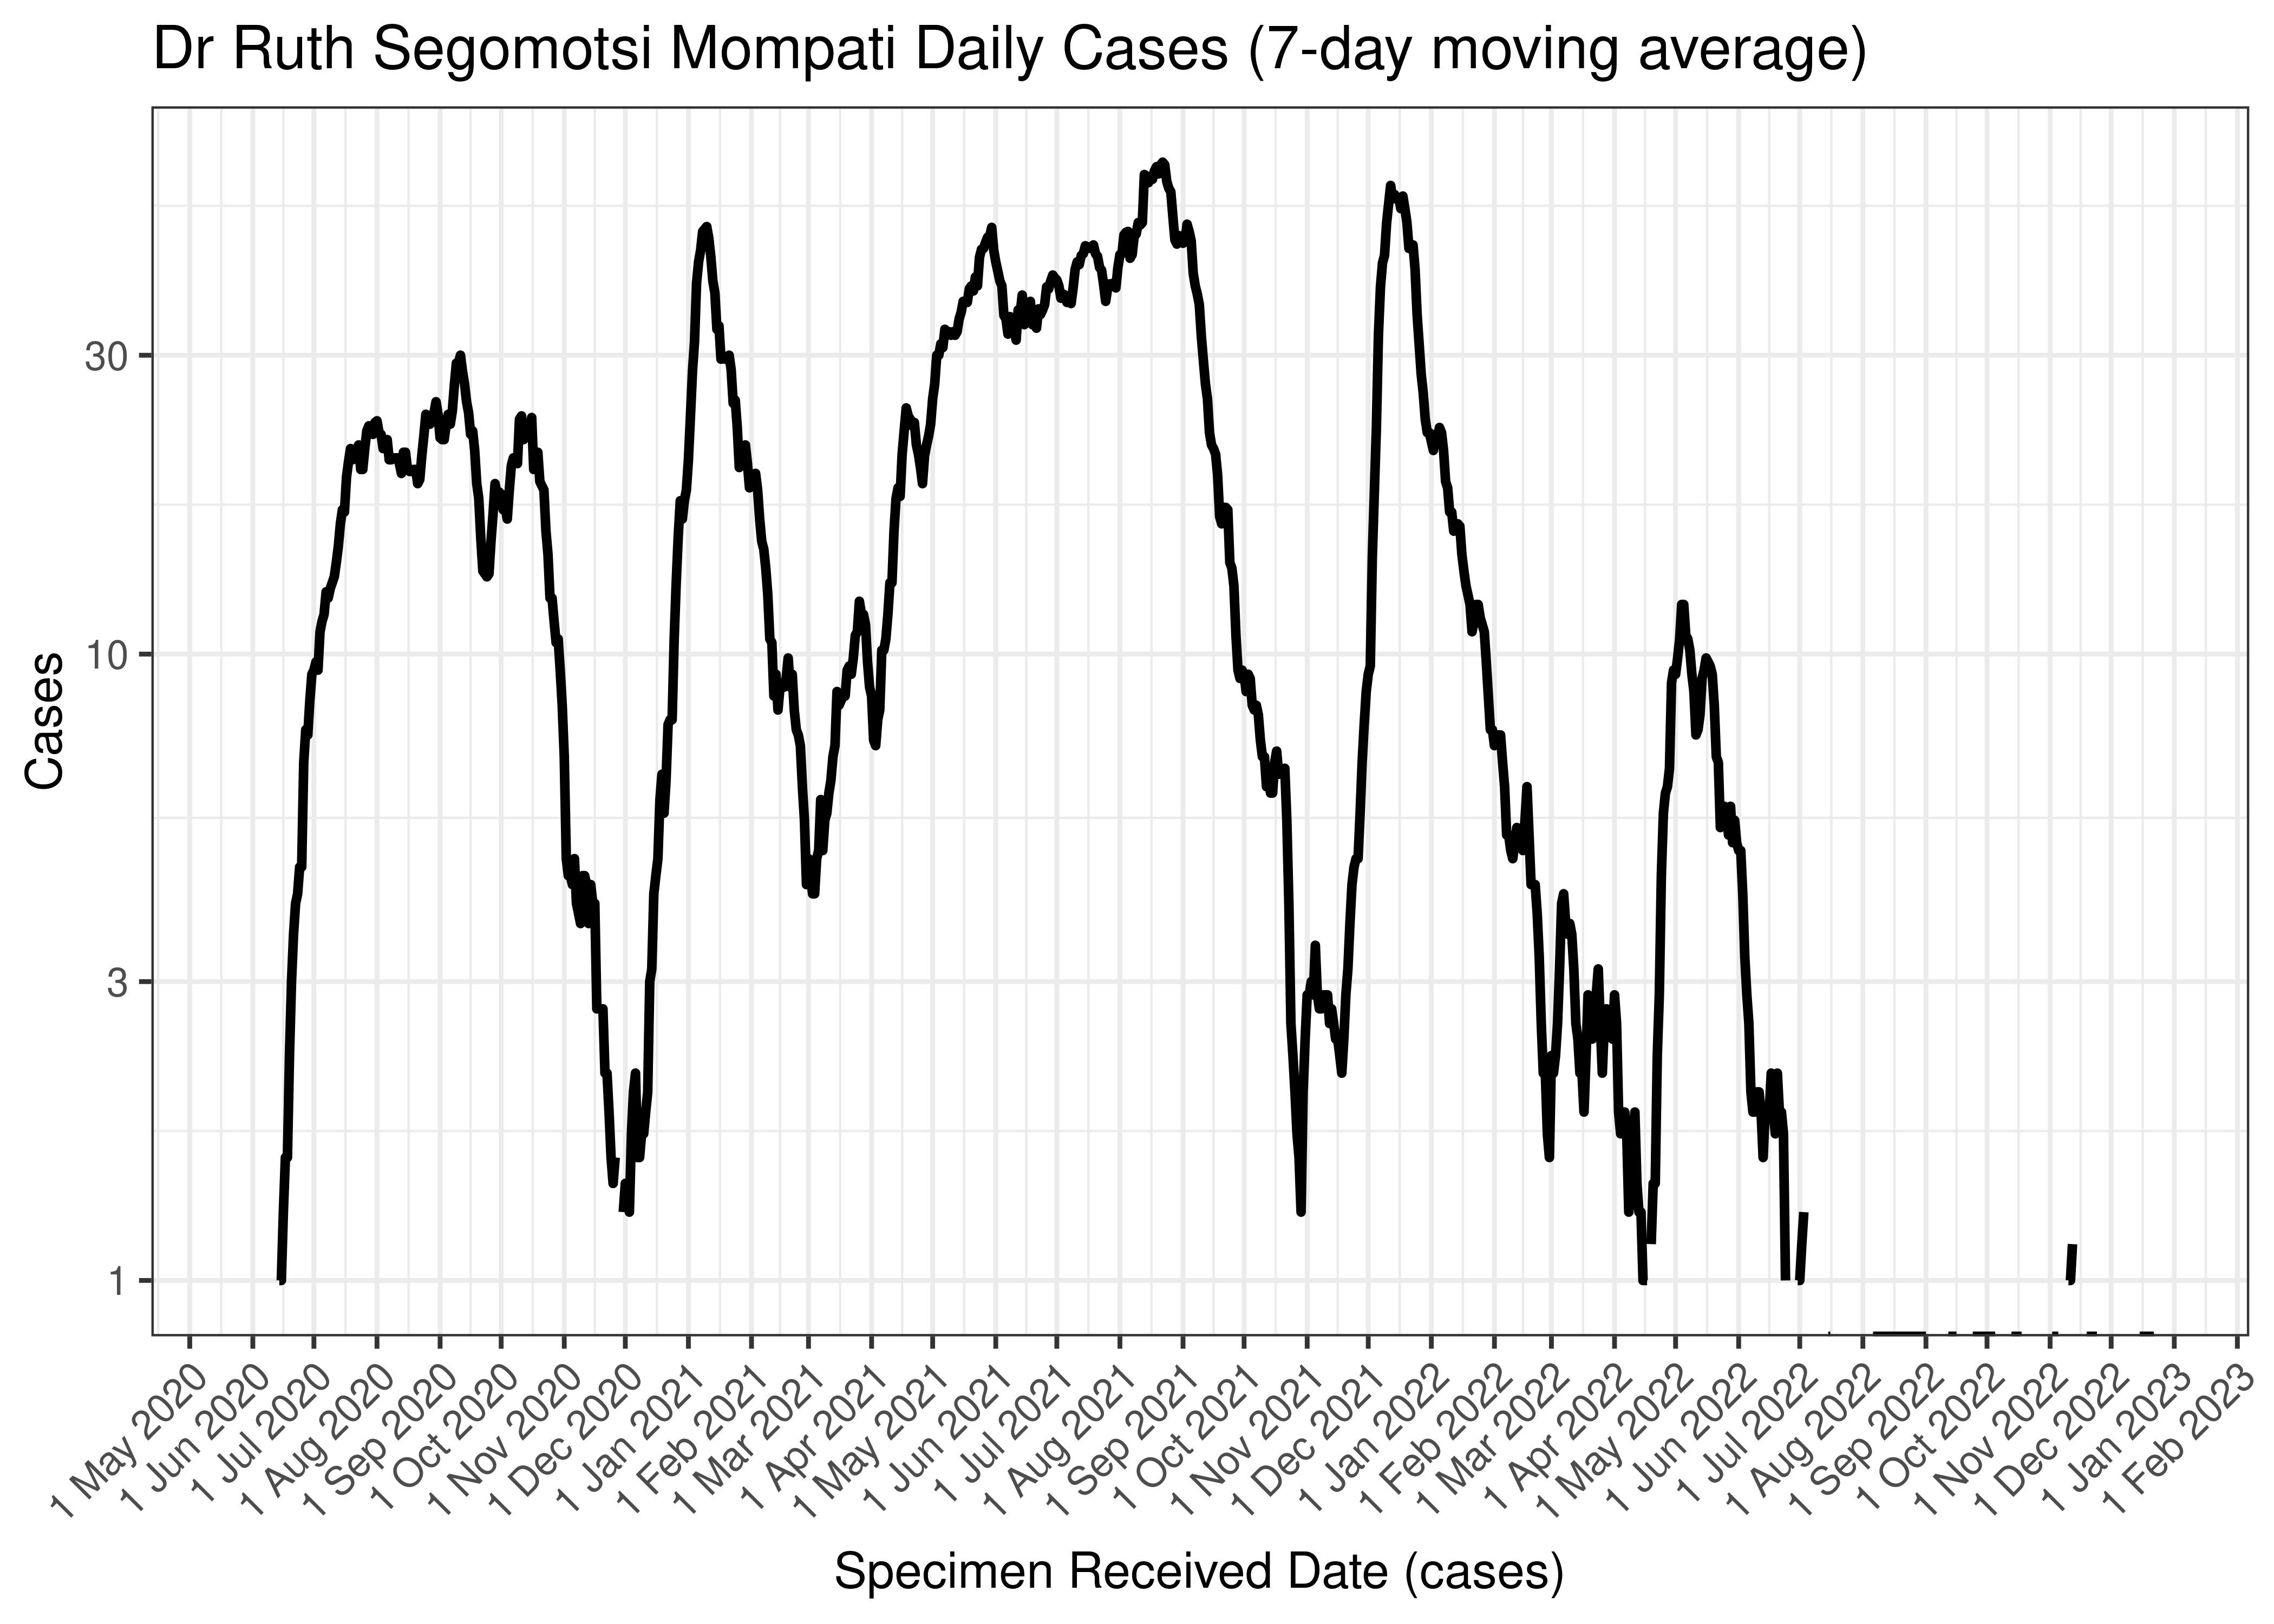
Dr Ruth Segomotsi Mompati Daily Cases (7-day moving average)
Below the above chart is repeated for the last 30-days:

Dr Ruth Segomotsi Mompati Daily Cases for Last 30-days (7-day moving average)
6.8.10.2 Reproduction Number
Below current (last weekly) reproduction number estimates are tabulated for Dr Ruth Segomotsi Mompati.
| Count (Per Day) | Week Ending | Reproduction Number [95% Confidence Interval] | |
|---|---|---|---|
| Dr Ruth Segomotsi Mompati | 0 | 2022-12-25 | 2.82 [0.07 - 10.65] |
Below the effective reproduction number for Dr Ruth Segomotsi Mompati over the last 90 days are plotted together with a plot since start of the pandemic.
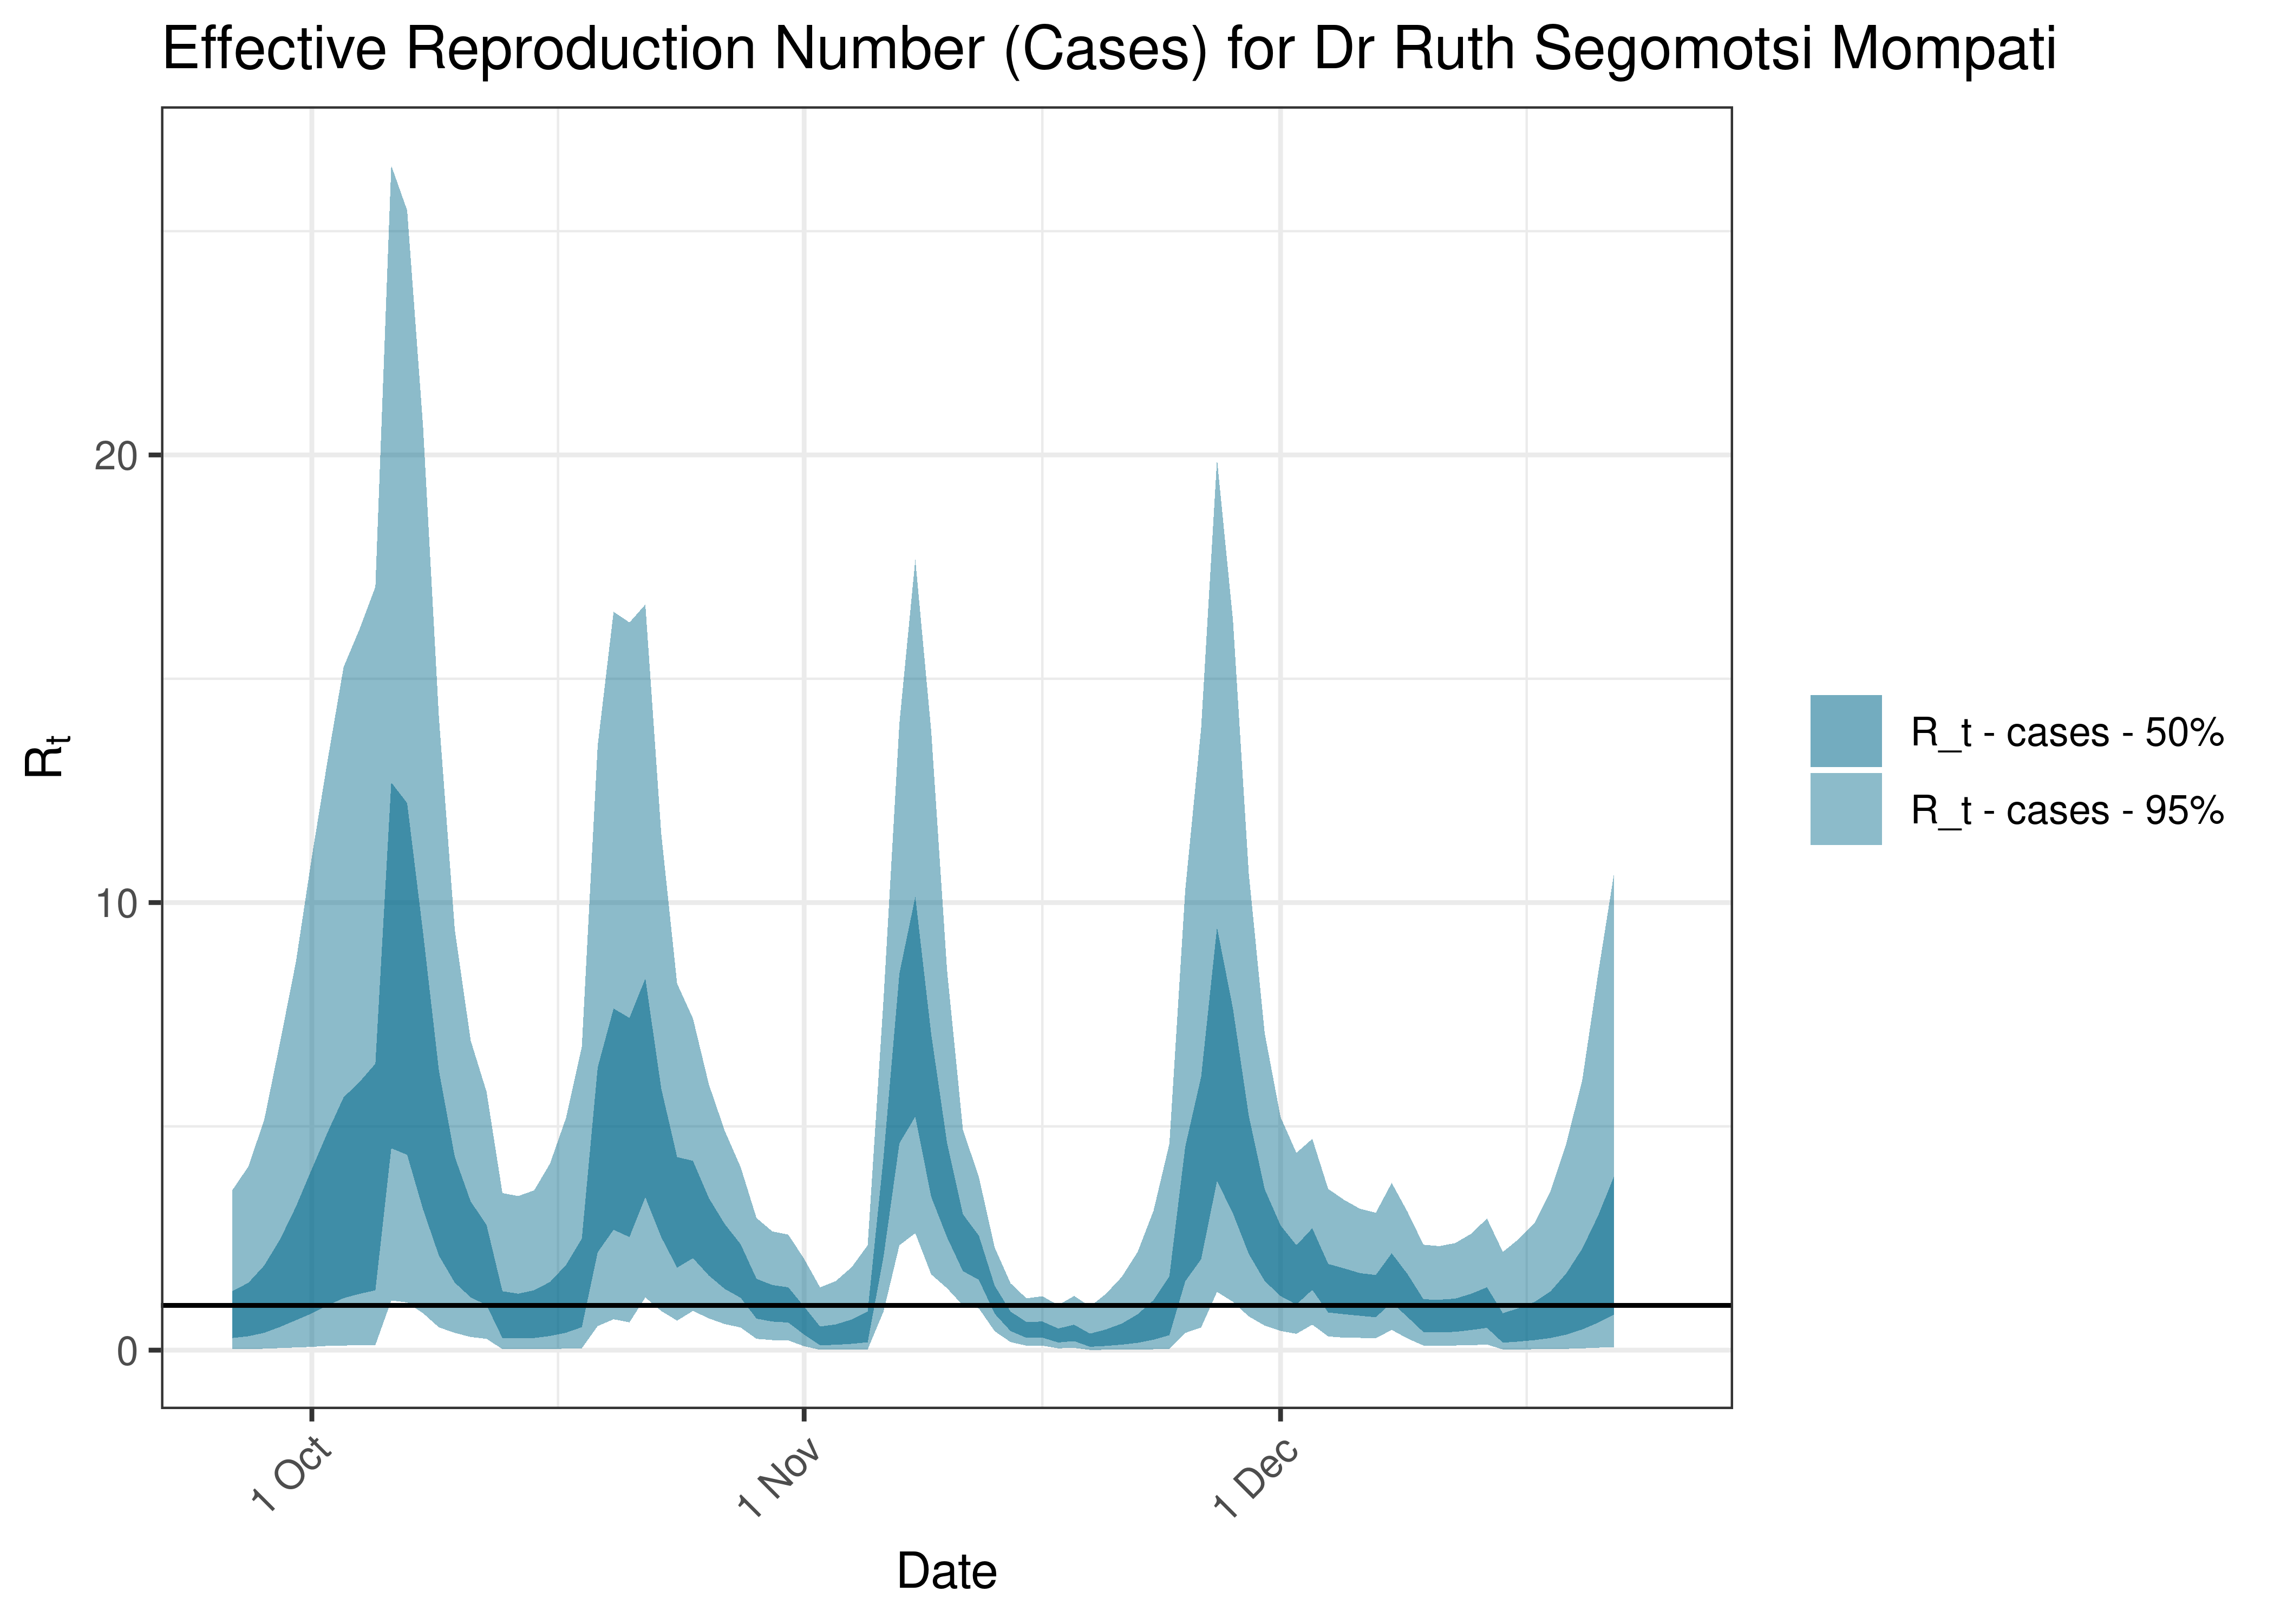
Estimated Effective Reproduction Number Based on Cases for Dr Ruth Segomotsi Mompati over last 90 days
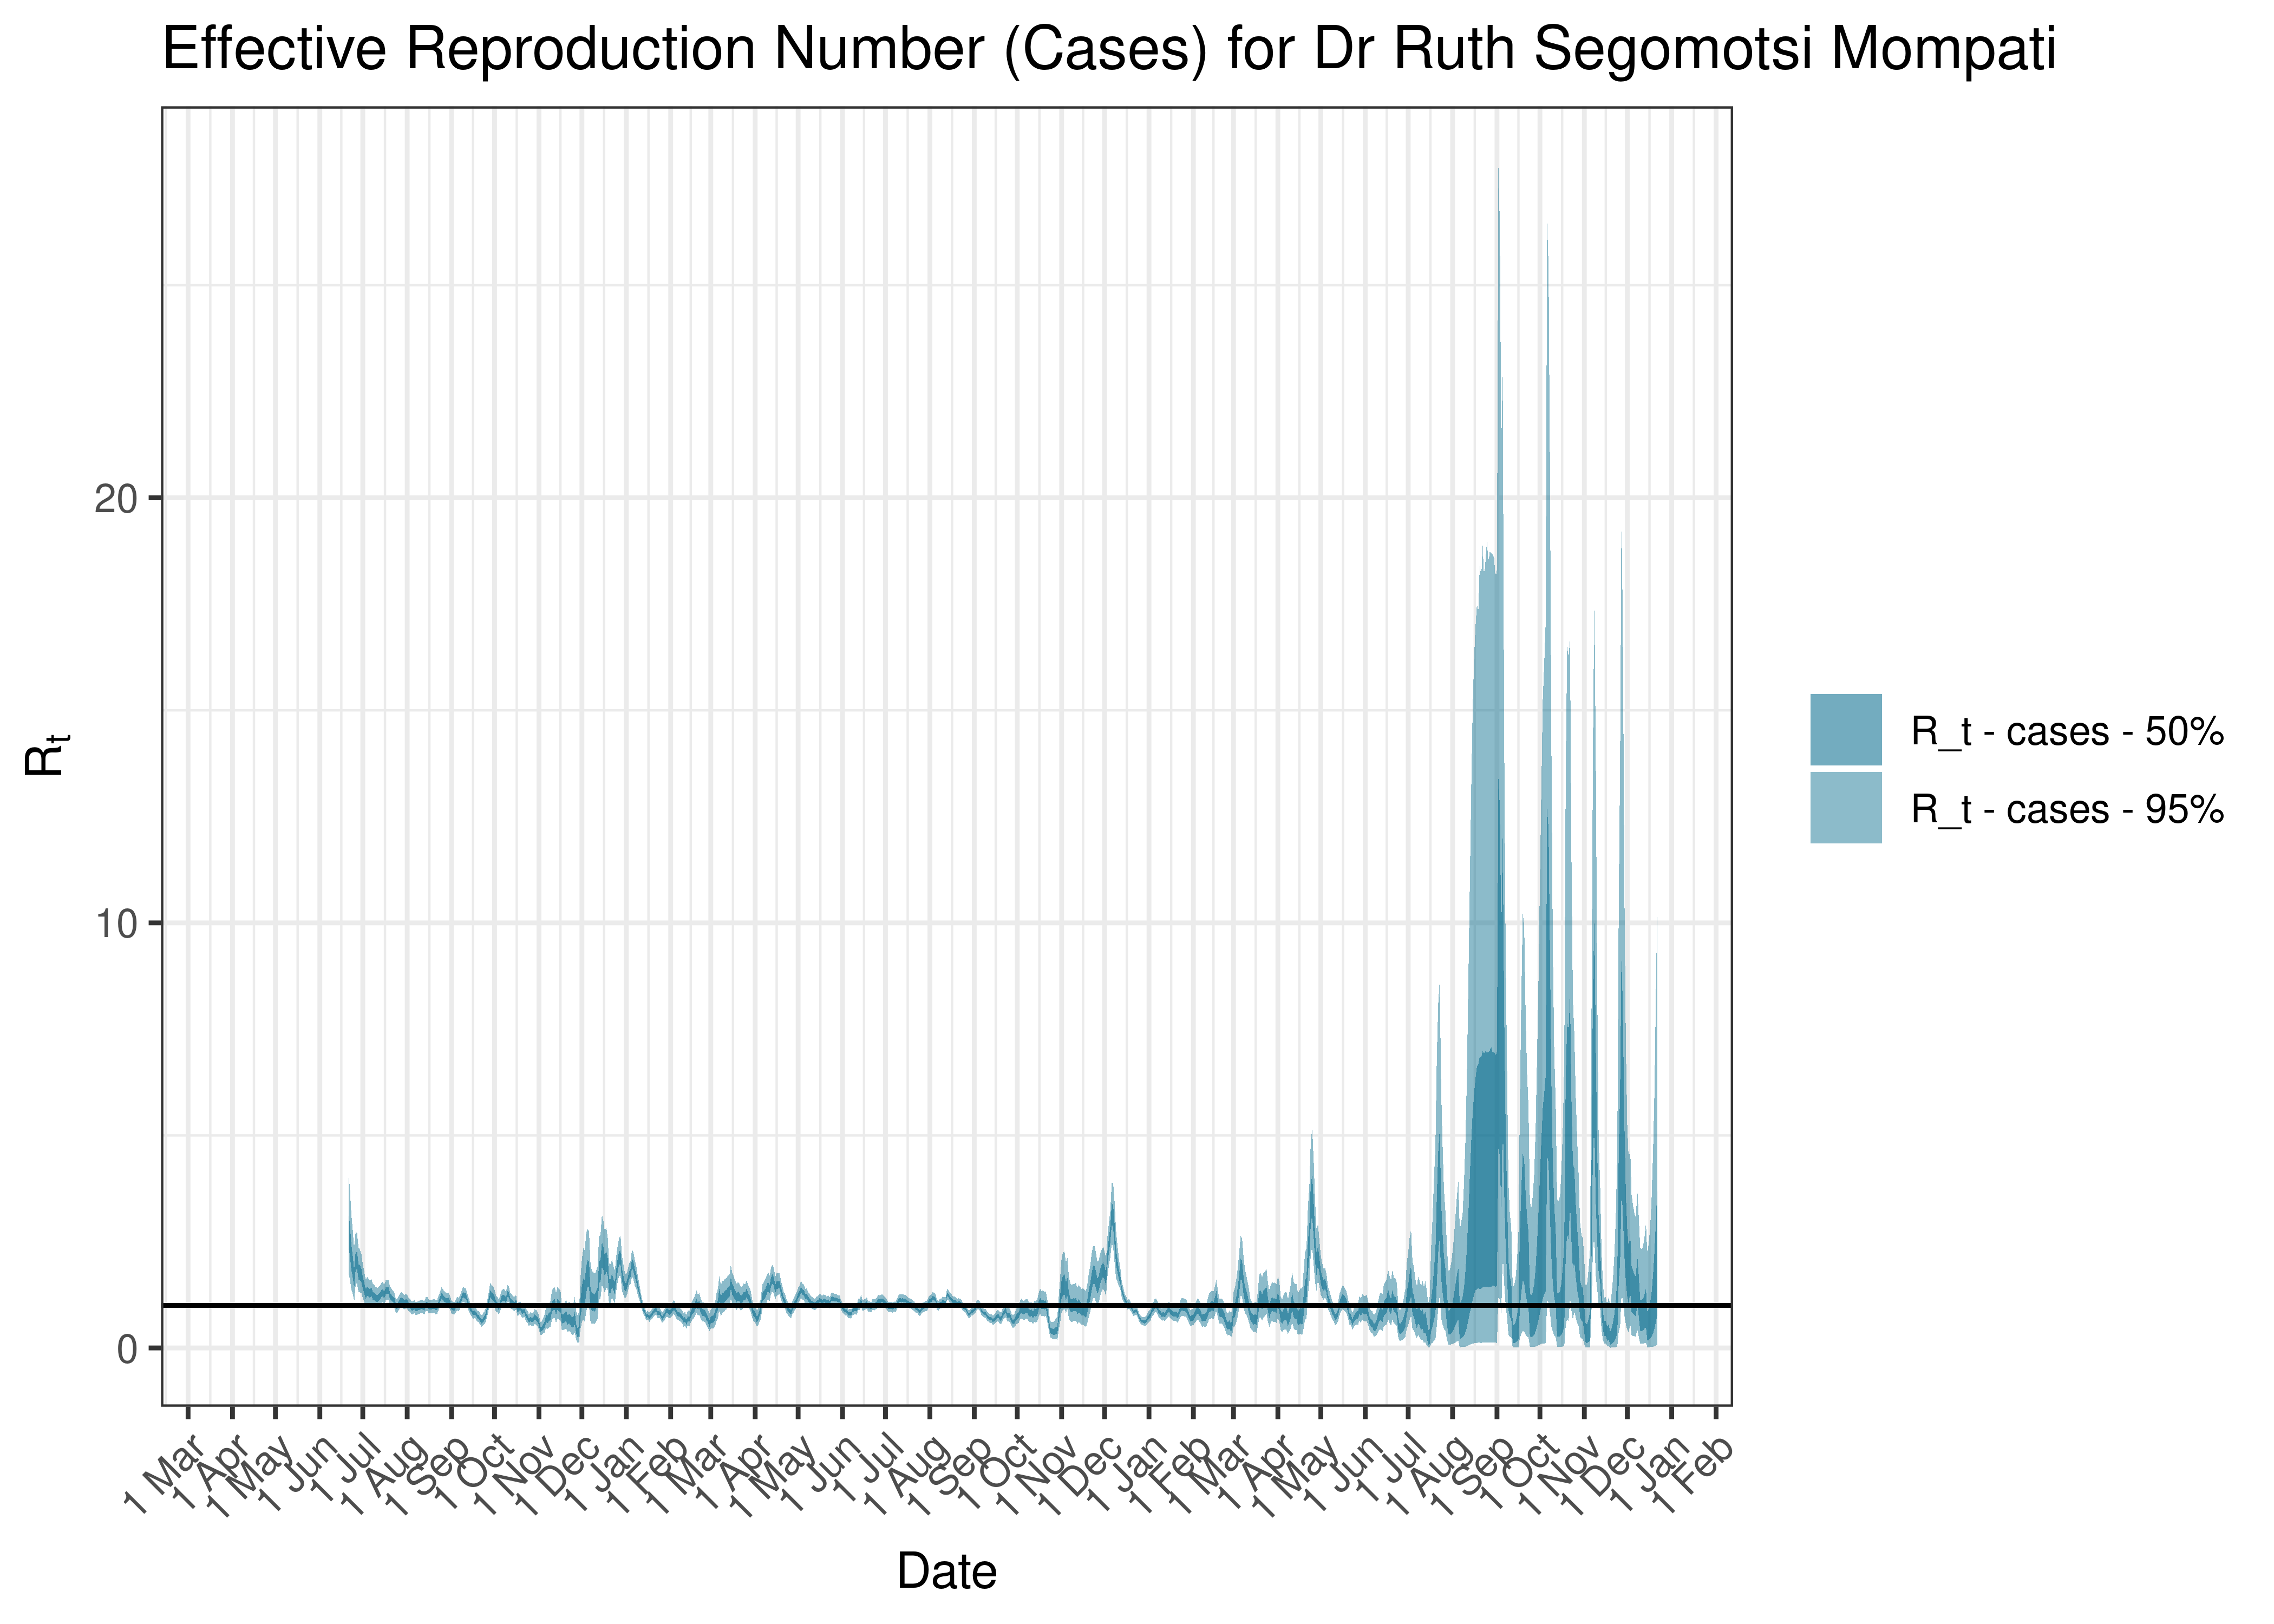
Estimated Effective Reproduction Number Based on Cases for Dr Ruth Segomotsi Mompati since 1 April 2020
6.8.11 Ngaka Modiri Molema
6.8.11.1 Cases
Cases are tabulated by specimen received date below. Cases include estimates for late reporting in recent days as well as adjustments for any public holidays. A centred 7-day moving average is also shown. The peak daily cases in previous waves (as measured by the moving average) is also shown.
| Specimen Received Date | Cases | 7-day Moving Average | Comment |
|---|---|---|---|
| 2020-07-19 | 23 | 79 | Wave 1 Peak |
| 2021-01-09 | 99 | 133 | Wave 2 Peak |
| 2021-07-07 | 195 | 134 | Wave 3 Peak |
| 2021-12-12 | 90 | 211 | Wave 4 Peak |
| 2022-05-08 | 8 | 43 | Wave 5 Peak (to date) |
Below a 7-day moving average daily case count are plotted for Ngaka Modiri Molema on a log scale since start of the epidemic:
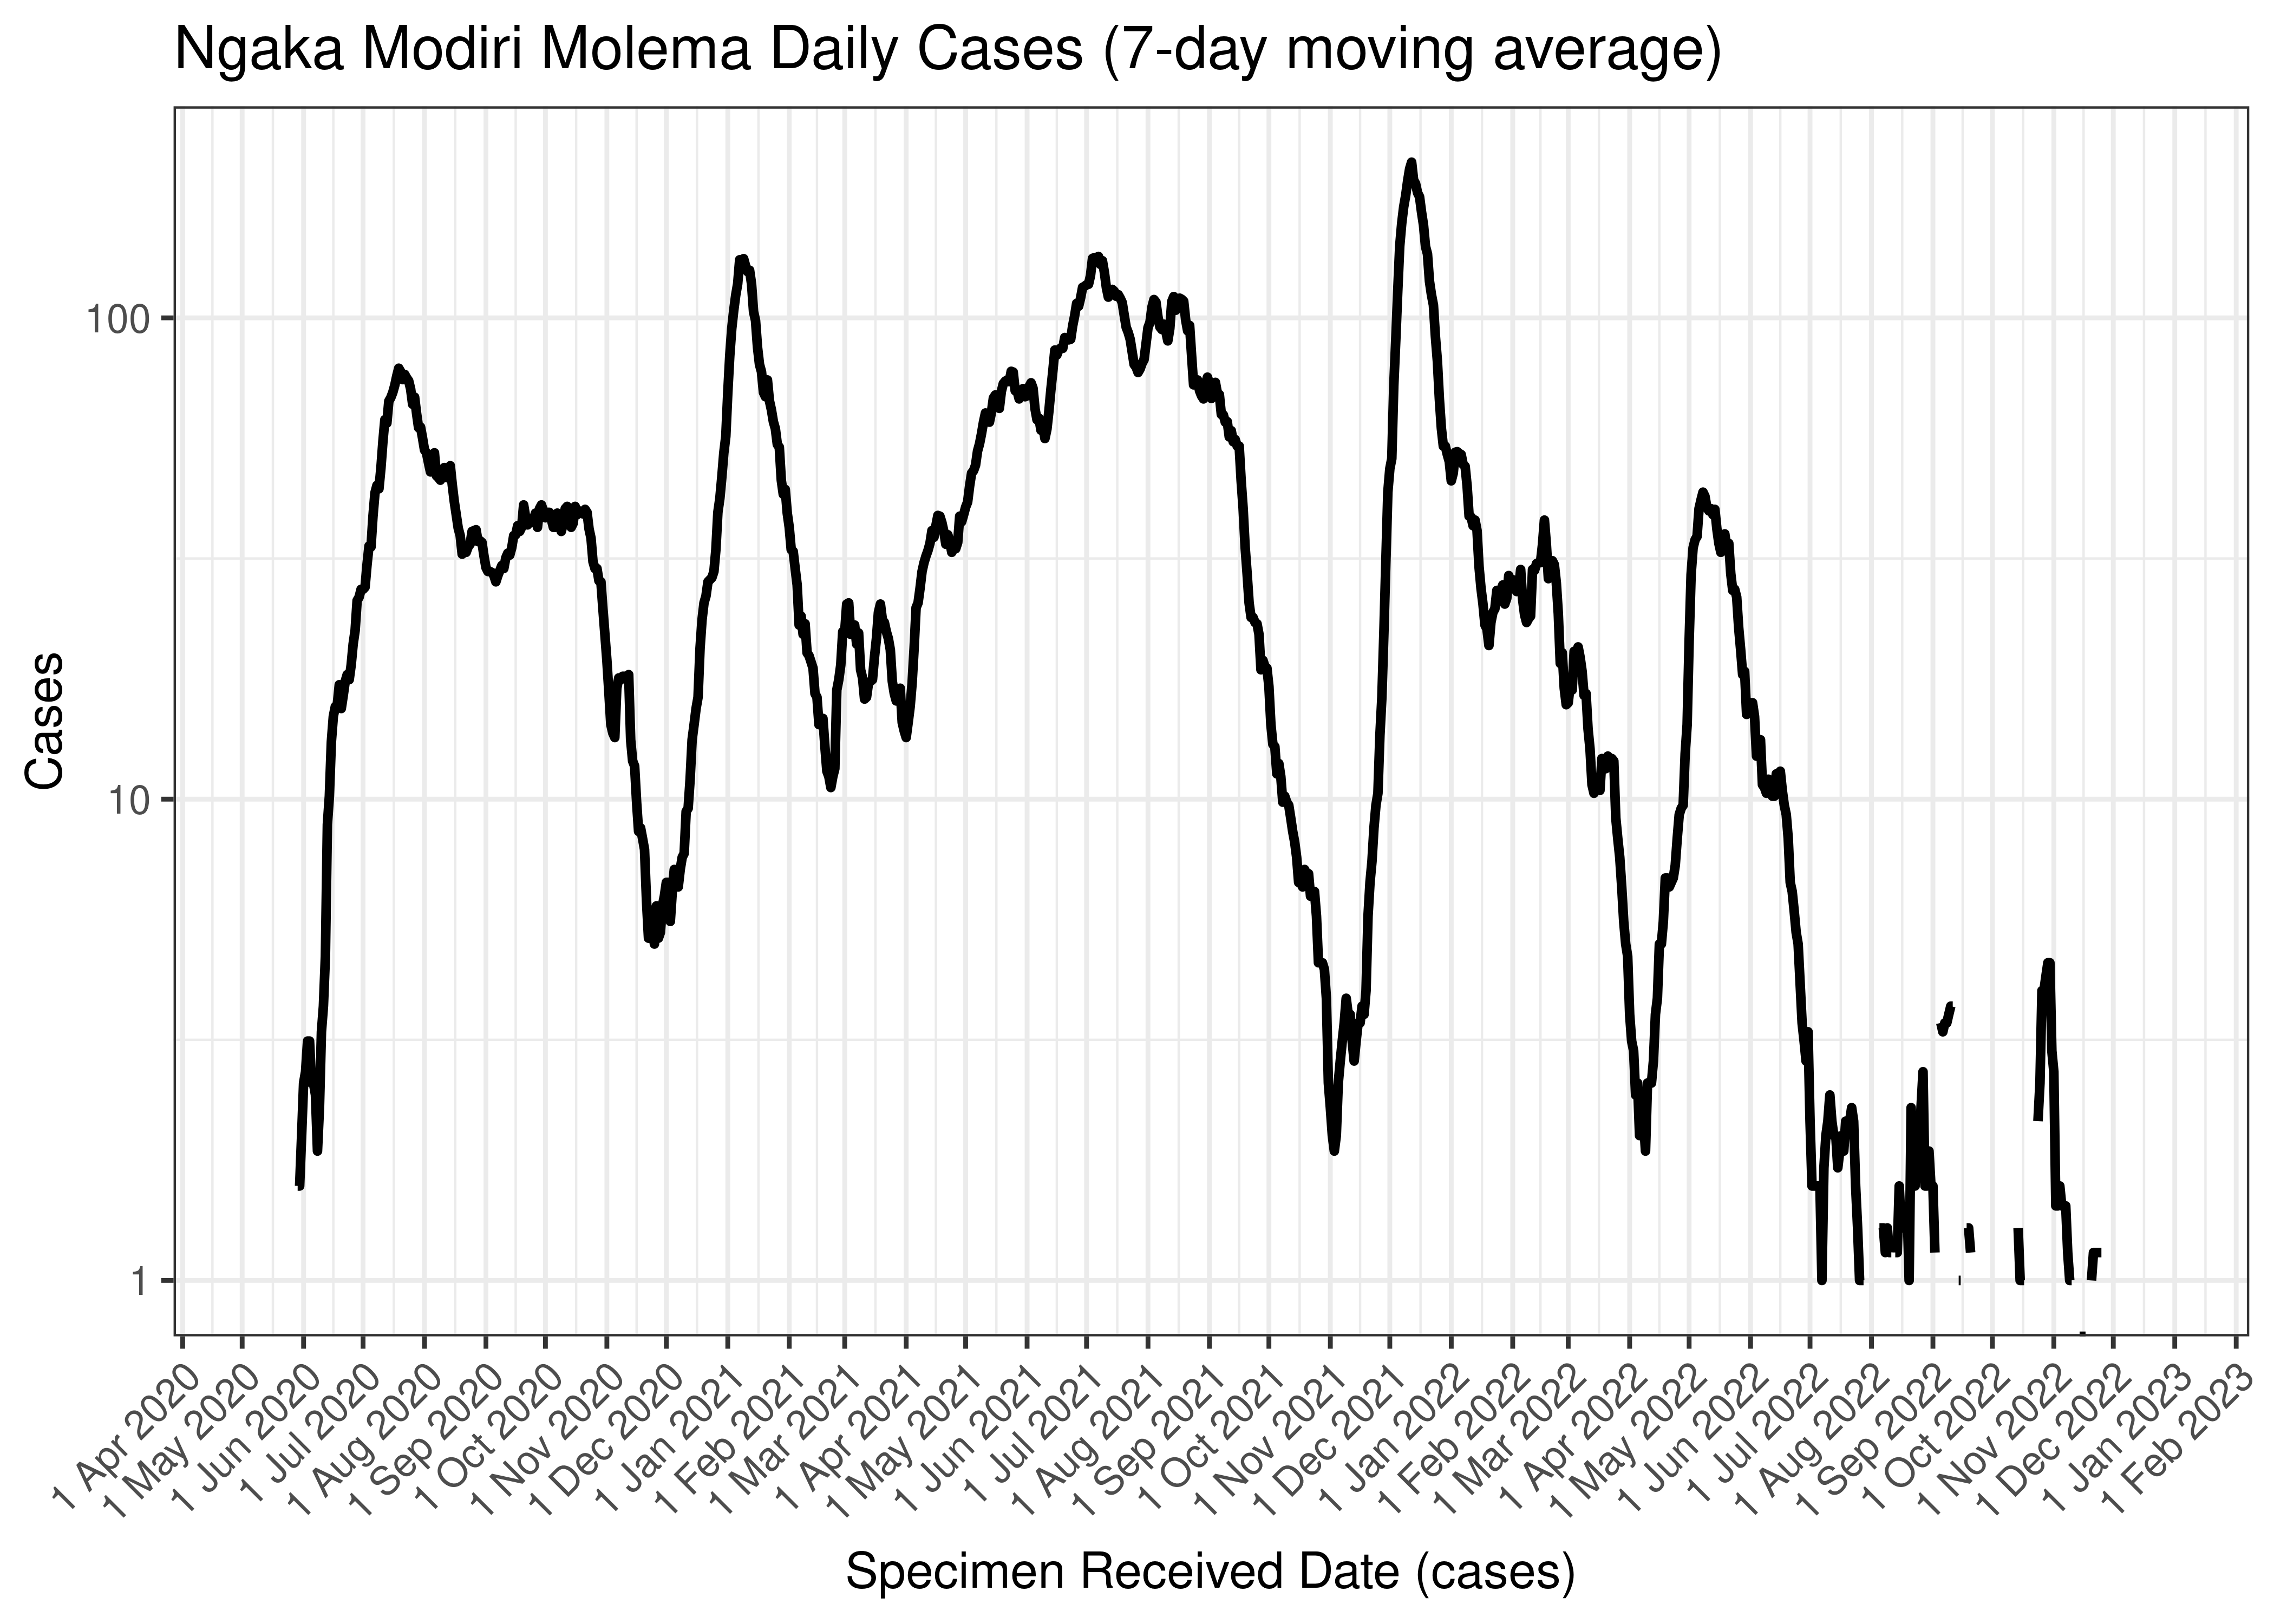
Ngaka Modiri Molema Daily Cases (7-day moving average)
Below the above chart is repeated for the last 30-days:
Ngaka Modiri Molema Daily Cases for Last 30-days (7-day moving average)
6.8.11.2 Reproduction Number
Below current (last weekly) reproduction number estimates are tabulated for Ngaka Modiri Molema.
| Count (Per Day) | Week Ending | Reproduction Number [95% Confidence Interval] | |
|---|---|---|---|
| Ngaka Modiri Molema | 0.4 | 2022-12-25 | 1.11 [0.30 - 2.42] |
Below the effective reproduction number for Ngaka Modiri Molema over the last 90 days are plotted together with a plot since start of the pandemic.
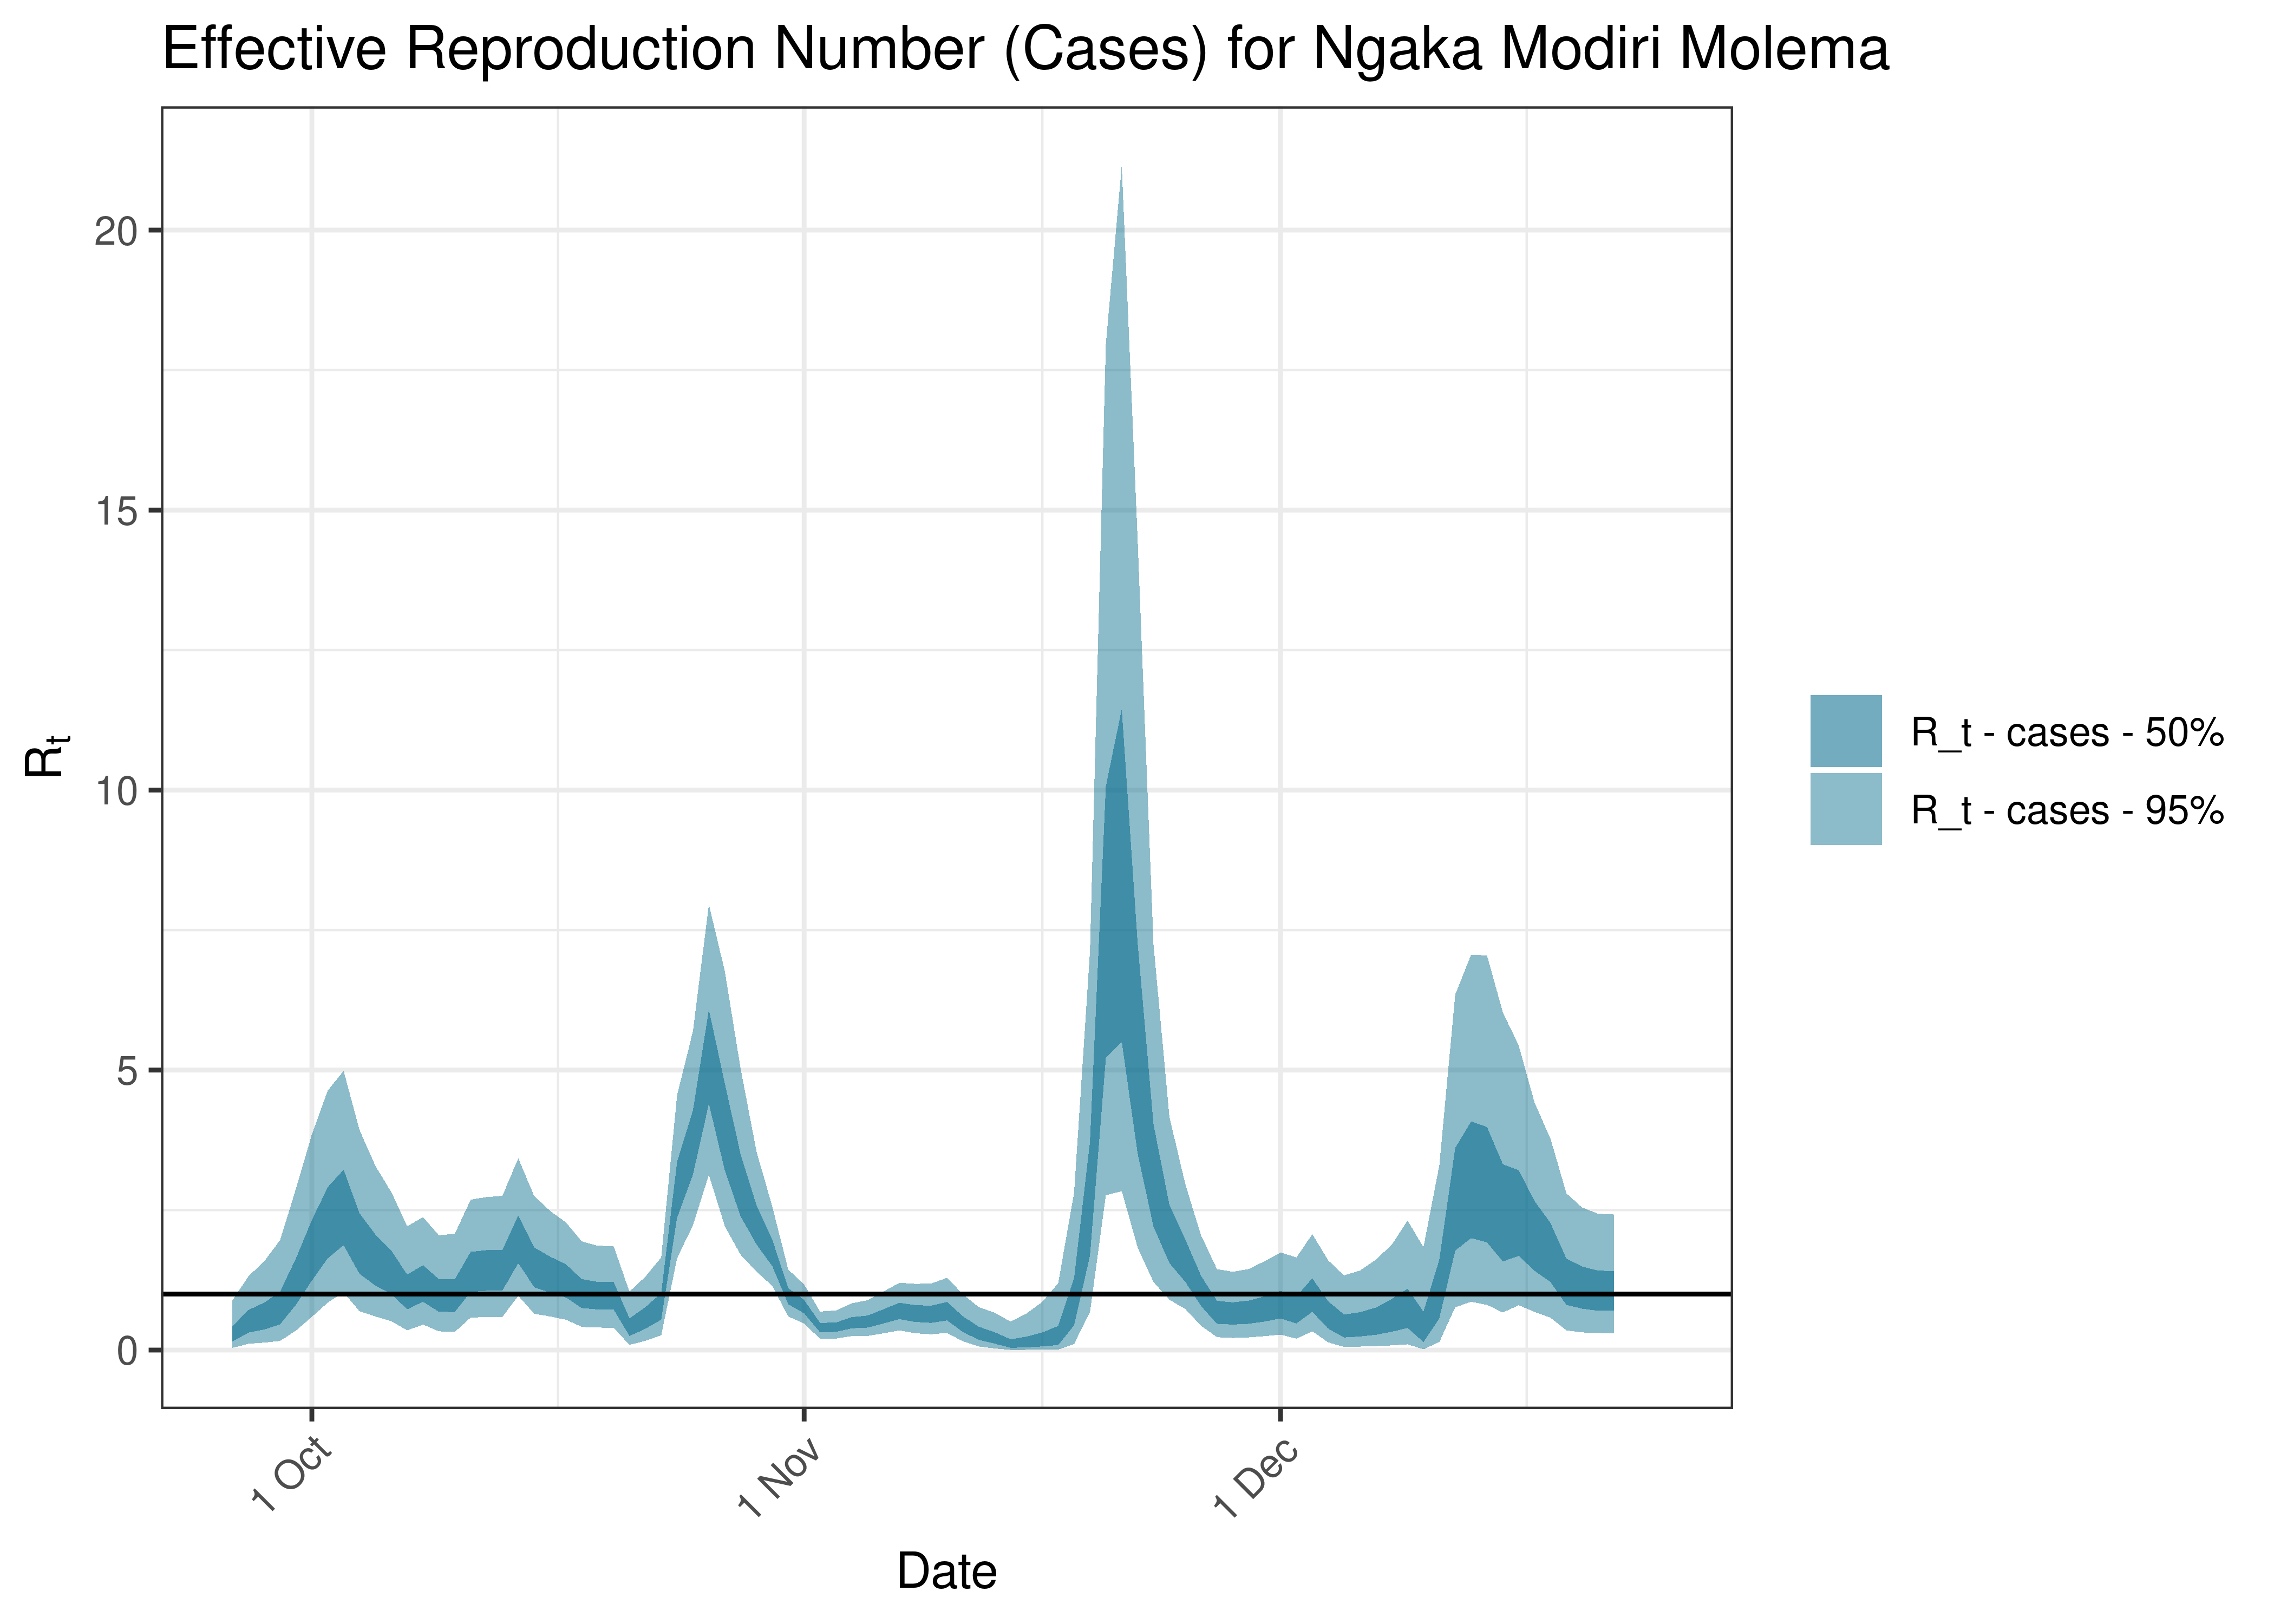
Estimated Effective Reproduction Number Based on Cases for Ngaka Modiri Molema over last 90 days
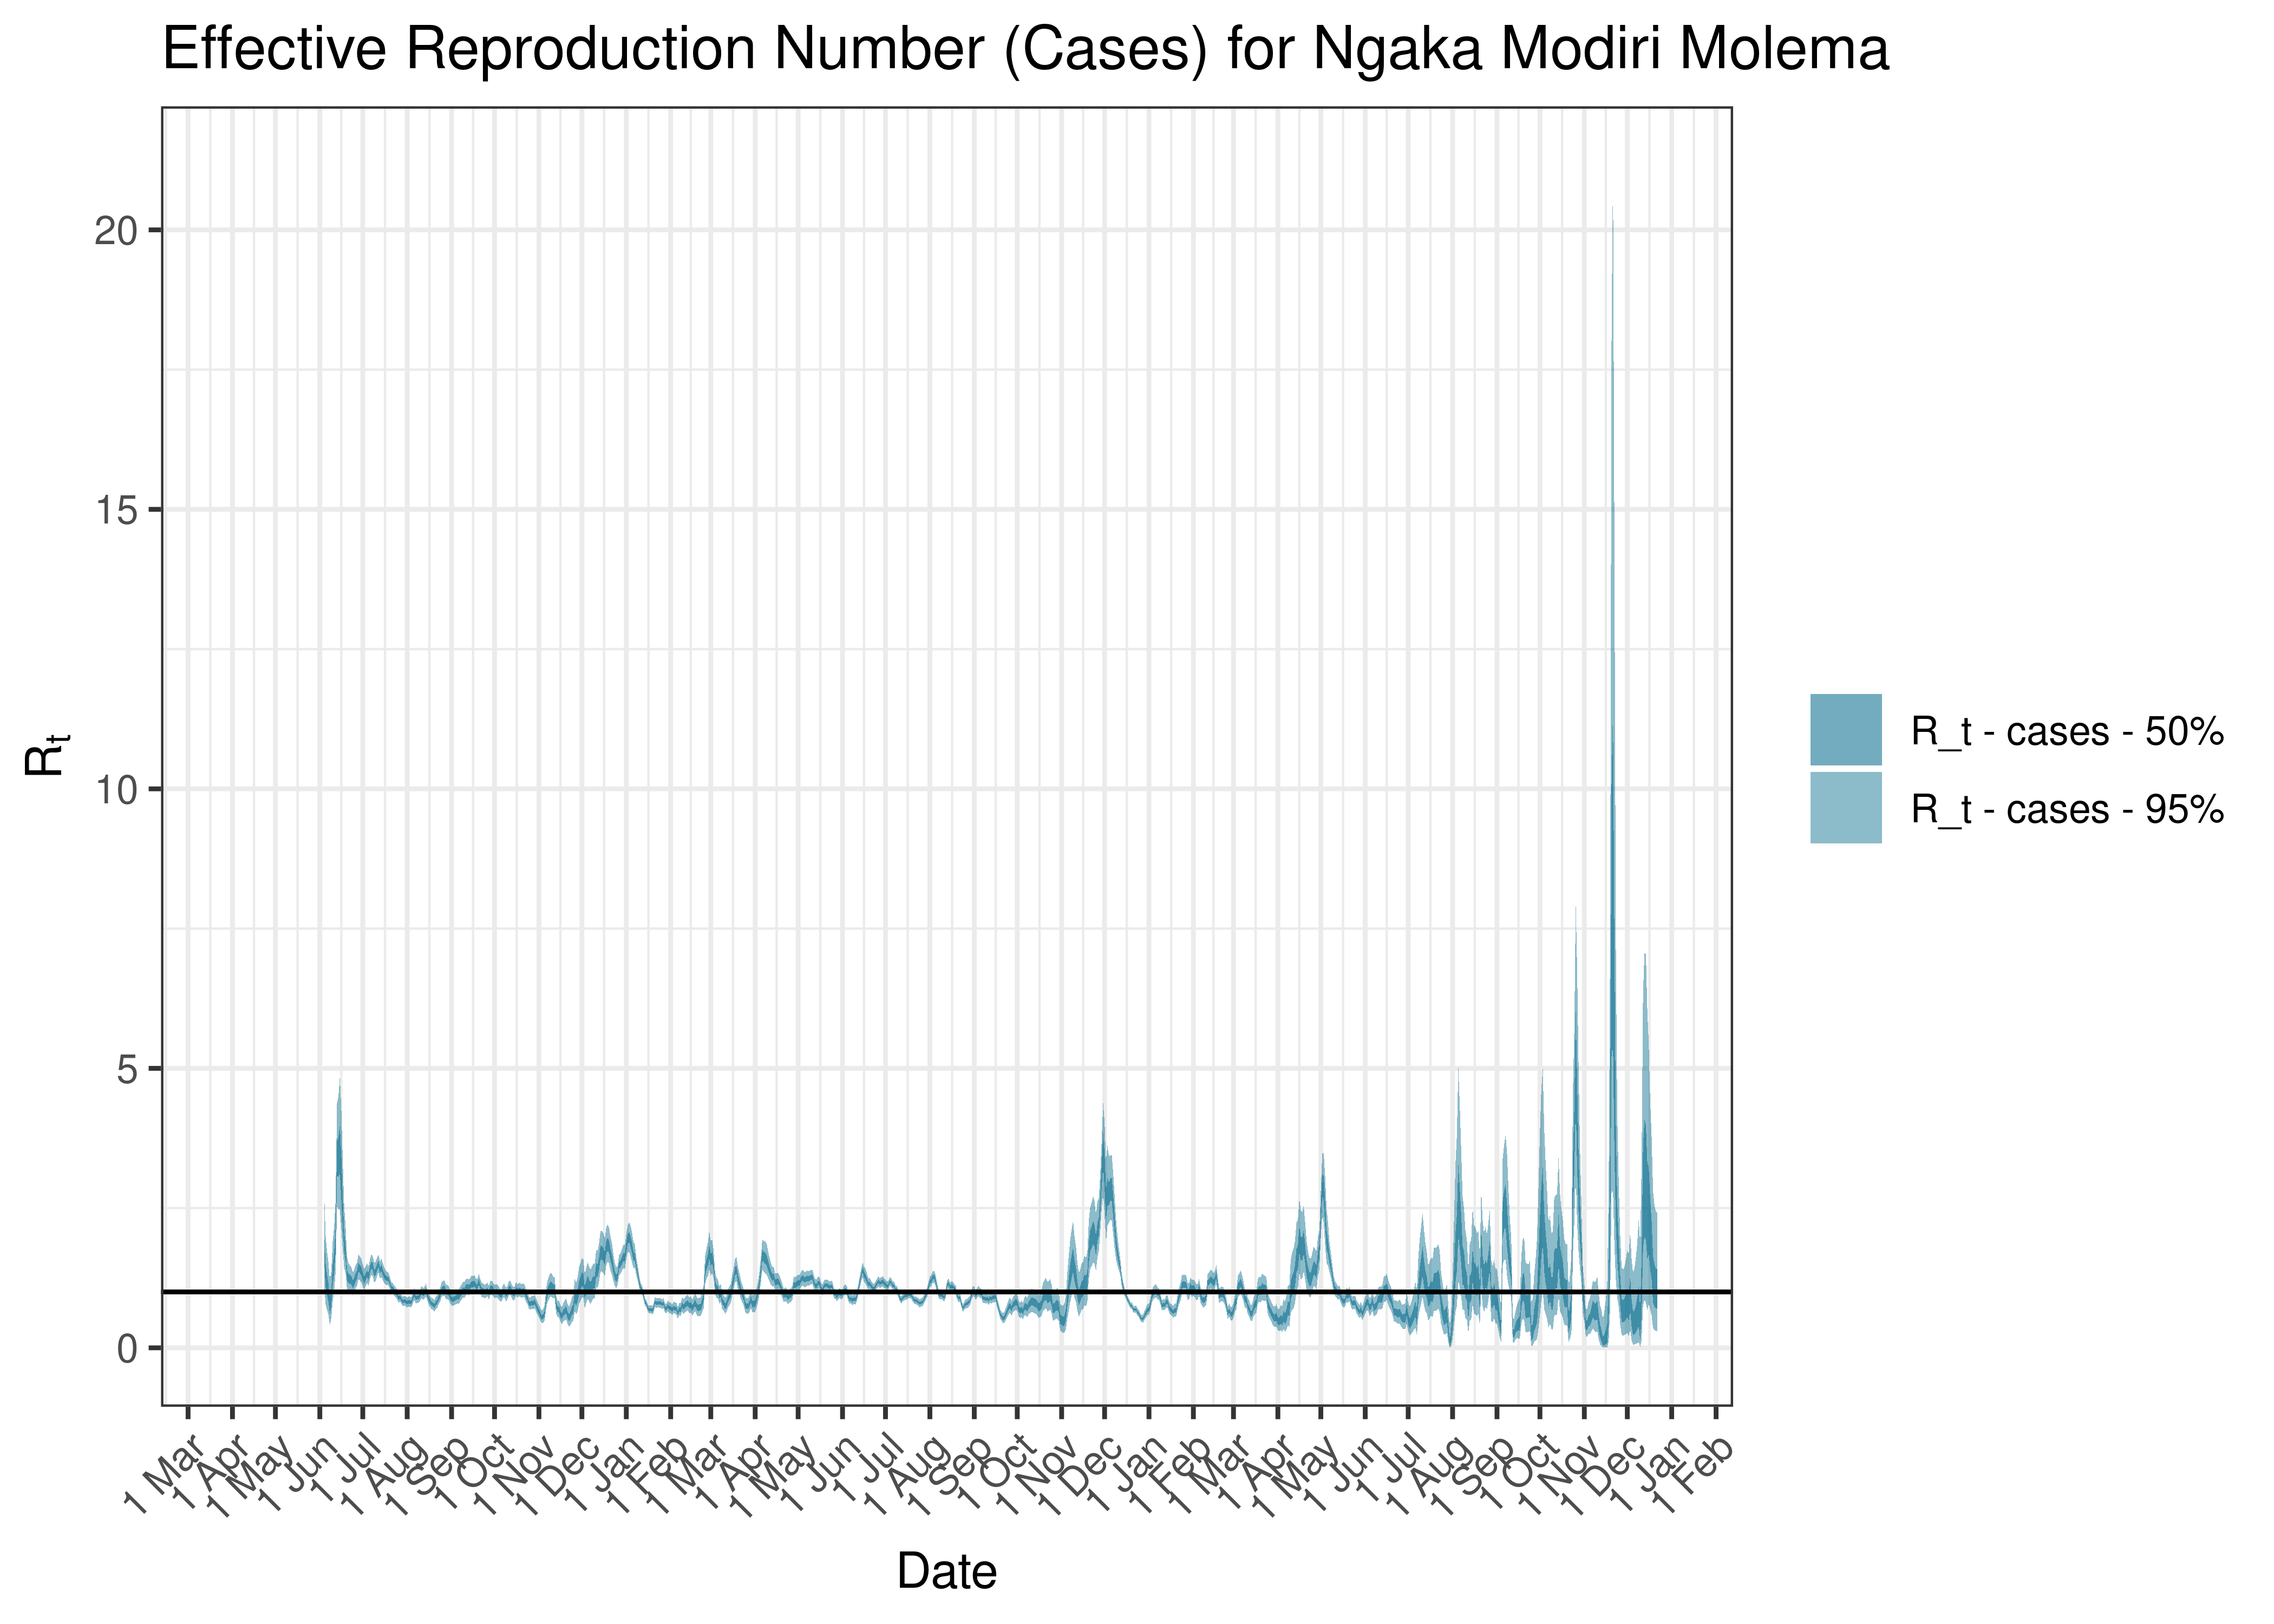
Estimated Effective Reproduction Number Based on Cases for Ngaka Modiri Molema since 1 April 2020
6.9 Northern Cape
6.9.1 Cases
Cases are tabulated by specimen received date below. Cases include estimates for late reporting in recent days as well as adjustments for any public holidays. A centred 7-day moving average is also shown. The peak daily cases in previous waves (as measured by the moving average) is also shown.
| Specimen Received Date | Cases | 7-day Moving Average | Comment |
|---|---|---|---|
| 2020-08-10 | 532 | 243 | Wave 1 Peak |
| 2021-01-08 | 411 | 287 | Wave 2 Peak |
| 2021-08-14 | 482 | 571 | Wave 3 Peak |
| 2021-12-17 | 543 | 512 | Wave 4 Peak |
| 2022-05-18 | 301 | 204 | Wave 5 Peak (to date) |
Below a 7-day moving average daily case count is plotted for Northern Cape on a log scale since start of the epidemic:
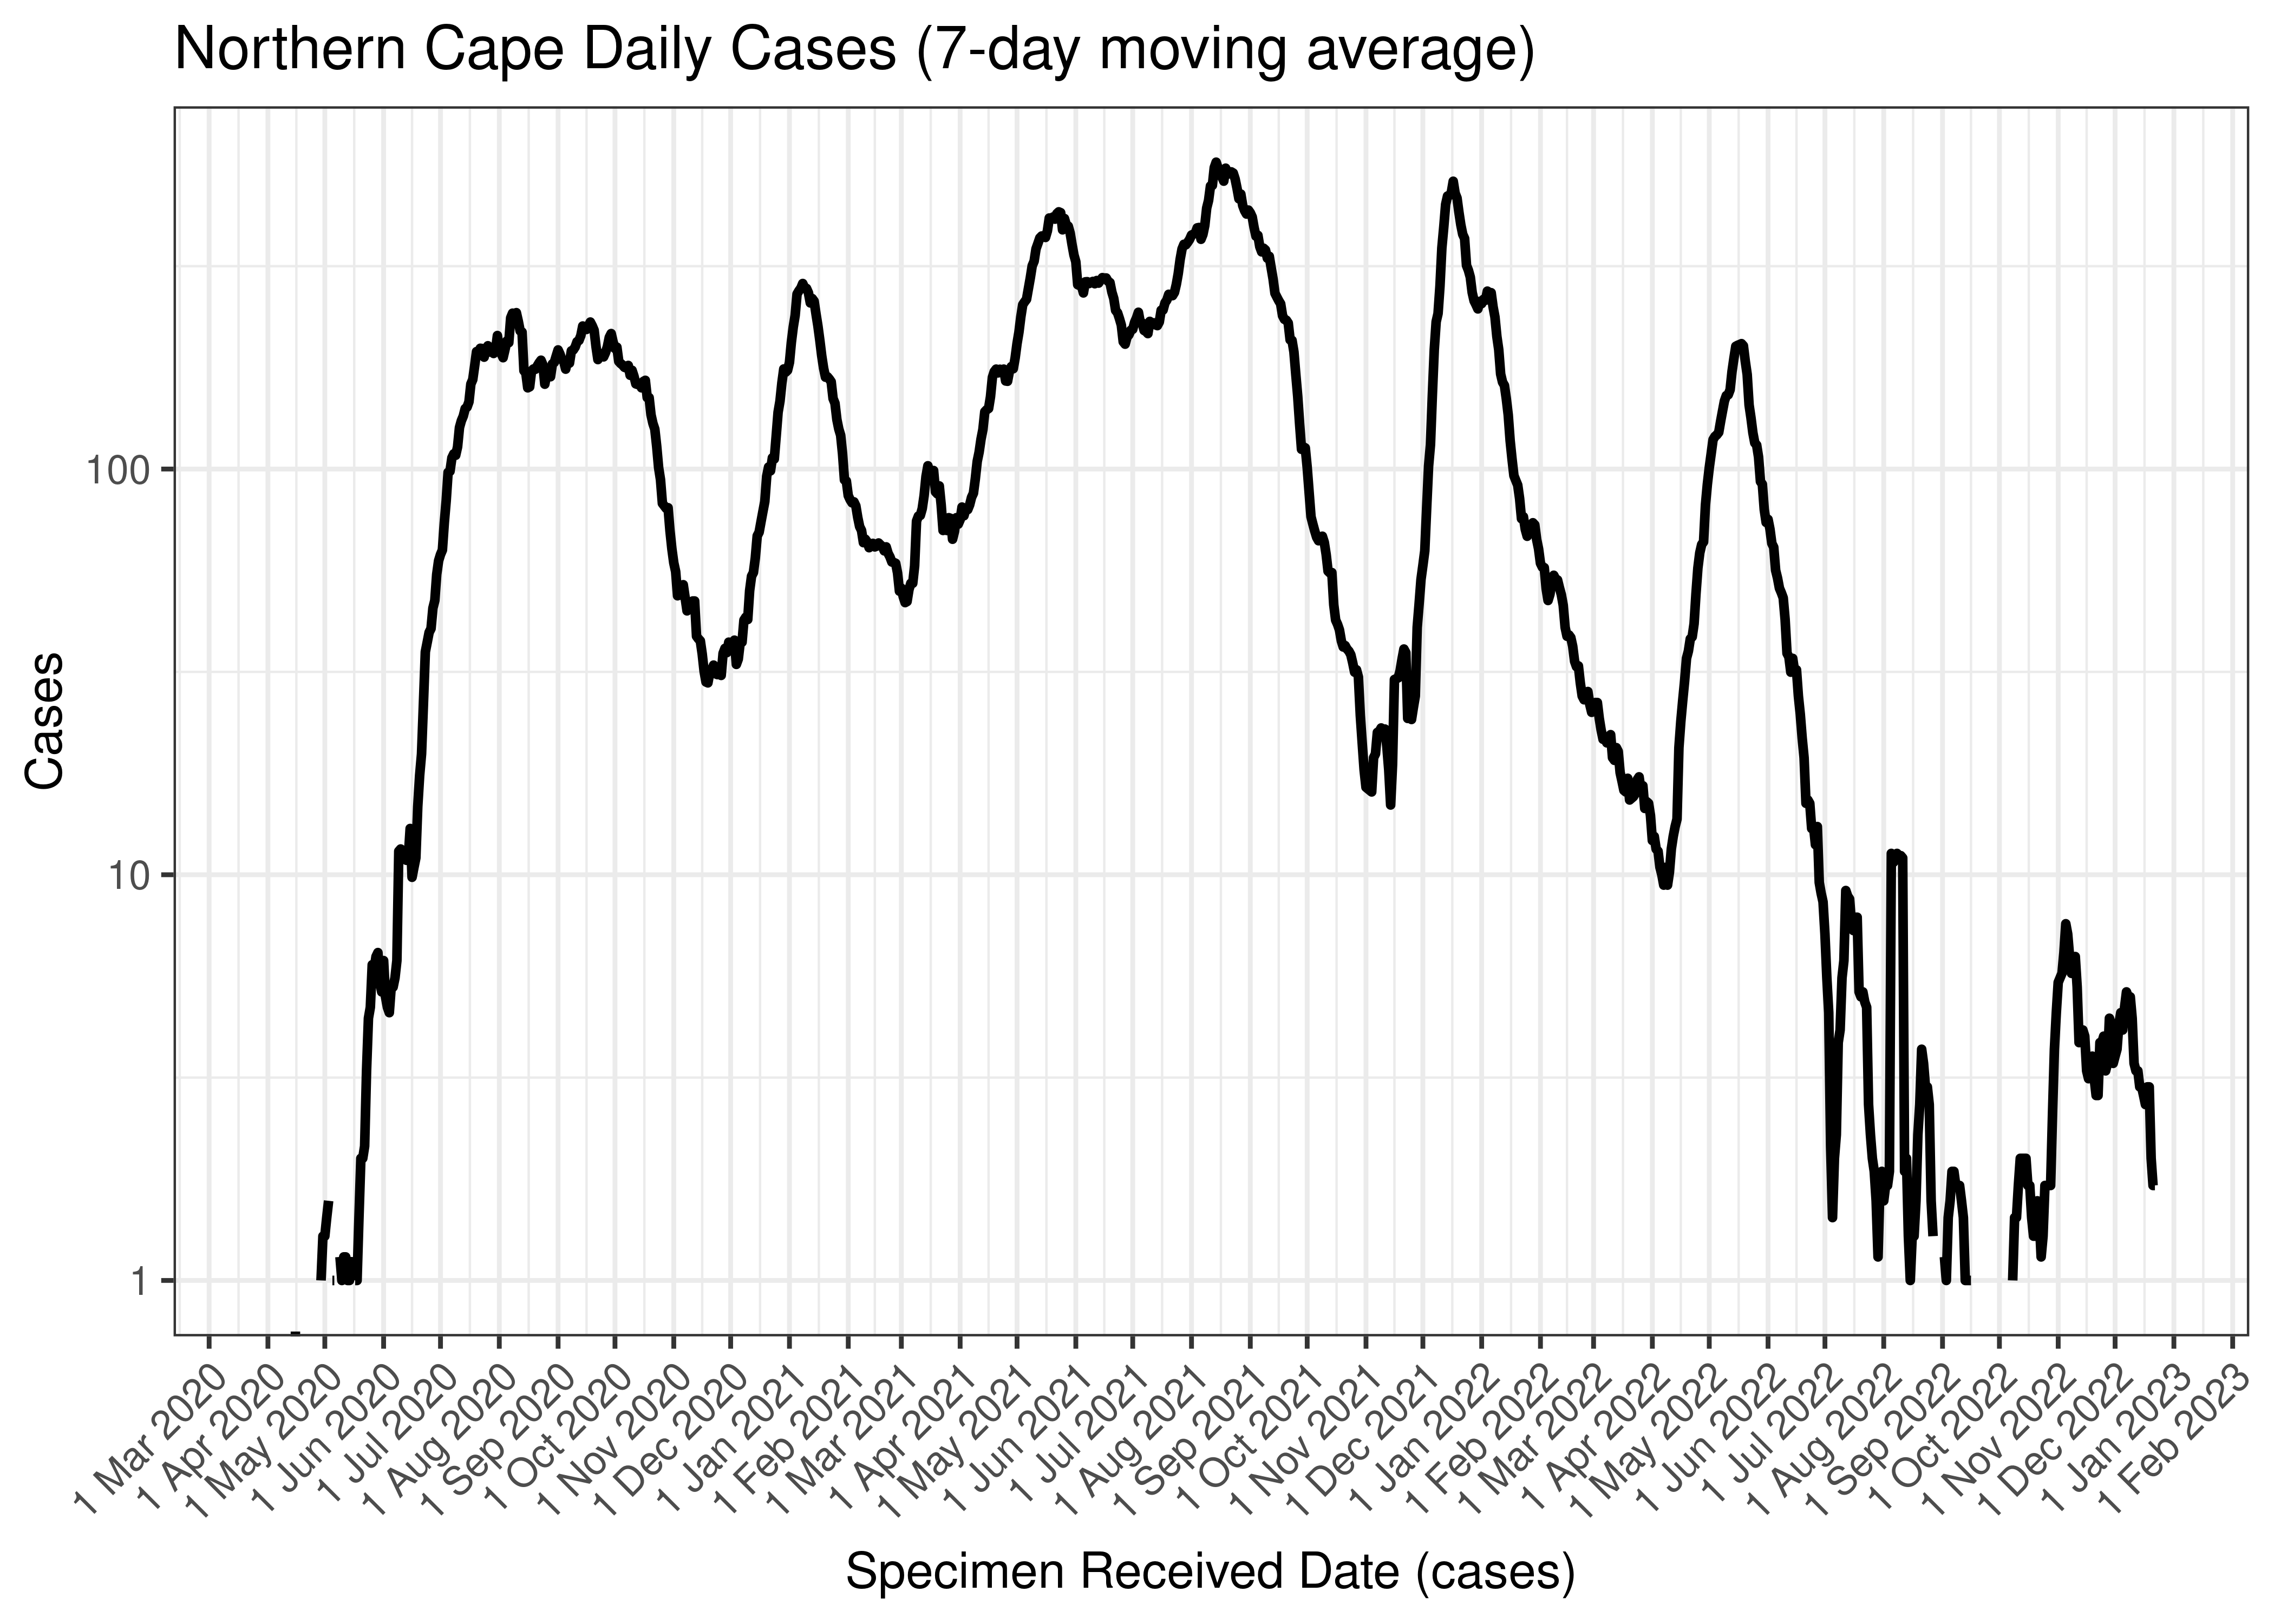
Northern Cape Daily Cases (7-day moving average)
Below the above chart is repeated for the last 30-days:

Northern Cape Daily Cases for Last 30-days (7-day moving average)
Below a 7-day moving average daily case count is plotted for Northern Cape by district municipality on a log scale since start of the epidemic:
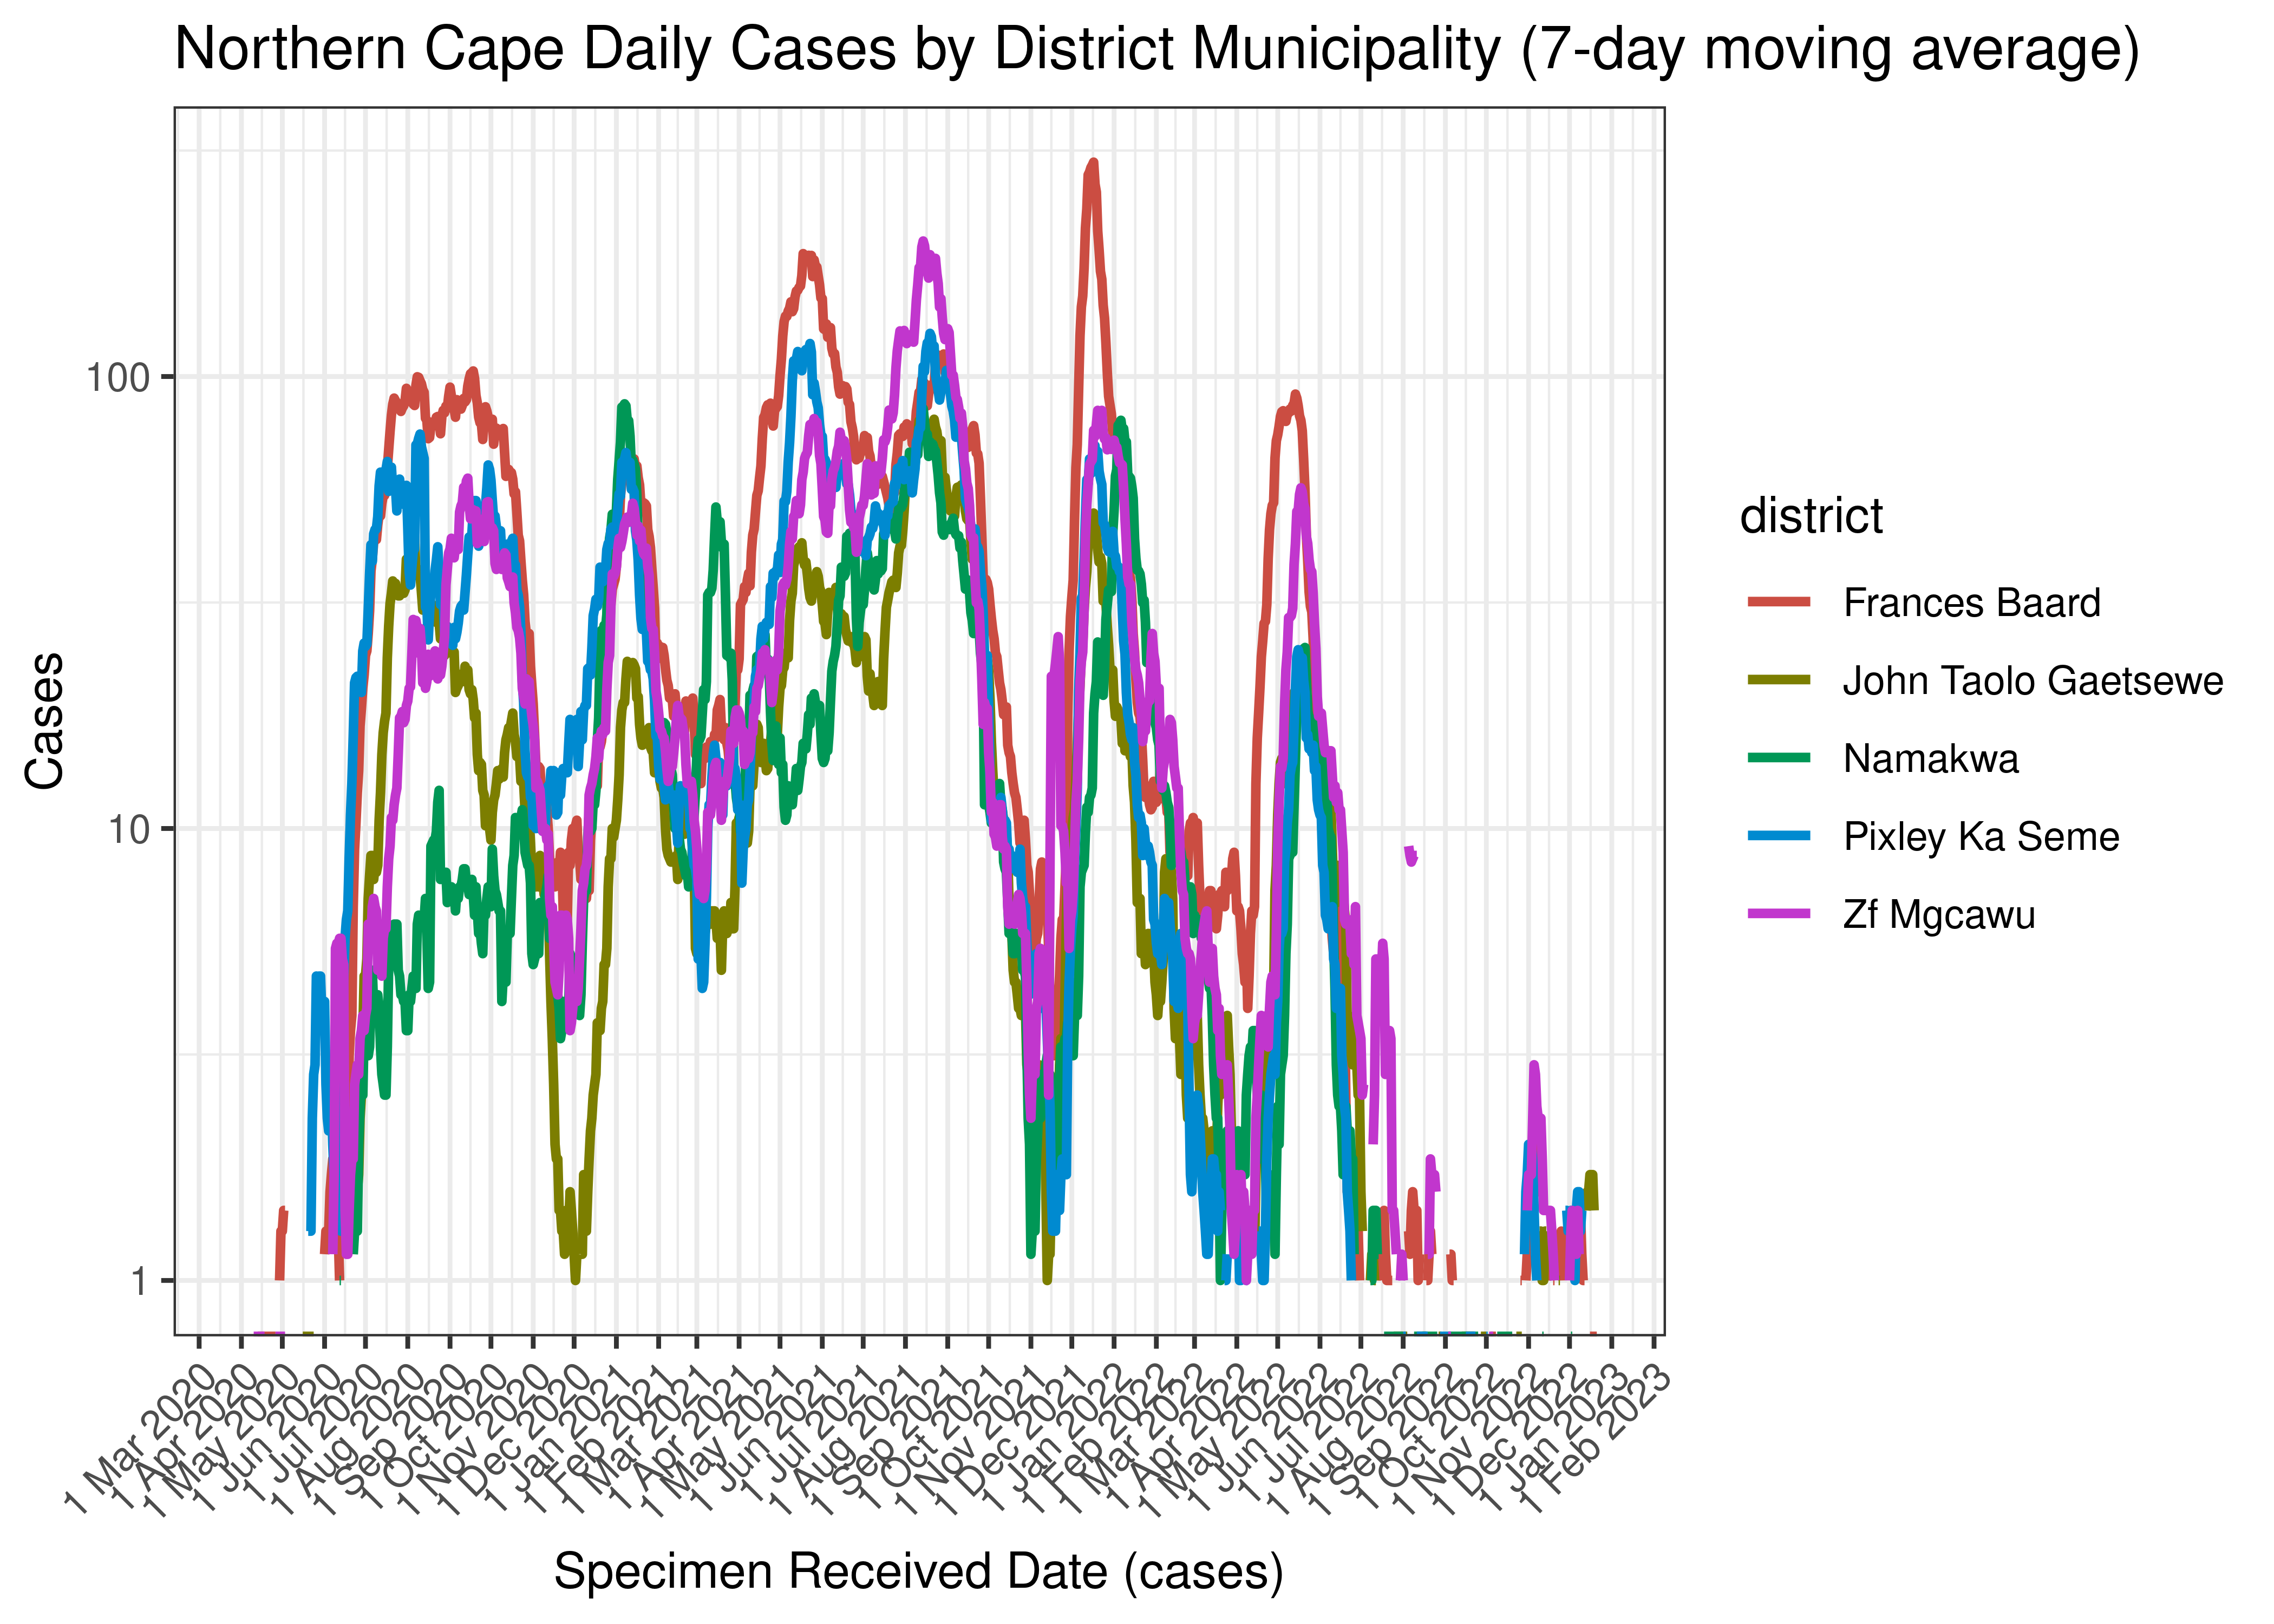
Northern Cape Daily Cases by District Municipality (7-day moving average)
Below the above chart is repeated for the last 30-days:

Northern Cape Daily Cases for Last 30-days by District Municipality (7-day moving average)
6.9.2 Hospital Admissions
Hospital admissions are tabulated by reported date below. The peak daily admissions in previous waves (as measured by the moving average) is also shown.
| Reported Date | Hospital Admissions | 7-day Moving Average | Comment |
|---|---|---|---|
| 2020-08-23 | 3 | 25 | Wave 1 Peak |
| 2021-01-26 | 28 | 49 | Wave 2 Peak |
| 2021-07-15 | 73 | 70 | Wave 3 Peak |
| 2022-01-07 | 32 | 38 | Wave 4 Peak |
| 2022-05-20 | 21 | 14 | Wave 5 Peak (to date) |
| 2022-12-16 | 0 | 1 | |
| 2022-12-17 | 1 | 1 | |
| 2022-12-18 | 1 | 0 | |
| 2022-12-19 | 1 | 0 | |
| 2022-12-20 | 0 | 1 | |
| 2022-12-21 | 0 | NA | |
| 2022-12-22 | 0 | NA | |
| 2022-12-23 | 1 | NA |
Below a 7-day moving average daily hospital admissions count is plotted for Northern Cape on a log scale since start of the epidemic:
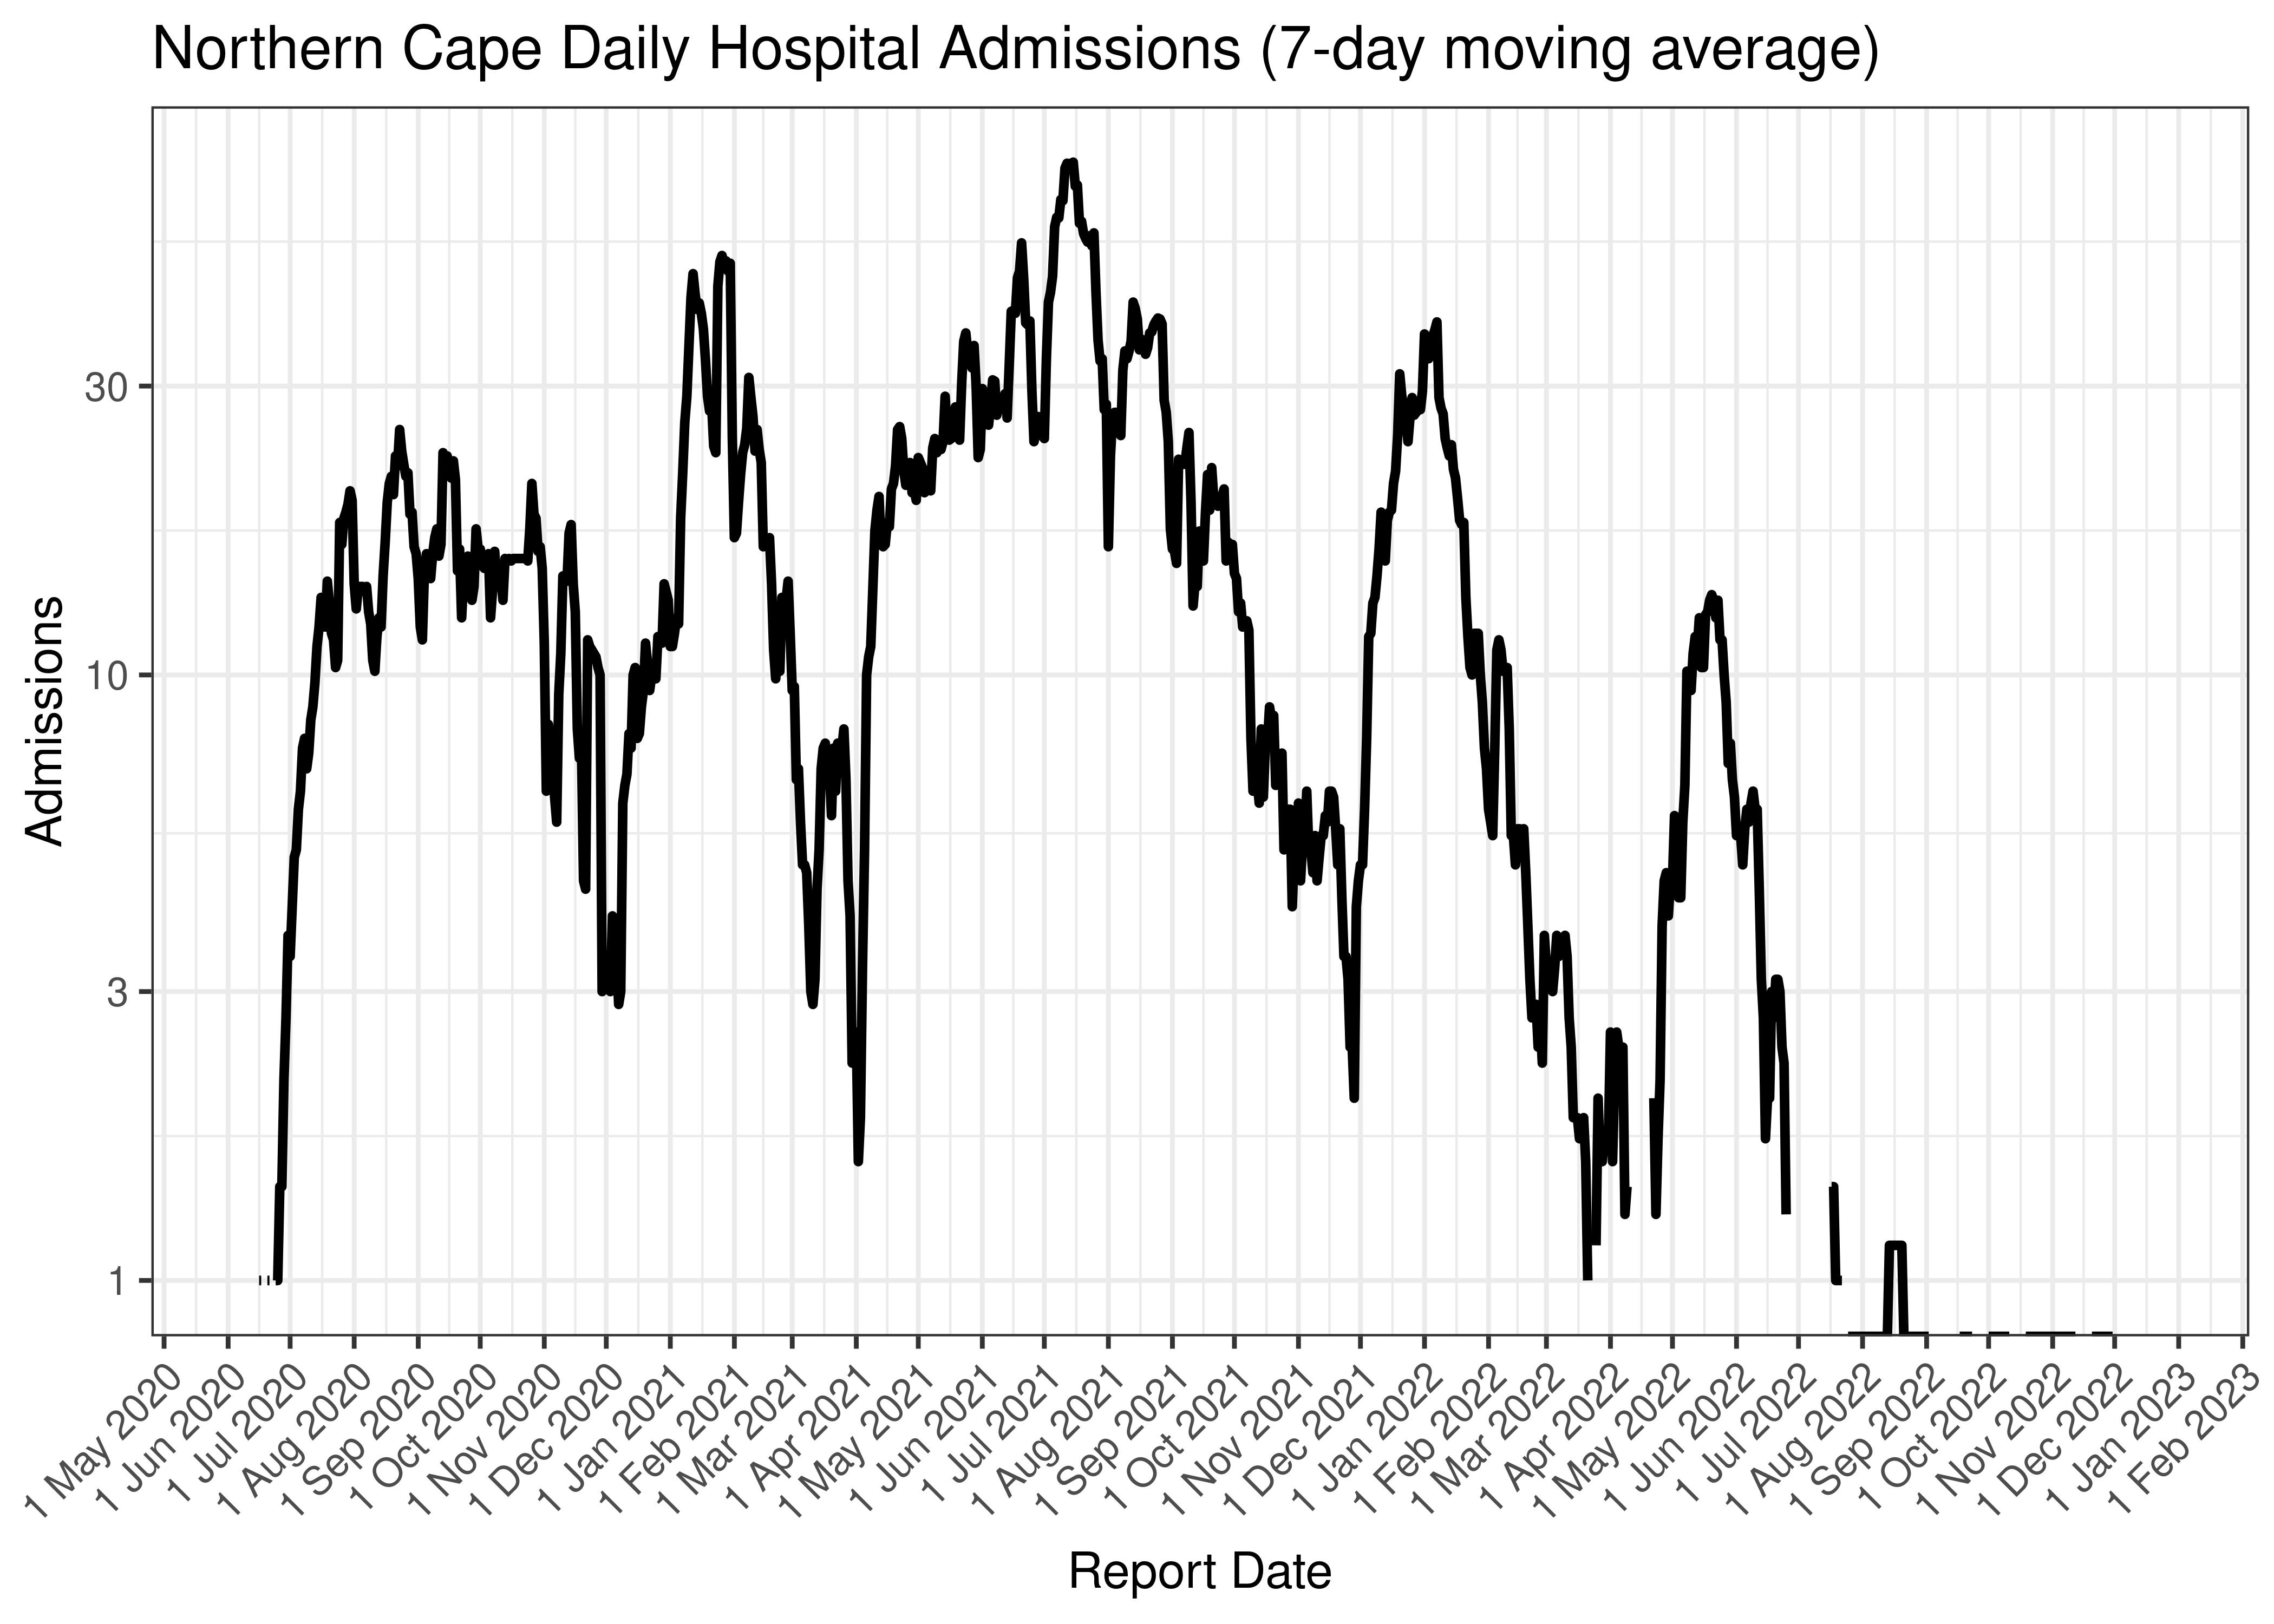
Northern Cape Daily Hospital Admissions (7-day moving average)
Below the above chart is repeated for the last 30-days:
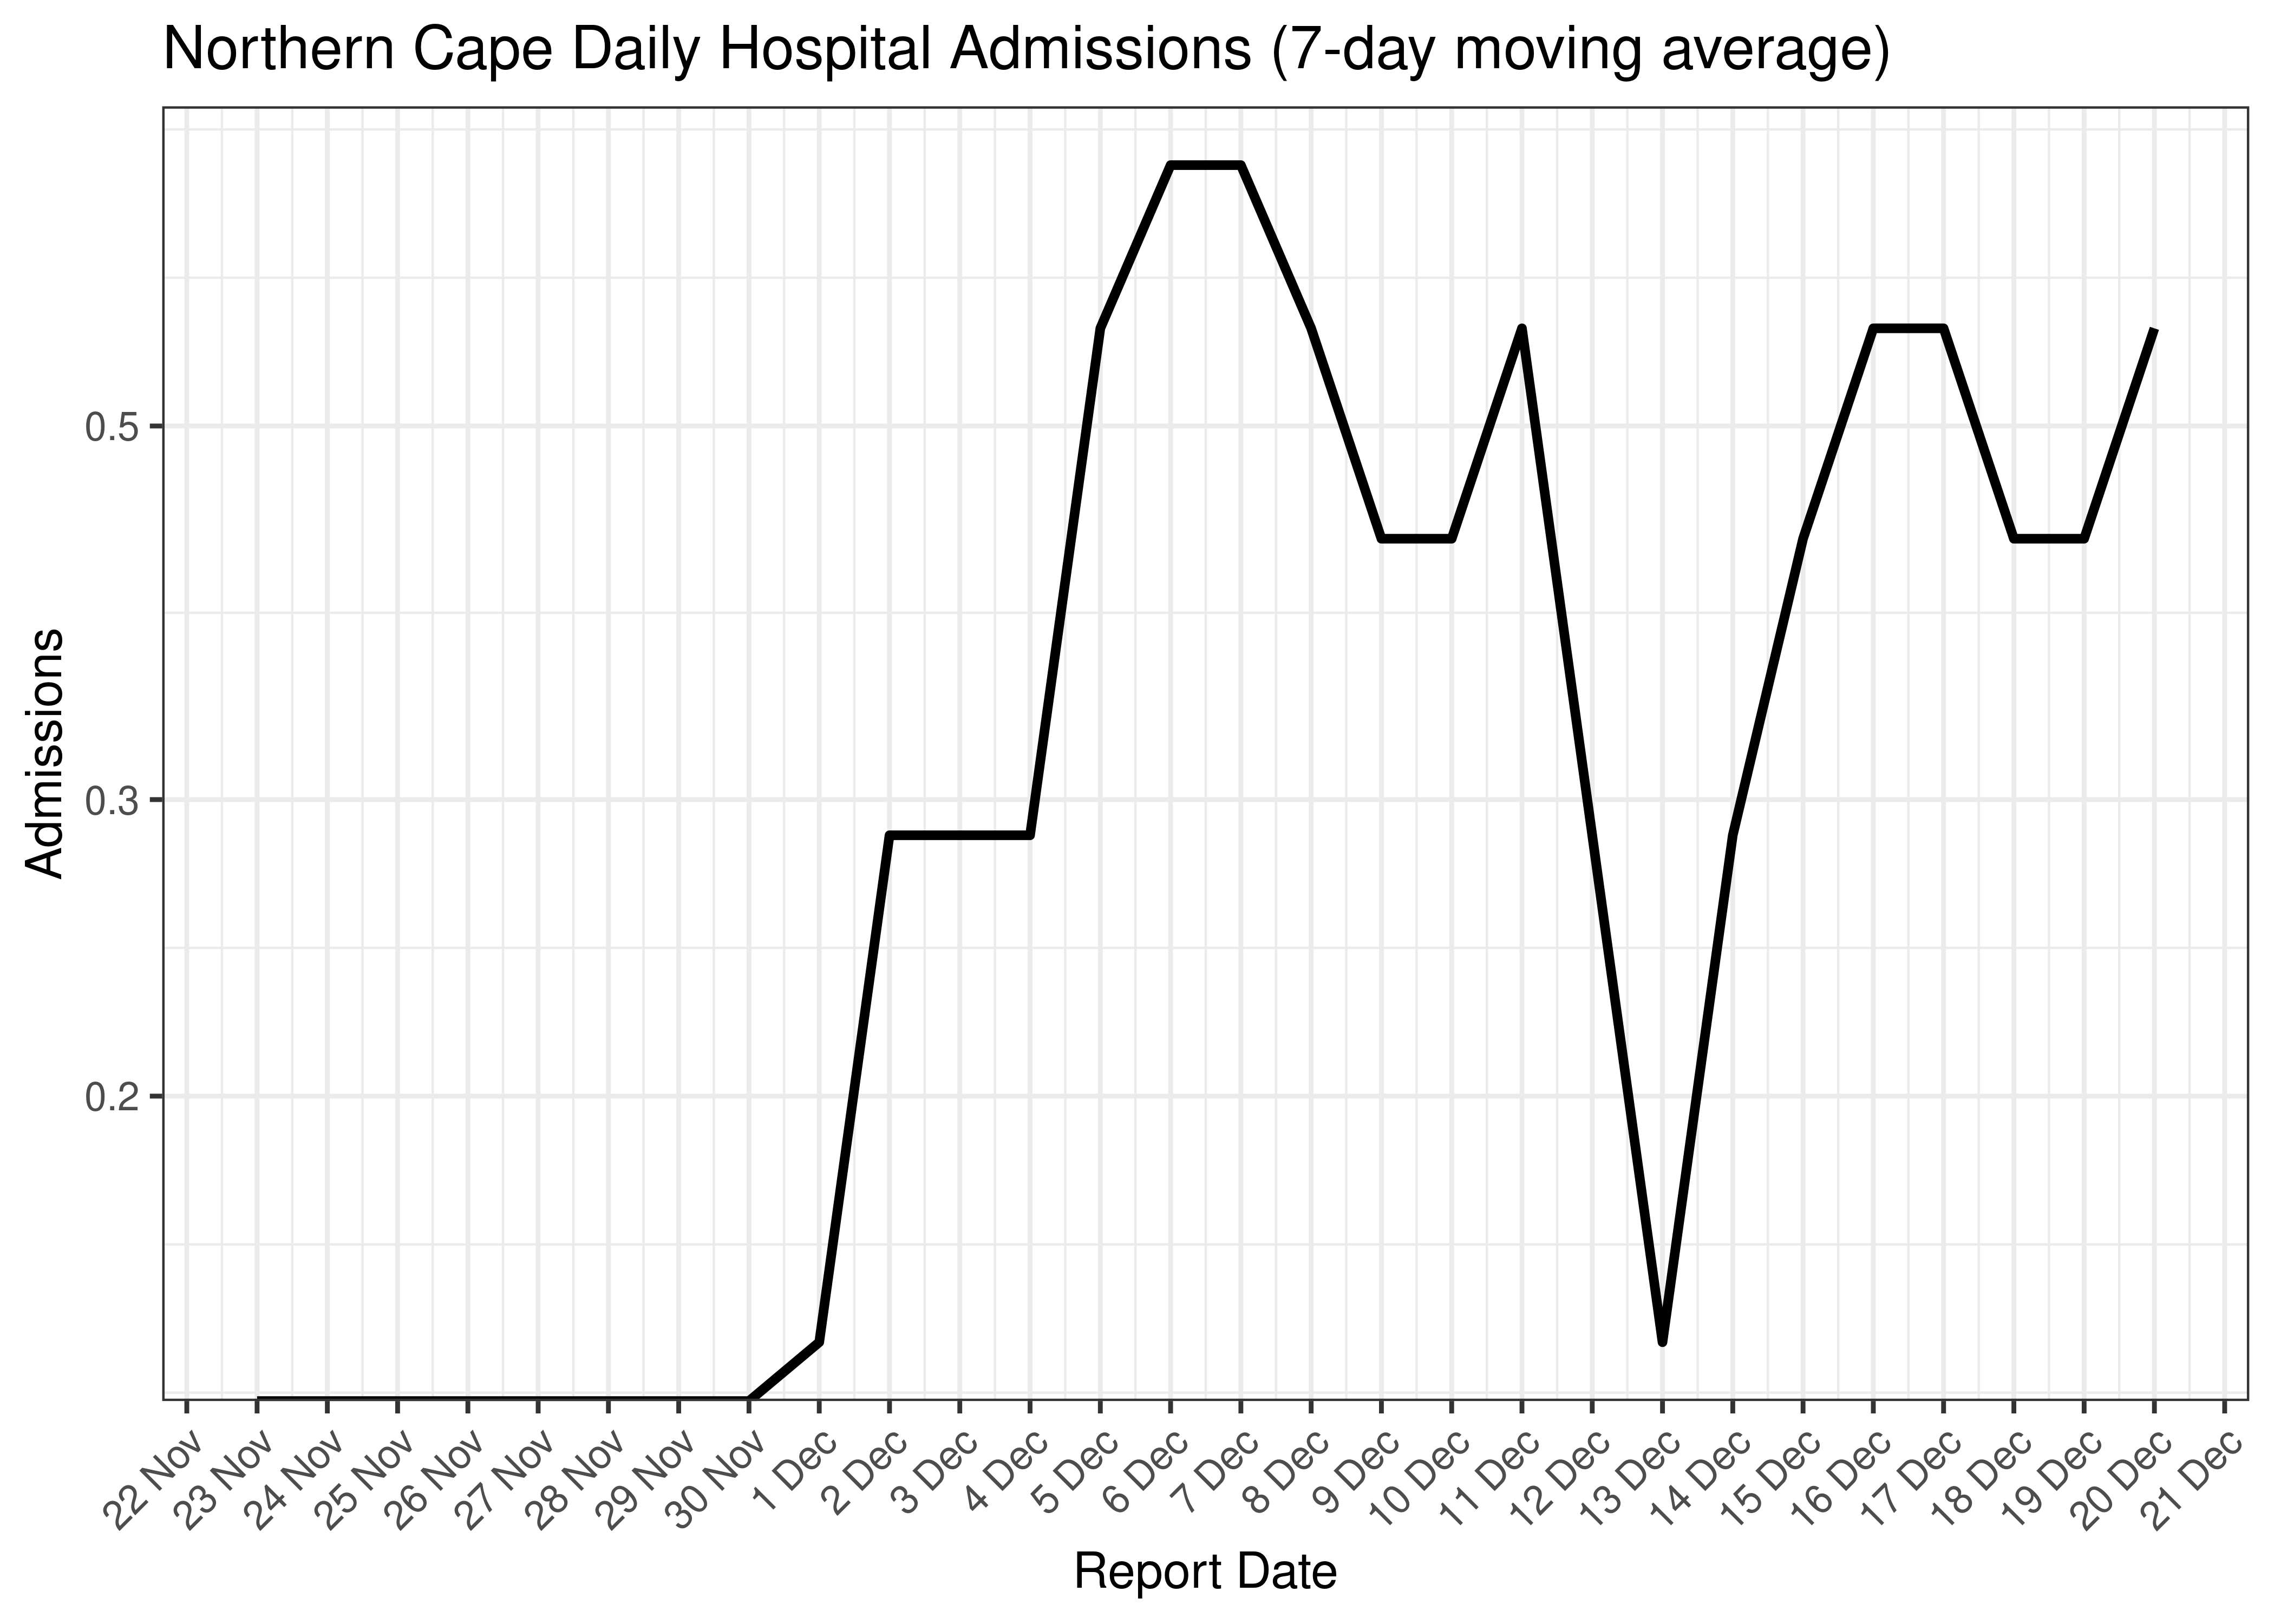
Northern Cape Daily Hospital Admissions for Last 30-days (7-day moving average)
6.9.3 Hospital Deaths
Hospital deaths are tabulated by reported date below. The peak daily deaths in previous waves (as measured by the moving average) is also shown.
Note that hospital deaths underestimates total COVID-19 deaths in South Africa.
| Reported Date | Hospital Deaths | 7-day Moving Average | Comment |
|---|---|---|---|
| 2020-08-27 | 2 | 5 | Wave 1 Peak |
| 2021-01-17 | 0 | 9 | Wave 2 Peak |
| 2021-07-11 | 1 | 19 | Wave 3 Peak |
| 2021-12-31 | 4 | 4 | Wave 4 Peak |
| 2022-05-24 | 3 | 1 | Wave 5 Peak (to date) |
| 2022-05-25 | 0 | 1 | Wave 5 Peak (to date) |
| 2022-05-26 | 1 | 1 | Wave 5 Peak (to date) |
| 2022-05-27 | 3 | 1 | Wave 5 Peak (to date) |
| 2022-12-16 | 0 | 0 | |
| 2022-12-17 | 0 | 0 | |
| 2022-12-18 | 0 | 0 | |
| 2022-12-19 | 0 | 0 | |
| 2022-12-20 | 0 | 0 | |
| 2022-12-21 | 0 | NA | |
| 2022-12-22 | 0 | NA | |
| 2022-12-23 | 0 | NA |
Below a 7-day moving average daily hospital deaths count is plotted for Northern Cape on a log scale since start of the epidemic:
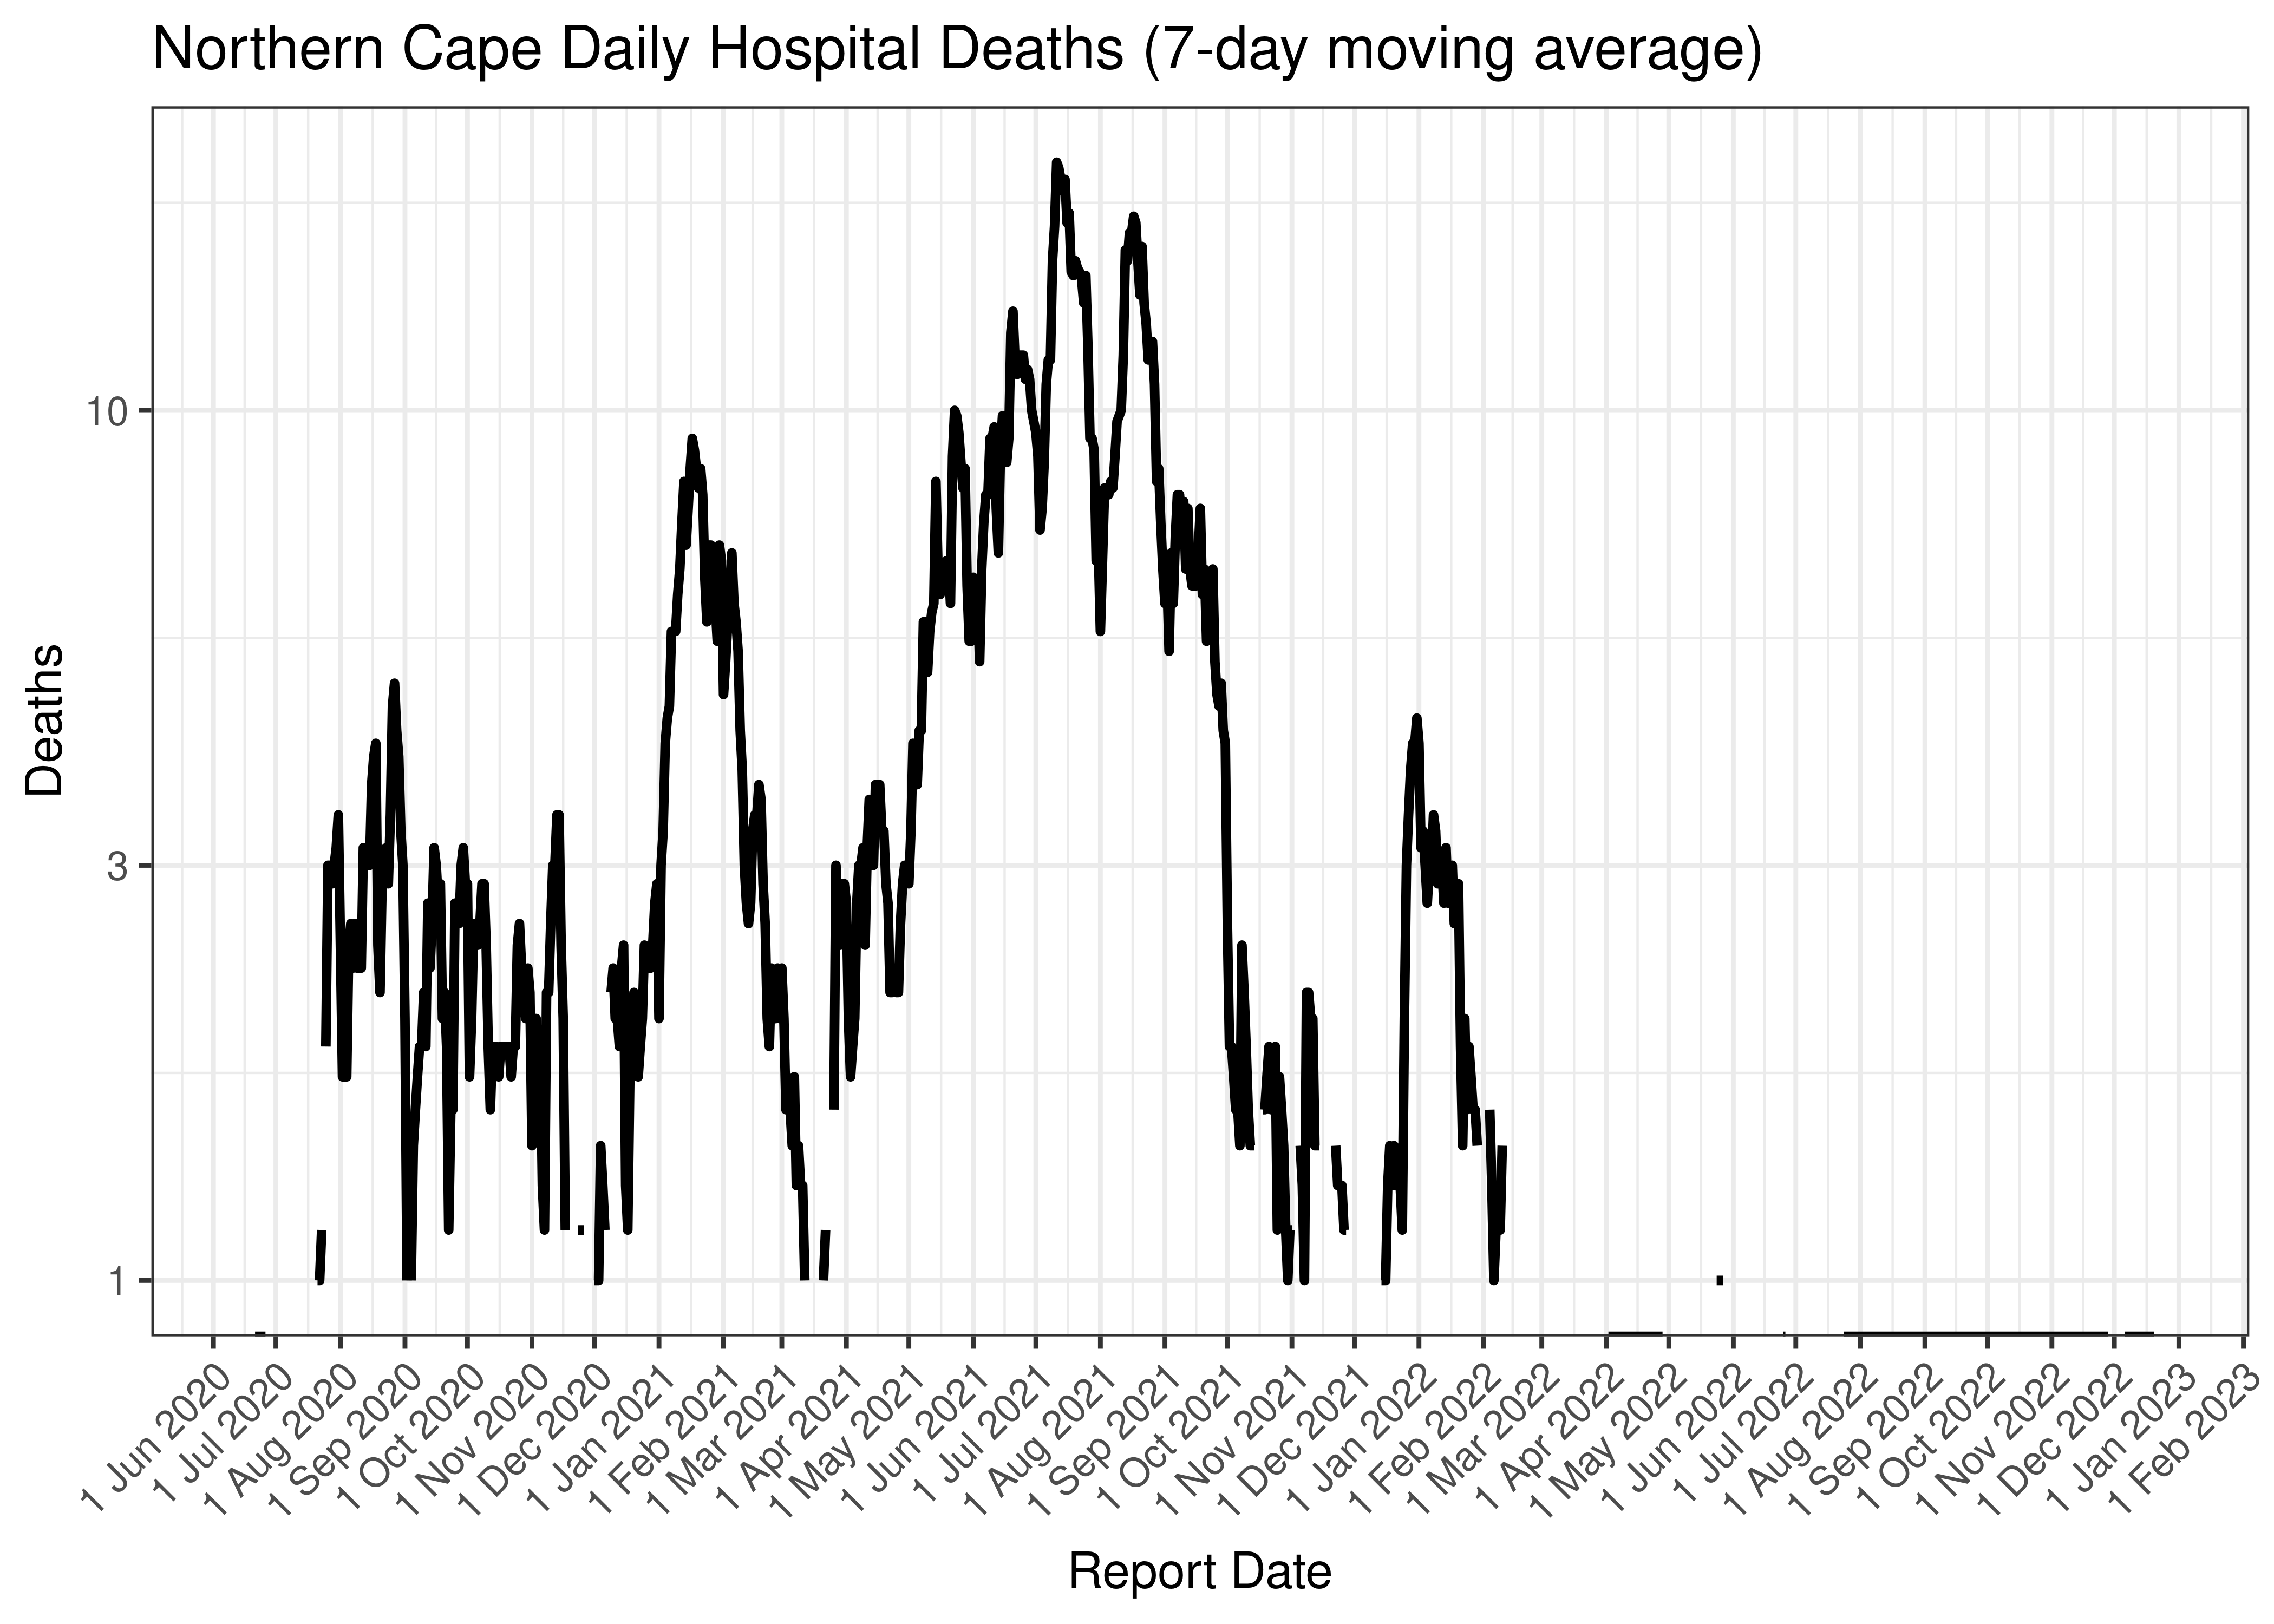
Northern Cape Daily Hospital Deaths (7-day moving average)
Below the above chart is repeated for the last 30-days:
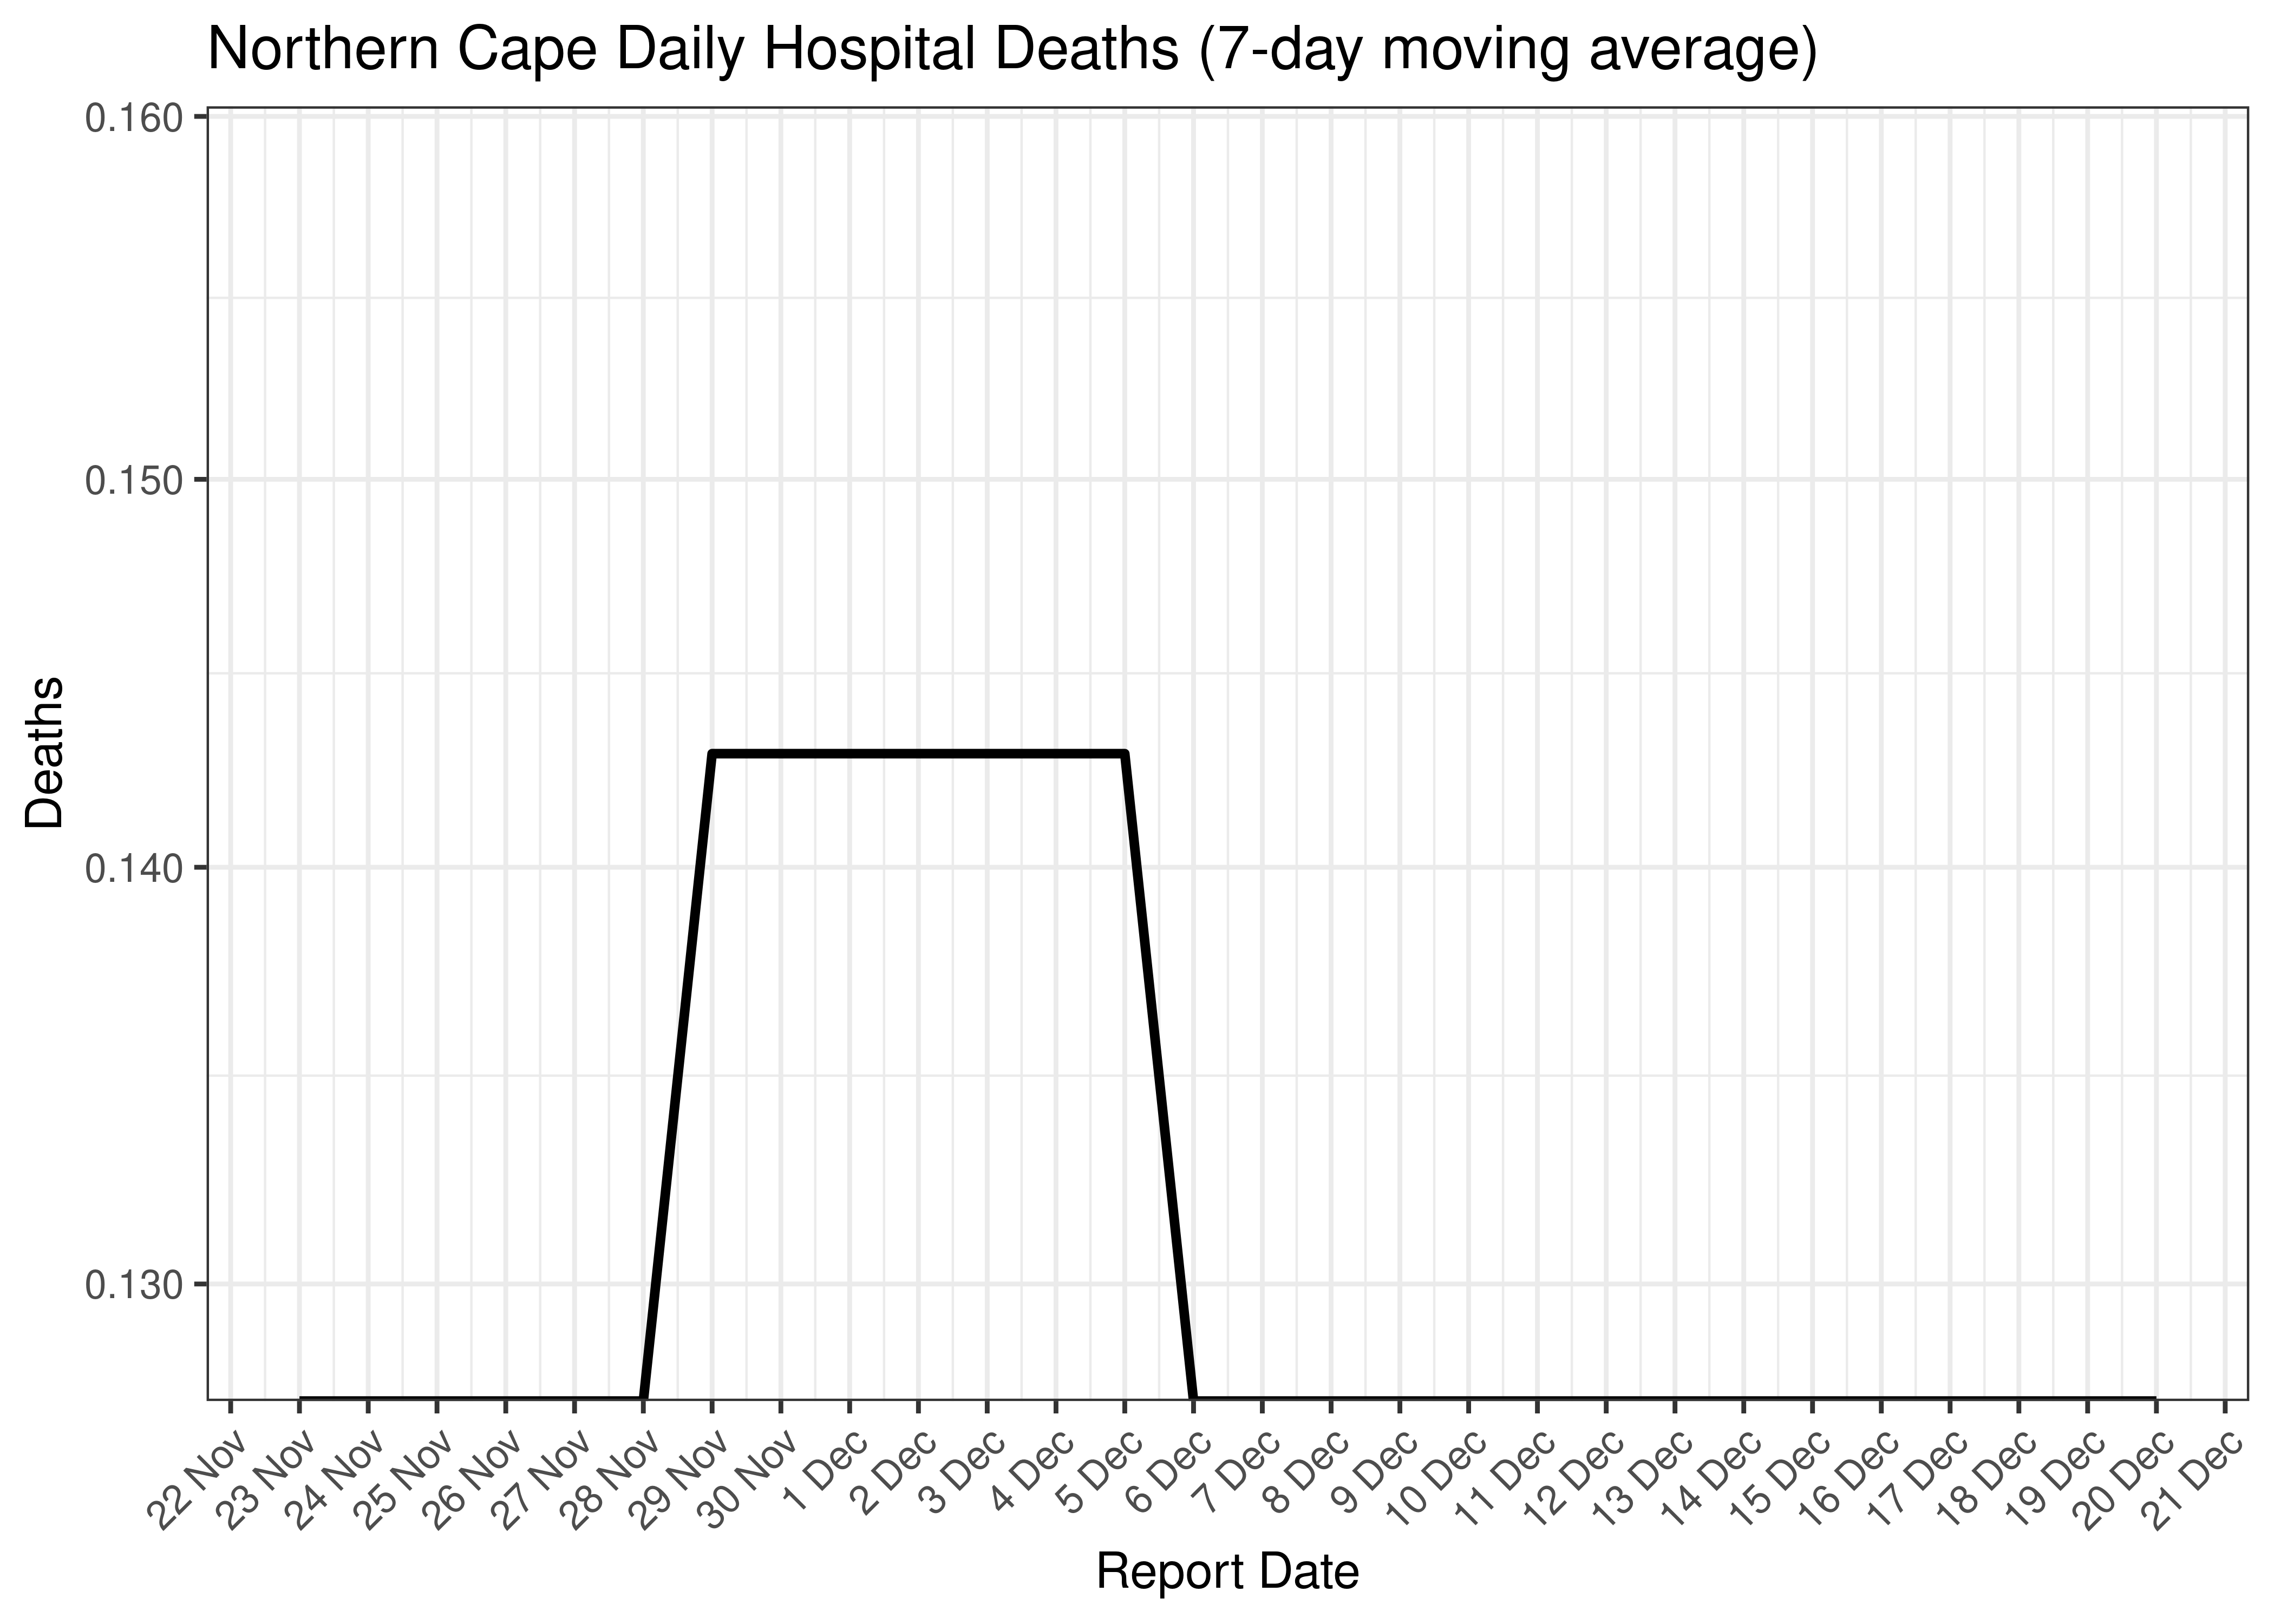
Northern Cape Daily Hospital Deaths for Last 30-days (7-day moving average)
6.9.4 Excess Deaths
Excess deaths are tabulated by date of death below. The peak daily deaths in previous waves (as measured by the moving average) is also shown.
| Date of Death | Excess Deaths | 7-day Moving Average | Comment |
|---|---|---|---|
| 2020-08-19 | 14 | 14 | Wave 1 Peak |
| 2021-01-20 | 23 | 23 | Wave 2 Peak |
| 2021-06-02 | 43 | 43 | Wave 3 Peak |
| 2021-12-22 | 21 | 21 | Wave 4 Peak |
| 2022-06-29 | 19 | 19 | Wave 5 Peak (to date) |
| 2022-12-03 | 0 | 0 | |
| 2022-12-04 | 1 | 1 | |
| 2022-12-05 | 1 | 1 | |
| 2022-12-06 | 1 | 1 | |
| 2022-12-07 | 1 | 1 | |
| 2022-12-08 | 1 | NA | |
| 2022-12-09 | 1 | NA | |
| 2022-12-10 | 1 | NA |
Below a 7-day moving average daily excess deaths count is plotted for Northern Cape on a log scale since start of the epidemic:
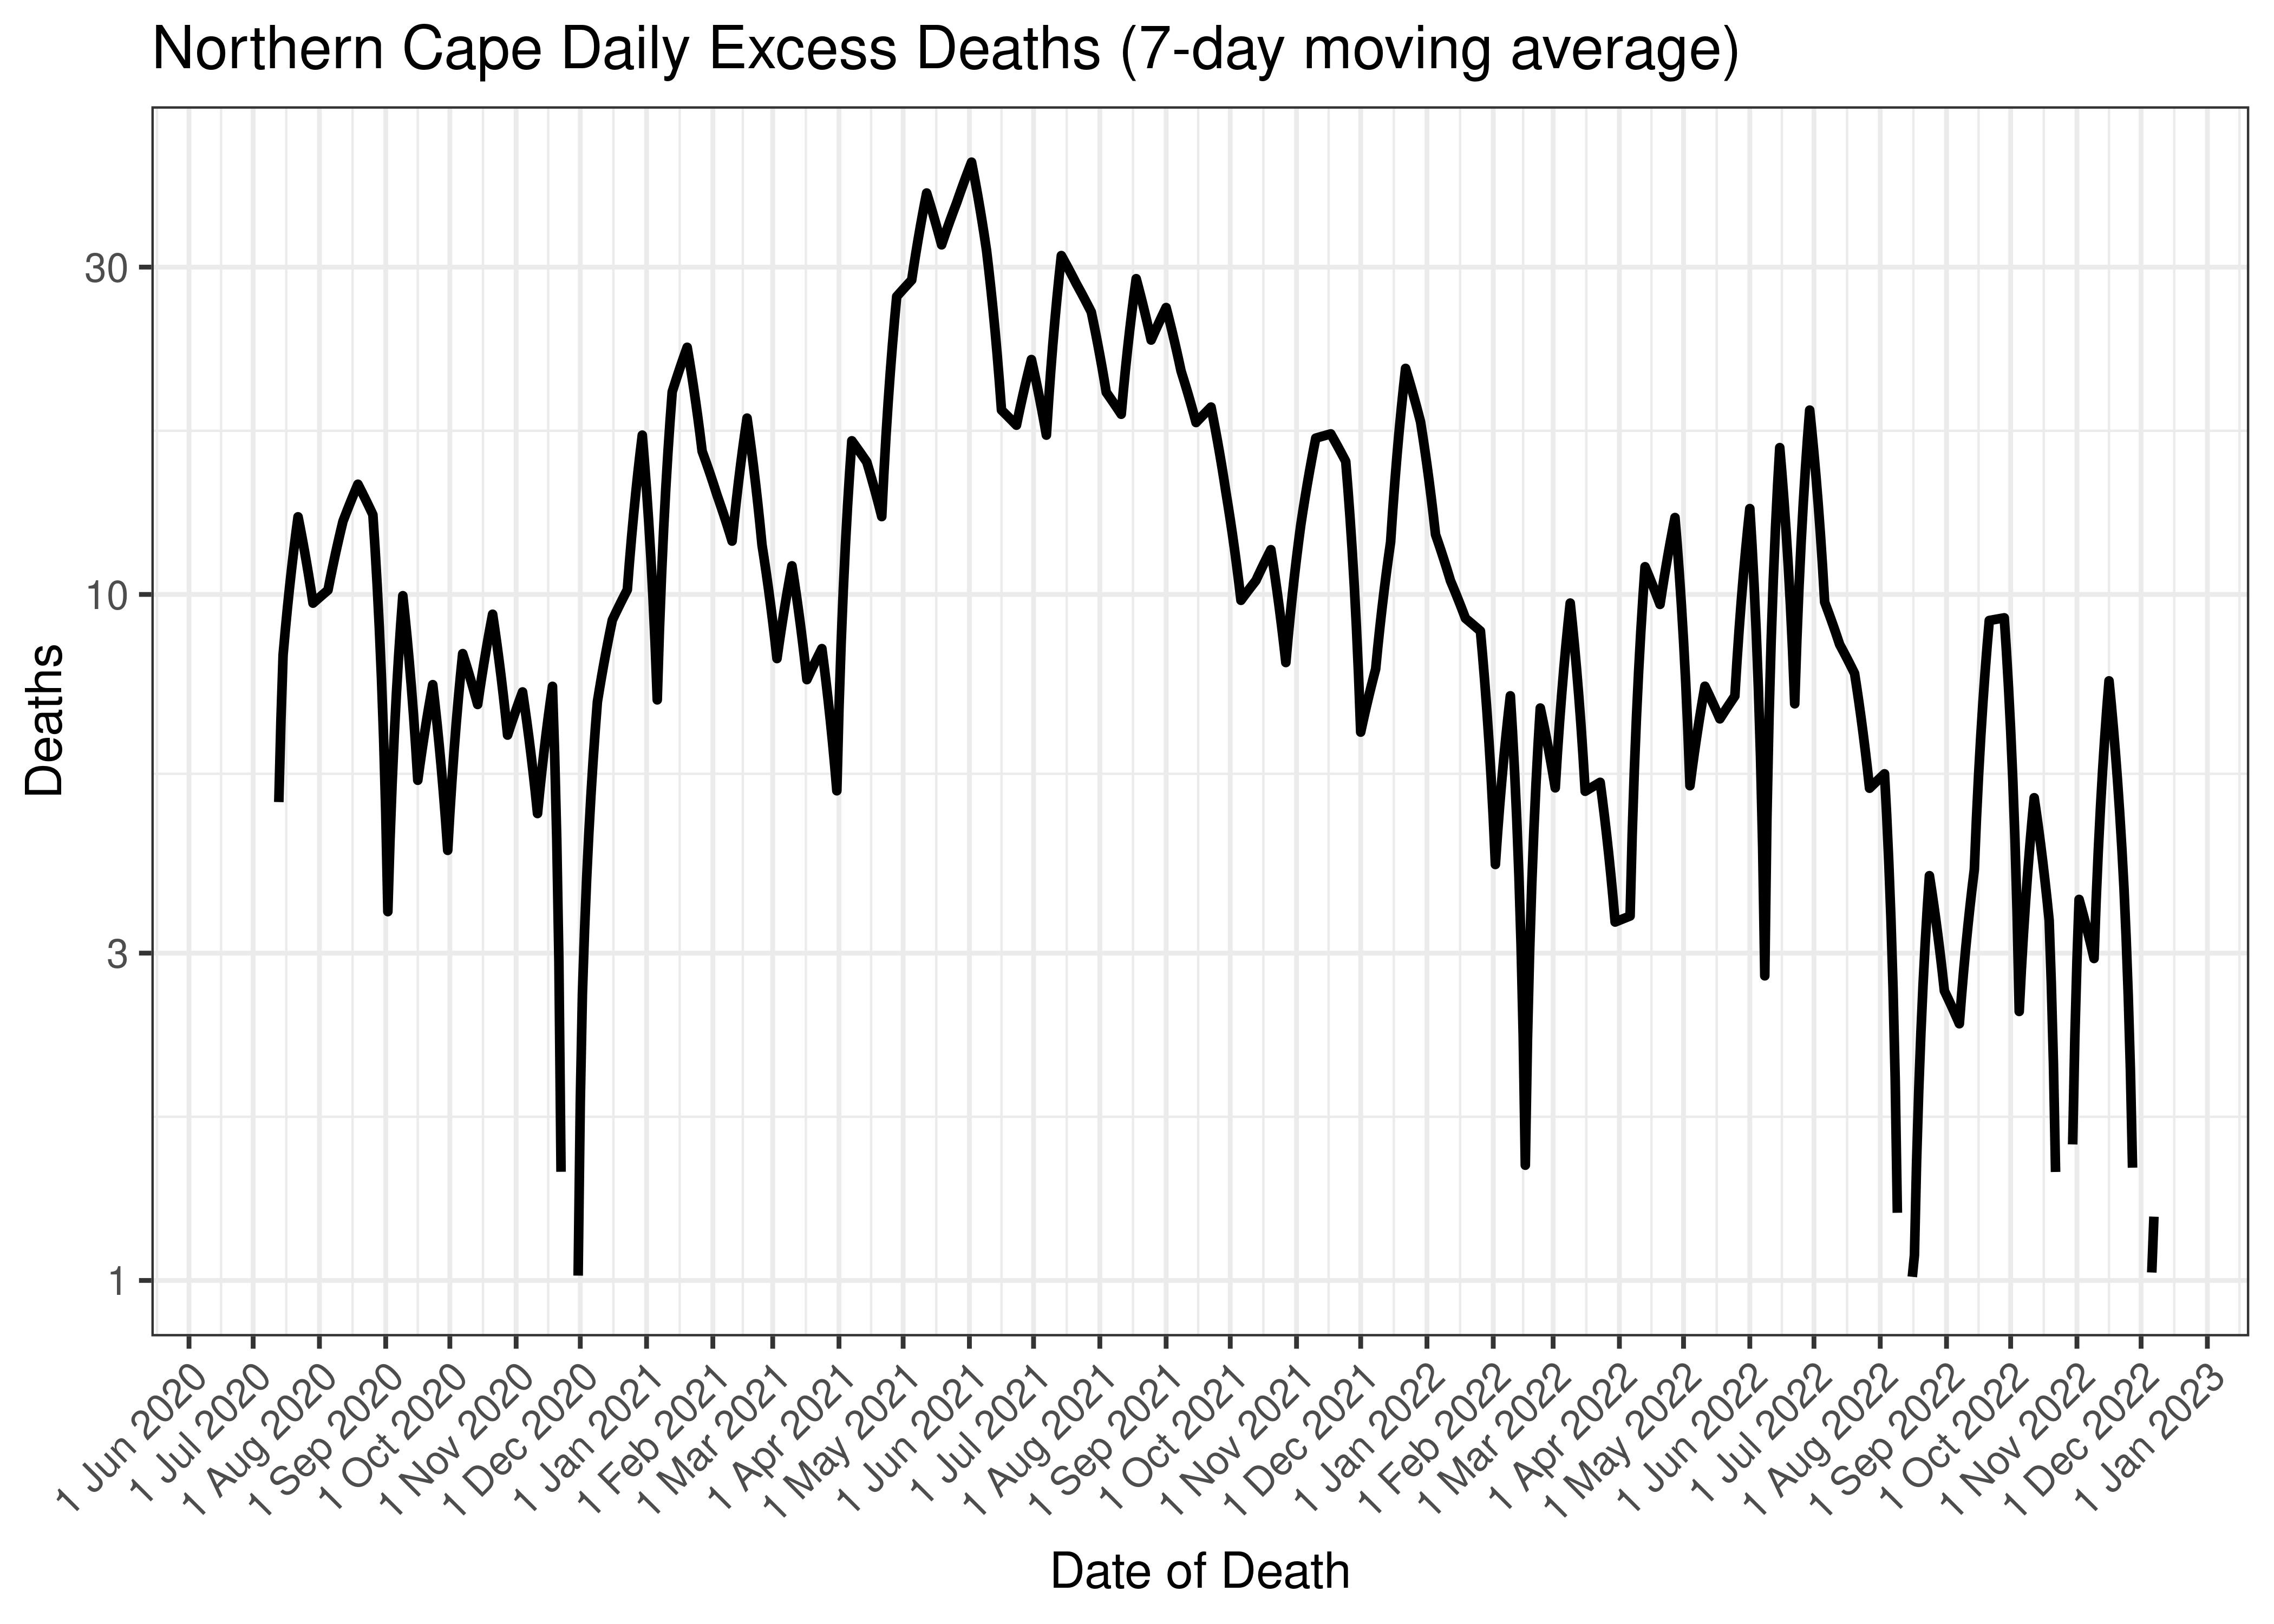
Northern Cape Daily Excess Deaths (7-day moving average)
Below the above chart is repeated for the last 30-days:
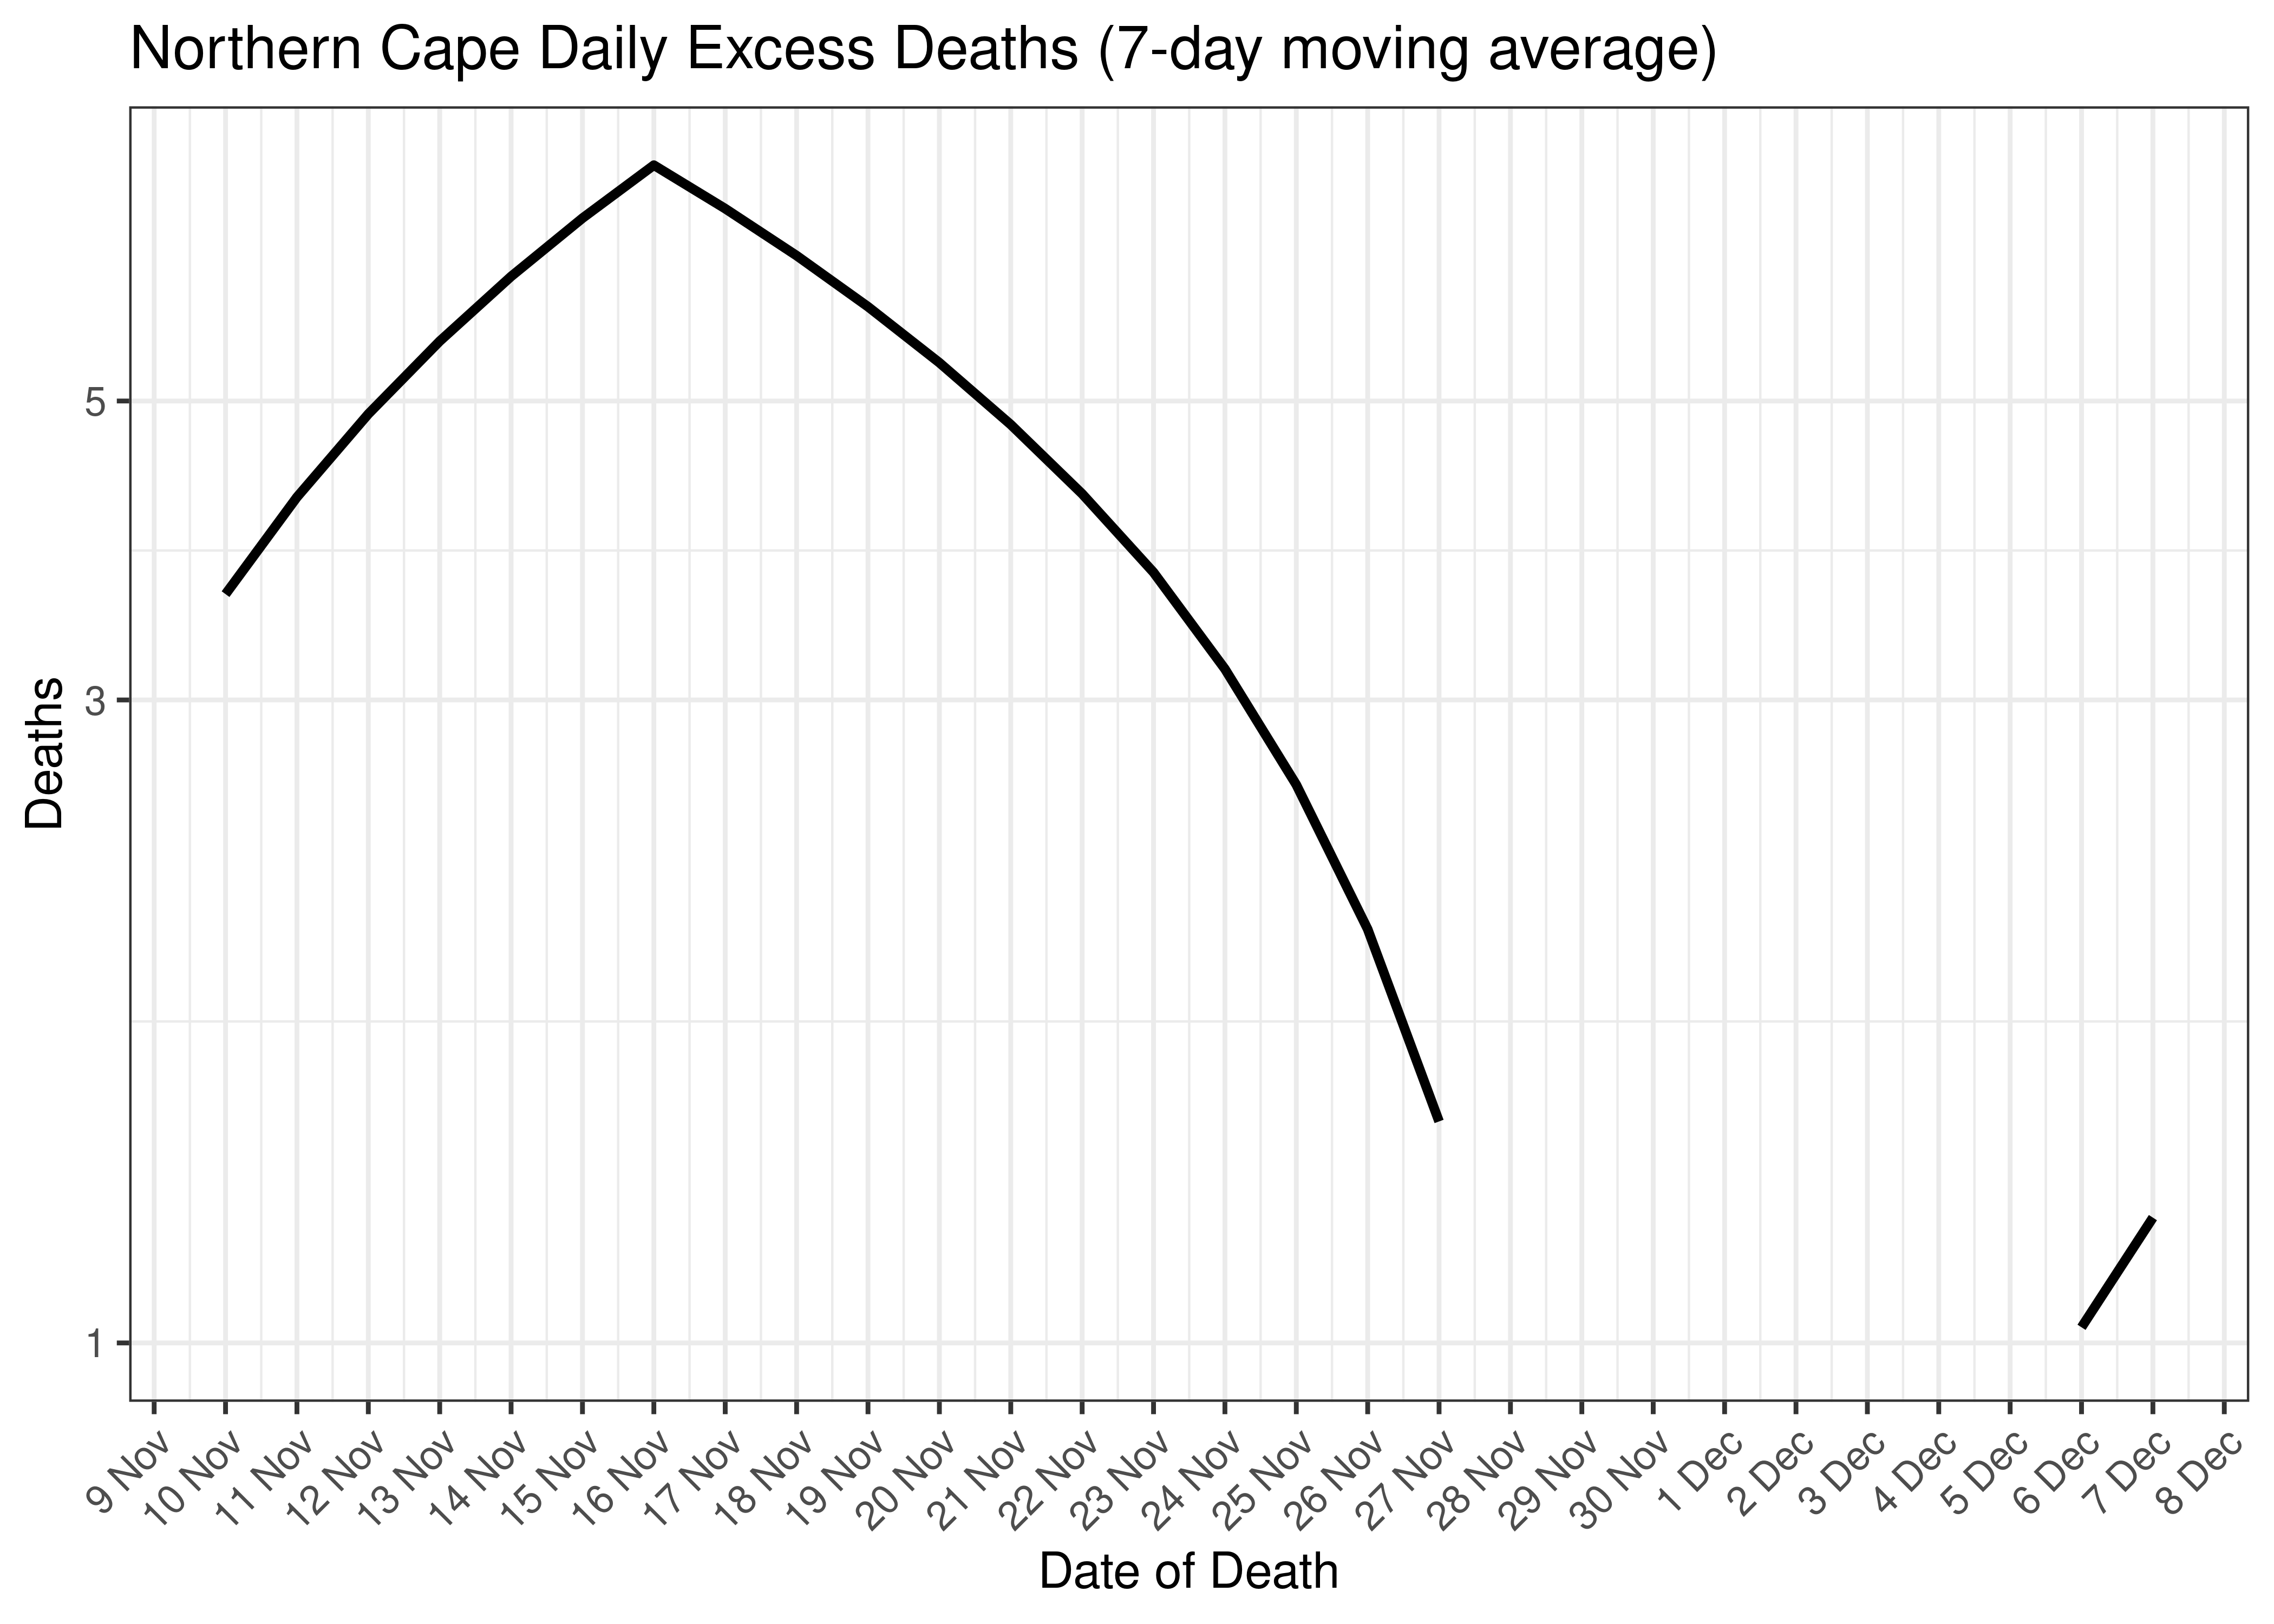
Northern Cape Daily Excess Deaths for Last 30-days (7-day moving average)
6.9.5 Cases, Admissions and Deaths Combined
Below a 7-day moving average daily case, admission and excess death counts are plotted for Northern Cape on a log scale since start of the epidemic. Note admissions and excess deaths are plotted by reported date, whereas cases are plotted by specimen received date.
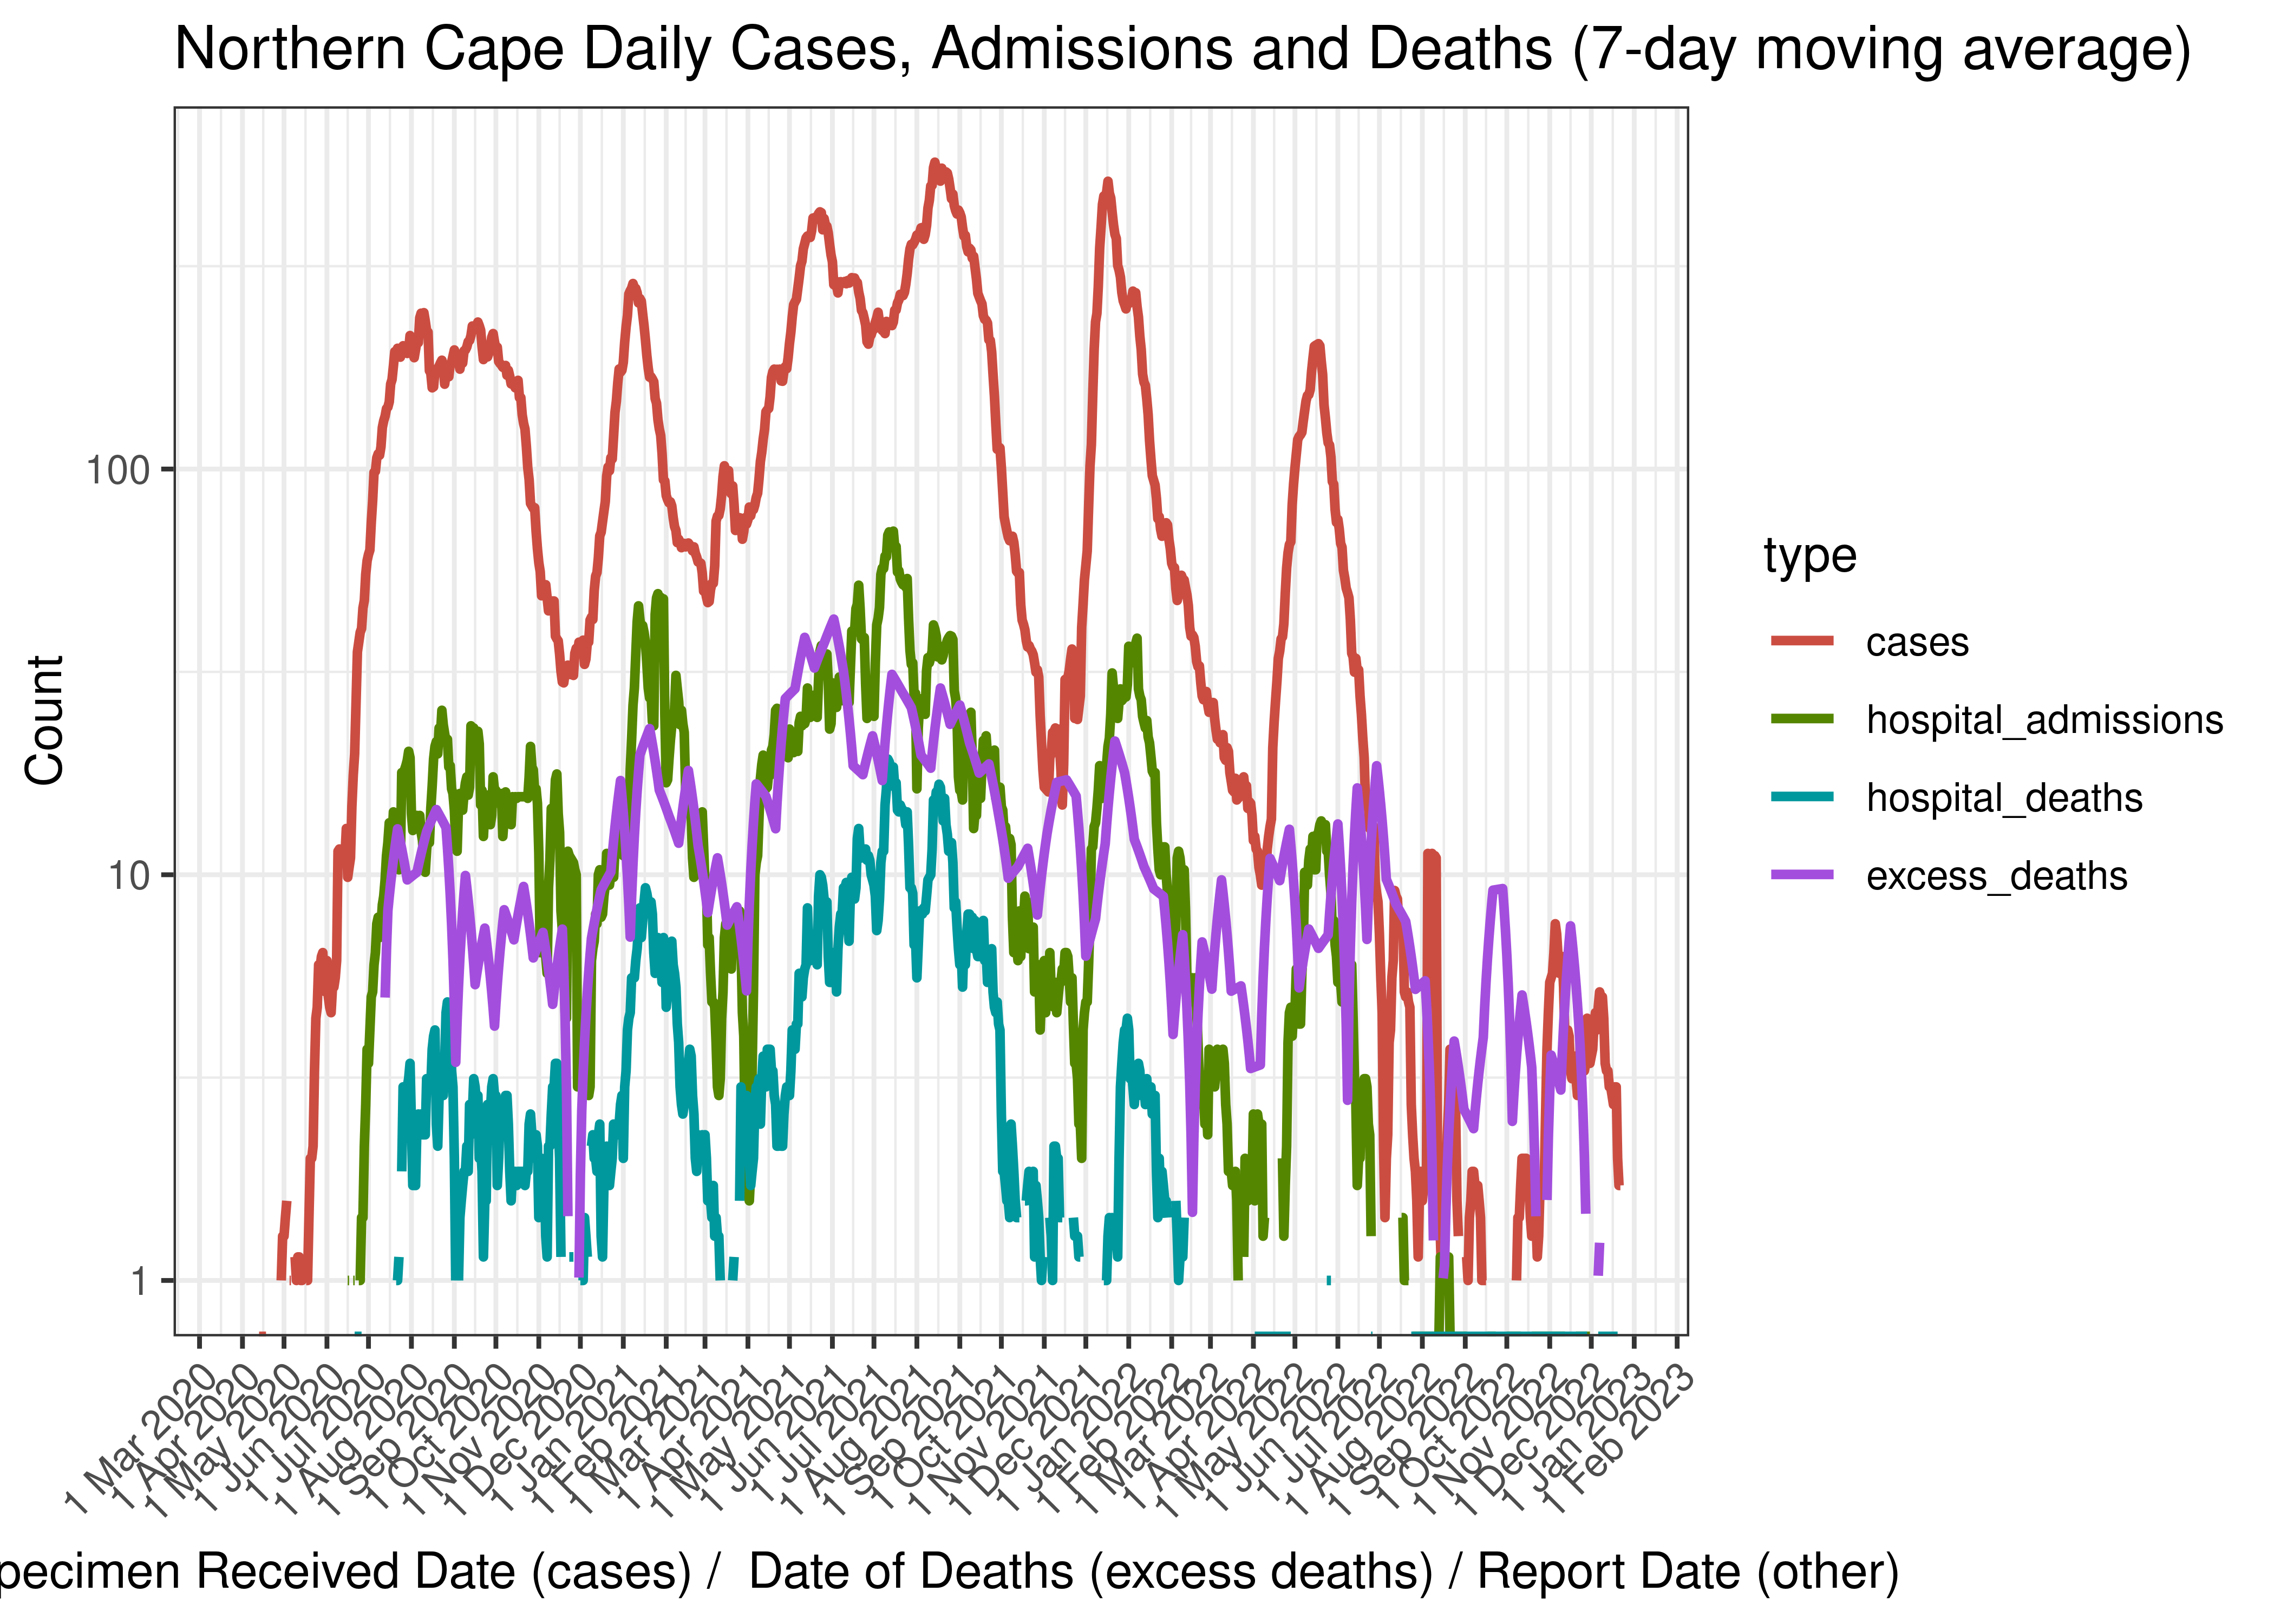
Northern Cape Daily Cases, Admissions and Deaths (7-day moving average)
Below the above chart is repeated for the last 30-days:
Northern Cape Daily Cases, Admissions and Deaths for Last 30-days (7-day moving average)
6.9.6 Crude Ratios per Wave
Below crude rations are calculated between the waves. It’s based on the following starting dates:
- Wave 1 started on 2020-01-01.
- Wave 2 started on 2020-10-01.
- Wave 3 started on 2021-04-01.
- Wave 4 started on 2021-11-01.
- Wave 5 started on 2022-04-01.
Below crude ratios are tabulated and plotted. These ratios are:
- Case admissions ratio calculated as admissions divided by cases.
- Case fatality ratio calculated as hospital deaths divided by cases (Note that COVID-19 deaths are under-reported by a significant factor in South Africa).
- Case excess deaths ratio calculated as excess deaths divided by cases.
- Hospital fatality ratio calculated as hospital deaths divided by admissions (Note that COVID-19 deaths are under-reported by a significant factor in South Africa).
- Death reporting ratio calculated as hospital deaths divided by excess deaths.
| Wave | Case Admission Ratio | Case Fatality Ratio | Case Excess Deaths Ratio | Hospital Fatality Ratio | Death Reporting Ratio | |
|---|---|---|---|---|---|---|
| Northern Cape | Wave 1 | 8.0% | 1.11% | 4.32% | 13.9% | 25.6% |
| Northern Cape | Wave 2 | 14.7% | 2.79% | 9.59% | 19.0% | 29.0% |
| Northern Cape | Wave 3 | 10.3% | 2.77% | 8.56% | 27.0% | 32.4% |
| Northern Cape | Wave 4 | 10.0% | 1.11% | 9.06% | 11.1% | 12.3% |
| Northern Cape | Wave 5 | 7.2% | 0.54% | 22.53% | 7.5% | 2.4% |
Below the rations above are plotted graphically:
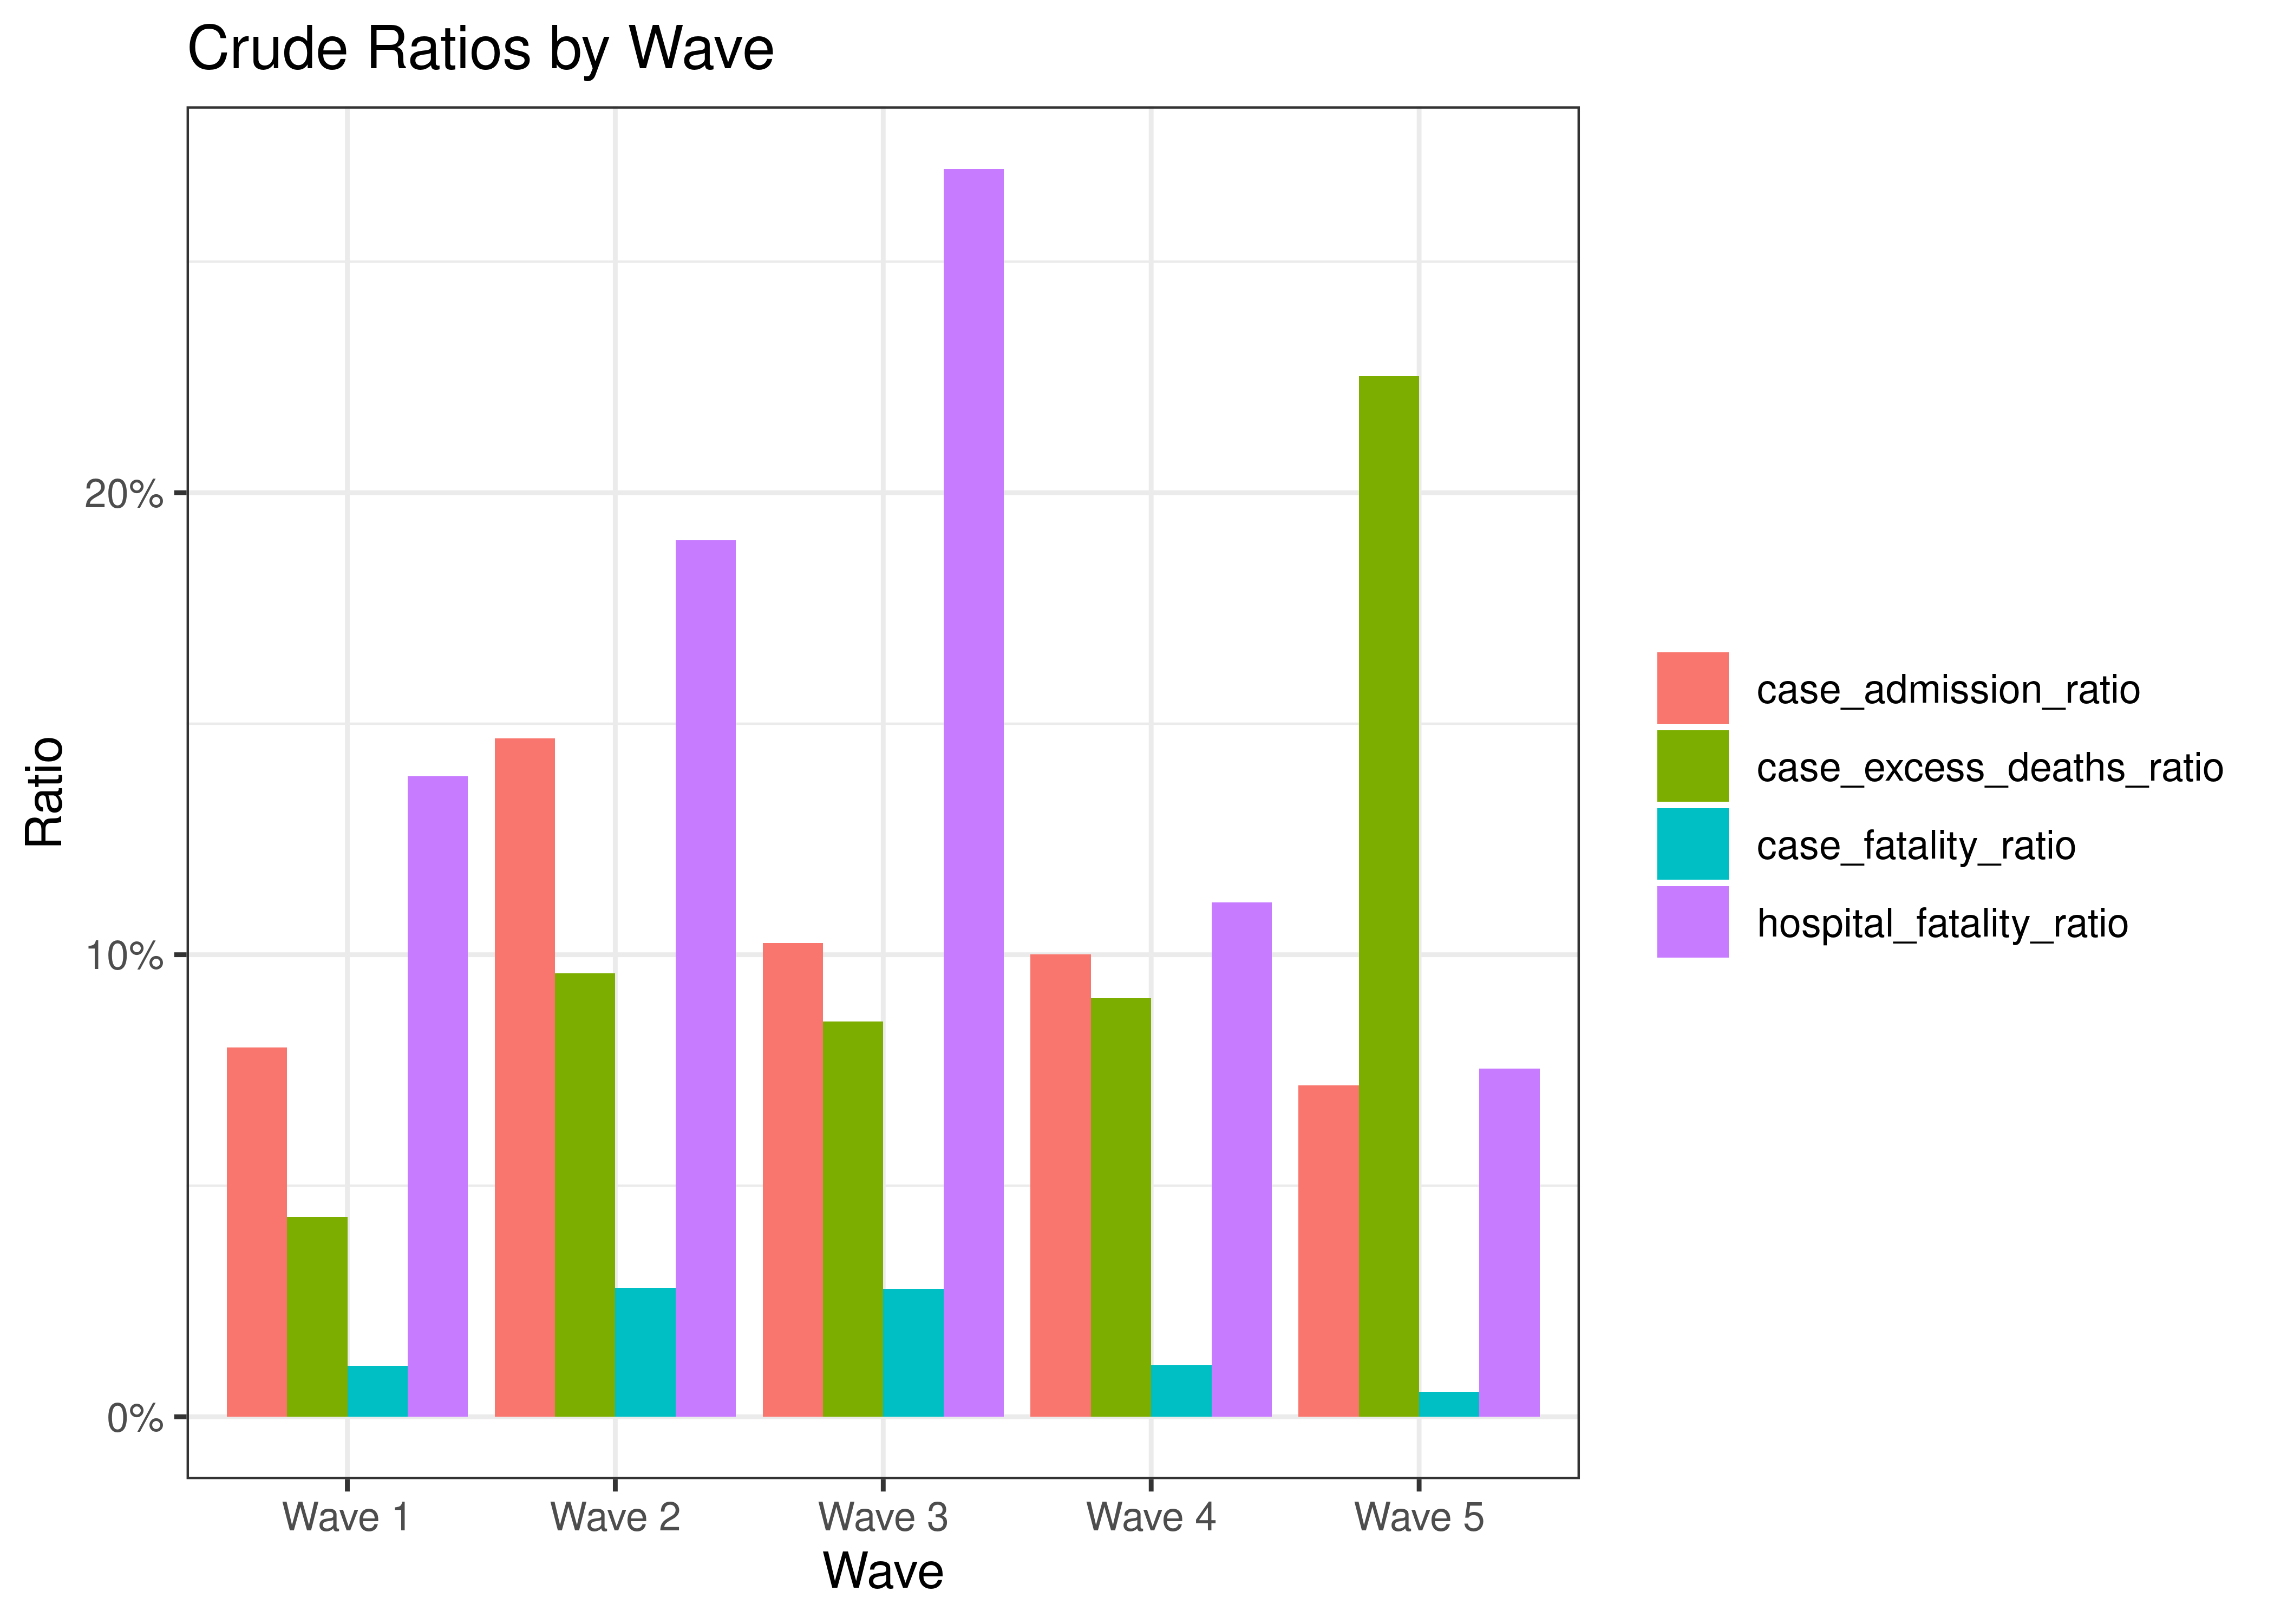
Crude Ratios by Wave
6.9.7 Reproduction Number
Below current (last weekly) effective reproduction number estimates are tabulated for Northern Cape and by district municipality.
| Type | Count (Per Day) | Week Ending | Reproduction Number [95% Confidence Interval] | |
|---|---|---|---|---|
| Northern Cape | cases | 1.7 | 2022-12-25 | 0.64 [0.34 - 1.02] |
| Northern Cape | hospital_admissions | 0.6 | 2022-12-23 | 1.56 [0.50 - 3.19] |
| District Municipality | Type | Count (Per Day) | Week Ending | Reproduction Number [95% Confidence Interval] |
|---|---|---|---|---|
| Frances Baard | cases | 0.1 | 2022-12-25 | 1.46 [0.16 - 4.41] |
| John Taolo Gaetsewe | cases | 0.3 | 2022-12-25 | 0.29 [0.06 - 0.70] |
| Namakwa | cases | 0.4 | 2022-12-25 | 2.24 [0.57 - 5.13] |
| Pixley Ka Seme | cases | 0.4 | 2022-12-25 | 1.16 [0.31 - 2.56] |
| Zf Mgcawu | cases | 0.4 | 2022-12-25 | 1.00 [0.27 - 2.20] |
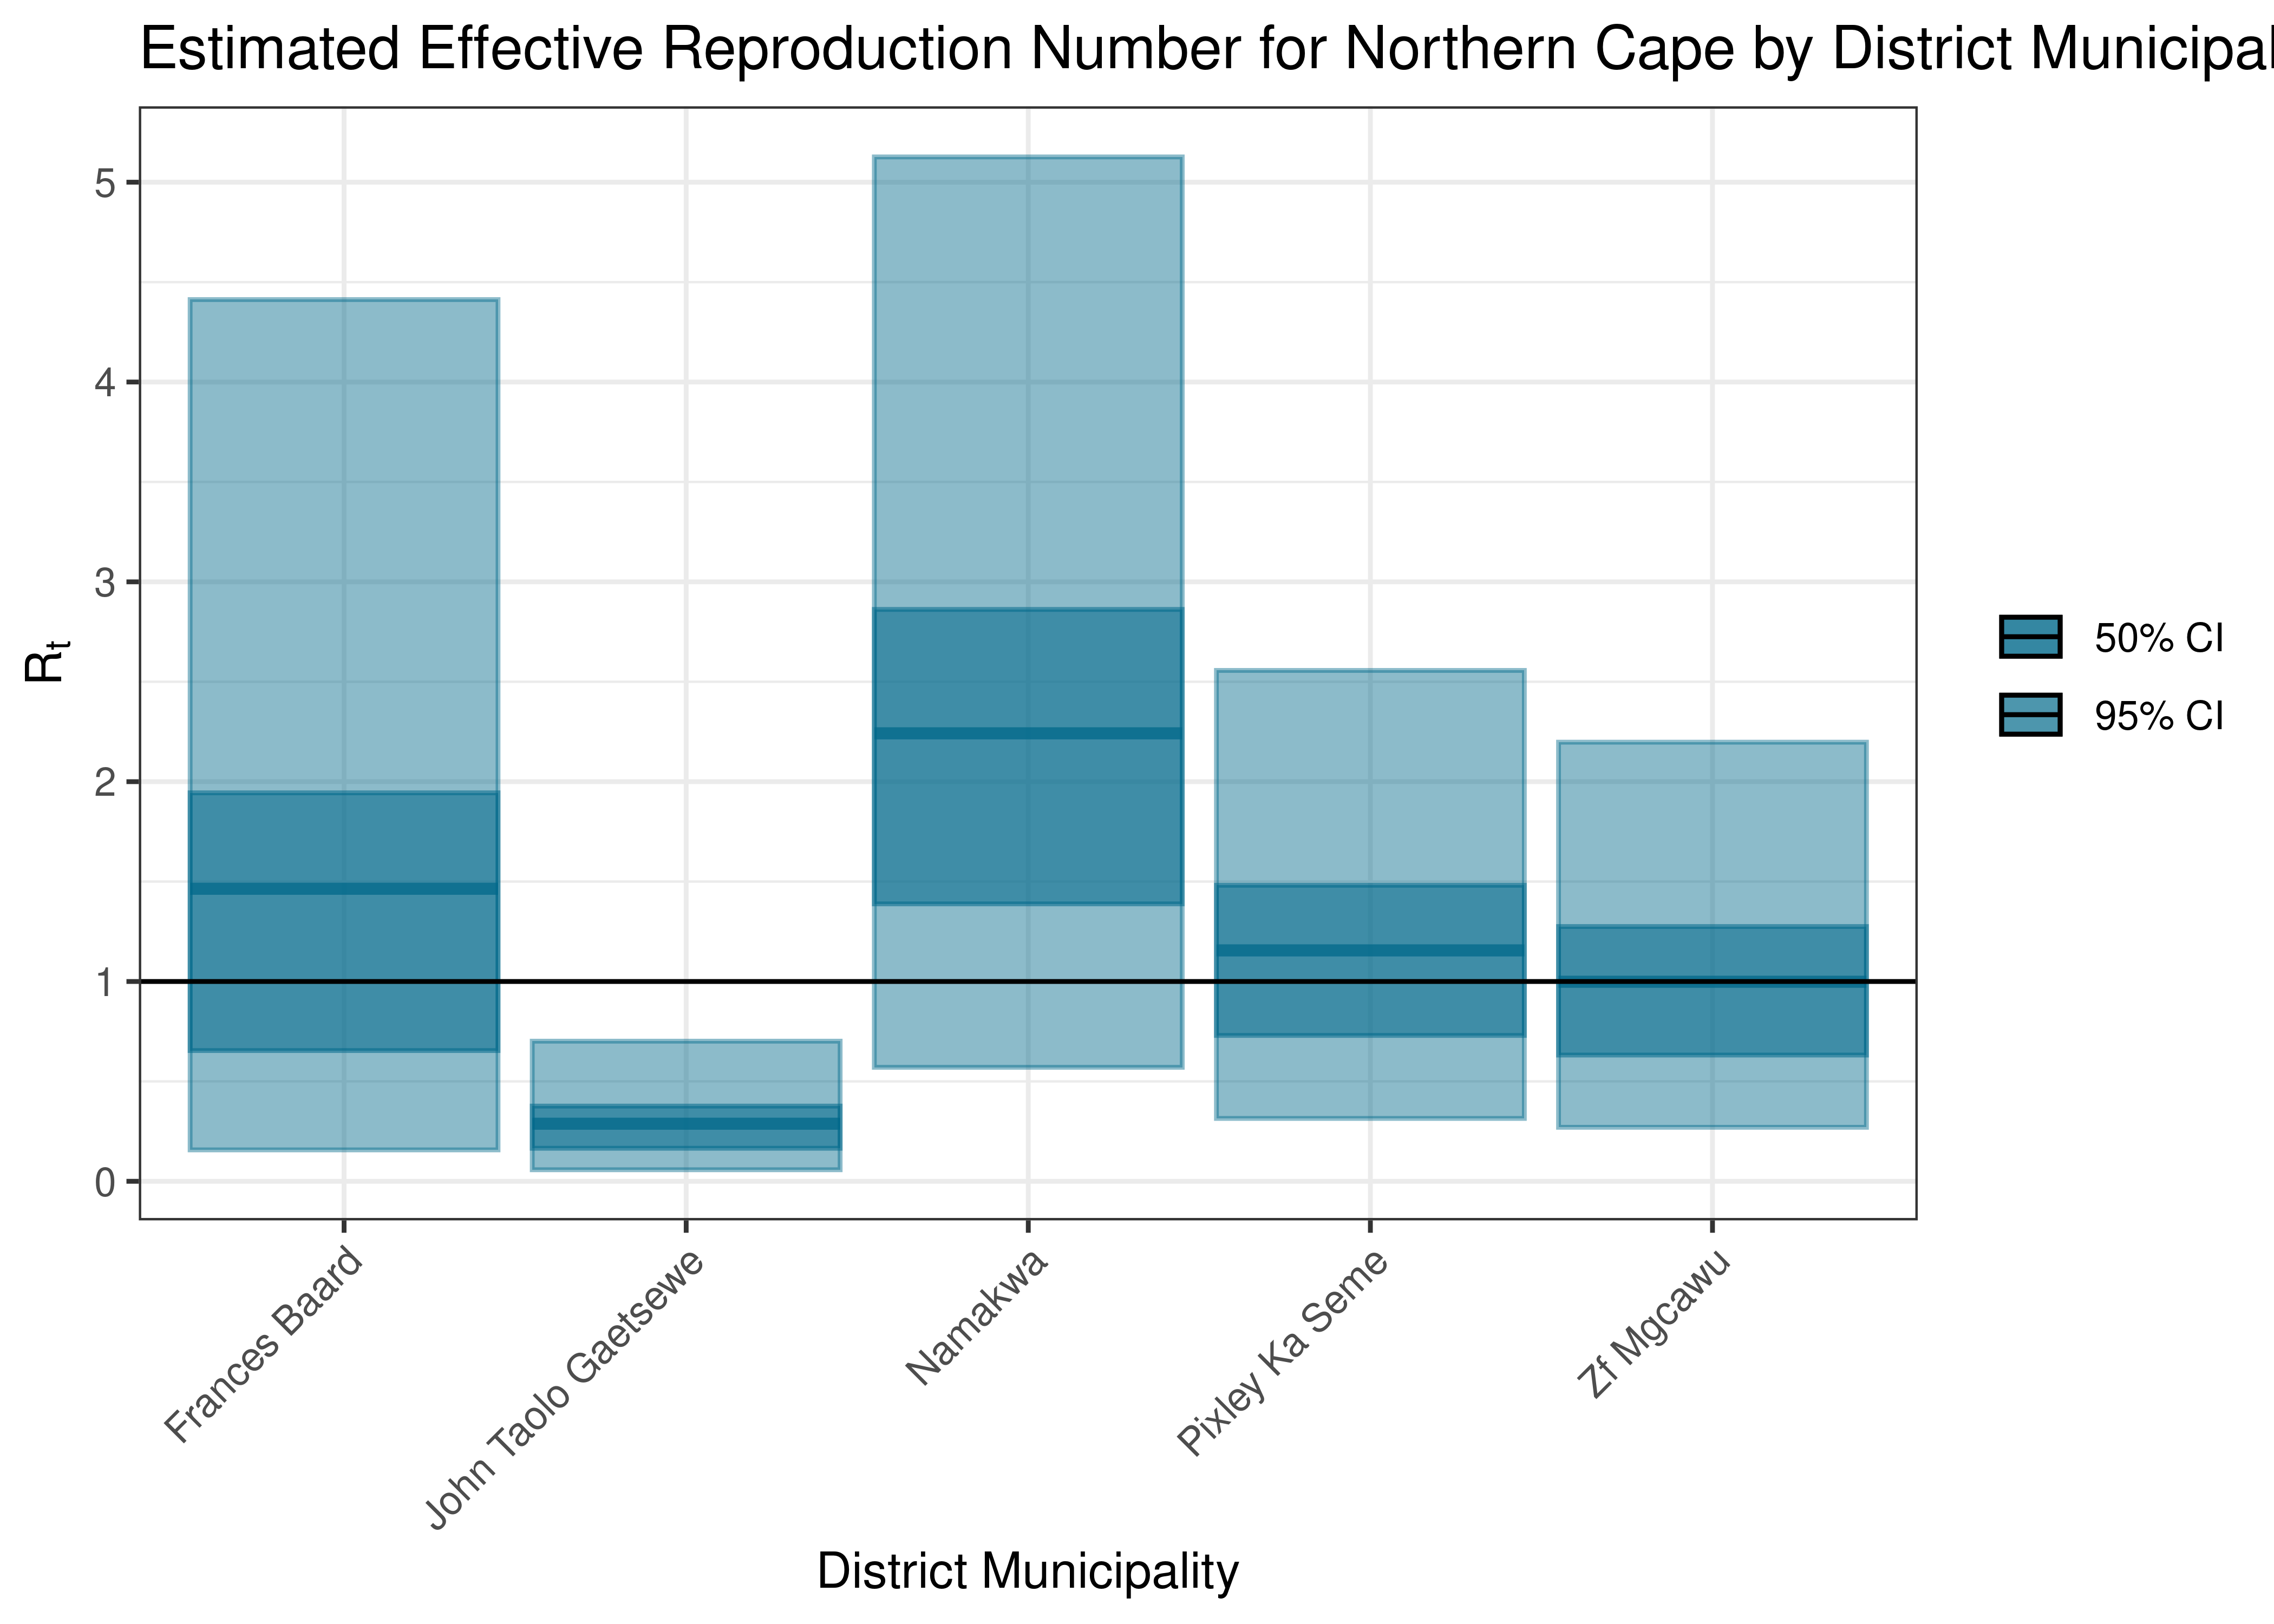
Estimated Effective Reproduction Number for Northern Cape by District Municipality
Below the effective reproduction number for Northern Cape over the last 90 days are plotted together with a plot since start of the pandemic.
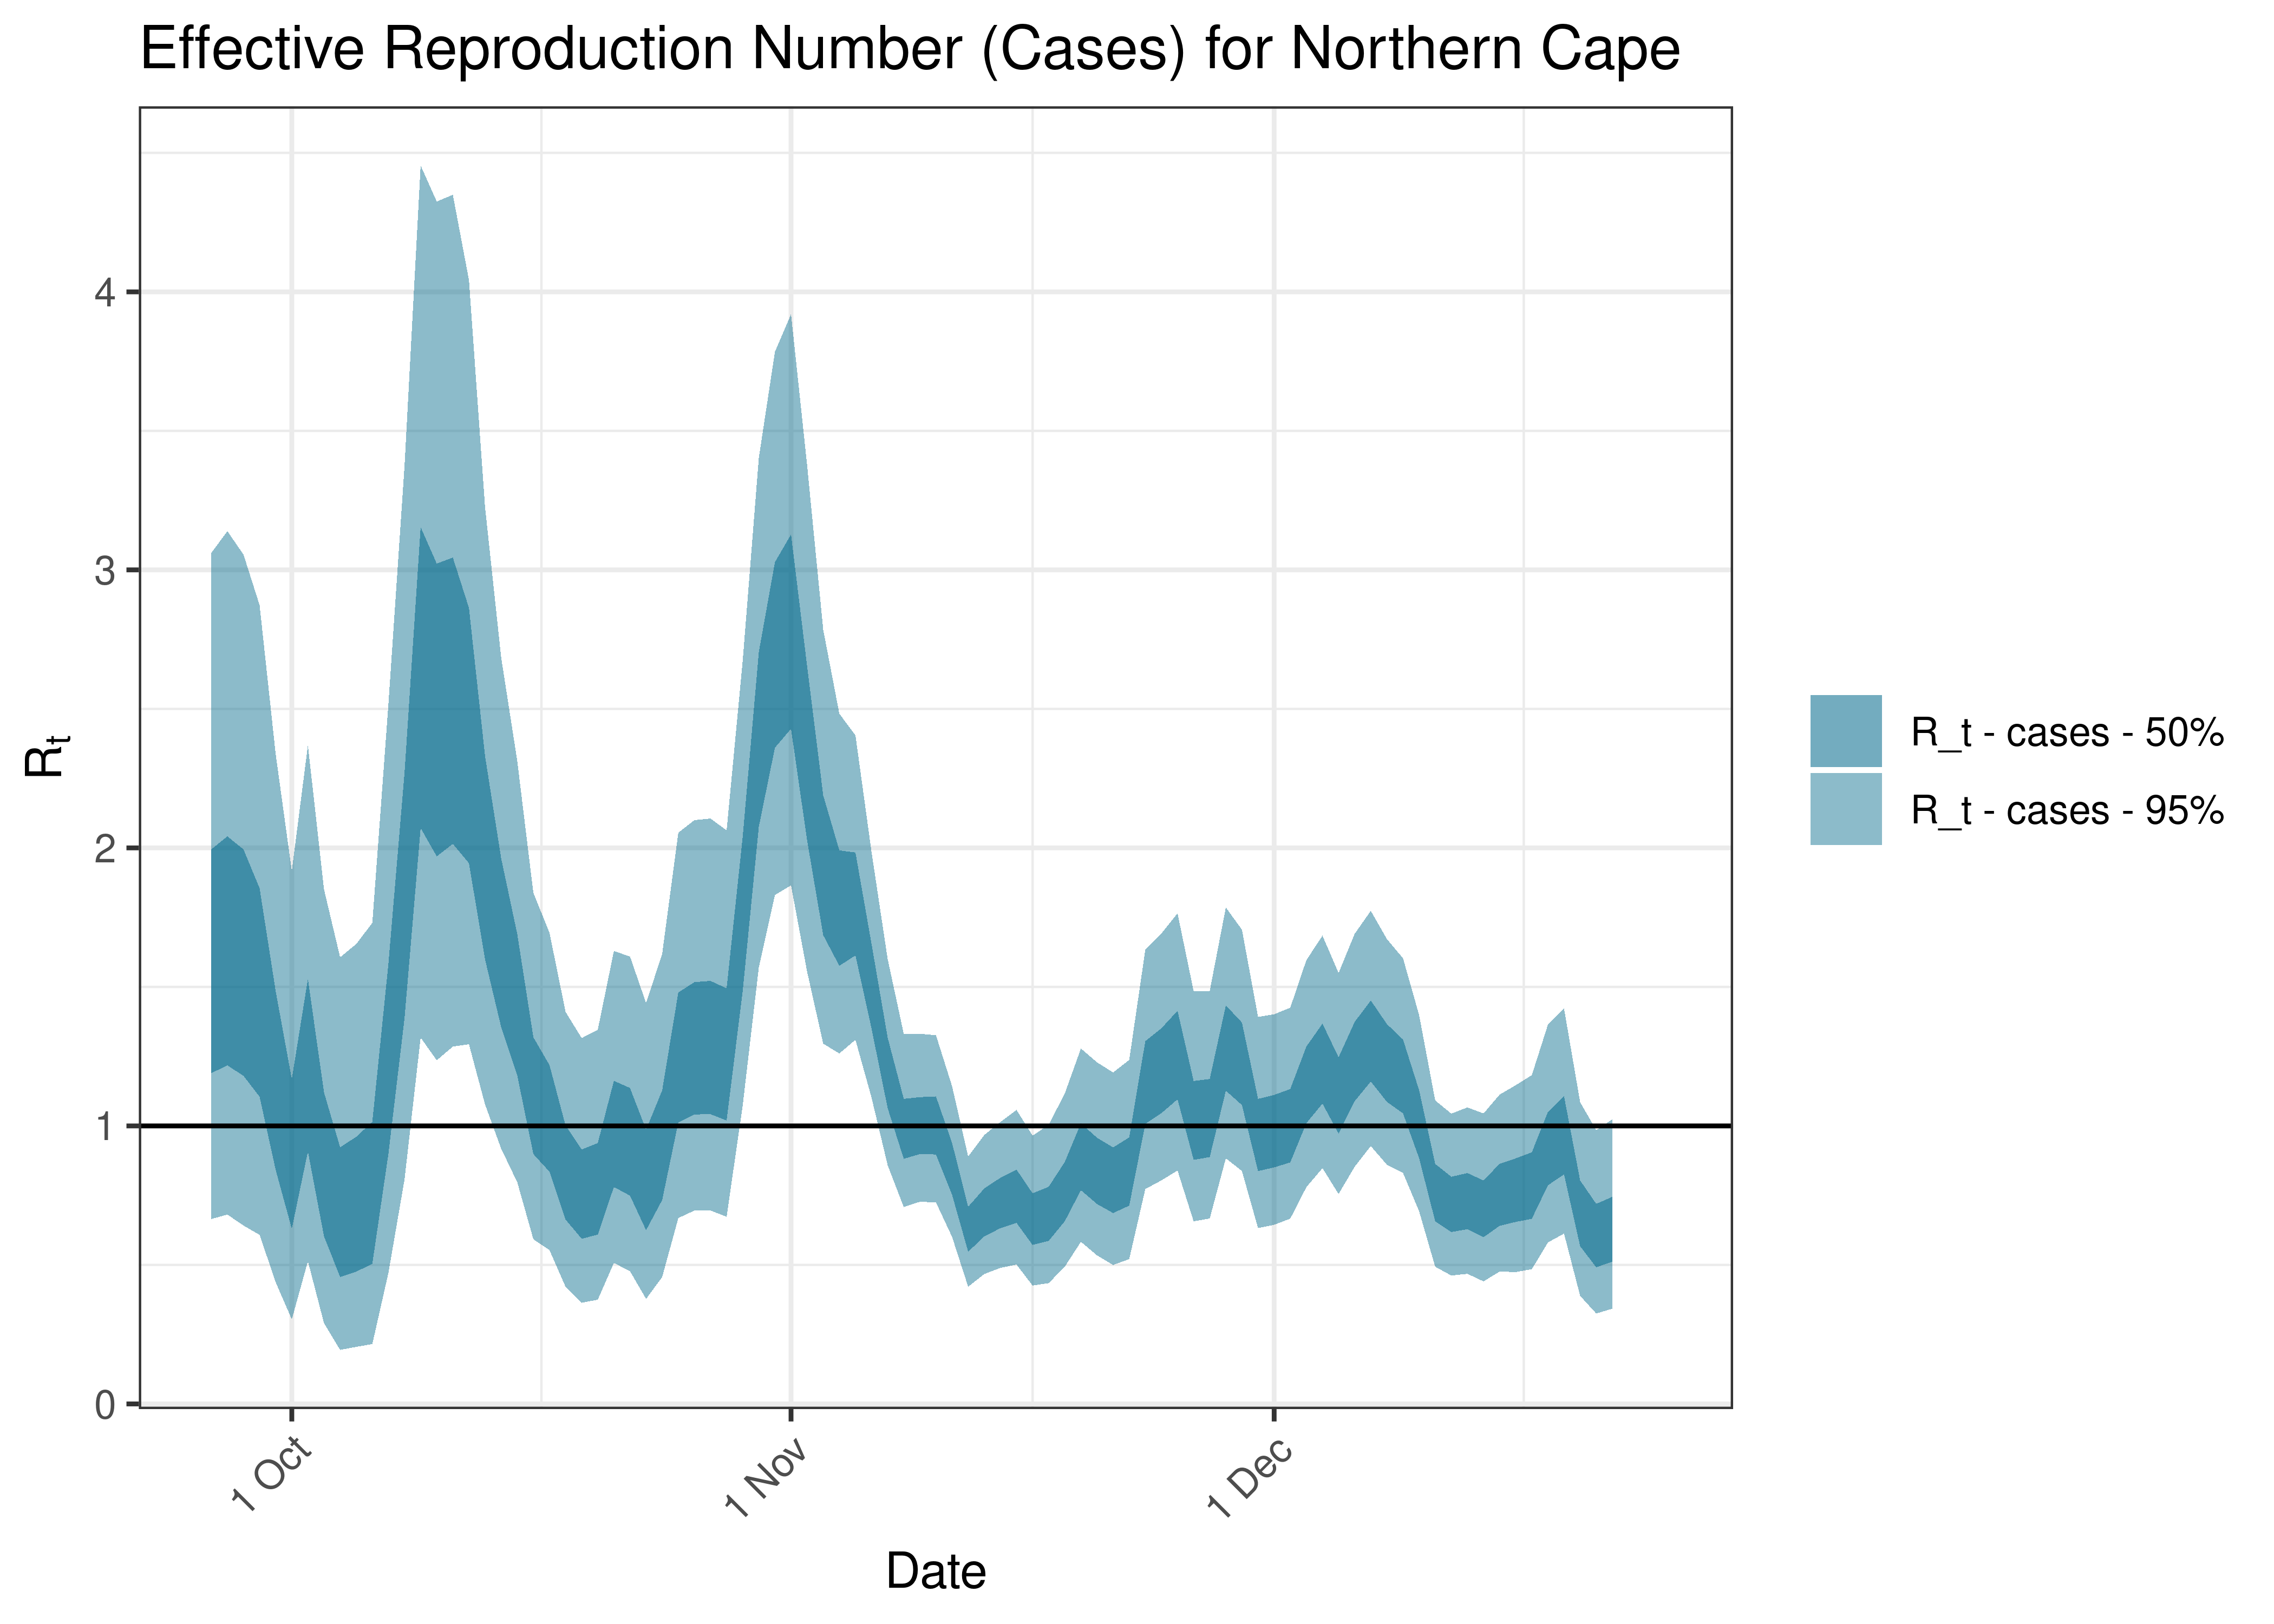
Estimated Effective Reproduction Number Based on Cases for Northern Cape over last 90 days
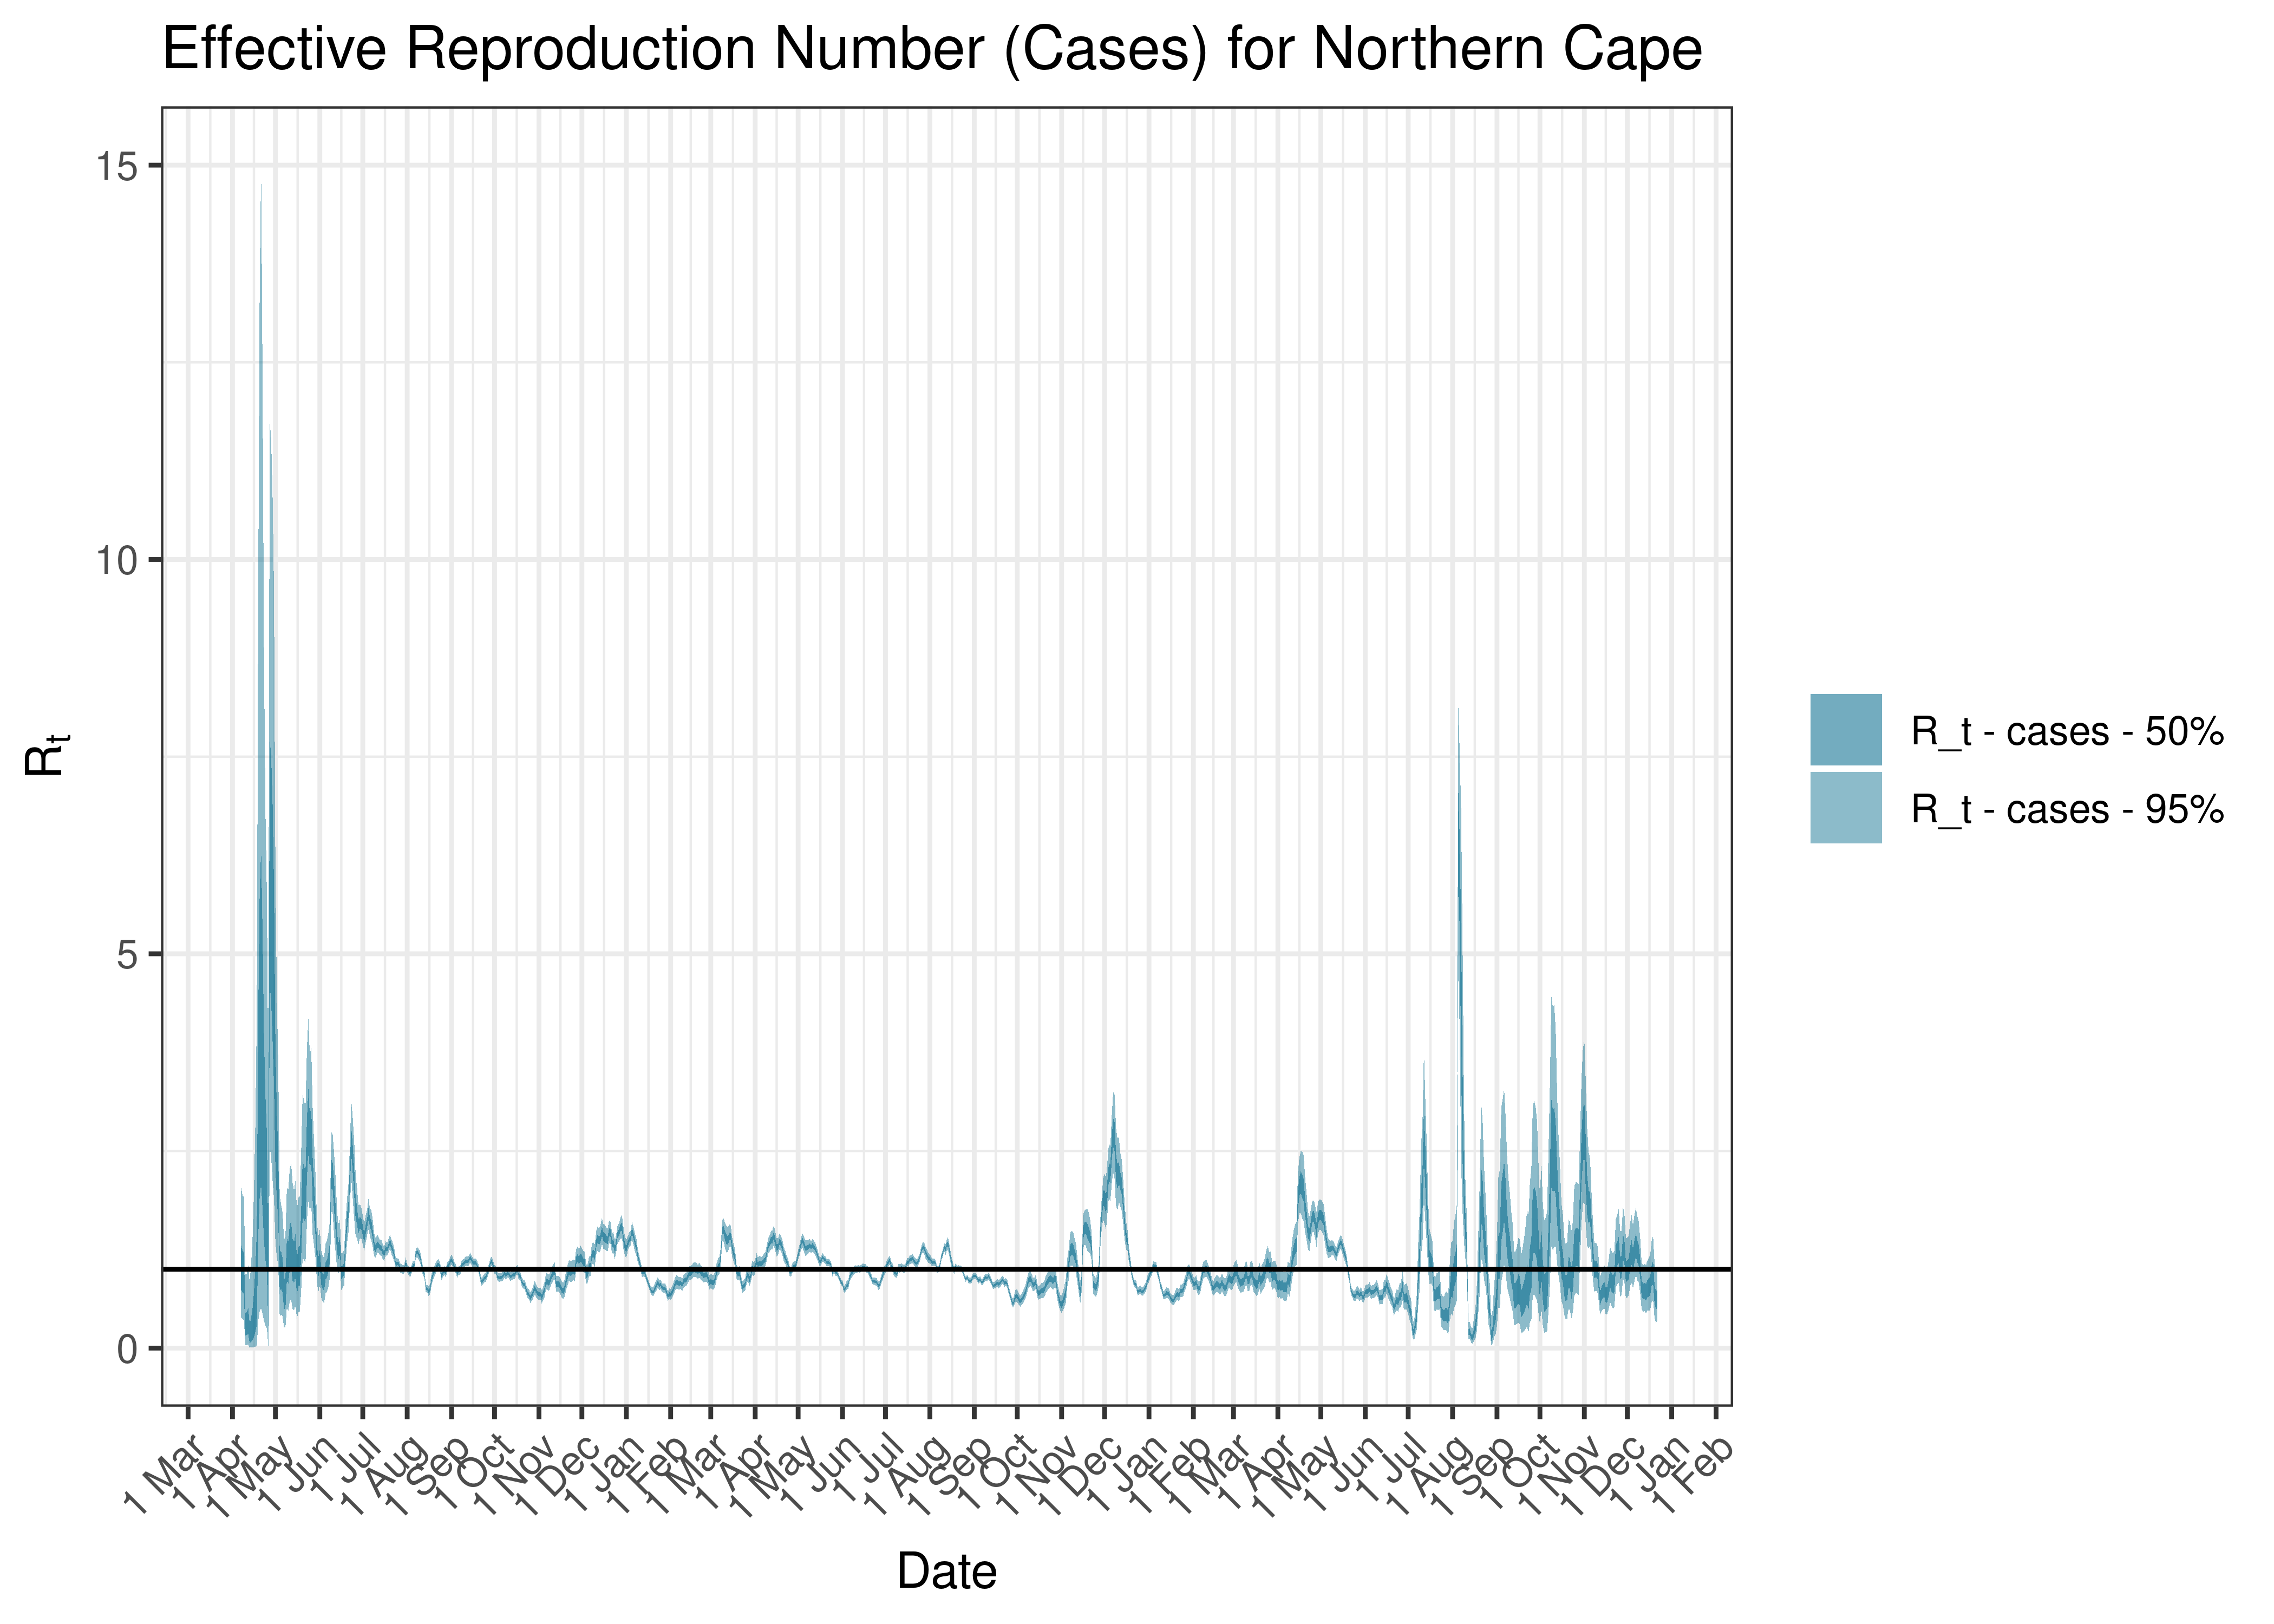
Estimated Effective Reproduction Number Based on Cases for Northern Cape since 1 April 2020
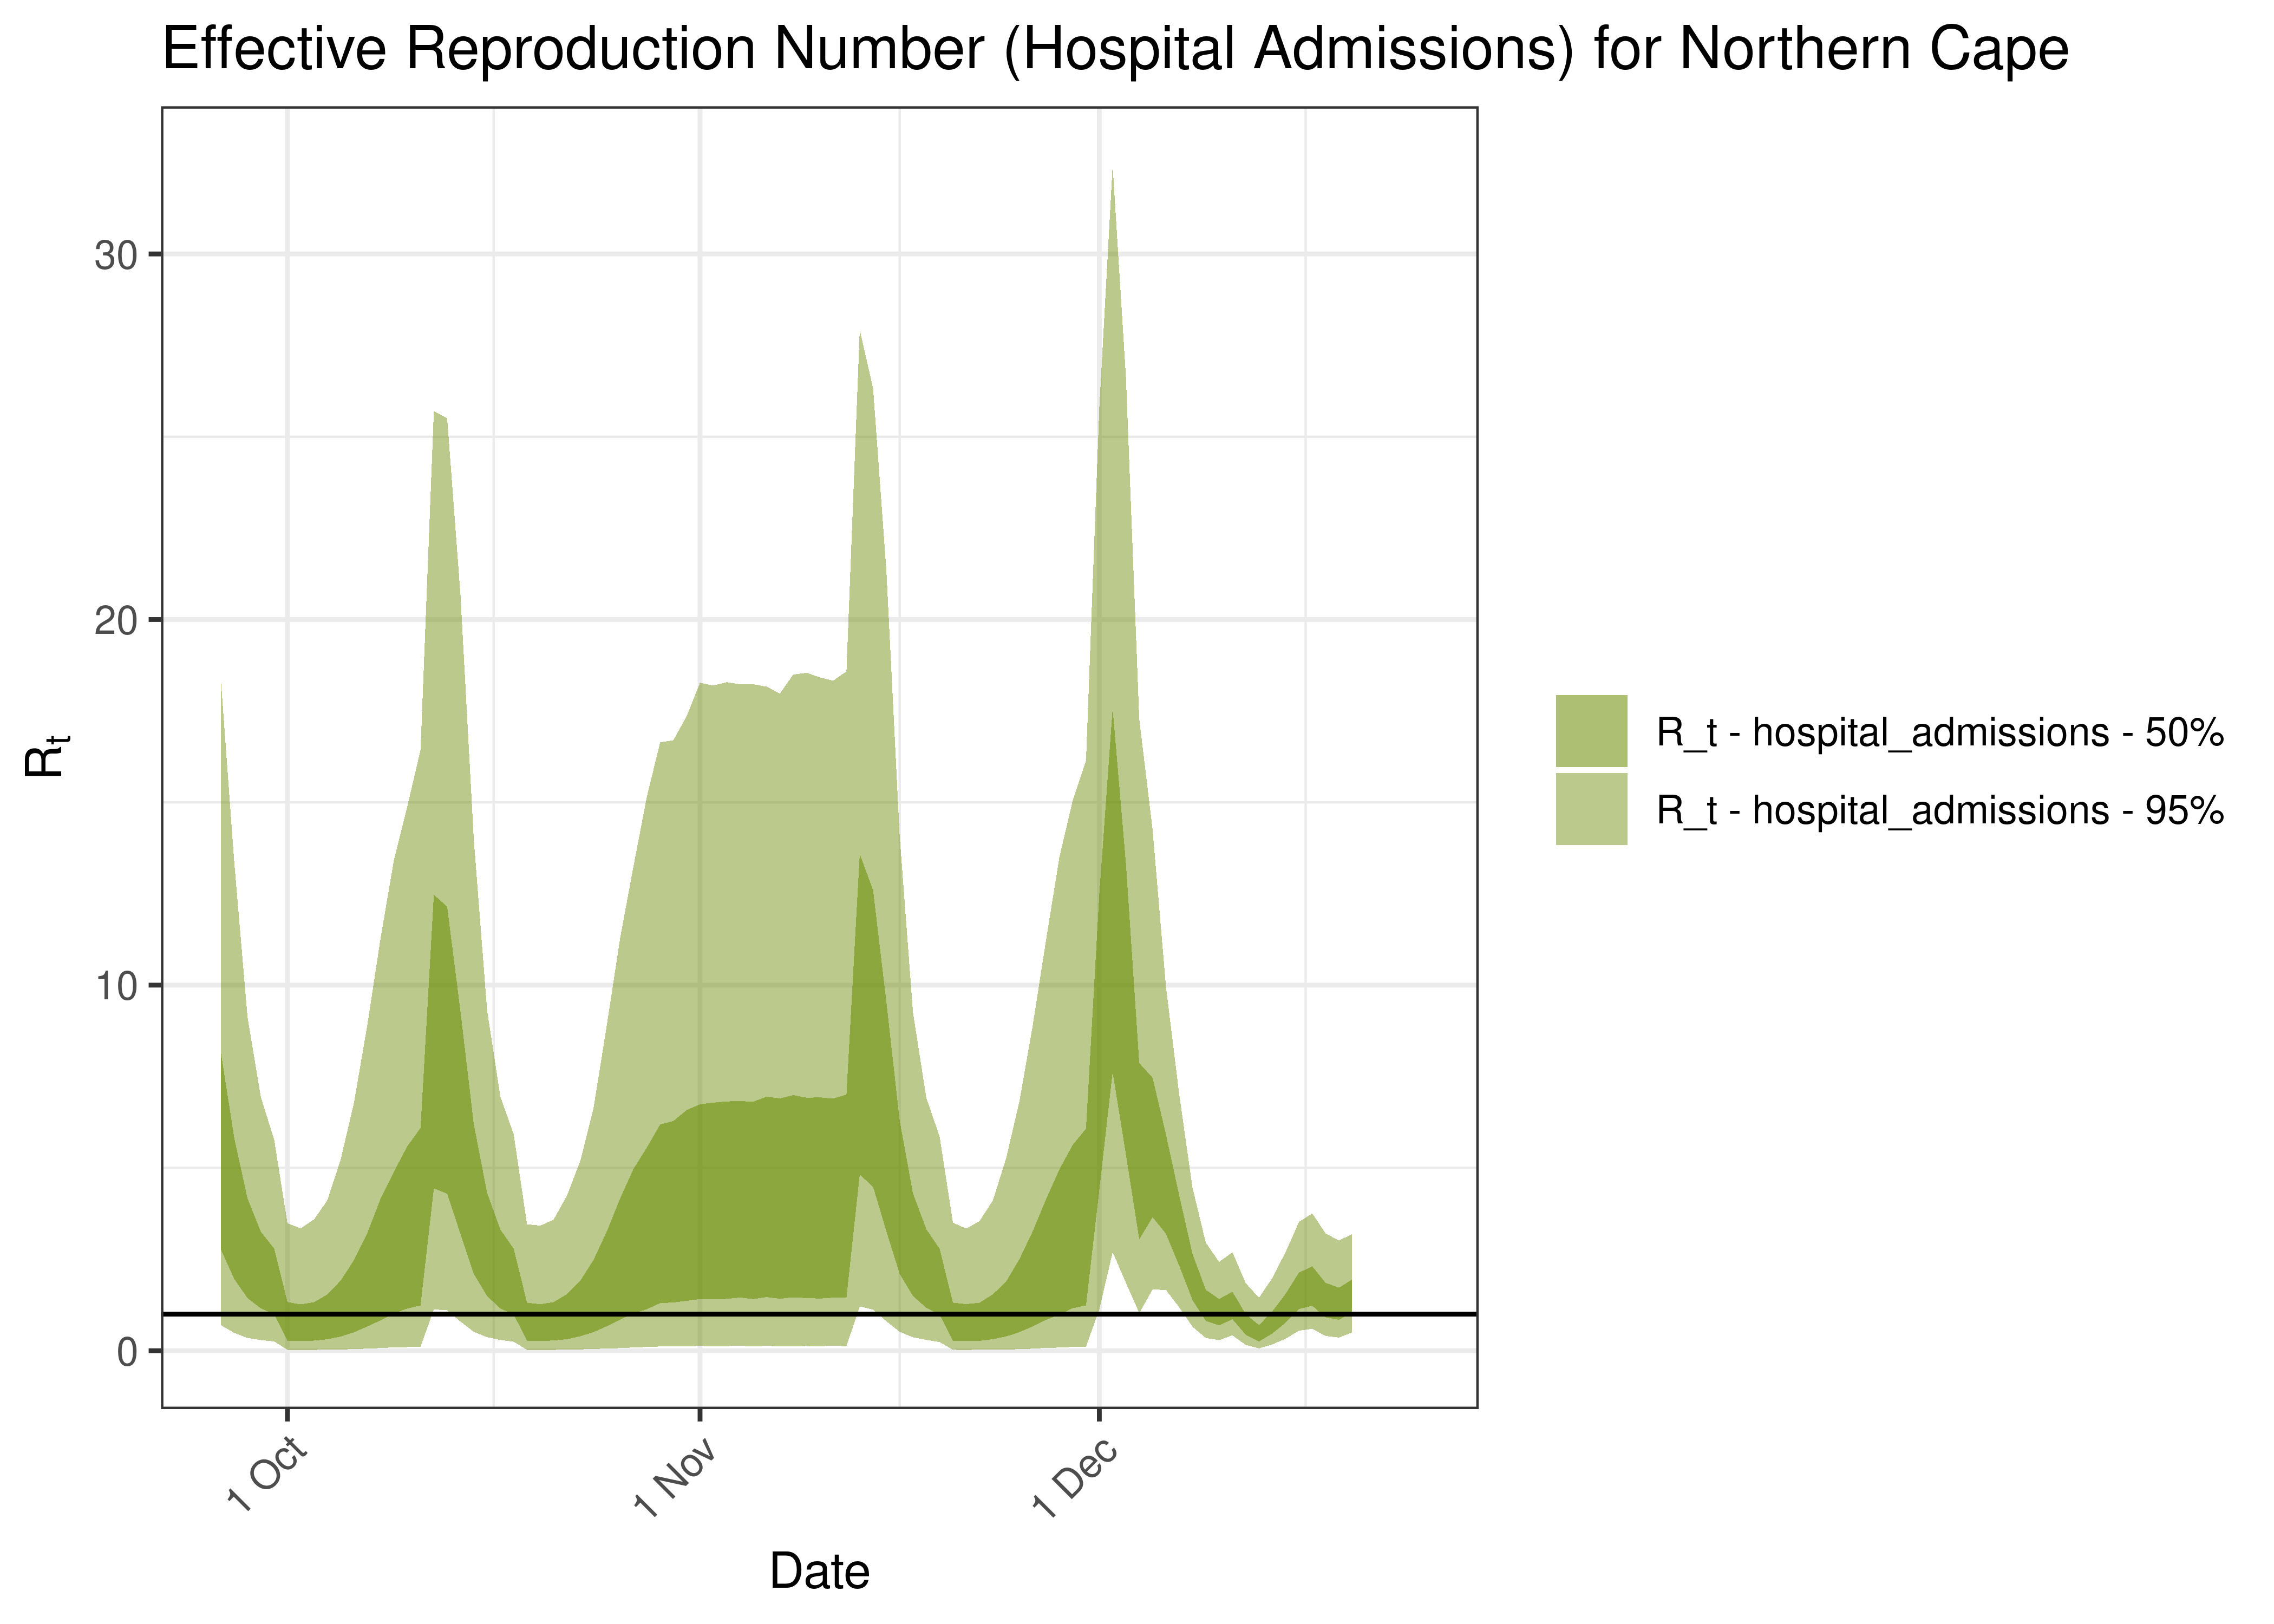
Estimated Effective Reproduction Number Based on Hospital Admissions for Northern Cape over last 90 days
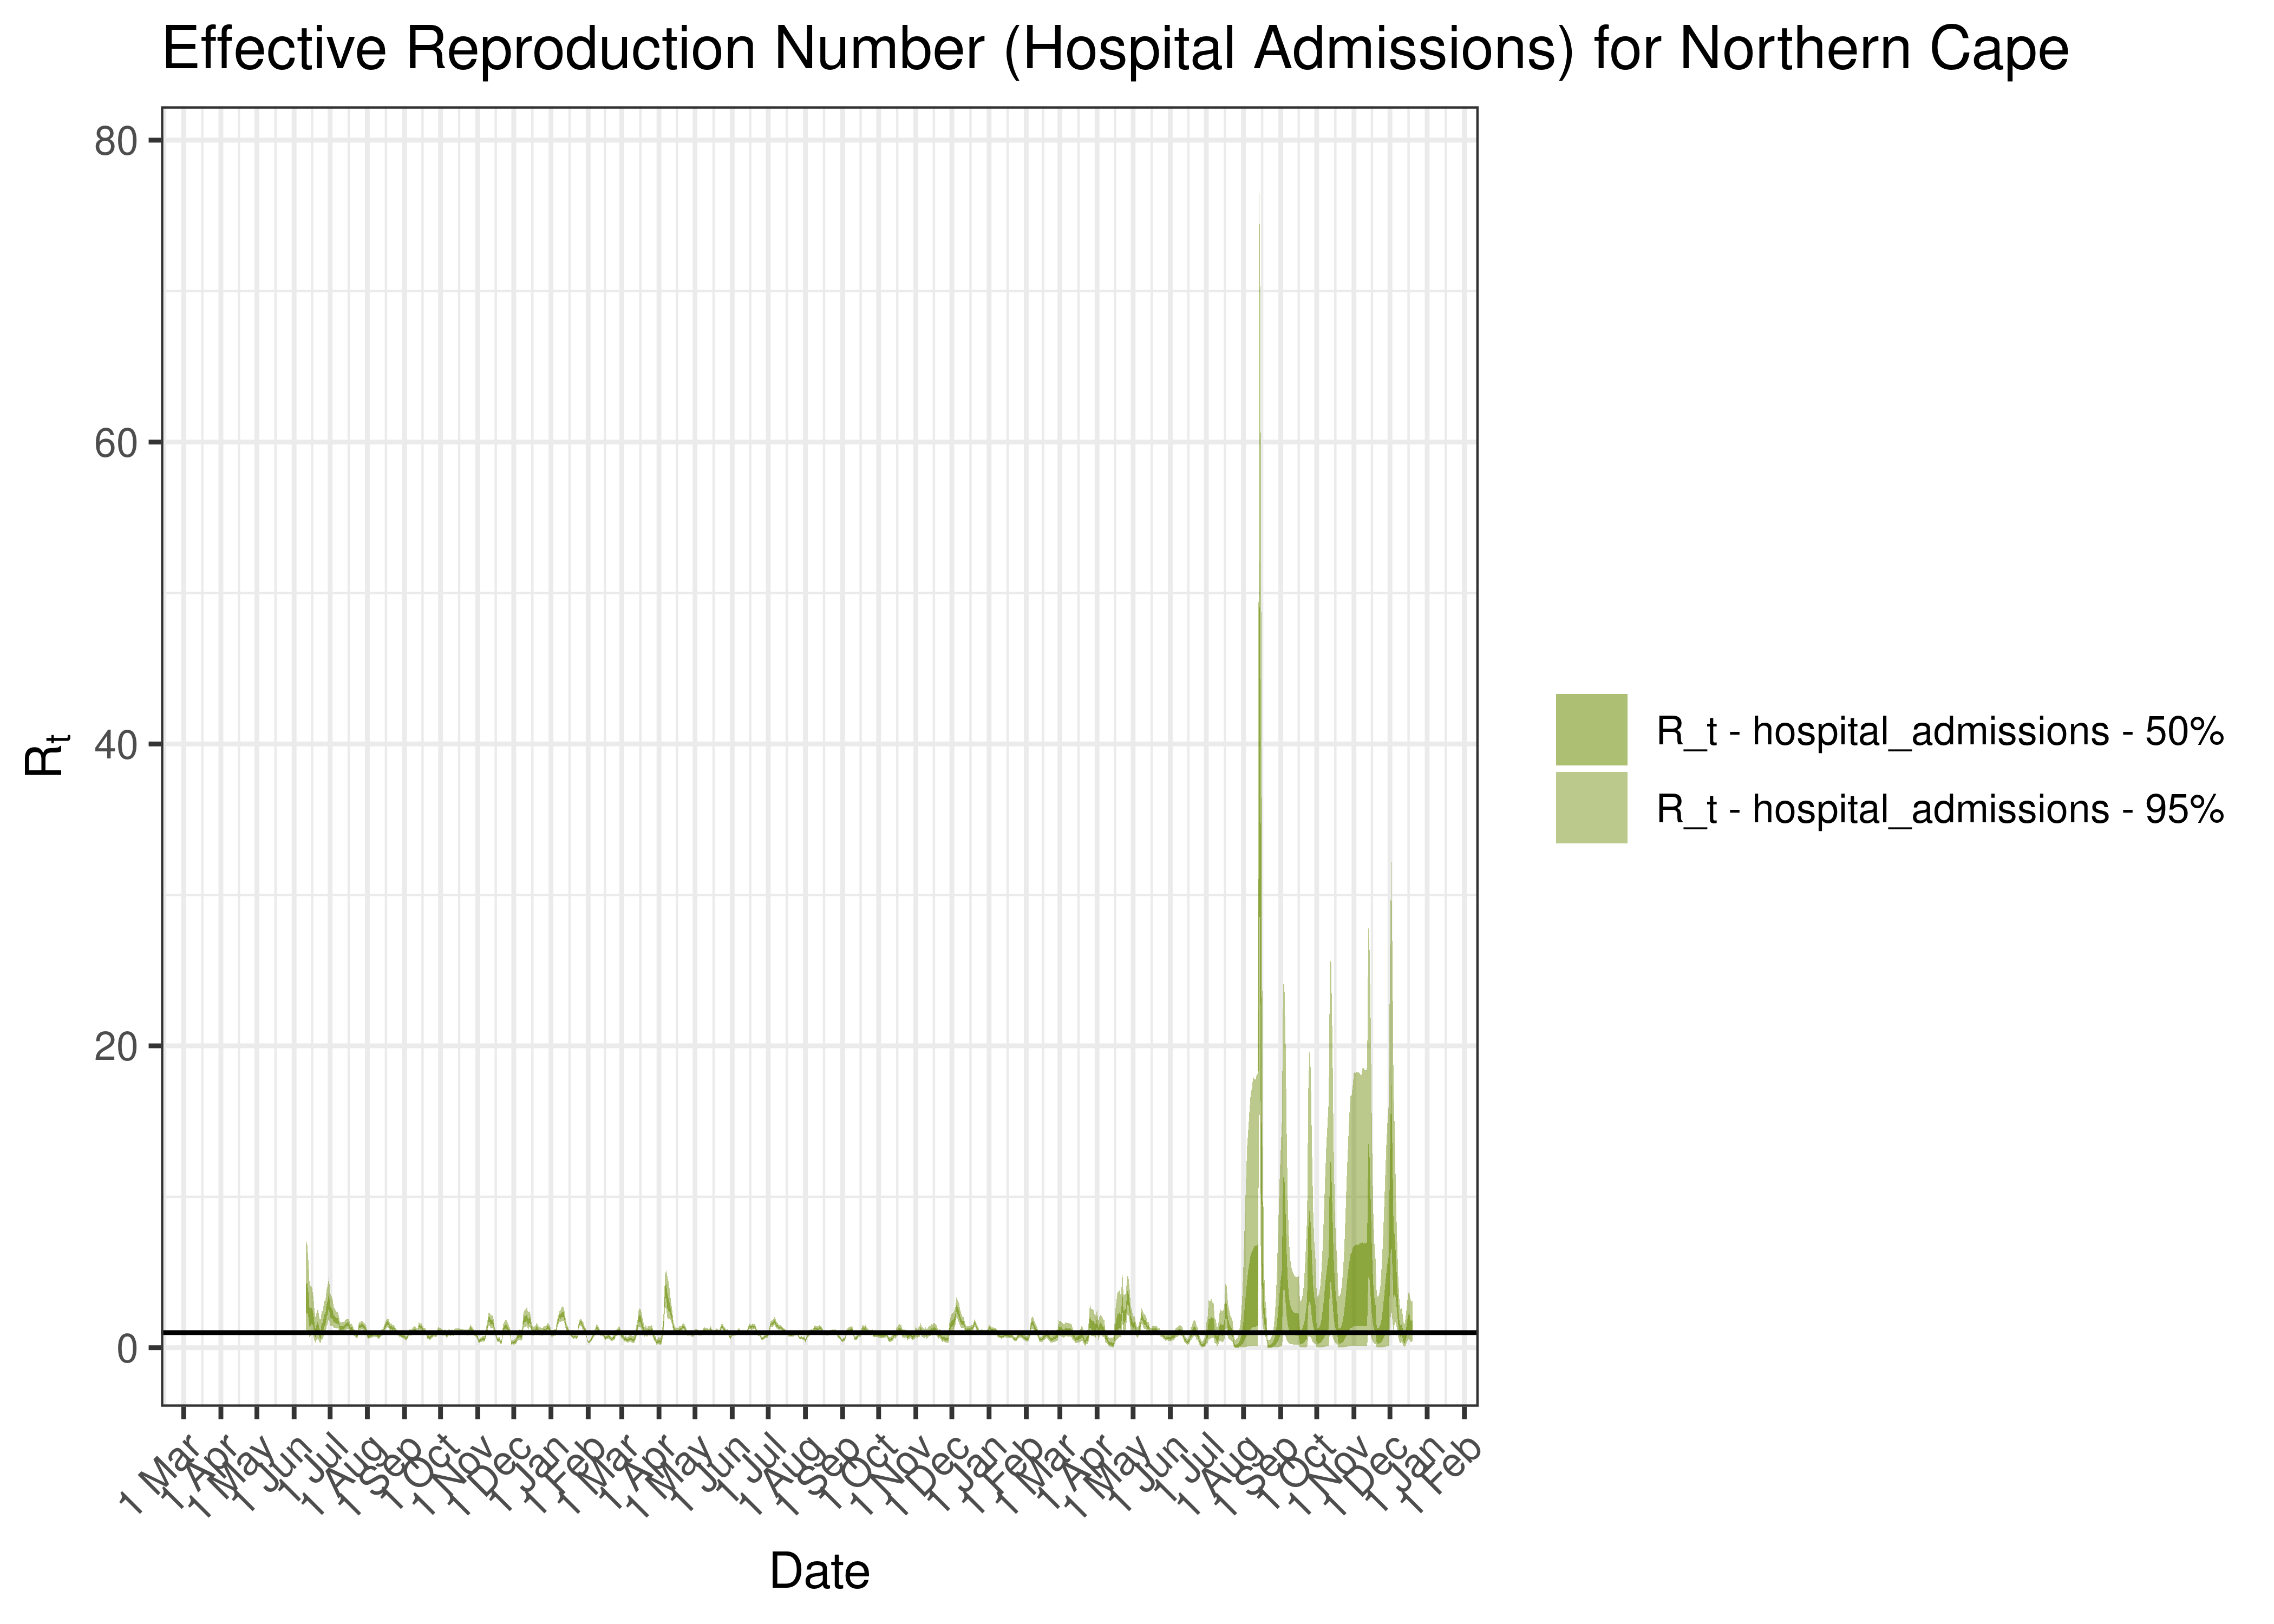
Estimated Effective Reproduction Number Based on Hospital Admissions for Northern Cape since 1 April 2020
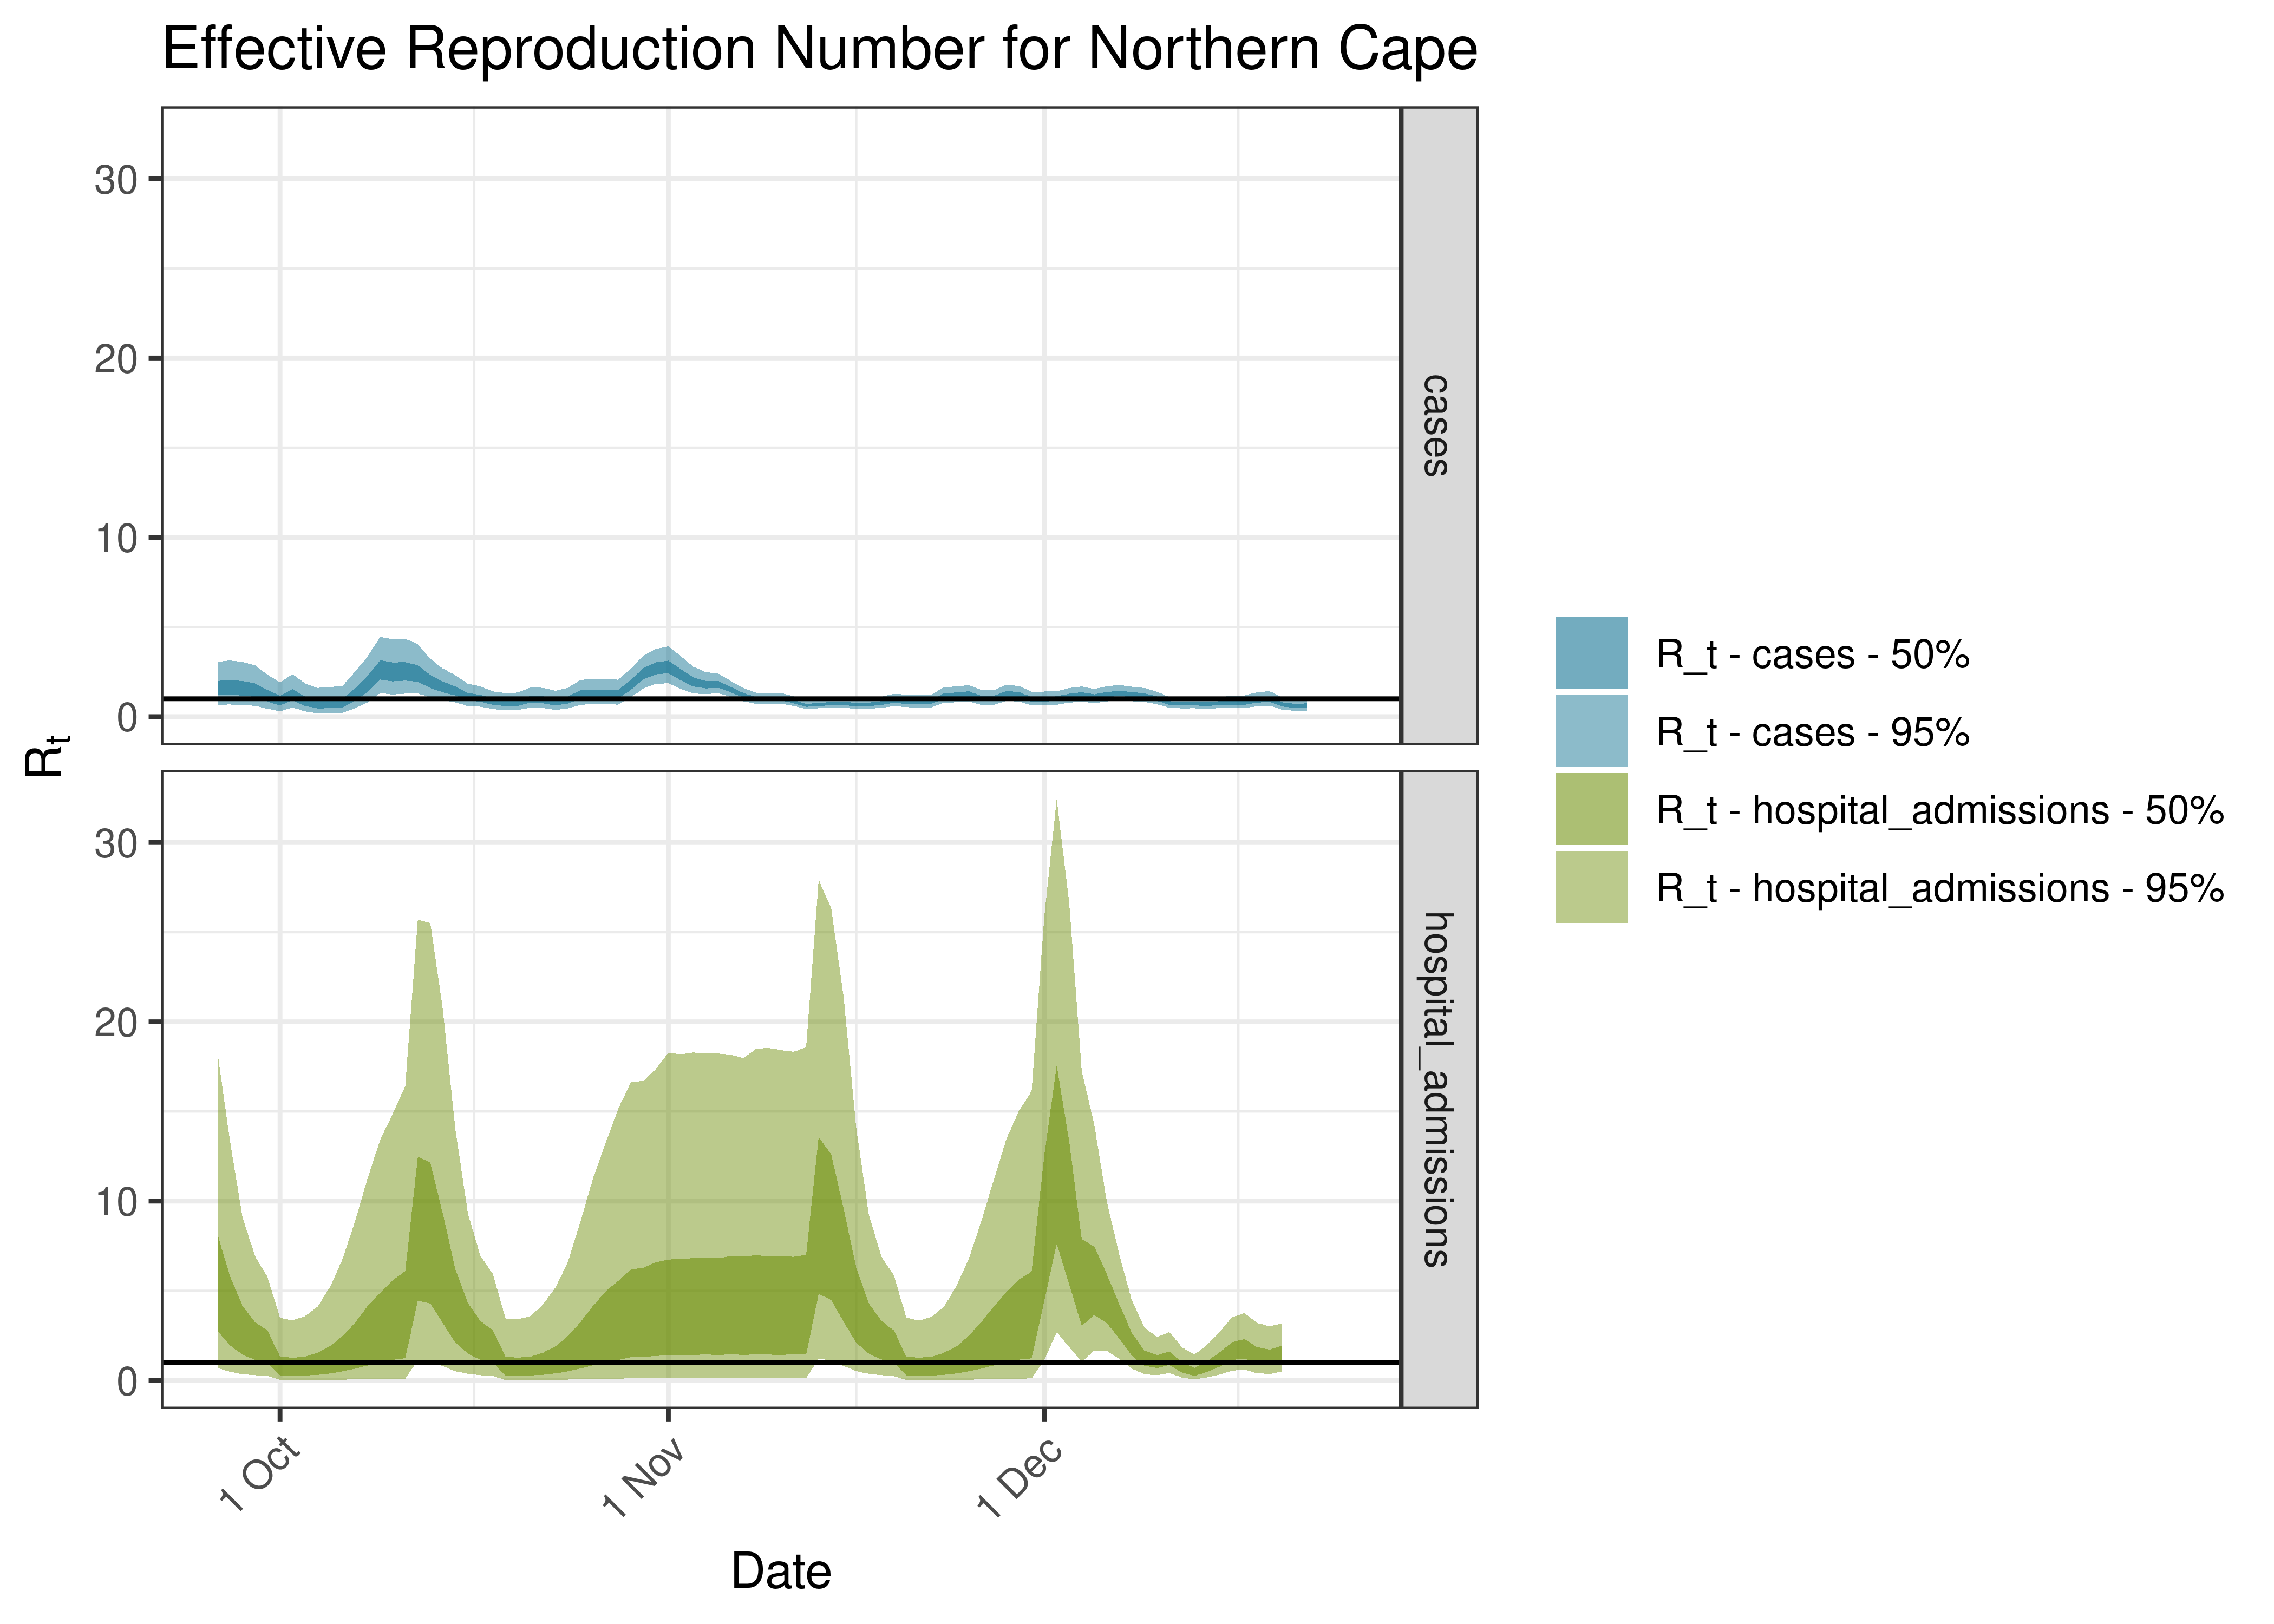
Estimated Effective Reproduction Number for Northern Cape over last 90 days
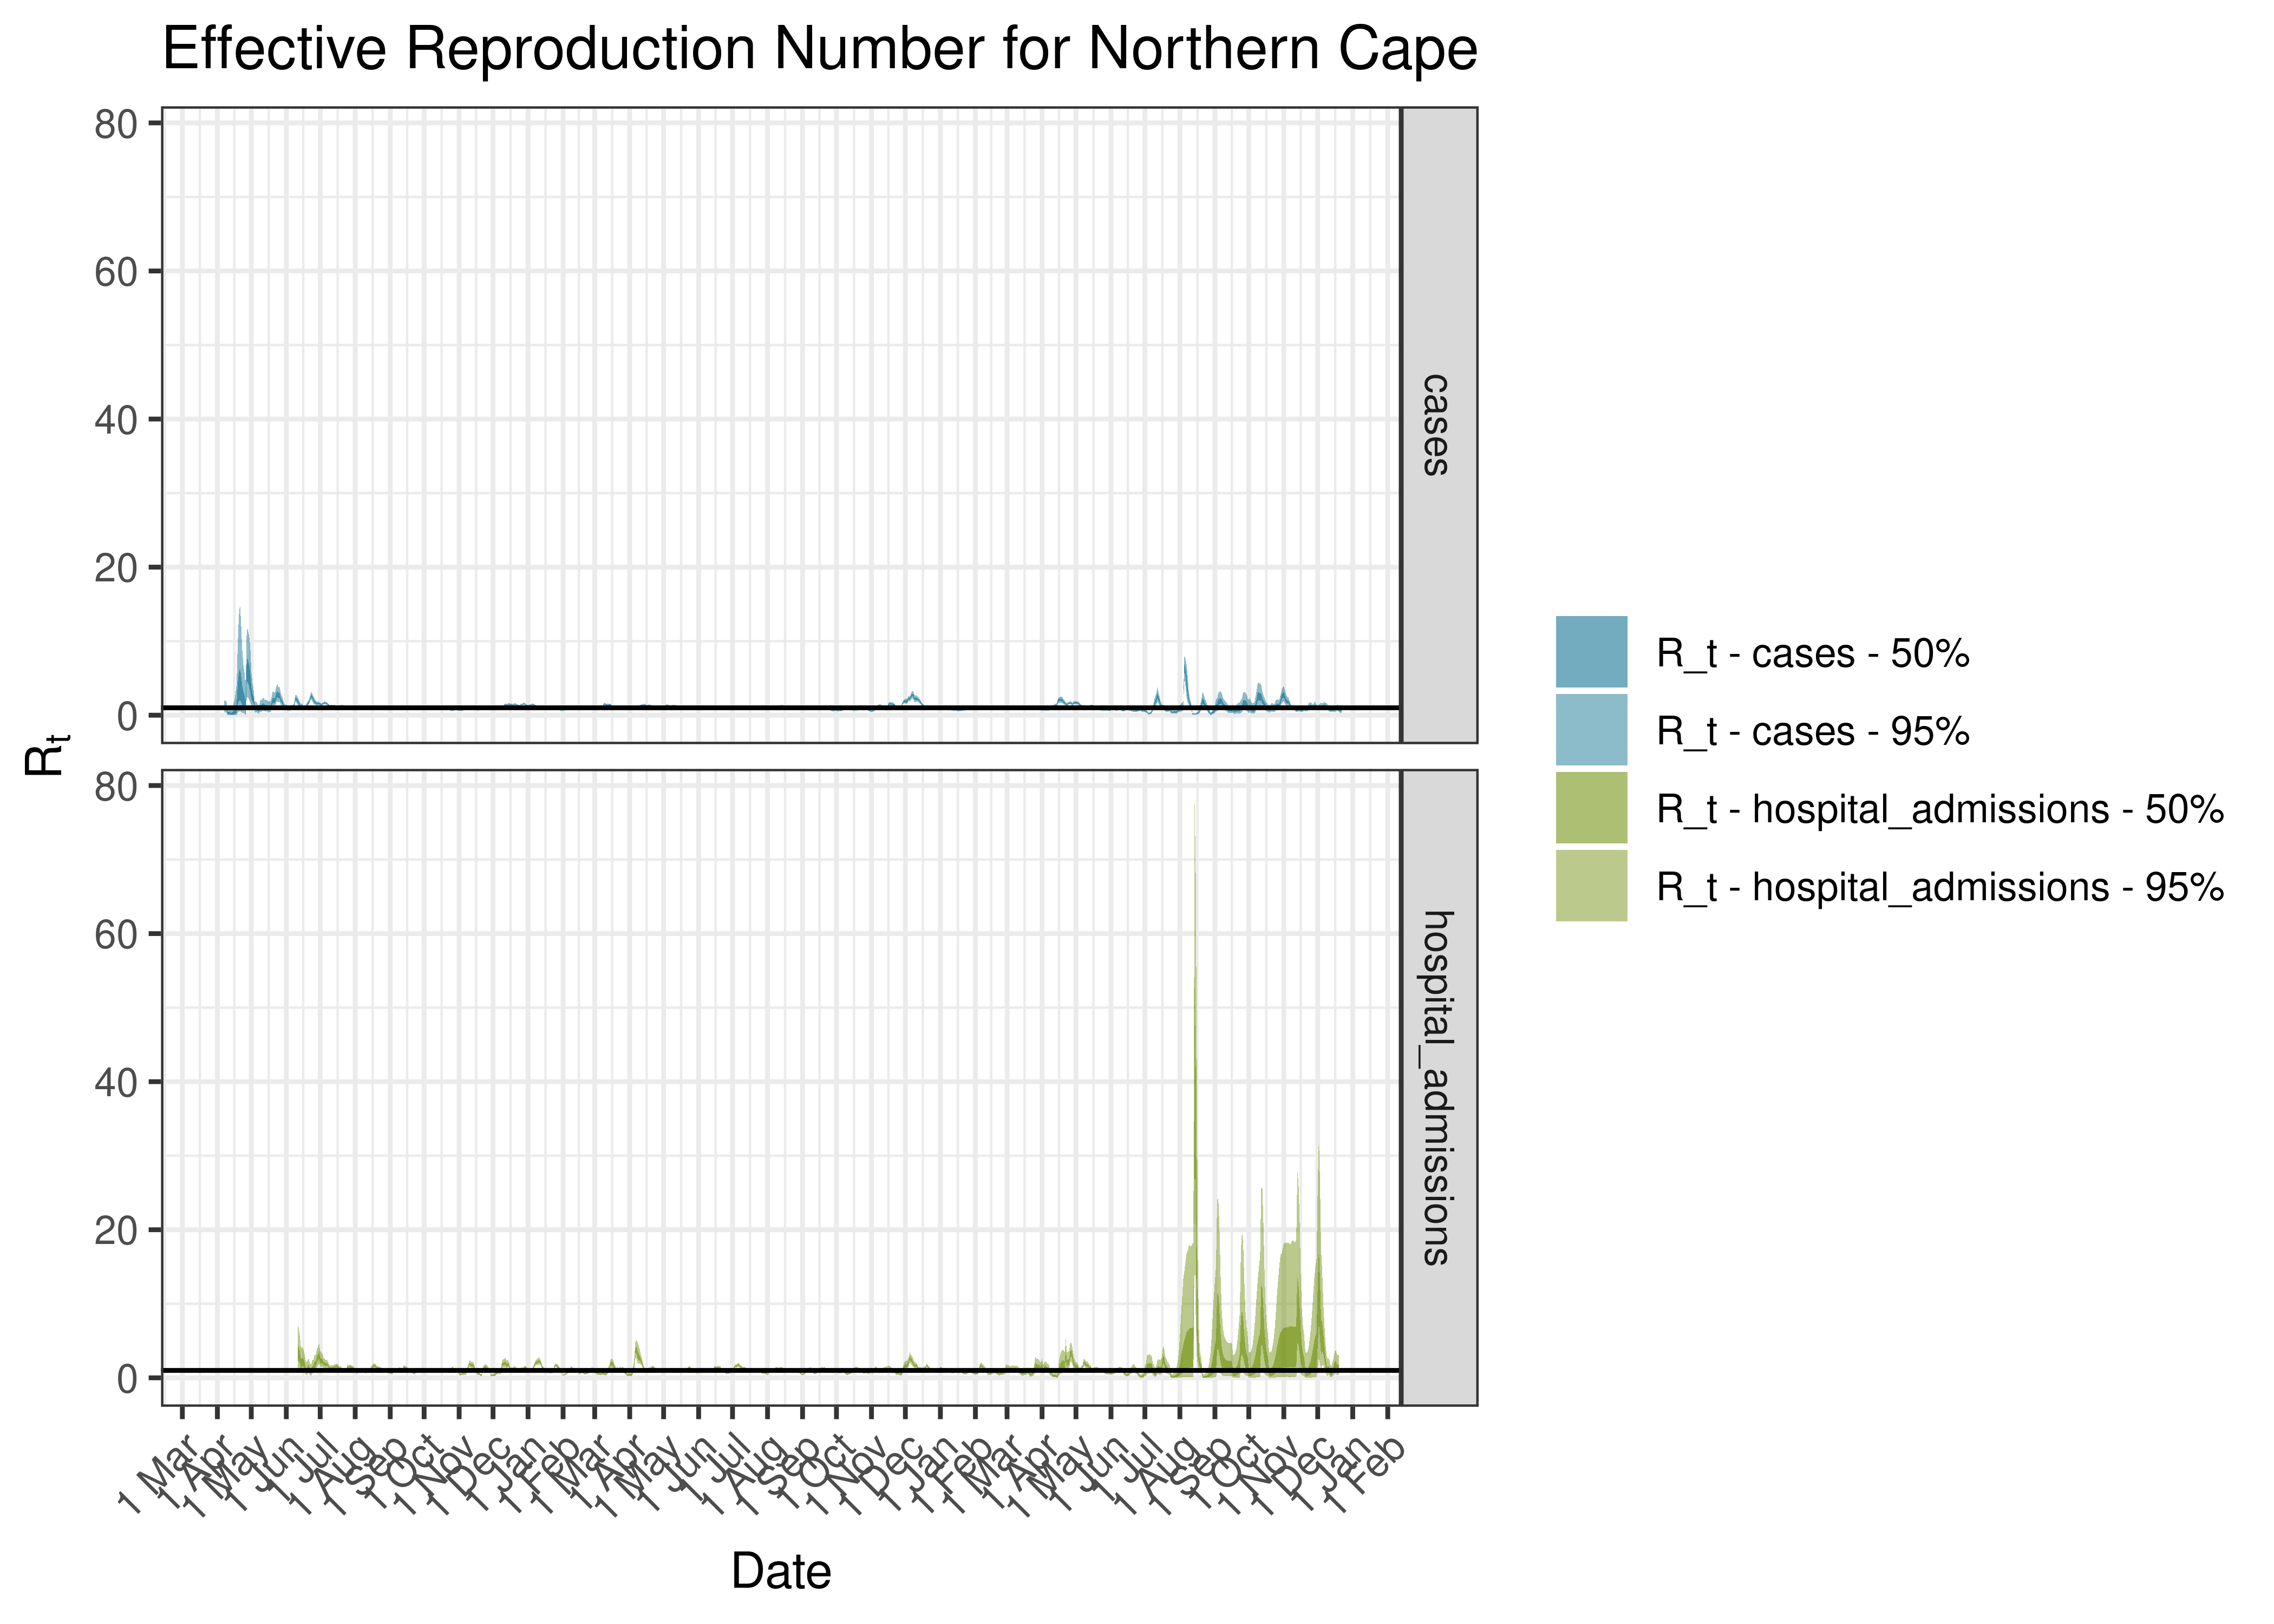
Estimated Effective Reproduction Number for Northern Cape since 1 April 2020
6.9.8 Frances Baard
6.9.8.1 Cases
Cases are tabulated by specimen received date below. Cases include estimates for late reporting in recent days as well as adjustments for any public holidays. A centred 7-day moving average is also shown. The peak daily cases in previous waves (as measured by the moving average) is also shown.
| Specimen Received Date | Cases | 7-day Moving Average | Comment |
|---|---|---|---|
| 2020-09-18 | 142 | 103 | Wave 1 Peak |
| 2020-10-02 | 80 | 80 | Wave 2 Peak |
| 2021-05-18 | 207 | 187 | Wave 3 Peak |
| 2021-12-17 | 277 | 298 | Wave 4 Peak |
| 2022-05-14 | 39 | 91 | Wave 5 Peak (to date) |
Below a 7-day moving average daily case count are plotted for Frances Baard on a log scale since start of the epidemic:
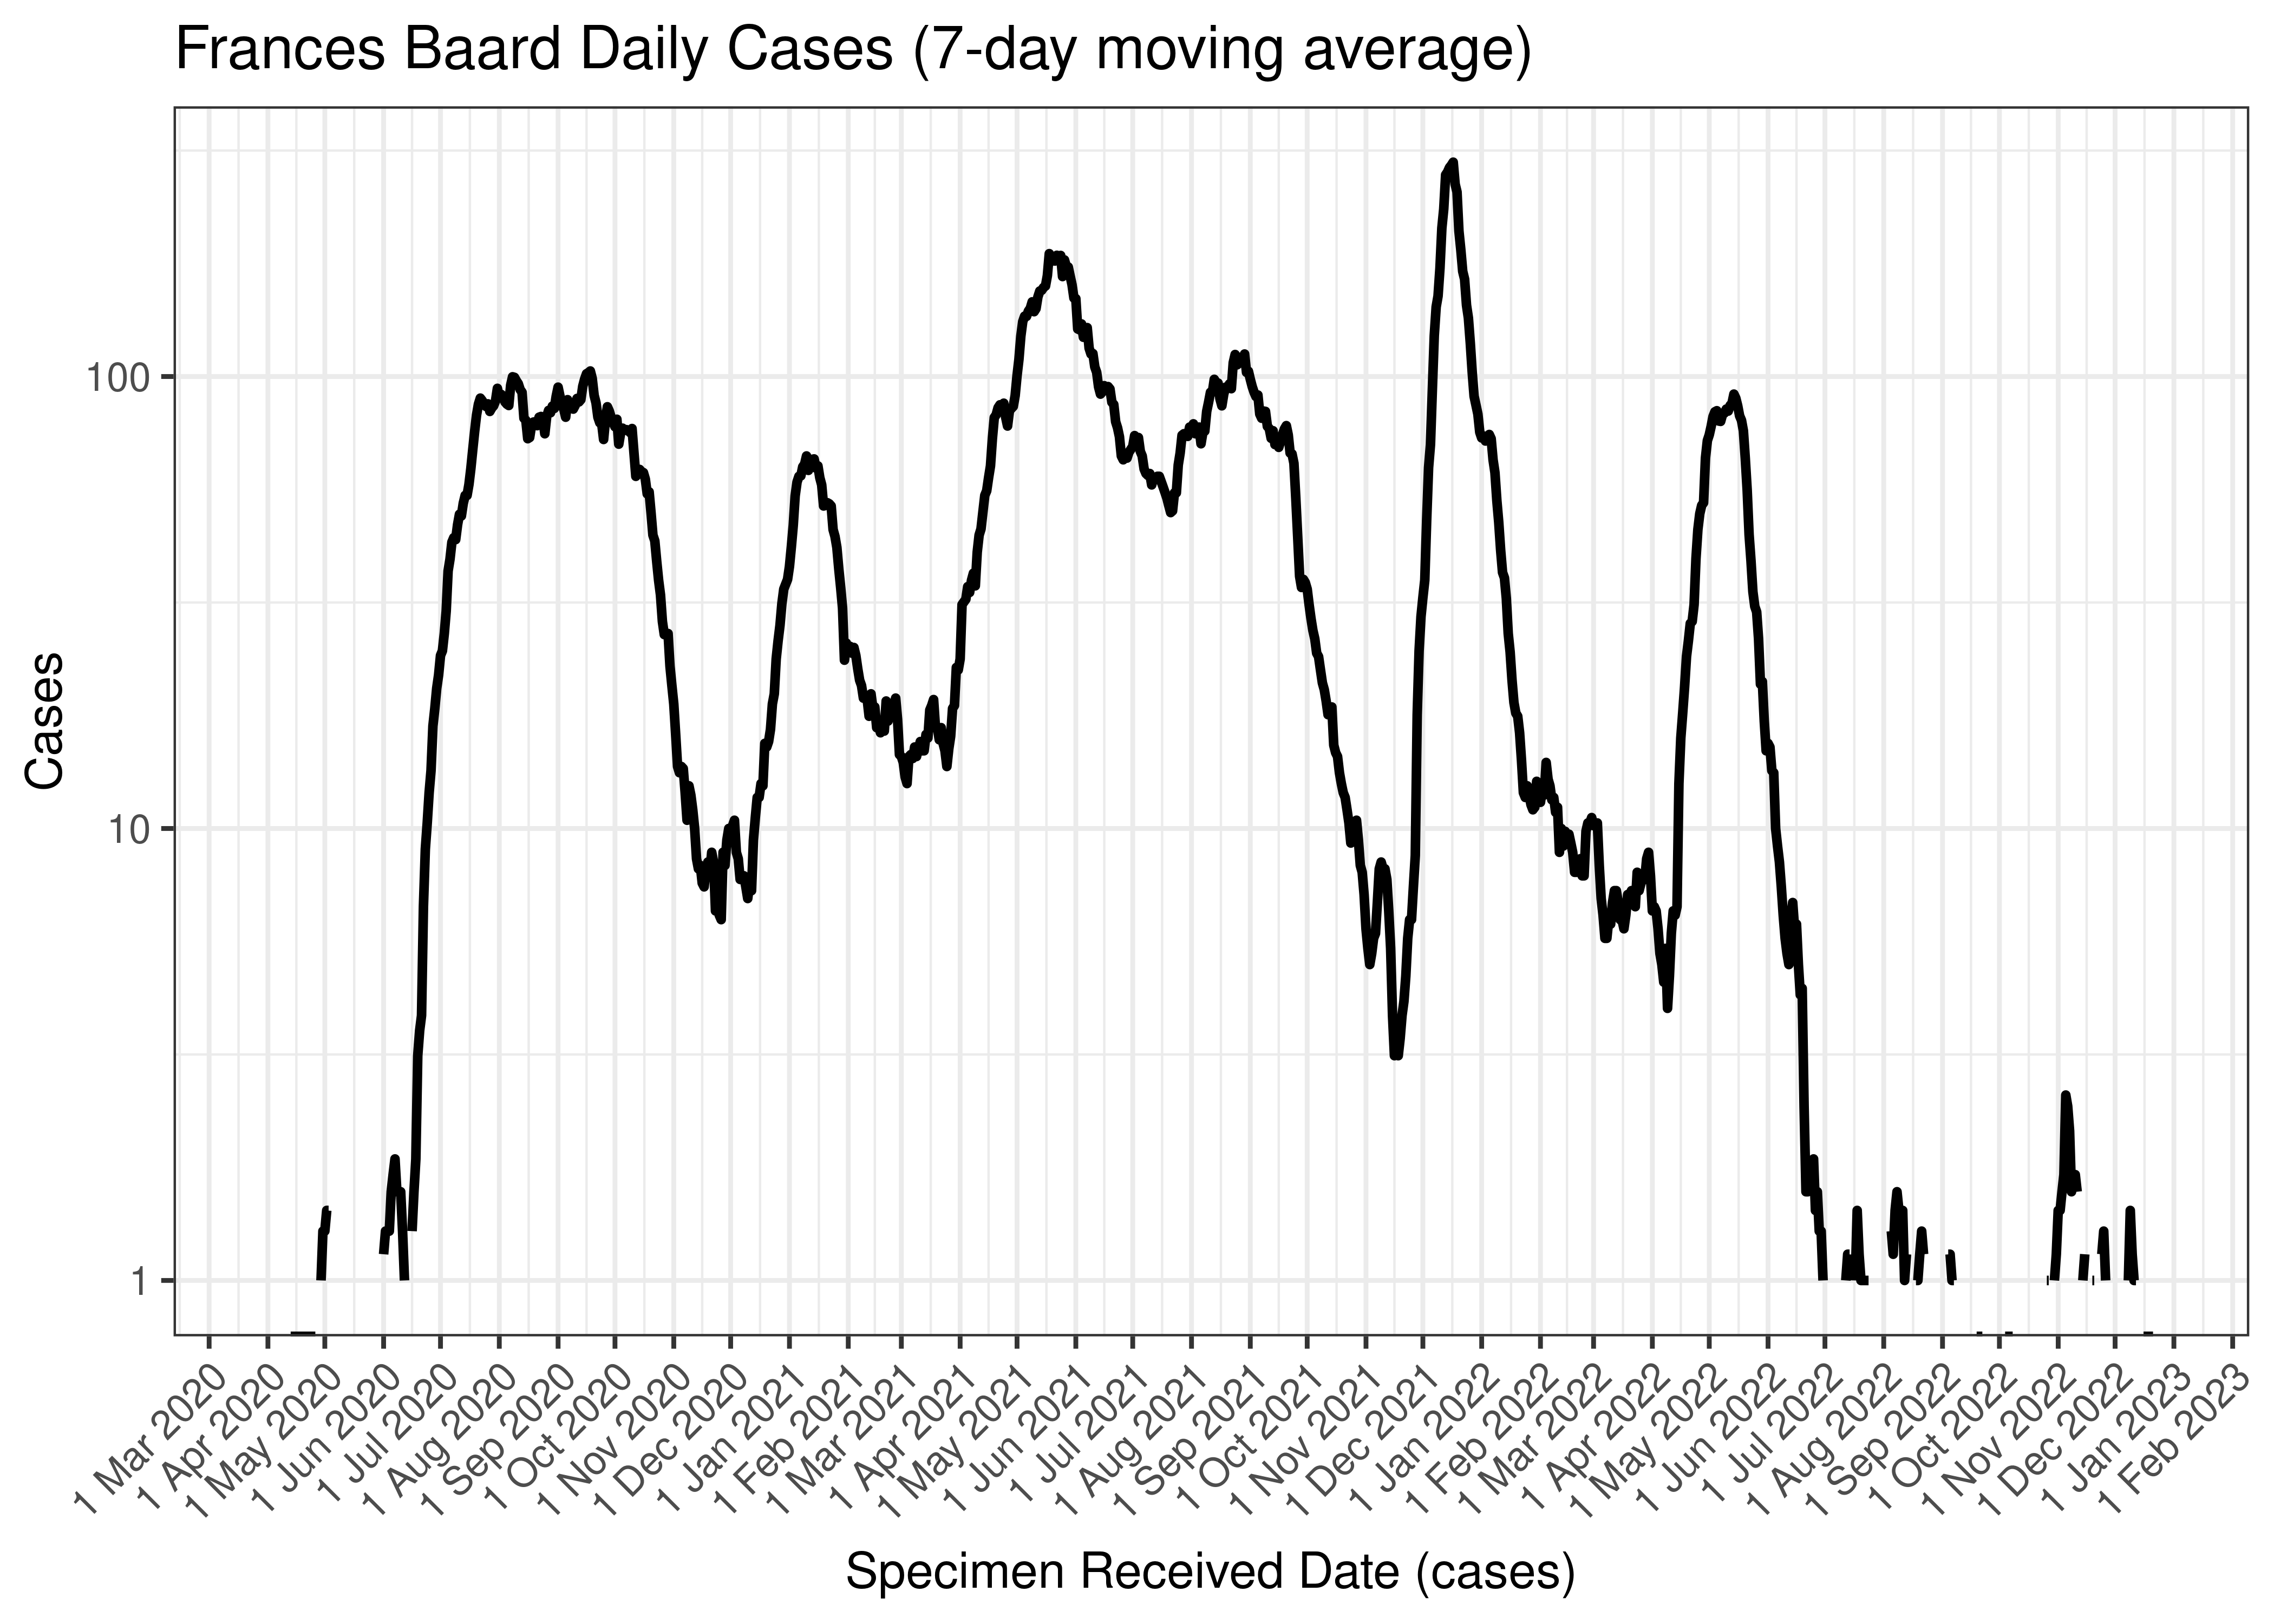
Frances Baard Daily Cases (7-day moving average)
Below the above chart is repeated for the last 30-days:

Frances Baard Daily Cases for Last 30-days (7-day moving average)
6.9.8.2 Reproduction Number
Below current (last weekly) reproduction number estimates are tabulated for Frances Baard.
| Count (Per Day) | Week Ending | Reproduction Number [95% Confidence Interval] | |
|---|---|---|---|
| Frances Baard | 0.1 | 2022-12-25 | 1.46 [0.16 - 4.41] |
Below the effective reproduction number for Frances Baard over the last 90 days are plotted together with a plot since start of the pandemic.
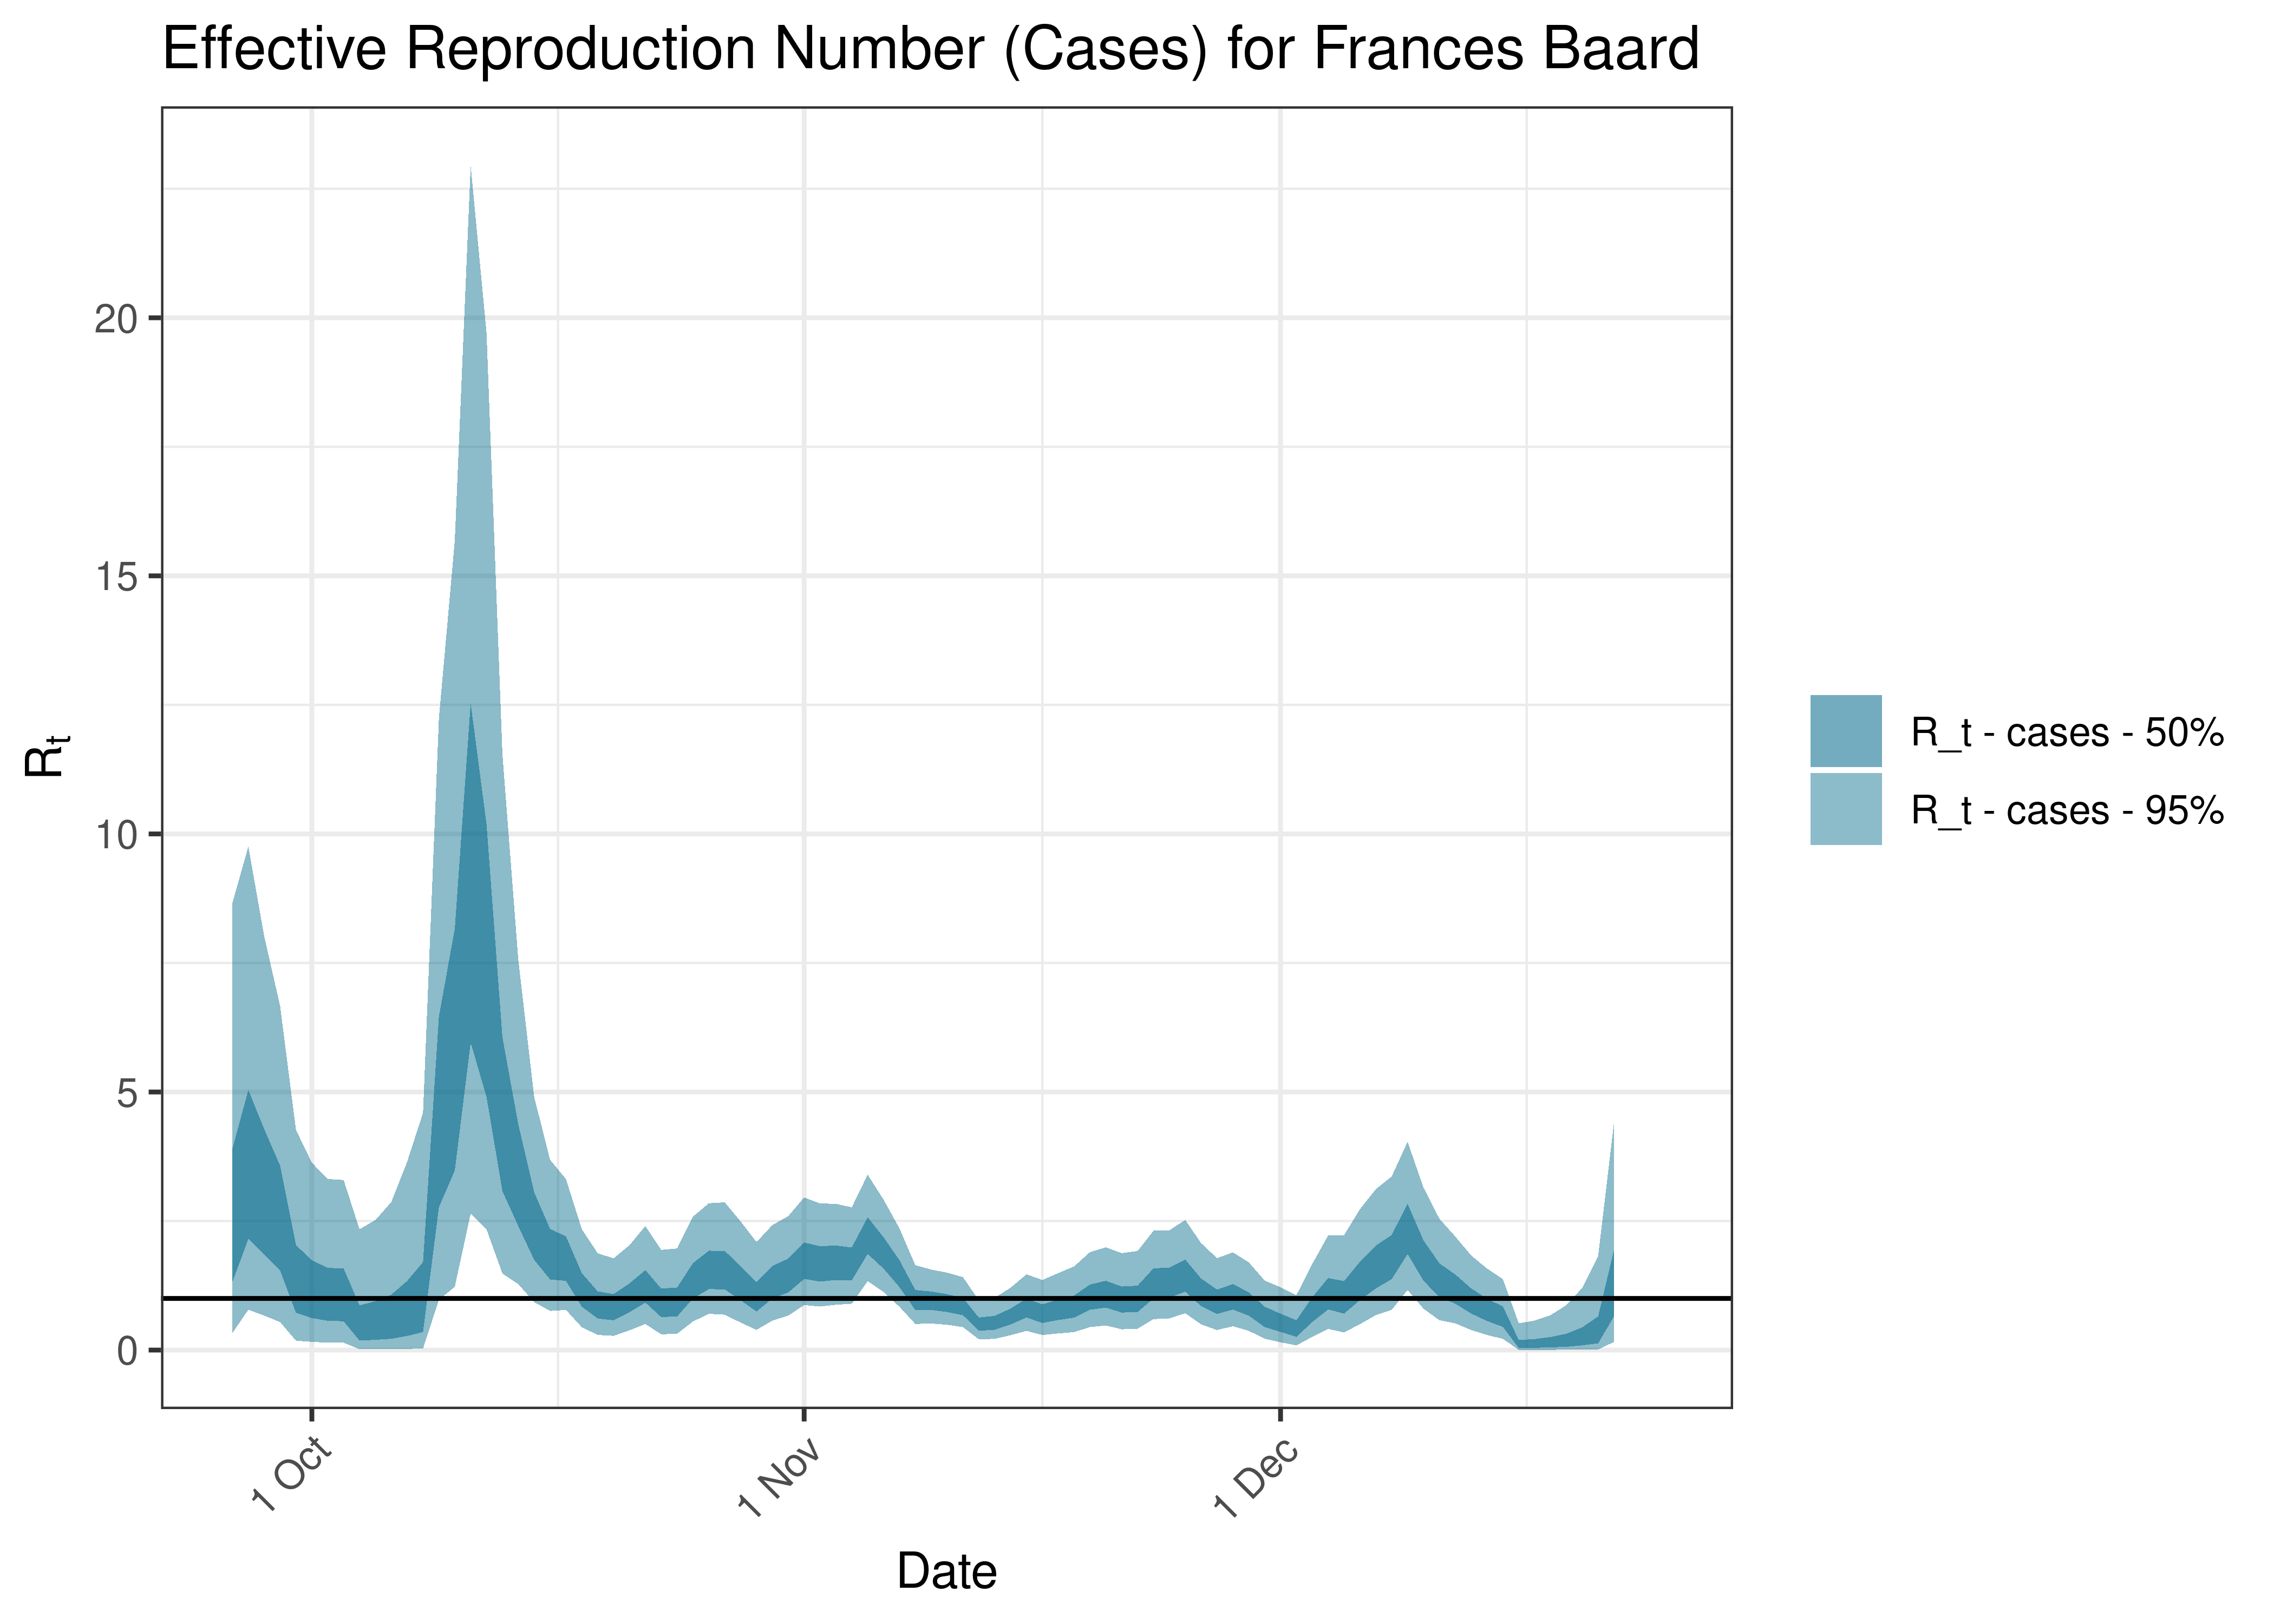
Estimated Effective Reproduction Number Based on Cases for Frances Baard over last 90 days
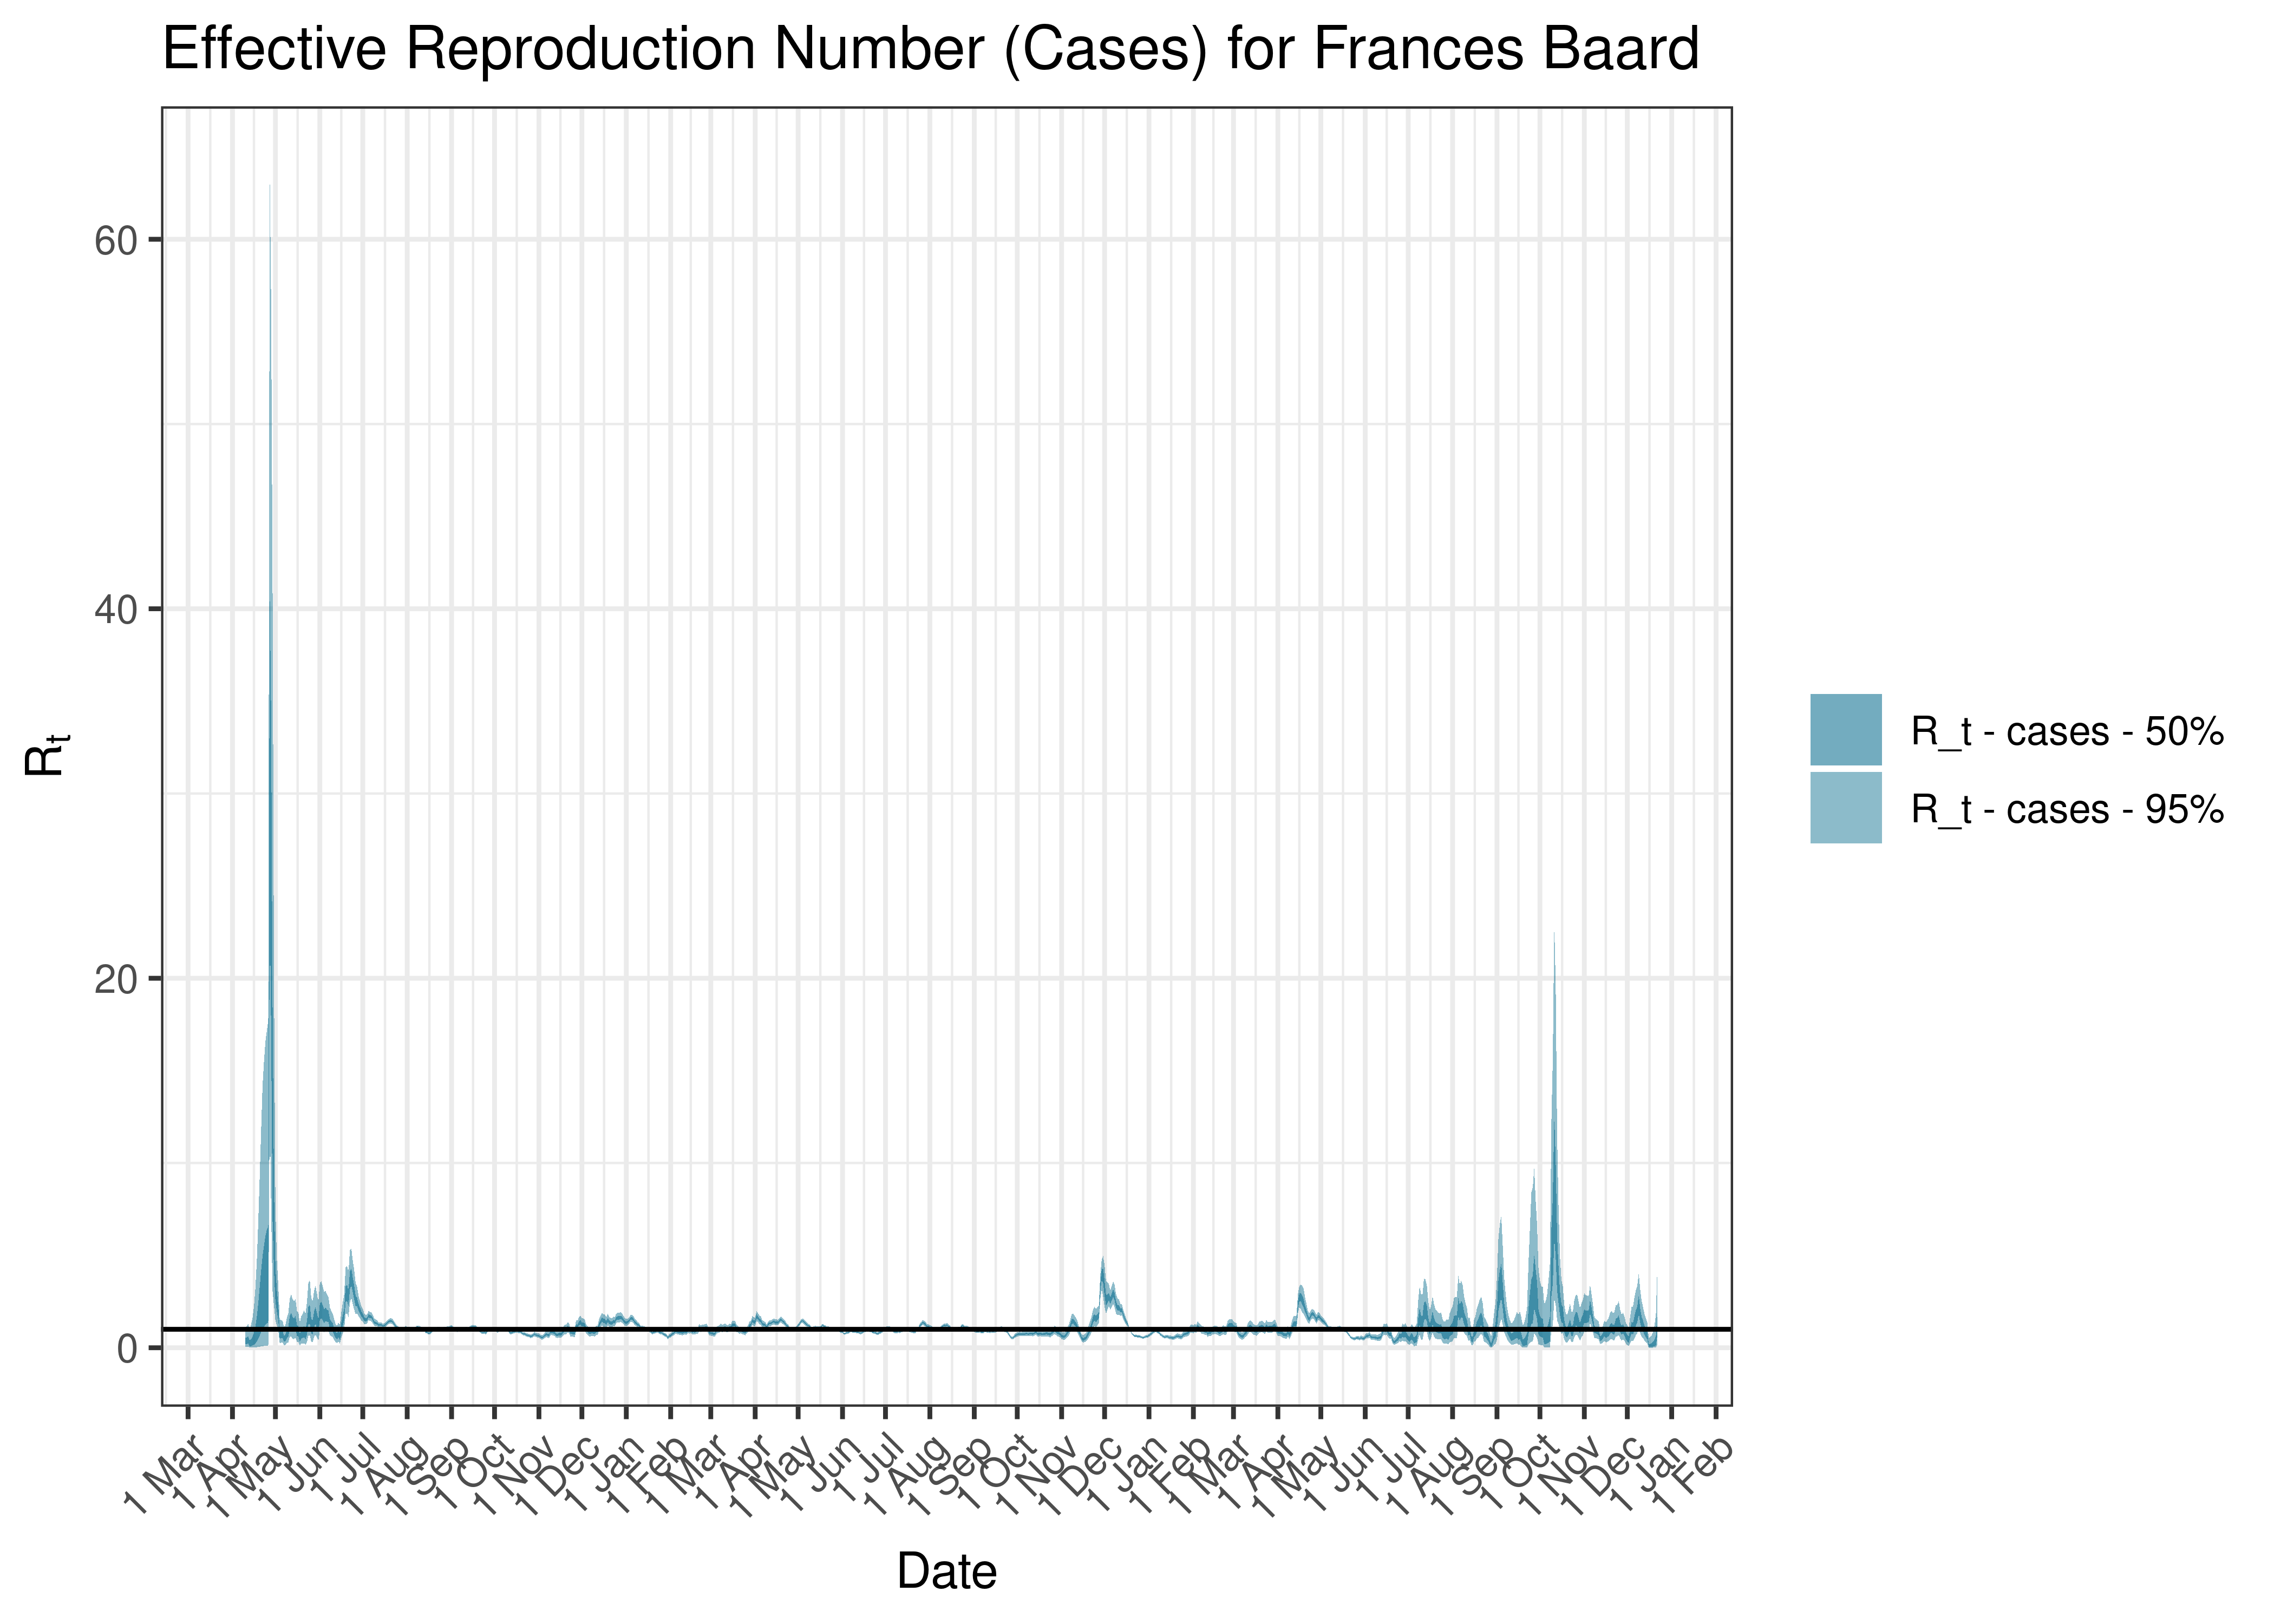
Estimated Effective Reproduction Number Based on Cases for Frances Baard since 1 April 2020
6.9.9 John Taolo Gaetsewe
6.9.9.1 Cases
Cases are tabulated by specimen received date below. Cases include estimates for late reporting in recent days as well as adjustments for any public holidays. A centred 7-day moving average is also shown. The peak daily cases in previous waves (as measured by the moving average) is also shown.
| Specimen Received Date | Cases | 7-day Moving Average | Comment |
|---|---|---|---|
| 2020-08-05 | 53 | 45 | Wave 1 Peak |
| 2021-01-09 | 9 | 23 | Wave 2 Peak |
| 2021-08-13 | 88 | 85 | Wave 3 Peak |
| 2021-12-17 | 53 | 50 | Wave 4 Peak |
| 2022-05-19 | 18 | 22 | Wave 5 Peak (to date) |
Below a 7-day moving average daily case count are plotted for John Taolo Gaetsewe on a log scale since start of the epidemic:
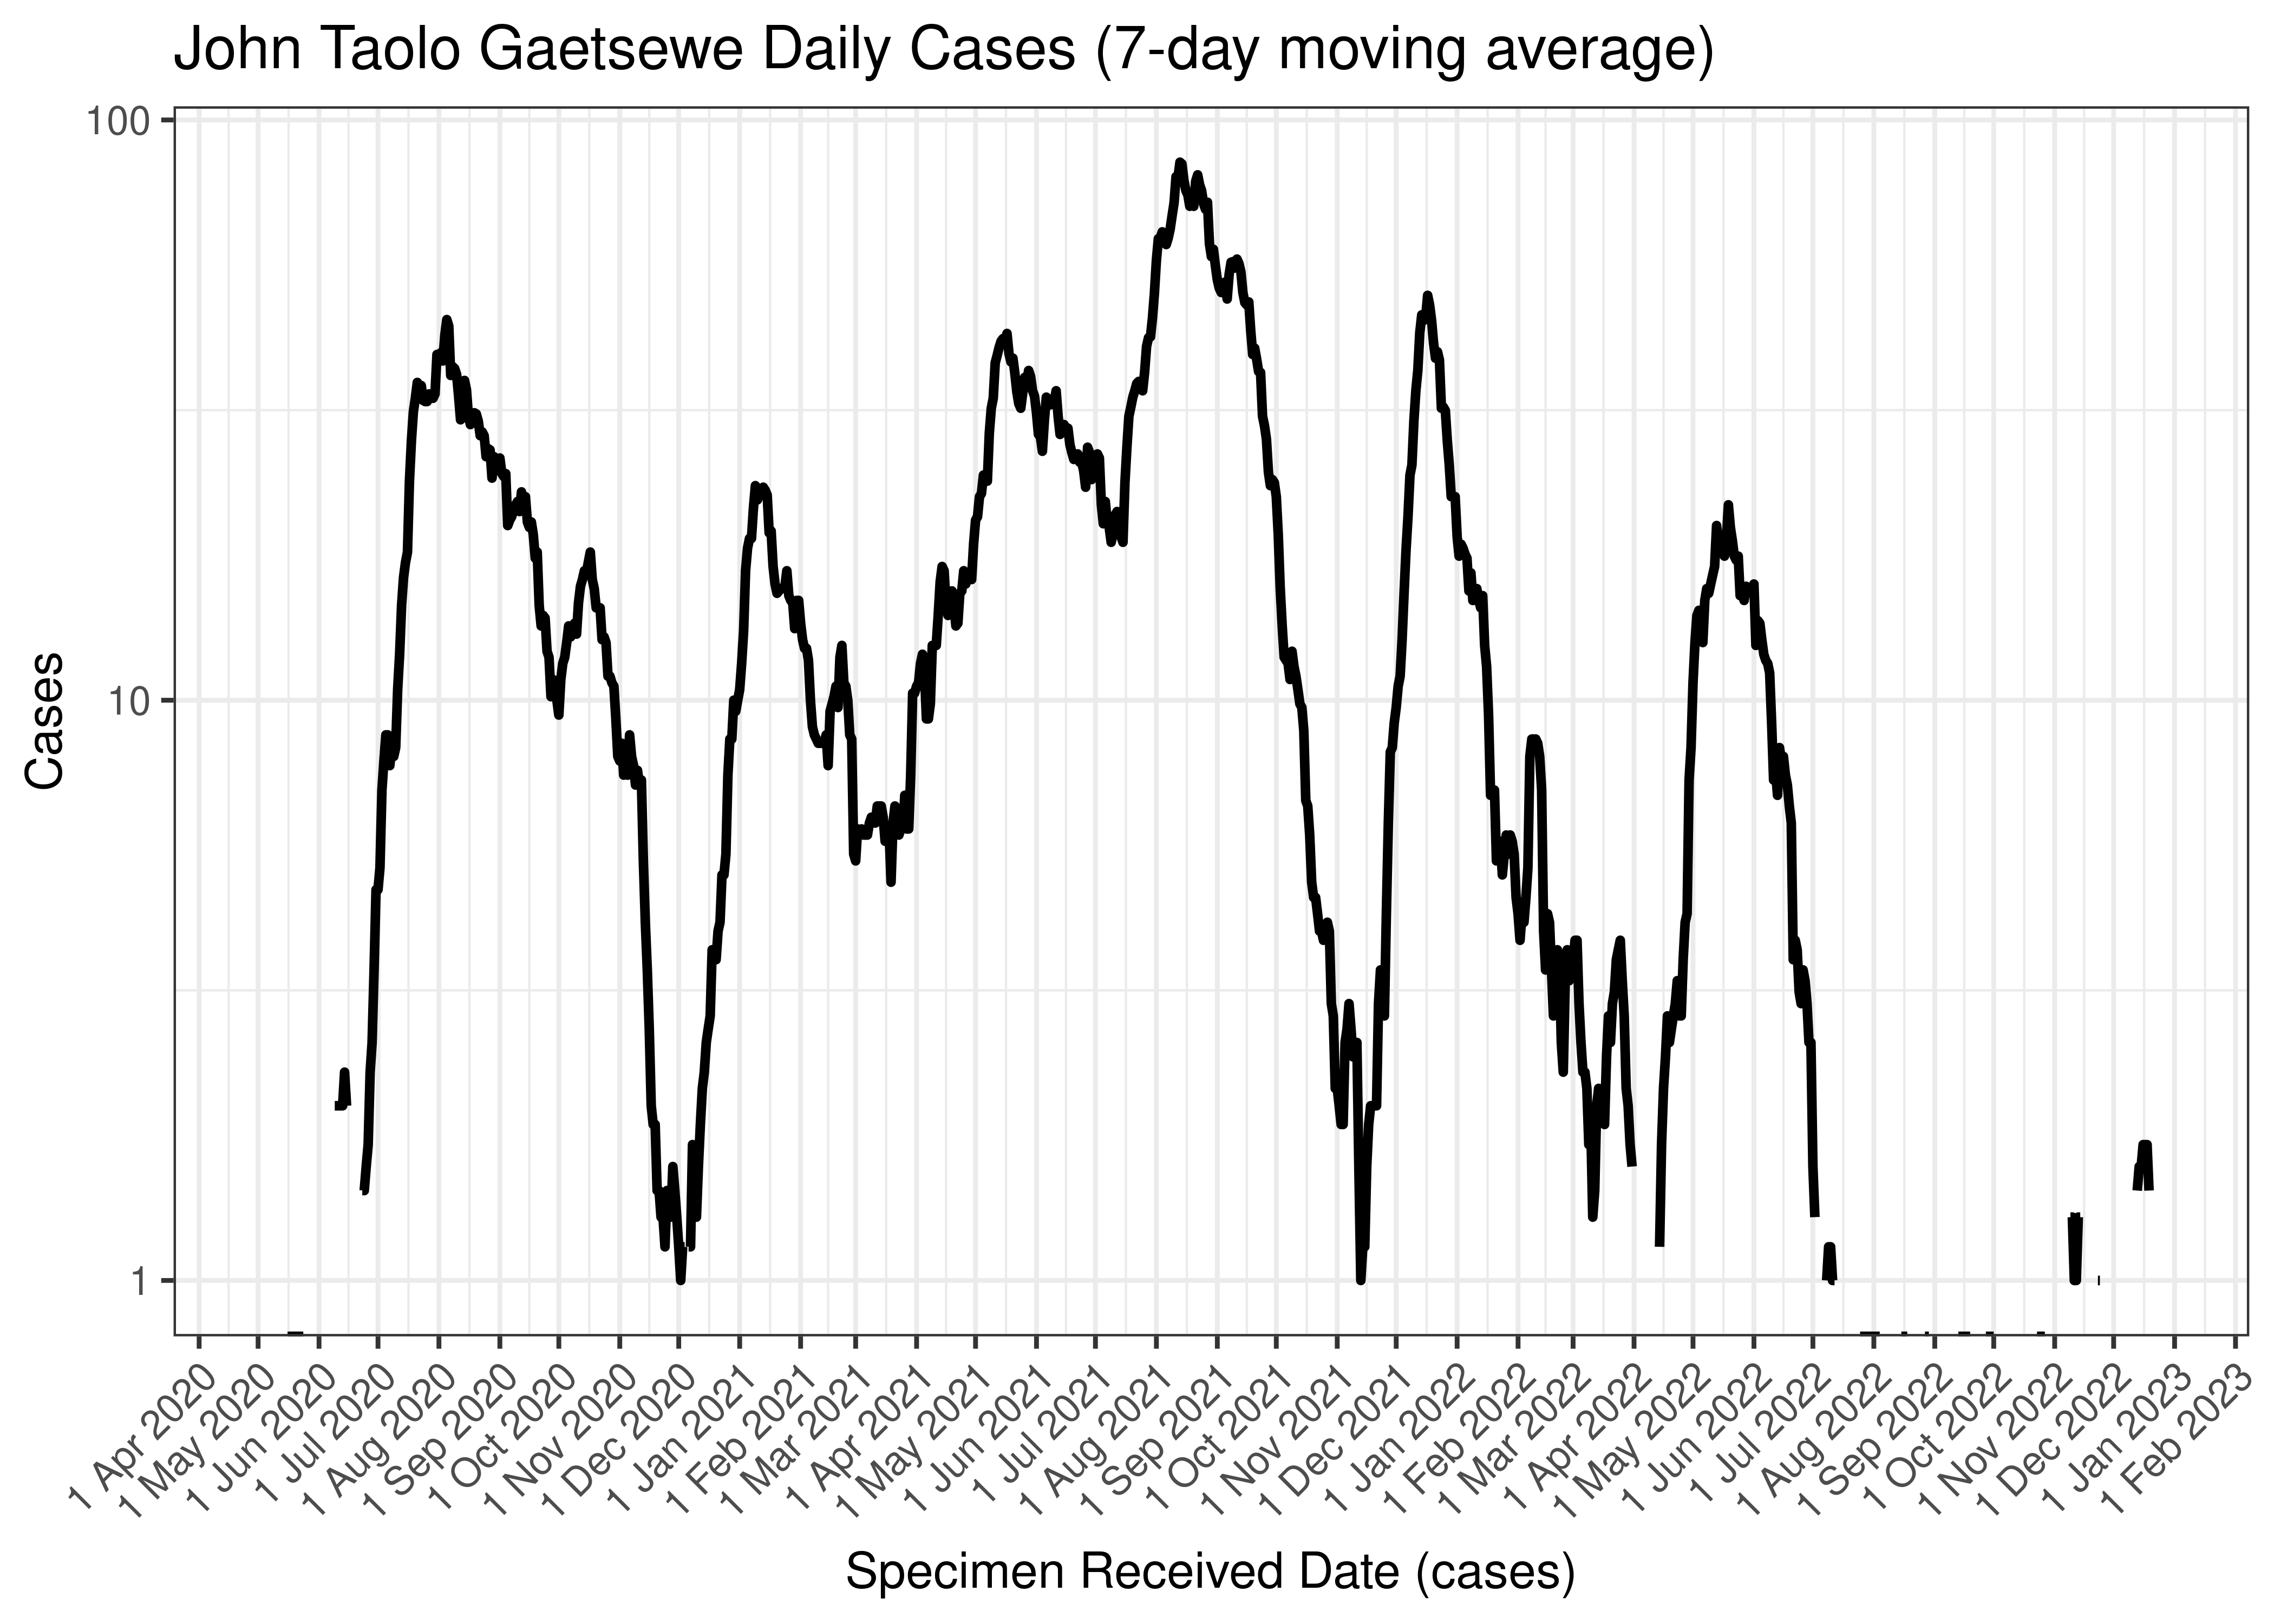
John Taolo Gaetsewe Daily Cases (7-day moving average)
Below the above chart is repeated for the last 30-days:
John Taolo Gaetsewe Daily Cases for Last 30-days (7-day moving average)
6.9.9.2 Reproduction Number
Below current (last weekly) reproduction number estimates are tabulated for John Taolo Gaetsewe.
| Count (Per Day) | Week Ending | Reproduction Number [95% Confidence Interval] | |
|---|---|---|---|
| John Taolo Gaetsewe | 0.3 | 2022-12-25 | 0.29 [0.06 - 0.70] |
Below the effective reproduction number for John Taolo Gaetsewe over the last 90 days are plotted together with a plot since start of the pandemic.
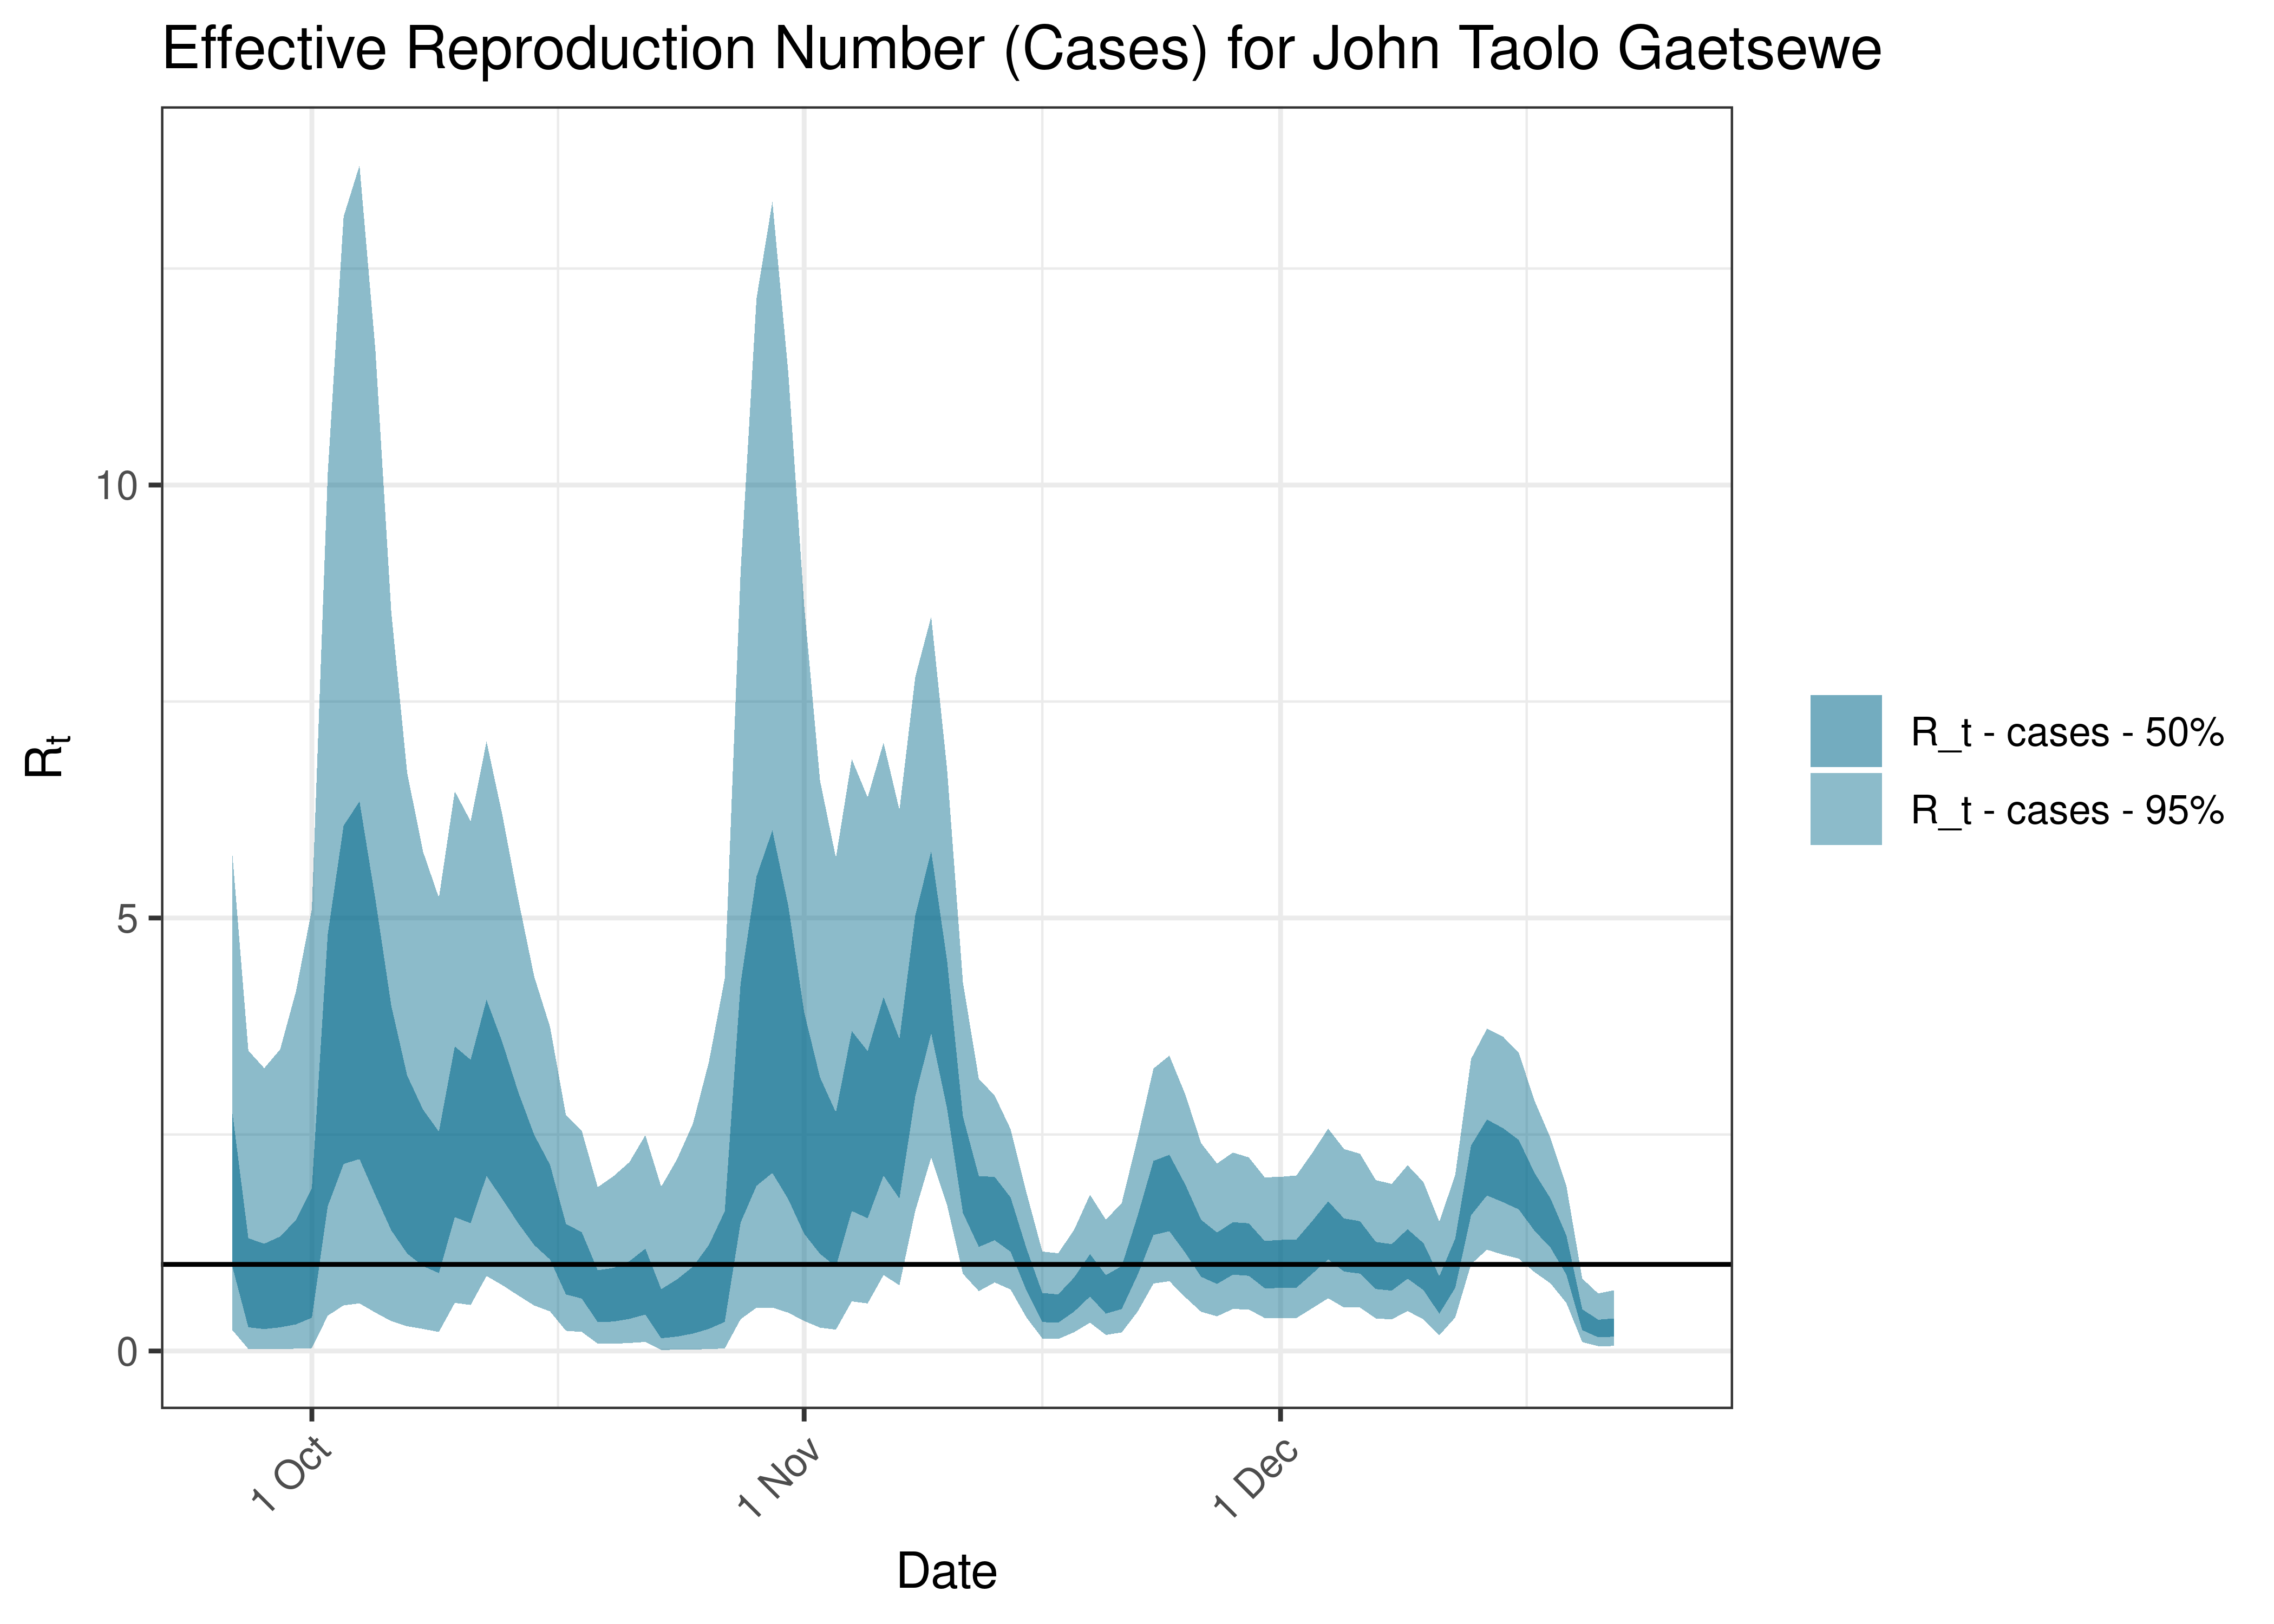
Estimated Effective Reproduction Number Based on Cases for John Taolo Gaetsewe over last 90 days
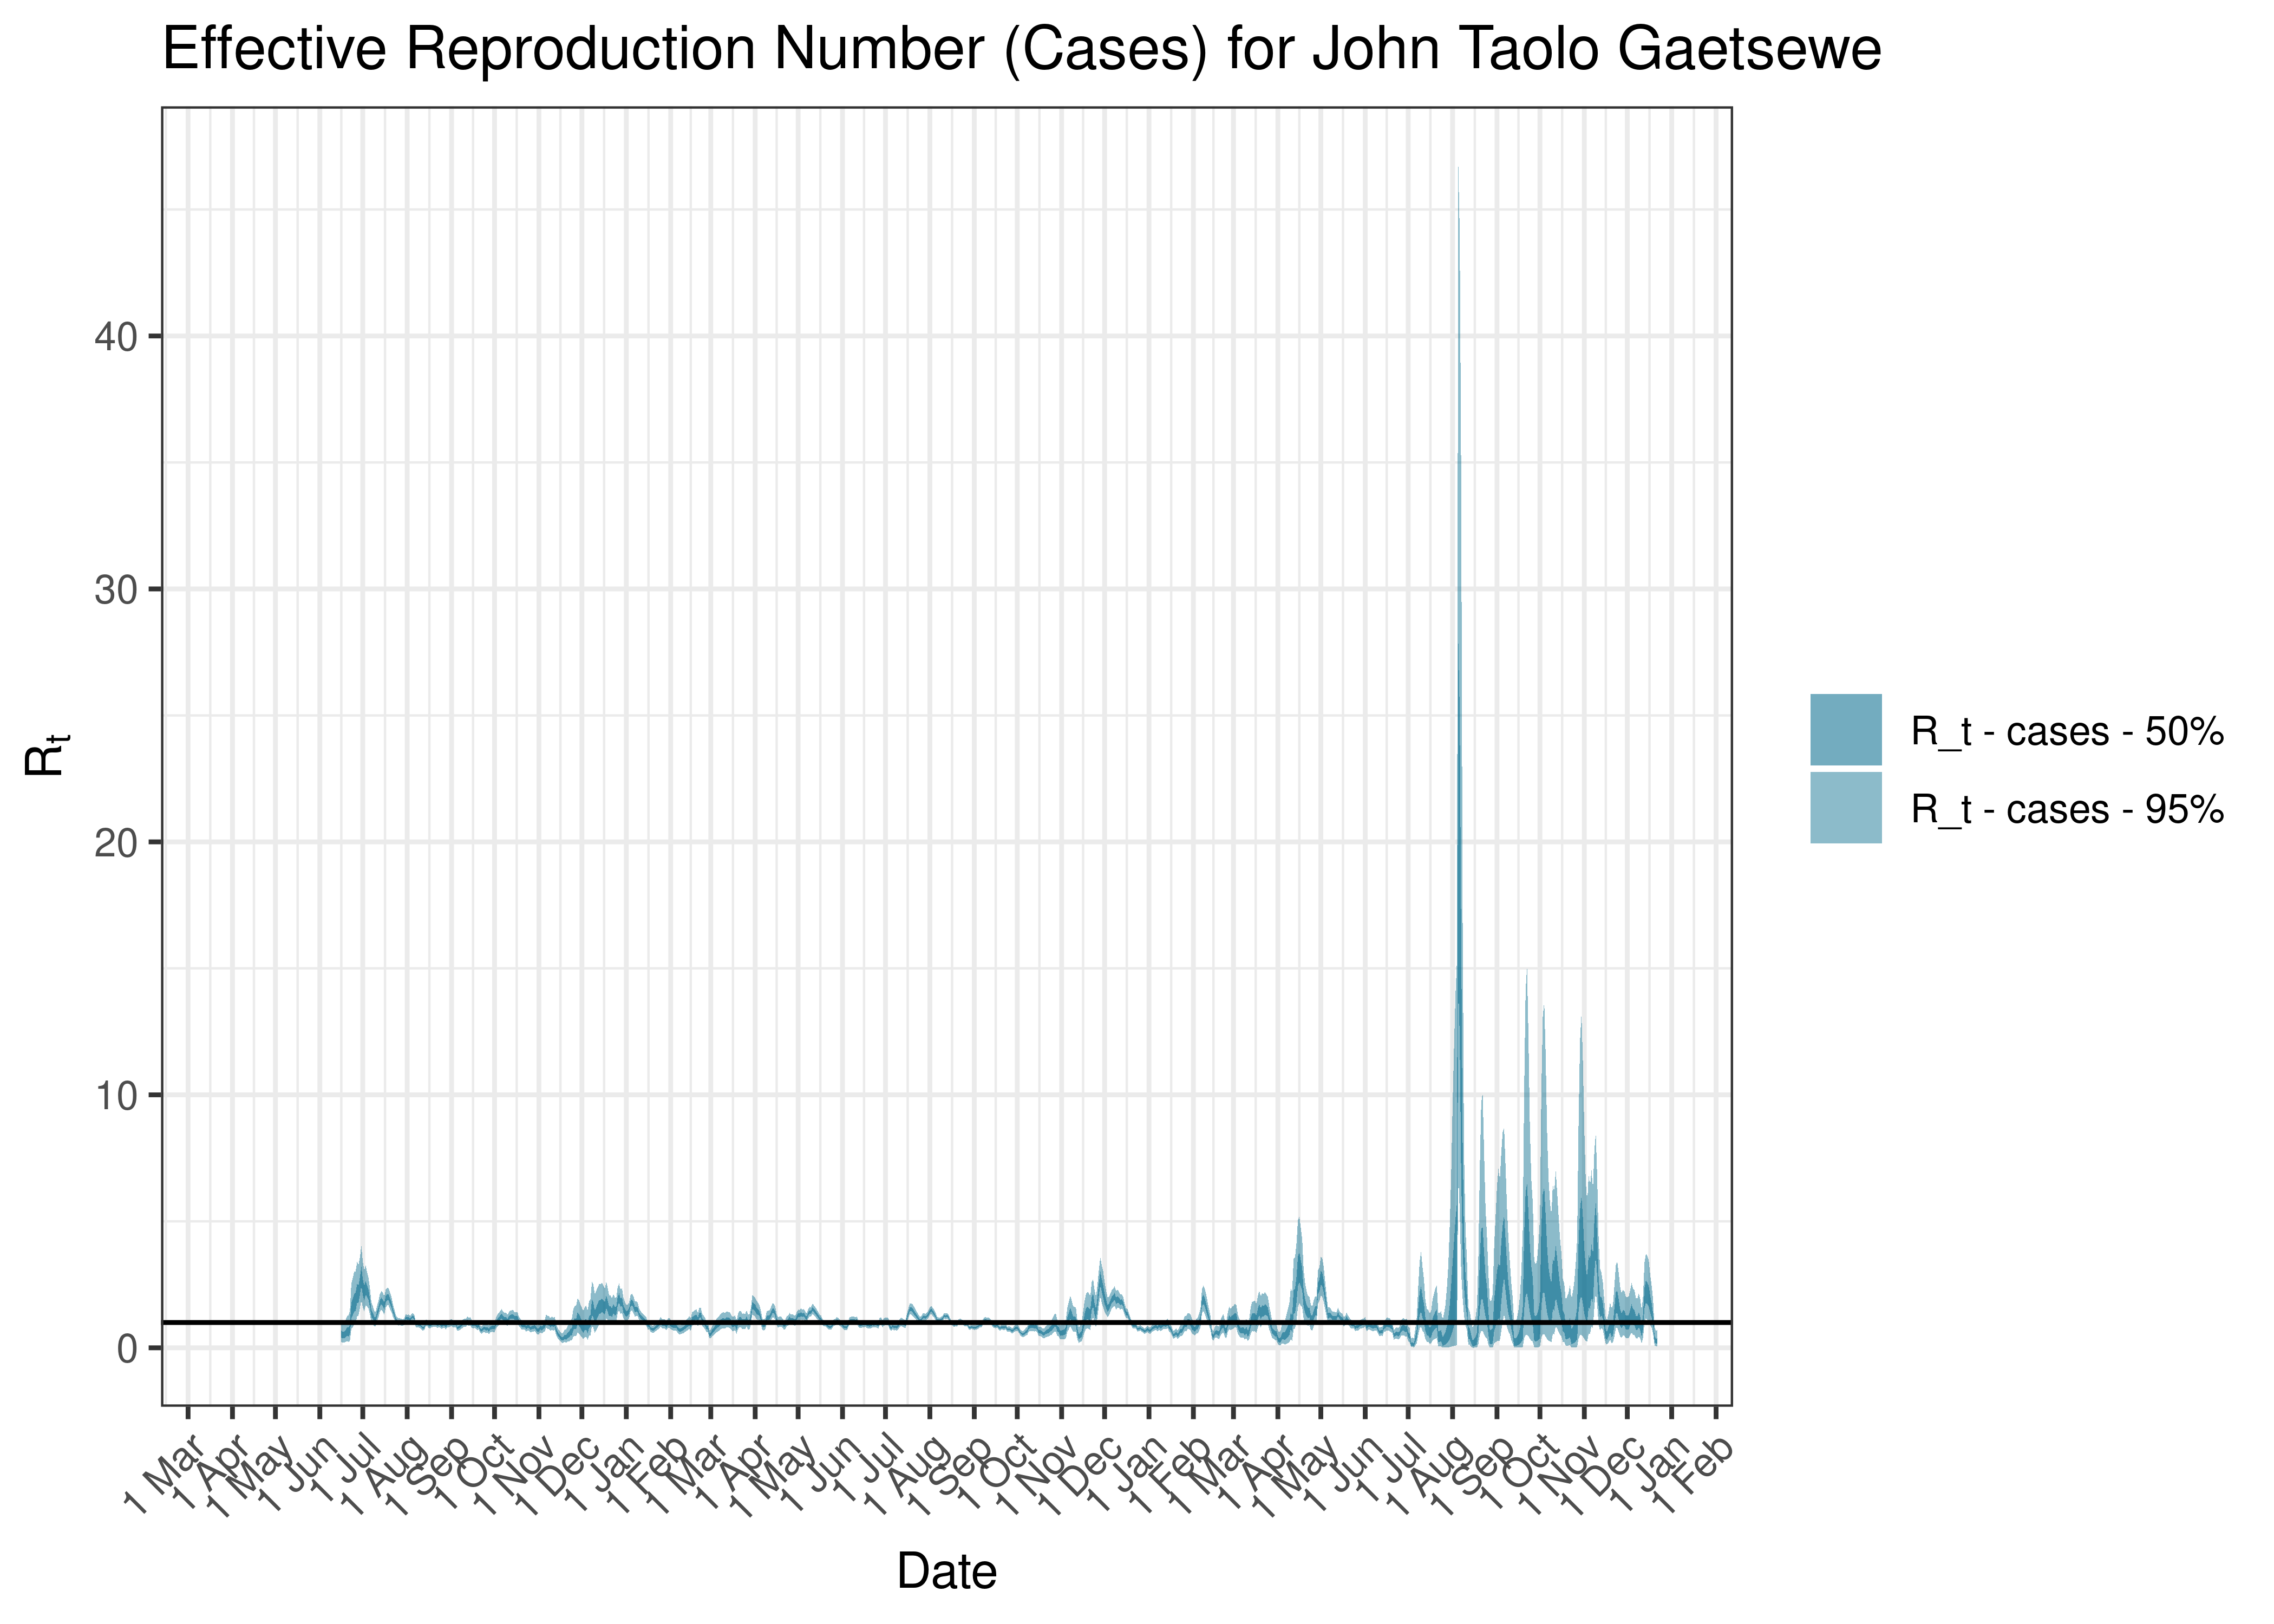
Estimated Effective Reproduction Number Based on Cases for John Taolo Gaetsewe since 1 April 2020
6.9.10 Namakwa
6.9.10.1 Cases
Cases are tabulated by specimen received date below. Cases include estimates for late reporting in recent days as well as adjustments for any public holidays. A centred 7-day moving average is also shown. The peak daily cases in previous waves (as measured by the moving average) is also shown.
| Specimen Received Date | Cases | 7-day Moving Average | Comment |
|---|---|---|---|
| 2020-08-24 | 9 | 12 | Wave 1 Peak |
| 2021-01-07 | 102 | 87 | Wave 2 Peak |
| 2021-08-13 | 86 | 86 | Wave 3 Peak |
| 2022-01-06 | 72 | 80 | Wave 4 Peak |
| 2022-05-21 | 2 | 25 | Wave 5 Peak (to date) |
Below a 7-day moving average daily case count are plotted for Namakwa on a log scale since start of the epidemic:
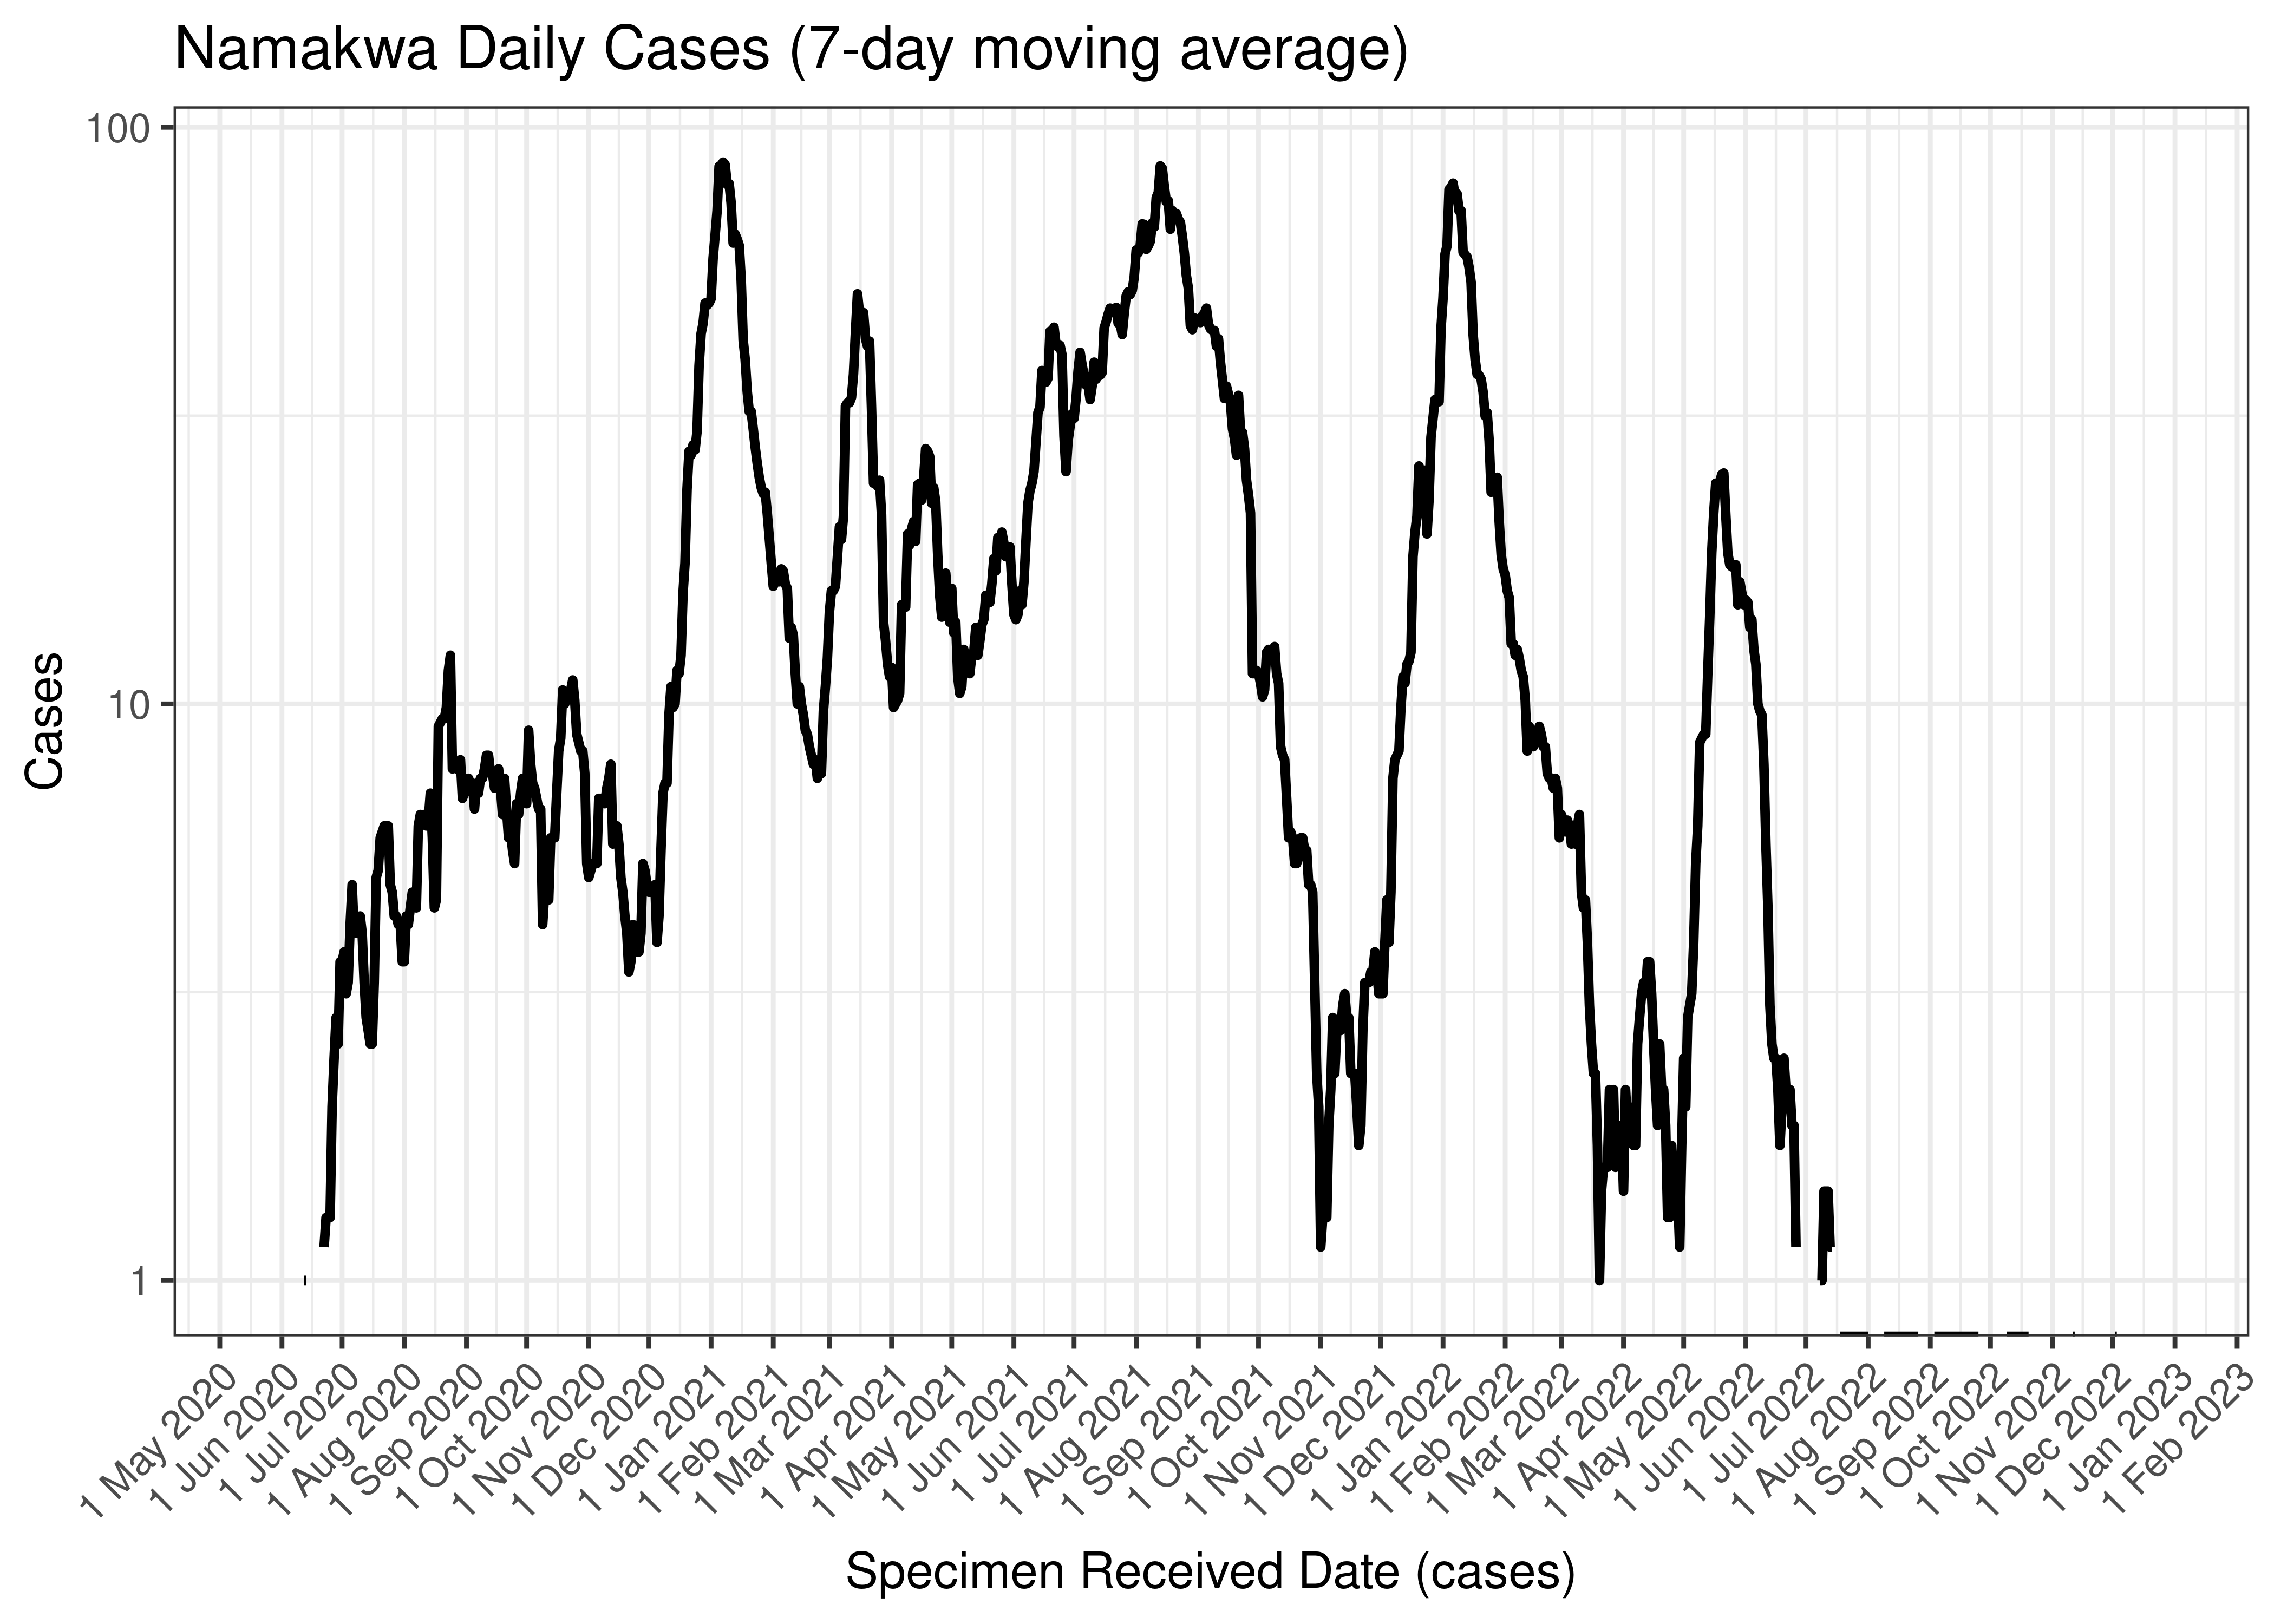
Namakwa Daily Cases (7-day moving average)
Below the above chart is repeated for the last 30-days:

Namakwa Daily Cases for Last 30-days (7-day moving average)
6.9.10.2 Reproduction Number
Below current (last weekly) reproduction number estimates are tabulated for Namakwa.
| Count (Per Day) | Week Ending | Reproduction Number [95% Confidence Interval] | |
|---|---|---|---|
| Namakwa | 0.4 | 2022-12-25 | 2.24 [0.57 - 5.13] |
Below the effective reproduction number for Namakwa over the last 90 days are plotted together with a plot since start of the pandemic.
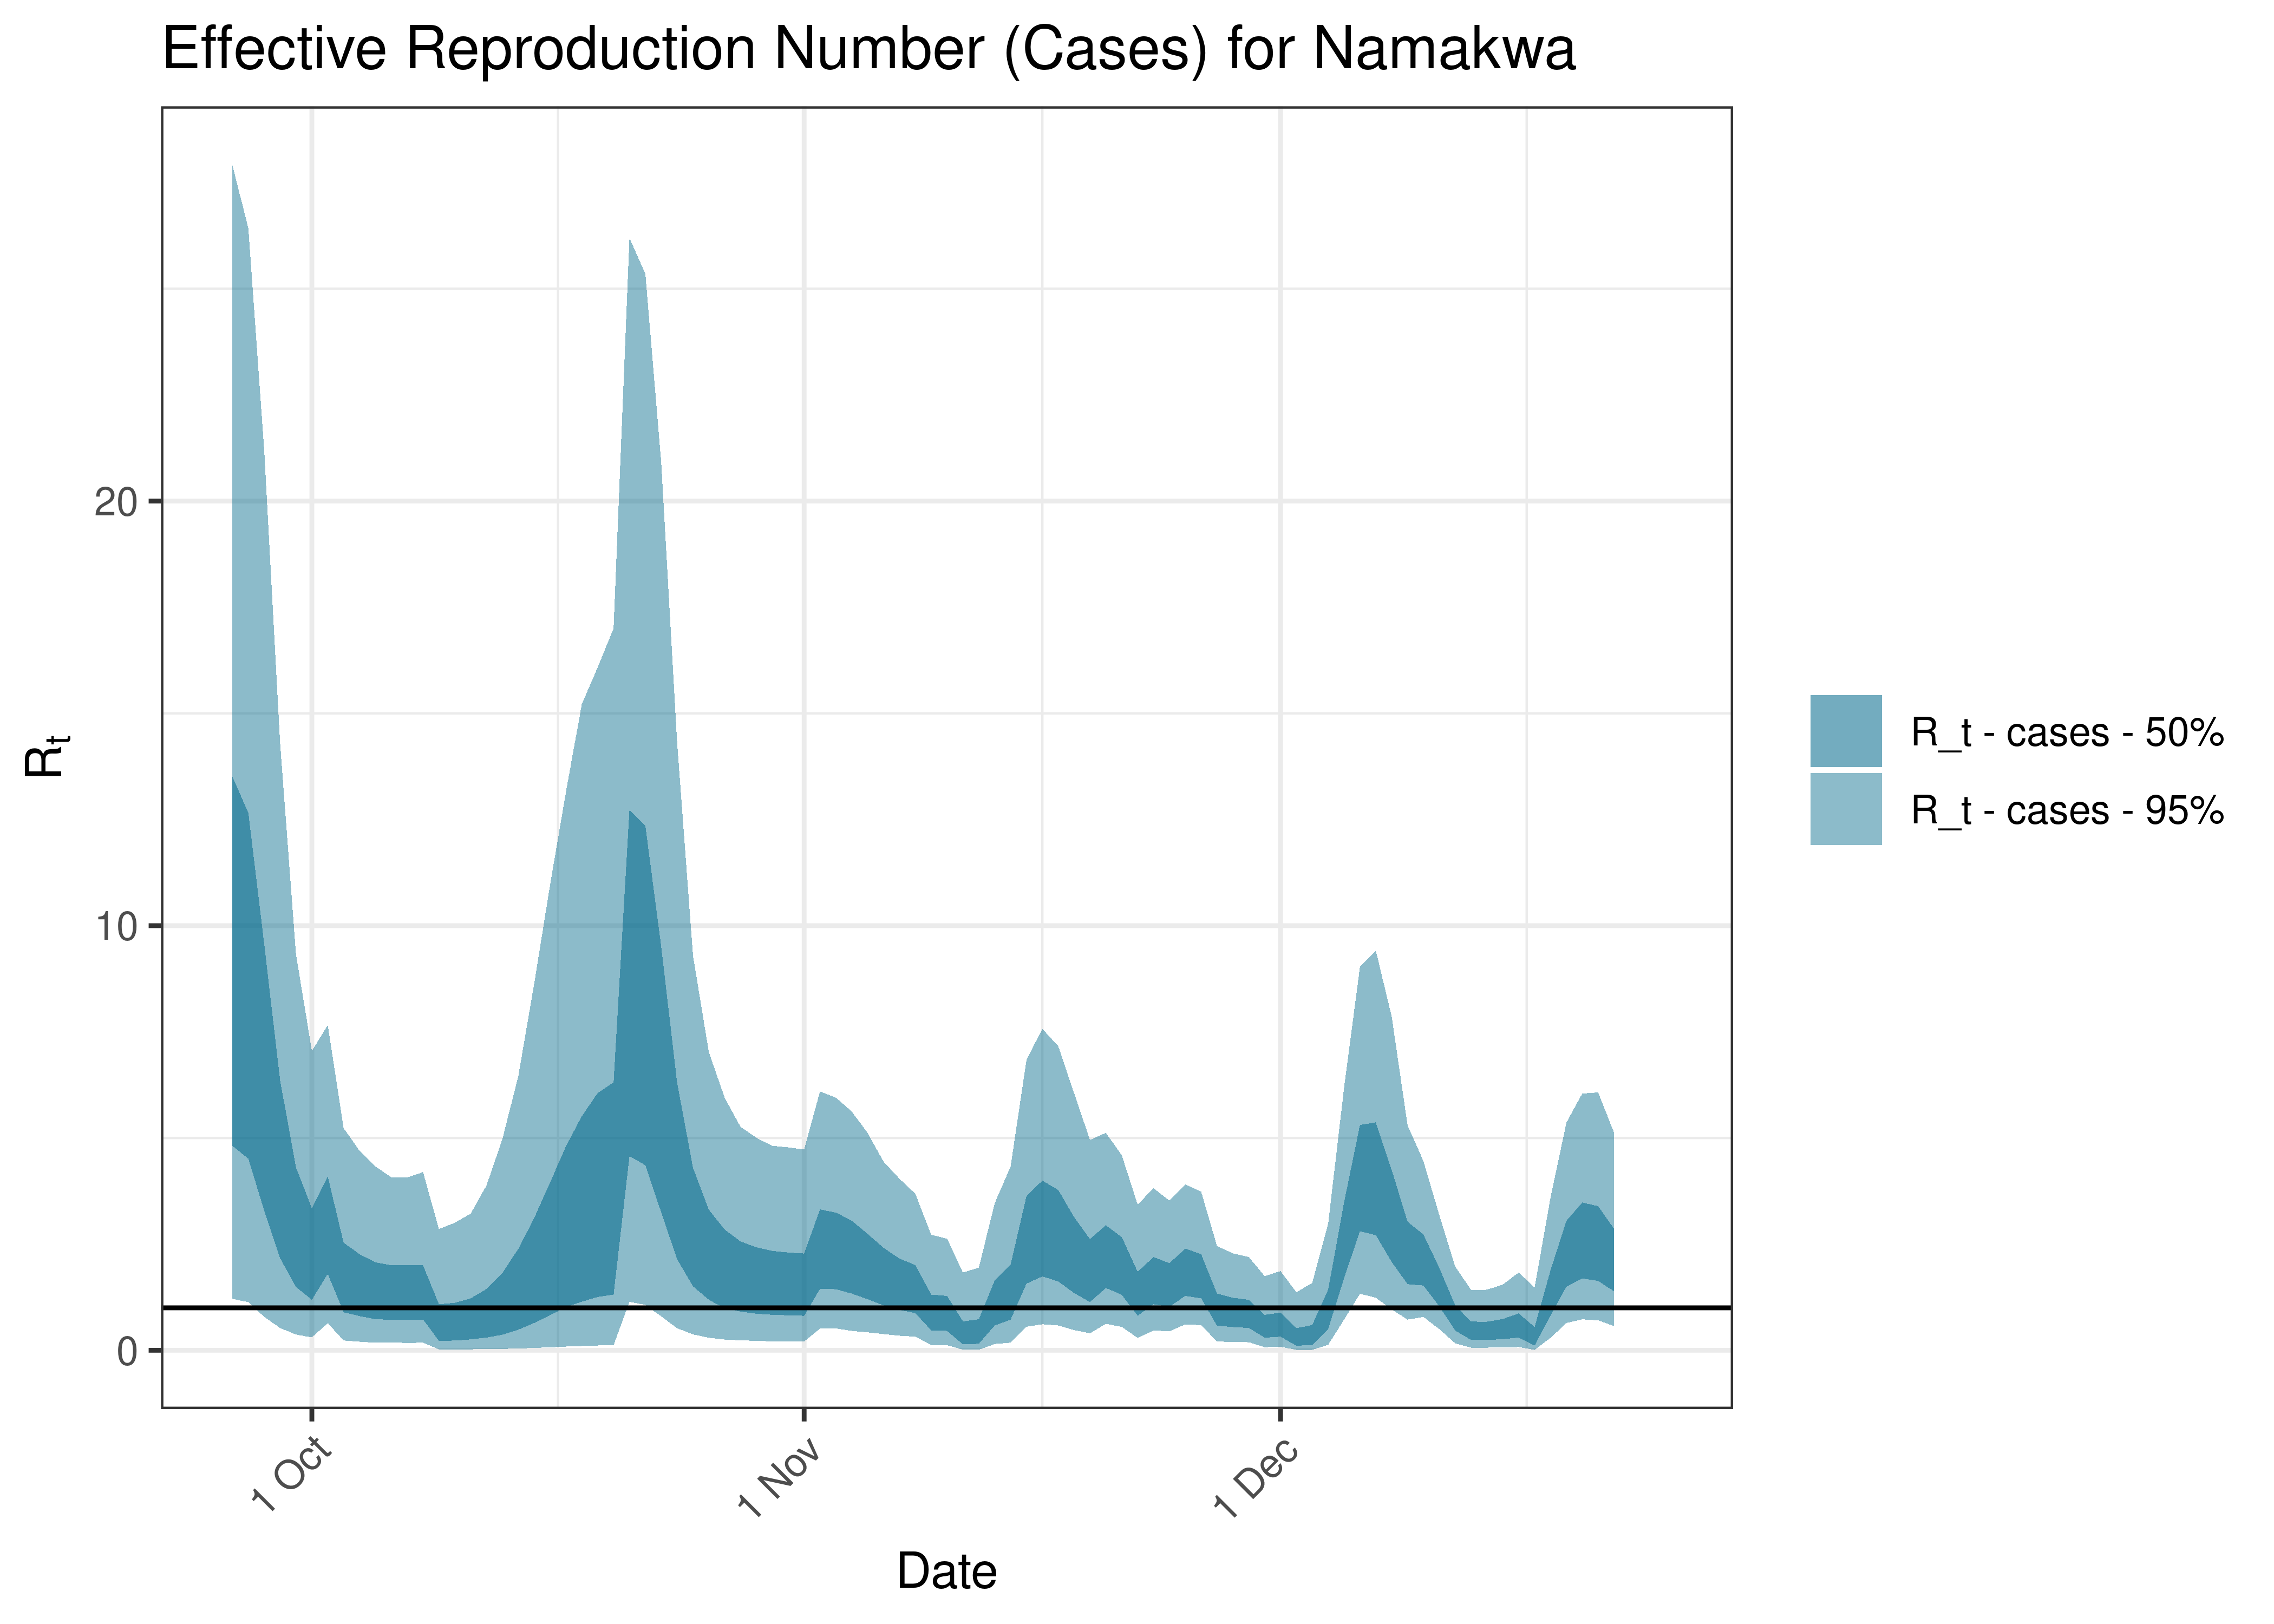
Estimated Effective Reproduction Number Based on Cases for Namakwa over last 90 days

Estimated Effective Reproduction Number Based on Cases for Namakwa since 1 April 2020
6.9.11 Pixley Ka Seme
6.9.11.1 Cases
Cases are tabulated by specimen received date below. Cases include estimates for late reporting in recent days as well as adjustments for any public holidays. A centred 7-day moving average is also shown. The peak daily cases in previous waves (as measured by the moving average) is also shown.
| Specimen Received Date | Cases | 7-day Moving Average | Comment |
|---|---|---|---|
| 2020-08-10 | 275 | 75 | Wave 1 Peak |
| 2021-01-08 | 112 | 68 | Wave 2 Peak |
| 2021-08-19 | 223 | 125 | Wave 3 Peak |
| 2021-12-18 | 27 | 70 | Wave 4 Peak |
| 2022-05-16 | 37 | 25 | Wave 5 Peak (to date) |
Below a 7-day moving average daily case count are plotted for Pixley Ka Seme on a log scale since start of the epidemic:
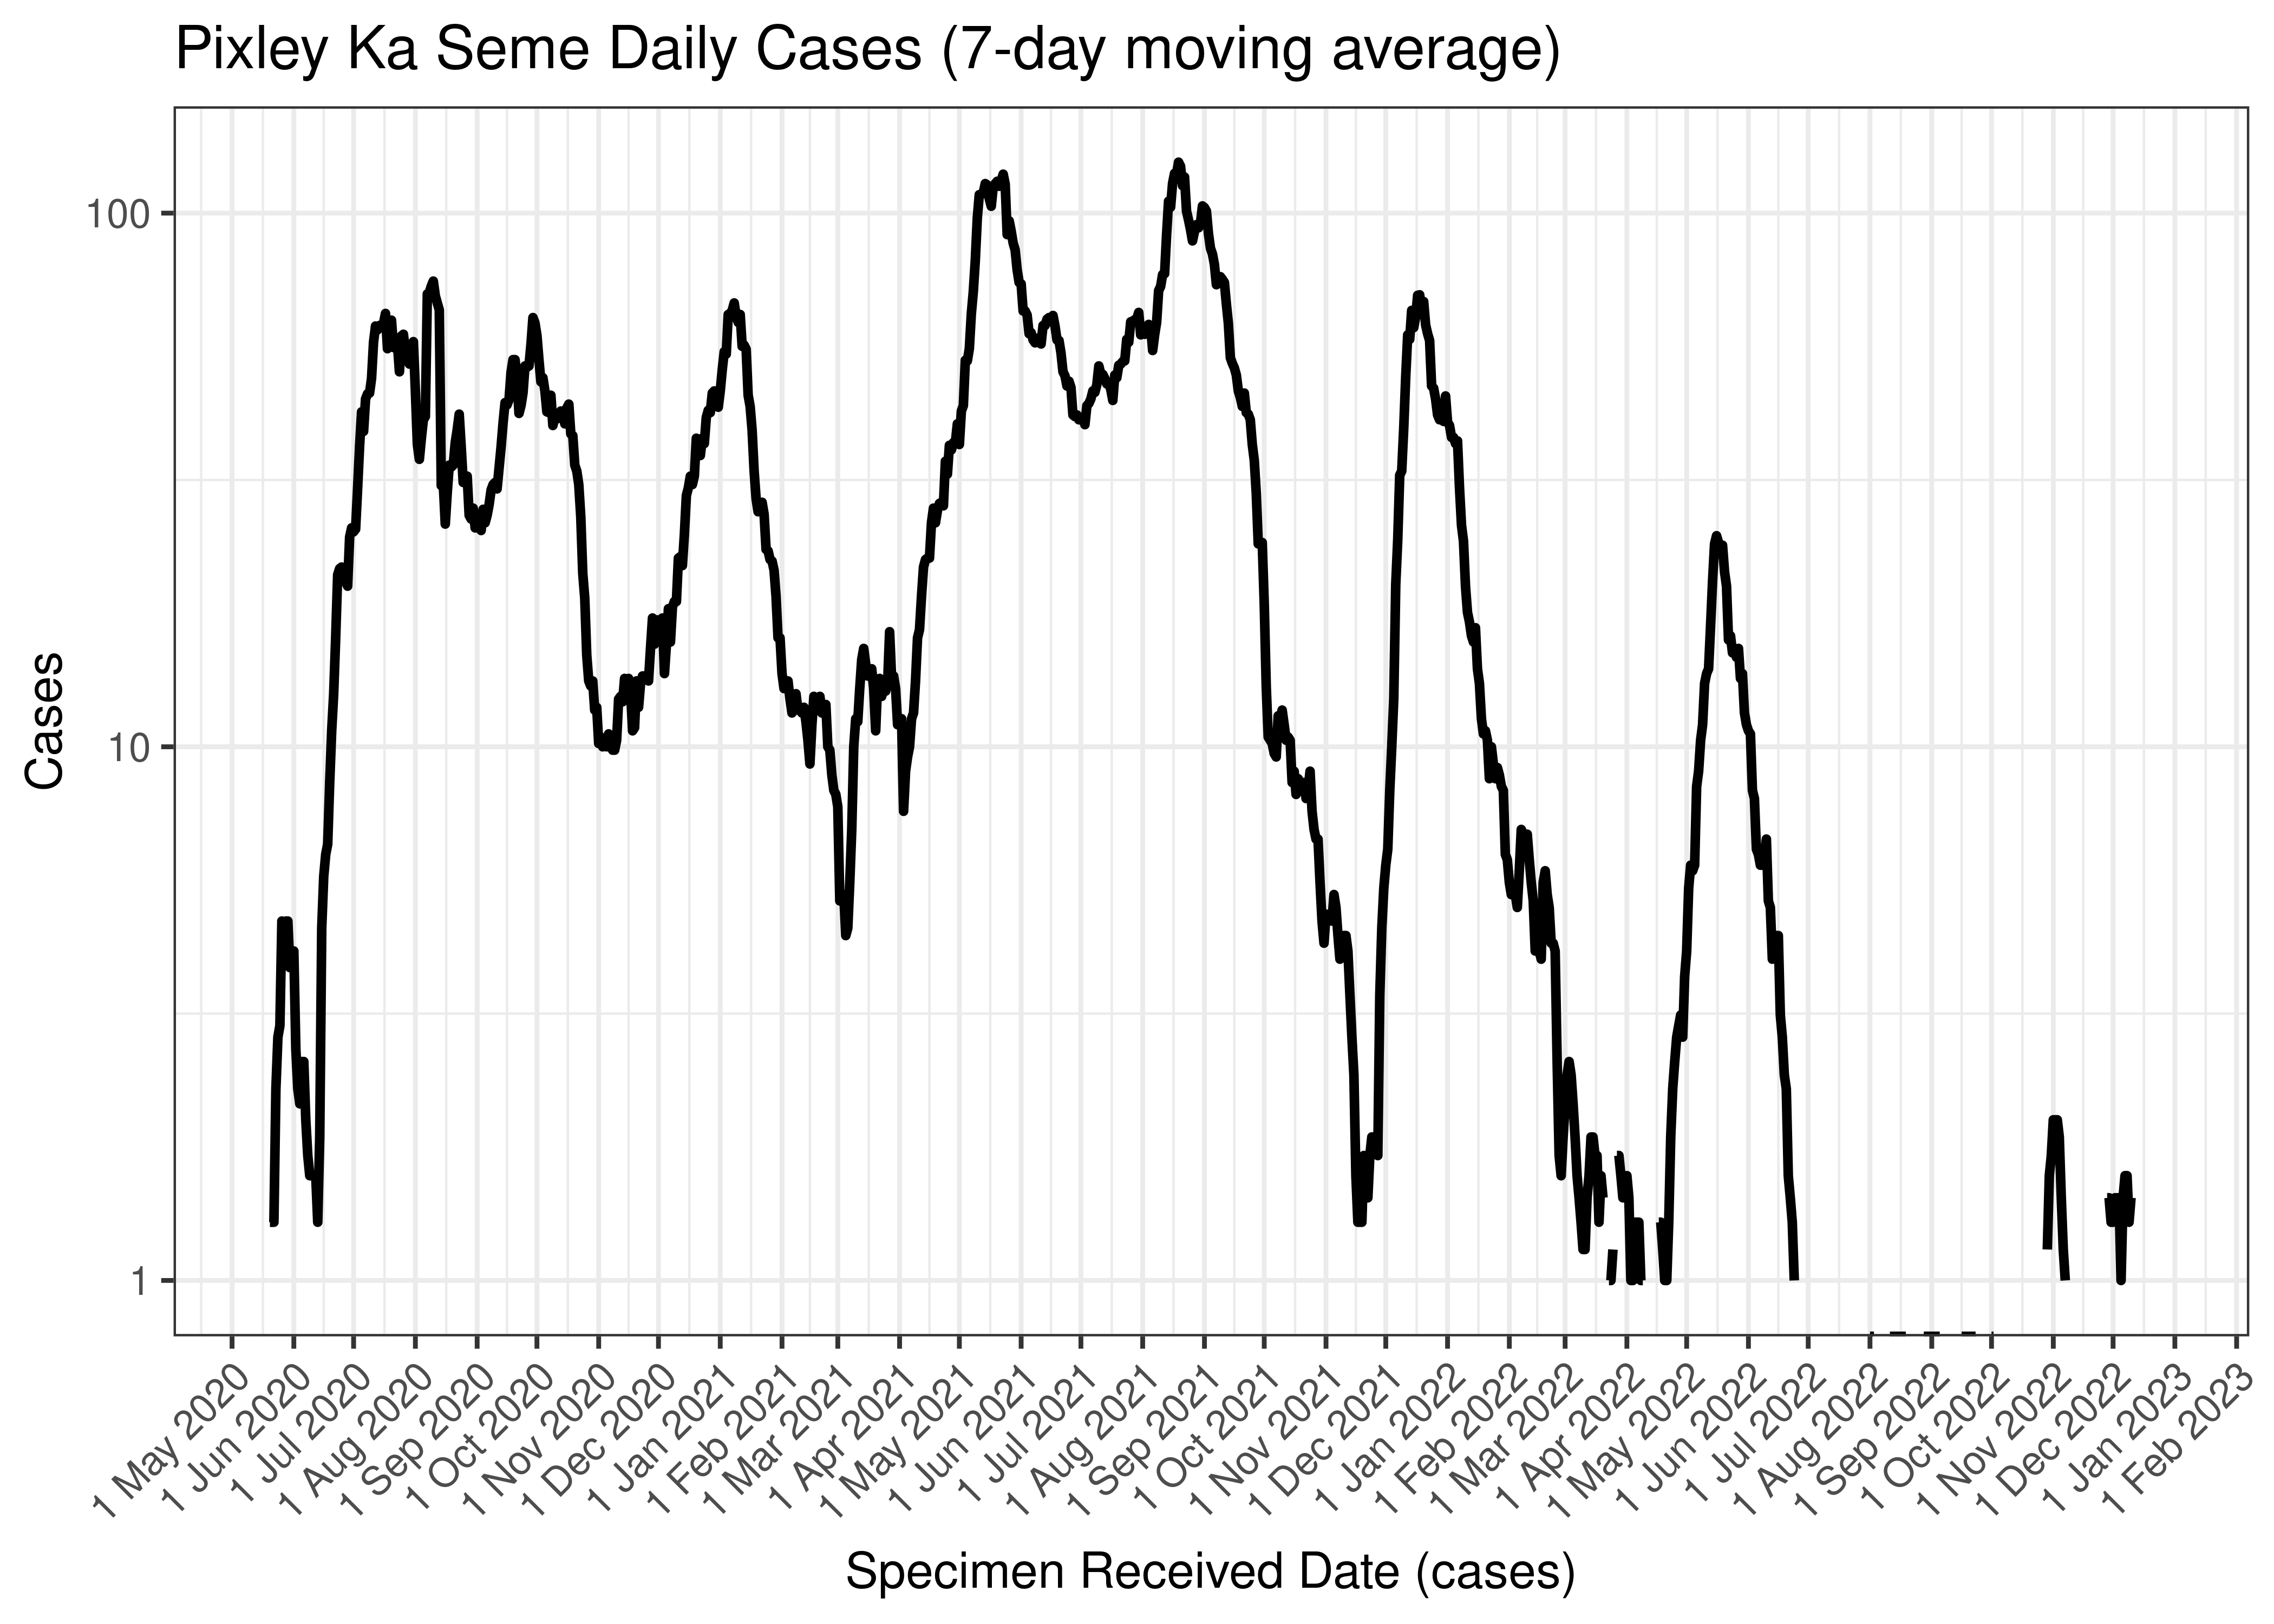
Pixley Ka Seme Daily Cases (7-day moving average)
Below the above chart is repeated for the last 30-days:

Pixley Ka Seme Daily Cases for Last 30-days (7-day moving average)
6.9.11.2 Reproduction Number
Below current (last weekly) reproduction number estimates are tabulated for Pixley Ka Seme.
| Count (Per Day) | Week Ending | Reproduction Number [95% Confidence Interval] | |
|---|---|---|---|
| Pixley Ka Seme | 0.4 | 2022-12-25 | 1.16 [0.31 - 2.56] |
Below the effective reproduction number for Pixley Ka Seme over the last 90 days are plotted together with a plot since start of the pandemic.
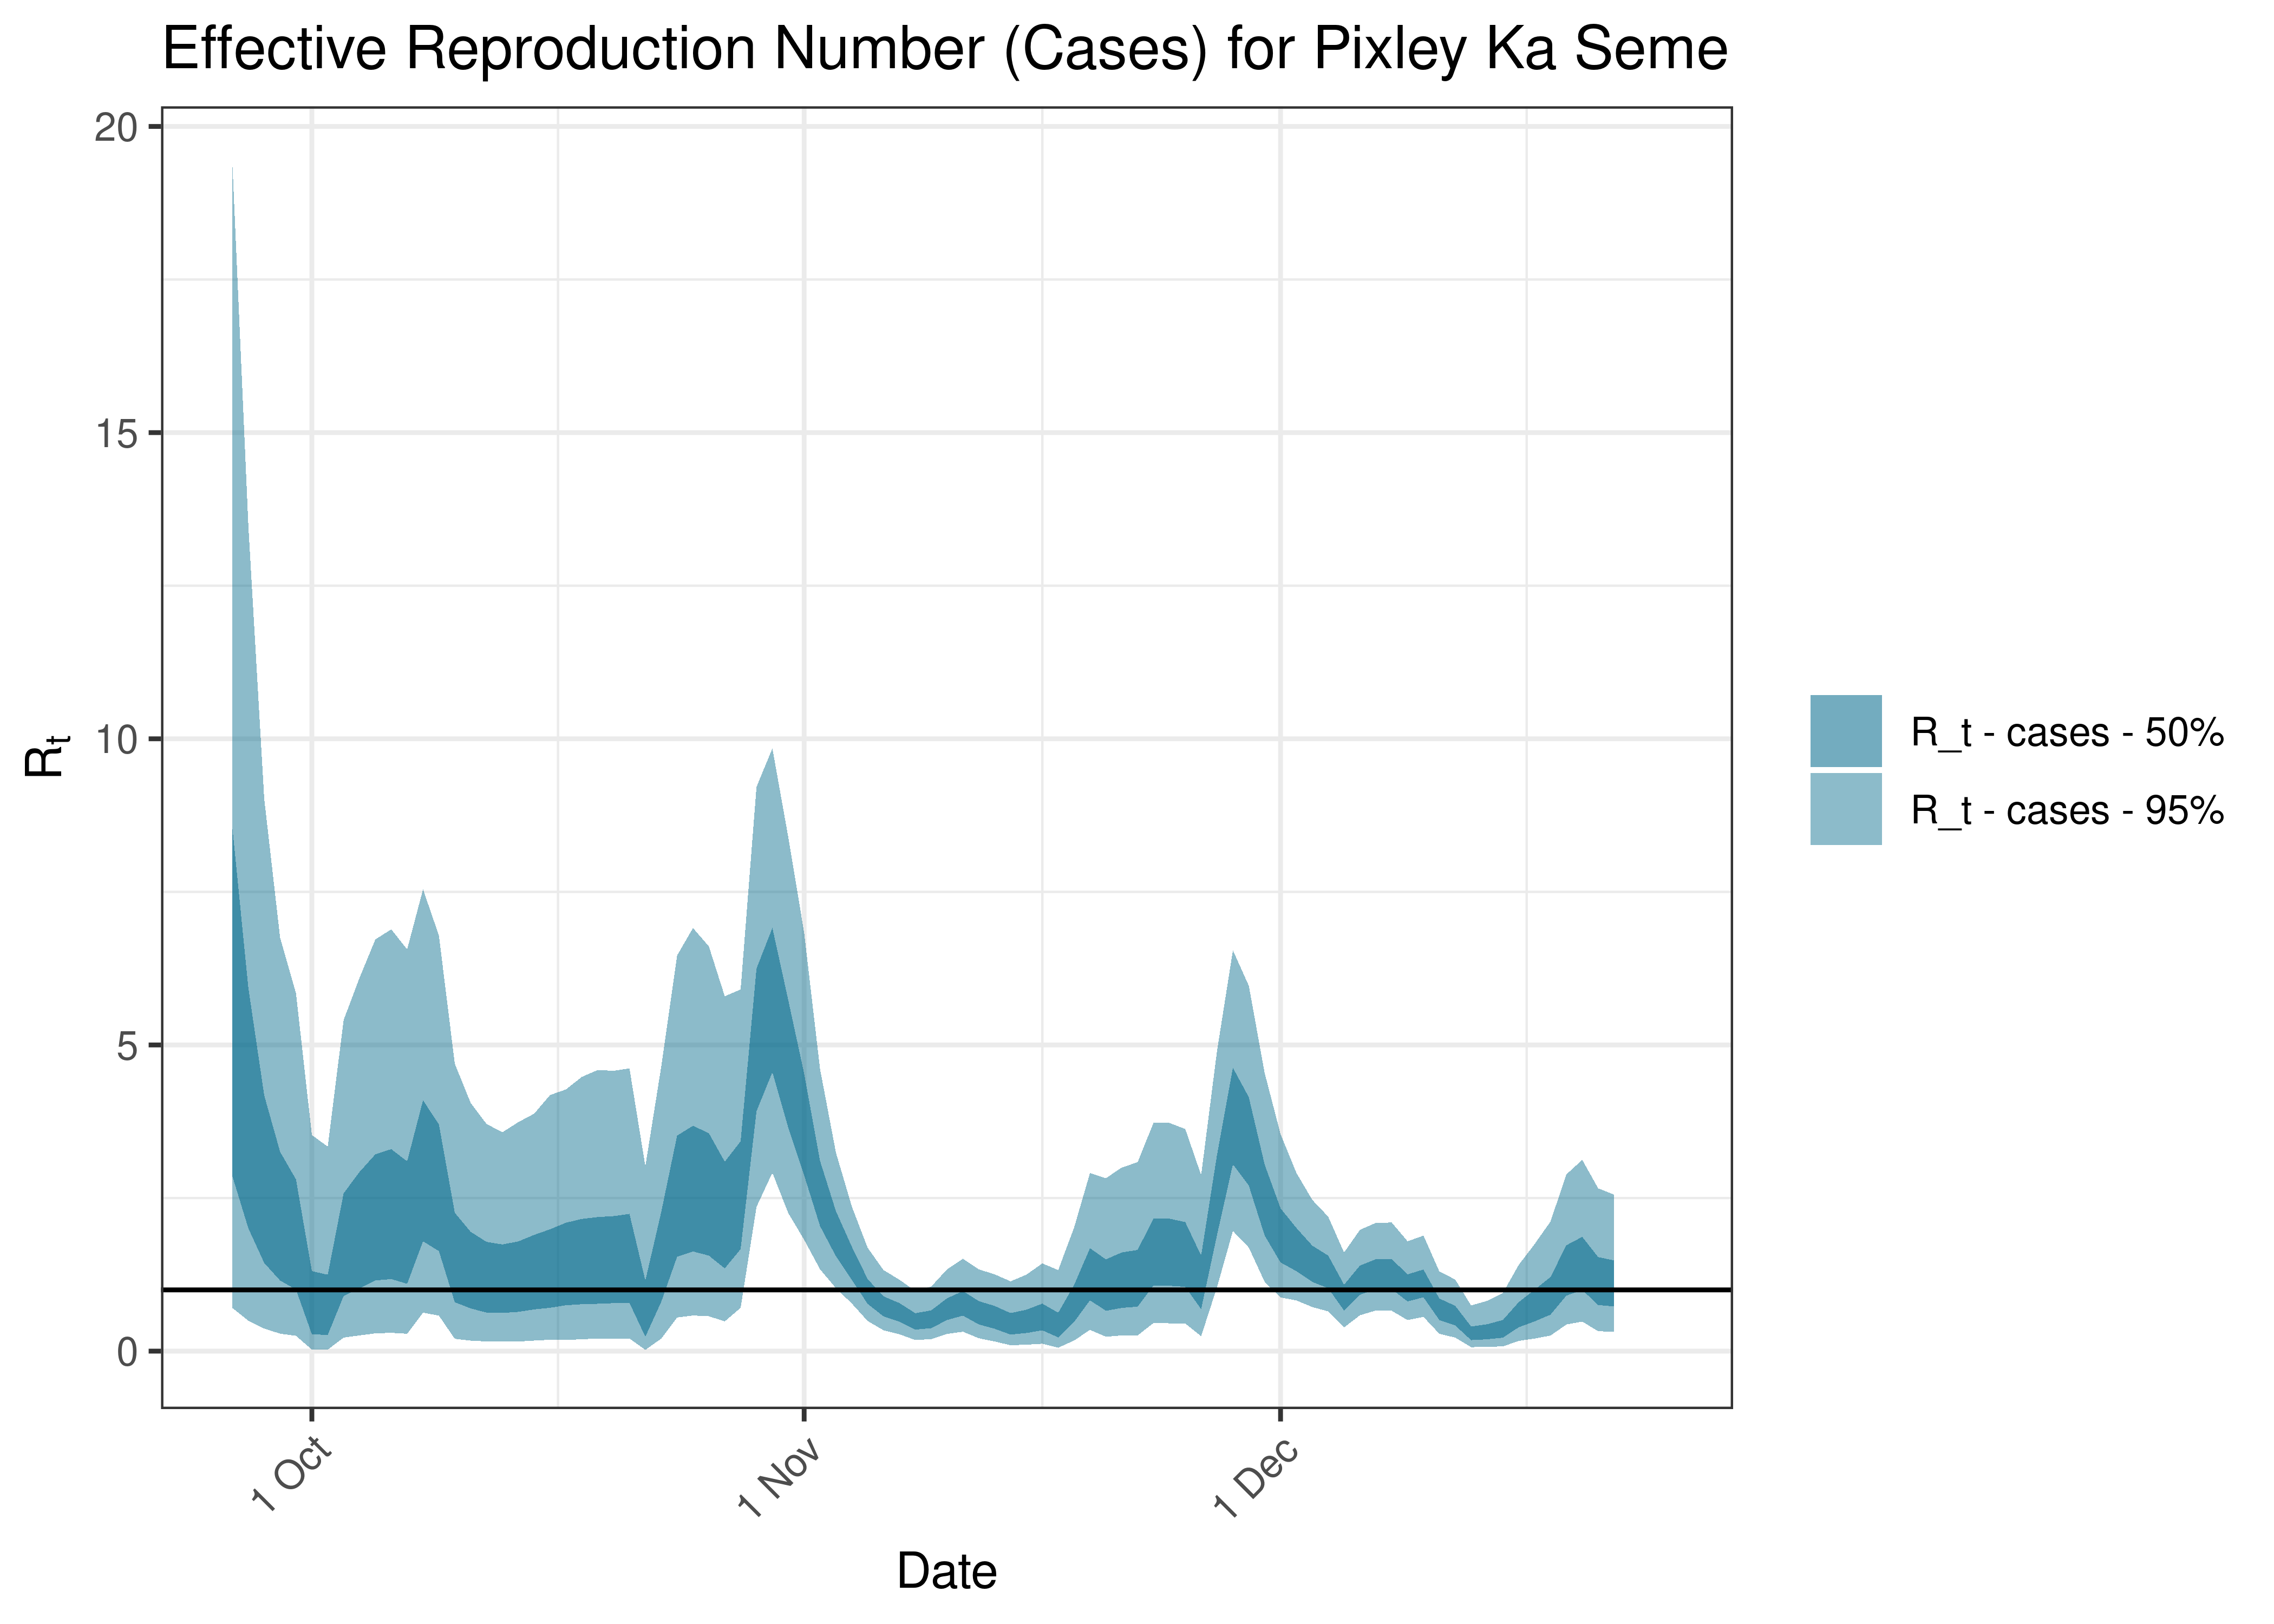
Estimated Effective Reproduction Number Based on Cases for Pixley Ka Seme over last 90 days
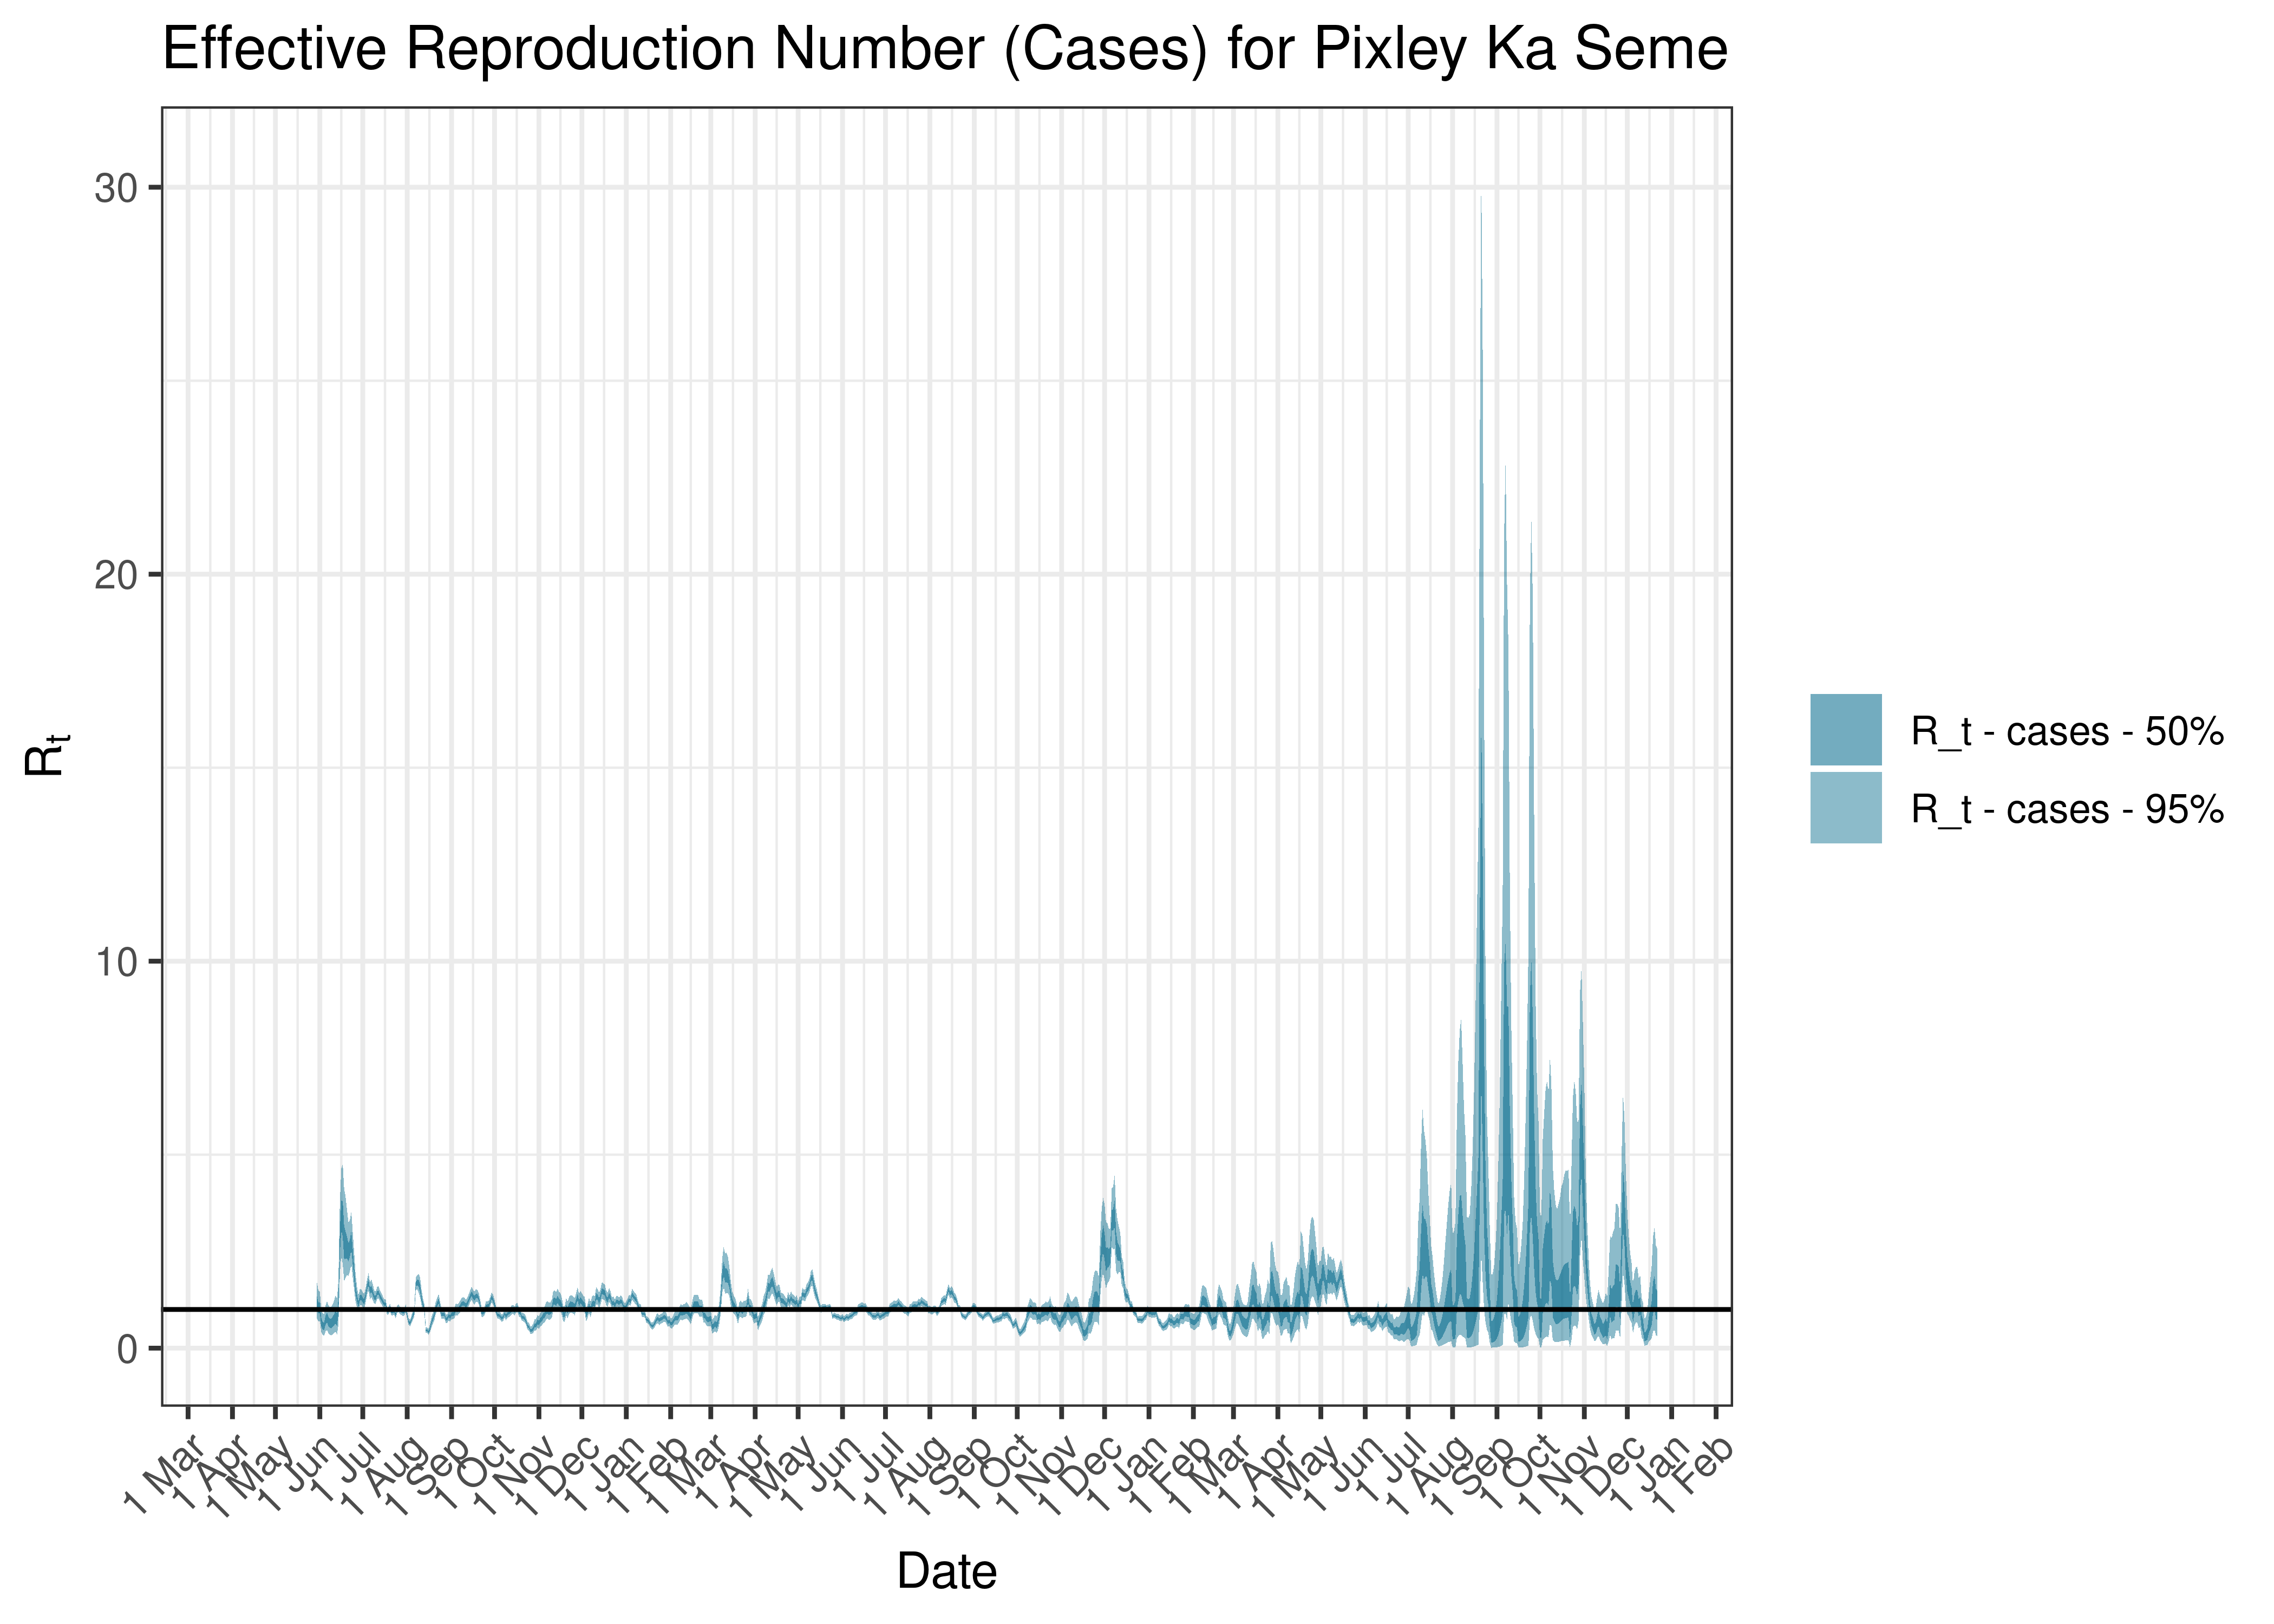
Estimated Effective Reproduction Number Based on Cases for Pixley Ka Seme since 1 April 2020
6.9.12 Zf Mgcawu
6.9.12.1 Cases
Cases are tabulated by specimen received date below. Cases include estimates for late reporting in recent days as well as adjustments for any public holidays. A centred 7-day moving average is also shown. The peak daily cases in previous waves (as measured by the moving average) is also shown.
| Specimen Received Date | Cases | 7-day Moving Average | Comment |
|---|---|---|---|
| 2020-09-14 | 59 | 60 | Wave 1 Peak |
| 2021-01-13 | 41 | 52 | Wave 2 Peak |
| 2021-08-14 | 171 | 199 | Wave 3 Peak |
| 2021-12-20 | 132 | 84 | Wave 4 Peak |
| 2021-12-23 | 109 | 84 | Wave 4 Peak |
| 2022-05-18 | 91 | 57 | Wave 5 Peak (to date) |
Below a 7-day moving average daily case count are plotted for Zf Mgcawu on a log scale since start of the epidemic:
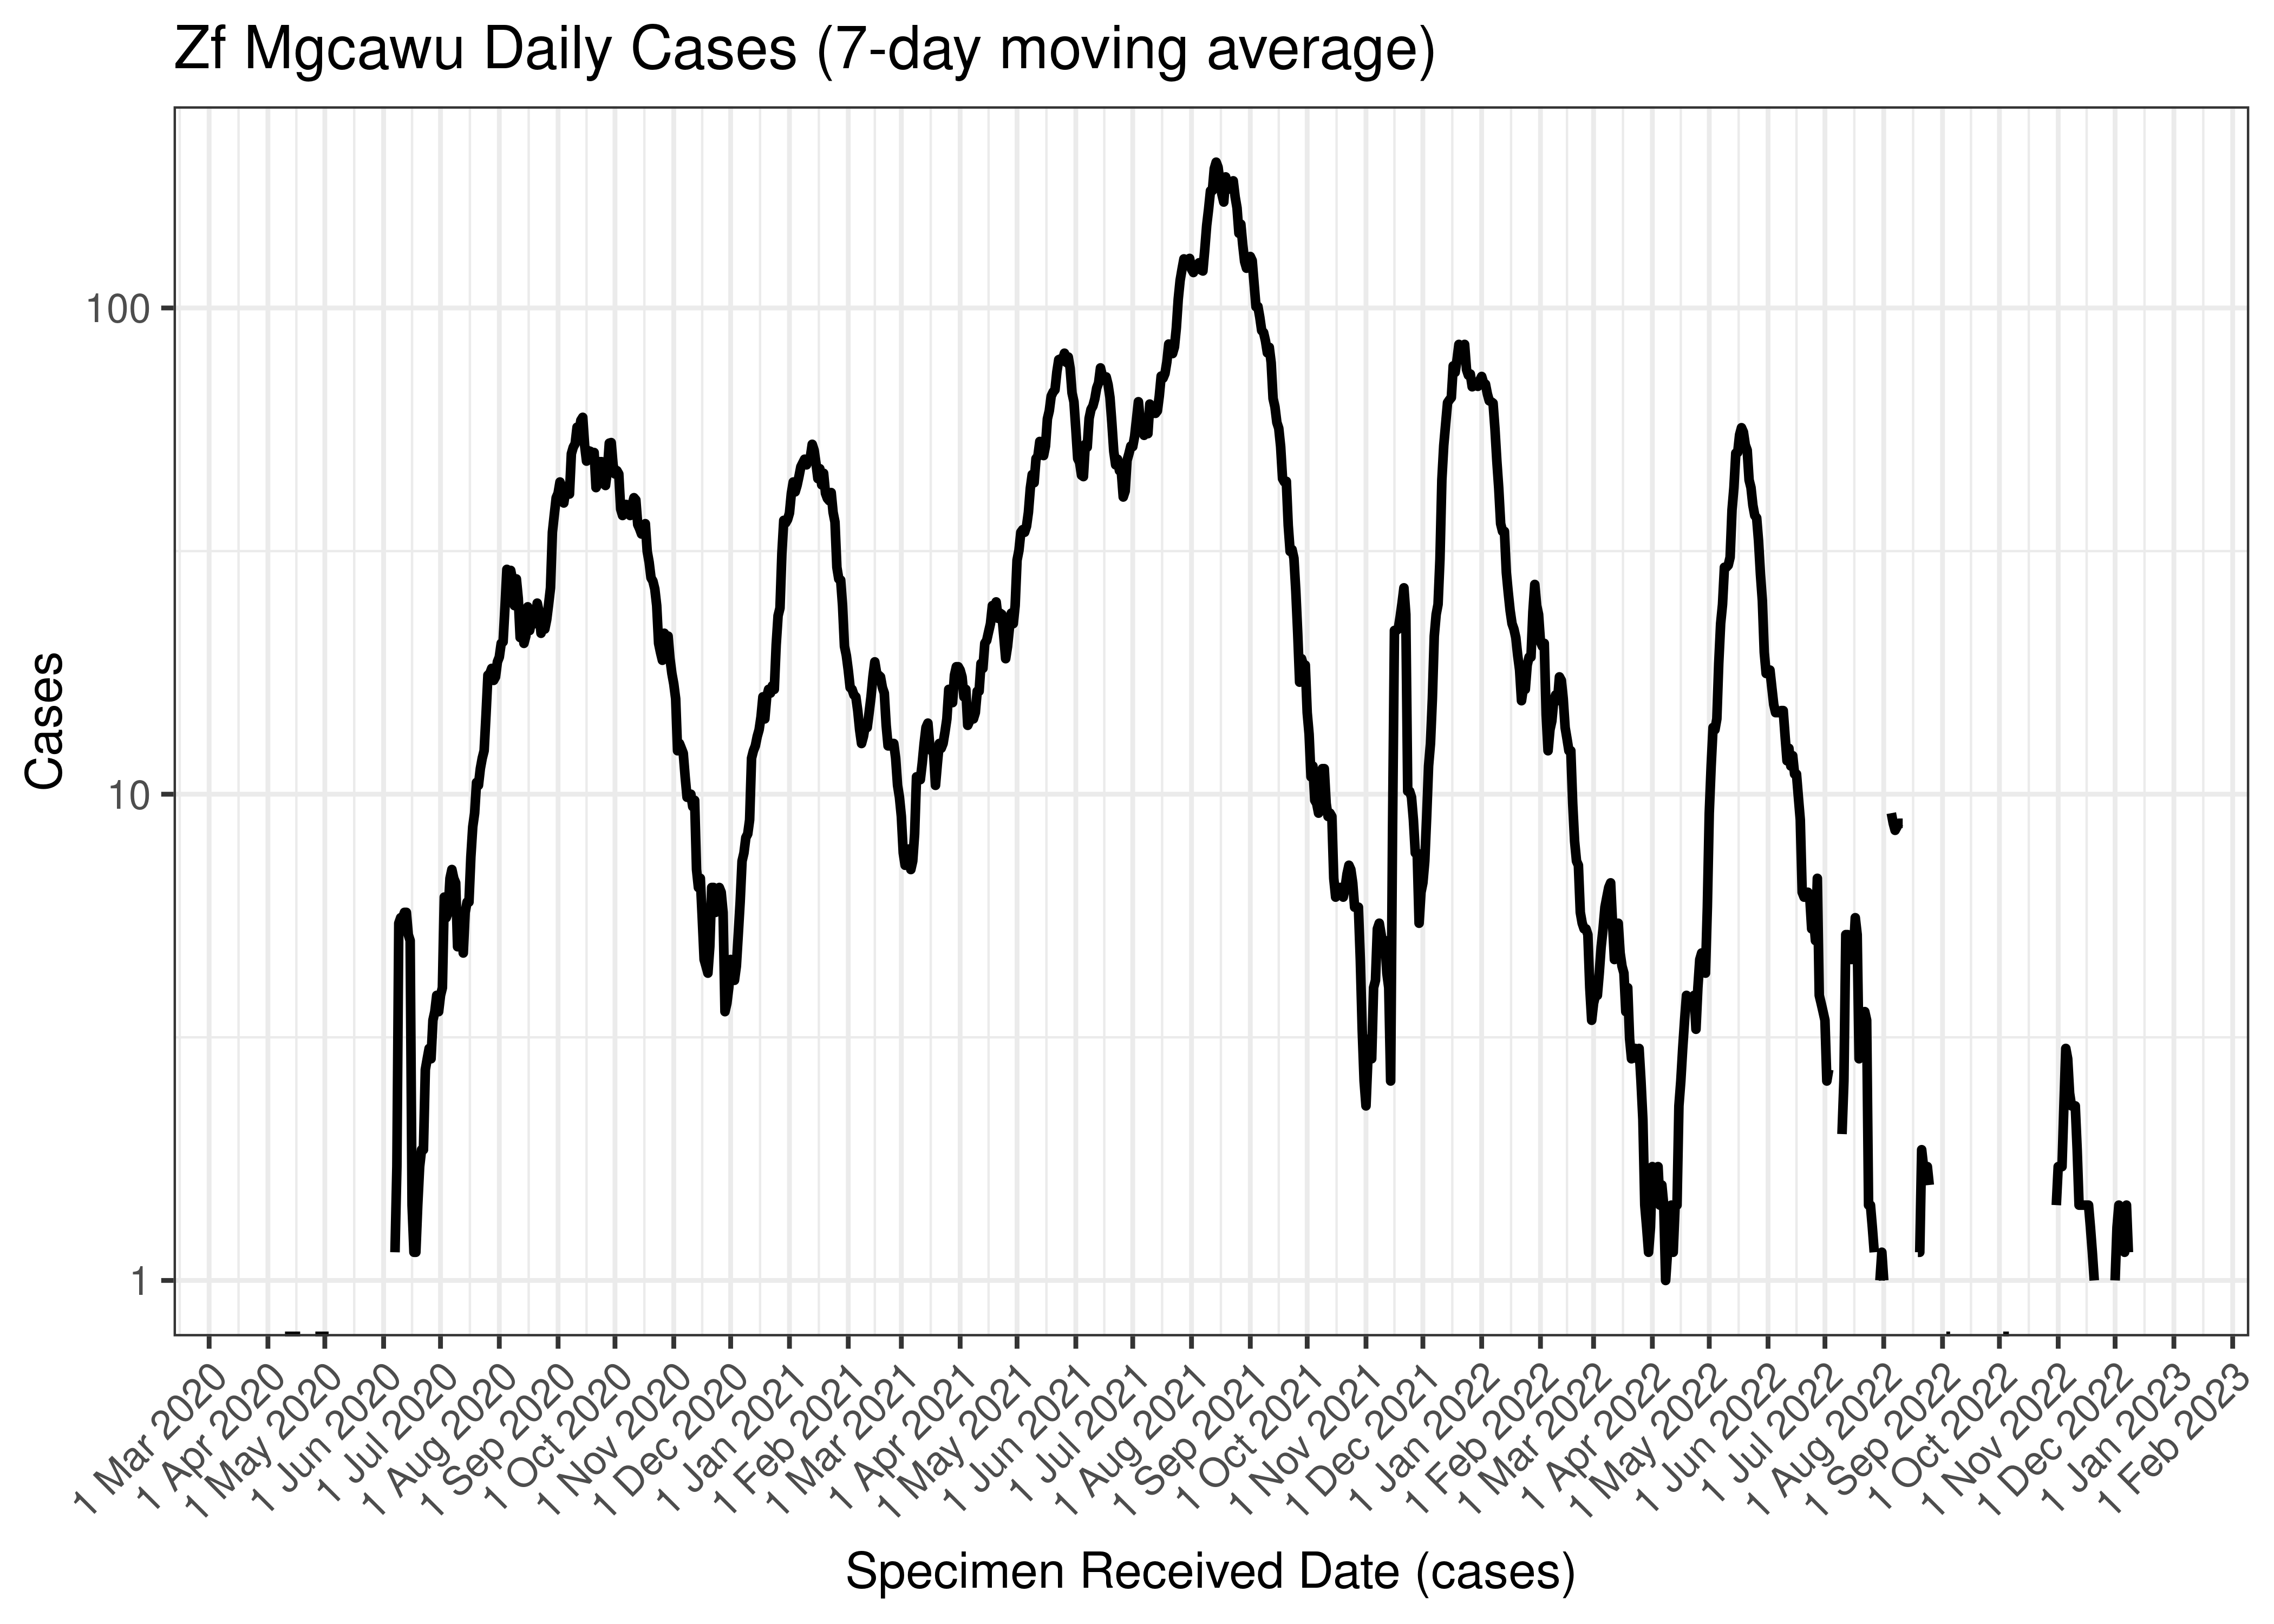
Zf Mgcawu Daily Cases (7-day moving average)
Below the above chart is repeated for the last 30-days:
Zf Mgcawu Daily Cases for Last 30-days (7-day moving average)
6.9.12.2 Reproduction Number
Below current (last weekly) reproduction number estimates are tabulated for Zf Mgcawu.
| Count (Per Day) | Week Ending | Reproduction Number [95% Confidence Interval] | |
|---|---|---|---|
| Zf Mgcawu | 0.4 | 2022-12-25 | 1.00 [0.27 - 2.20] |
Below the effective reproduction number for Zf Mgcawu over the last 90 days are plotted together with a plot since start of the pandemic.
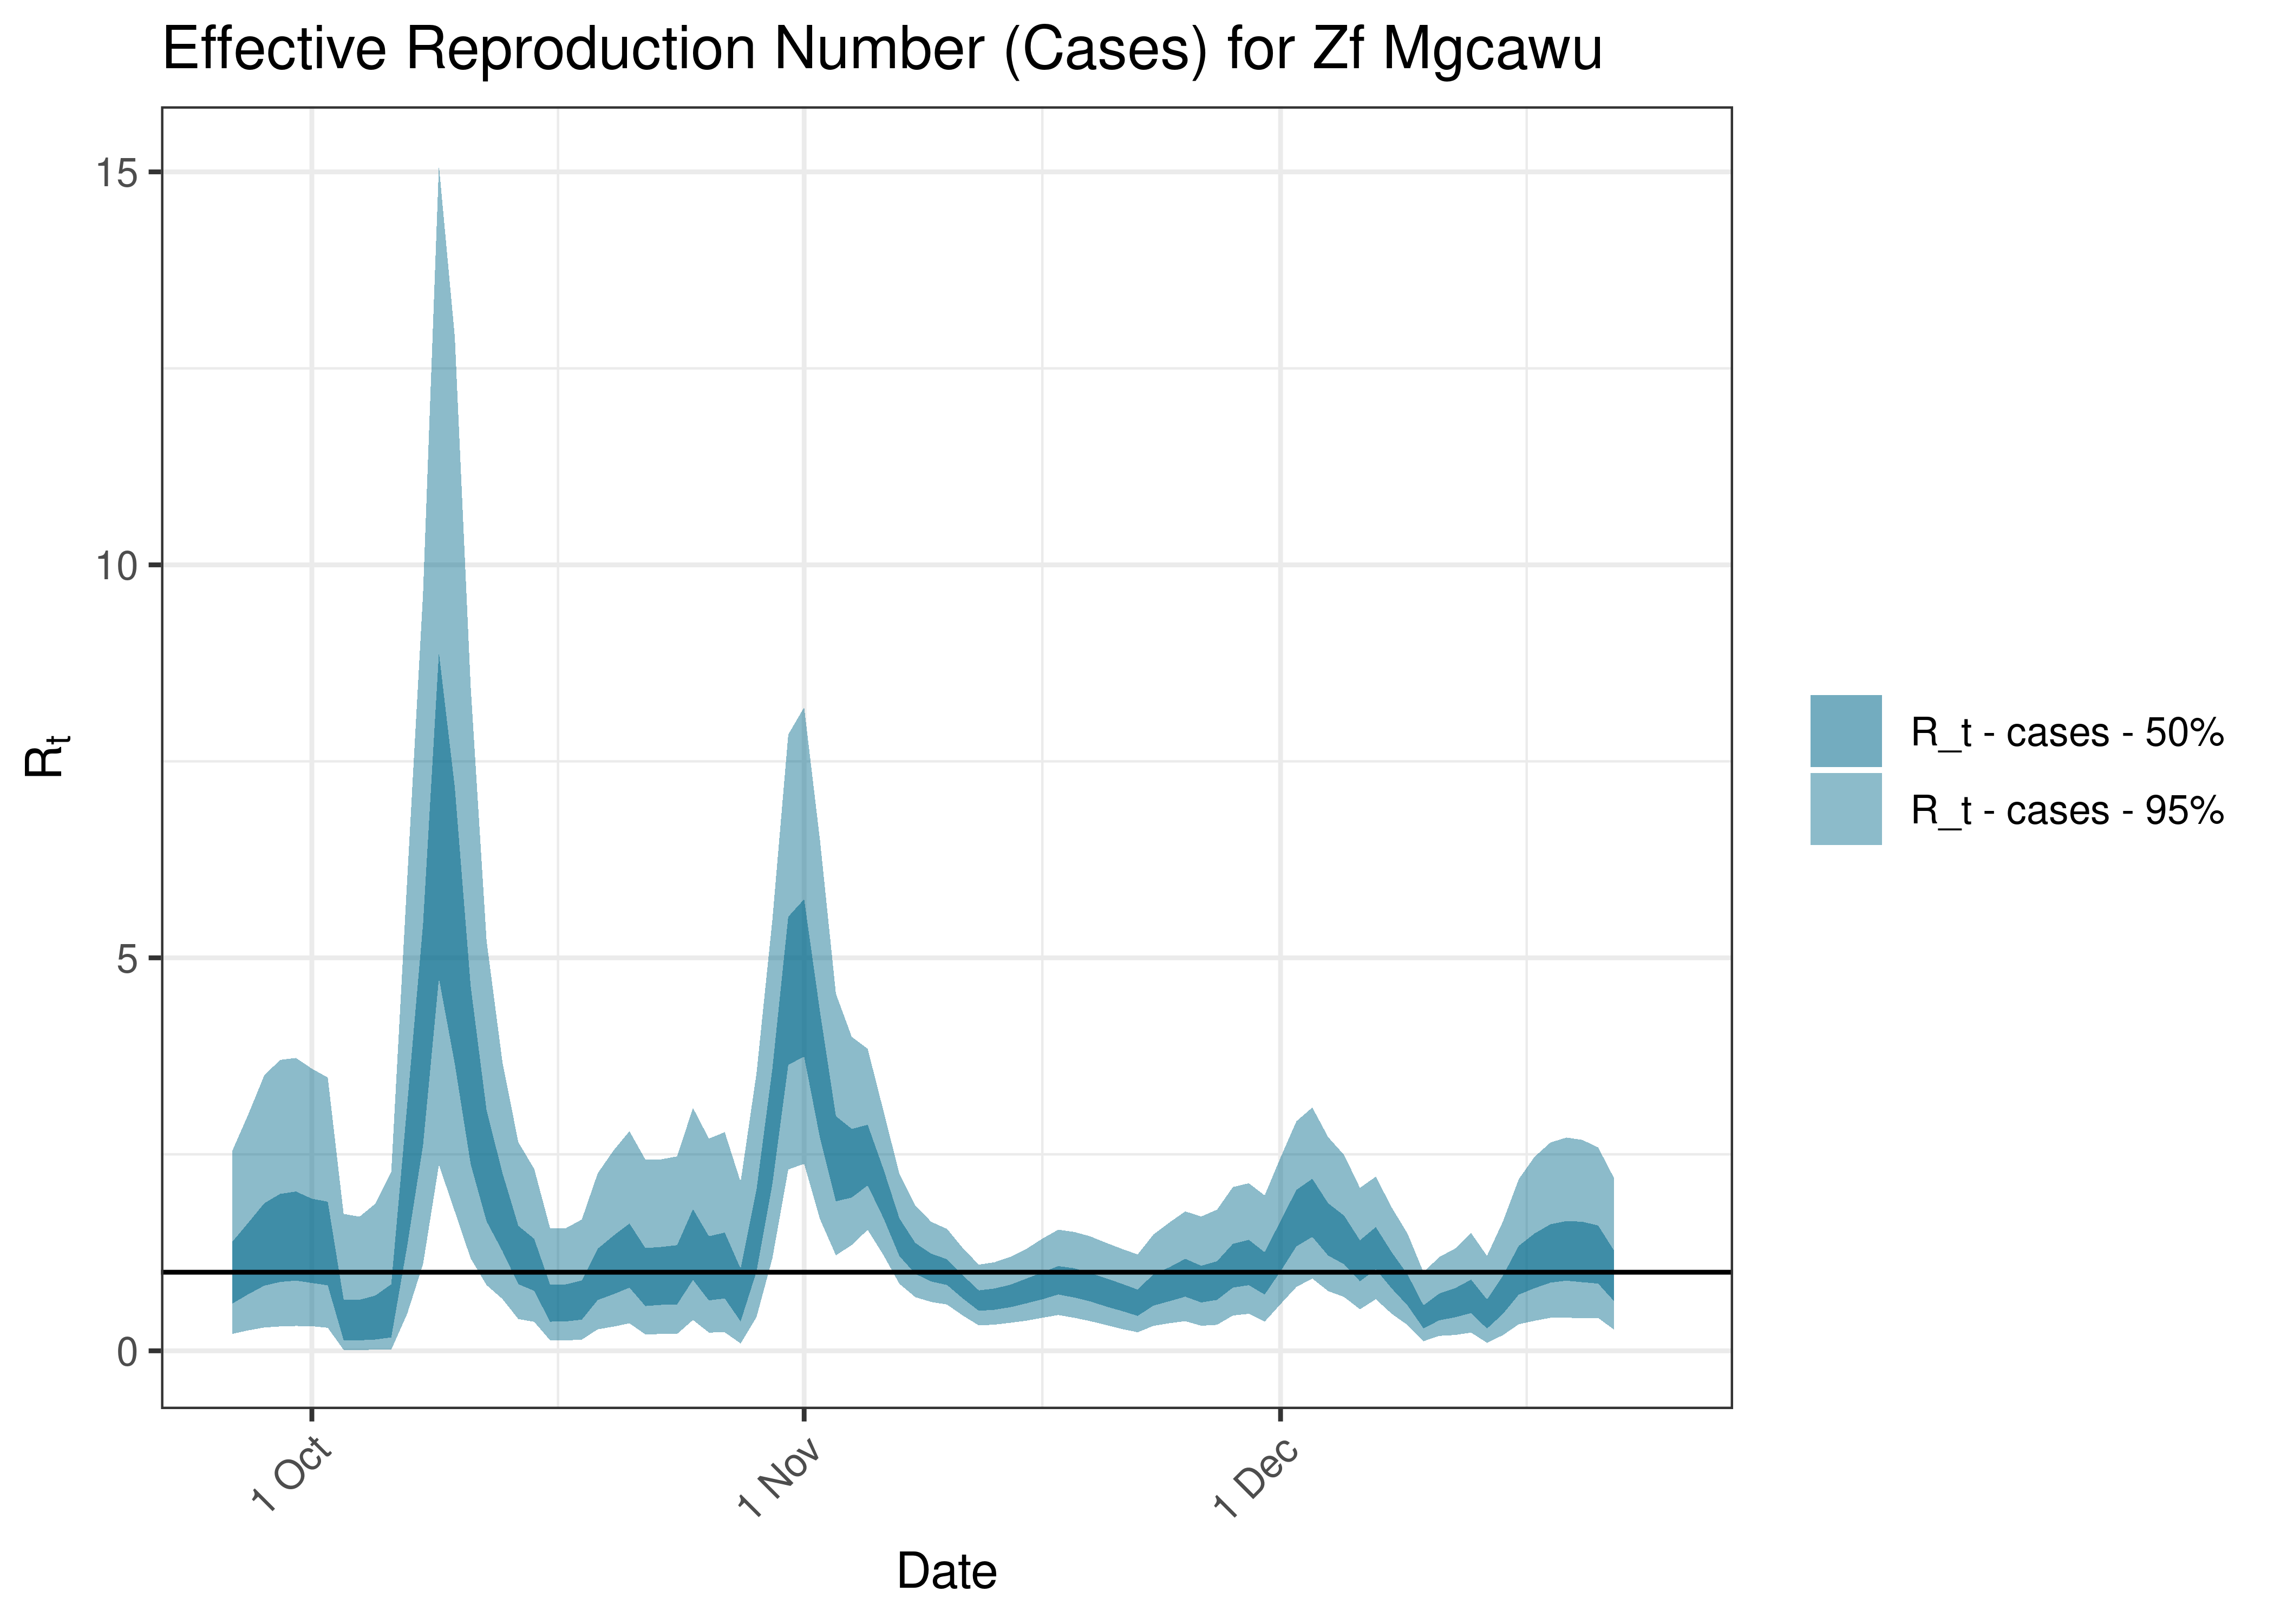
Estimated Effective Reproduction Number Based on Cases for Zf Mgcawu over last 90 days
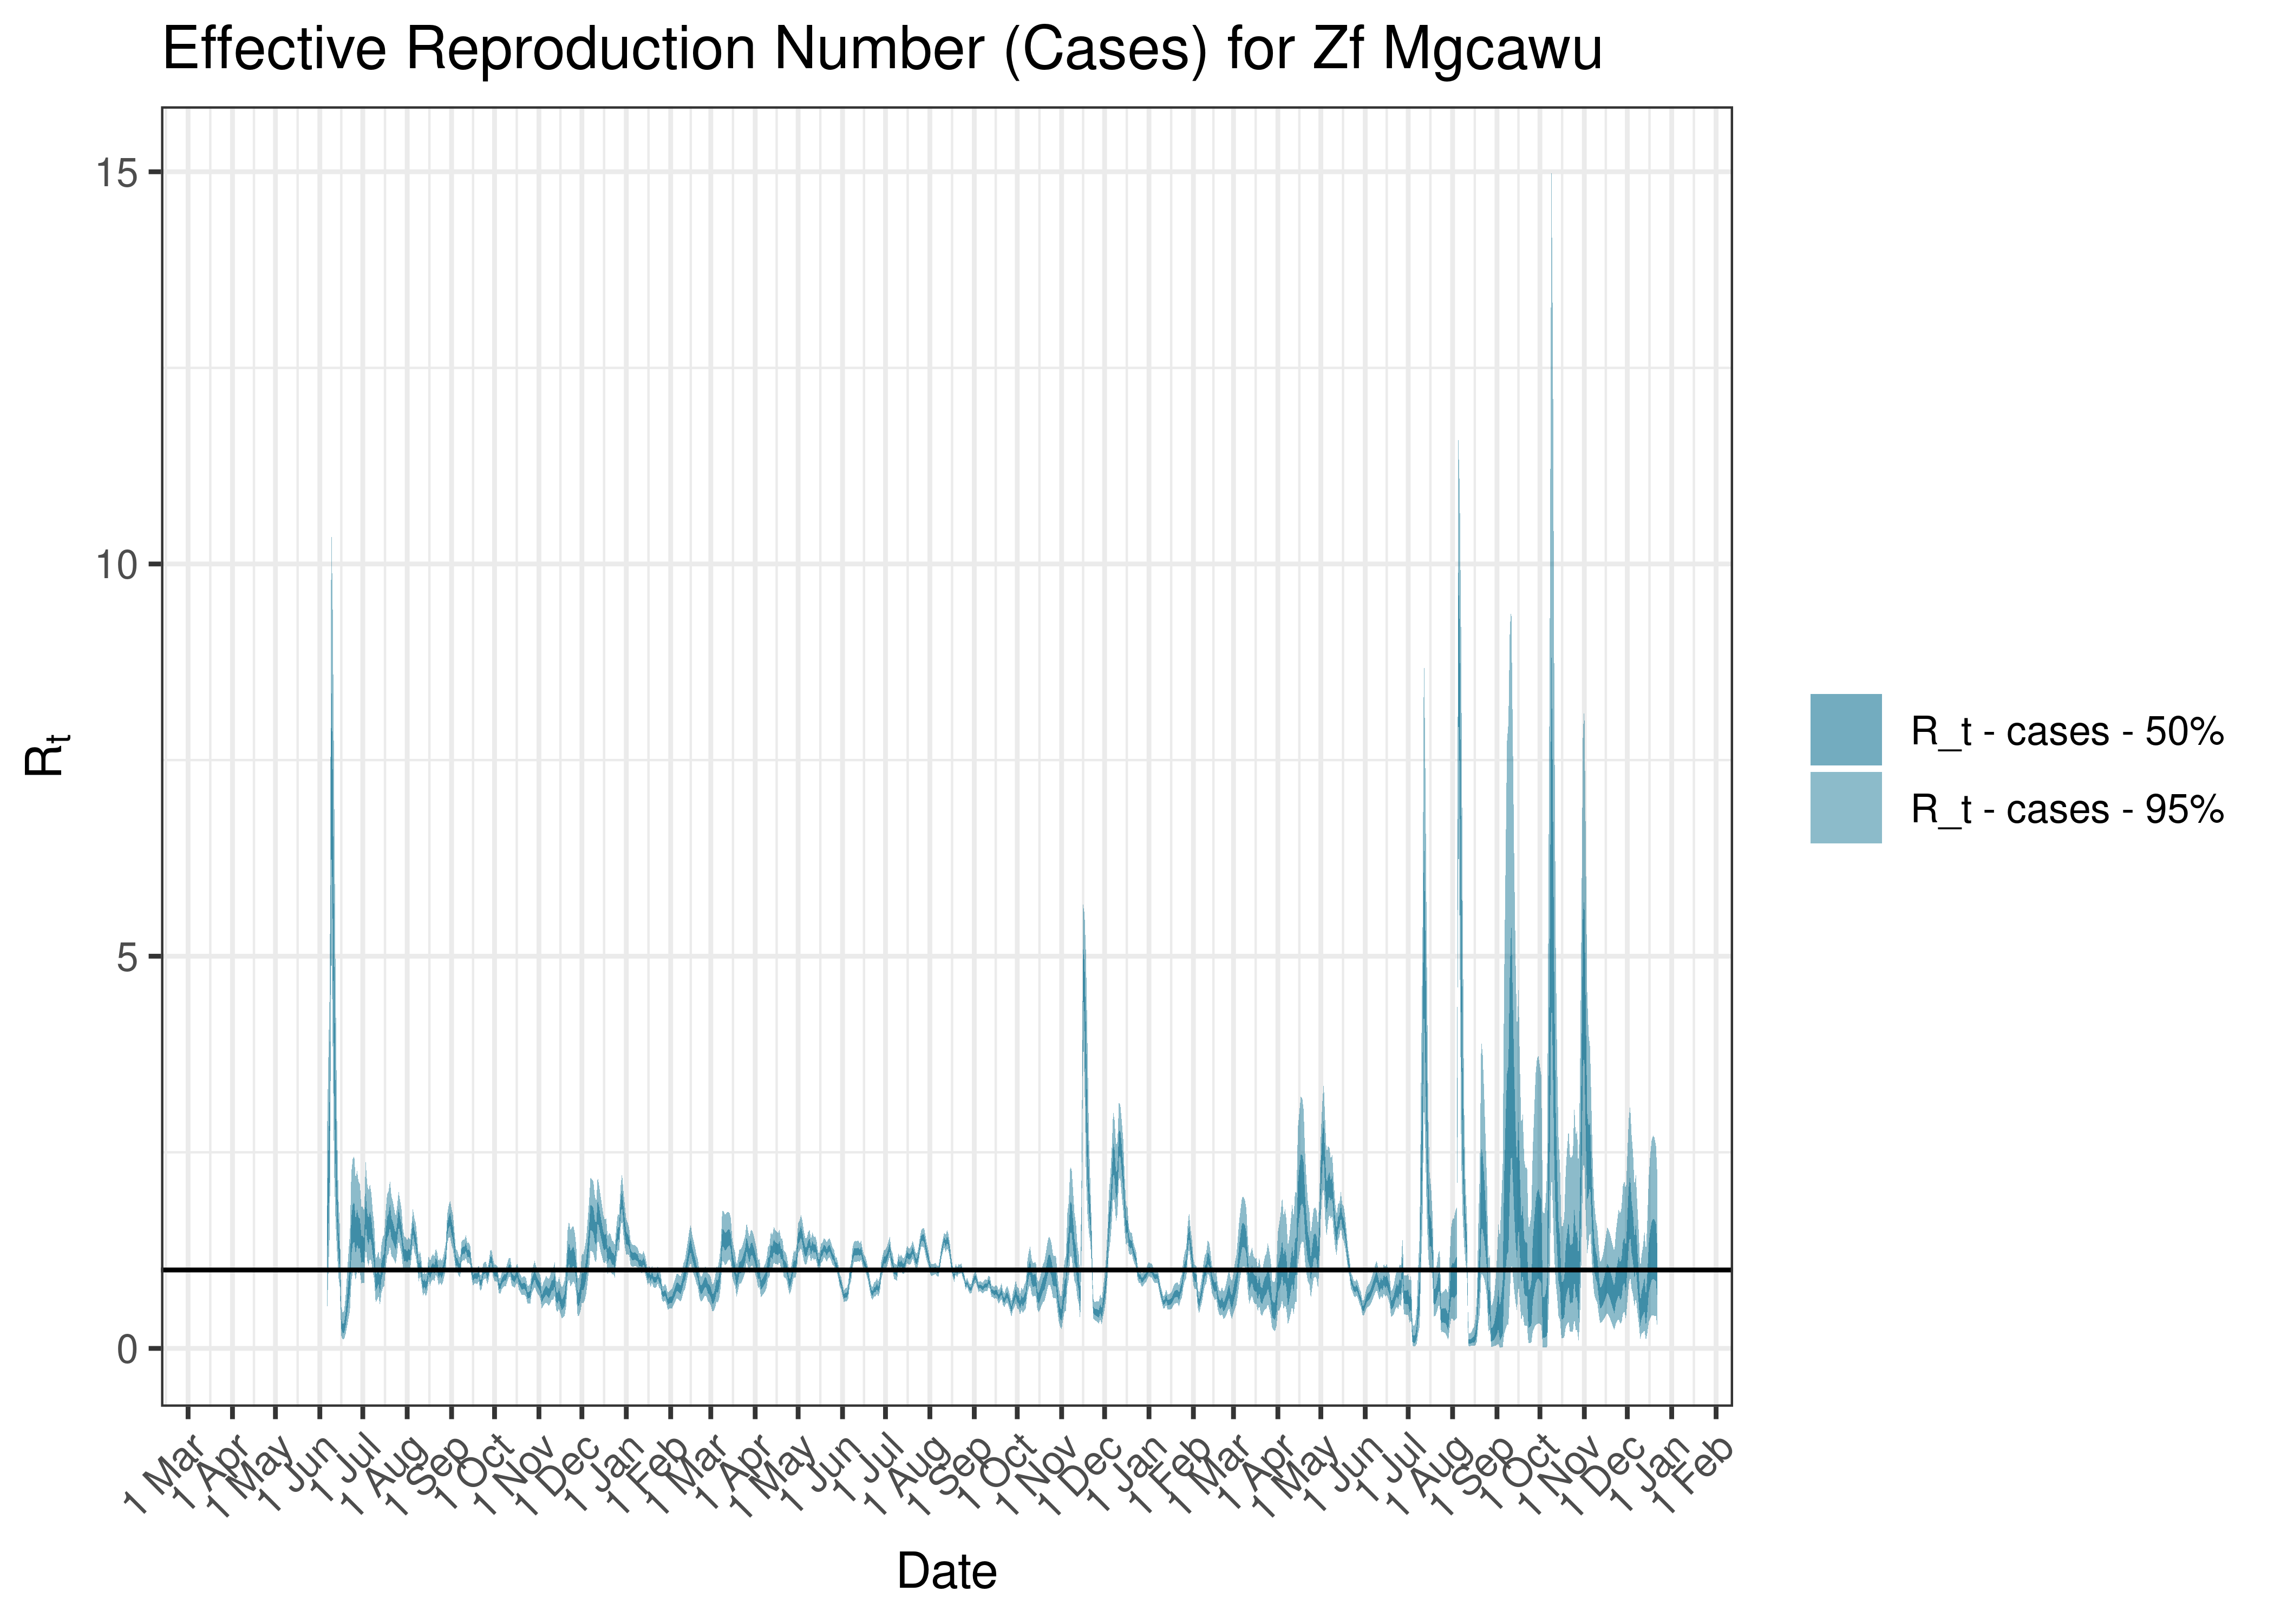
Estimated Effective Reproduction Number Based on Cases for Zf Mgcawu since 1 April 2020
6.10 Western Cape
6.10.1 Cases
Cases are tabulated by specimen received date below. Cases include estimates for late reporting in recent days as well as adjustments for any public holidays. A centred 7-day moving average is also shown. The peak daily cases in previous waves (as measured by the moving average) is also shown.
| Specimen Received Date | Cases | 7-day Moving Average | Comment |
|---|---|---|---|
| 2020-06-21 | 491 | 1,336 | Wave 1 Peak |
| 2020-12-29 | 4,562 | 3,619 | Wave 2 Peak |
| 2021-08-05 | 4,044 | 3,277 | Wave 3 Peak |
| 2021-12-17 | 3,877 | 3,658 | Wave 4 Peak |
| 2022-05-15 | 321 | 1,183 | Wave 5 Peak (to date) |
Below a 7-day moving average daily case count is plotted for Western Cape on a log scale since start of the epidemic:
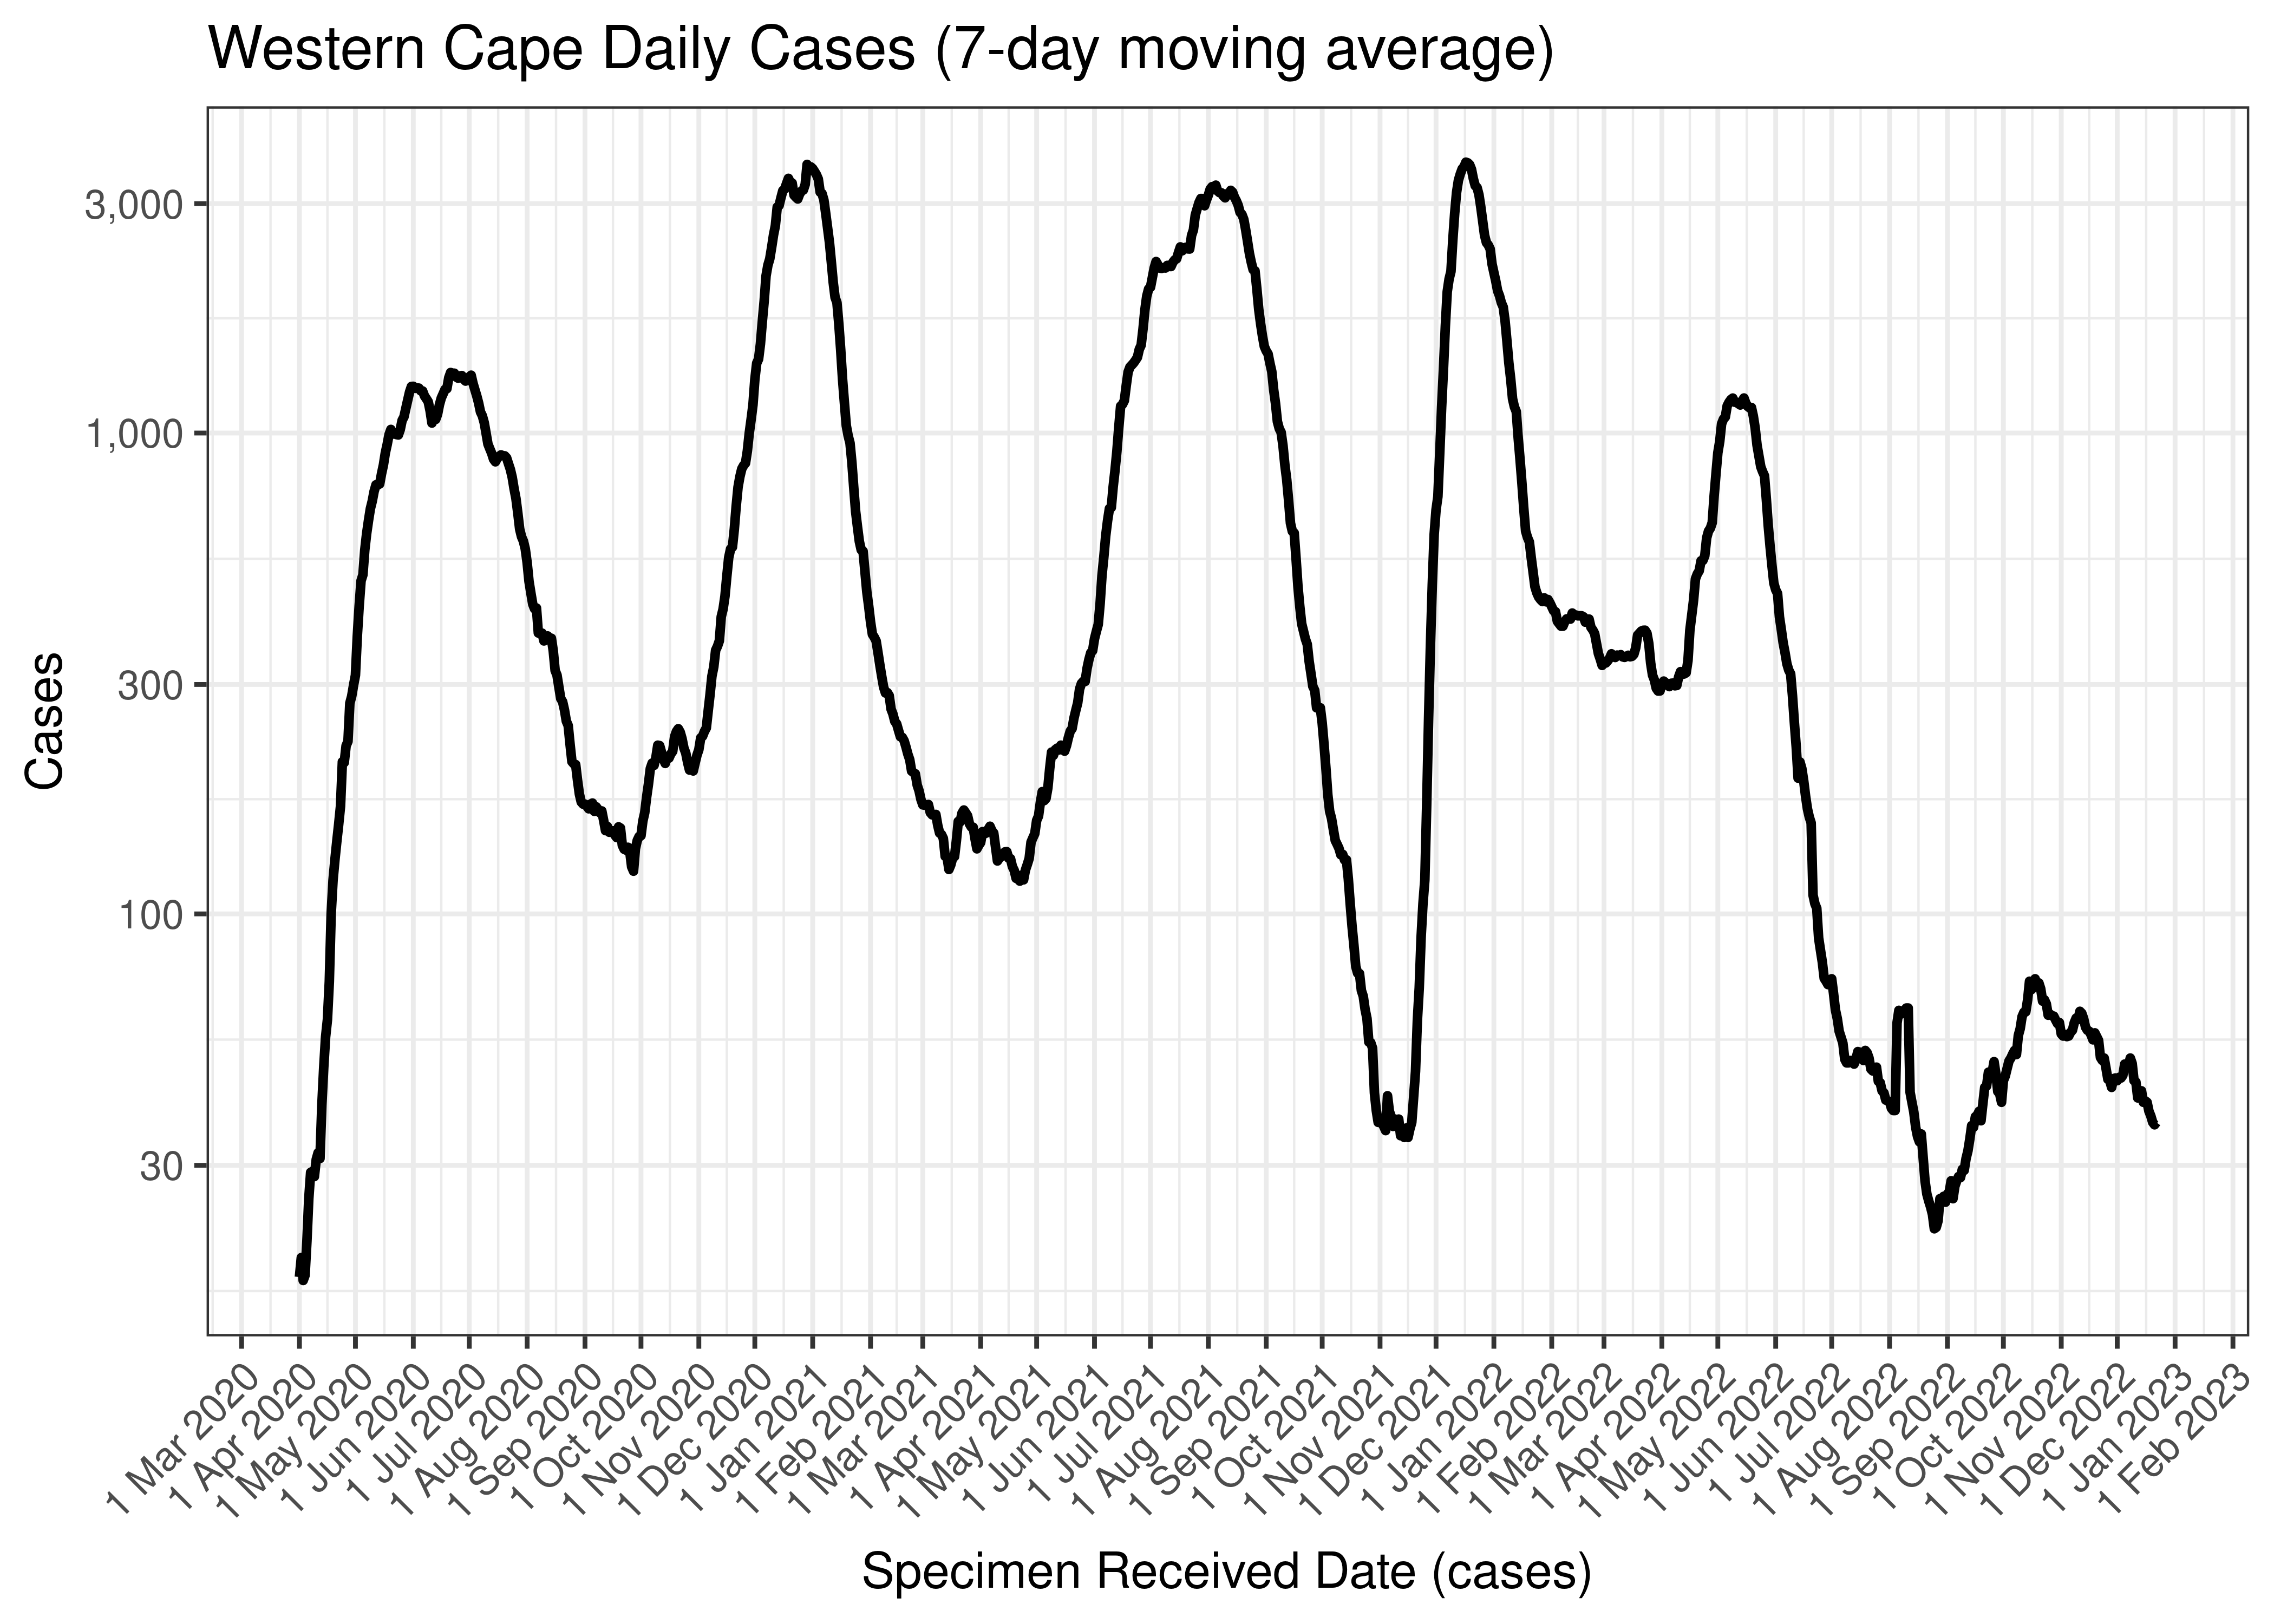
Western Cape Daily Cases (7-day moving average)
Below the above chart is repeated for the last 30-days:

Western Cape Daily Cases for Last 30-days (7-day moving average)
Below a 7-day moving average daily case count is plotted for Western Cape by district municipality on a log scale since start of the epidemic:
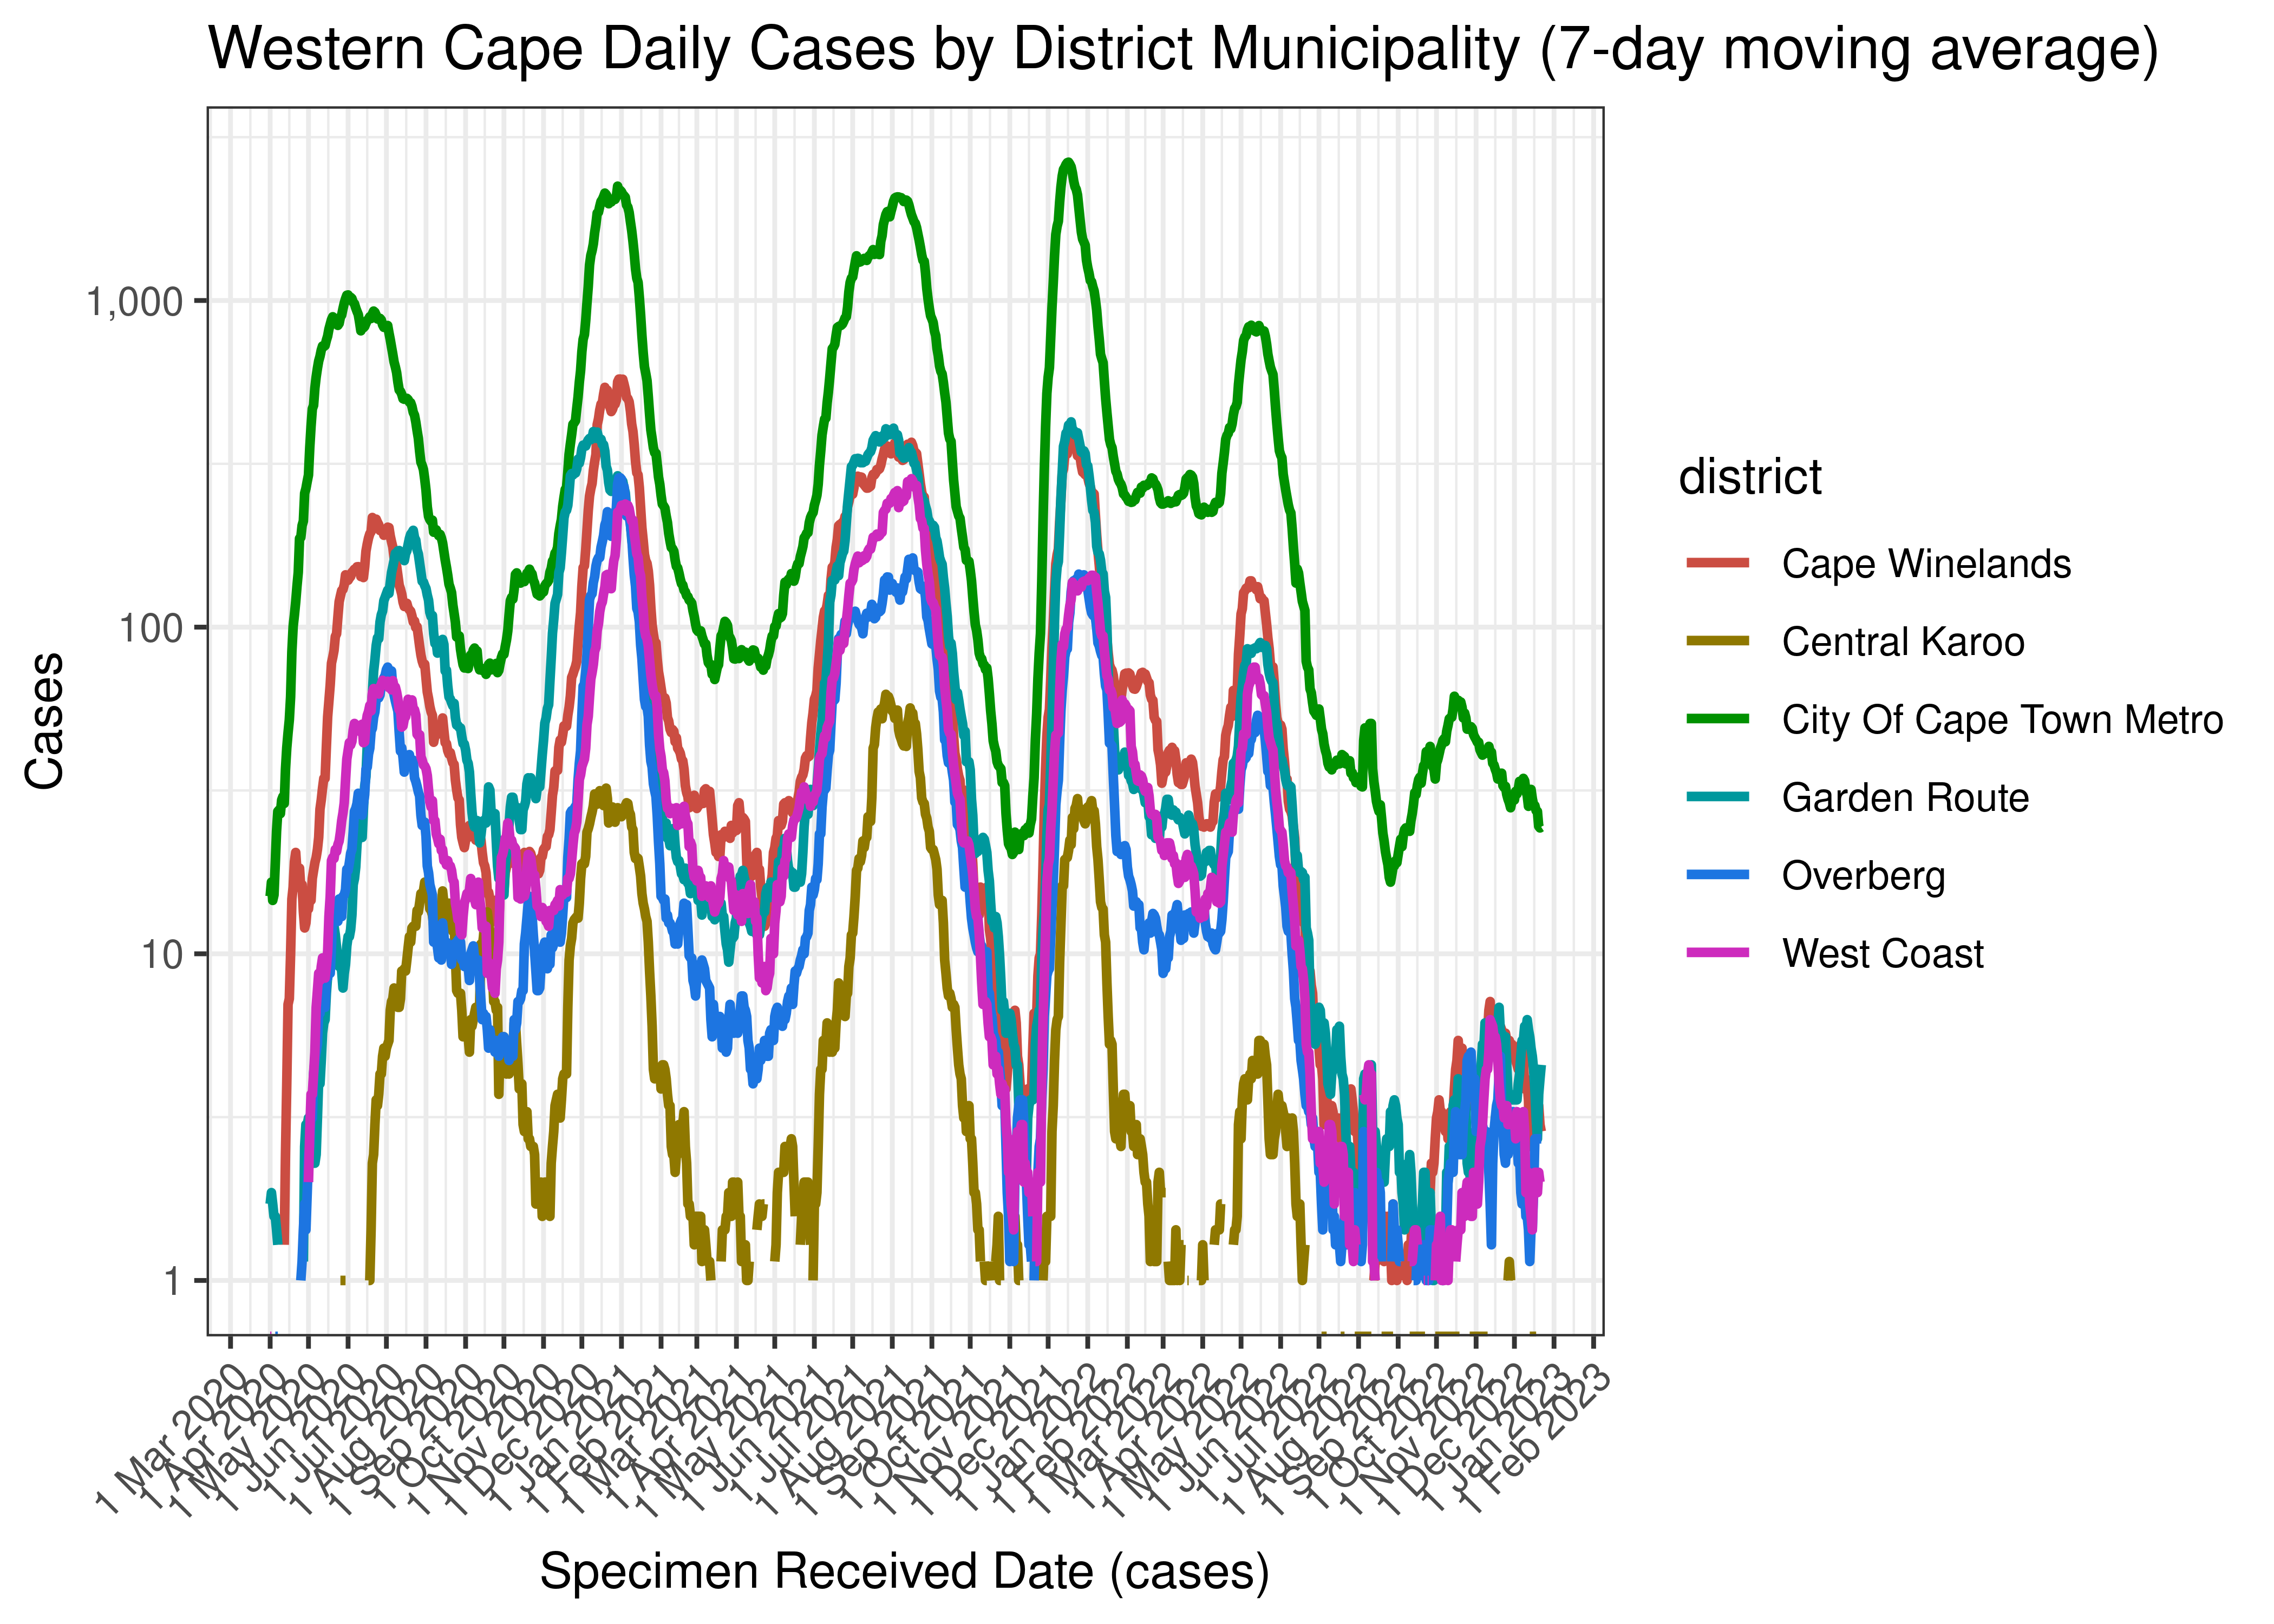
Western Cape Daily Cases by District Municipality (7-day moving average)
Below the above chart is repeated for the last 30-days:
Western Cape Daily Cases for Last 30-days by District Municipality (7-day moving average)
6.10.2 Hospital Admissions
Hospital admissions are tabulated by reported date below. The peak daily admissions in previous waves (as measured by the moving average) is also shown.
| Reported Date | Hospital Admissions | 7-day Moving Average | Comment |
|---|---|---|---|
| 2020-06-24 | 236 | 309 | Wave 1 Peak |
| 2021-01-25 | 118 | 1,074 | Wave 2 Peak |
| 2021-08-05 | 522 | 553 | Wave 3 Peak |
| 2021-12-27 | 937 | 398 | Wave 4 Peak |
| 2022-05-21 | 114 | 101 | Wave 5 Peak (to date) |
| 2022-12-16 | 0 | 8 | |
| 2022-12-17 | 11 | 9 | |
| 2022-12-18 | 11 | 8 | |
| 2022-12-19 | 8 | 8 | |
| 2022-12-20 | 12 | 8 | |
| 2022-12-21 | 7 | NA | |
| 2022-12-22 | 5 | NA | |
| 2022-12-23 | 2 | NA |
Below a 7-day moving average daily hospital admissions count is plotted for Western Cape on a log scale since start of the epidemic:
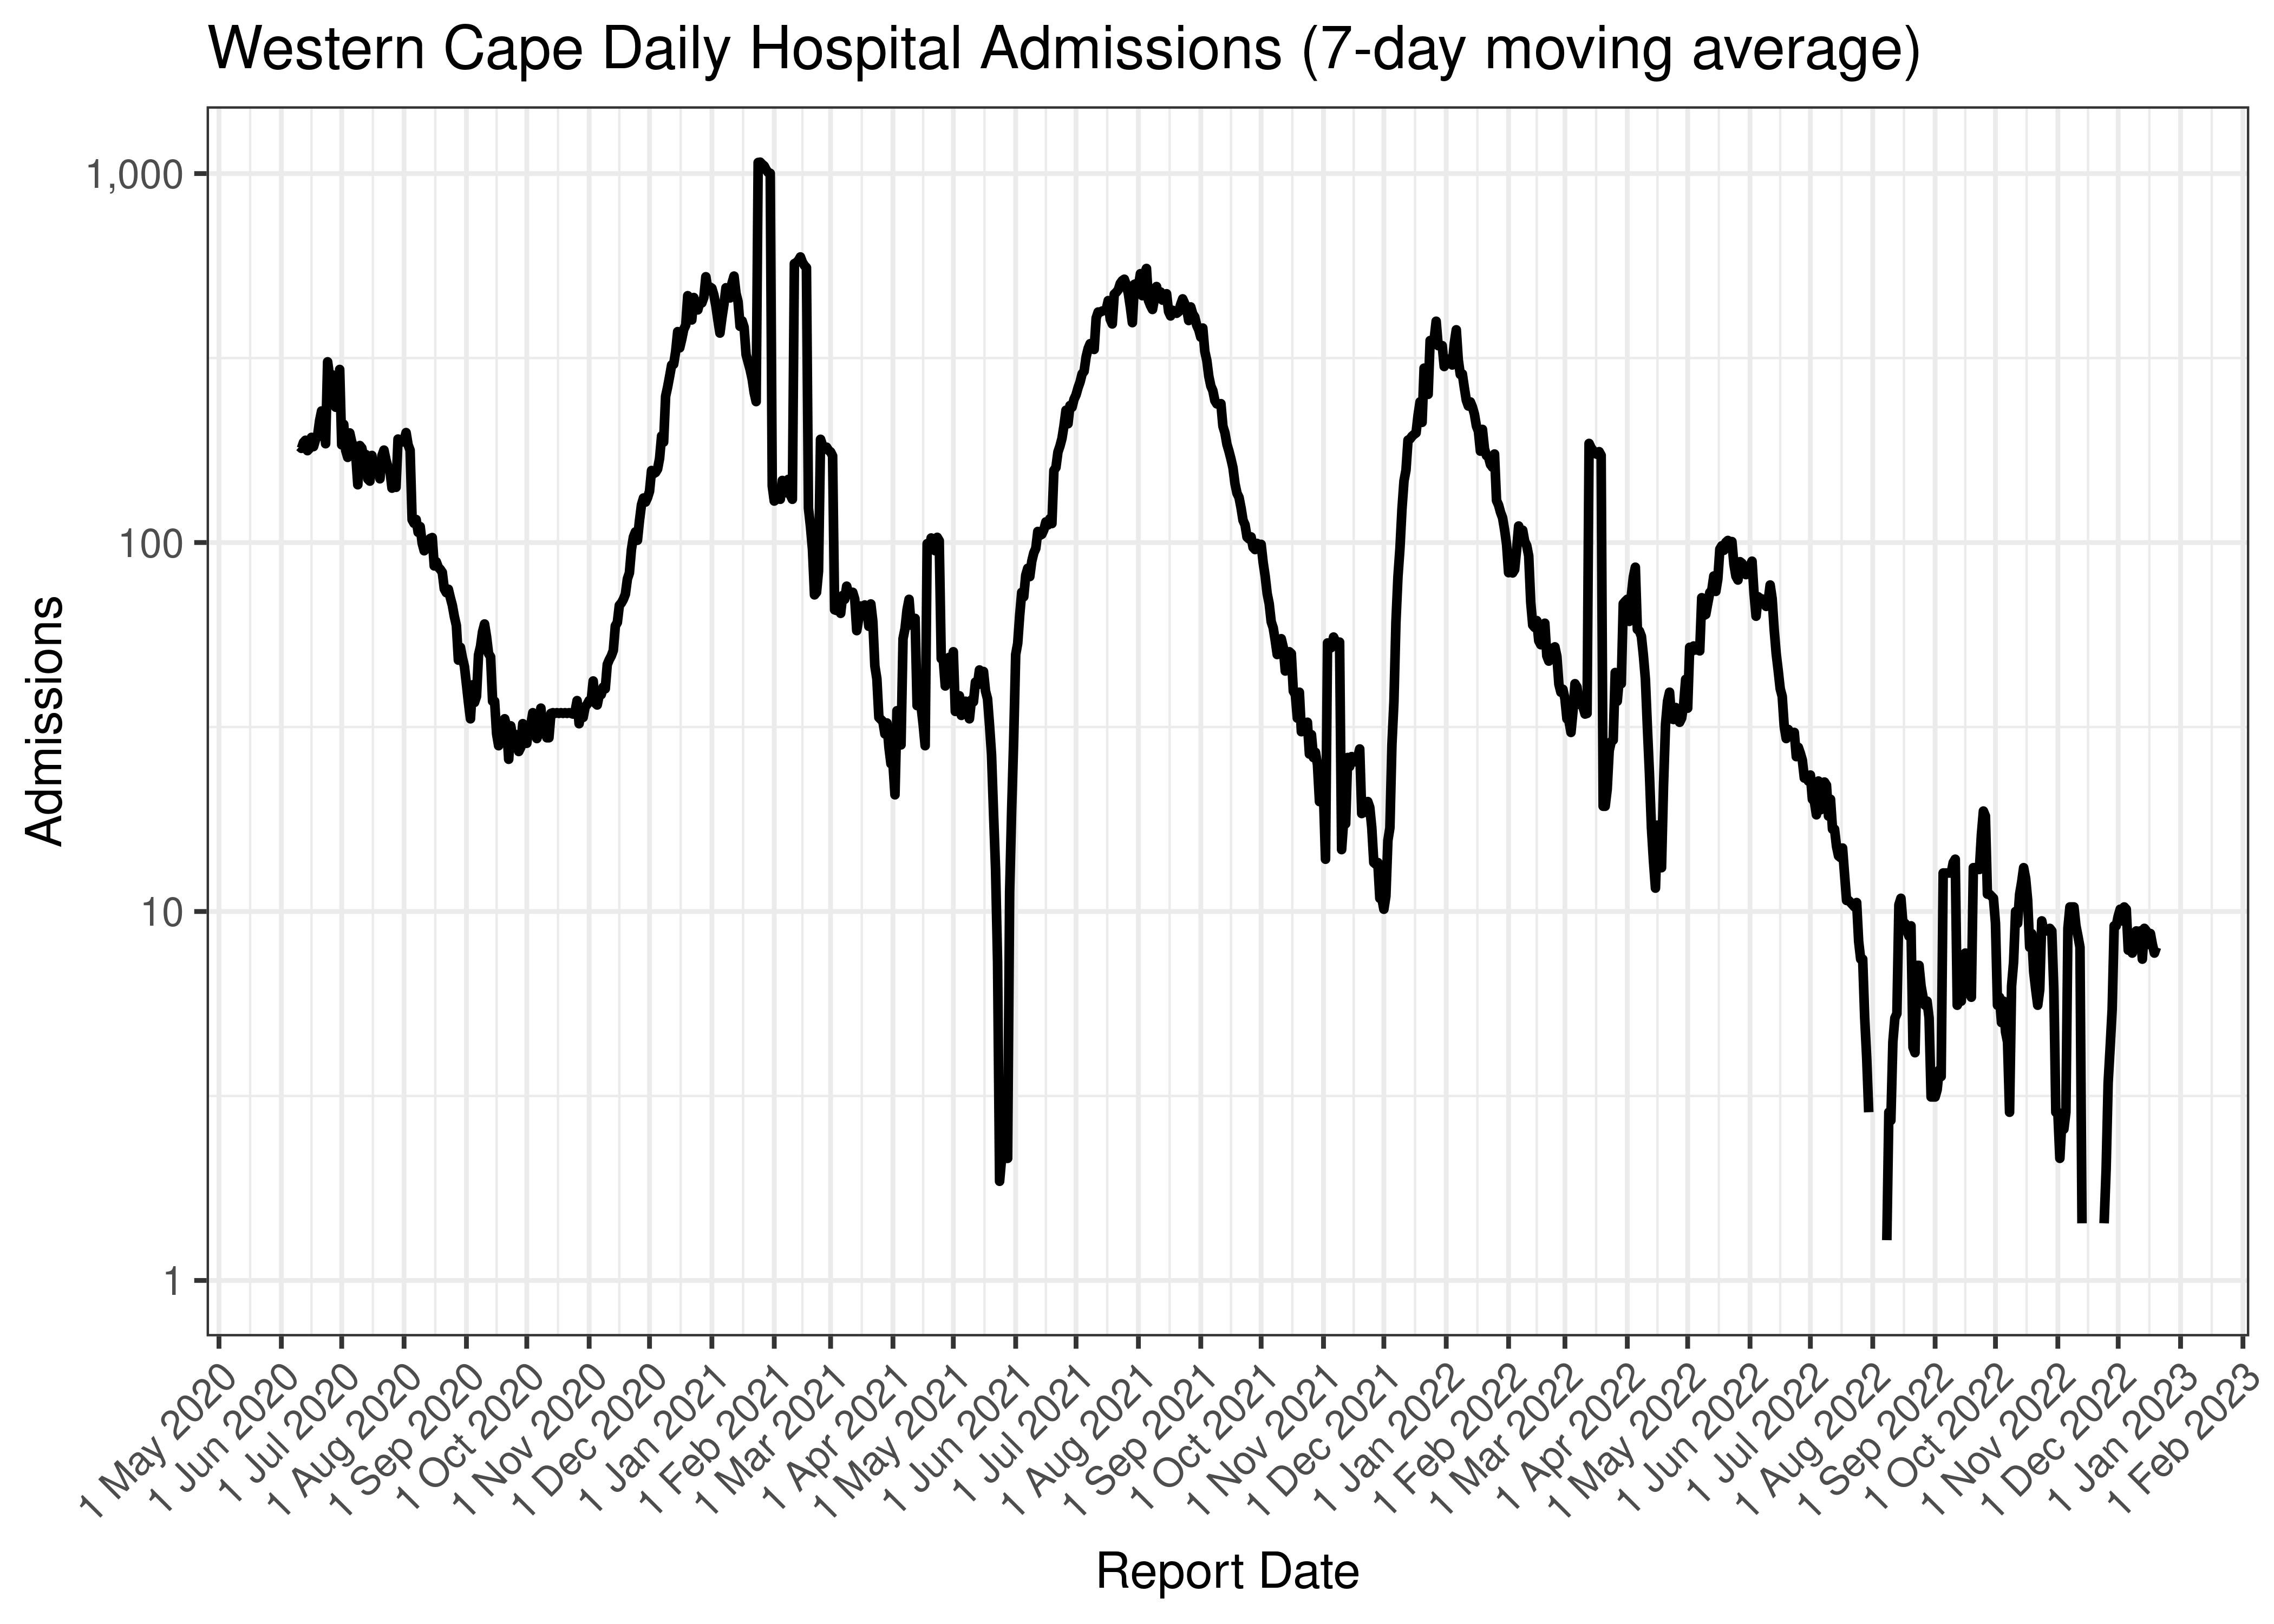
Western Cape Daily Hospital Admissions (7-day moving average)
Below the above chart is repeated for the last 30-days:
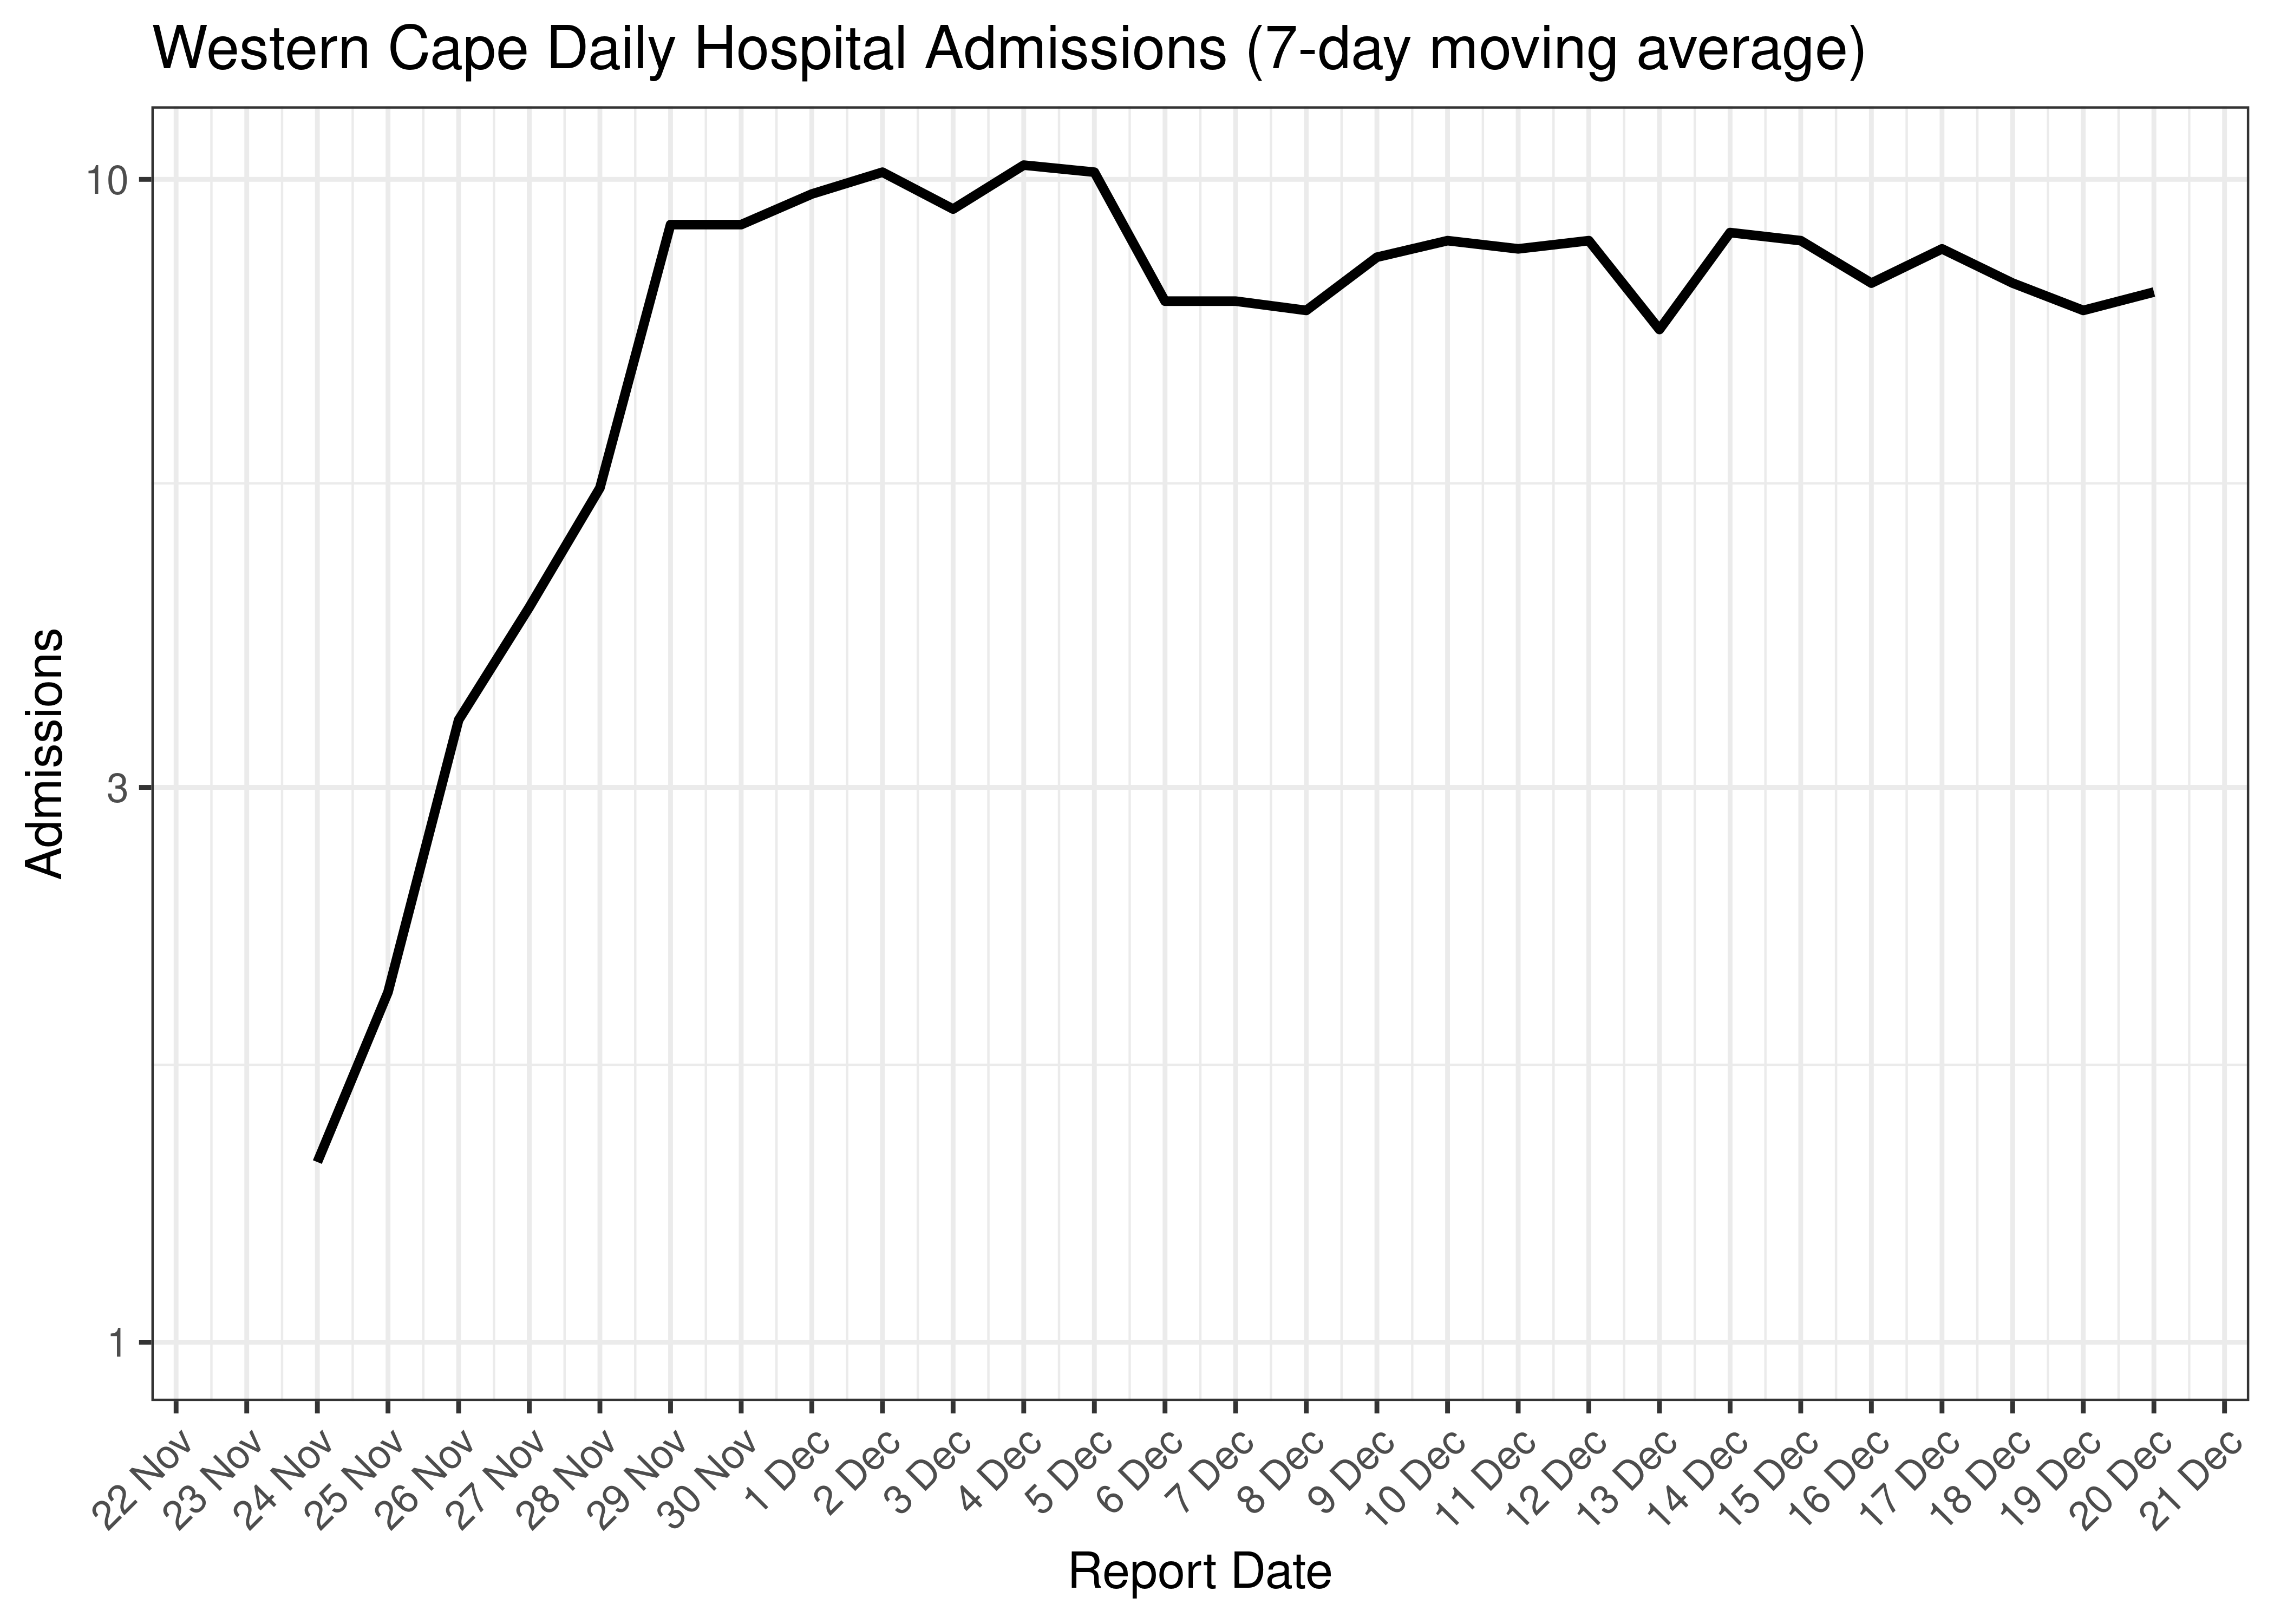
Western Cape Daily Hospital Admissions for Last 30-days (7-day moving average)
6.10.3 Hospital Deaths
Hospital deaths are tabulated by reported date below. The peak daily deaths in previous waves (as measured by the moving average) is also shown.
Note that hospital deaths underestimates total COVID-19 deaths in South Africa.
| Reported Date | Hospital Deaths | 7-day Moving Average | Comment |
|---|---|---|---|
| 2020-06-30 | 49 | 55 | Wave 1 Peak |
| 2021-01-02 | 105 | 134 | Wave 2 Peak |
| 2021-07-25 | 97 | 111 | Wave 3 Peak |
| 2022-01-09 | 27 | 65 | Wave 4 Peak |
| 2022-06-05 | 4 | 6 | Wave 5 Peak (to date) |
| 2022-12-16 | 0 | 0 | |
| 2022-12-17 | 0 | 0 | |
| 2022-12-18 | 0 | 0 | |
| 2022-12-19 | 0 | 0 | |
| 2022-12-20 | 1 | 0 | |
| 2022-12-21 | 2 | NA | |
| 2022-12-22 | 0 | NA | |
| 2022-12-23 | 0 | NA |
Below a 7-day moving average daily hospital deaths count is plotted for Western Cape on a log scale since start of the epidemic:
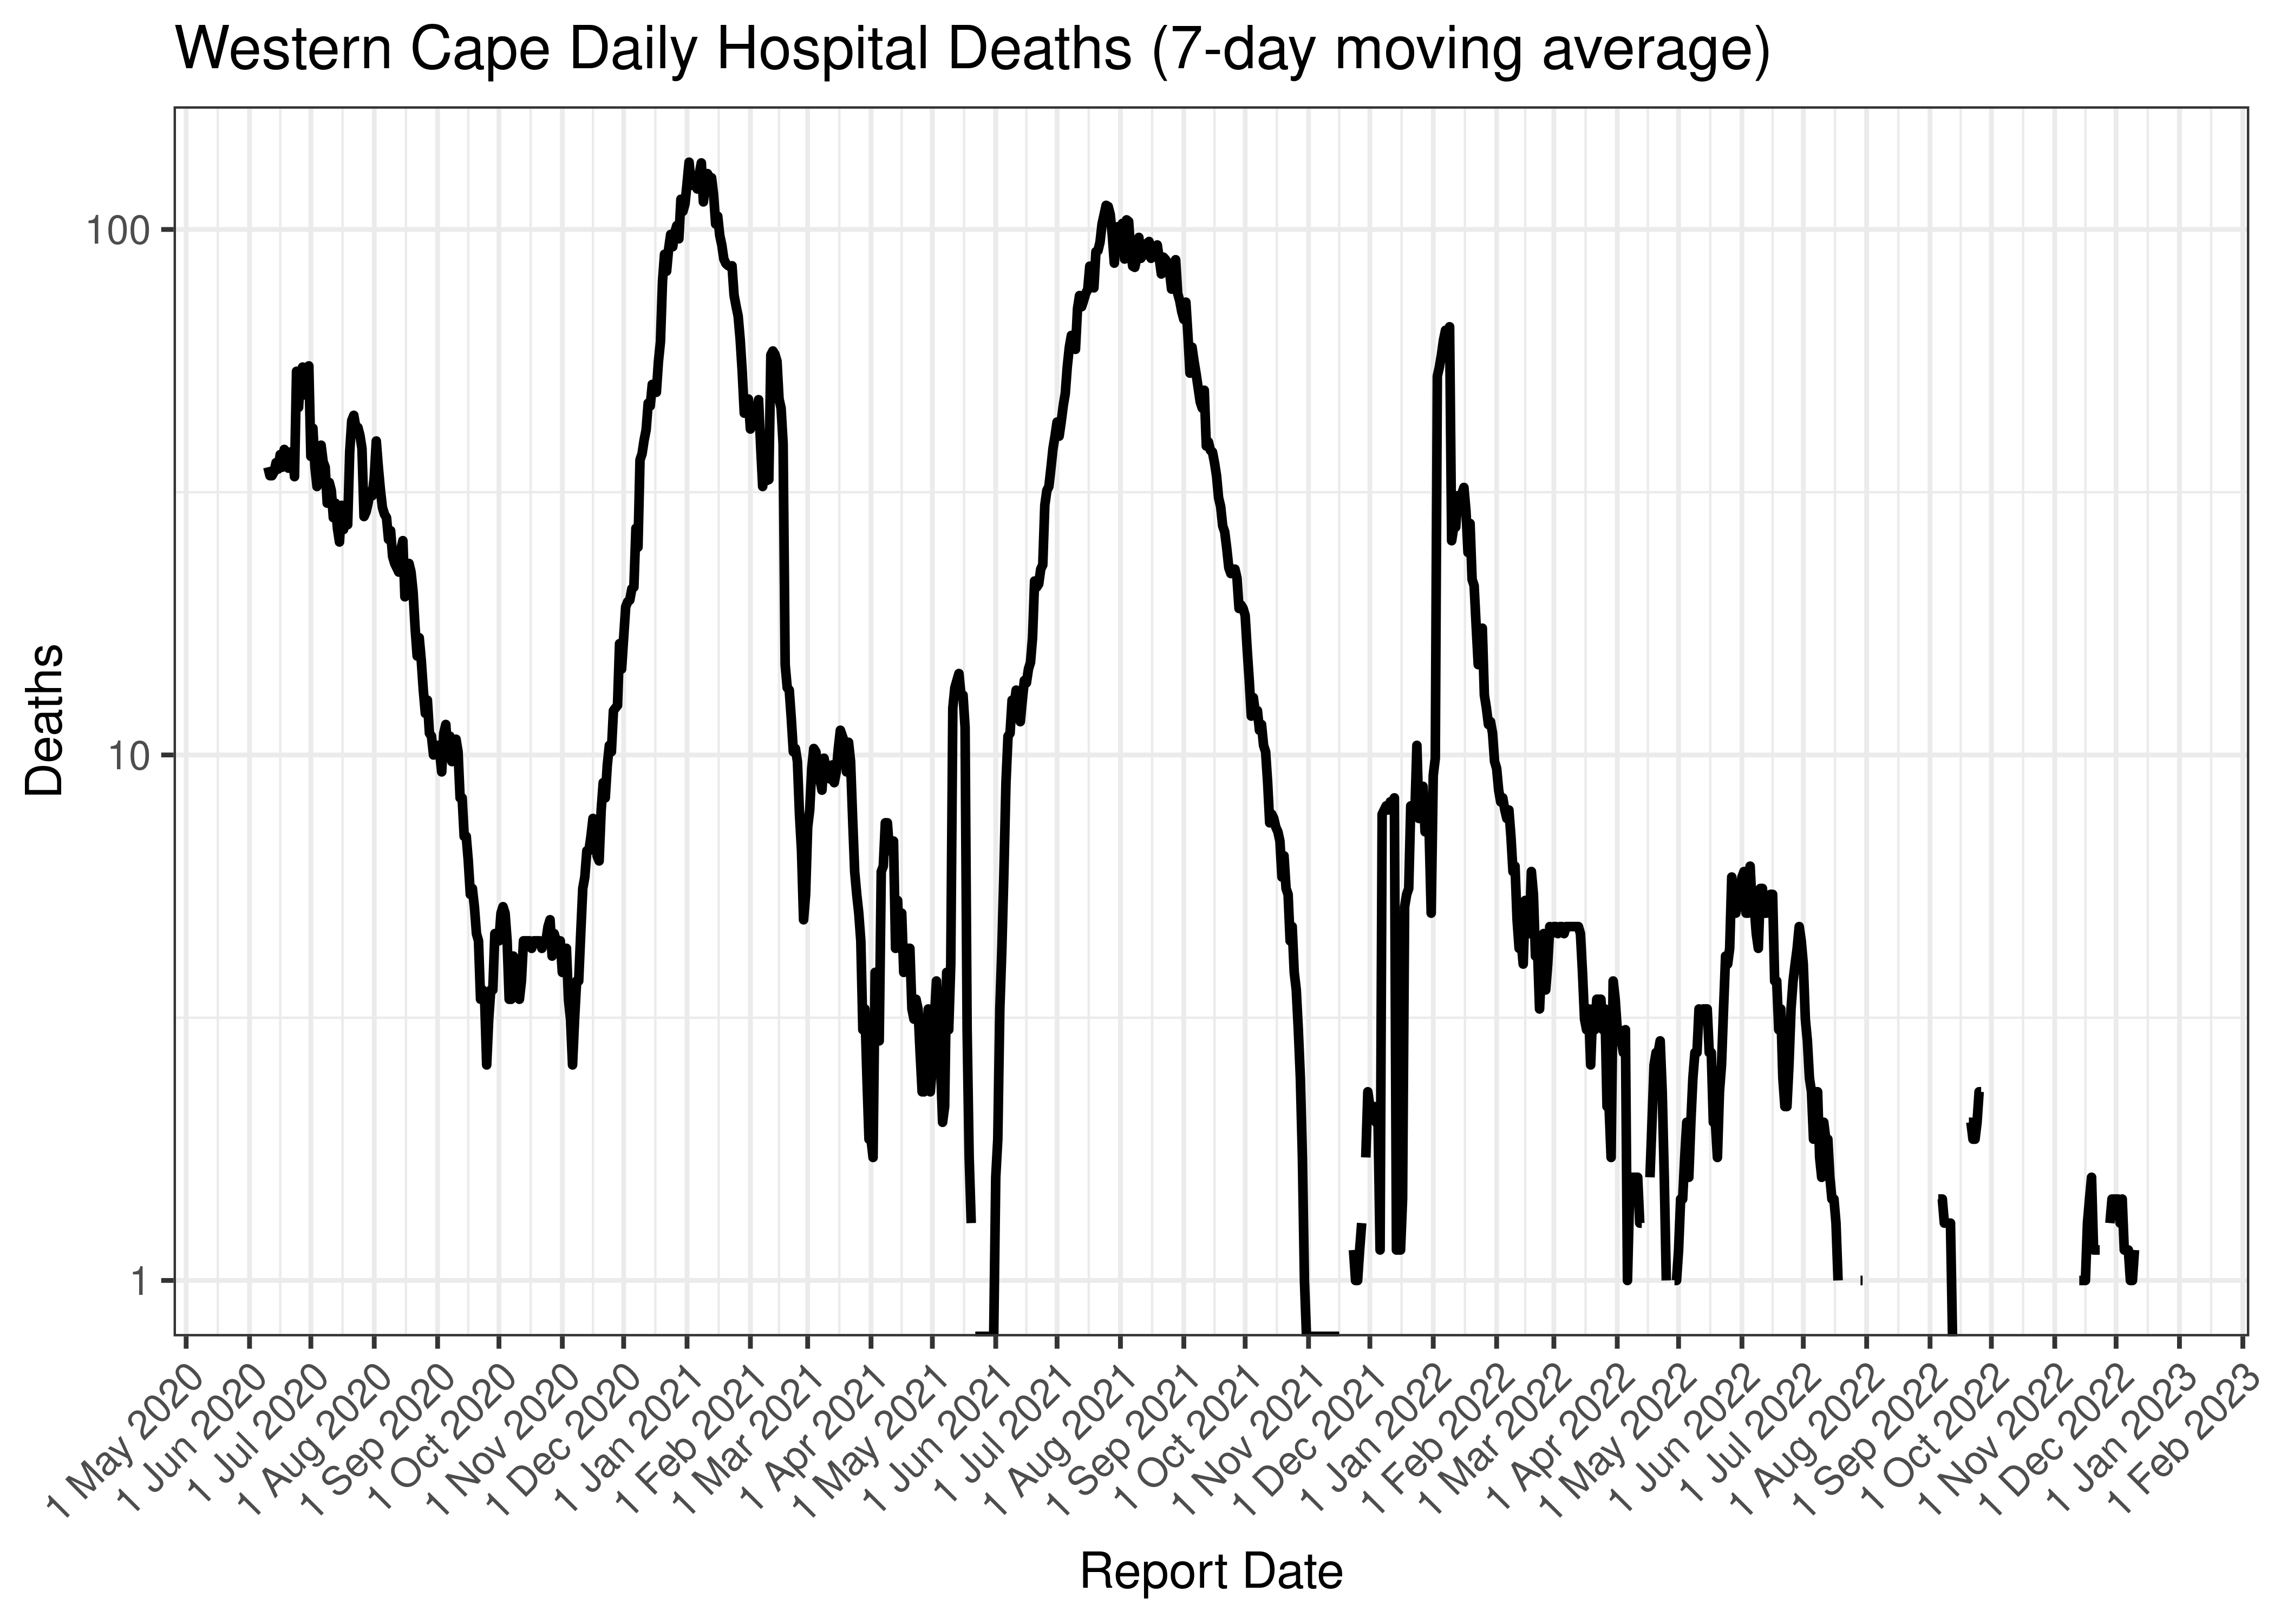
Western Cape Daily Hospital Deaths (7-day moving average)
Below the above chart is repeated for the last 30-days:
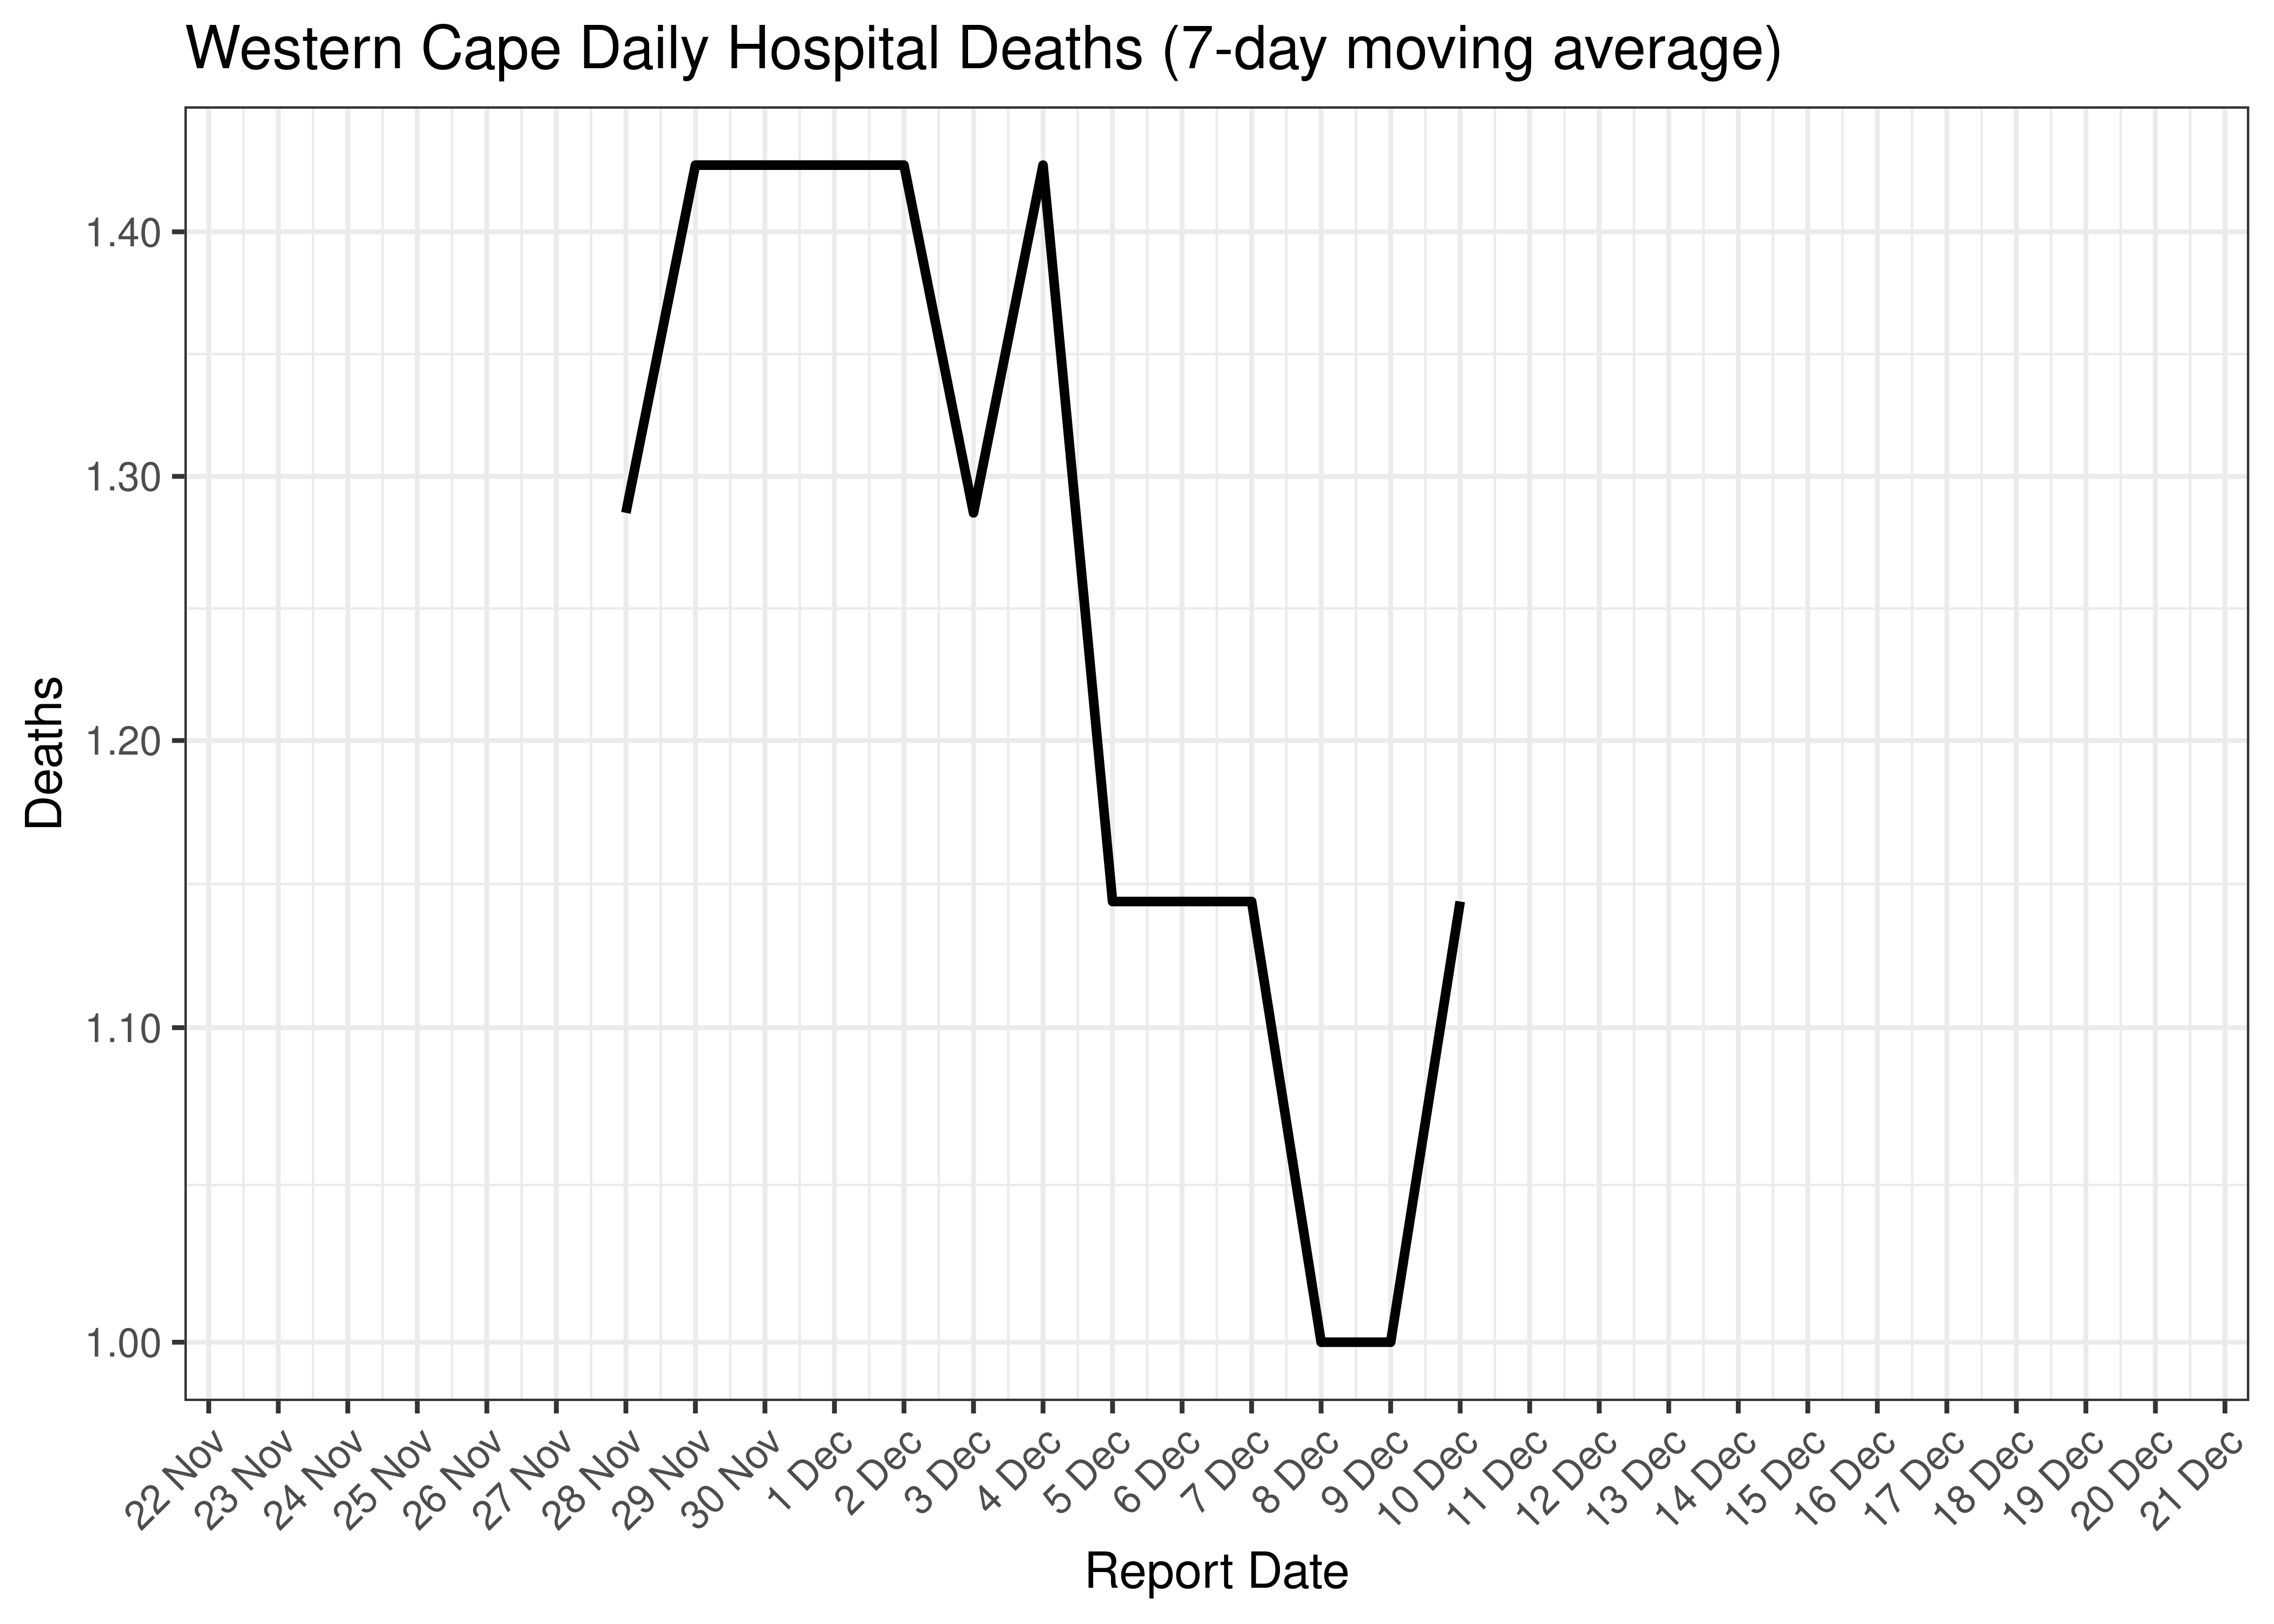
Western Cape Daily Hospital Deaths for Last 30-days (7-day moving average)
6.10.4 Excess Deaths
Excess deaths are tabulated by date of death below. The peak daily deaths in previous waves (as measured by the moving average) is also shown.
| Date of Death | Excess Deaths | 7-day Moving Average | Comment |
|---|---|---|---|
| 2020-07-15 | 59 | 59 | Wave 1 Peak |
| 2021-01-06 | 215 | 215 | Wave 2 Peak |
| 2021-08-04 | 181 | 181 | Wave 3 Peak |
| 2022-01-05 | 53 | 53 | Wave 4 Peak |
| 2022-05-11 | 15 | 15 | Wave 5 Peak (to date) |
| 2022-12-03 | 3 | -2 | |
| 2022-12-04 | -9 | -4 | |
| 2022-12-05 | -9 | -6 | |
| 2022-12-06 | -9 | -8 | |
| 2022-12-07 | -9 | -9 | |
| 2022-12-08 | -9 | NA | |
| 2022-12-09 | -9 | NA | |
| 2022-12-10 | -9 | NA |
Below a 7-day moving average daily excess deaths count is plotted for Western Cape on a log scale since start of the epidemic:
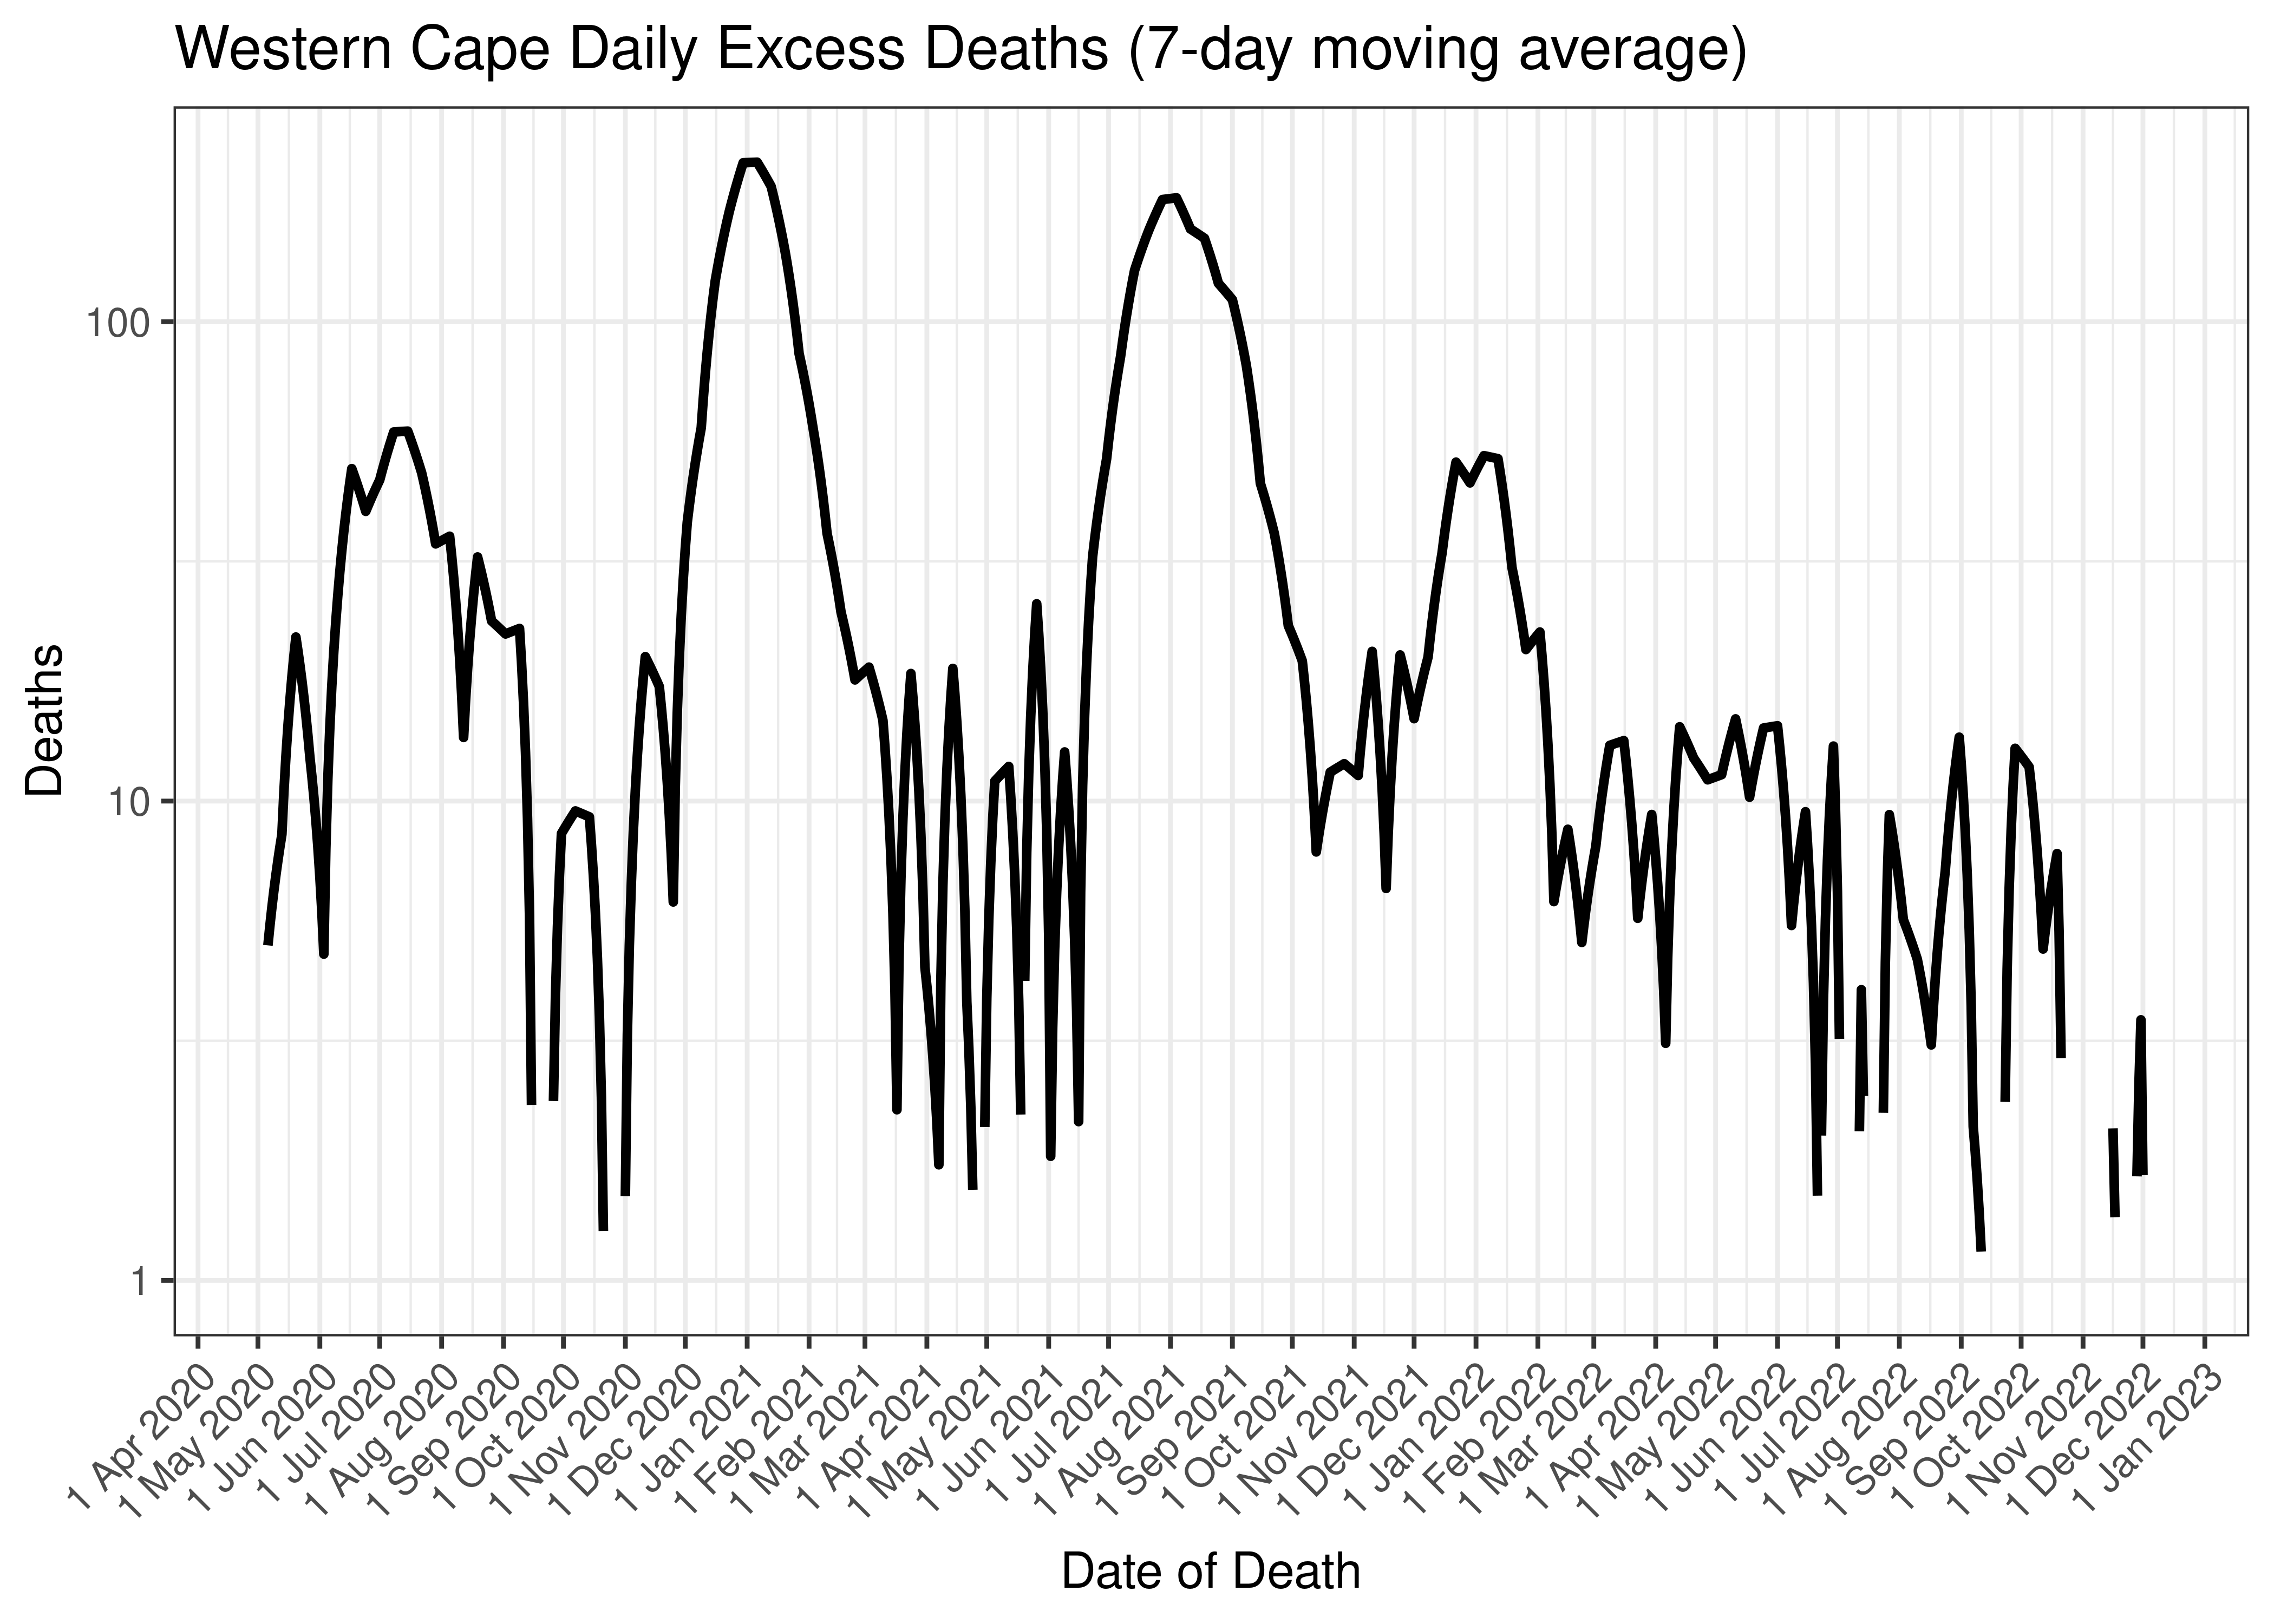
Western Cape Daily Excess Deaths (7-day moving average)
Below the above chart is repeated for the last 30-days:
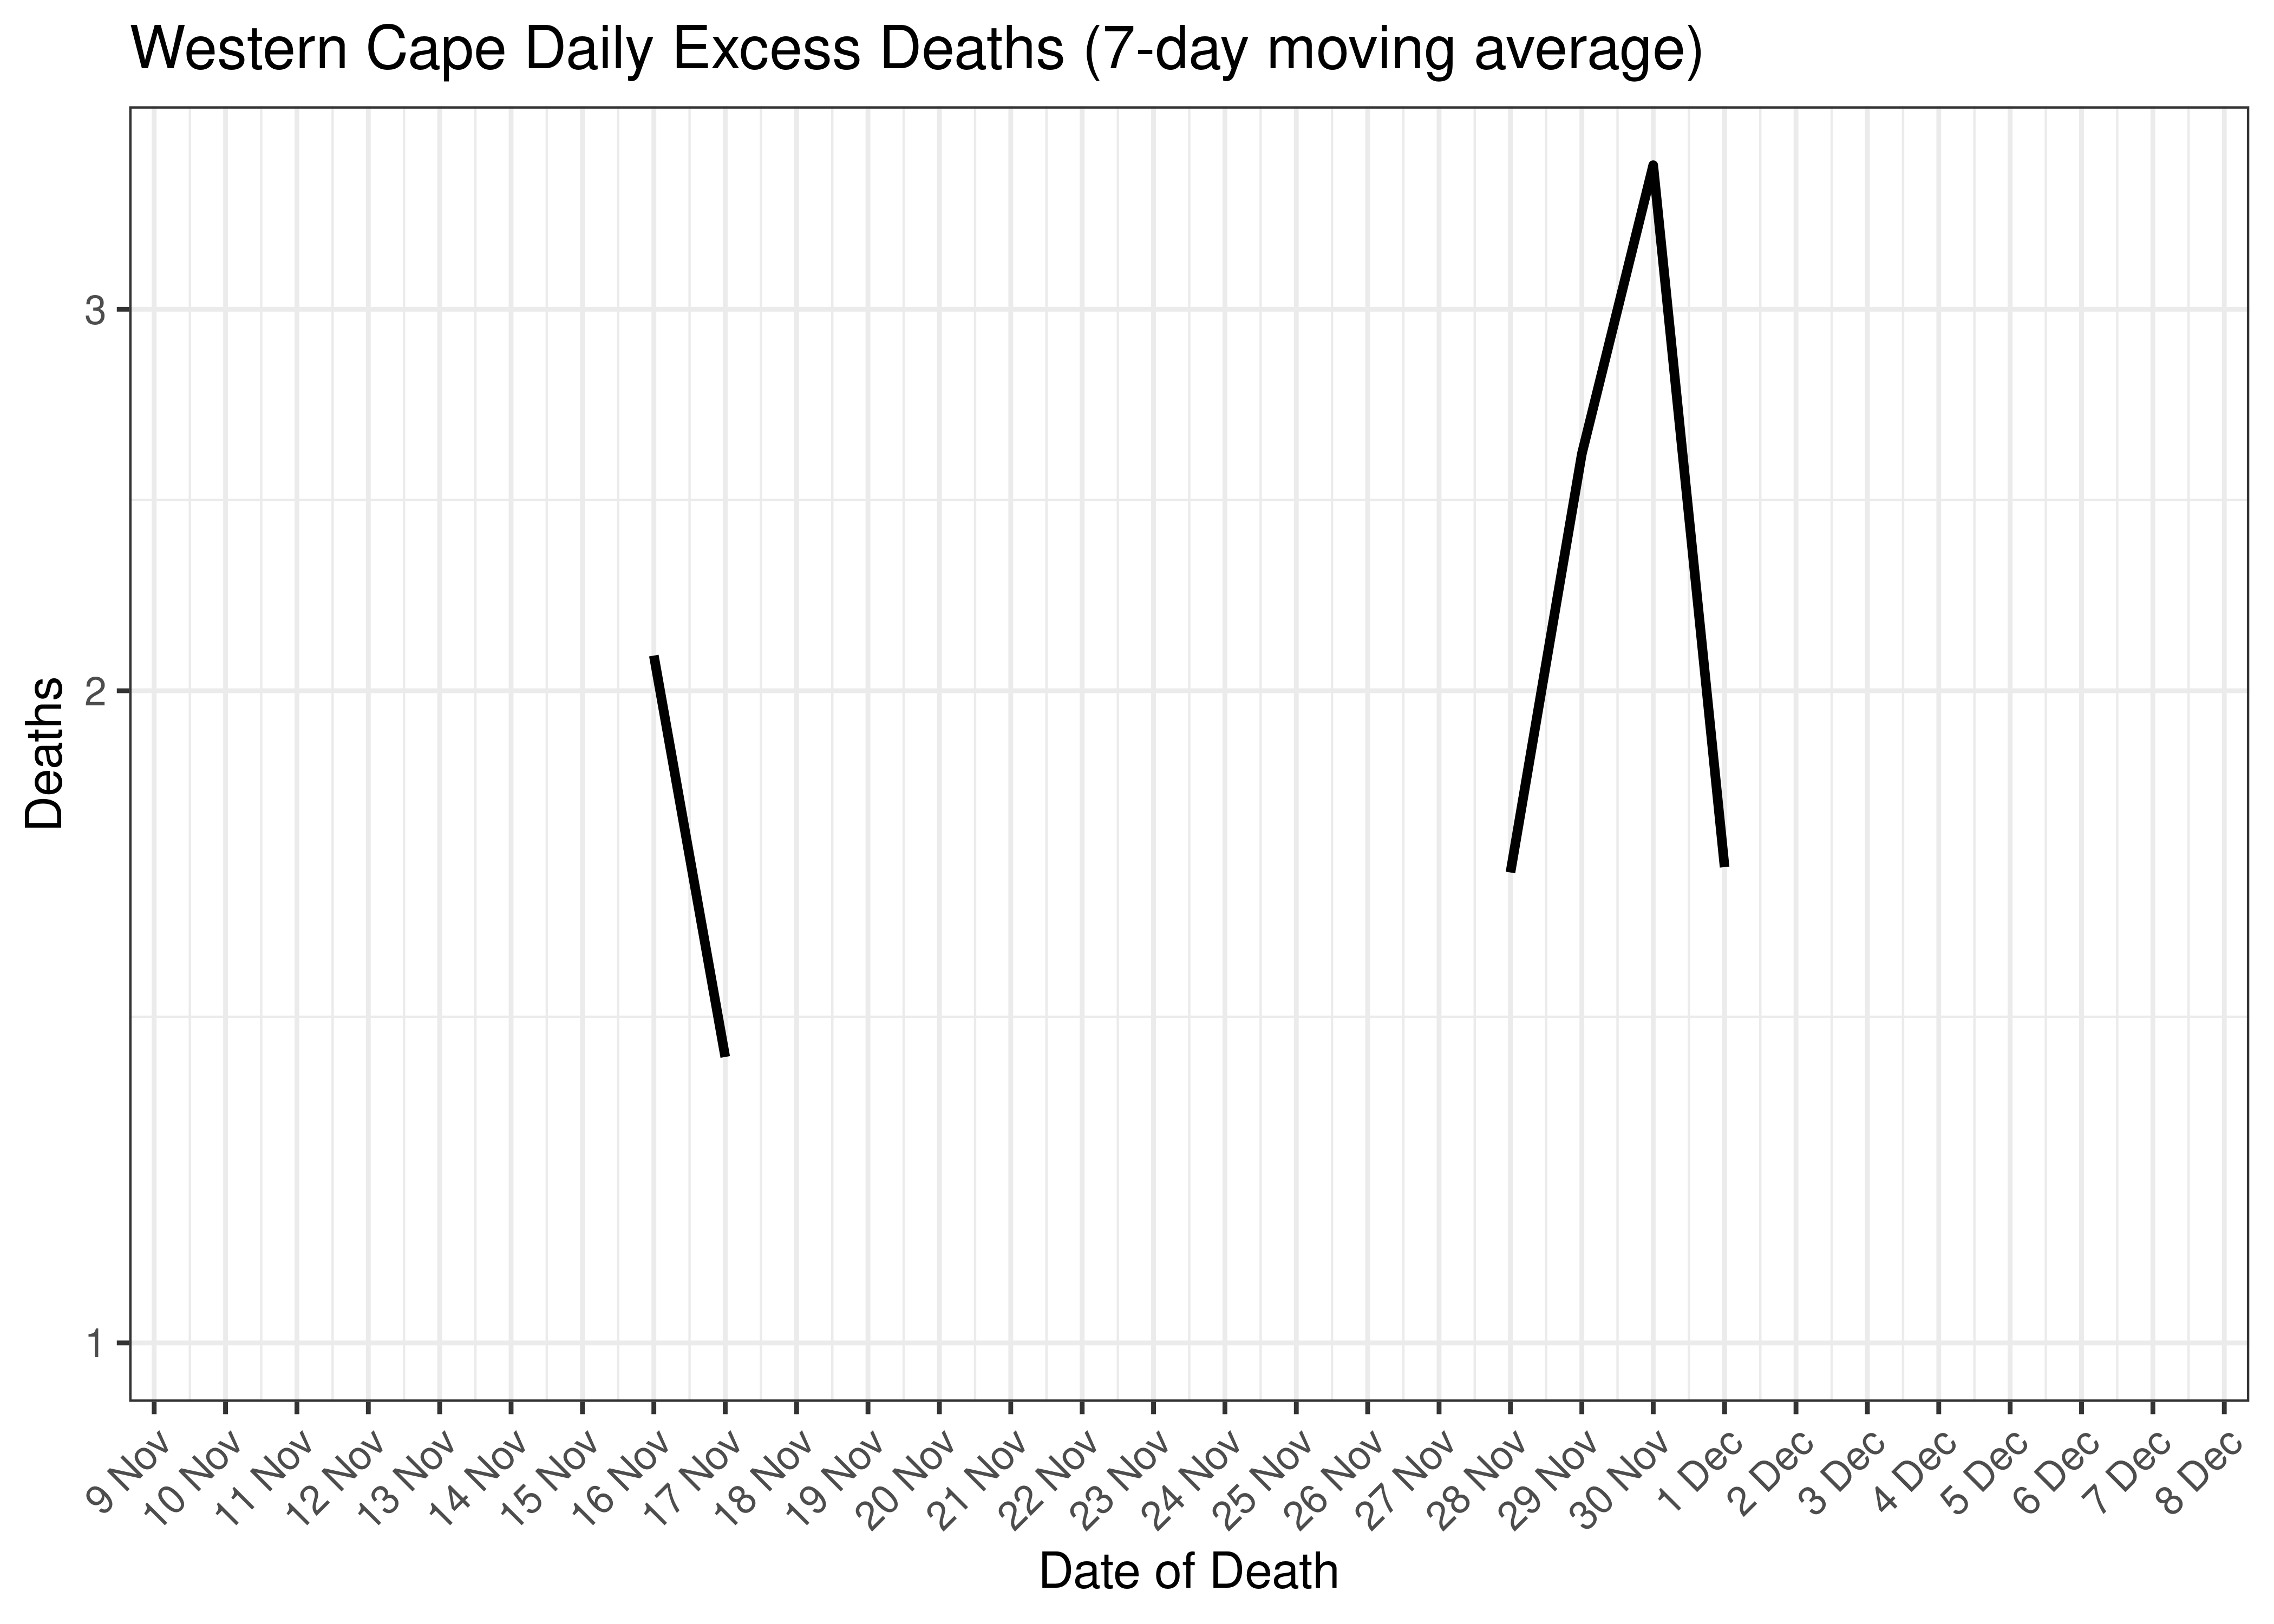
Western Cape Daily Excess Deaths for Last 30-days (7-day moving average)
6.10.5 Cases, Admissions and Deaths Combined
Below a 7-day moving average daily case, admission and excess death counts are plotted for Western Cape on a log scale since start of the epidemic. Note admissions and excess deaths are plotted by reported date, whereas cases are plotted by specimen received date.
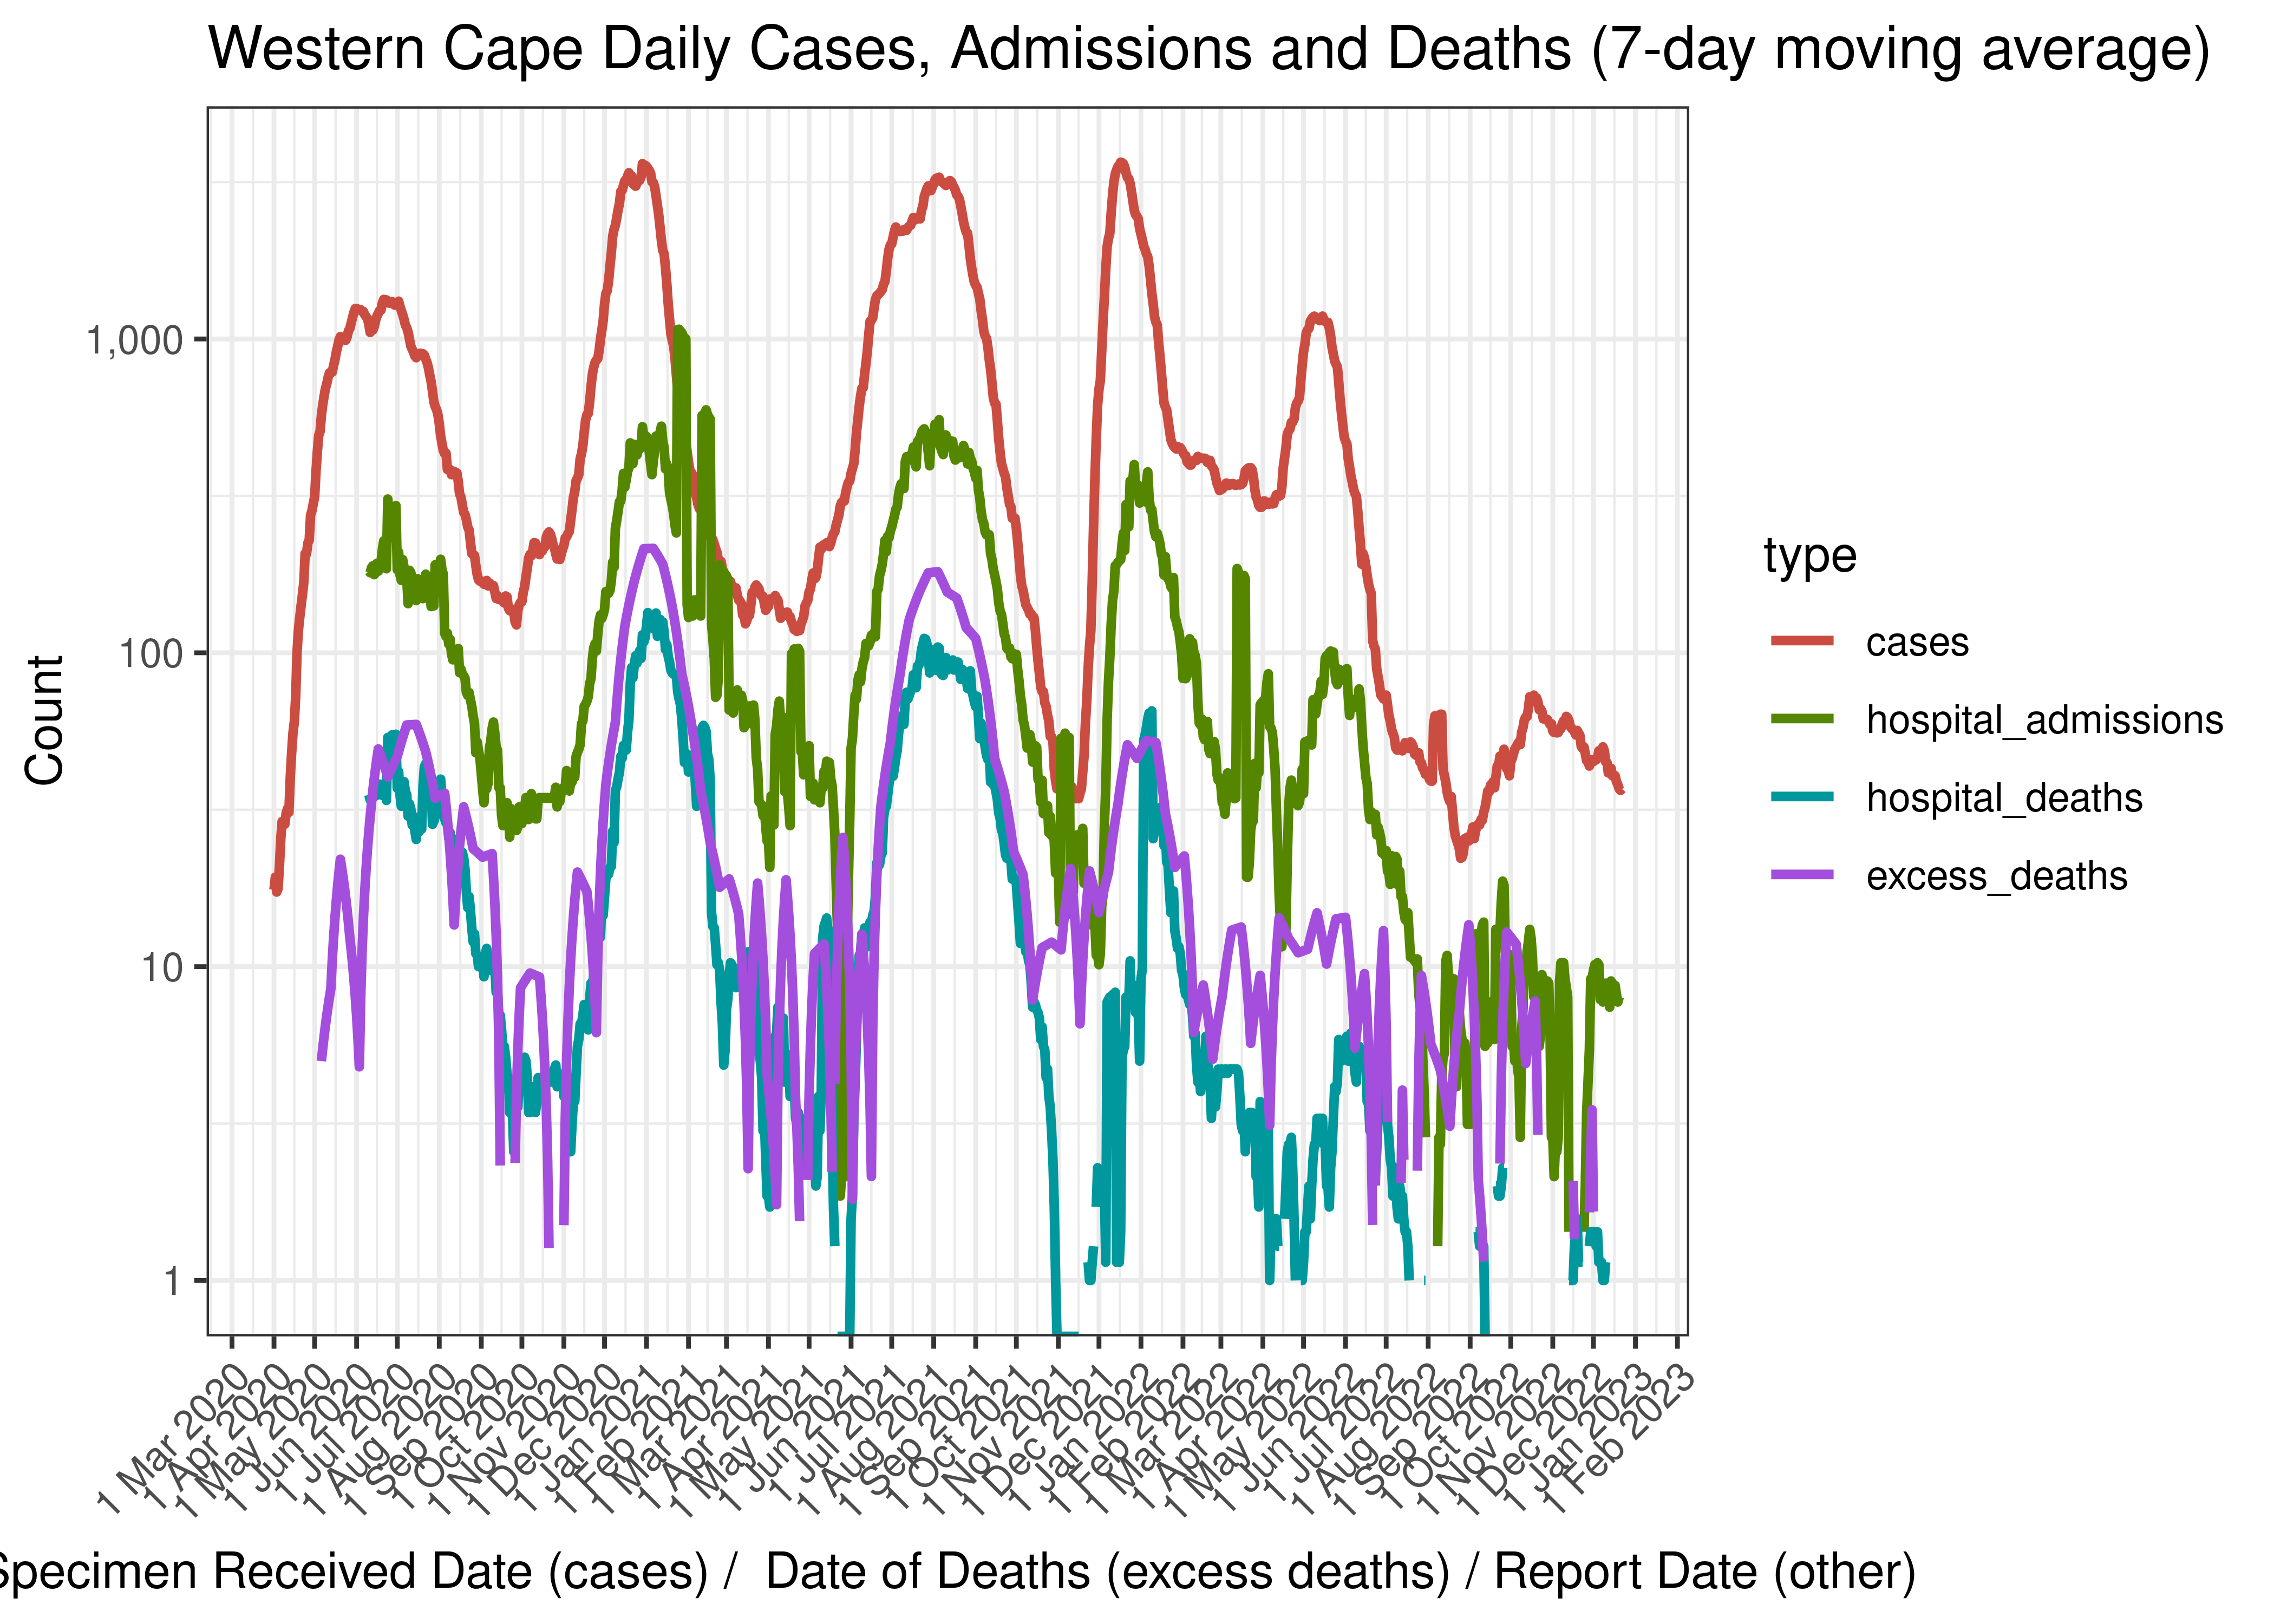
Western Cape Daily Cases, Admissions and Deaths (7-day moving average)
Below the above chart is repeated for the last 30-days:

Western Cape Daily Cases, Admissions and Deaths for Last 30-days (7-day moving average)
6.10.6 Crude Ratios per Wave
Below crude rations are calculated between the waves. It’s based on the following starting dates:
- Wave 1 started on 2020-01-01.
- Wave 2 started on 2020-10-01.
- Wave 3 started on 2021-04-01.
- Wave 4 started on 2021-11-01.
- Wave 5 started on 2022-04-01.
Below crude ratios are tabulated and plotted. These ratios are:
- Case admissions ratio calculated as admissions divided by cases.
- Case fatality ratio calculated as hospital deaths divided by cases (Note that COVID-19 deaths are under-reported by a significant factor in South Africa).
- Case excess deaths ratio calculated as excess deaths divided by cases.
- Hospital fatality ratio calculated as hospital deaths divided by admissions (Note that COVID-19 deaths are under-reported by a significant factor in South Africa).
- Death reporting ratio calculated as hospital deaths divided by excess deaths.
| Wave | Case Admission Ratio | Case Fatality Ratio | Case Excess Deaths Ratio | Hospital Fatality Ratio | Death Reporting Ratio | |
|---|---|---|---|---|---|---|
| Western Cape | Wave 1 | 13.3% | 2.66% | 3.64% | 20.0% | 73.0% |
| Western Cape | Wave 2 | 22.4% | 3.64% | 6.02% | 16.2% | 60.4% |
| Western Cape | Wave 3 | 17.5% | 3.18% | 5.12% | 18.2% | 62.2% |
| Western Cape | Wave 4 | 12.8% | 0.99% | 2.38% | 7.7% | 41.6% |
| Western Cape | Wave 5 | 11.1% | 0.73% | 2.12% | 6.6% | 34.7% |
Below the rations above are plotted graphically:
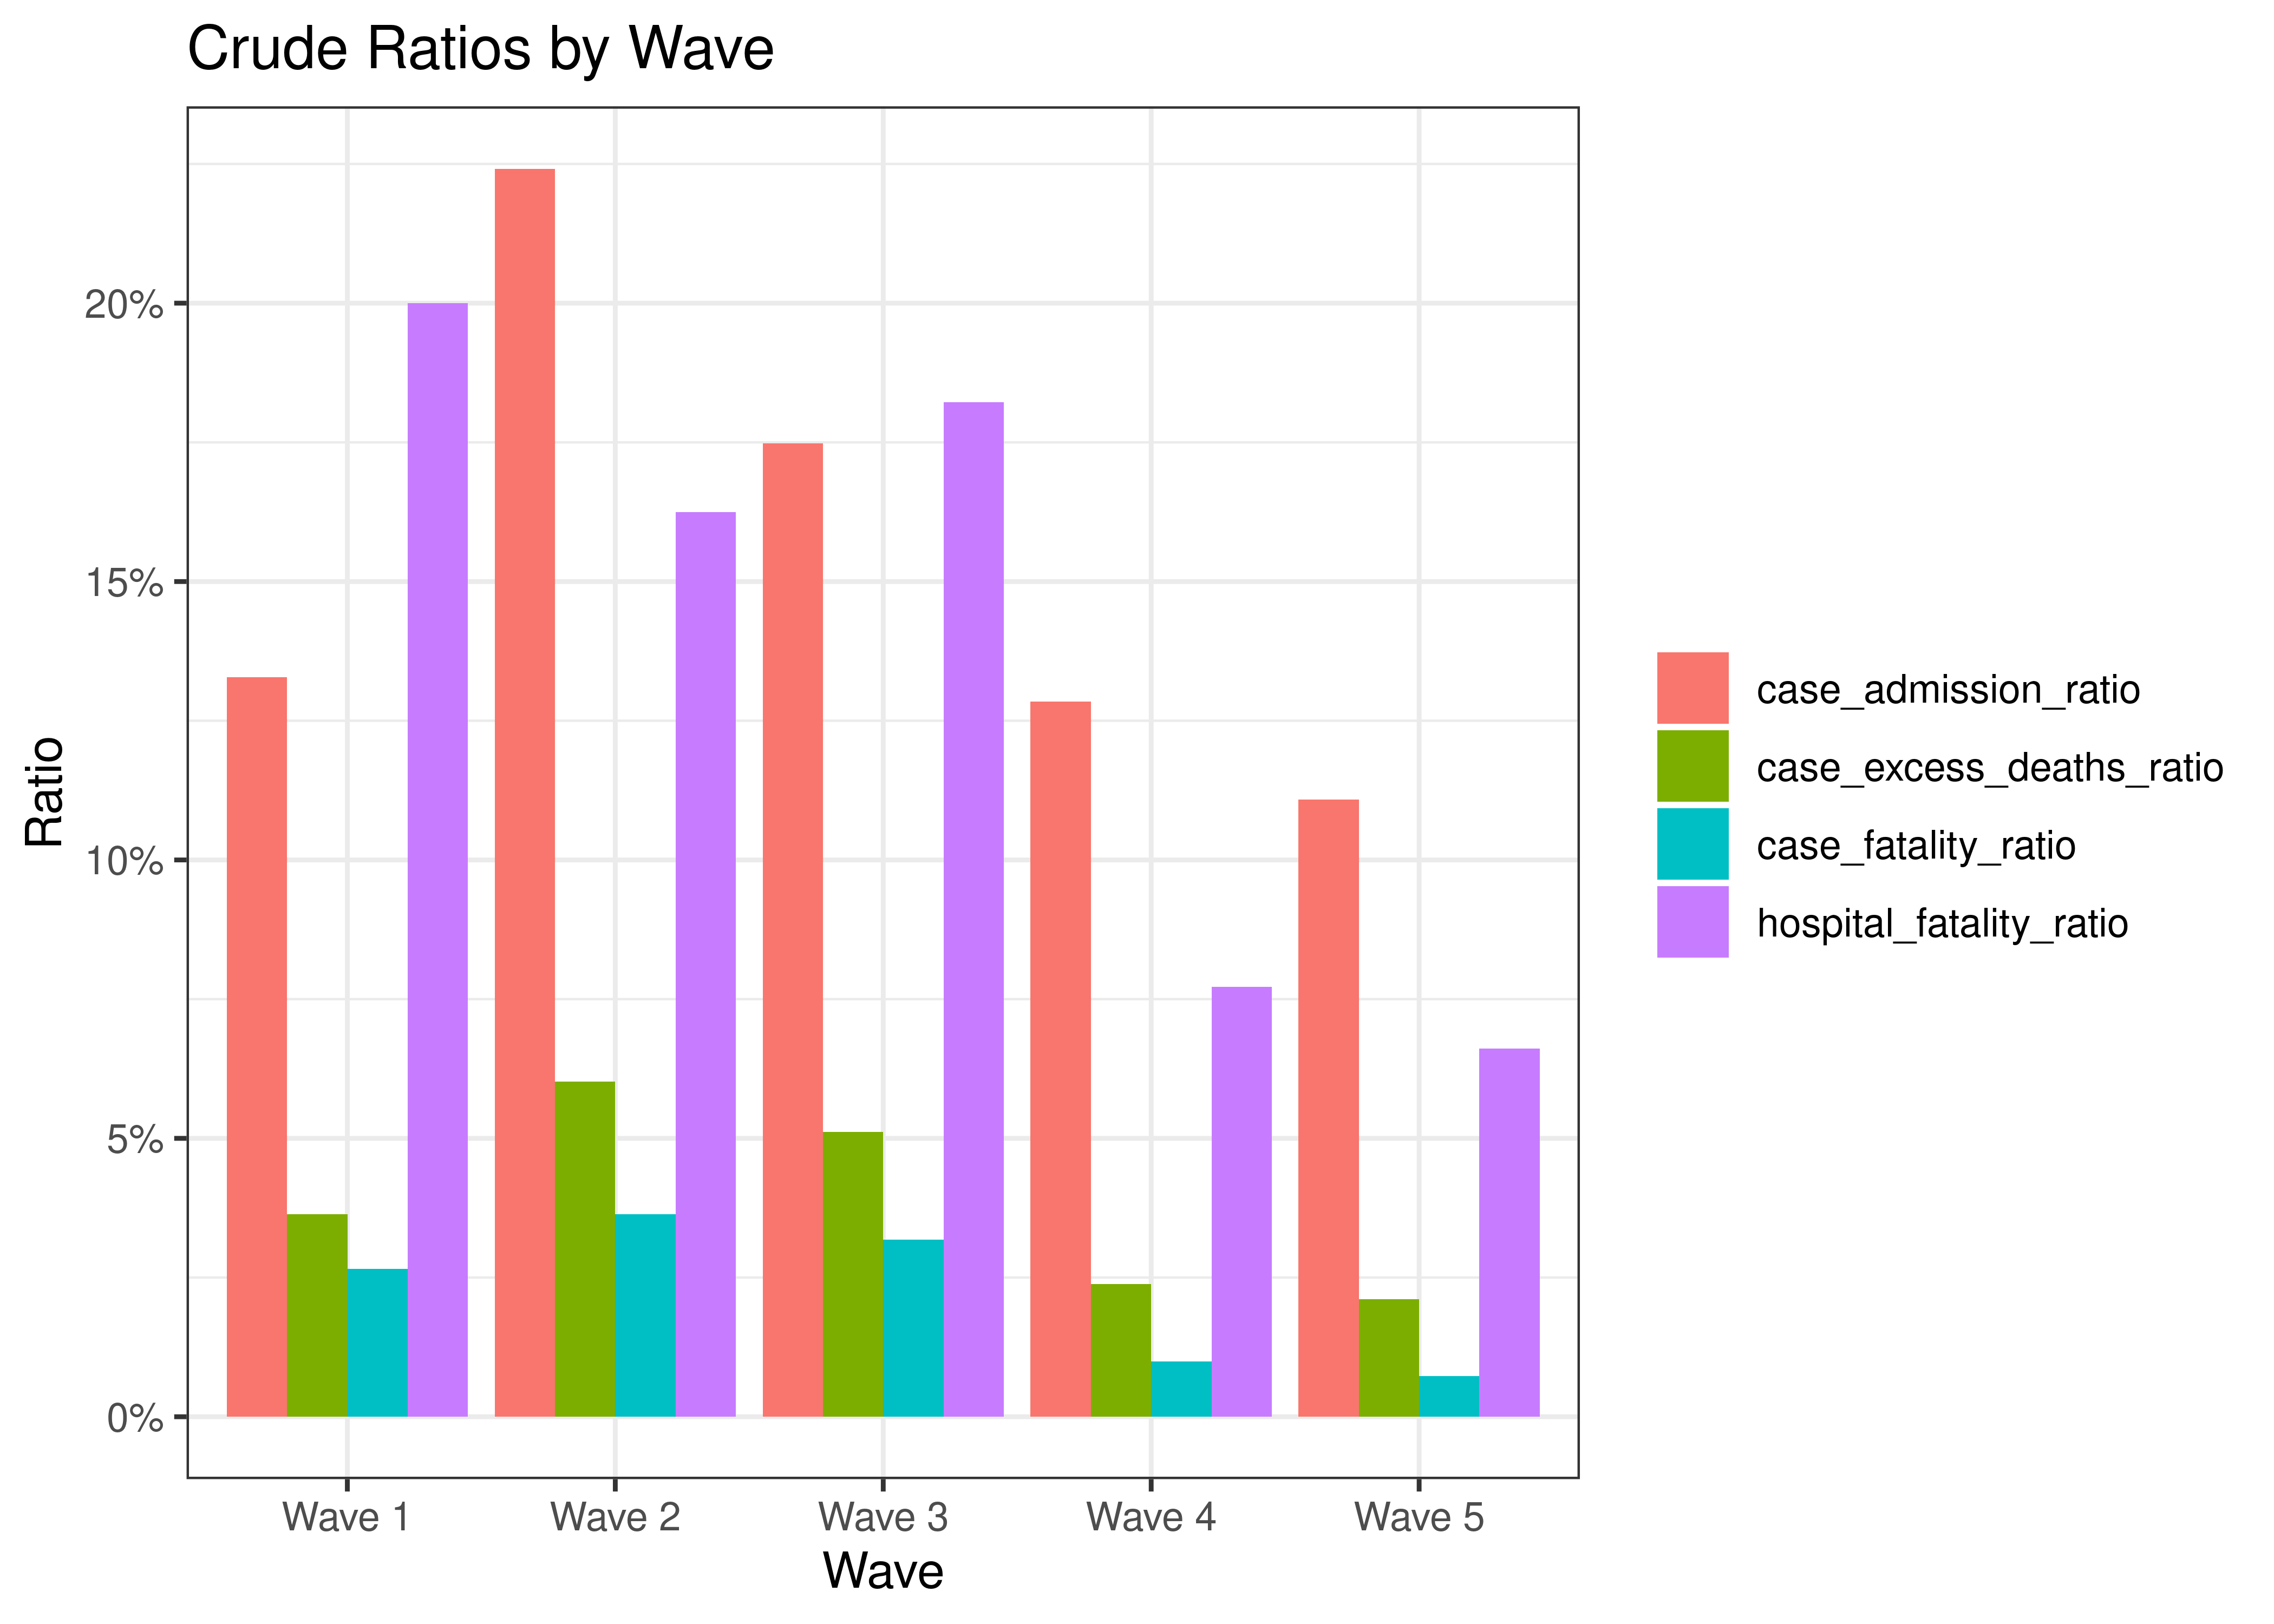
Crude Ratios by Wave
6.10.7 Reproduction Number
Below current (last weekly) effective reproduction number estimates are tabulated for Western Cape and by district municipality.
| Type | Count (Per Day) | Week Ending | Reproduction Number [95% Confidence Interval] | |
|---|---|---|---|---|
| Western Cape | cases | 36.9 | 2022-12-25 | 0.93 [0.82 - 1.04] |
| Western Cape | hospital_admissions | 8.0 | 2022-12-23 | 0.96 [0.73 - 1.22] |
| District Municipality | Type | Count (Per Day) | Week Ending | Reproduction Number [95% Confidence Interval] |
|---|---|---|---|---|
| Cape Winelands | cases | 2.9 | 2022-12-25 | 0.88 [0.55 - 1.29] |
| Central Karoo | cases | 0.3 | 2022-12-25 | 4.11 [0.72 - 11.69] |
| City Of Cape Town Metro | cases | 24.4 | 2022-12-25 | 0.87 [0.74 - 1.01] |
| Garden Route | cases | 4.6 | 2022-12-25 | 1.18 [0.81 - 1.63] |
| Overberg | cases | 2.7 | 2022-12-25 | 1.24 [0.75 - 1.86] |
| West Coast | cases | 2.0 | 2022-12-25 | 1.07 [0.60 - 1.68] |
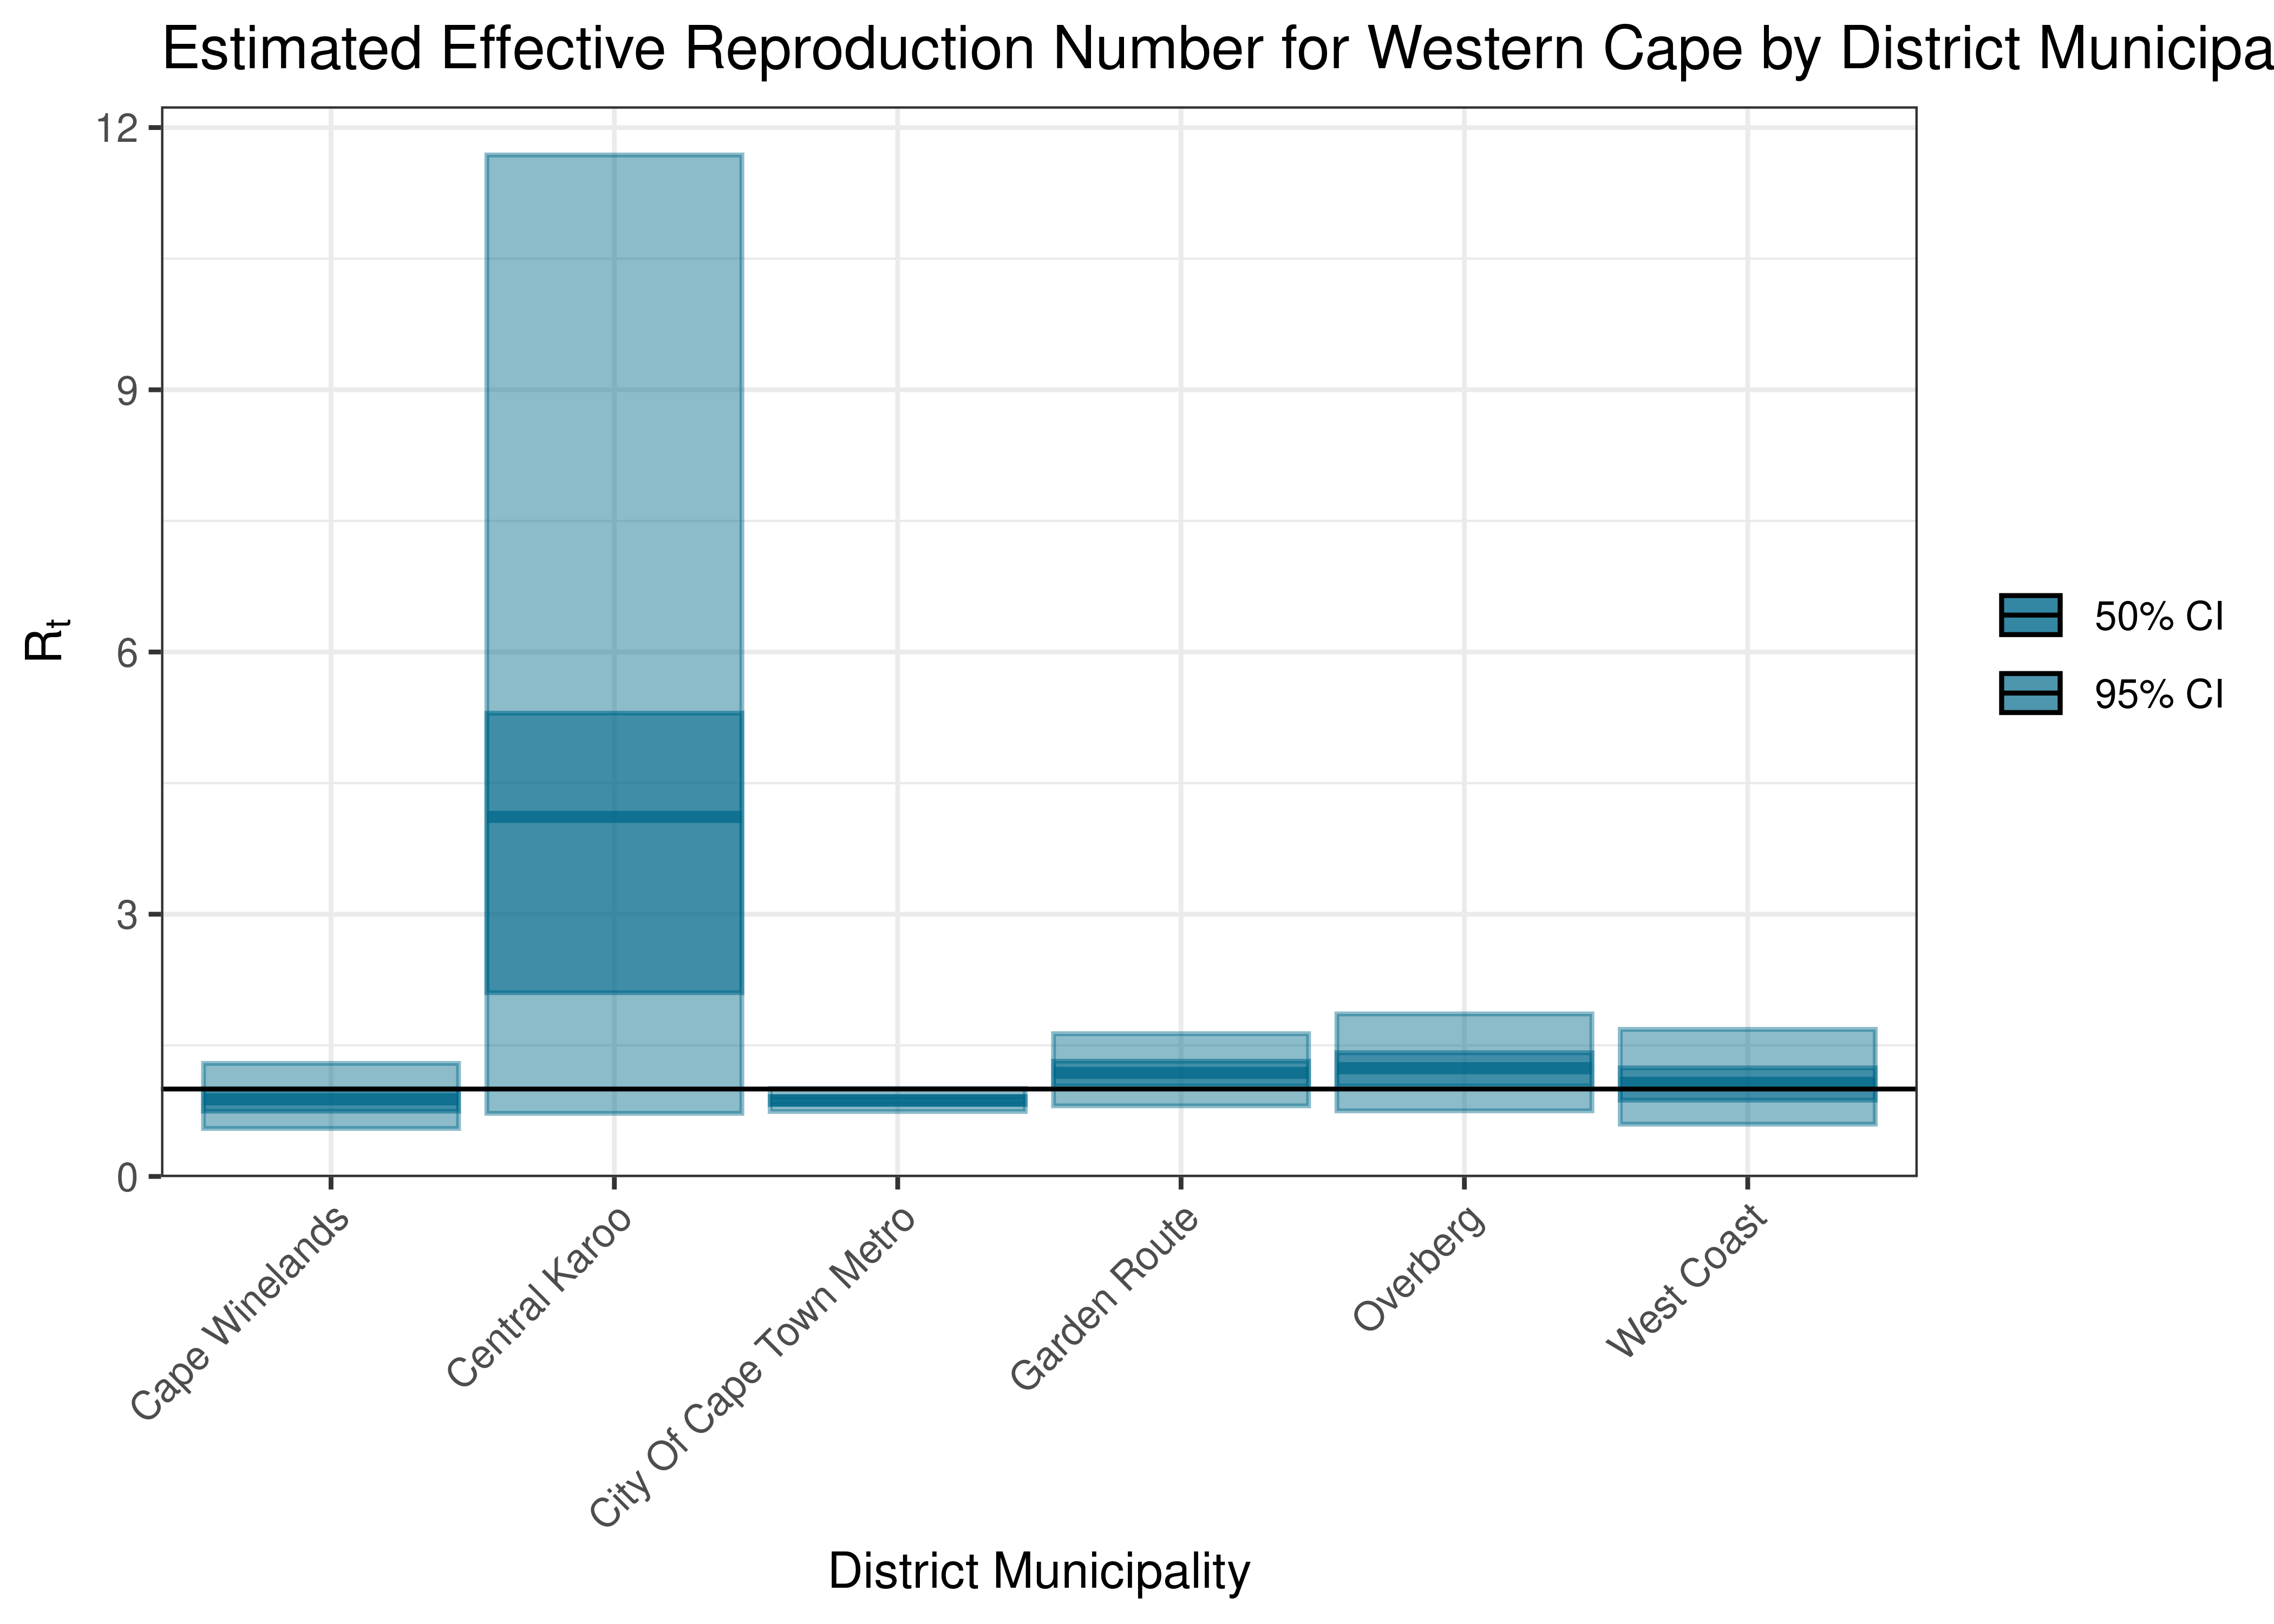
Estimated Effective Reproduction Number for Western Cape by District Municipality
Below the effective reproduction number for Western Cape over the last 90 days are plotted together with a plot since start of the pandemic.
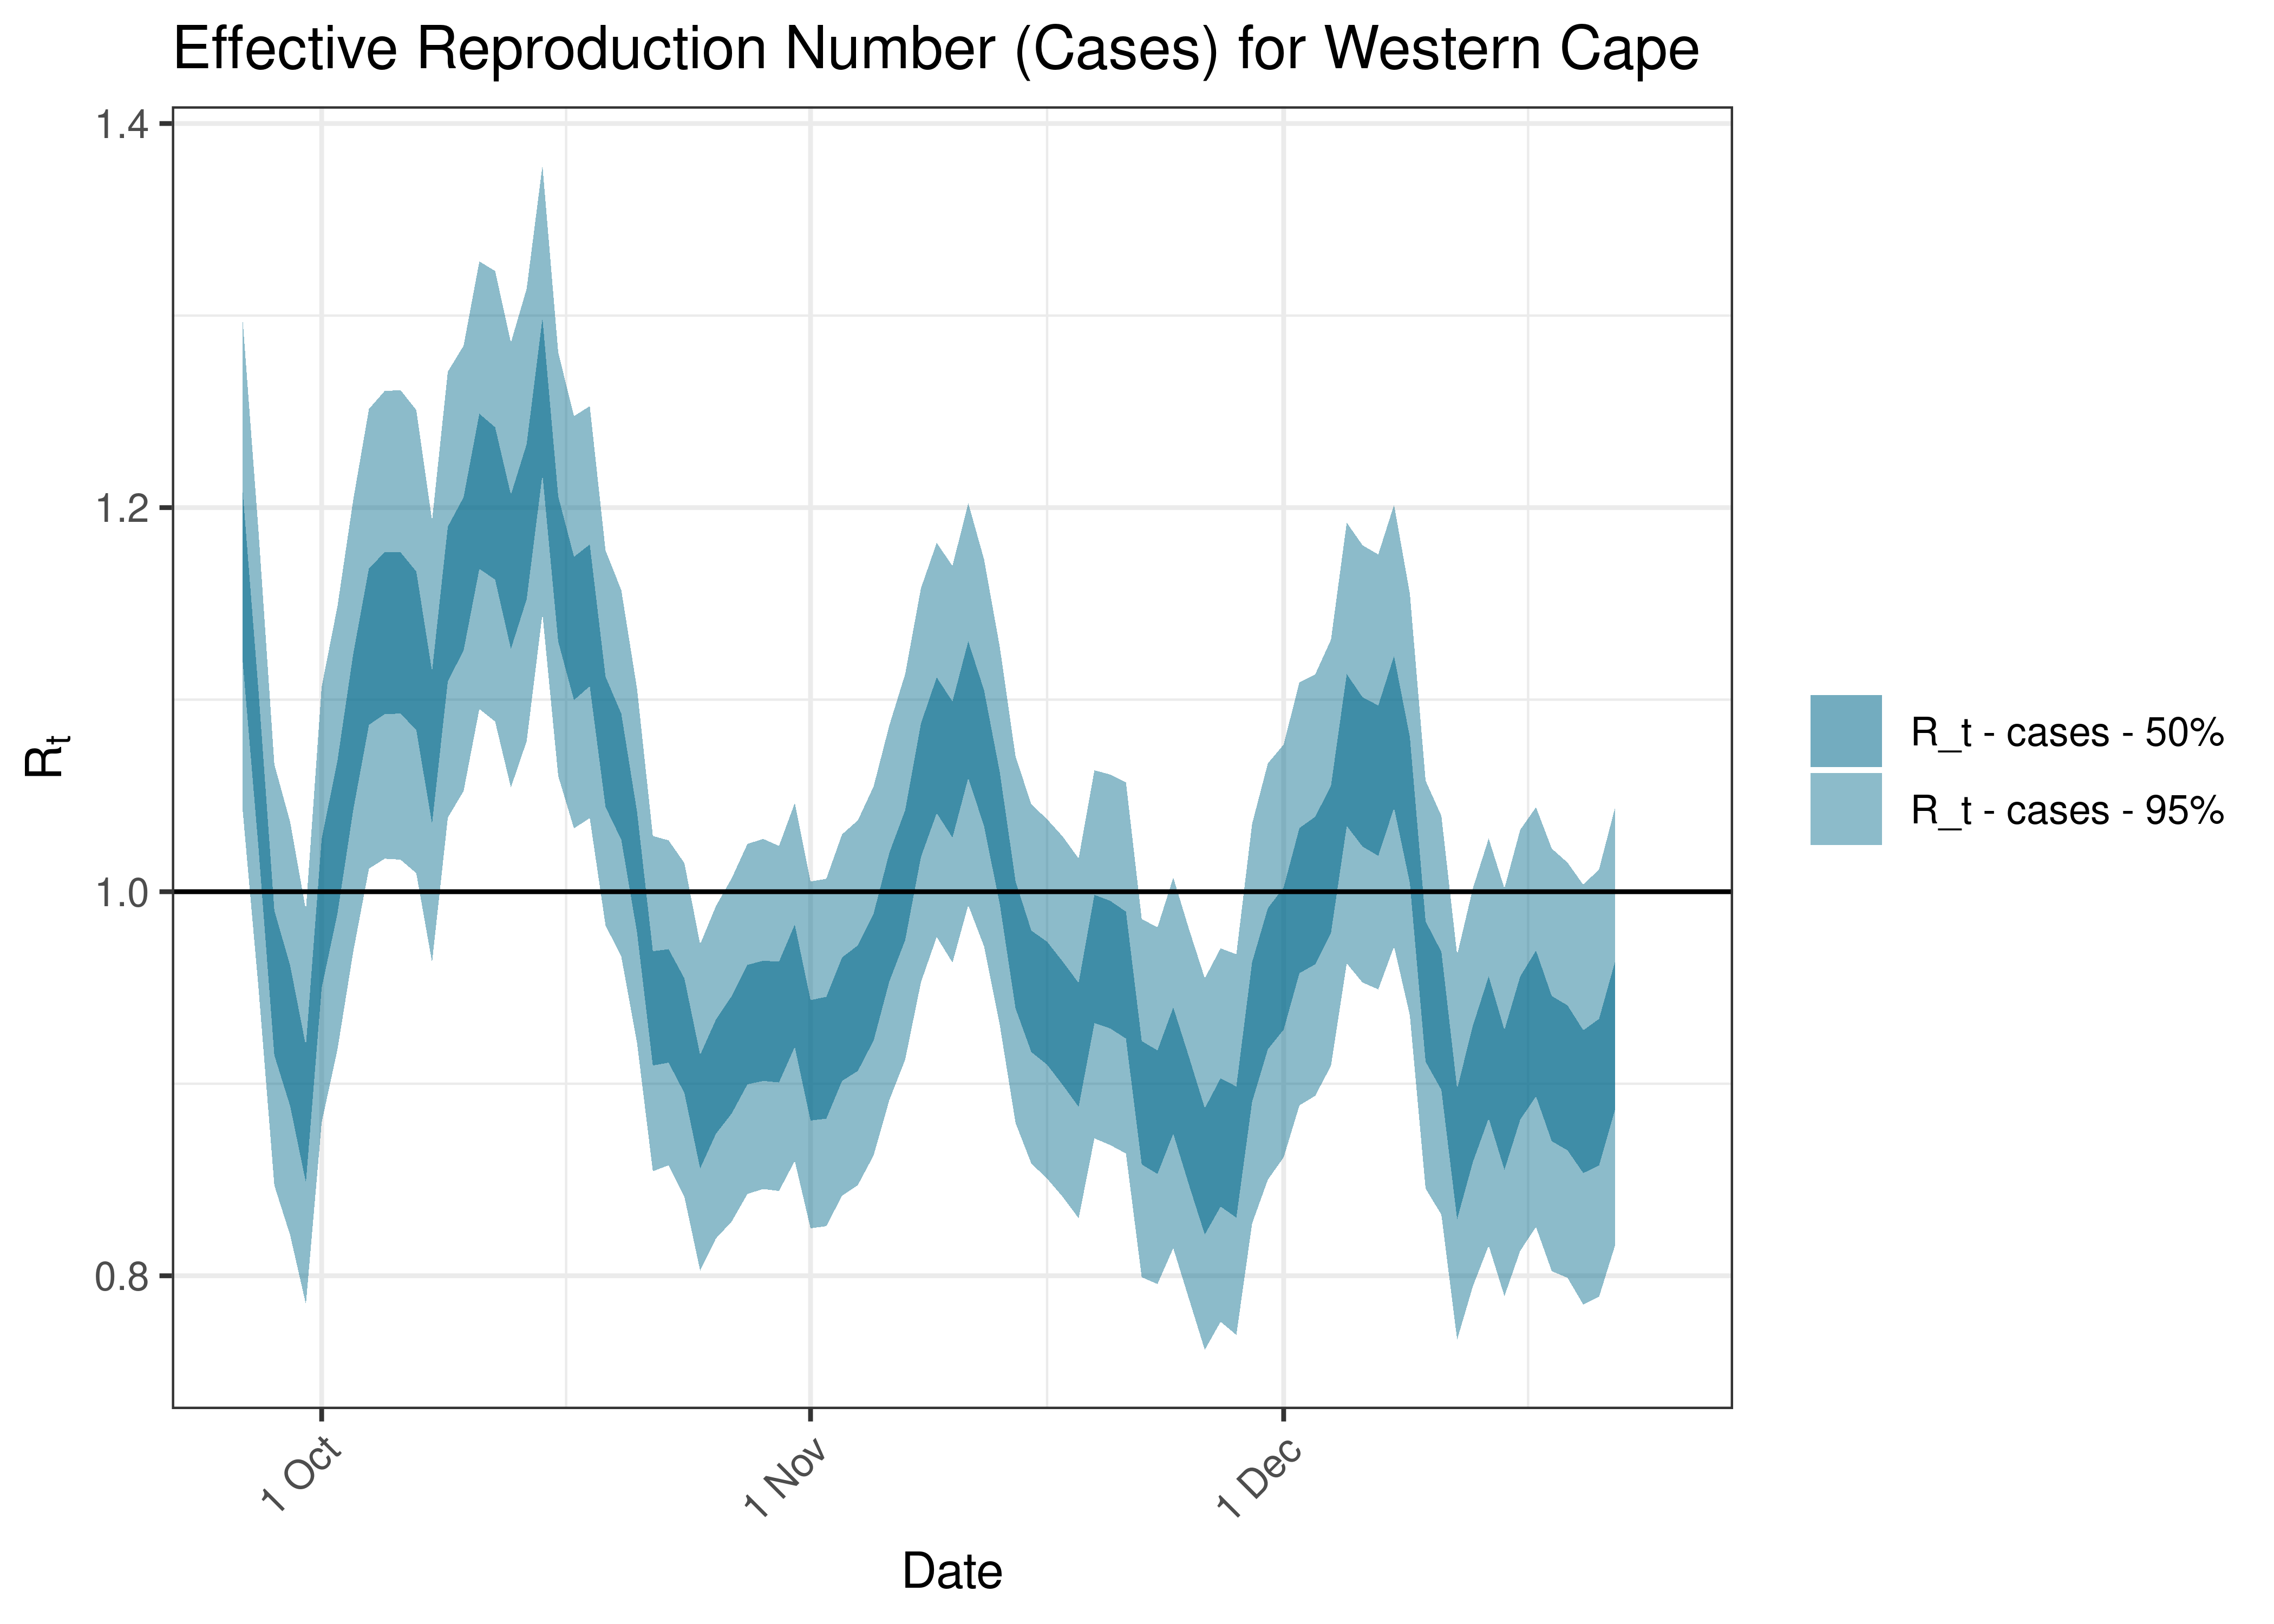
Estimated Effective Reproduction Number Based on Cases for Western Cape over last 90 days
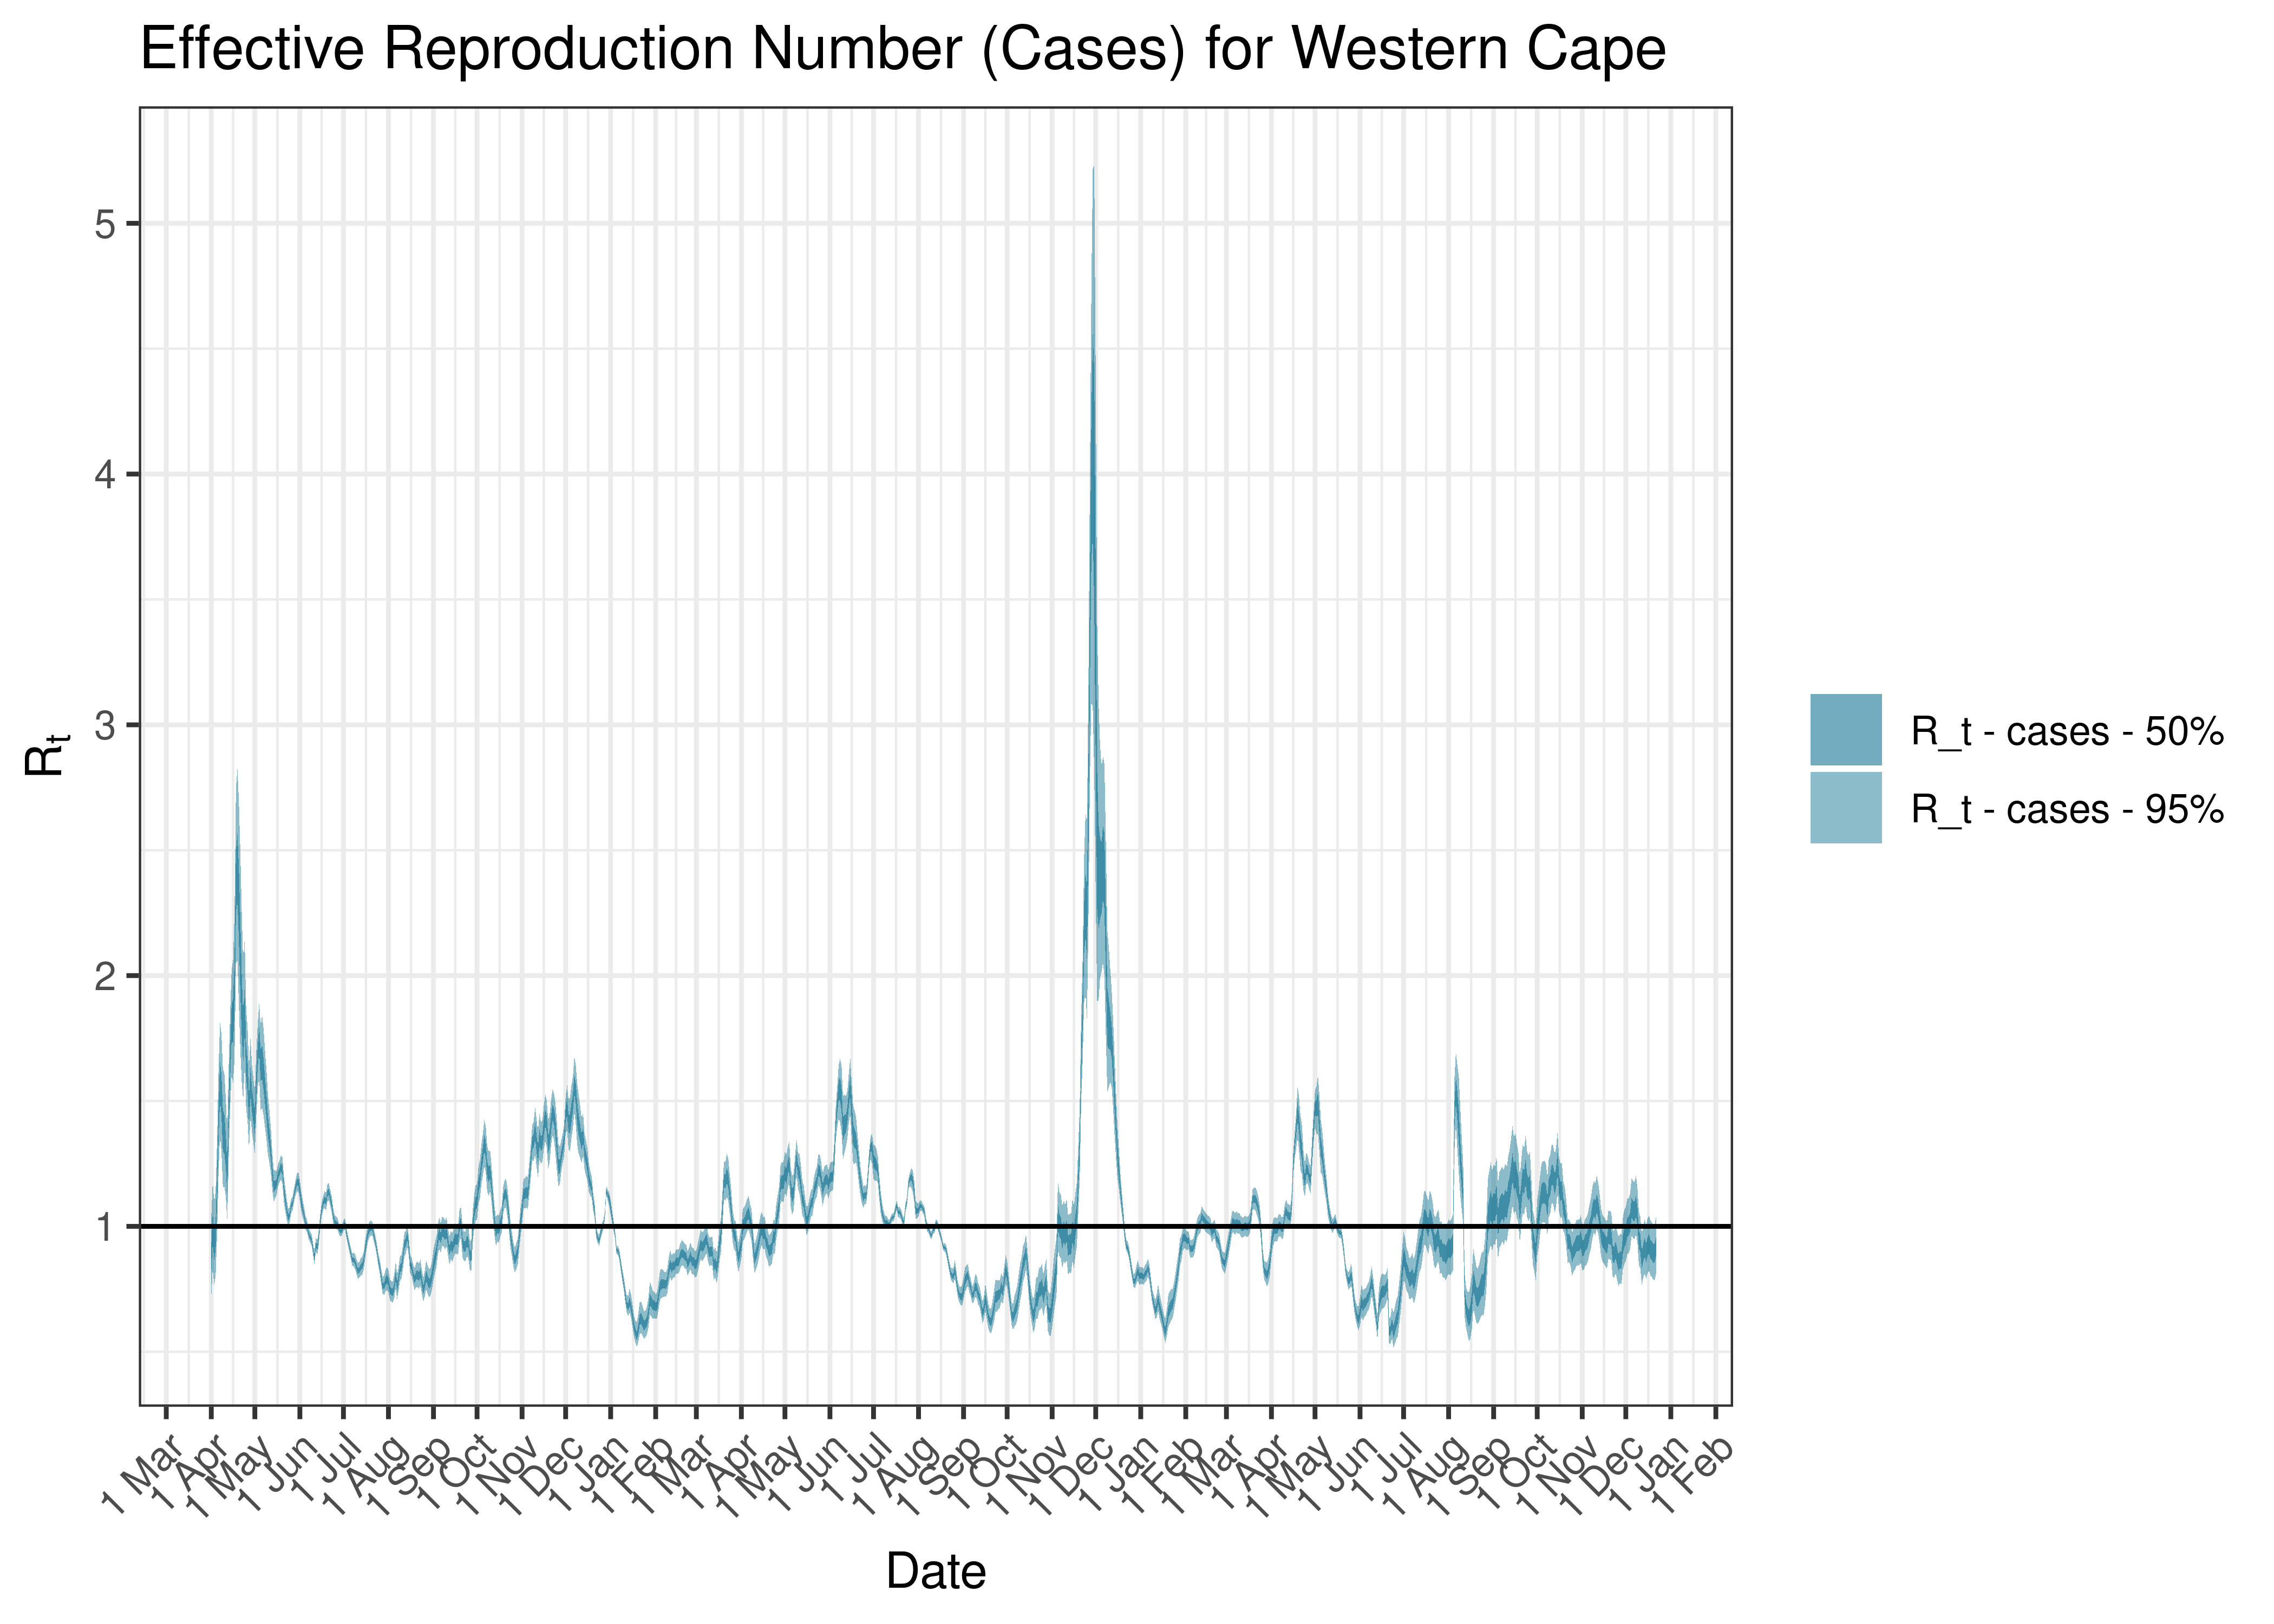
Estimated Effective Reproduction Number Based on Cases for Western Cape since 1 April 2020
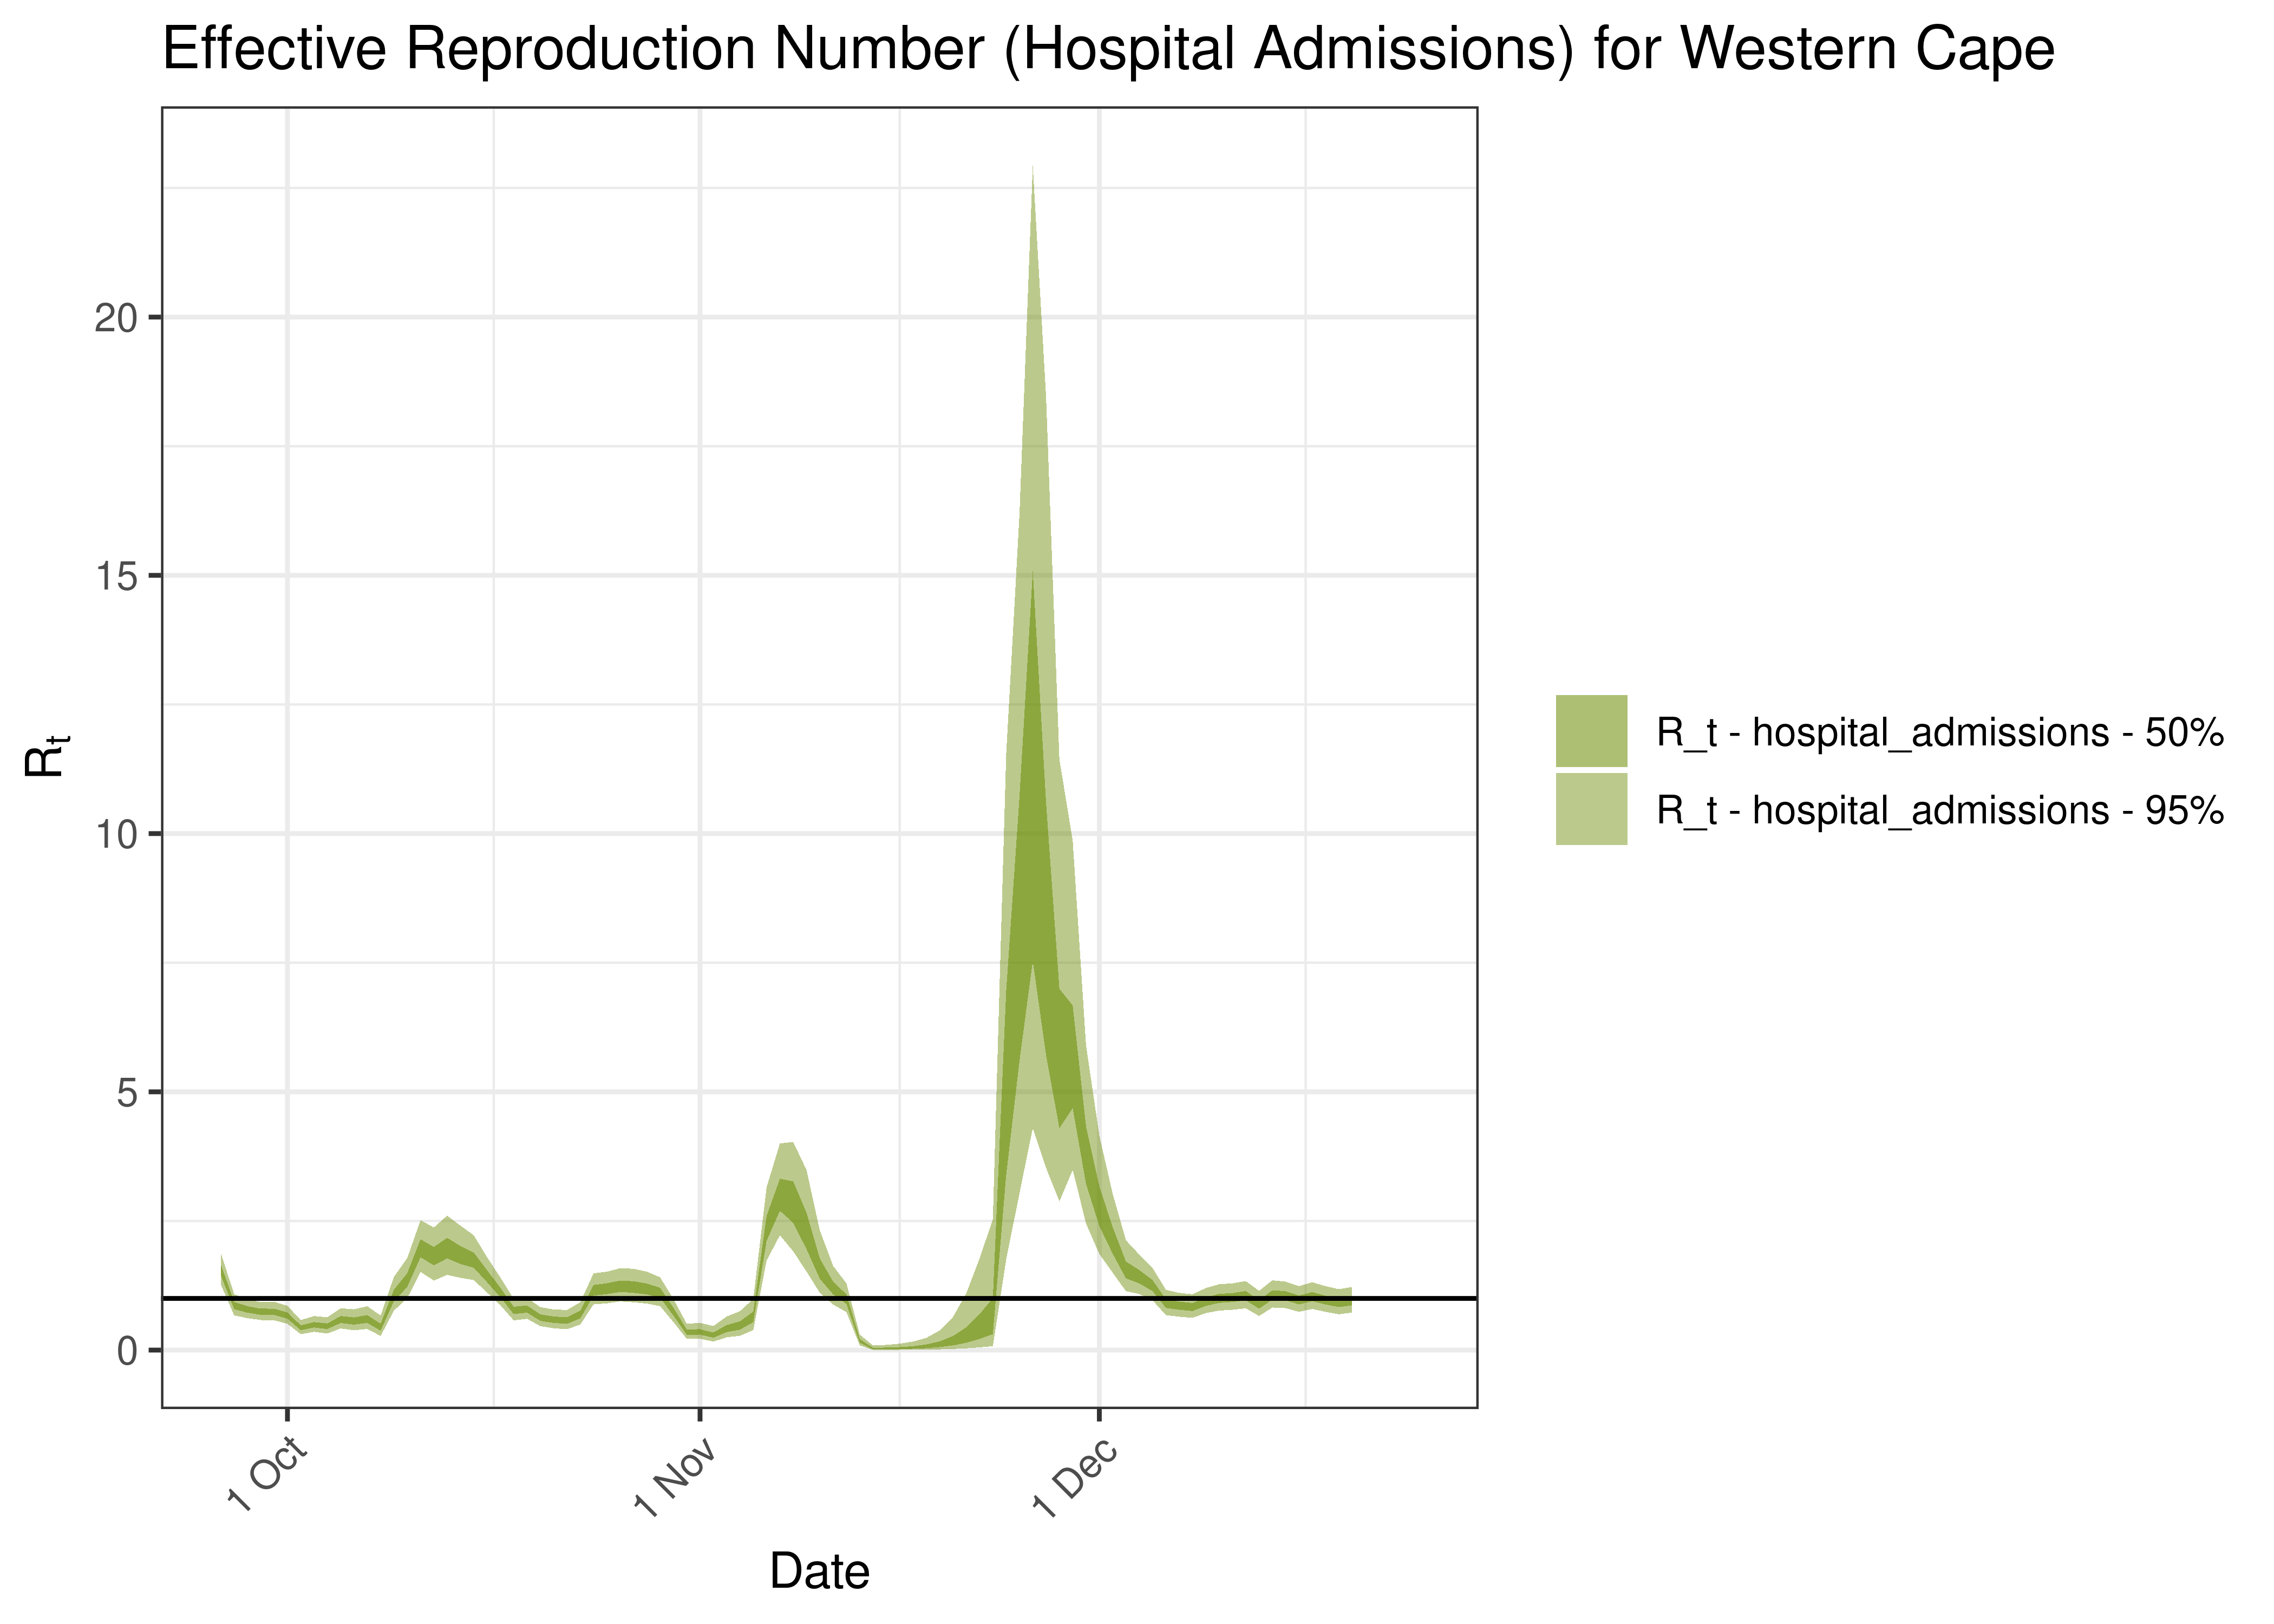
Estimated Effective Reproduction Number Based on Hospital Admissions for Western Cape over last 90 days
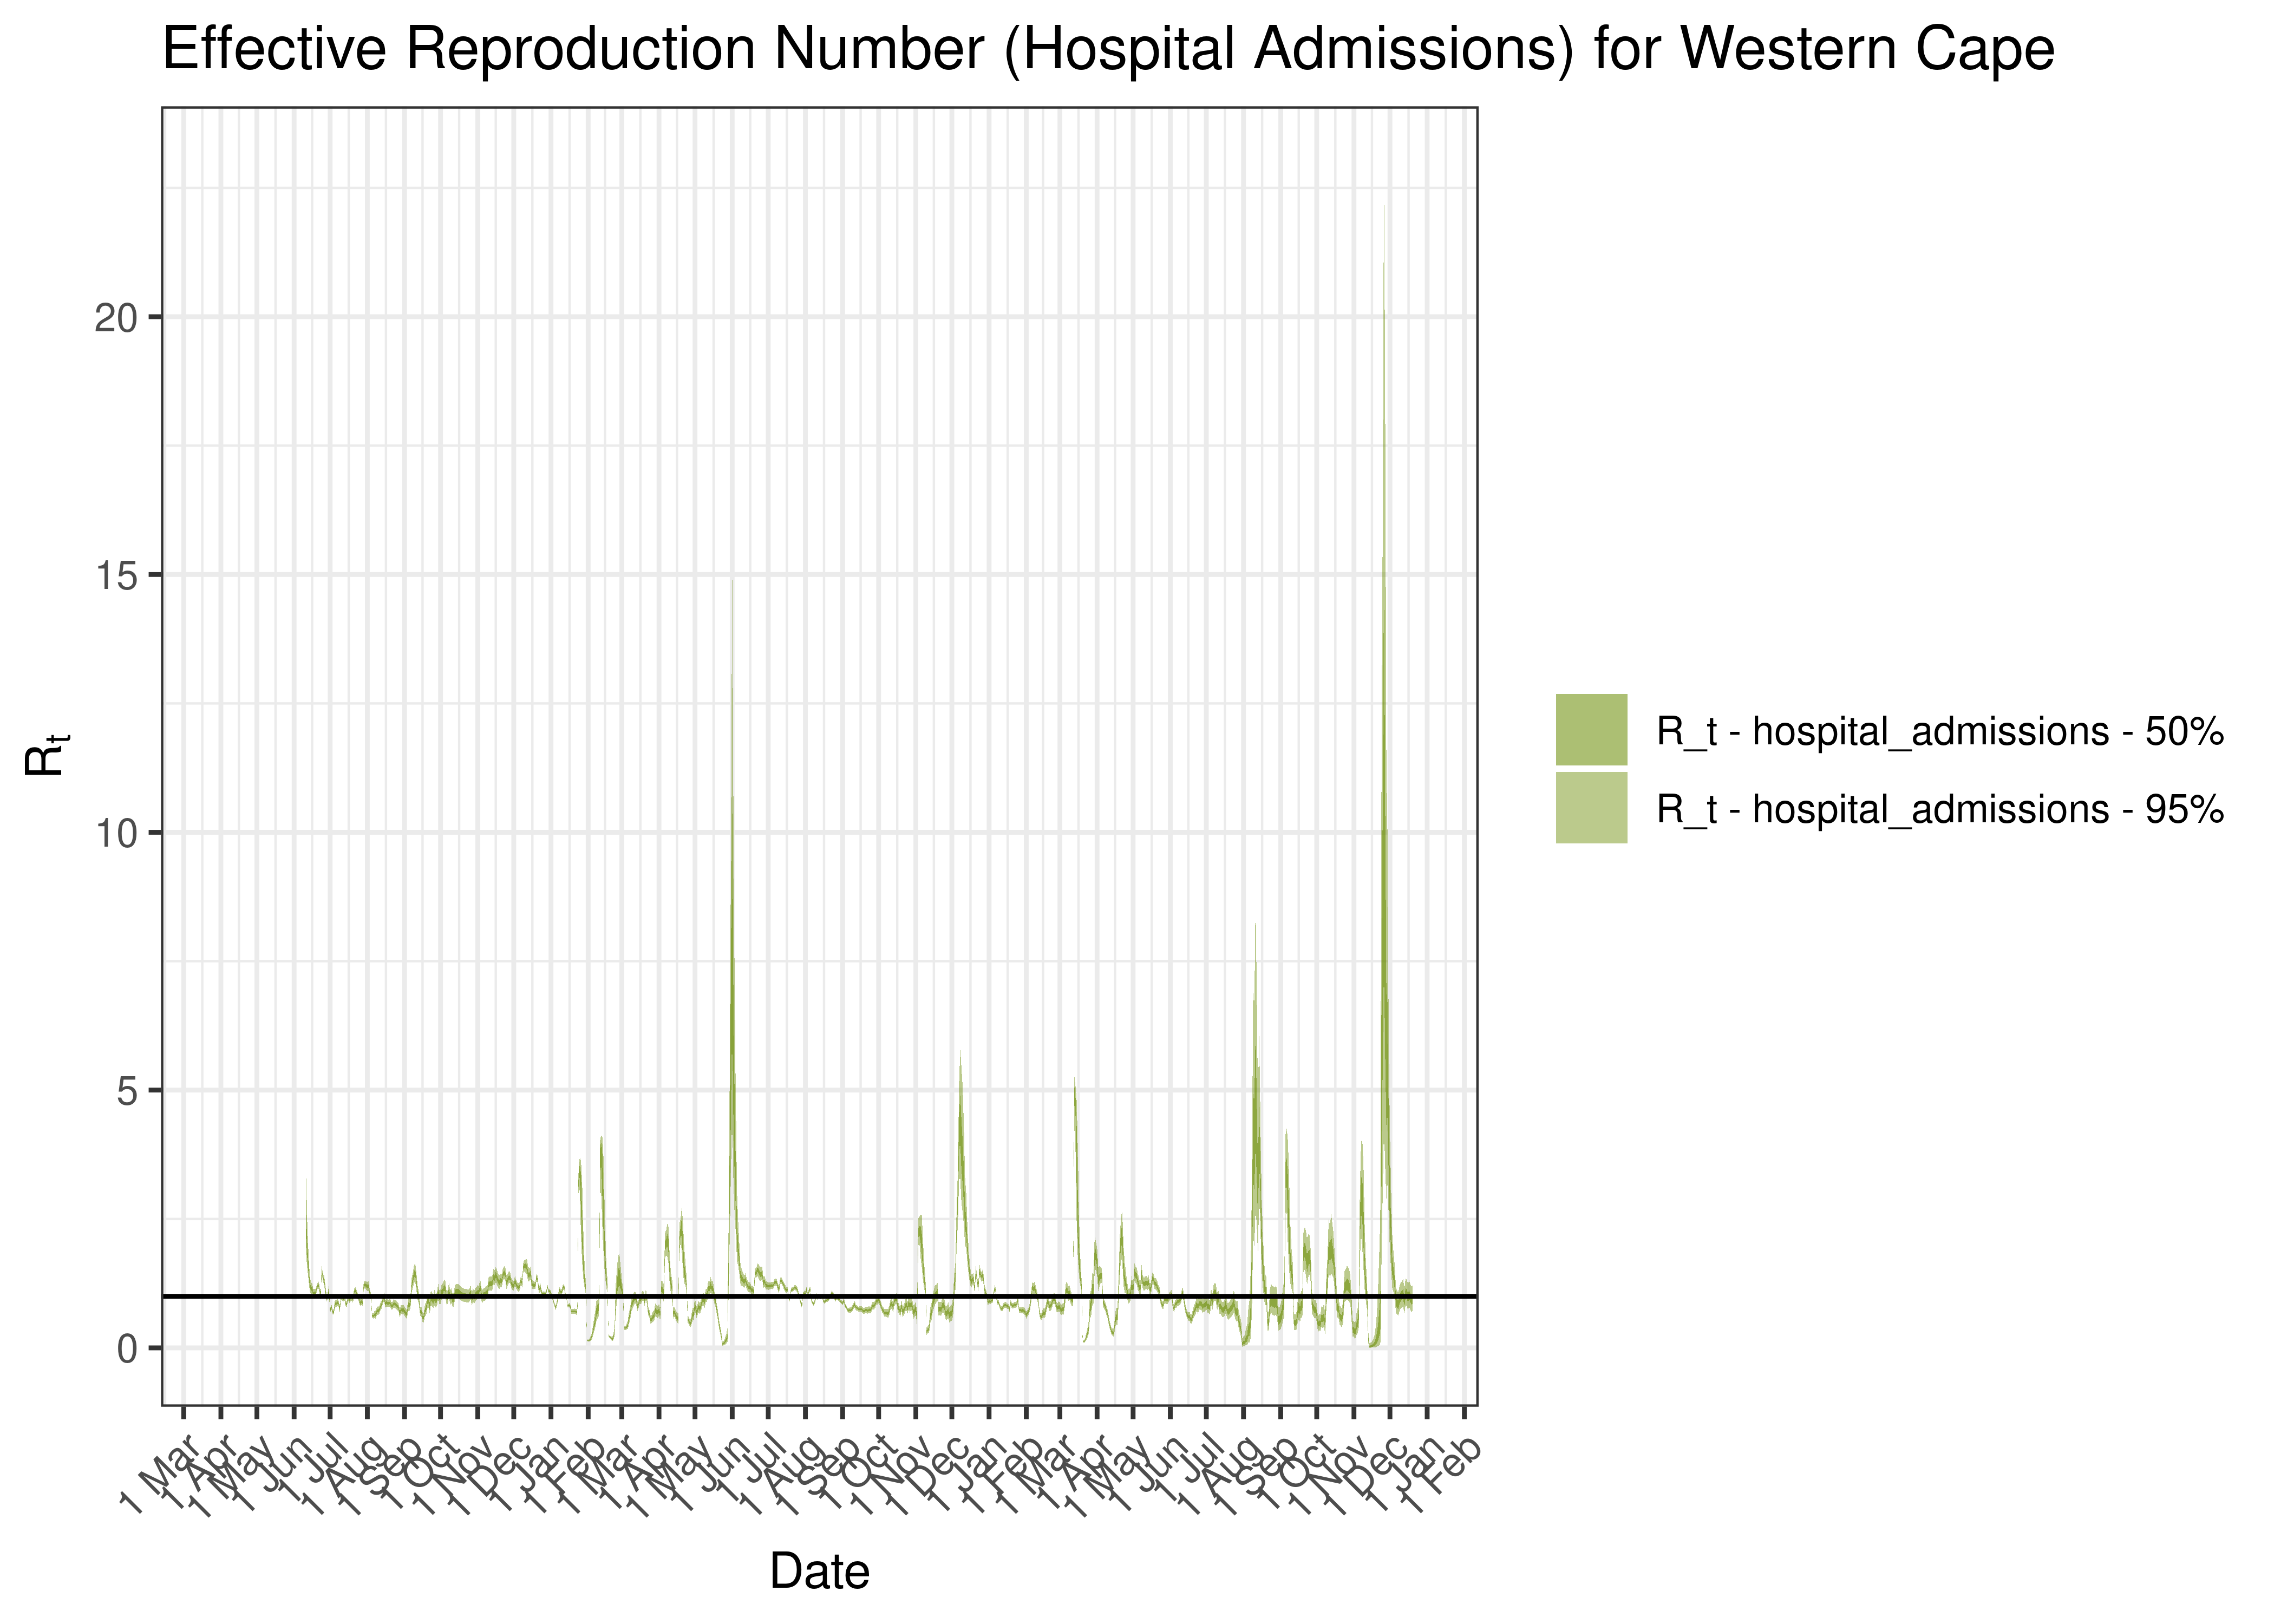
Estimated Effective Reproduction Number Based on Hospital Admissions for Western Cape since 1 April 2020
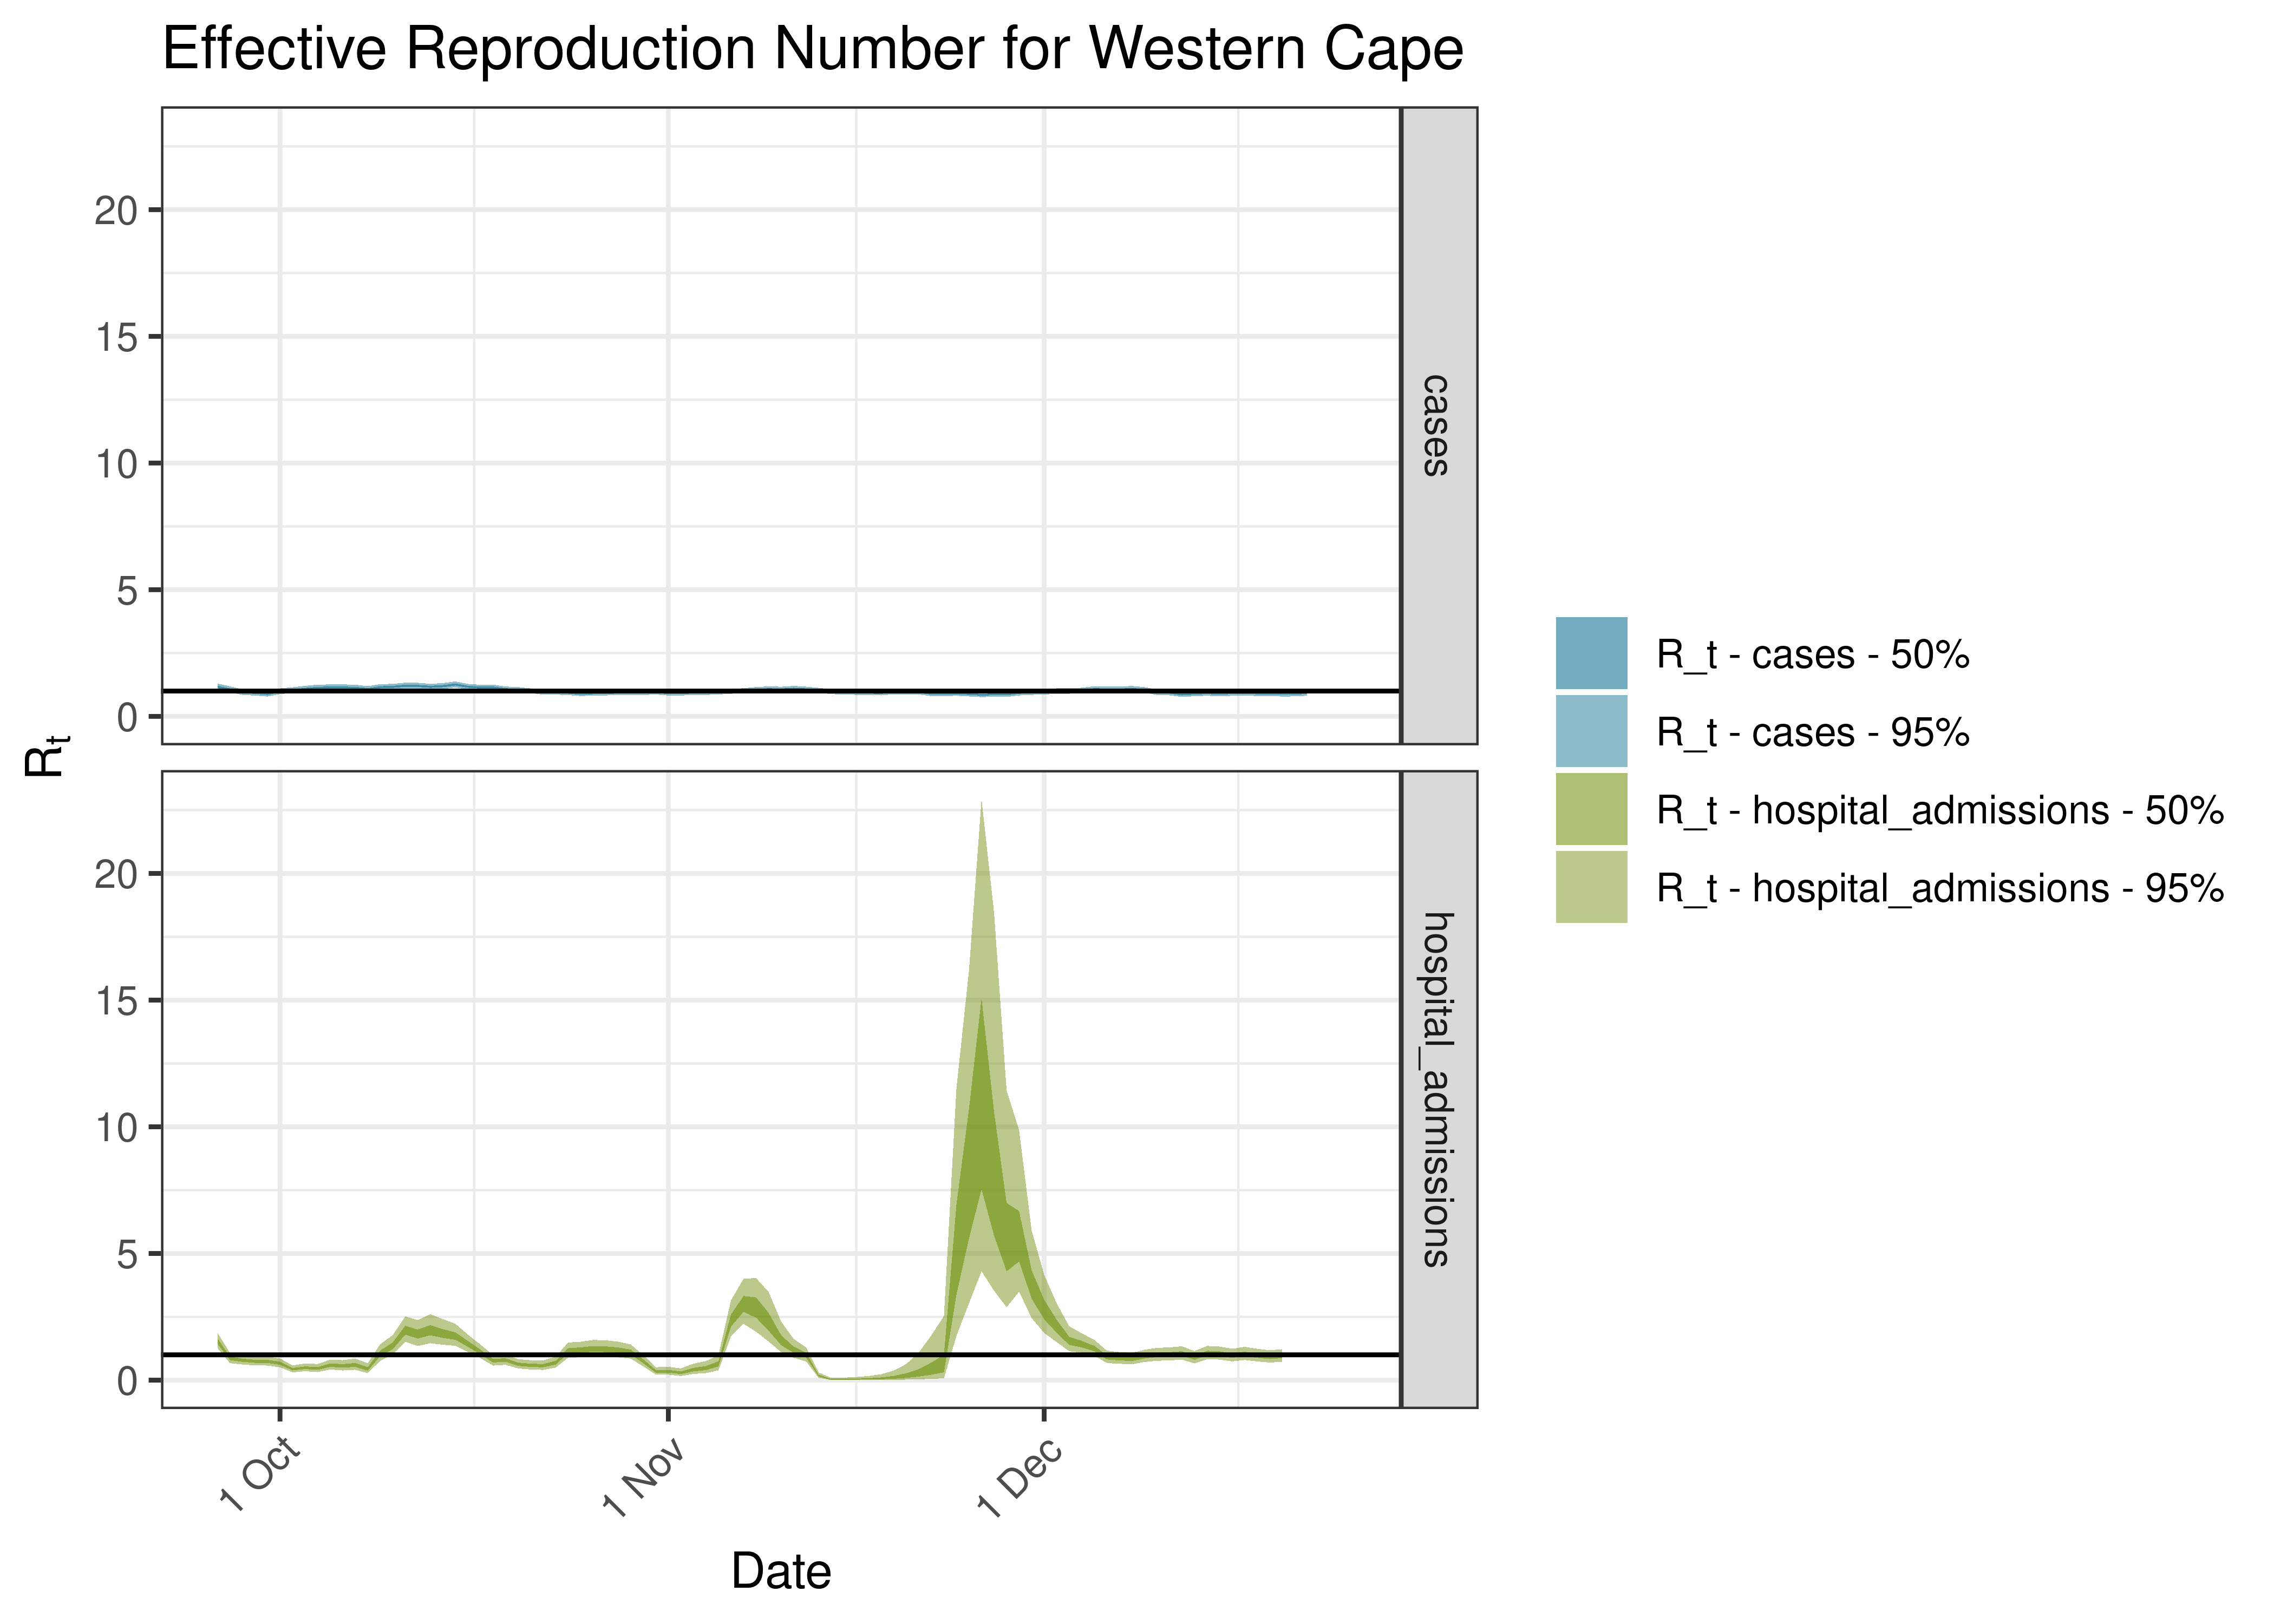
Estimated Effective Reproduction Number for Western Cape over last 90 days
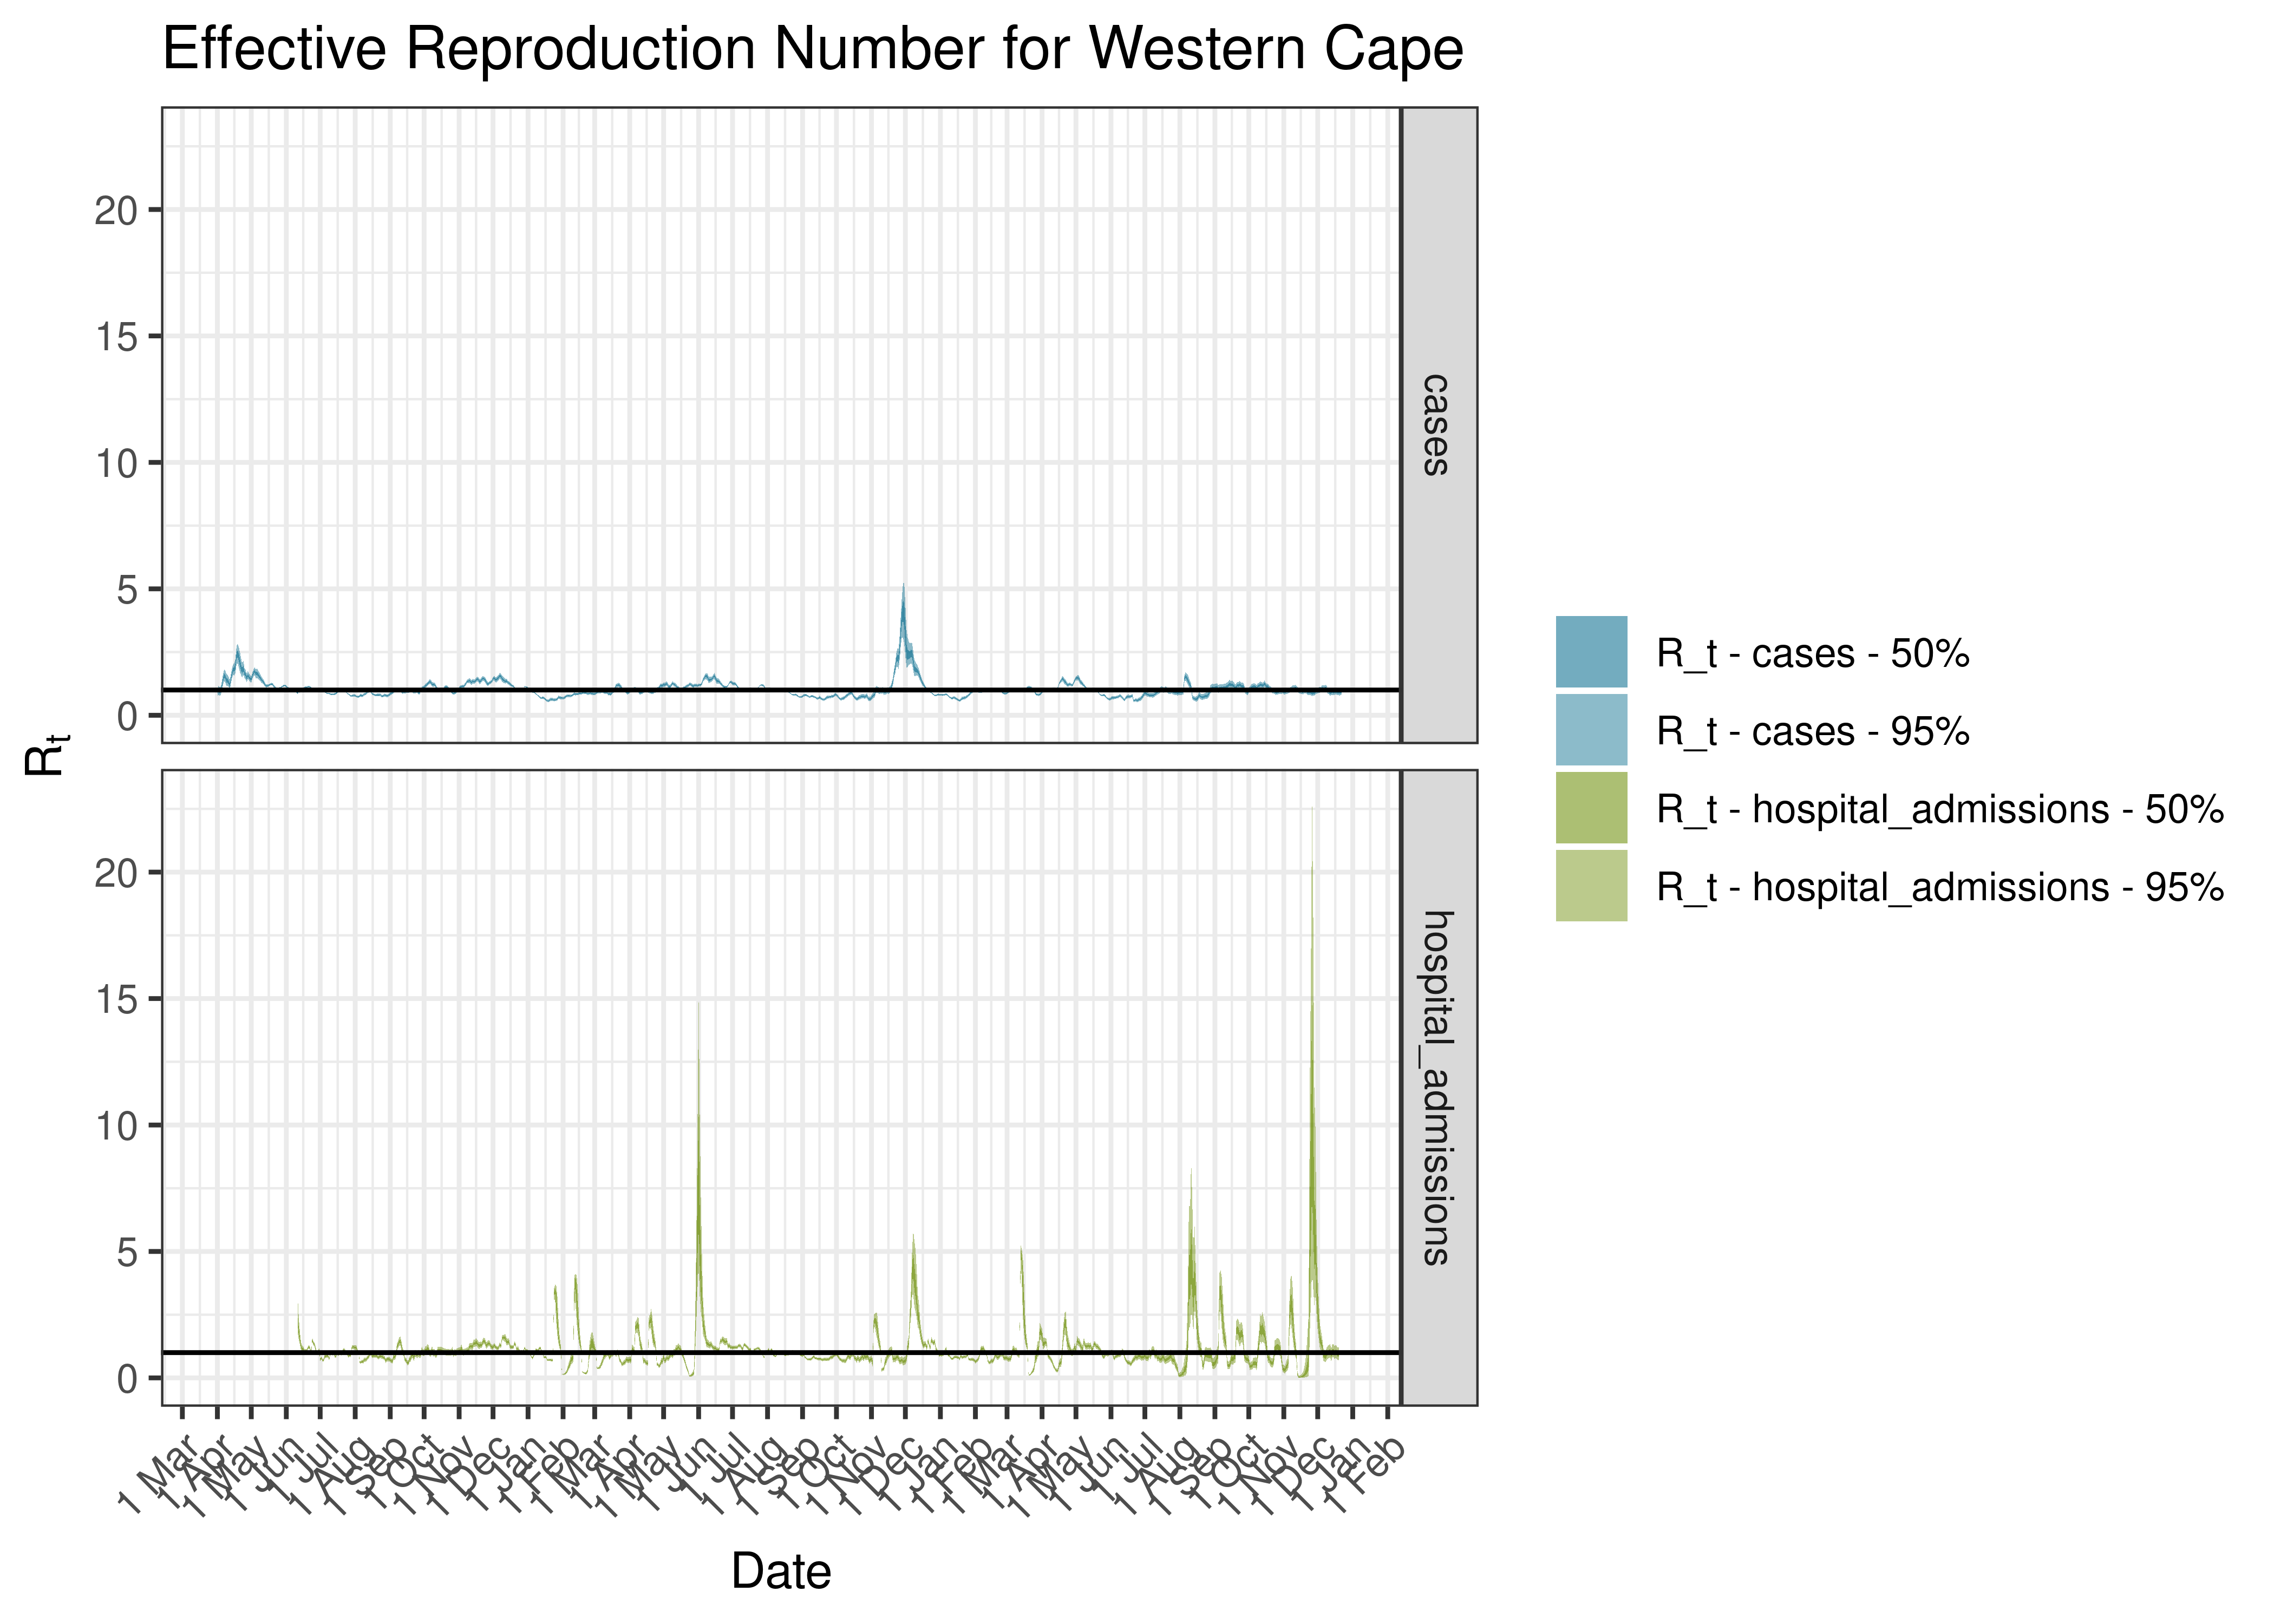
Estimated Effective Reproduction Number for Western Cape since 1 April 2020
6.10.8 Cape Winelands
6.10.8.1 Cases
Cases are tabulated by specimen received date below. Cases include estimates for late reporting in recent days as well as adjustments for any public holidays. A centred 7-day moving average is also shown. The peak daily cases in previous waves (as measured by the moving average) is also shown.
| Specimen Received Date | Cases | 7-day Moving Average | Comment |
|---|---|---|---|
| 2020-06-20 | 135 | 217 | Wave 1 Peak |
| 2020-12-31 | 707 | 575 | Wave 2 Peak |
| 2021-08-16 | 454 | 368 | Wave 3 Peak |
| 2021-12-20 | 526 | 375 | Wave 4 Peak |
| 2022-05-08 | 37 | 139 | Wave 5 Peak (to date) |
| 2022-05-09 | 221 | 139 | Wave 5 Peak (to date) |
Below a 7-day moving average daily case count are plotted for Cape Winelands on a log scale since start of the epidemic:
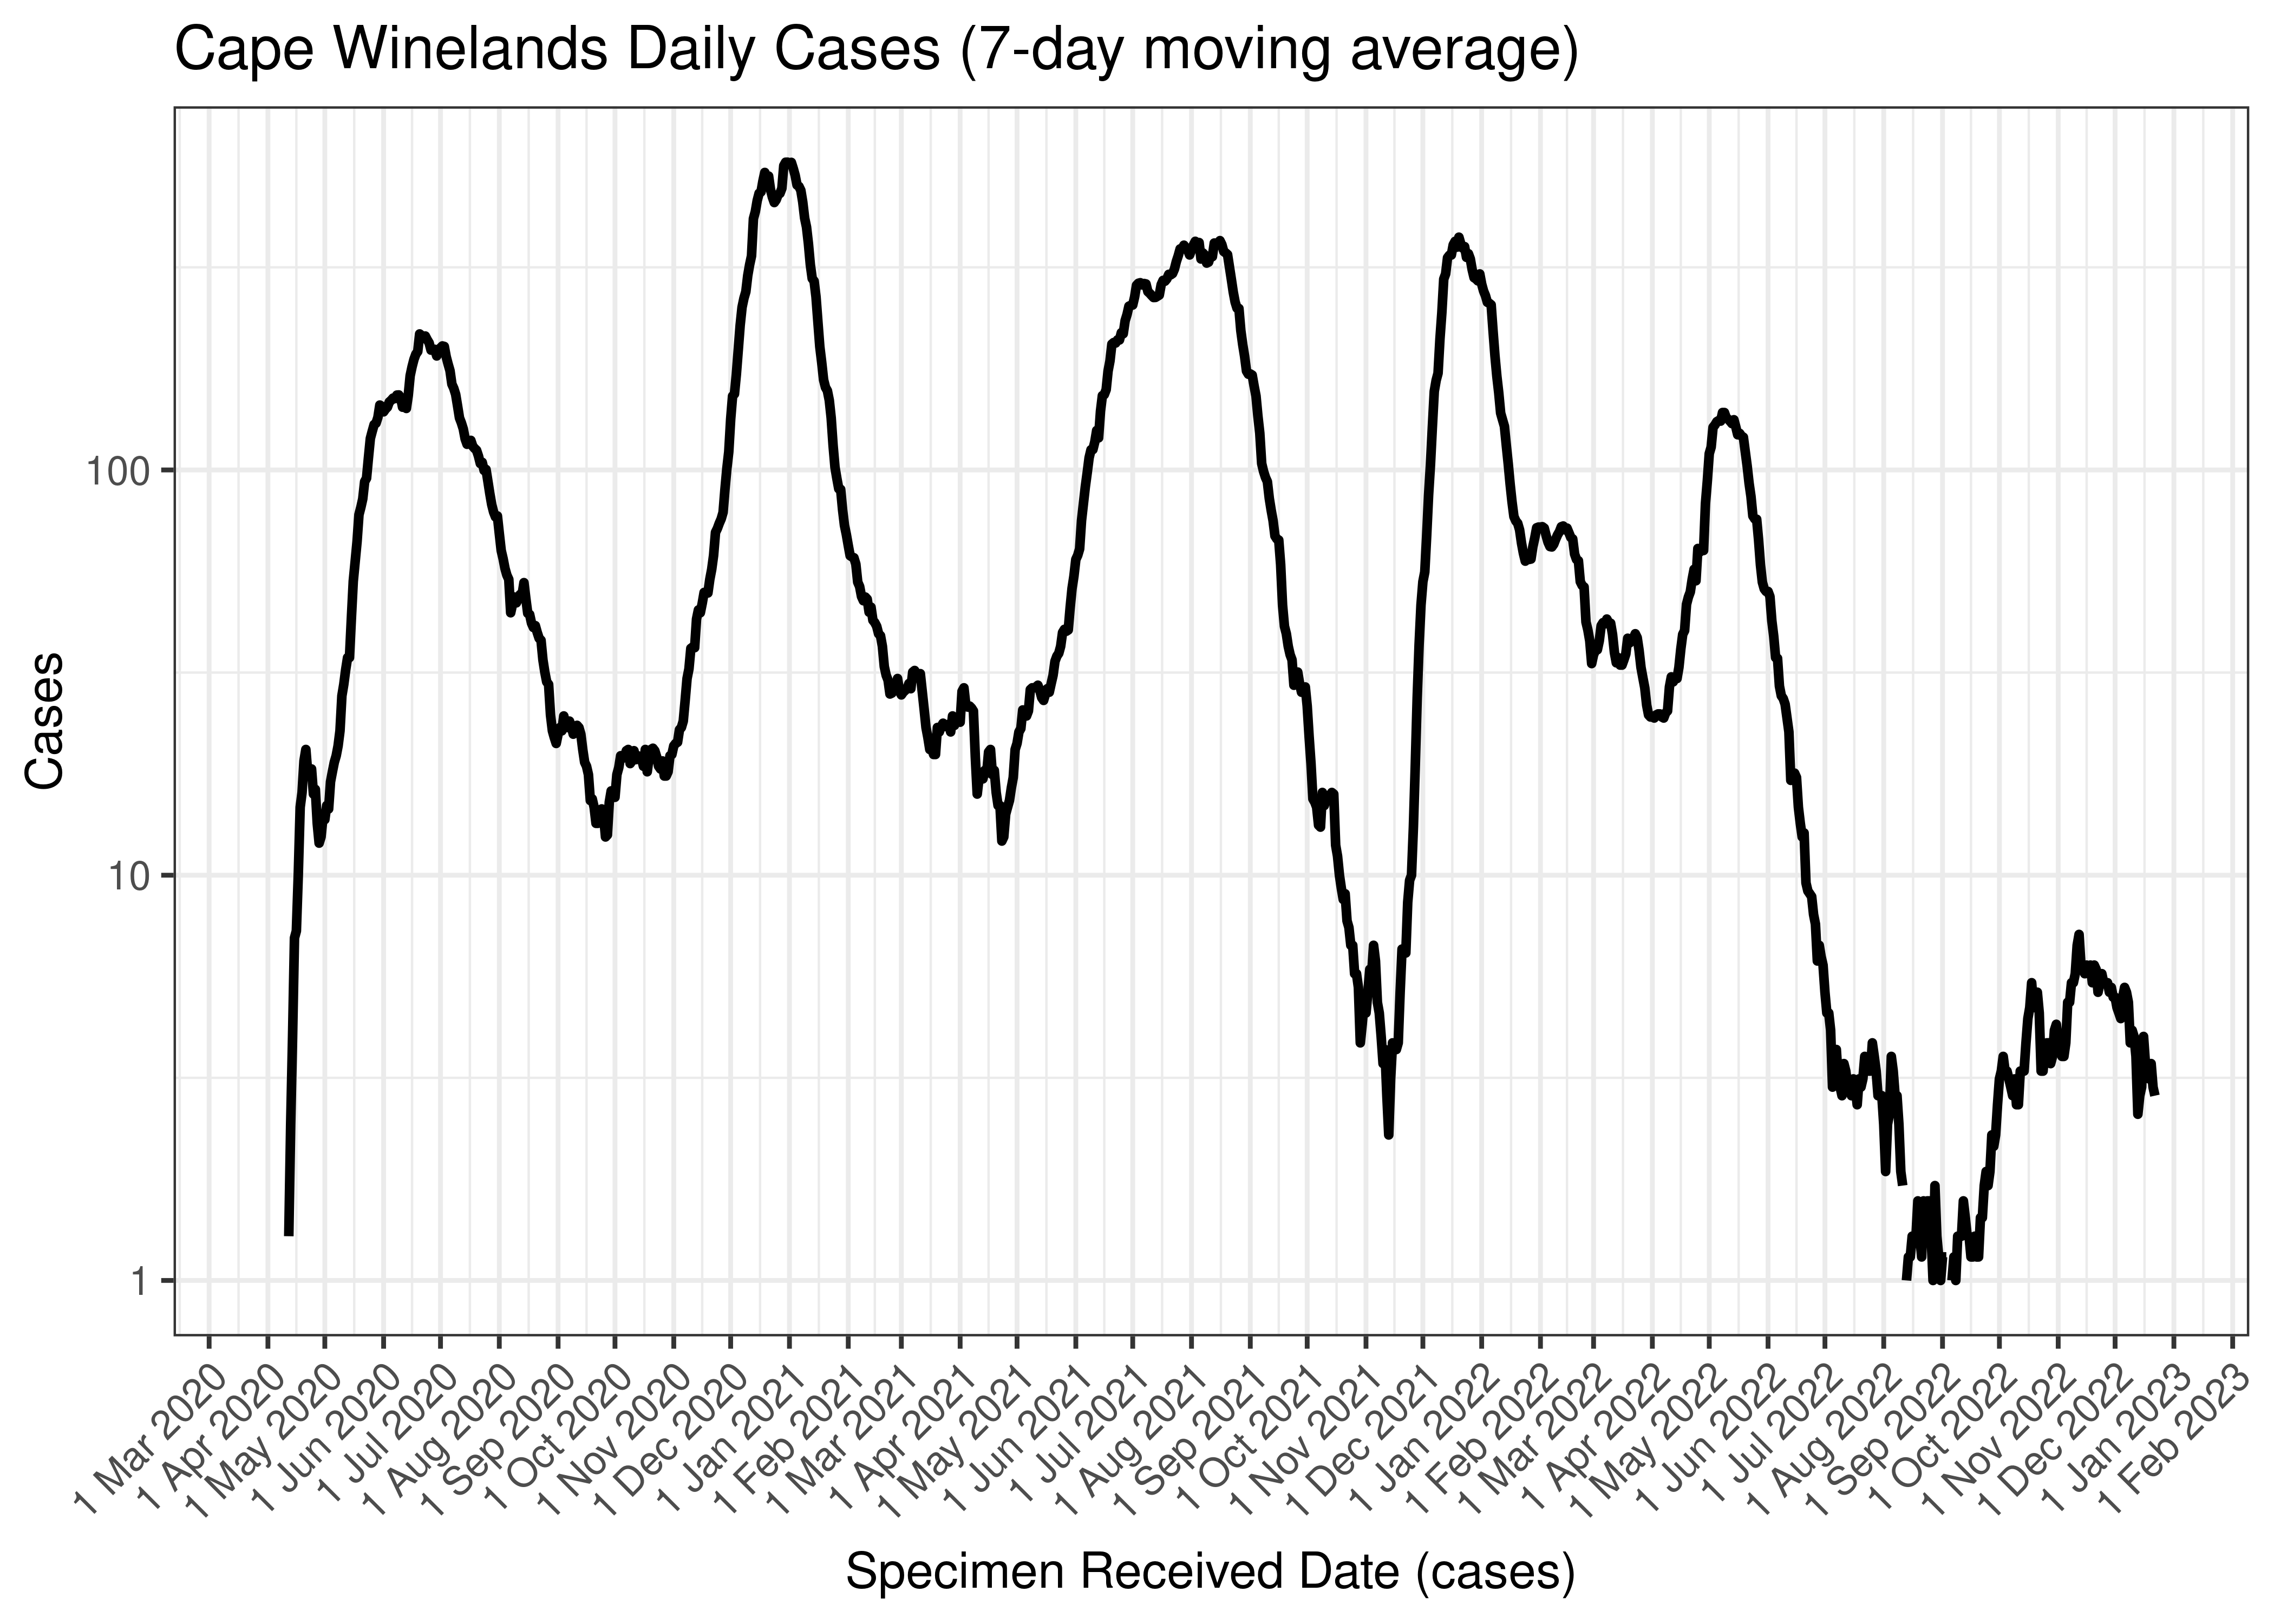
Cape Winelands Daily Cases (7-day moving average)
Below the above chart is repeated for the last 30-days:

Cape Winelands Daily Cases for Last 30-days (7-day moving average)
6.10.8.2 Reproduction Number
Below current (last weekly) reproduction number estimates are tabulated for Cape Winelands.
| Count (Per Day) | Week Ending | Reproduction Number [95% Confidence Interval] | |
|---|---|---|---|
| Cape Winelands | 2.9 | 2022-12-25 | 0.88 [0.55 - 1.29] |
Below the effective reproduction number for Cape Winelands over the last 90 days are plotted together with a plot since start of the pandemic.
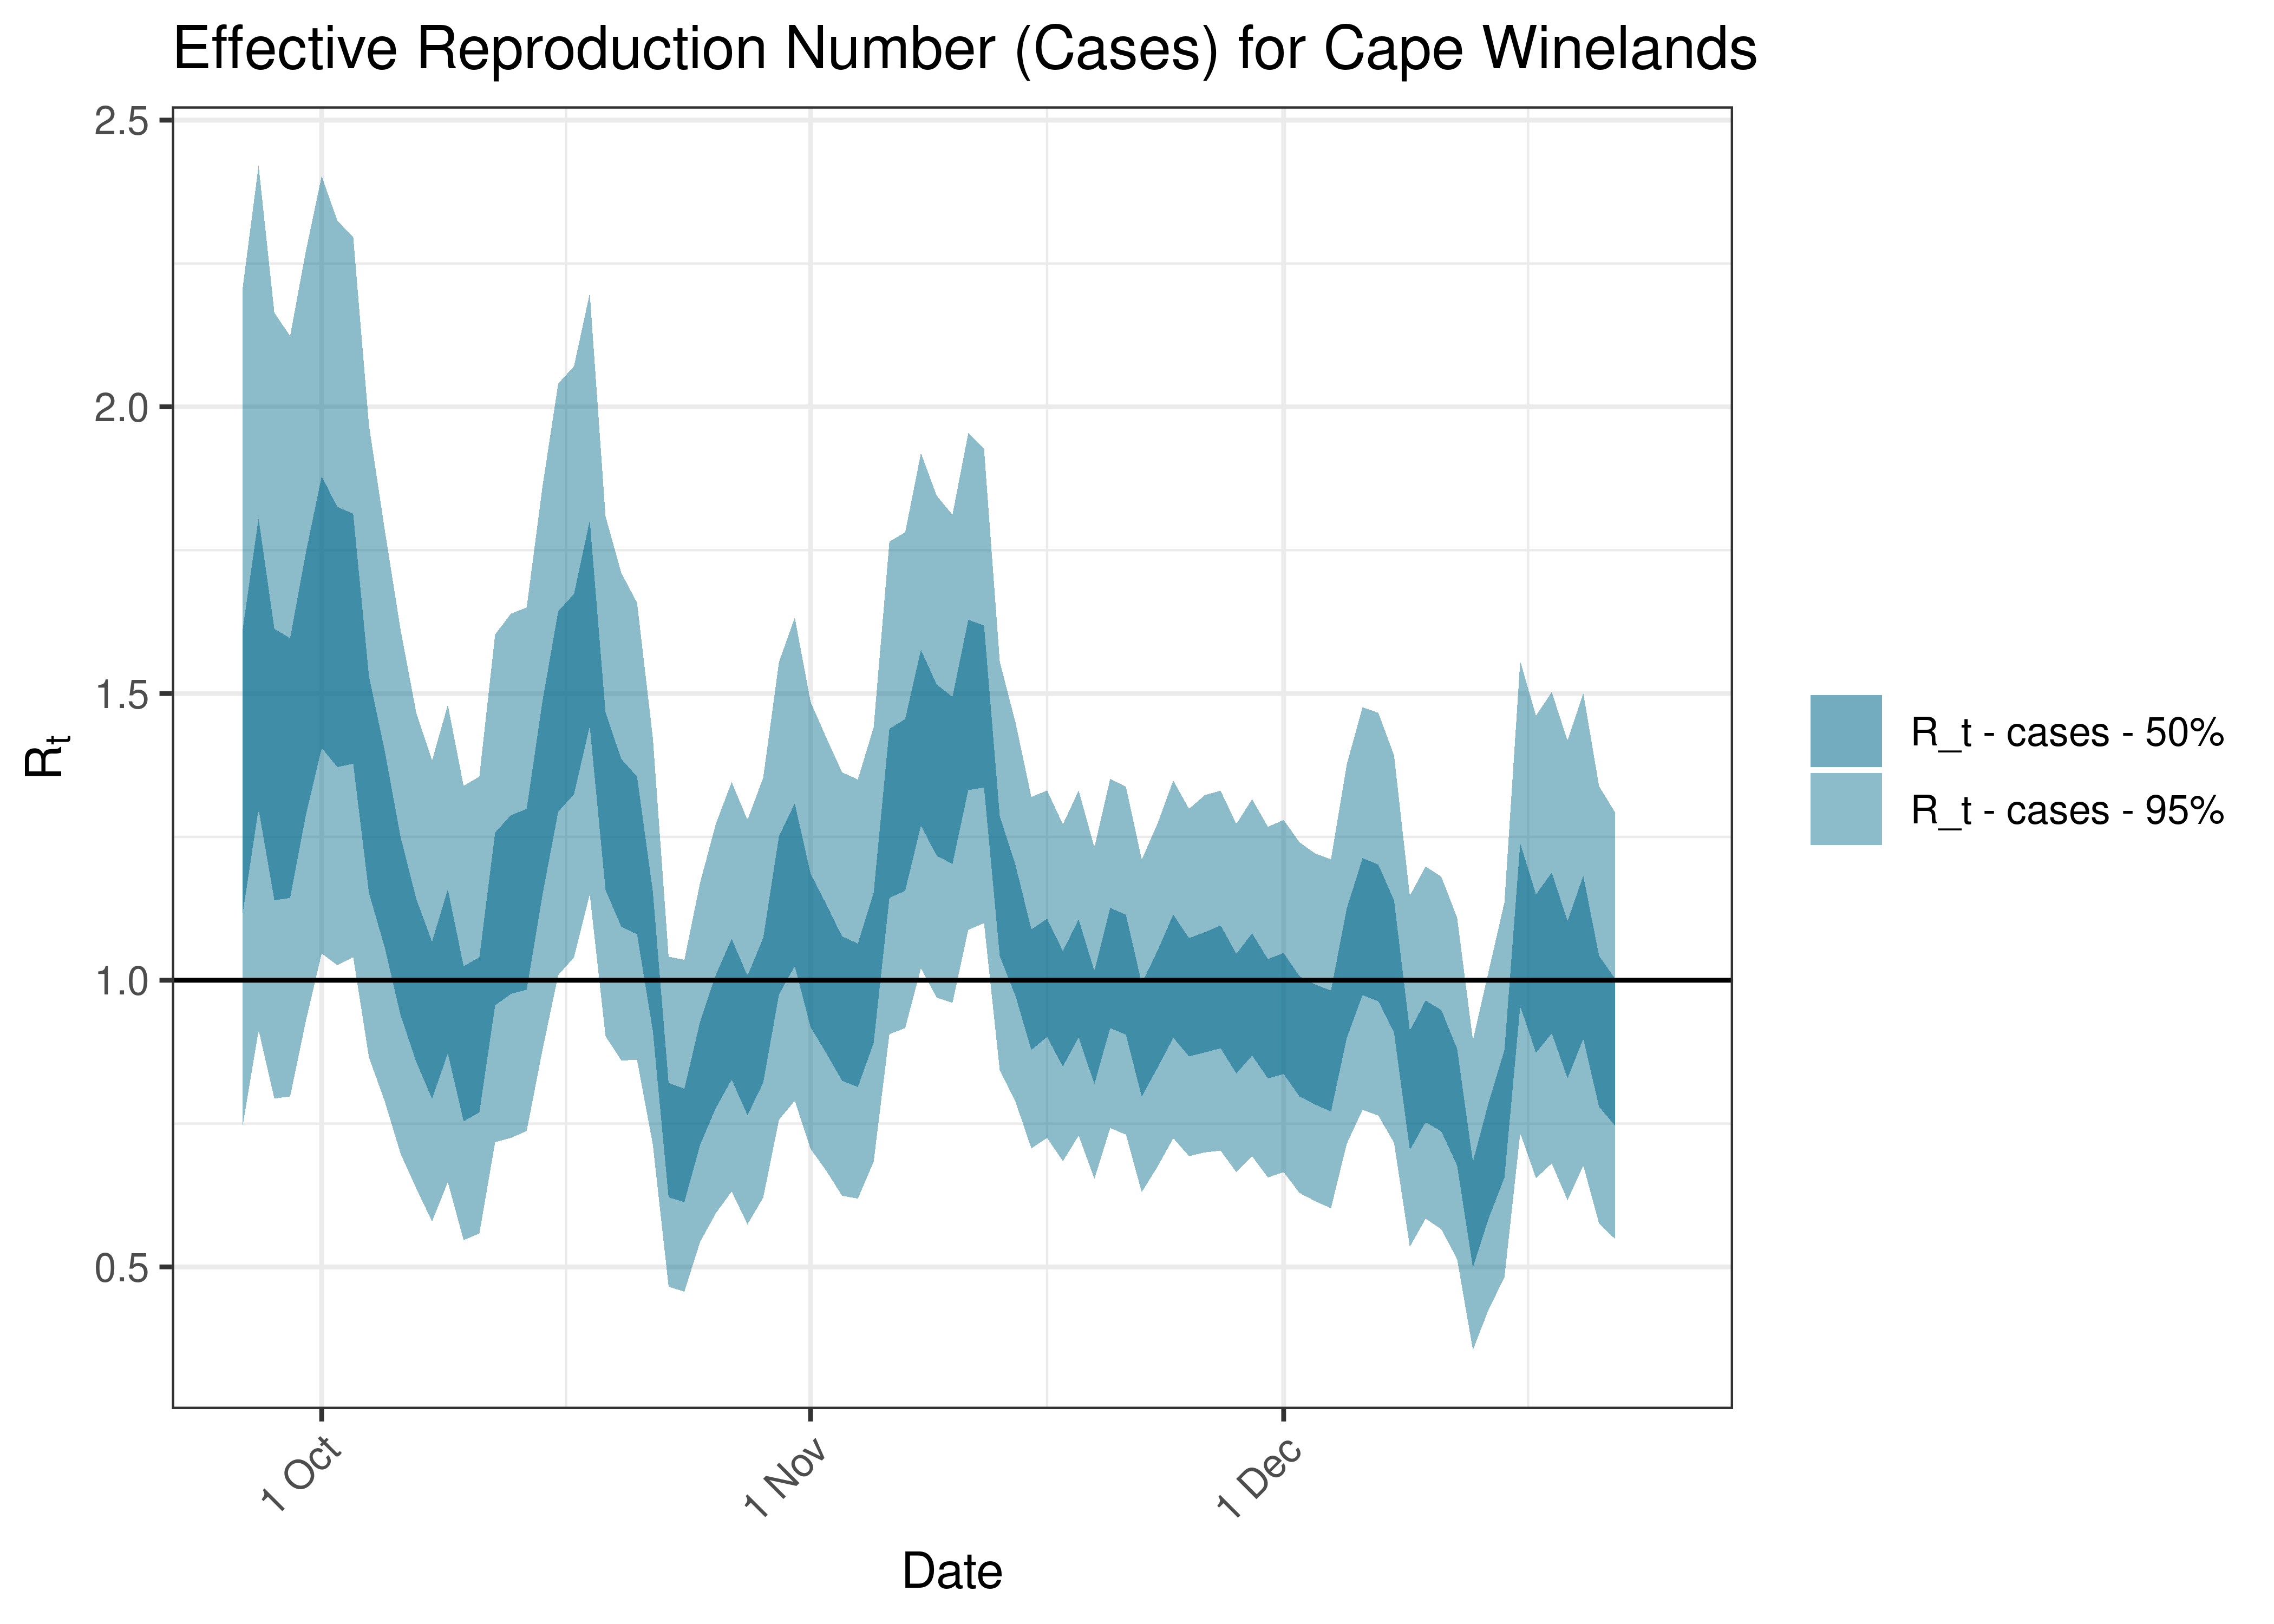
Estimated Effective Reproduction Number Based on Cases for Cape Winelands over last 90 days
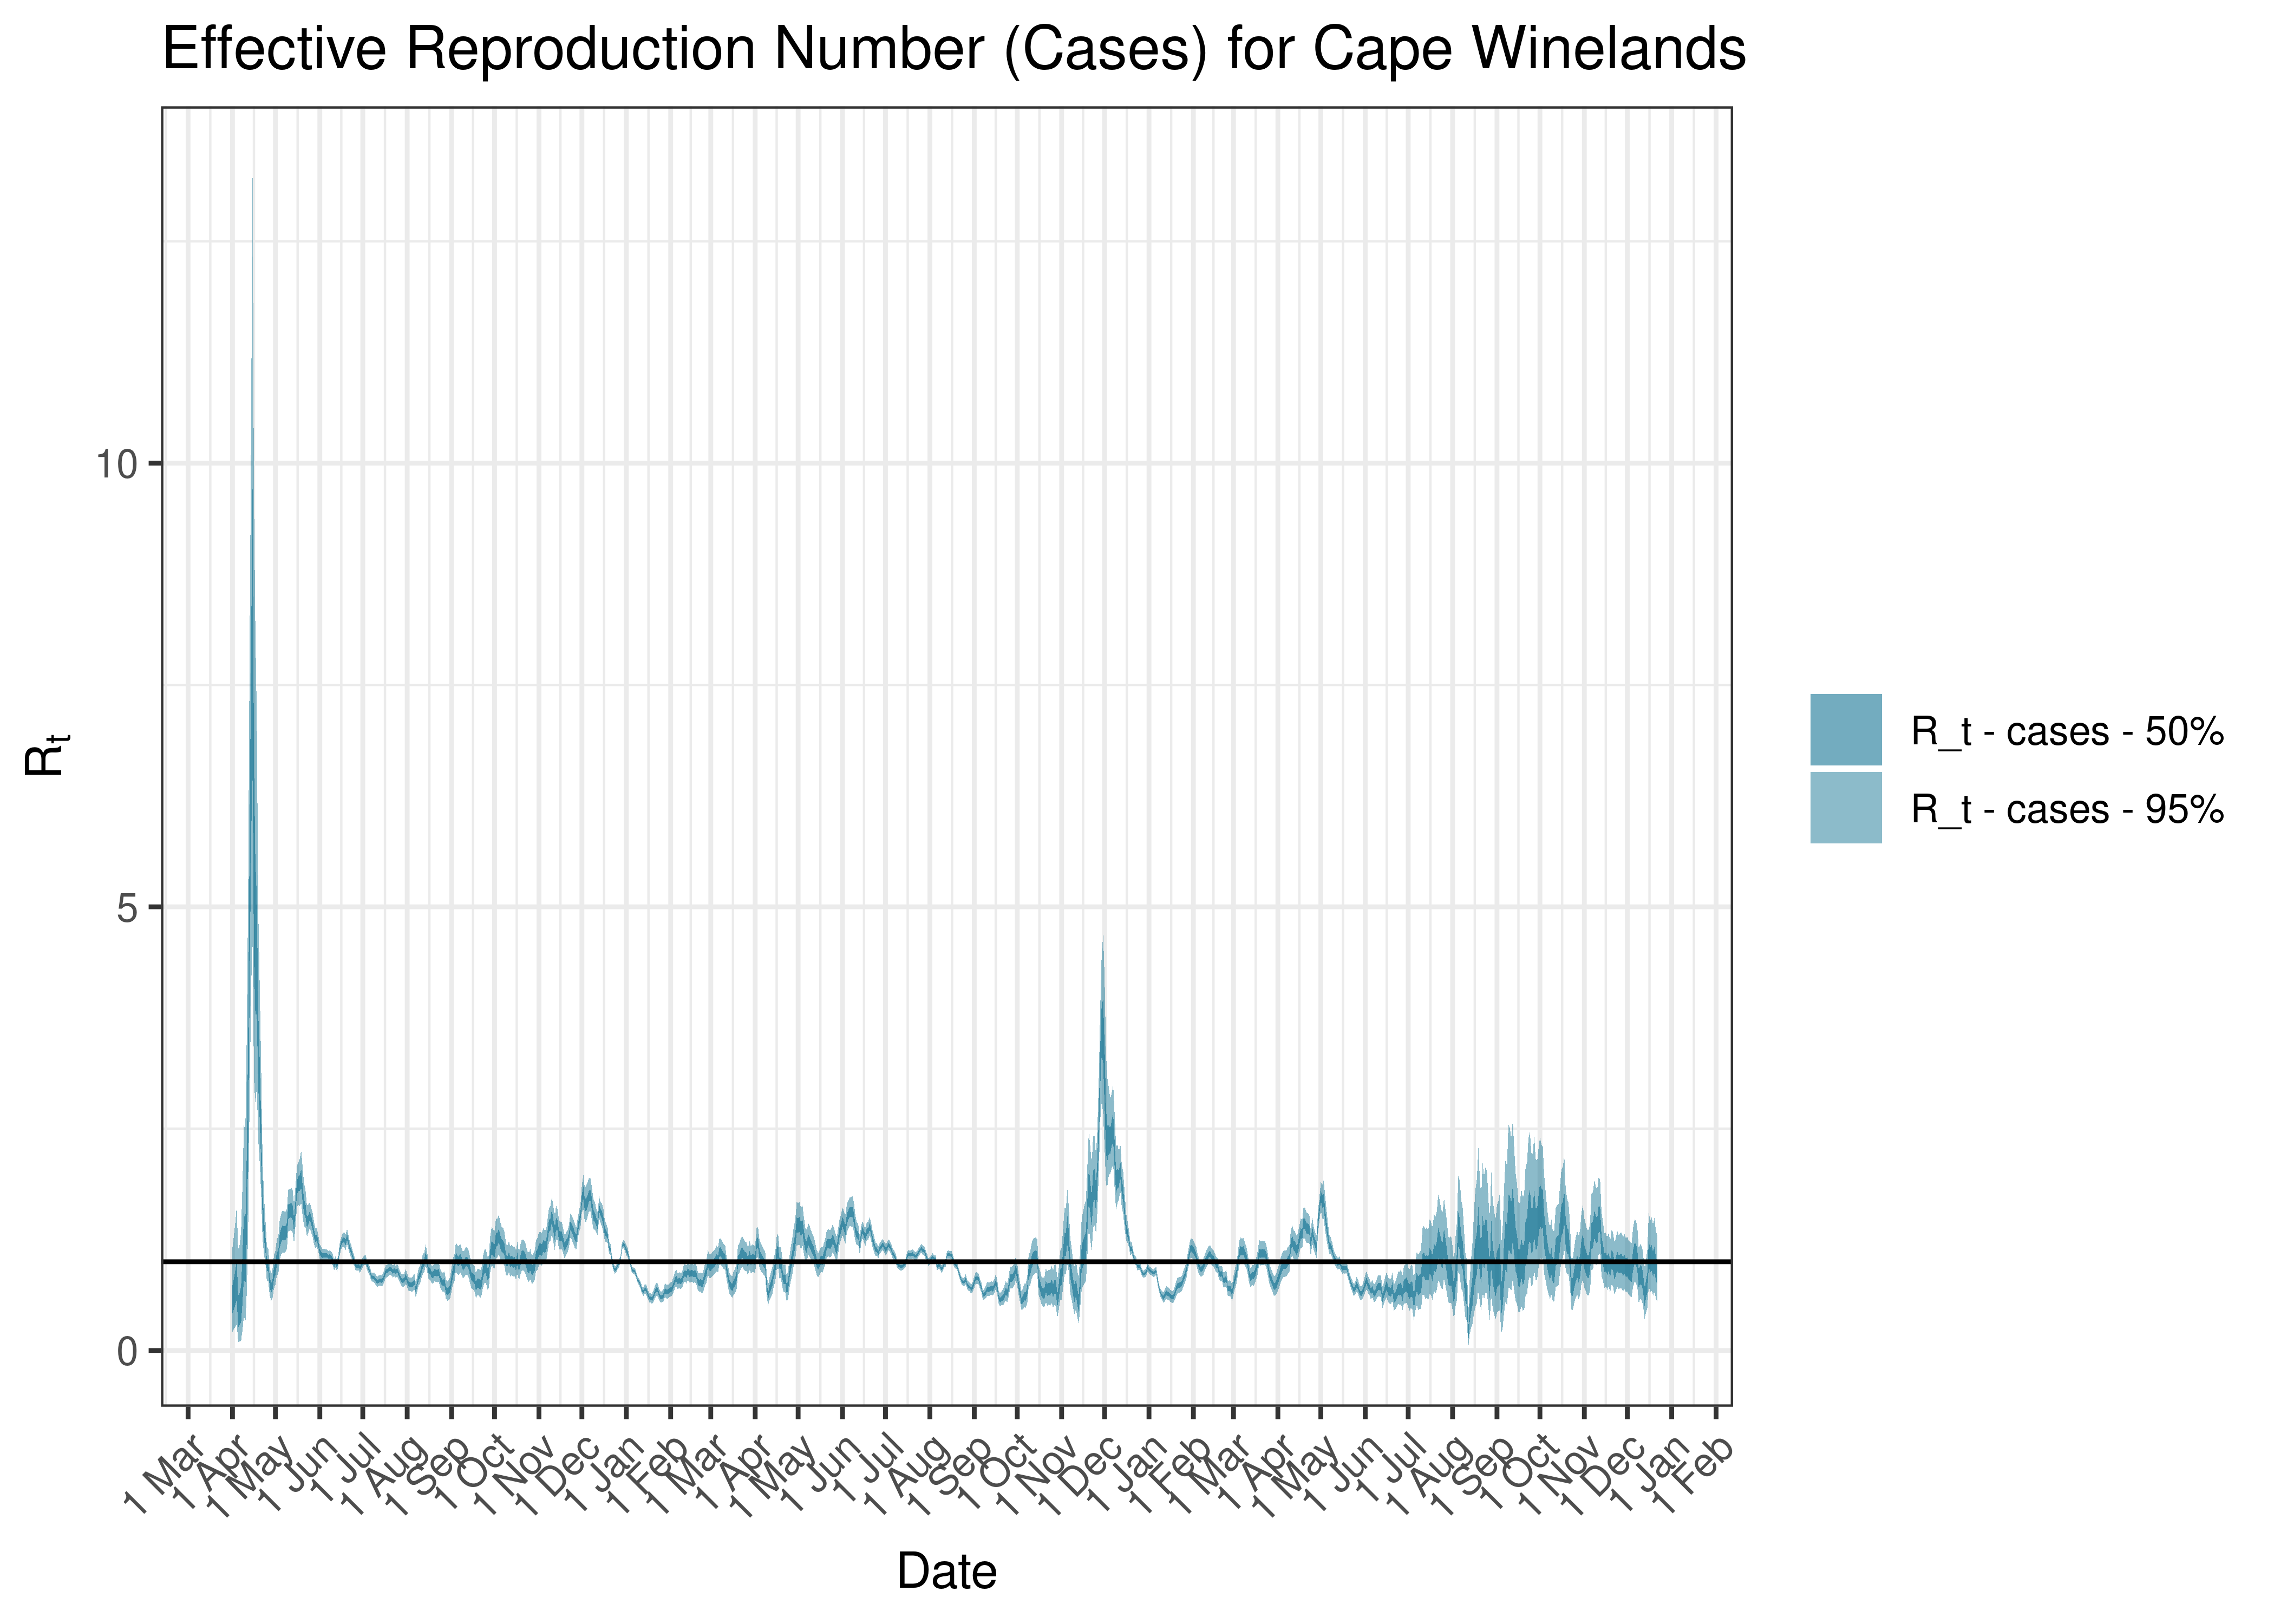
Estimated Effective Reproduction Number Based on Cases for Cape Winelands since 1 April 2020
6.10.9 Central Karoo
6.10.9.1 Cases
Cases are tabulated by specimen received date below. Cases include estimates for late reporting in recent days as well as adjustments for any public holidays. A centred 7-day moving average is also shown. The peak daily cases in previous waves (as measured by the moving average) is also shown.
| Specimen Received Date | Cases | 7-day Moving Average | Comment |
|---|---|---|---|
| 2020-07-31 | 24 | 17 | Wave 1 Peak |
| 2020-12-20 | 10 | 32 | Wave 2 Peak |
| 2021-07-27 | 86 | 62 | Wave 3 Peak |
| 2021-12-24 | 20 | 30 | Wave 4 Peak |
| 2022-05-15 | 0 | 5 | Wave 5 Peak (to date) |
| 2022-05-16 | 5 | 5 | Wave 5 Peak (to date) |
Below a 7-day moving average daily case count are plotted for Central Karoo on a log scale since start of the epidemic:
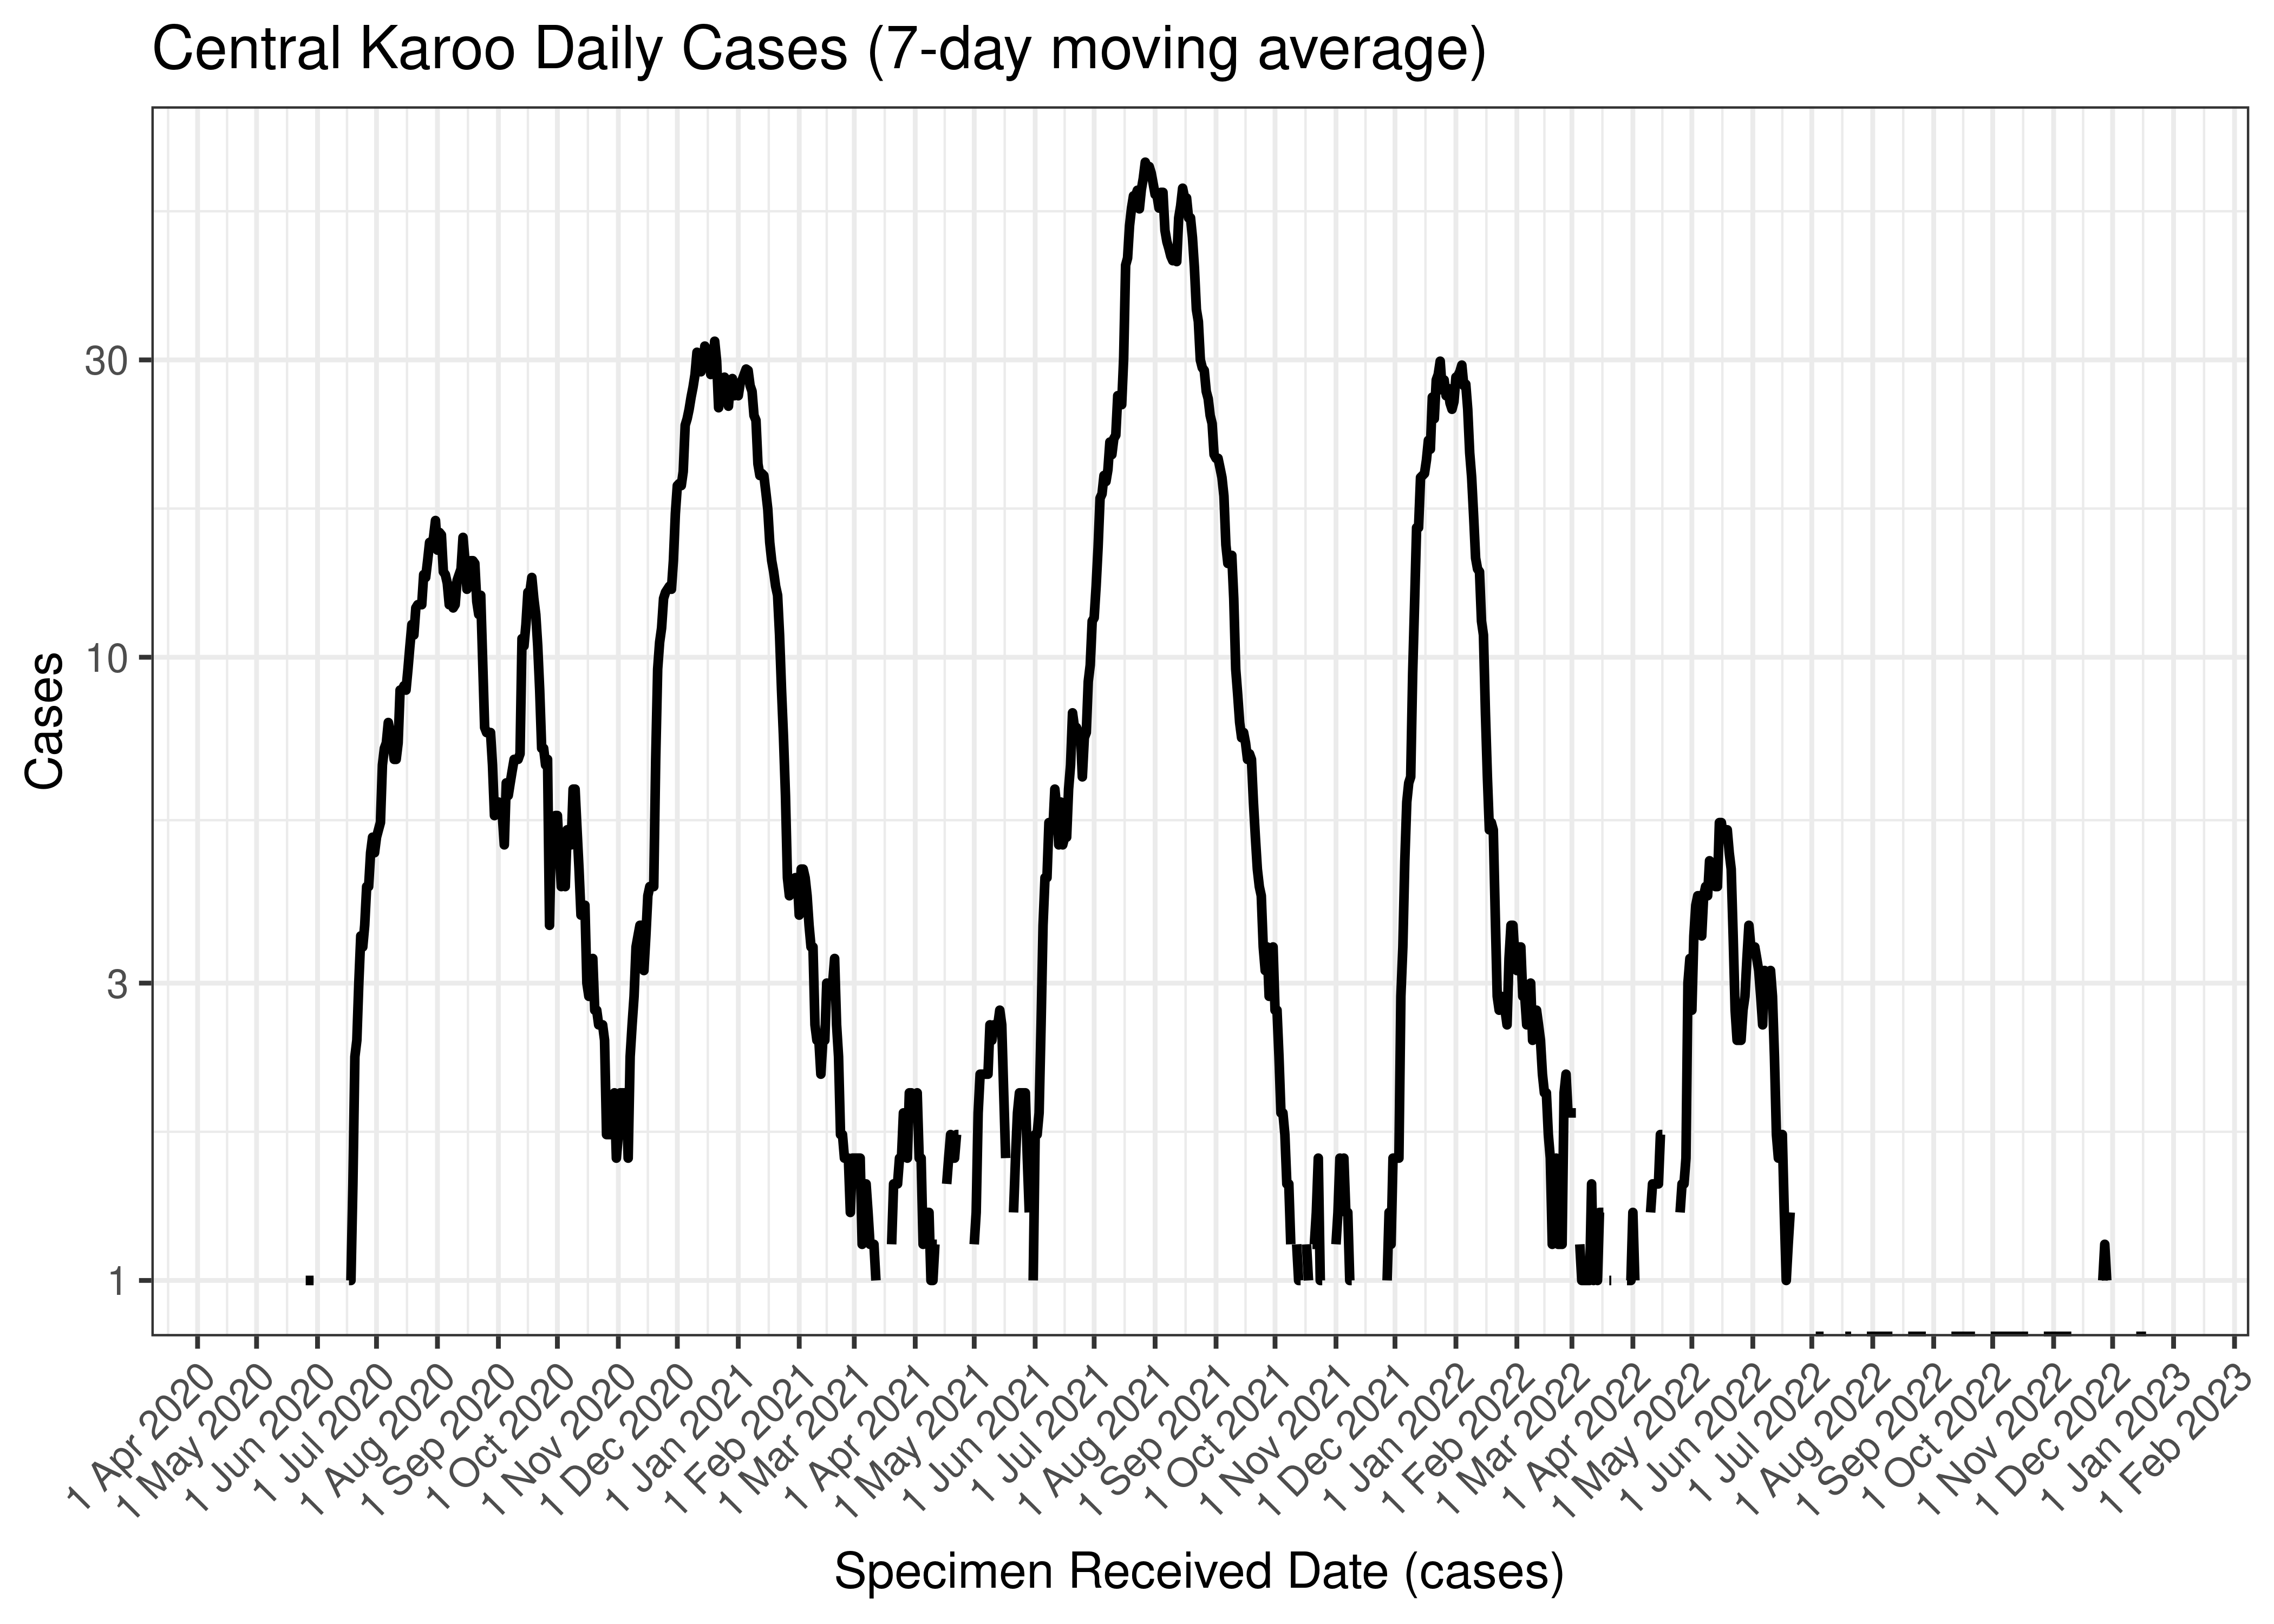
Central Karoo Daily Cases (7-day moving average)
Below the above chart is repeated for the last 30-days:

Central Karoo Daily Cases for Last 30-days (7-day moving average)
6.10.9.2 Reproduction Number
Below current (last weekly) reproduction number estimates are tabulated for Central Karoo.
| Count (Per Day) | Week Ending | Reproduction Number [95% Confidence Interval] | |
|---|---|---|---|
| Central Karoo | 0.3 | 2022-12-25 | 4.11 [0.72 - 11.69] |
Below the effective reproduction number for Central Karoo over the last 90 days are plotted together with a plot since start of the pandemic.
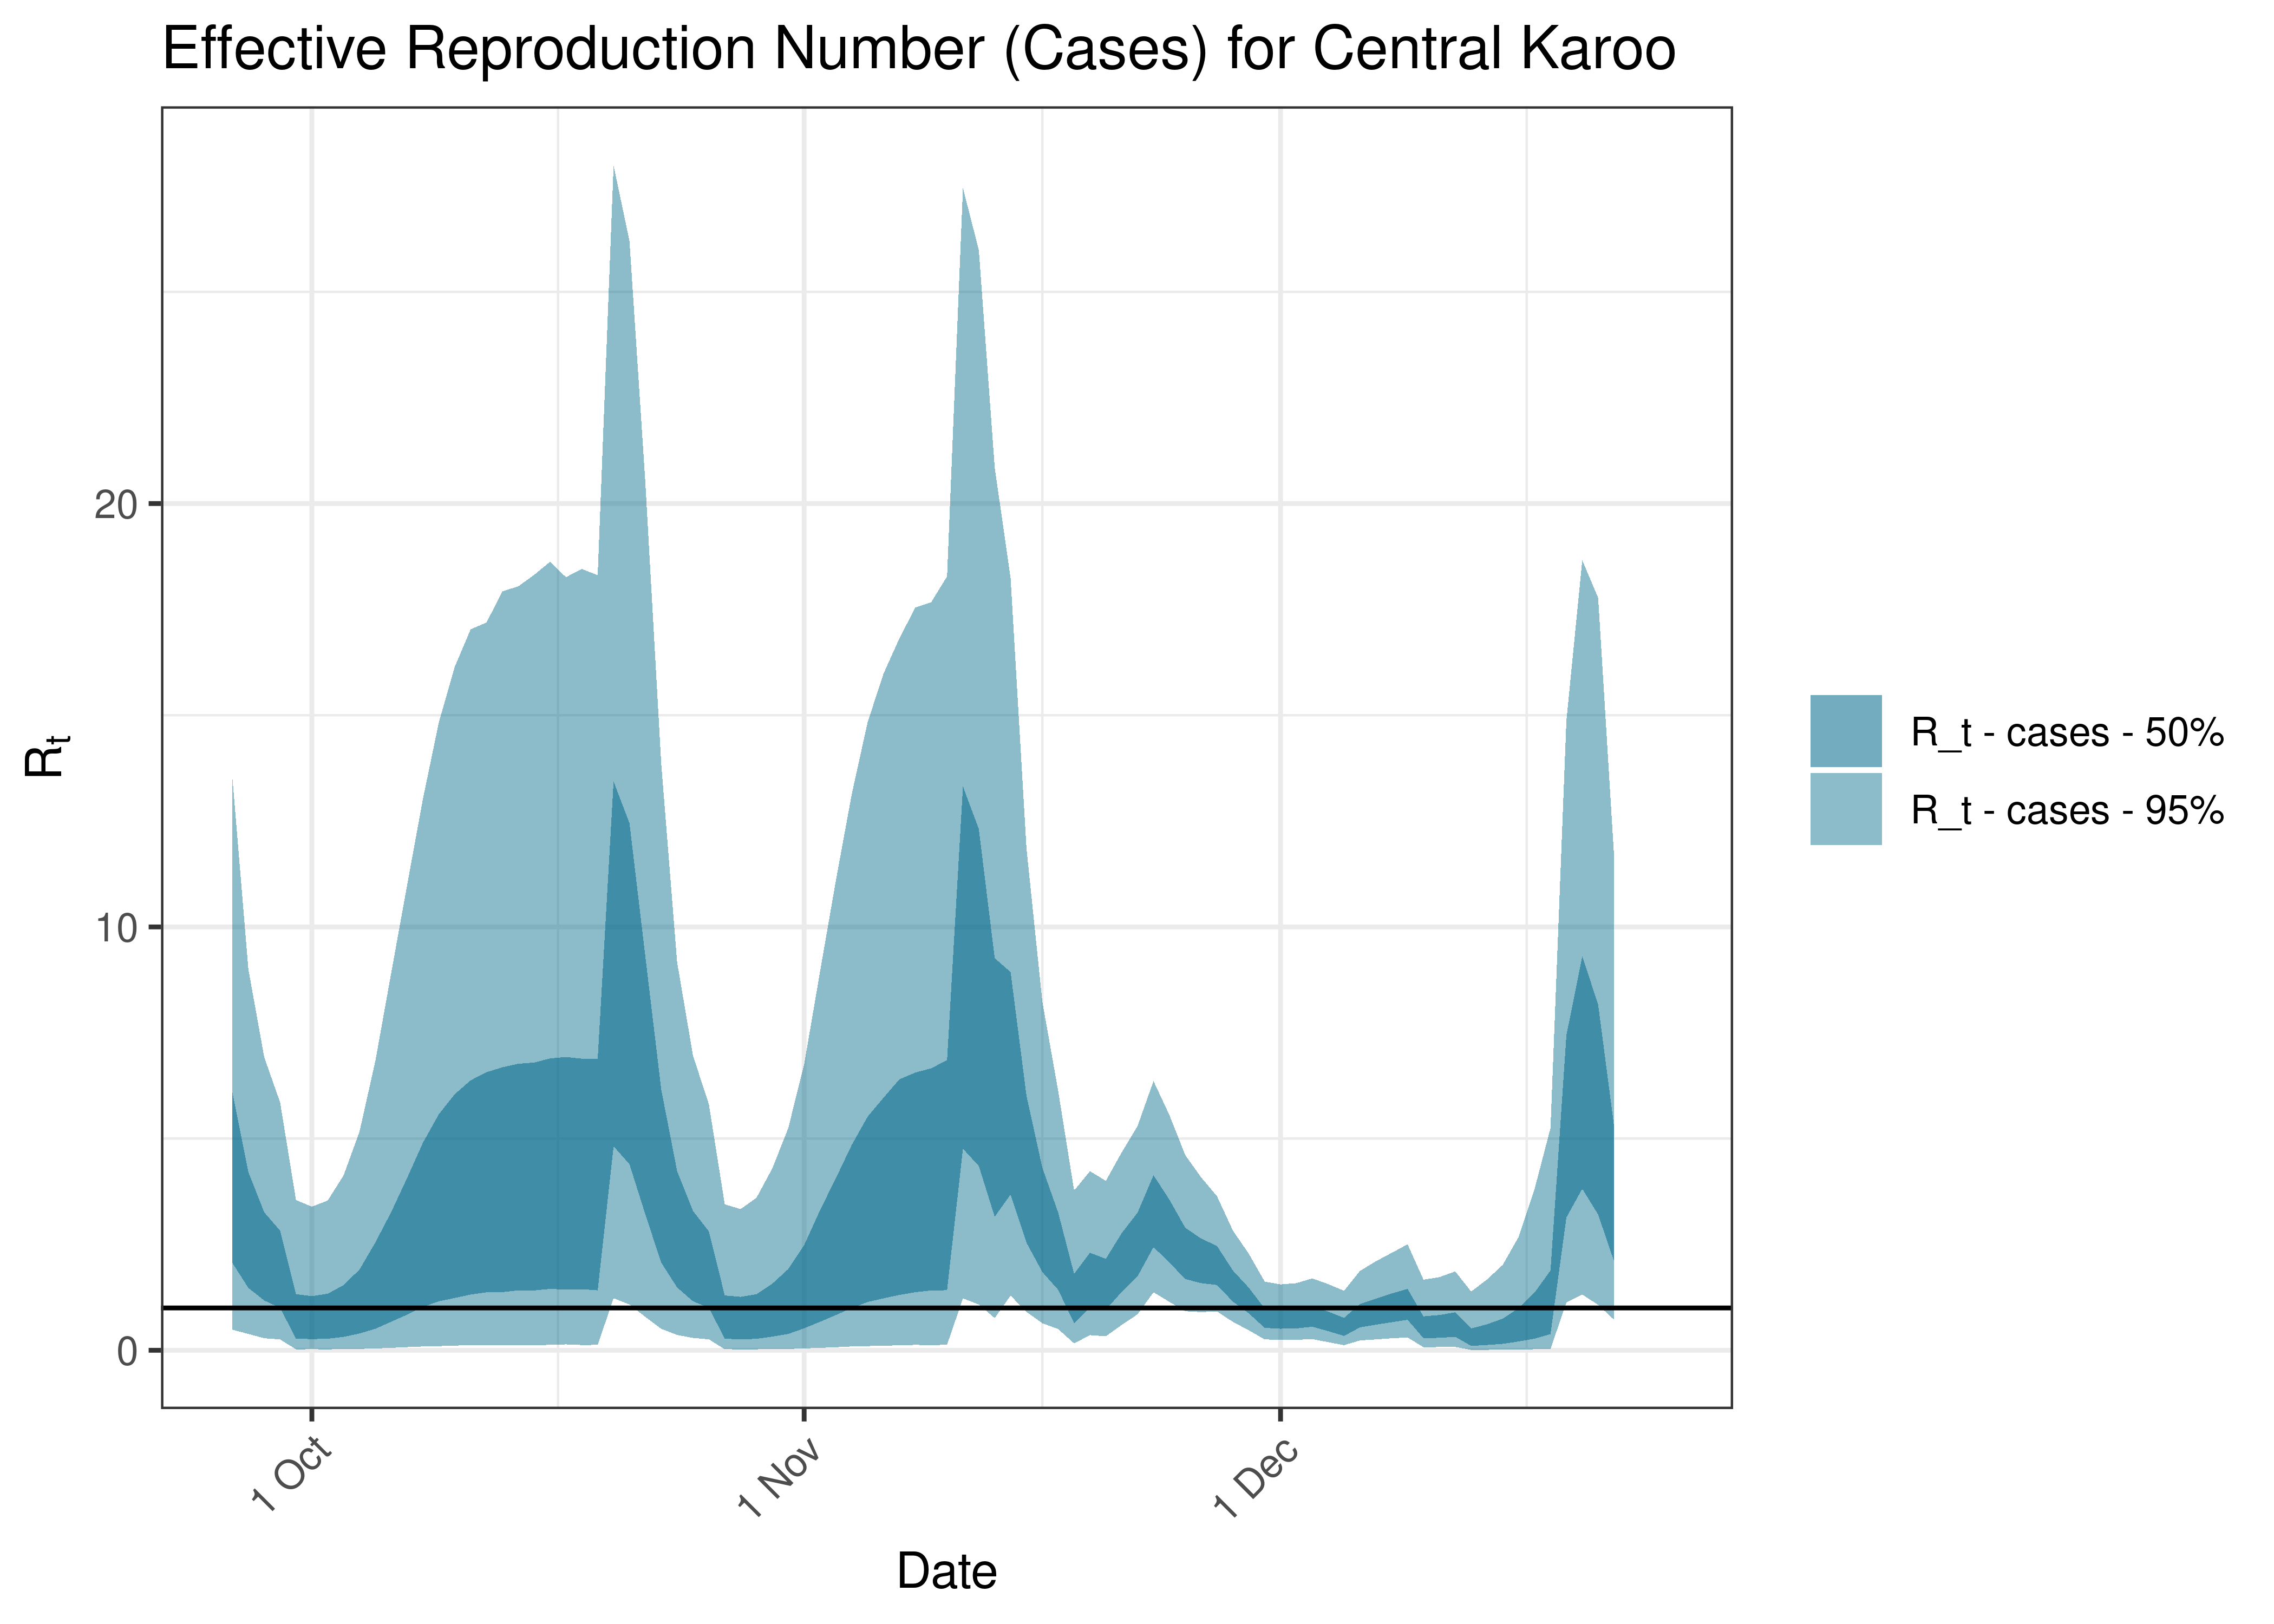
Estimated Effective Reproduction Number Based on Cases for Central Karoo over last 90 days
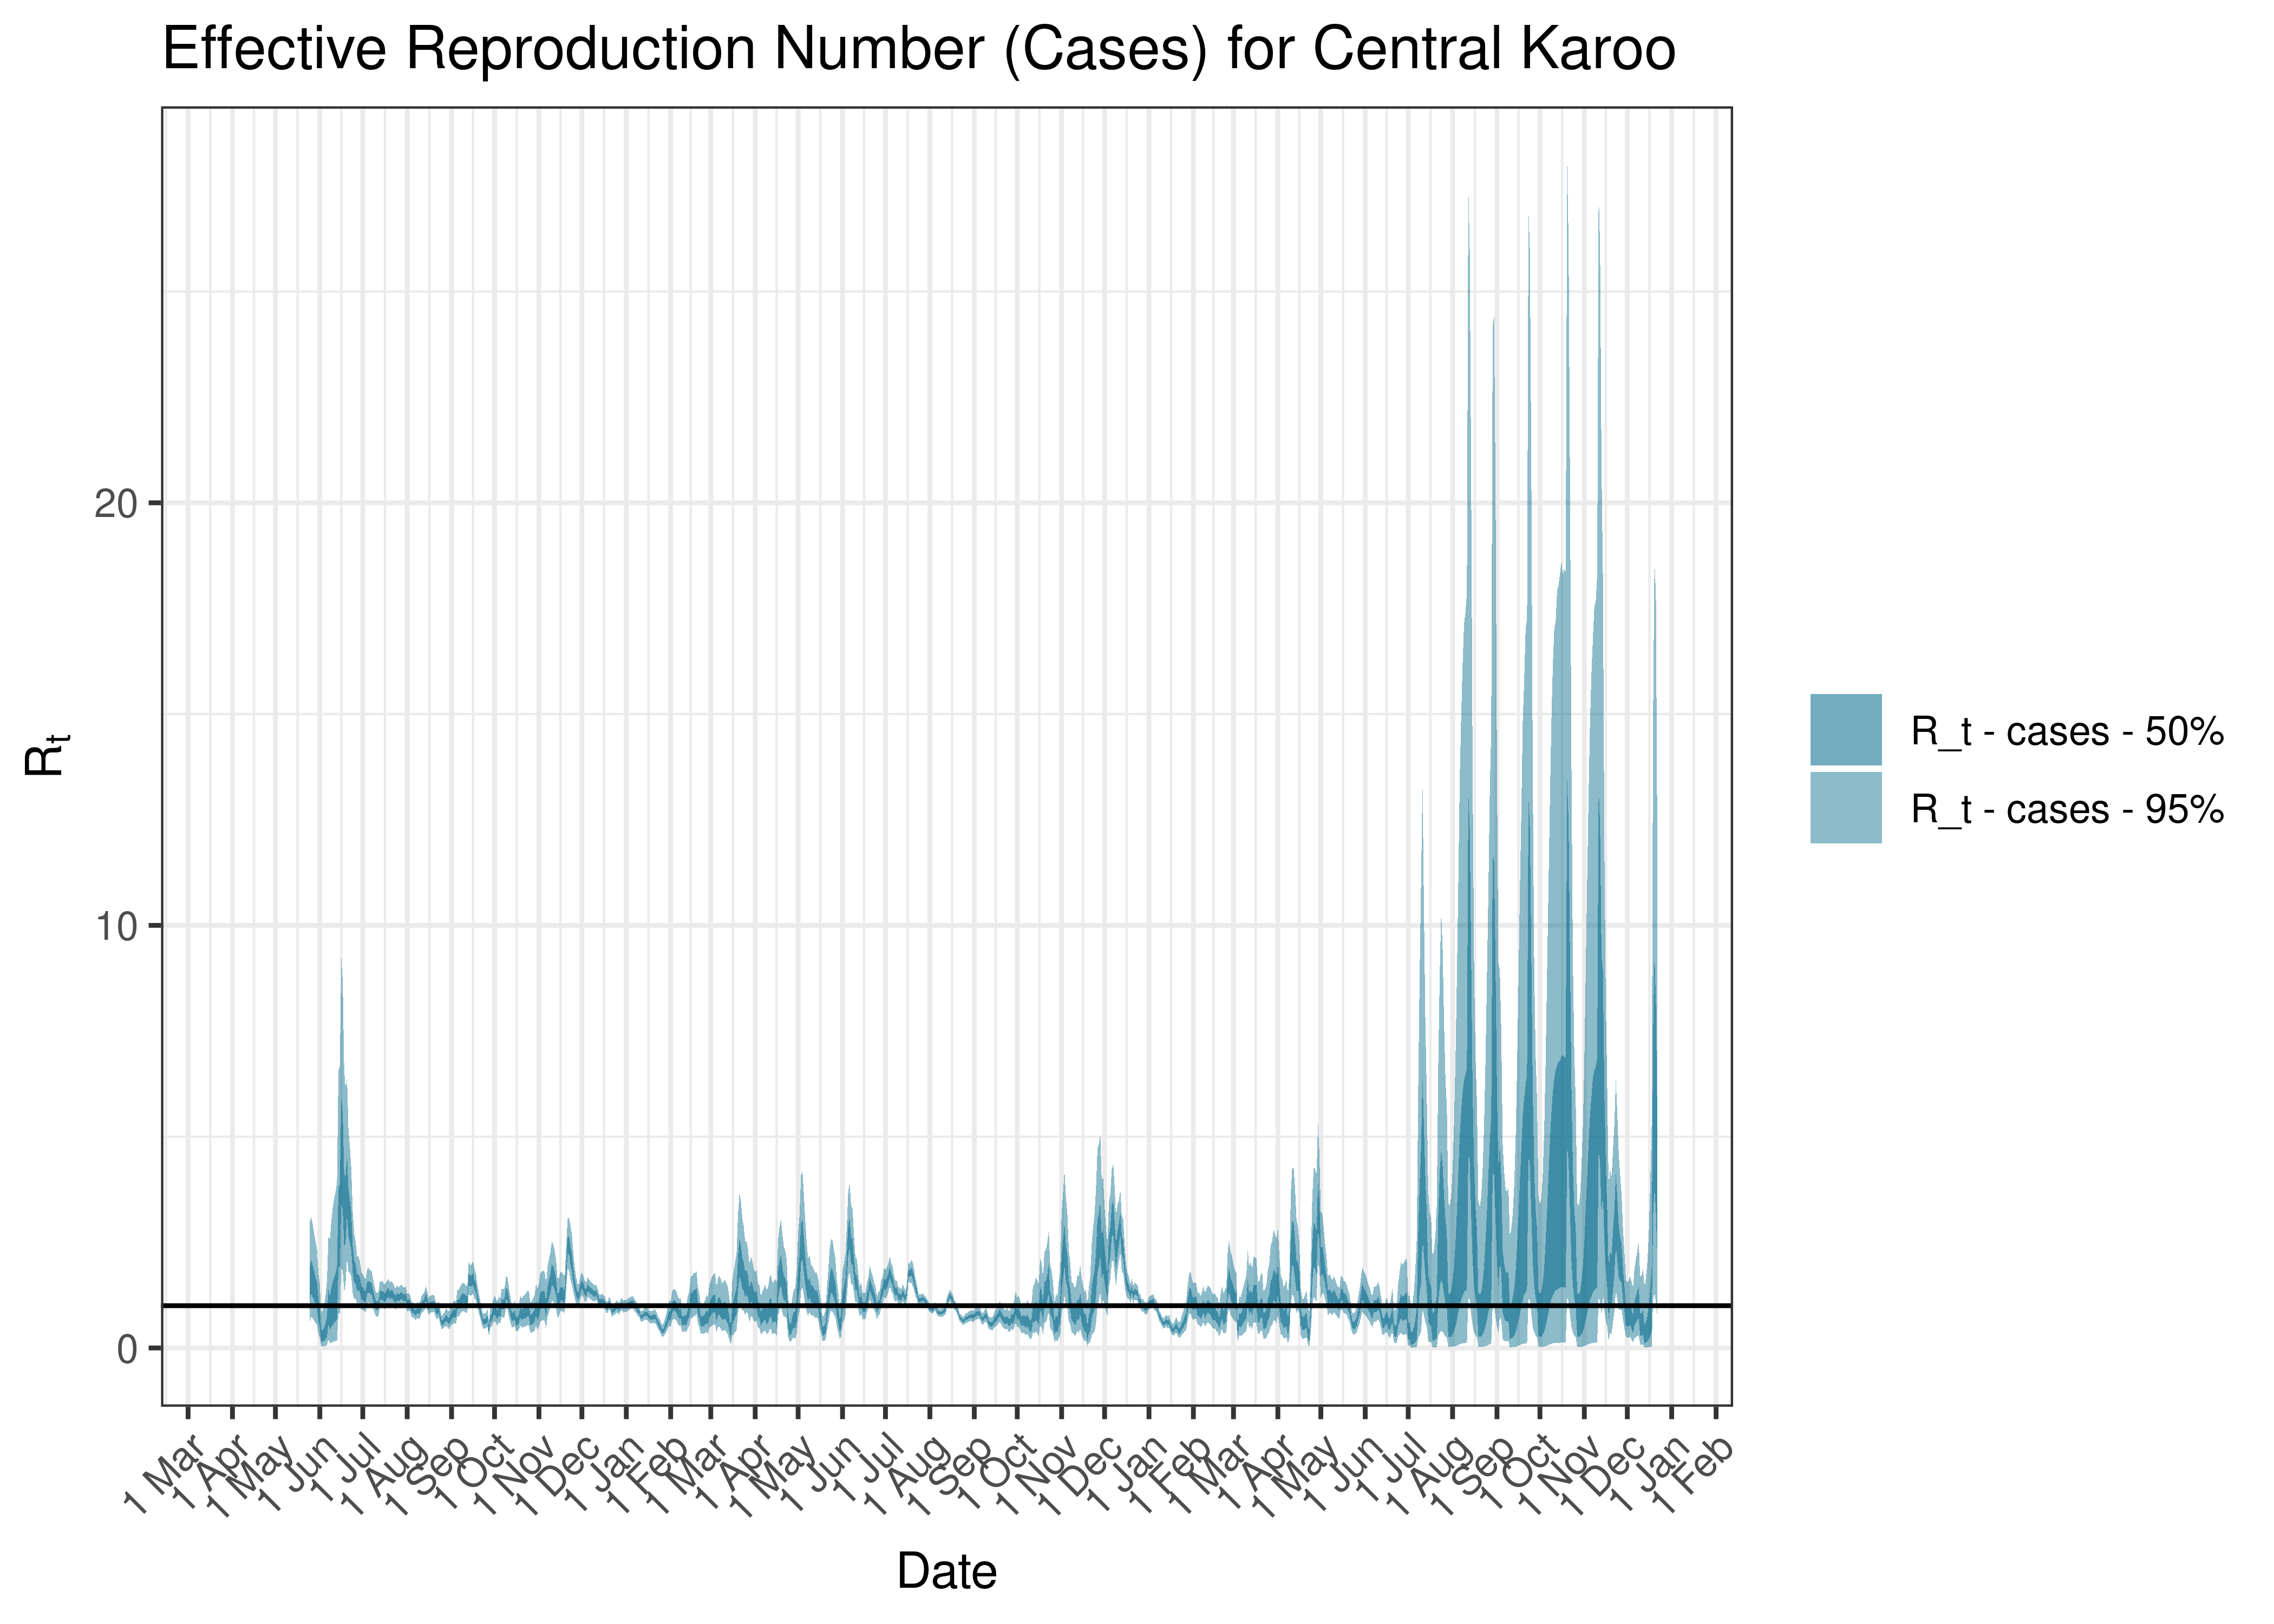
Estimated Effective Reproduction Number Based on Cases for Central Karoo since 1 April 2020
6.10.10 City Of Cape Town Metro
6.10.10.1 Cases
Cases are tabulated by specimen received date below. Cases include estimates for late reporting in recent days as well as adjustments for any public holidays. A centred 7-day moving average is also shown. The peak daily cases in previous waves (as measured by the moving average) is also shown.
| Specimen Received Date | Cases | 7-day Moving Average | Comment |
|---|---|---|---|
| 2020-06-01 | 1,119 | 1,040 | Wave 1 Peak |
| 2020-12-29 | 2,721 | 2,238 | Wave 2 Peak |
| 2021-08-05 | 2,515 | 2,076 | Wave 3 Peak |
| 2021-12-17 | 2,715 | 2,651 | Wave 4 Peak |
| 2022-05-09 | 1,260 | 840 | Wave 5 Peak (to date) |
Below a 7-day moving average daily case count are plotted for City Of Cape Town Metro on a log scale since start of the epidemic:
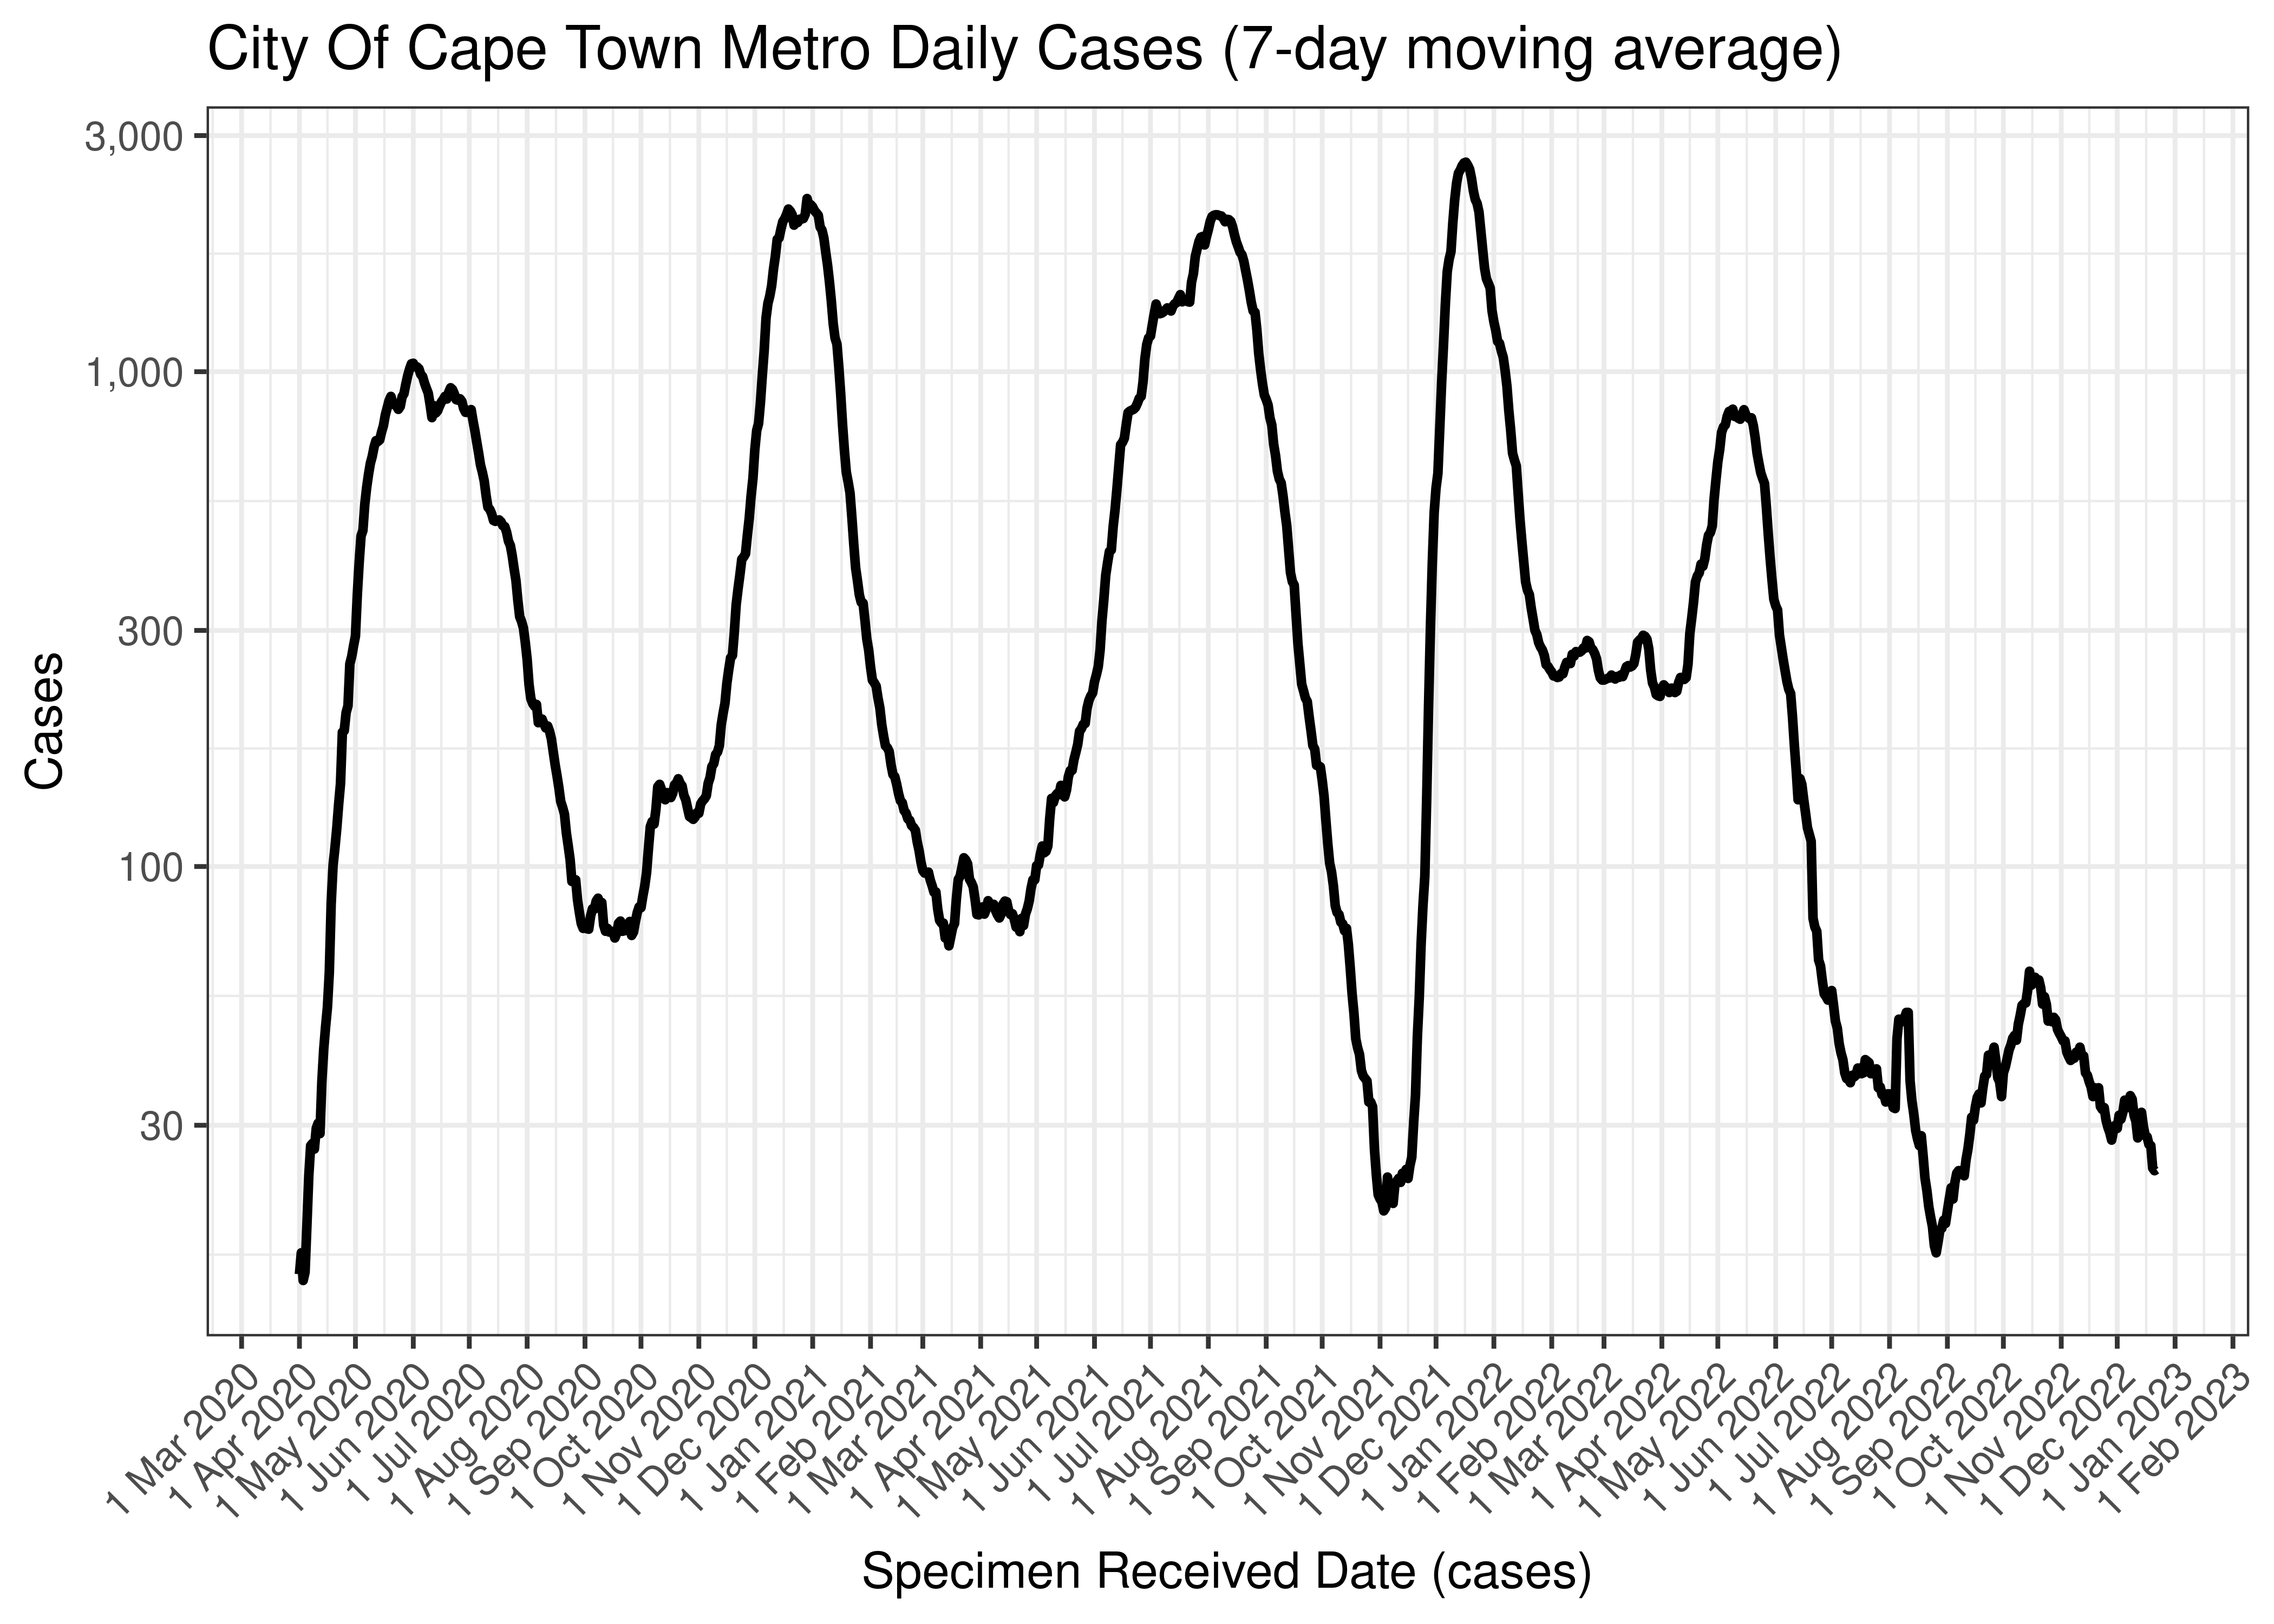
City Of Cape Town Metro Daily Cases (7-day moving average)
Below the above chart is repeated for the last 30-days:

City Of Cape Town Metro Daily Cases for Last 30-days (7-day moving average)
6.10.10.2 Excess Deaths
Excess deaths are tabulated by date of death below. A centred 7-day moving average is also shown. The peak daily deaths in previous waves (as measured by the moving average) is also shown.
| Specimen Received Date | Excess Deaths | 7-day Moving Average | Comment |
|---|---|---|---|
| 2020-06-17 | 70 | 70 | Wave 1 Peak |
| 2020-12-30 | 142 | 142 | Wave 2 Peak |
| 2021-08-04 | 129 | 129 | Wave 3 Peak |
| 2021-12-22 | 34 | 34 | Wave 4 Peak |
| 2022-10-05 | 21 | 21 | Wave 5 Peak (to date) |
| 2022-12-03 | 11 | 6 | |
| 2022-12-04 | -1 | 4 | |
| 2022-12-05 | -1 | 2 | |
| 2022-12-06 | -1 | 1 | |
| 2022-12-07 | -1 | -1 | |
| 2022-12-08 | -1 | NA | |
| 2022-12-09 | -1 | NA | |
| 2022-12-10 | -1 | NA |
Below a 7-day moving average daily excess deaths is plotted for City Of Cape Town Metro on a log scale since start of the epidemic:
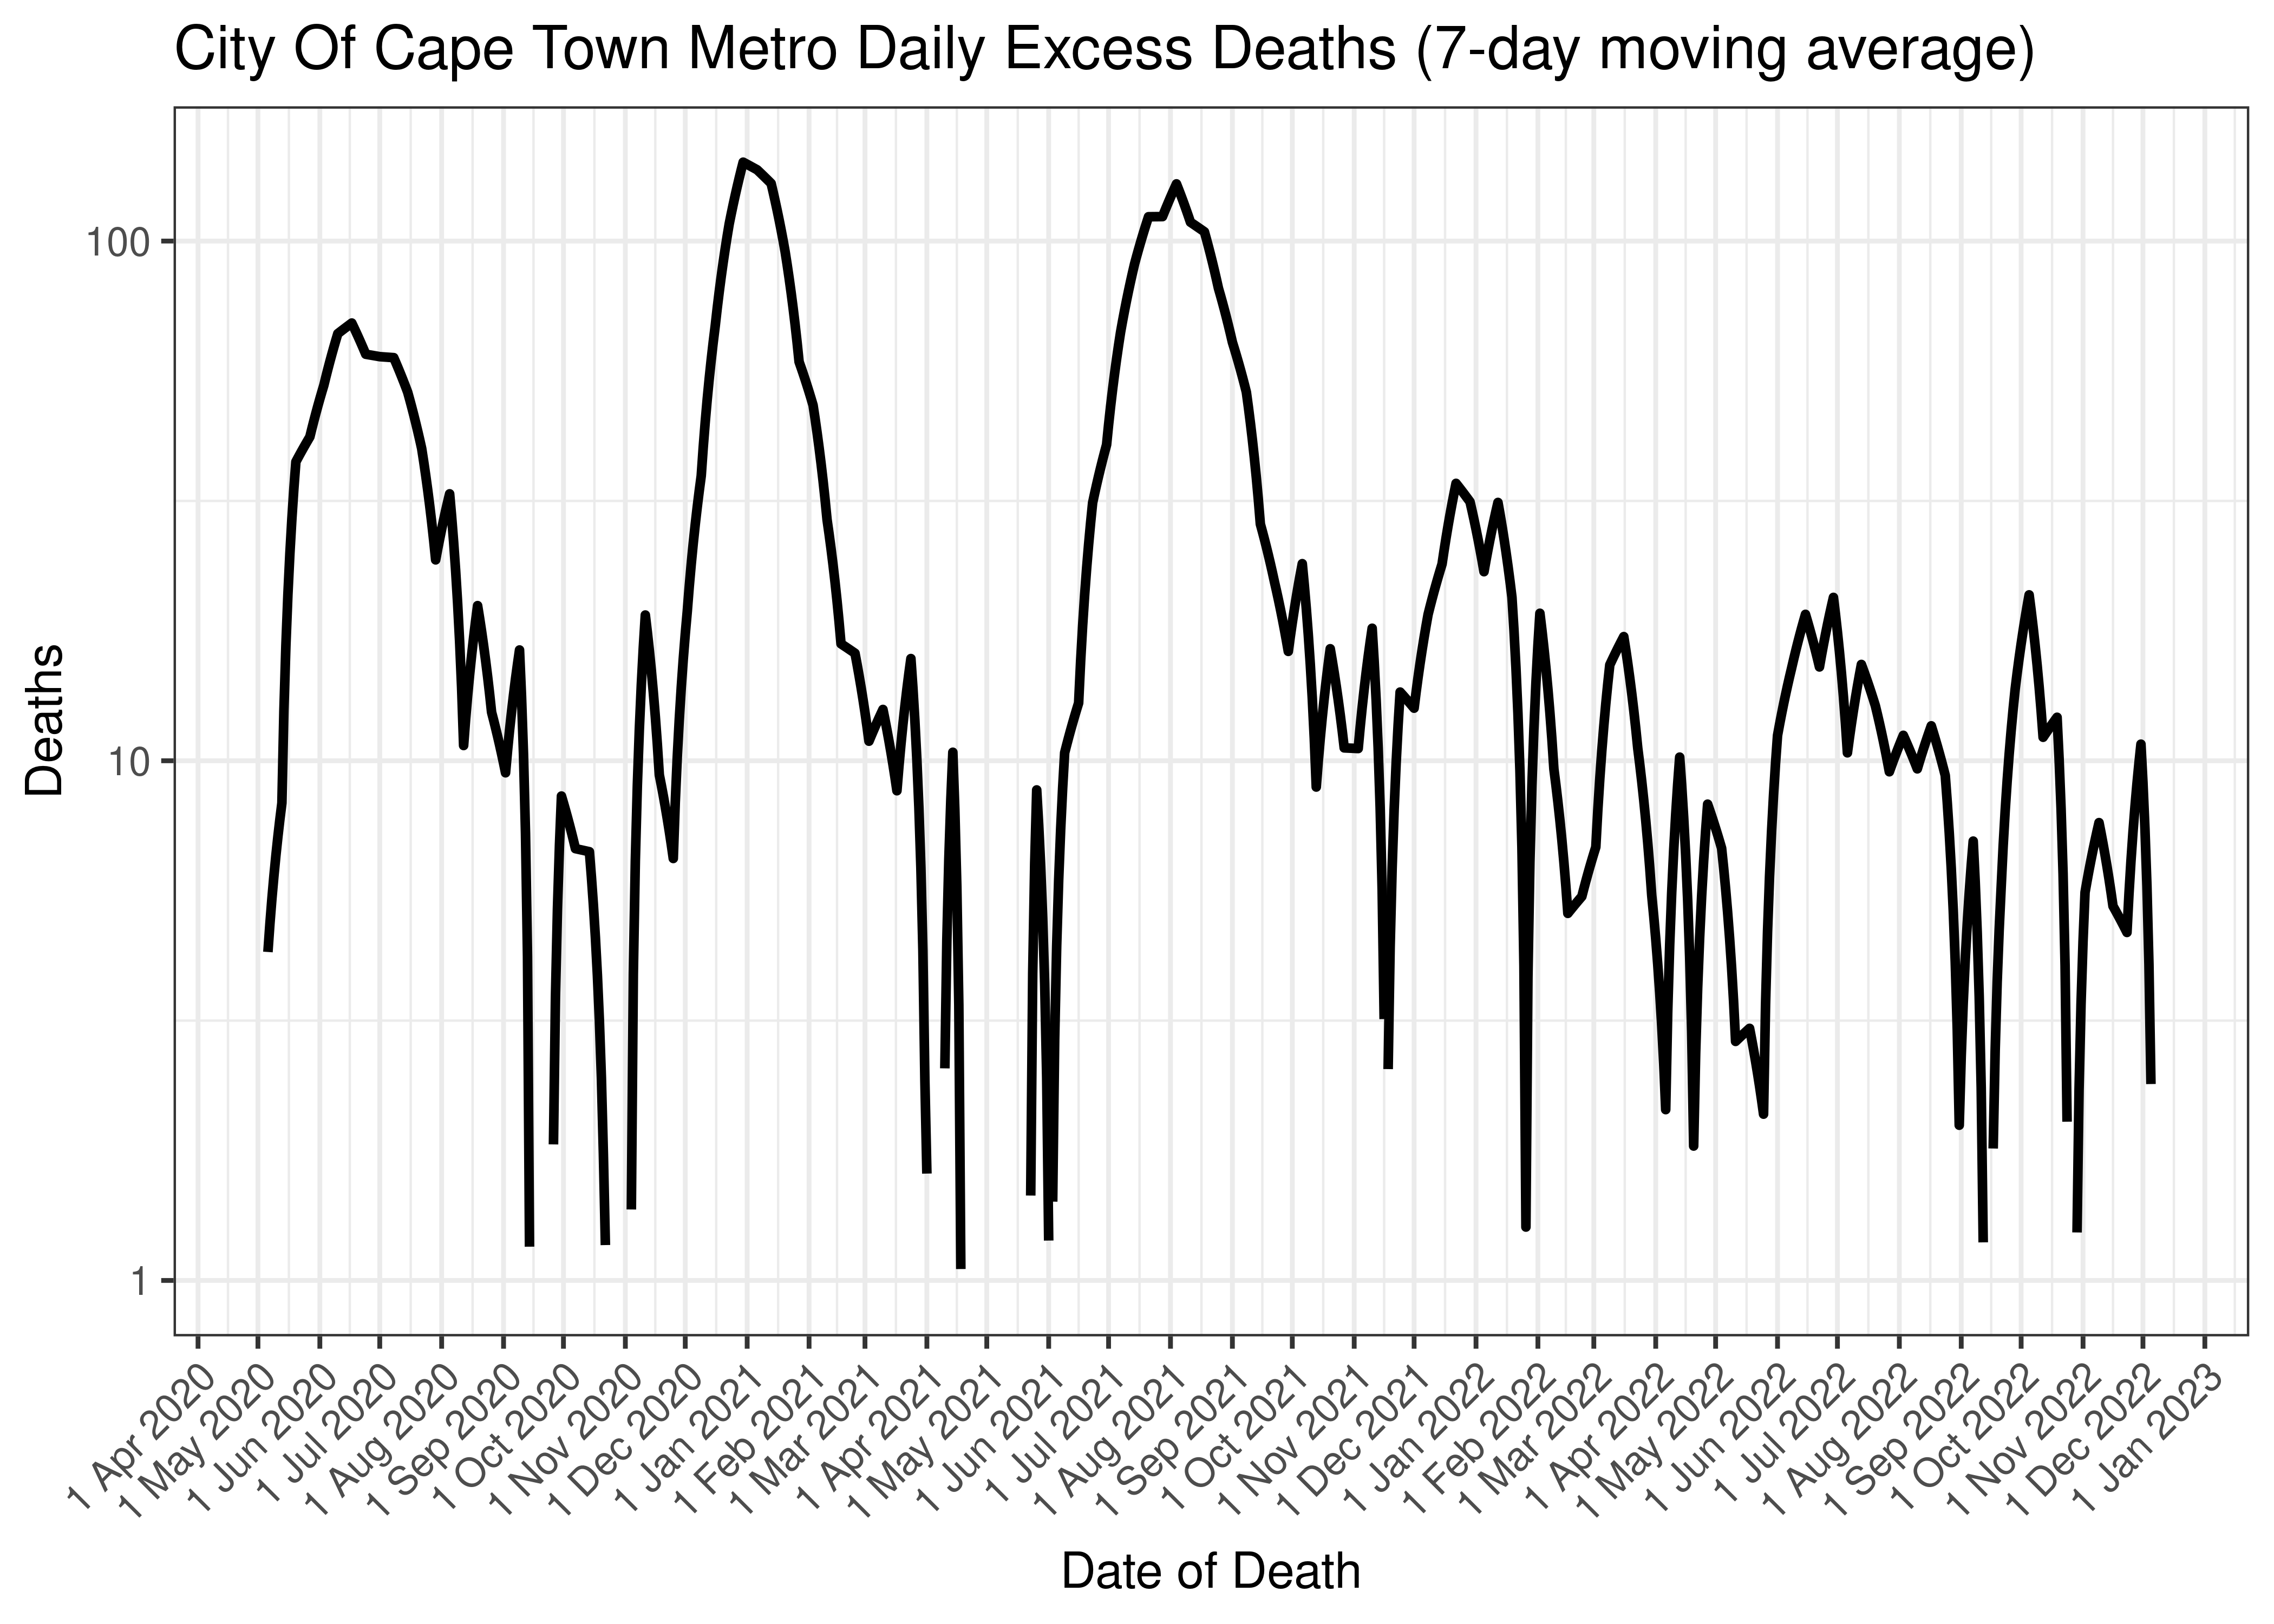
City Of Cape Town Metro Daily Excess Deaths (7-day moving average)
Below the above chart is repeated for the last 30-days:
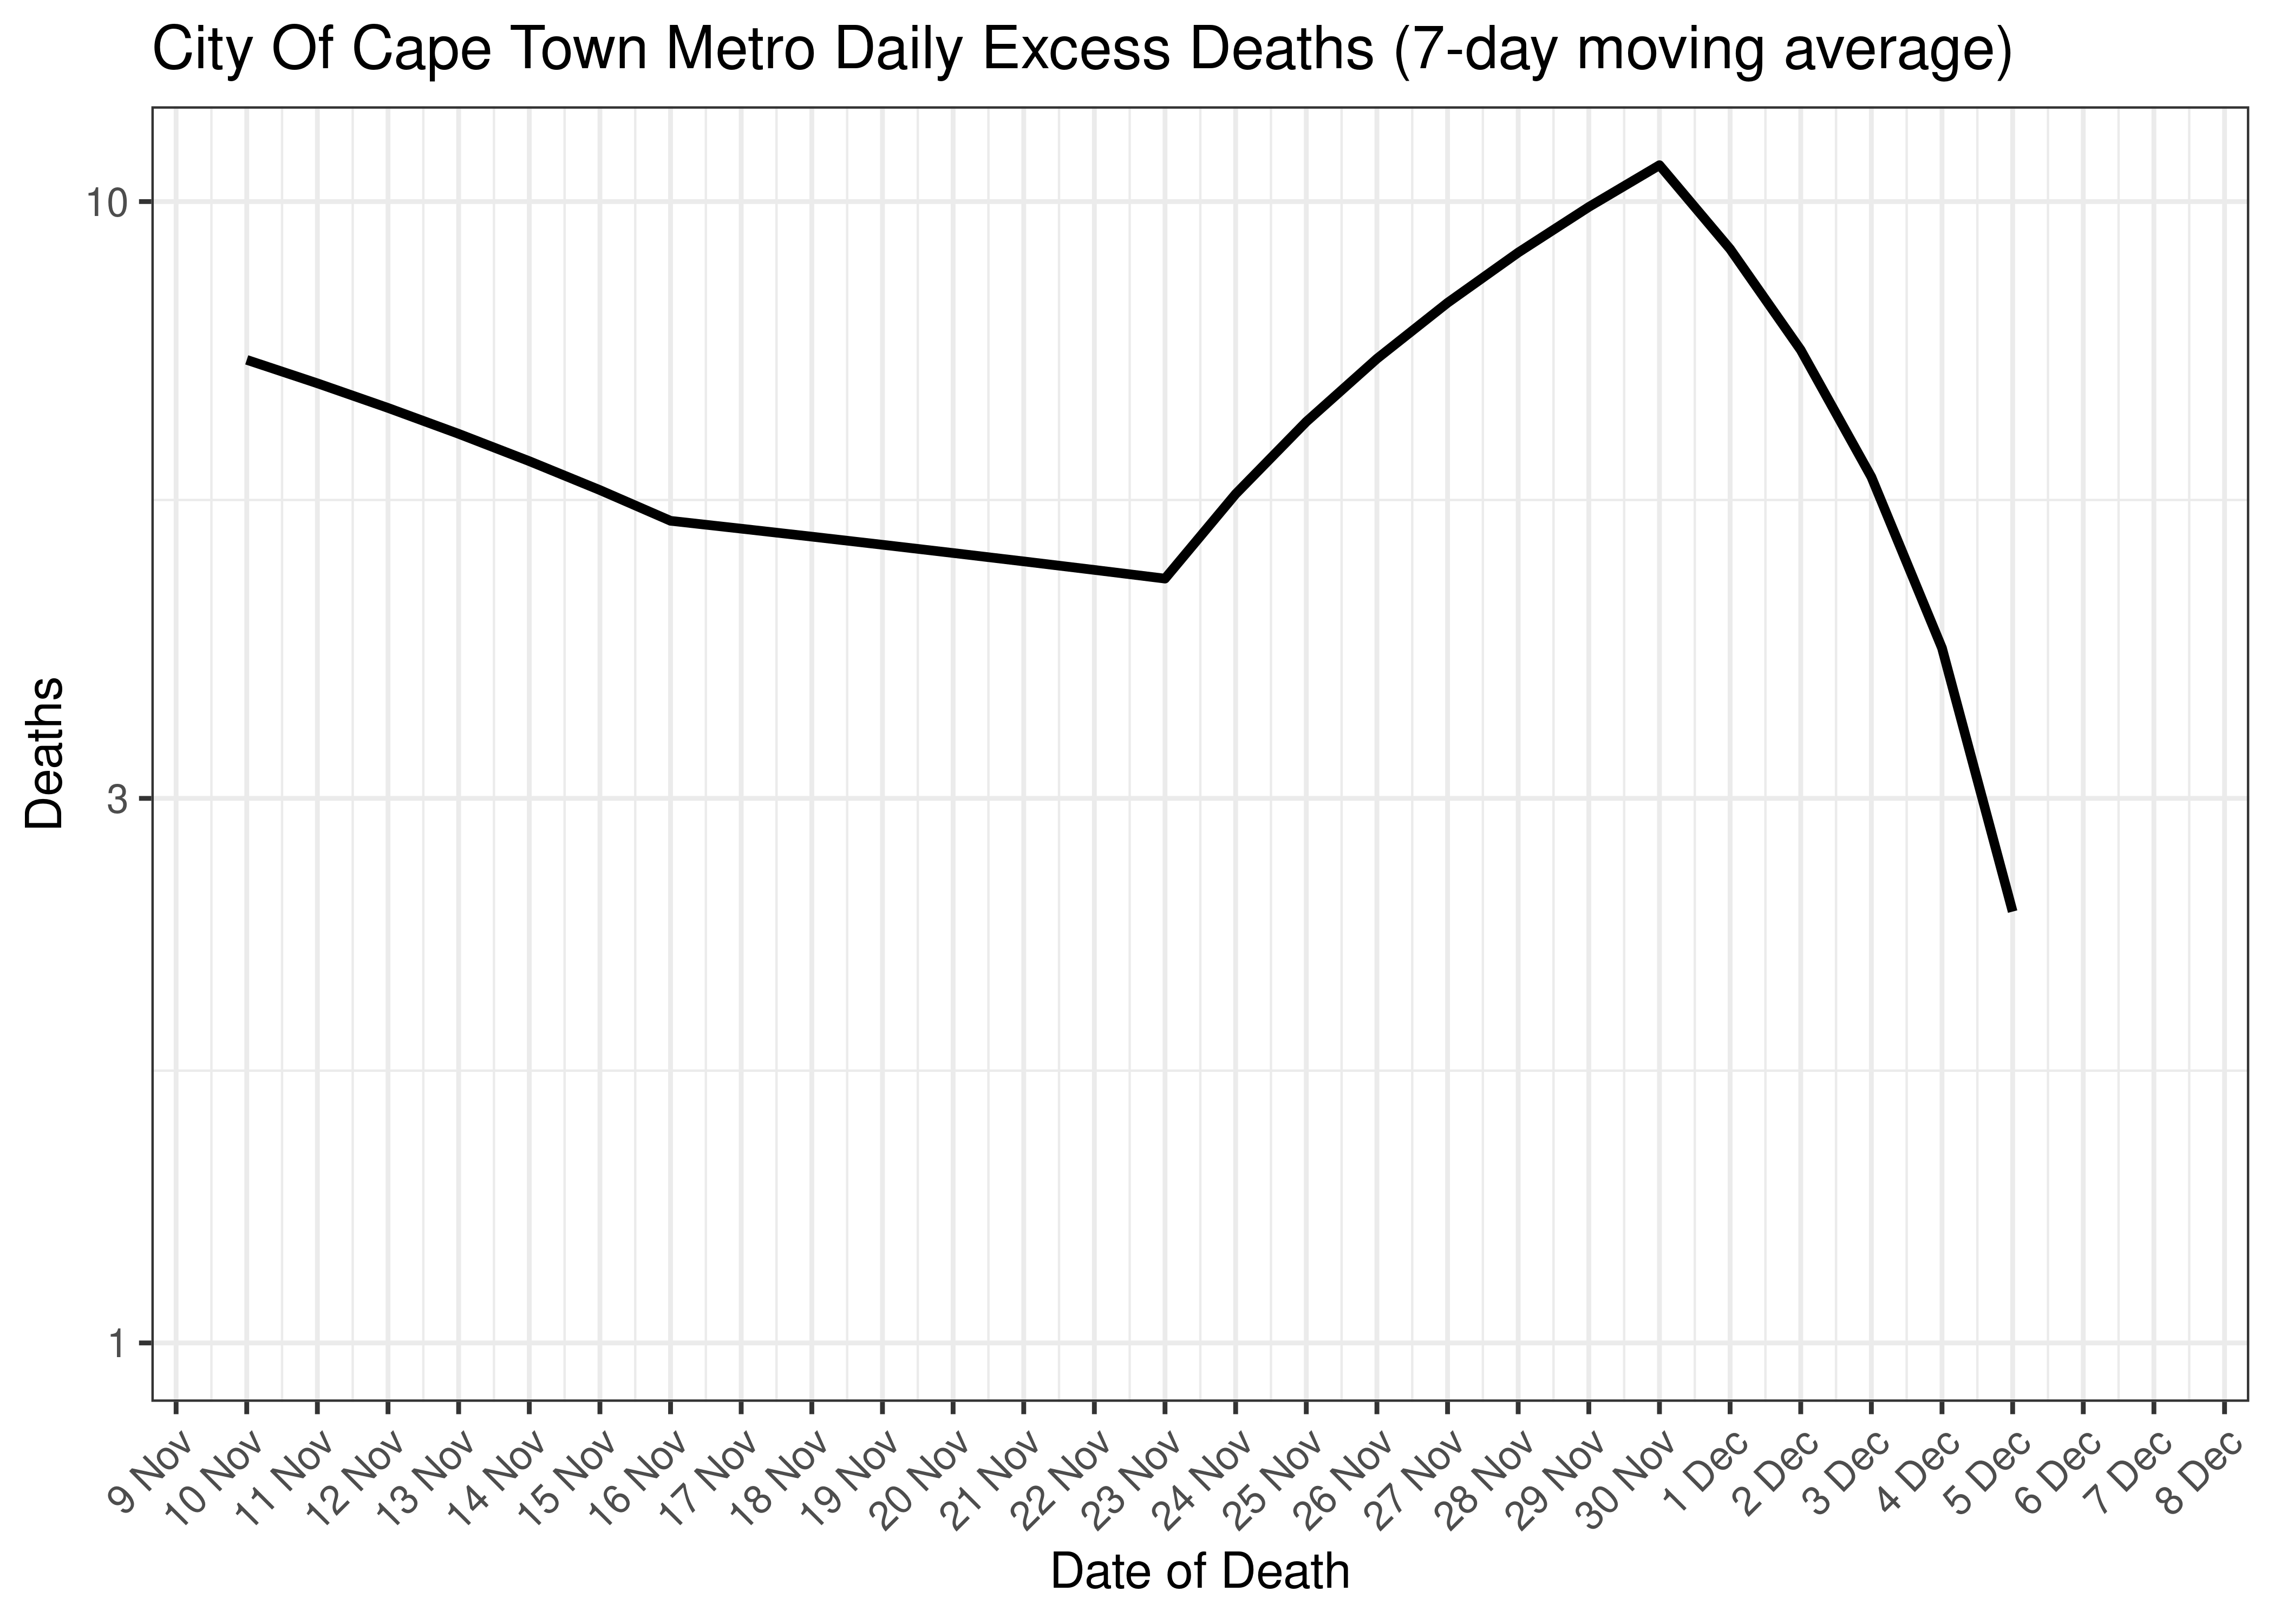
City Of Cape Town Metro Excess Deaths for Last 30-days (7-day moving average)
6.10.10.3 Cases and Excess Deaths Combined
Below a 7-day moving average daily case count and estimated daily excess deaths are plotted for City Of Cape Town Metro on a log scale since start of the epidemic:
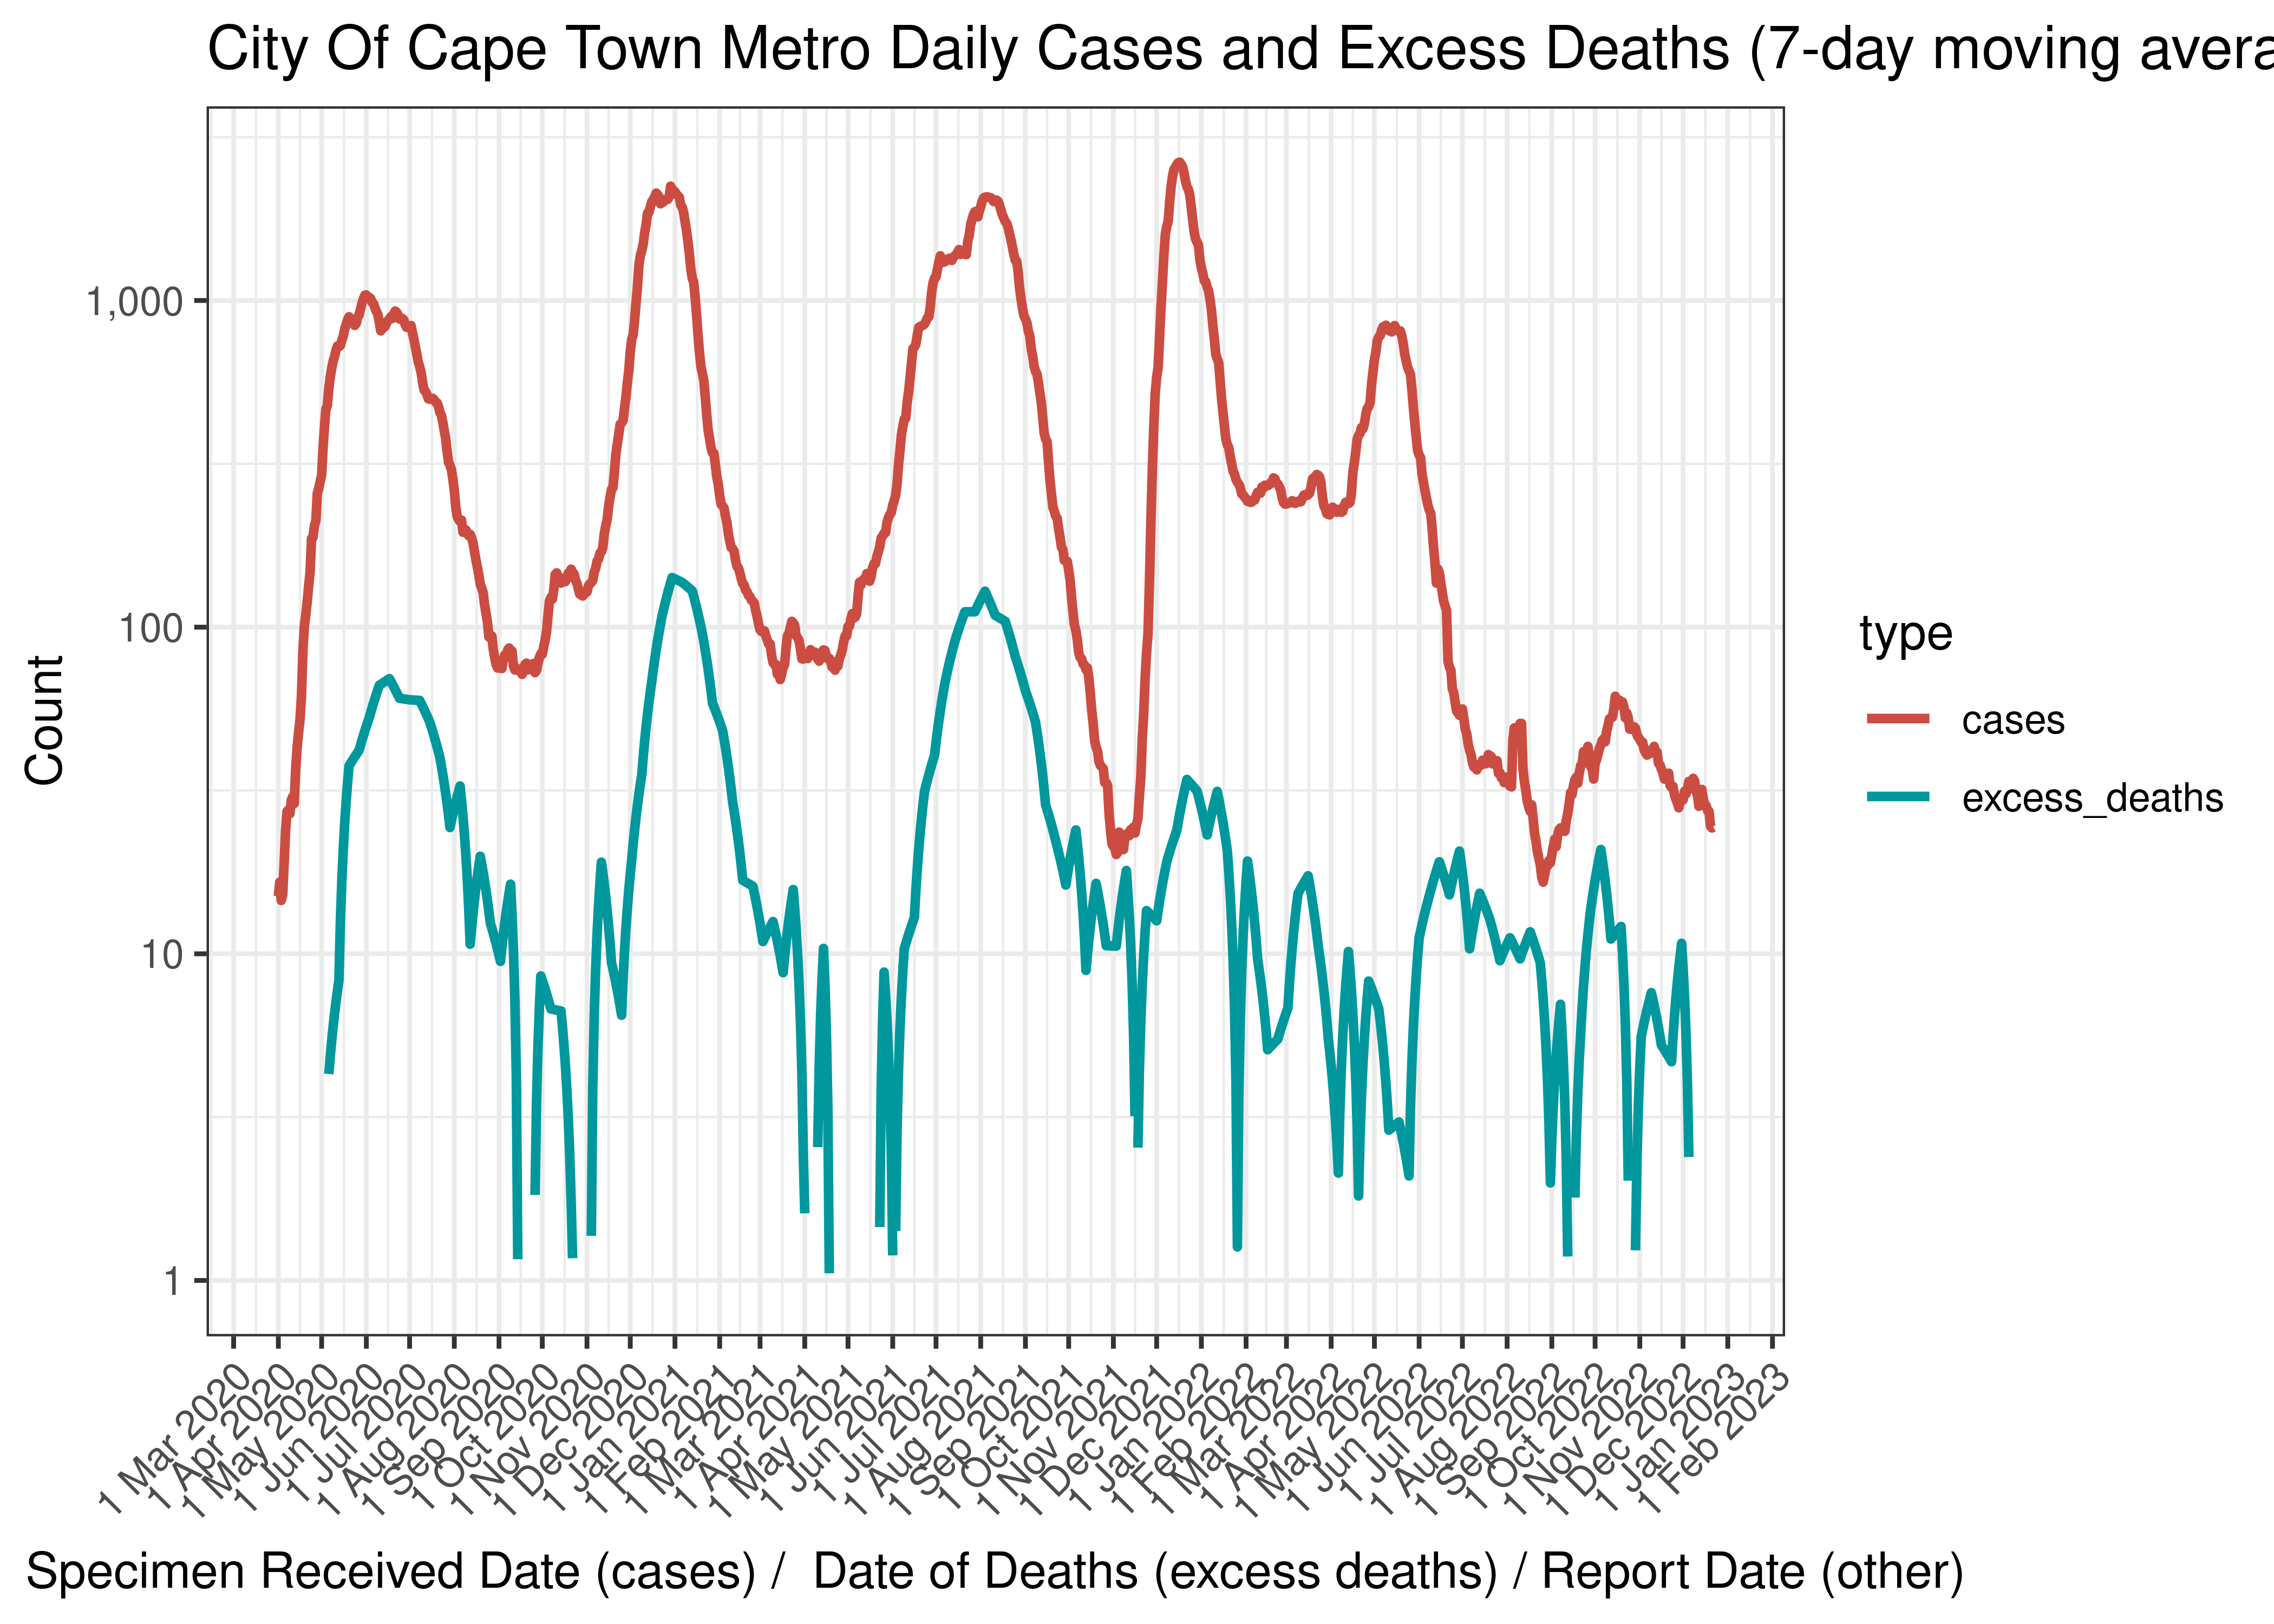
City Of Cape Town Metro Daily Cases and Excess Deaths (7-day moving average)
Below the above chart is repeated for the last 30-days:
City Of Cape Town Metro Daily Cases and Deaths (if available) for Last 30-days (7-day moving average)
6.10.10.4 Reproduction Number
Below current (last weekly) reproduction number estimates are tabulated for City Of Cape Town Metro.
| Count (Per Day) | Week Ending | Reproduction Number [95% Confidence Interval] | |
|---|---|---|---|
| City Of Cape Town Metro | 24.4 | 2022-12-25 | 0.87 [0.74 - 1.01] |
Below the effective reproduction number for City Of Cape Town Metro over the last 90 days are plotted together with a plot since start of the pandemic.
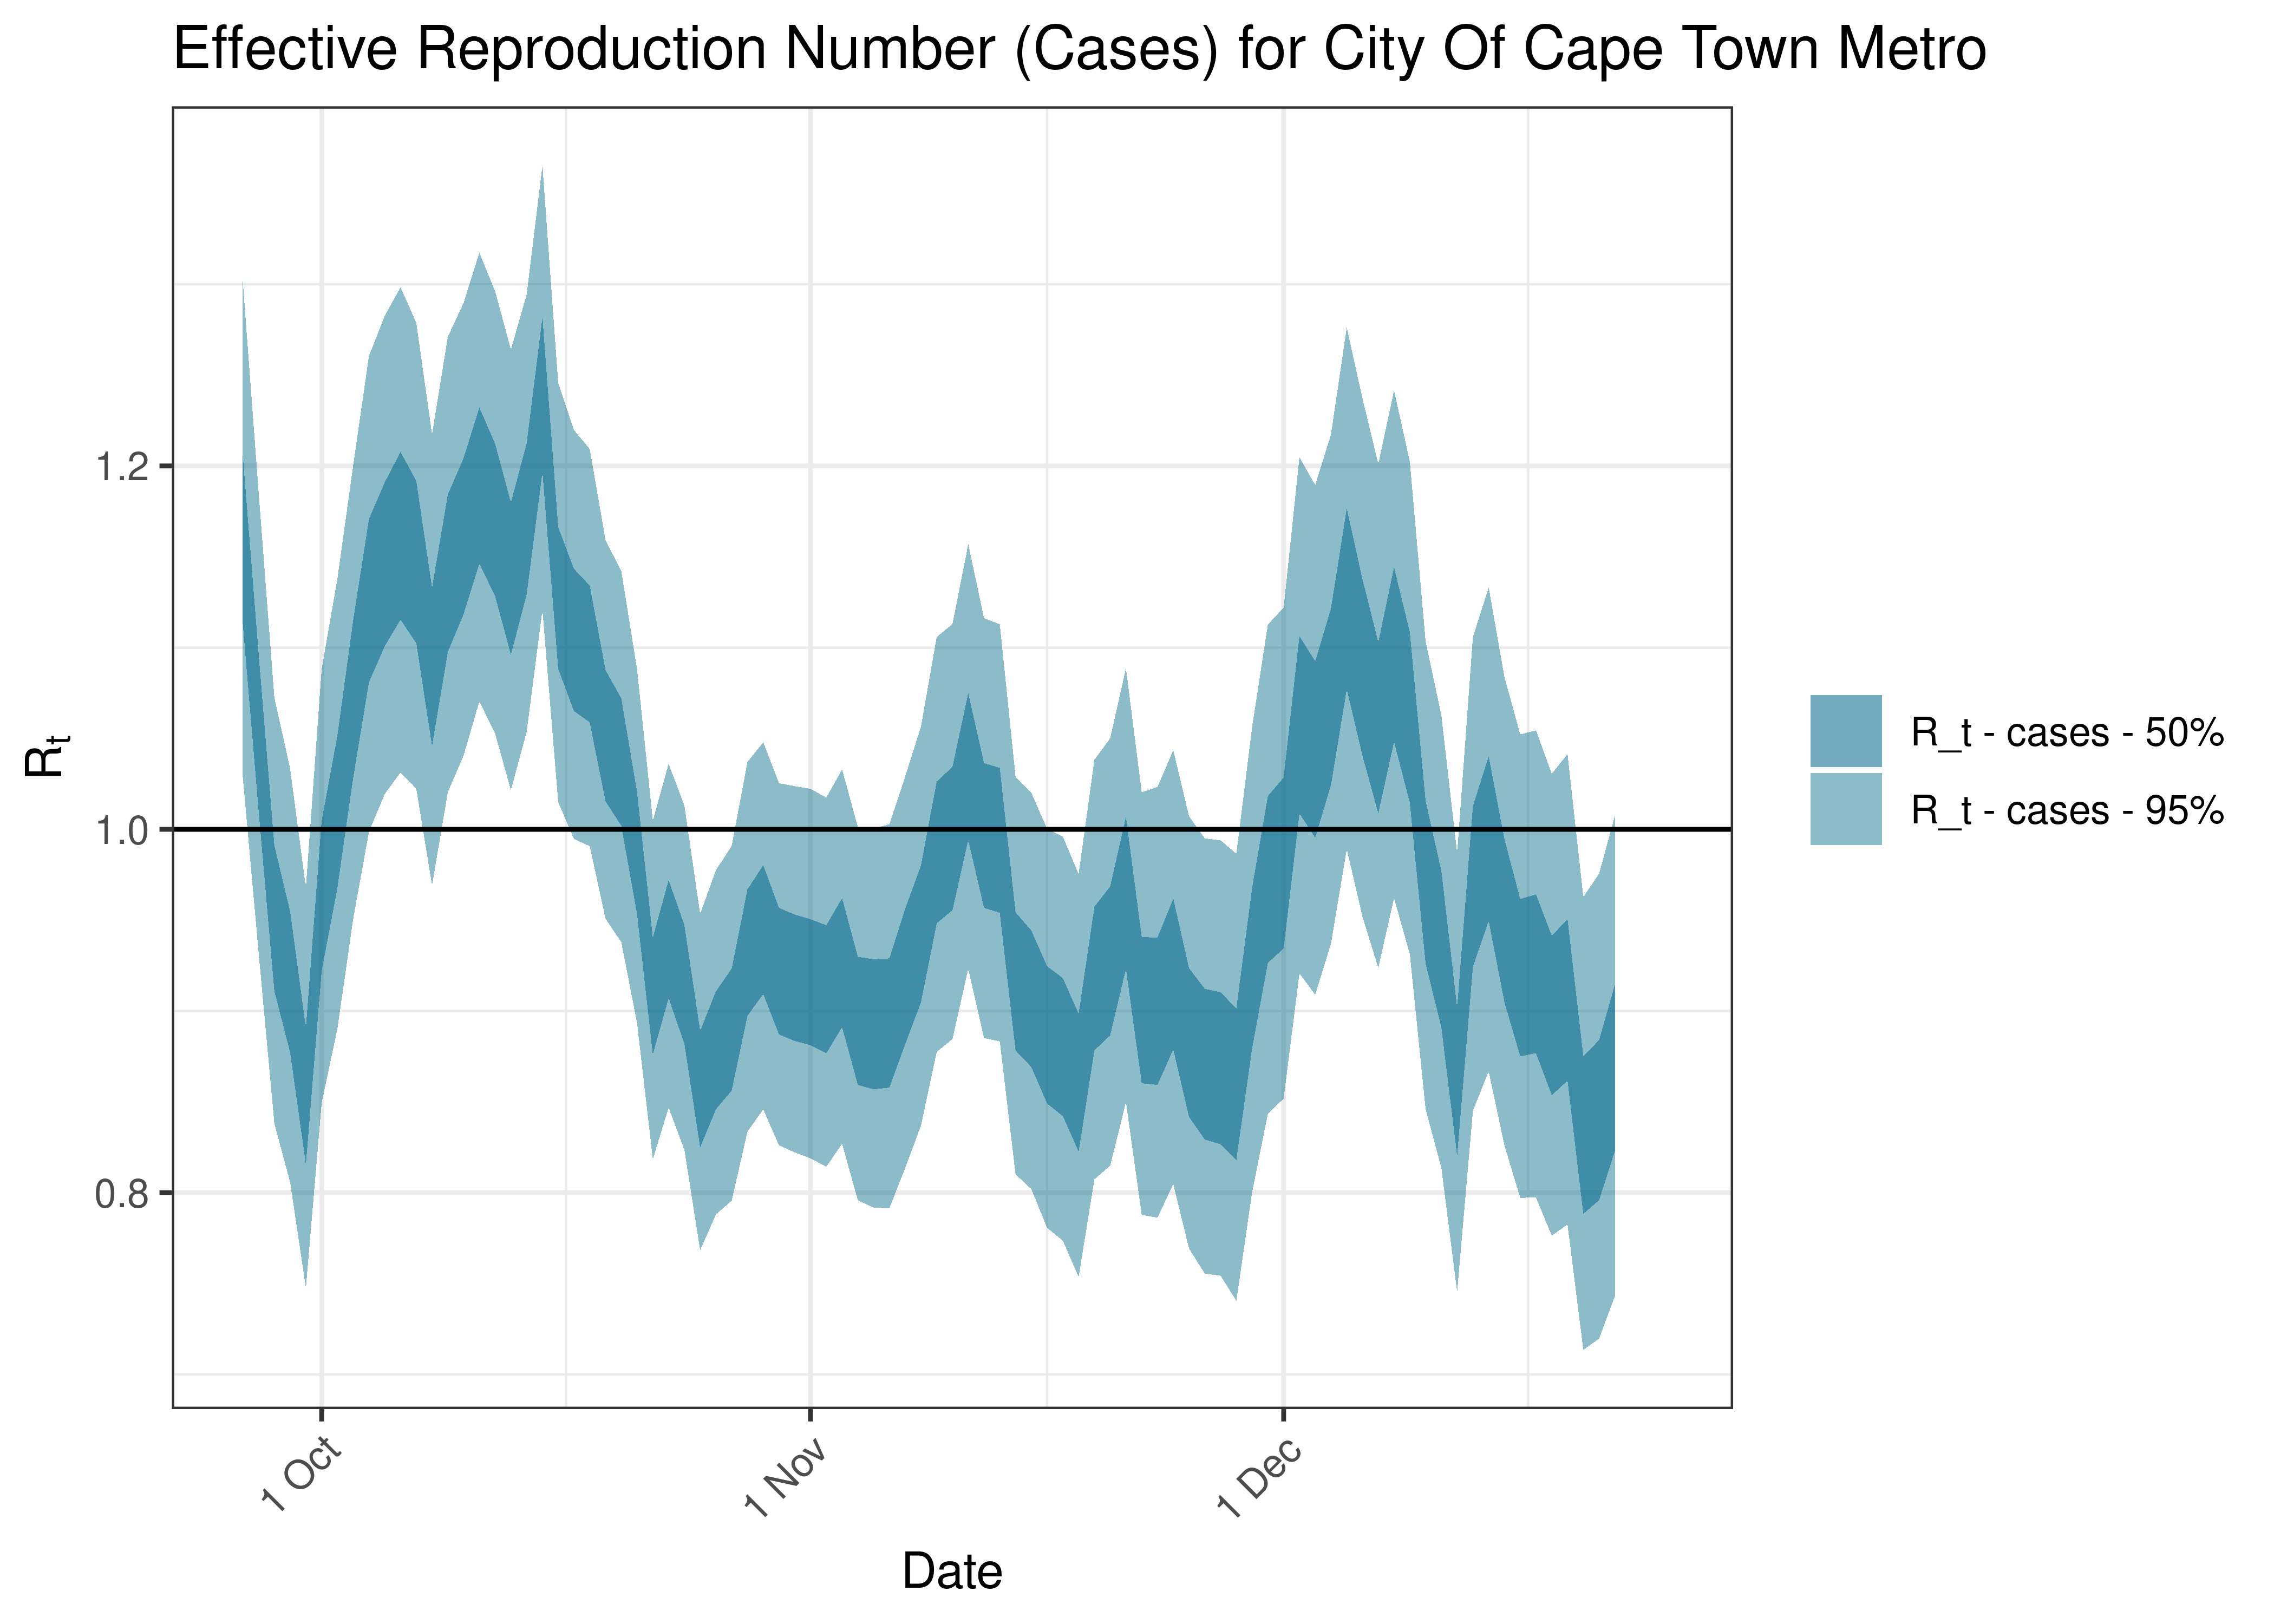
Estimated Effective Reproduction Number Based on Cases for City Of Cape Town Metro over last 90 days
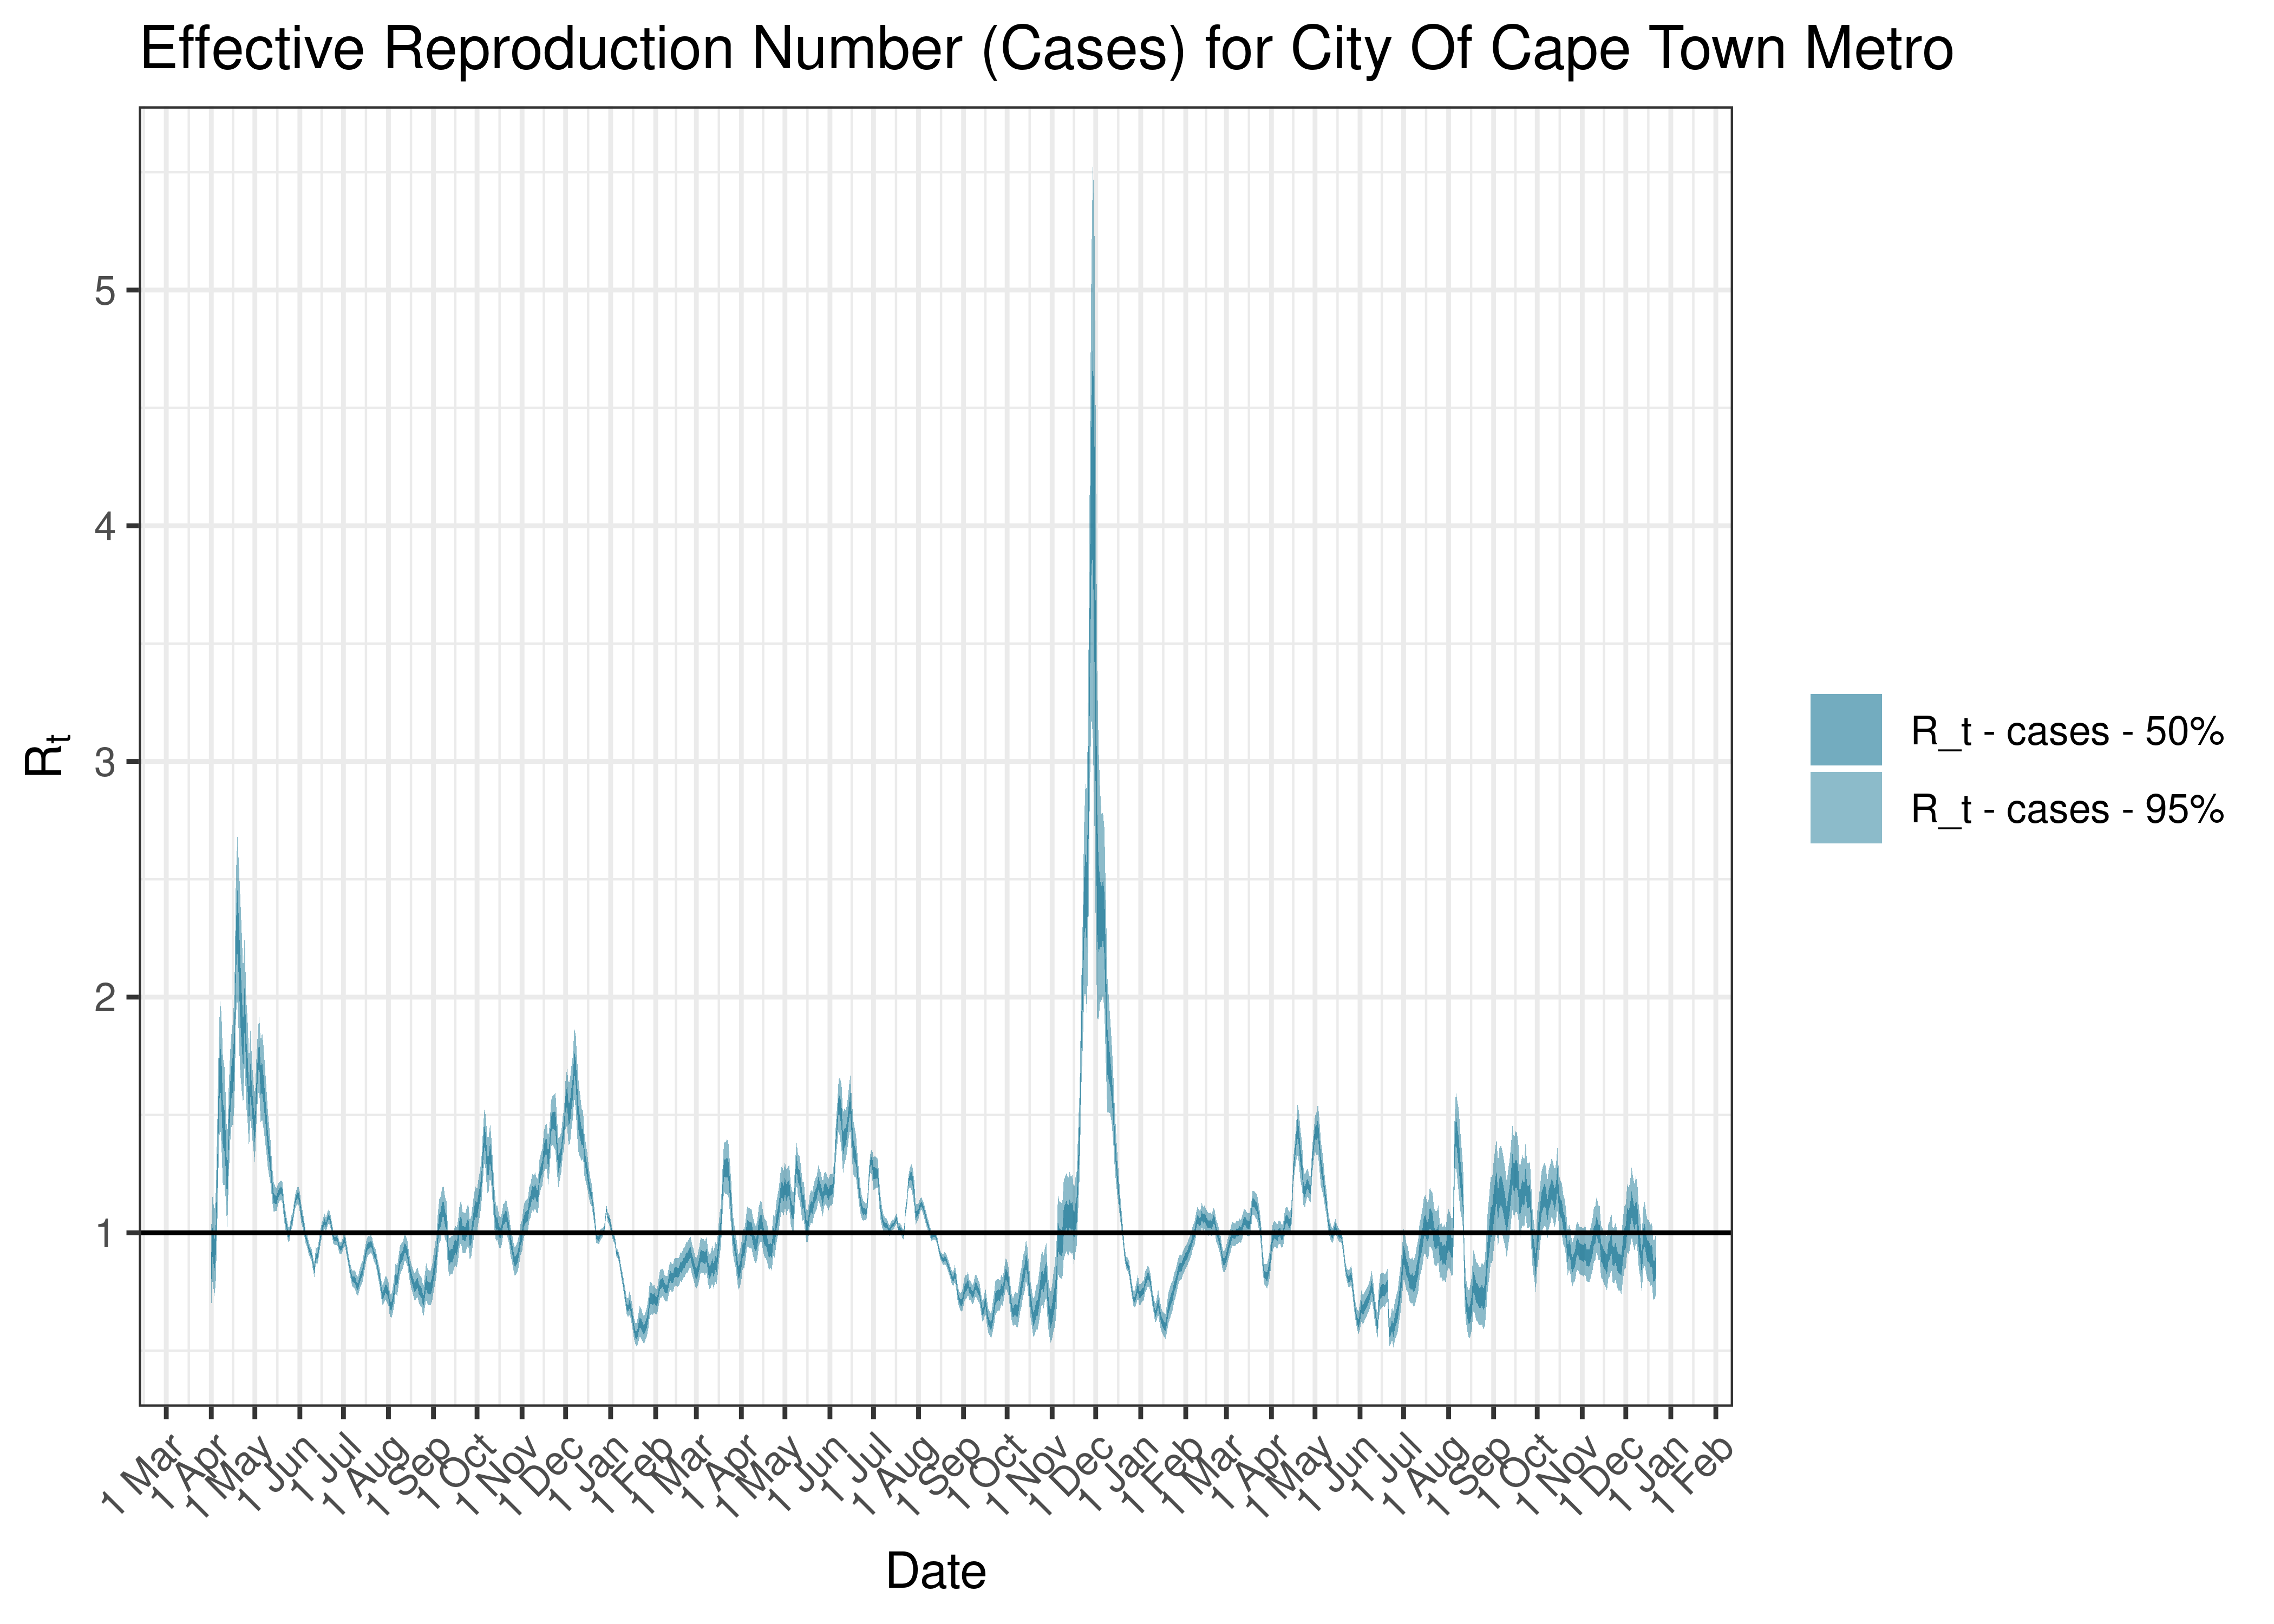
Estimated Effective Reproduction Number Based on Cases for City Of Cape Town Metro since 1 April 2020
6.10.11 Garden Route
6.10.11.1 Cases
Cases are tabulated by specimen received date below. Cases include estimates for late reporting in recent days as well as adjustments for any public holidays. A centred 7-day moving average is also shown. The peak daily cases in previous waves (as measured by the moving average) is also shown.
| Specimen Received Date | Cases | 7-day Moving Average | Comment |
|---|---|---|---|
| 2020-07-22 | 236 | 198 | Wave 1 Peak |
| 2020-12-10 | 461 | 397 | Wave 2 Peak |
| 2021-08-02 | 404 | 406 | Wave 3 Peak |
| 2021-12-19 | 69 | 425 | Wave 4 Peak |
| 2022-05-16 | 128 | 90 | Wave 5 Peak (to date) |
Below a 7-day moving average daily case count are plotted for Garden Route on a log scale since start of the epidemic:
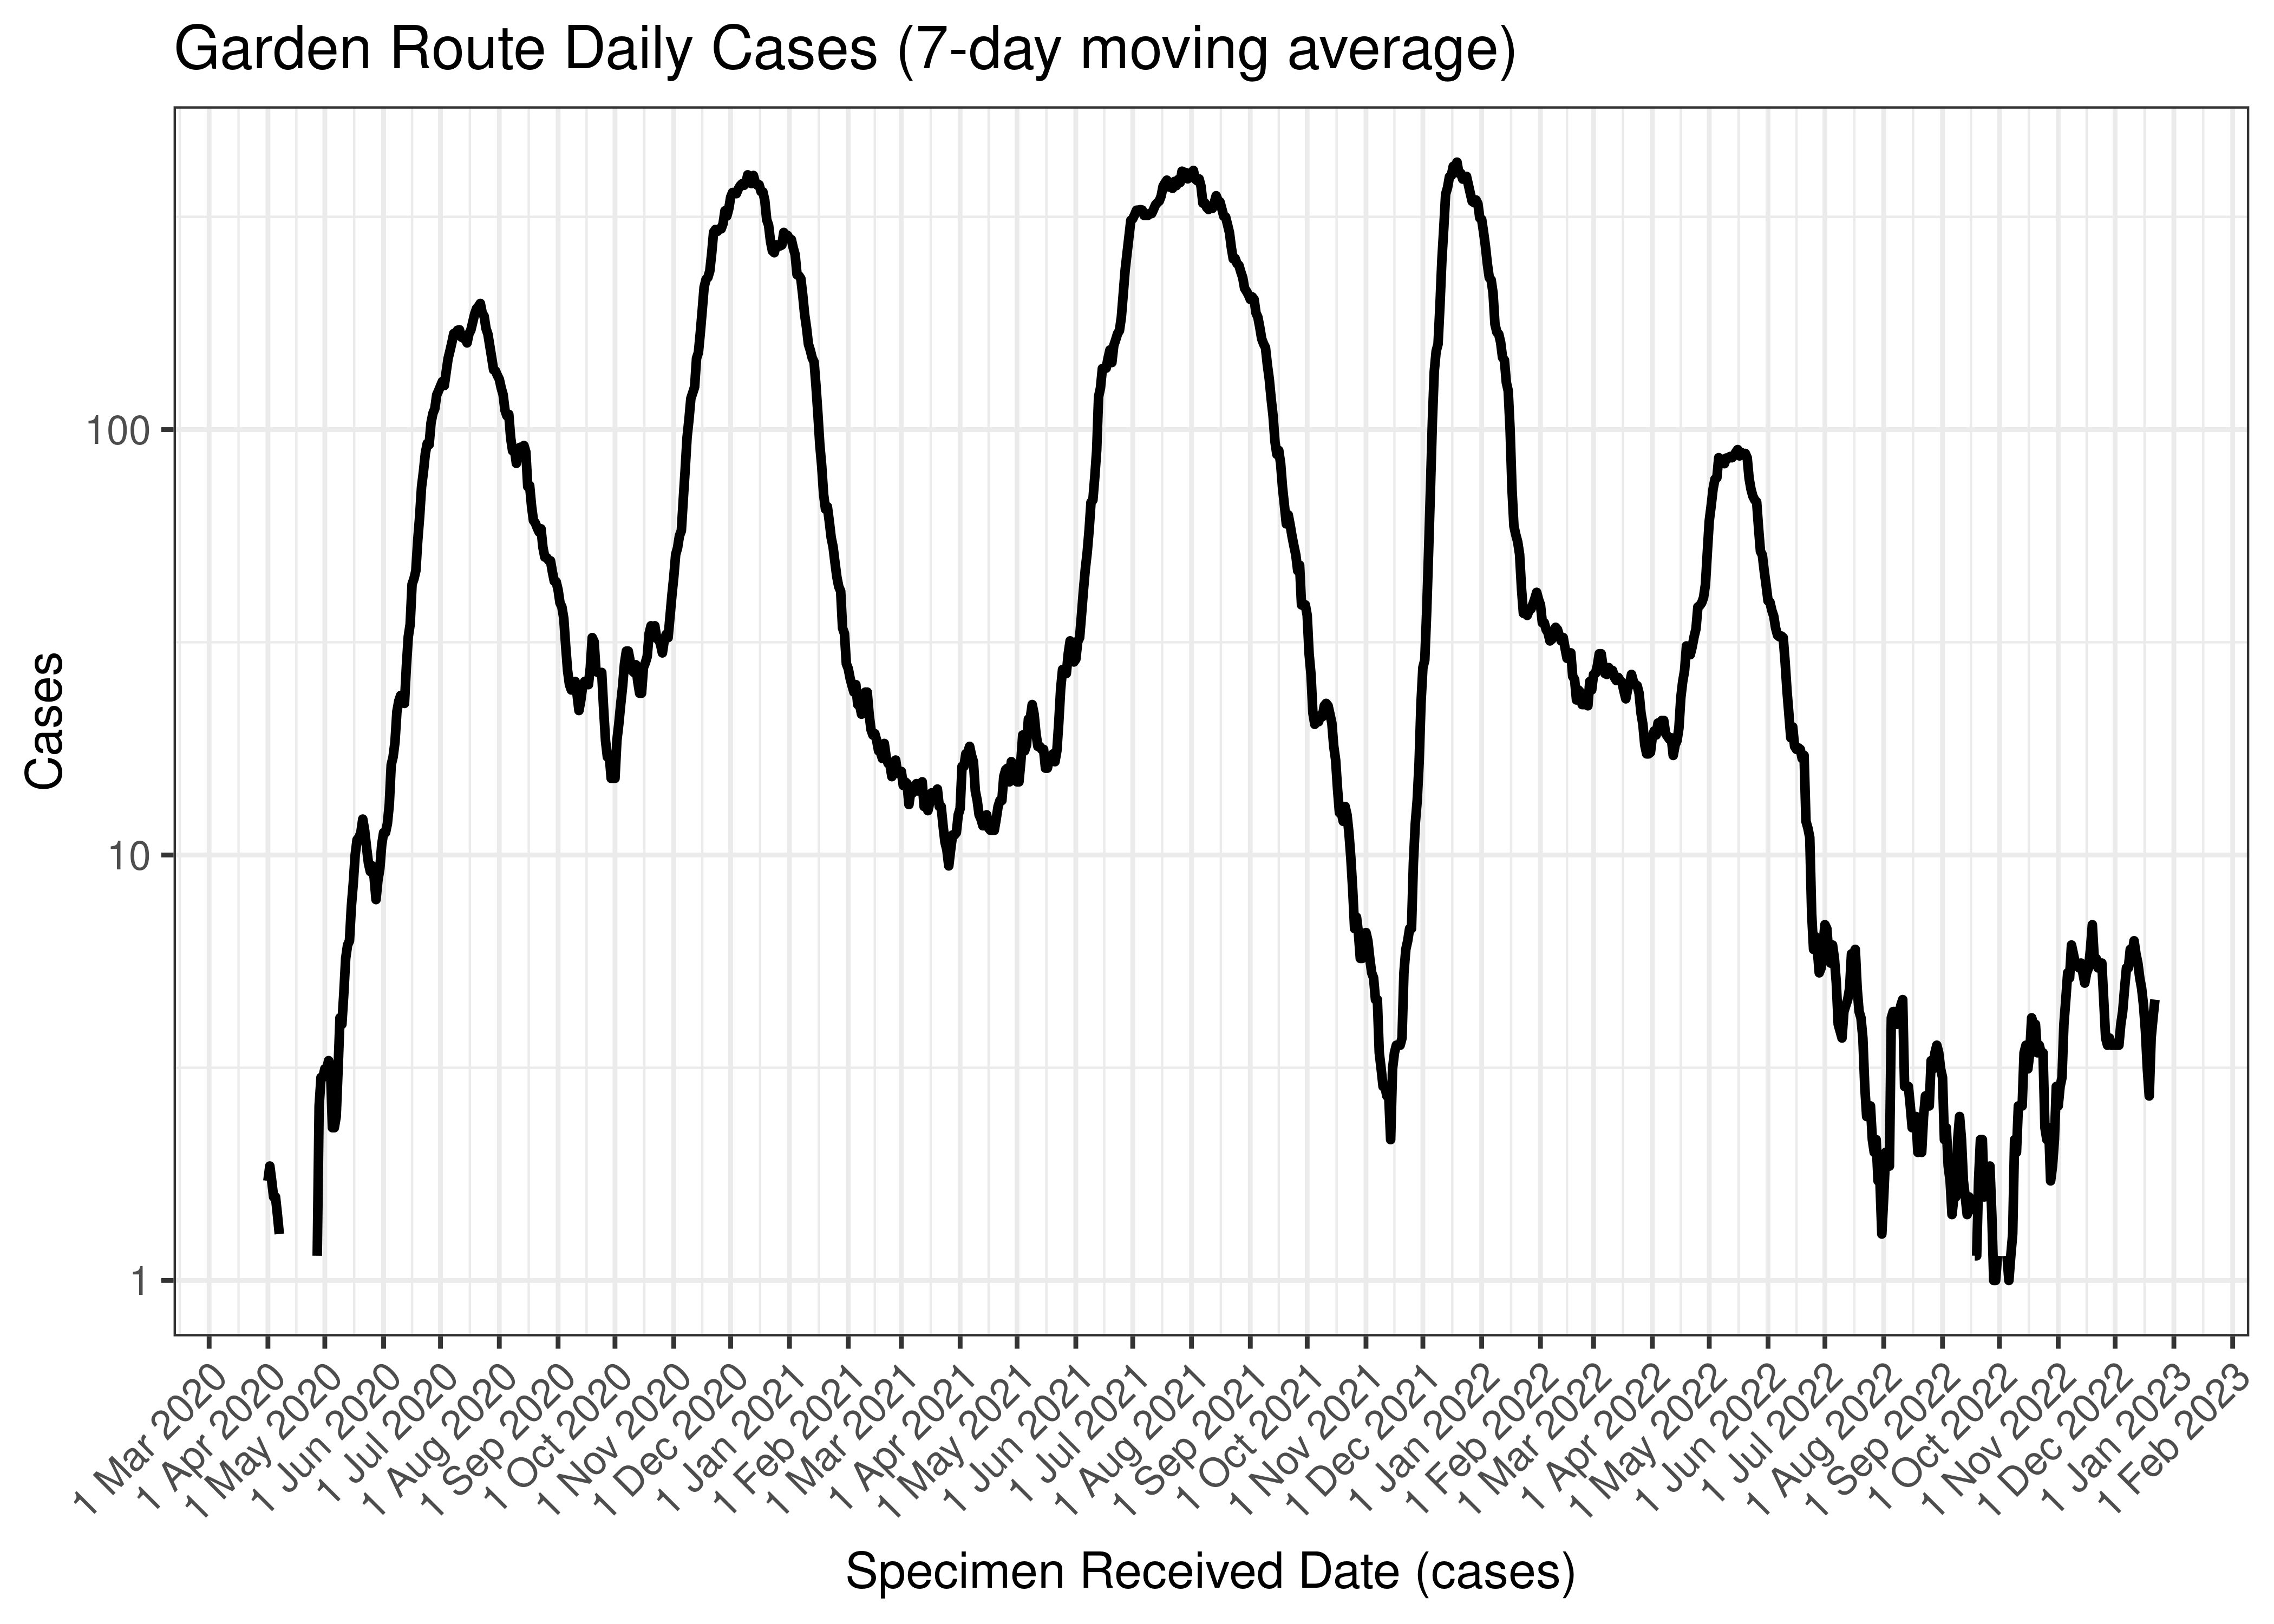
Garden Route Daily Cases (7-day moving average)
Below the above chart is repeated for the last 30-days:

Garden Route Daily Cases for Last 30-days (7-day moving average)
6.10.11.2 Reproduction Number
Below current (last weekly) reproduction number estimates are tabulated for Garden Route.
| Count (Per Day) | Week Ending | Reproduction Number [95% Confidence Interval] | |
|---|---|---|---|
| Garden Route | 4.6 | 2022-12-25 | 1.18 [0.81 - 1.63] |
Below the effective reproduction number for Garden Route over the last 90 days are plotted together with a plot since start of the pandemic.
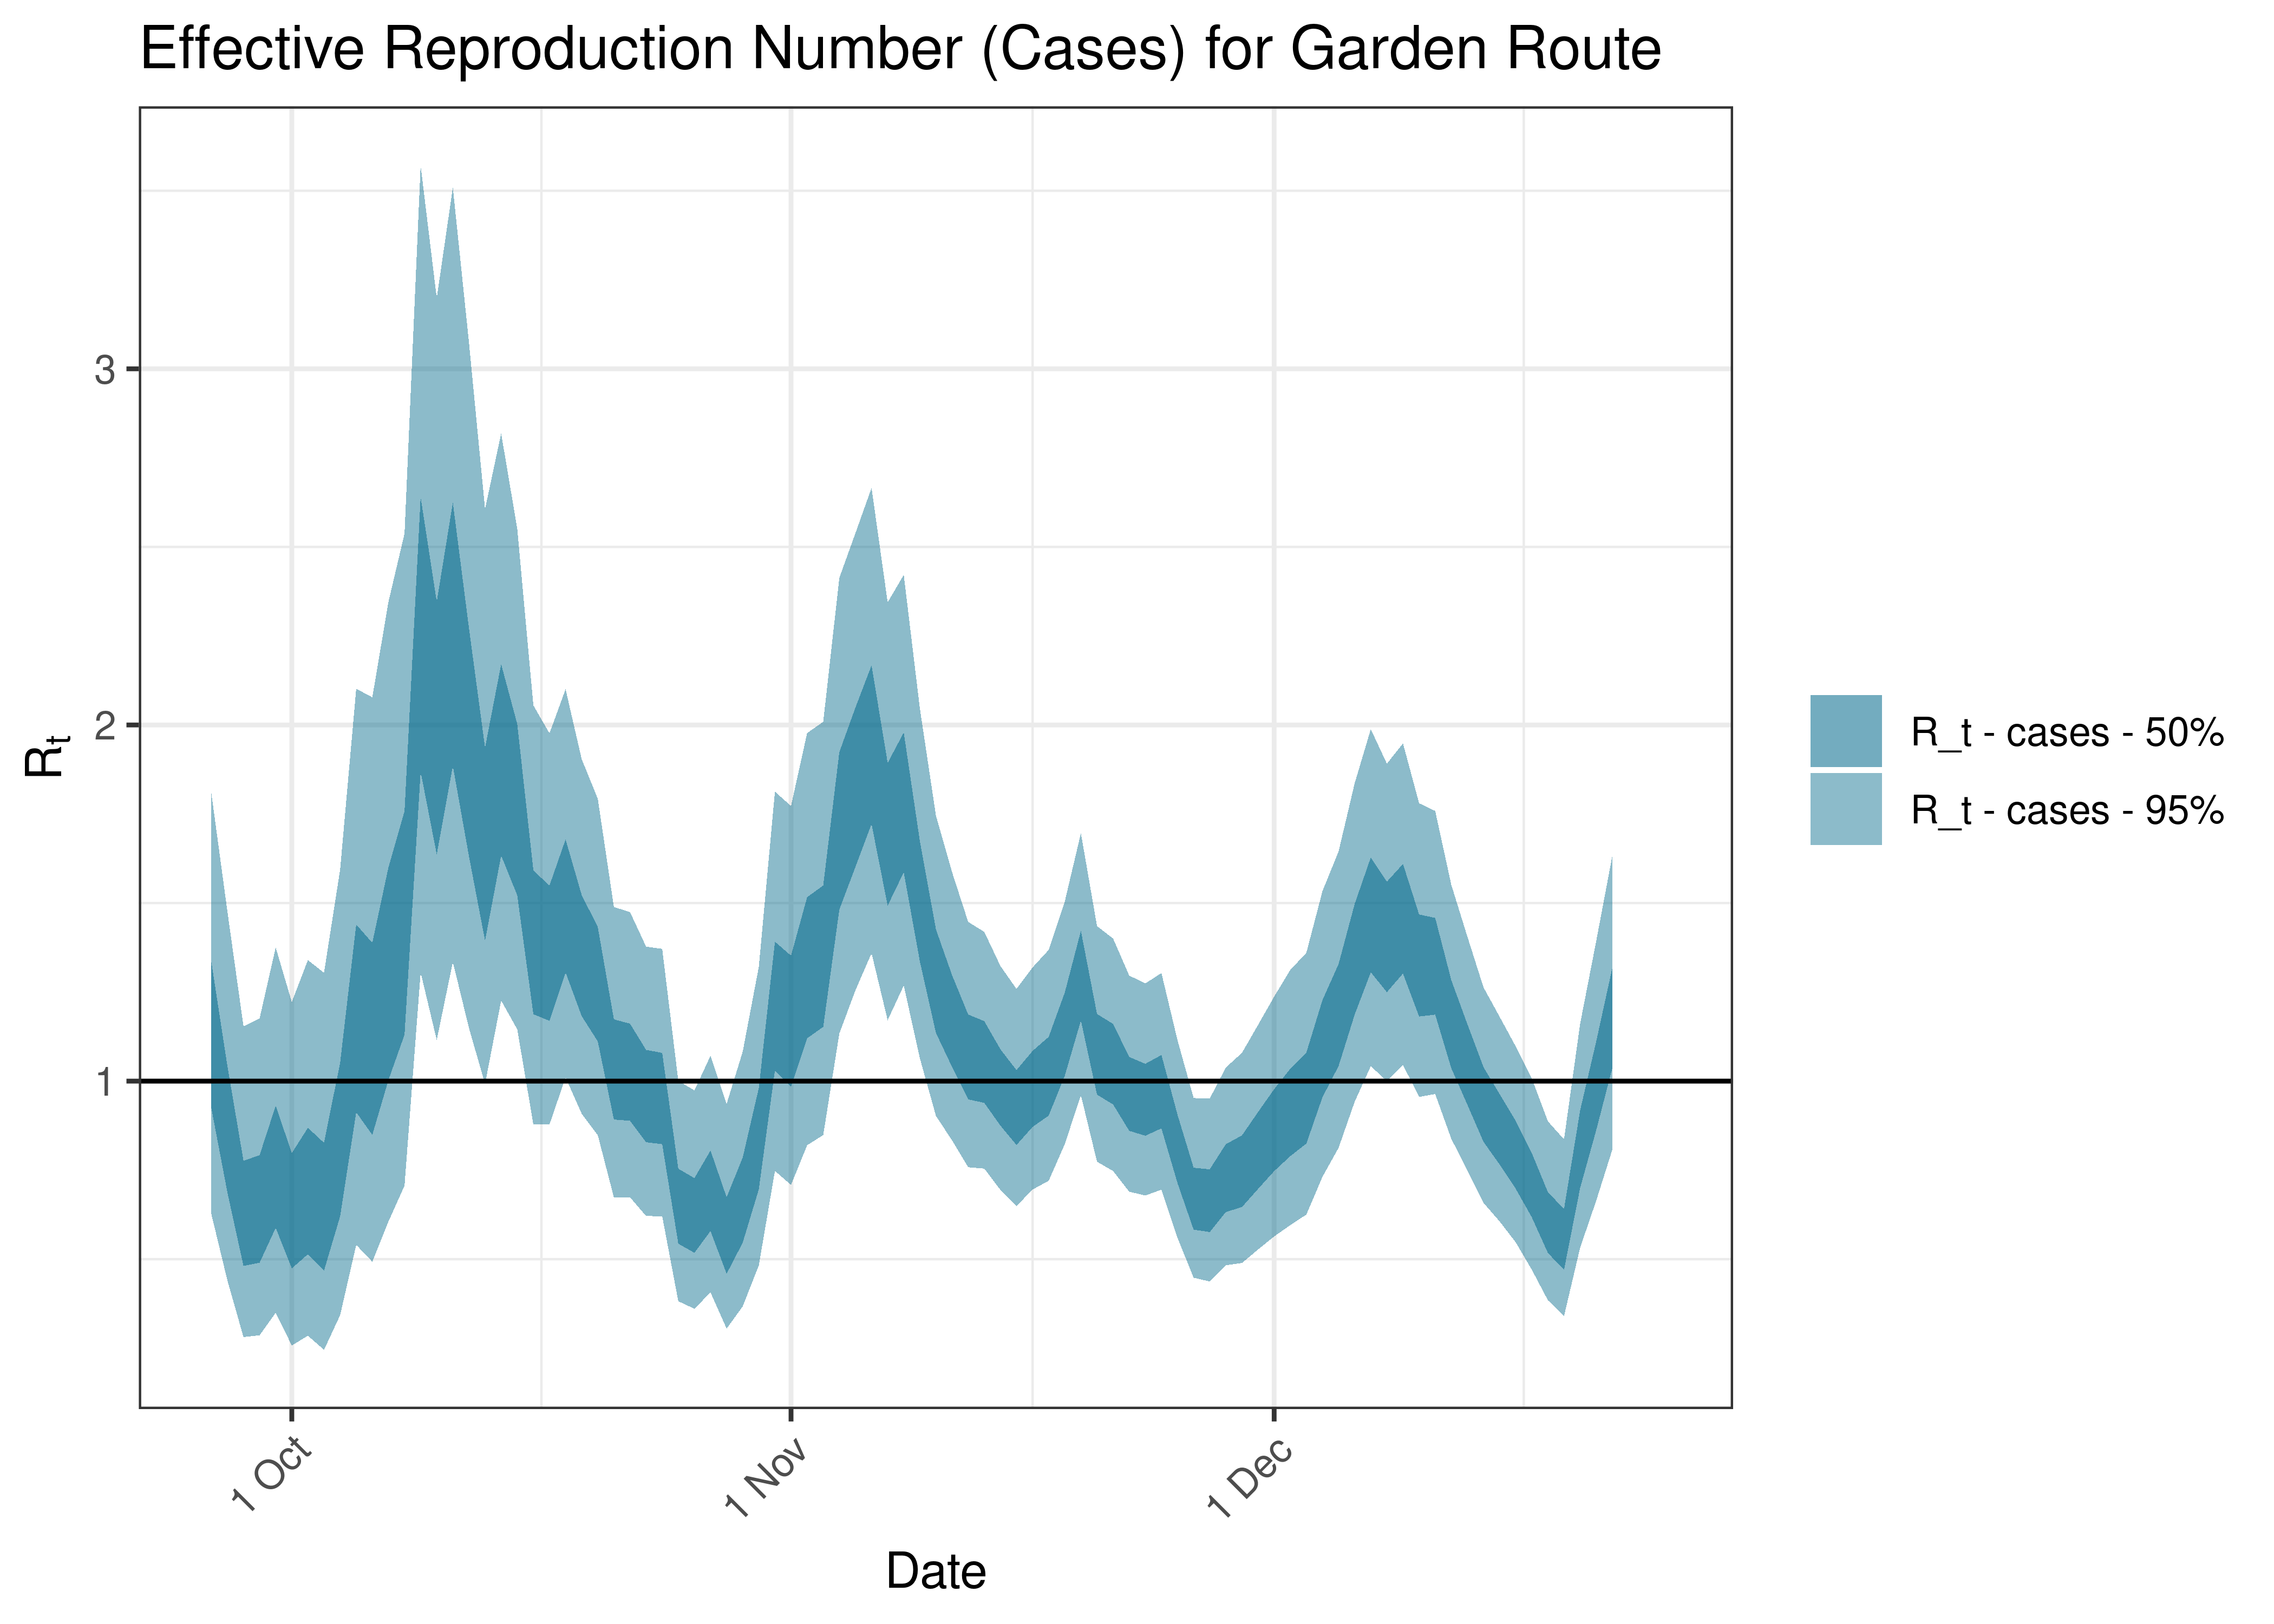
Estimated Effective Reproduction Number Based on Cases for Garden Route over last 90 days
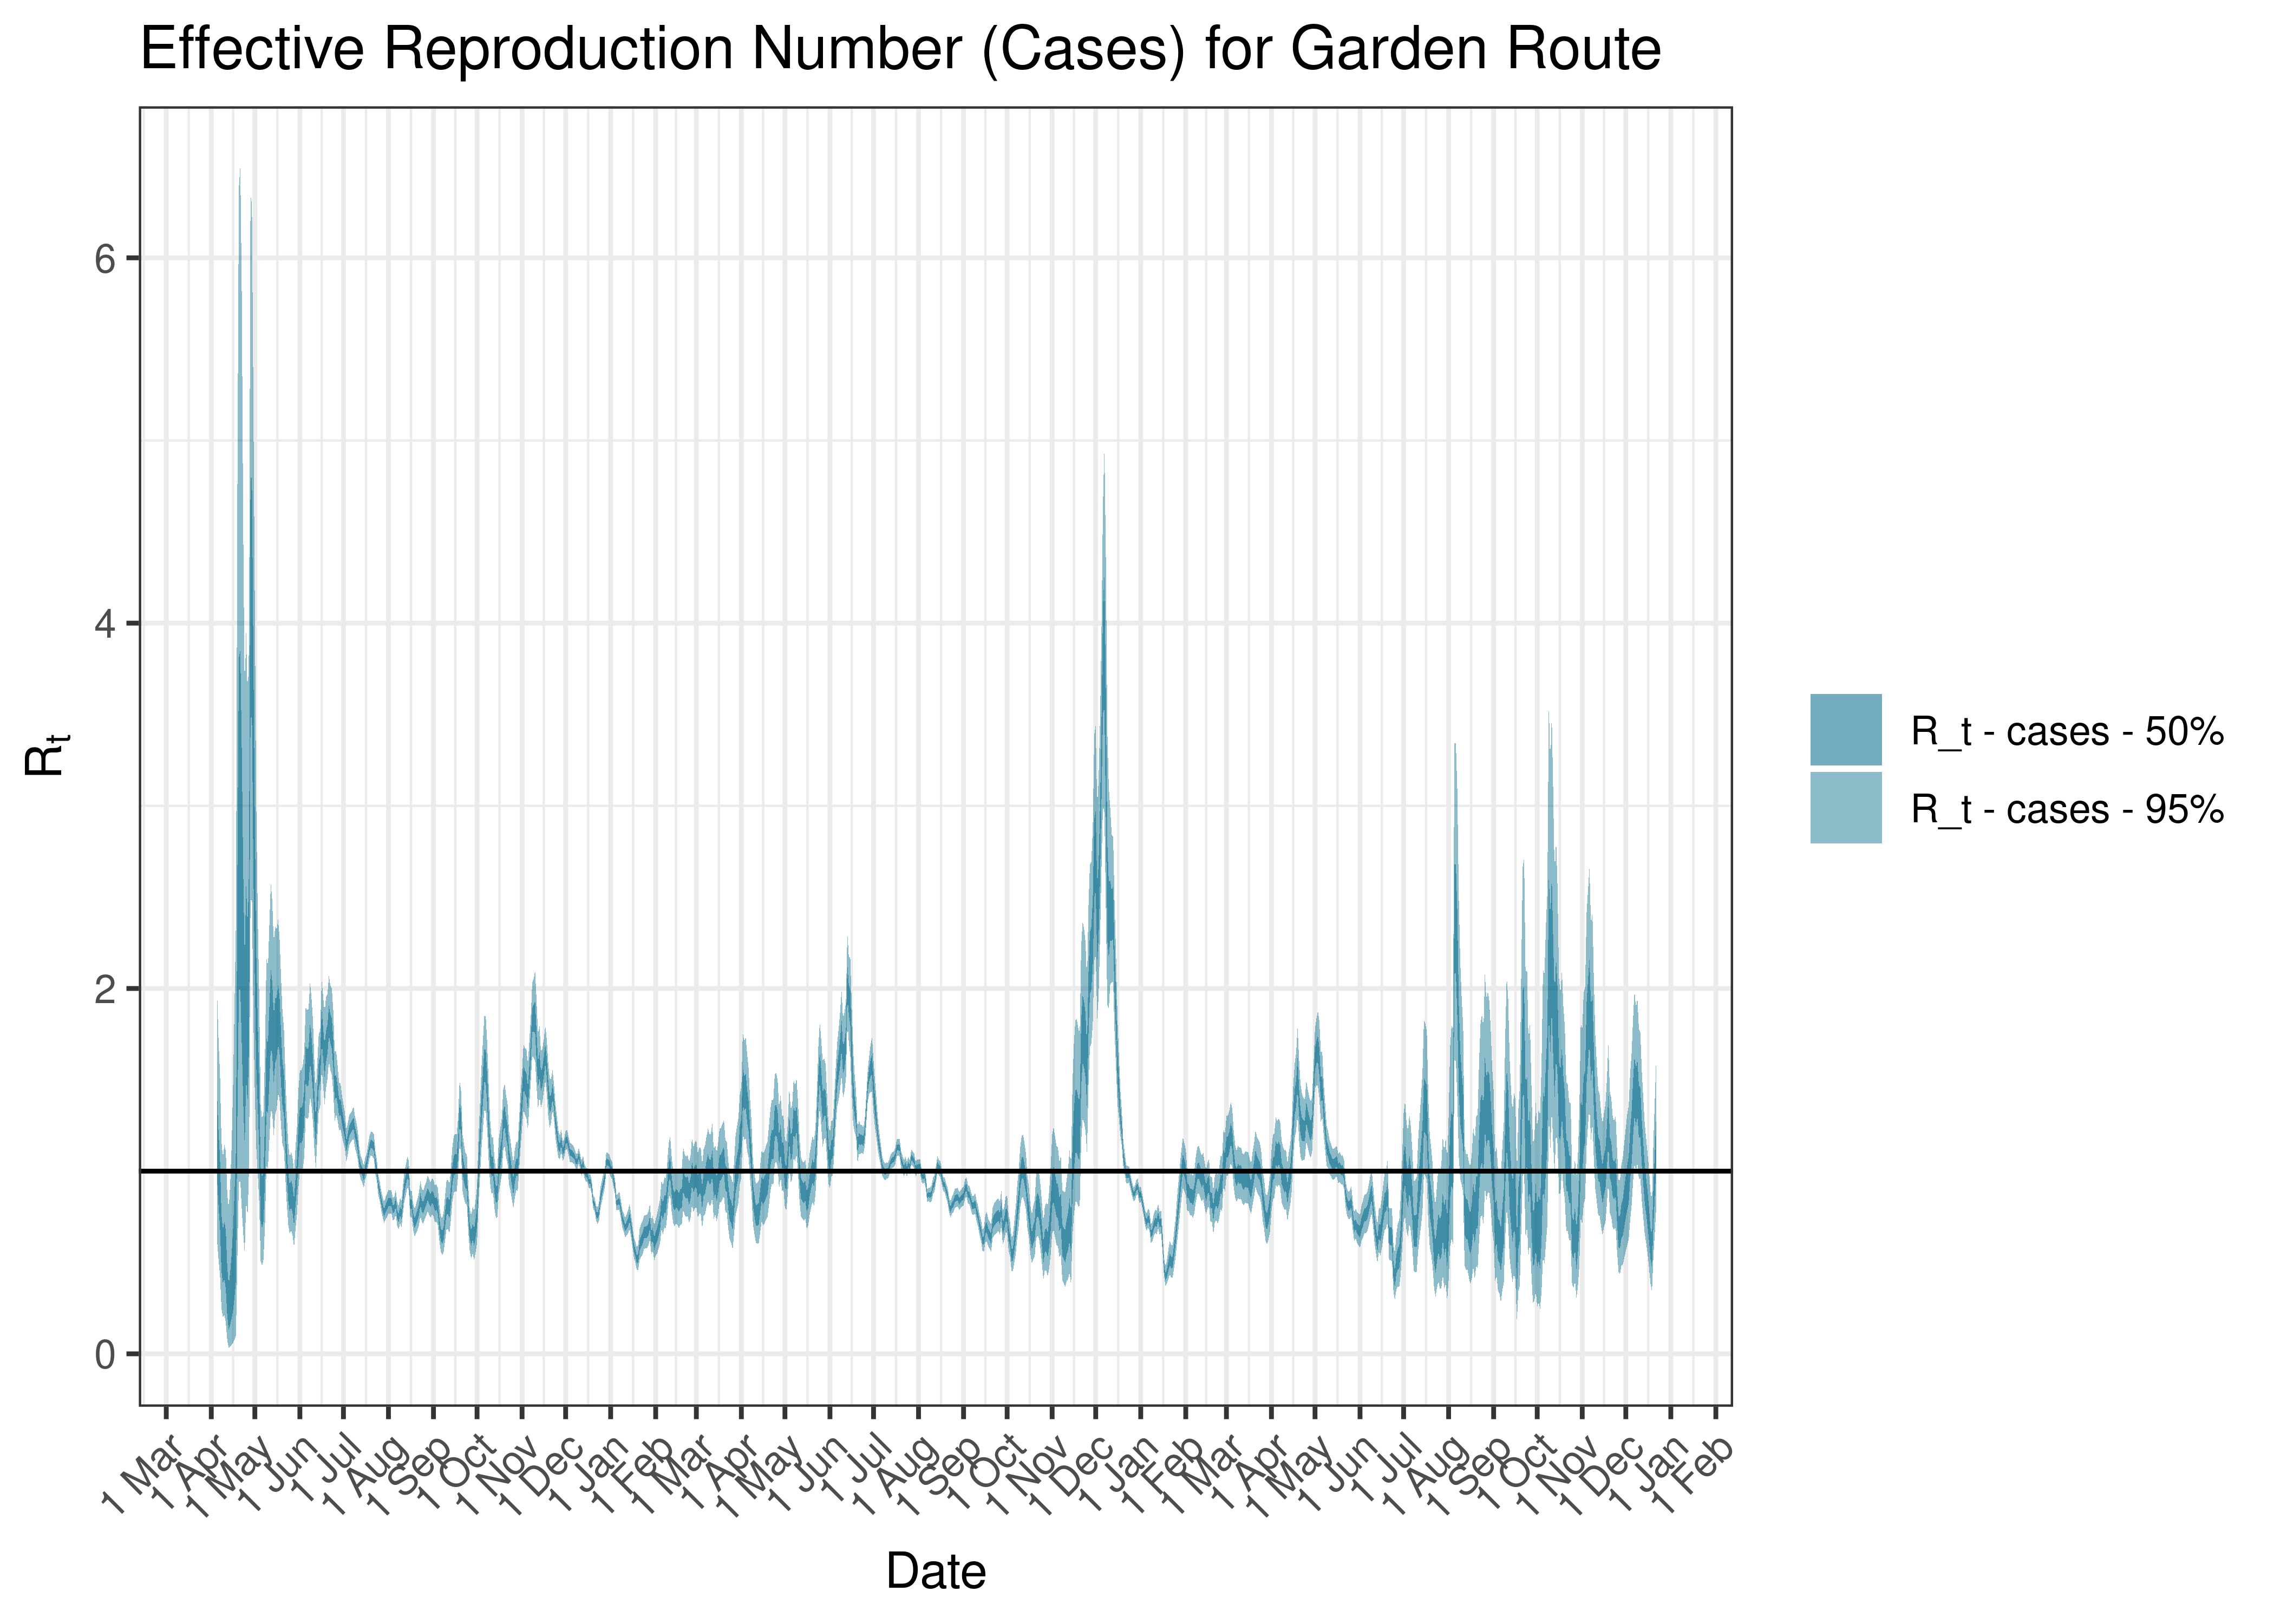
Estimated Effective Reproduction Number Based on Cases for Garden Route since 1 April 2020
6.10.12 Overberg
6.10.12.1 Cases
Cases are tabulated by specimen received date below. Cases include estimates for late reporting in recent days as well as adjustments for any public holidays. A centred 7-day moving average is also shown. The peak daily cases in previous waves (as measured by the moving average) is also shown.
| Specimen Received Date | Cases | 7-day Moving Average | Comment |
|---|---|---|---|
| 2020-07-02 | 98 | 75 | Wave 1 Peak |
| 2020-12-31 | 418 | 287 | Wave 2 Peak |
| 2021-08-17 | 253 | 163 | Wave 3 Peak |
| 2021-12-25 | 44 | 145 | Wave 4 Peak |
| 2022-05-14 | 18 | 54 | Wave 5 Peak (to date) |
Below a 7-day moving average daily case count are plotted for Overberg on a log scale since start of the epidemic:
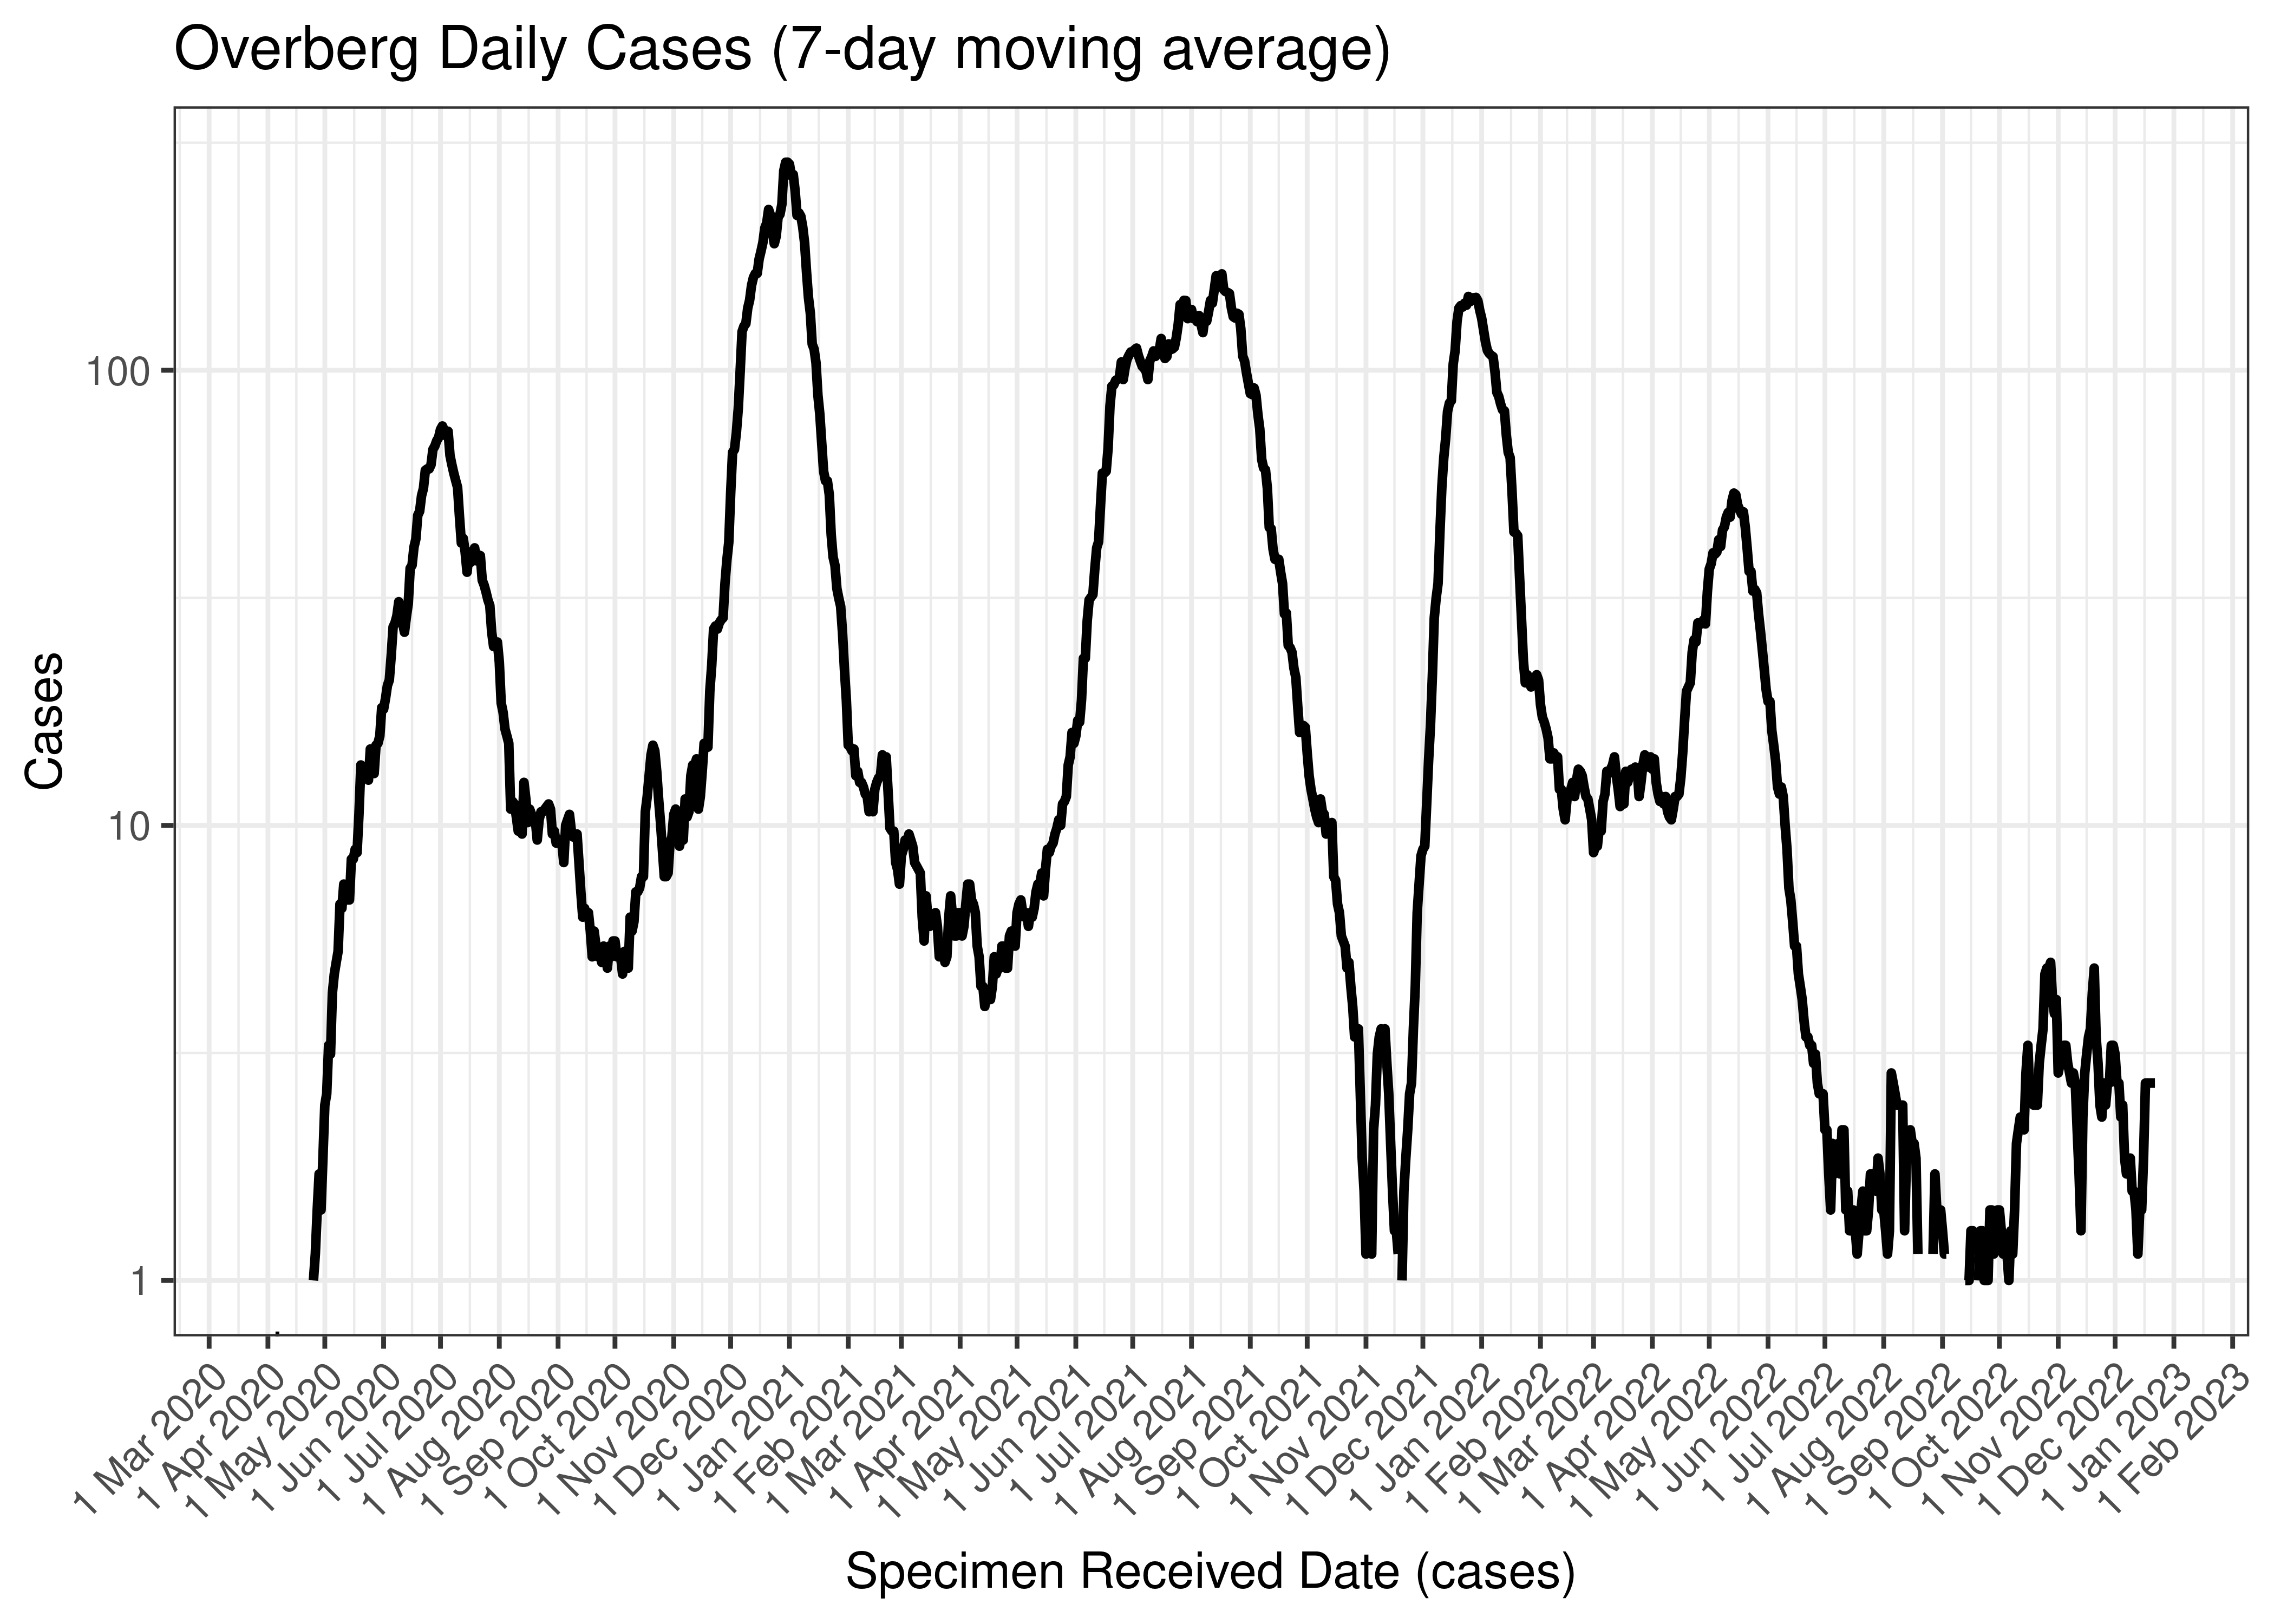
Overberg Daily Cases (7-day moving average)
Below the above chart is repeated for the last 30-days:
Overberg Daily Cases for Last 30-days (7-day moving average)
6.10.12.2 Reproduction Number
Below current (last weekly) reproduction number estimates are tabulated for Overberg.
| Count (Per Day) | Week Ending | Reproduction Number [95% Confidence Interval] | |
|---|---|---|---|
| Overberg | 2.7 | 2022-12-25 | 1.24 [0.75 - 1.86] |
Below the effective reproduction number for Overberg over the last 90 days are plotted together with a plot since start of the pandemic.
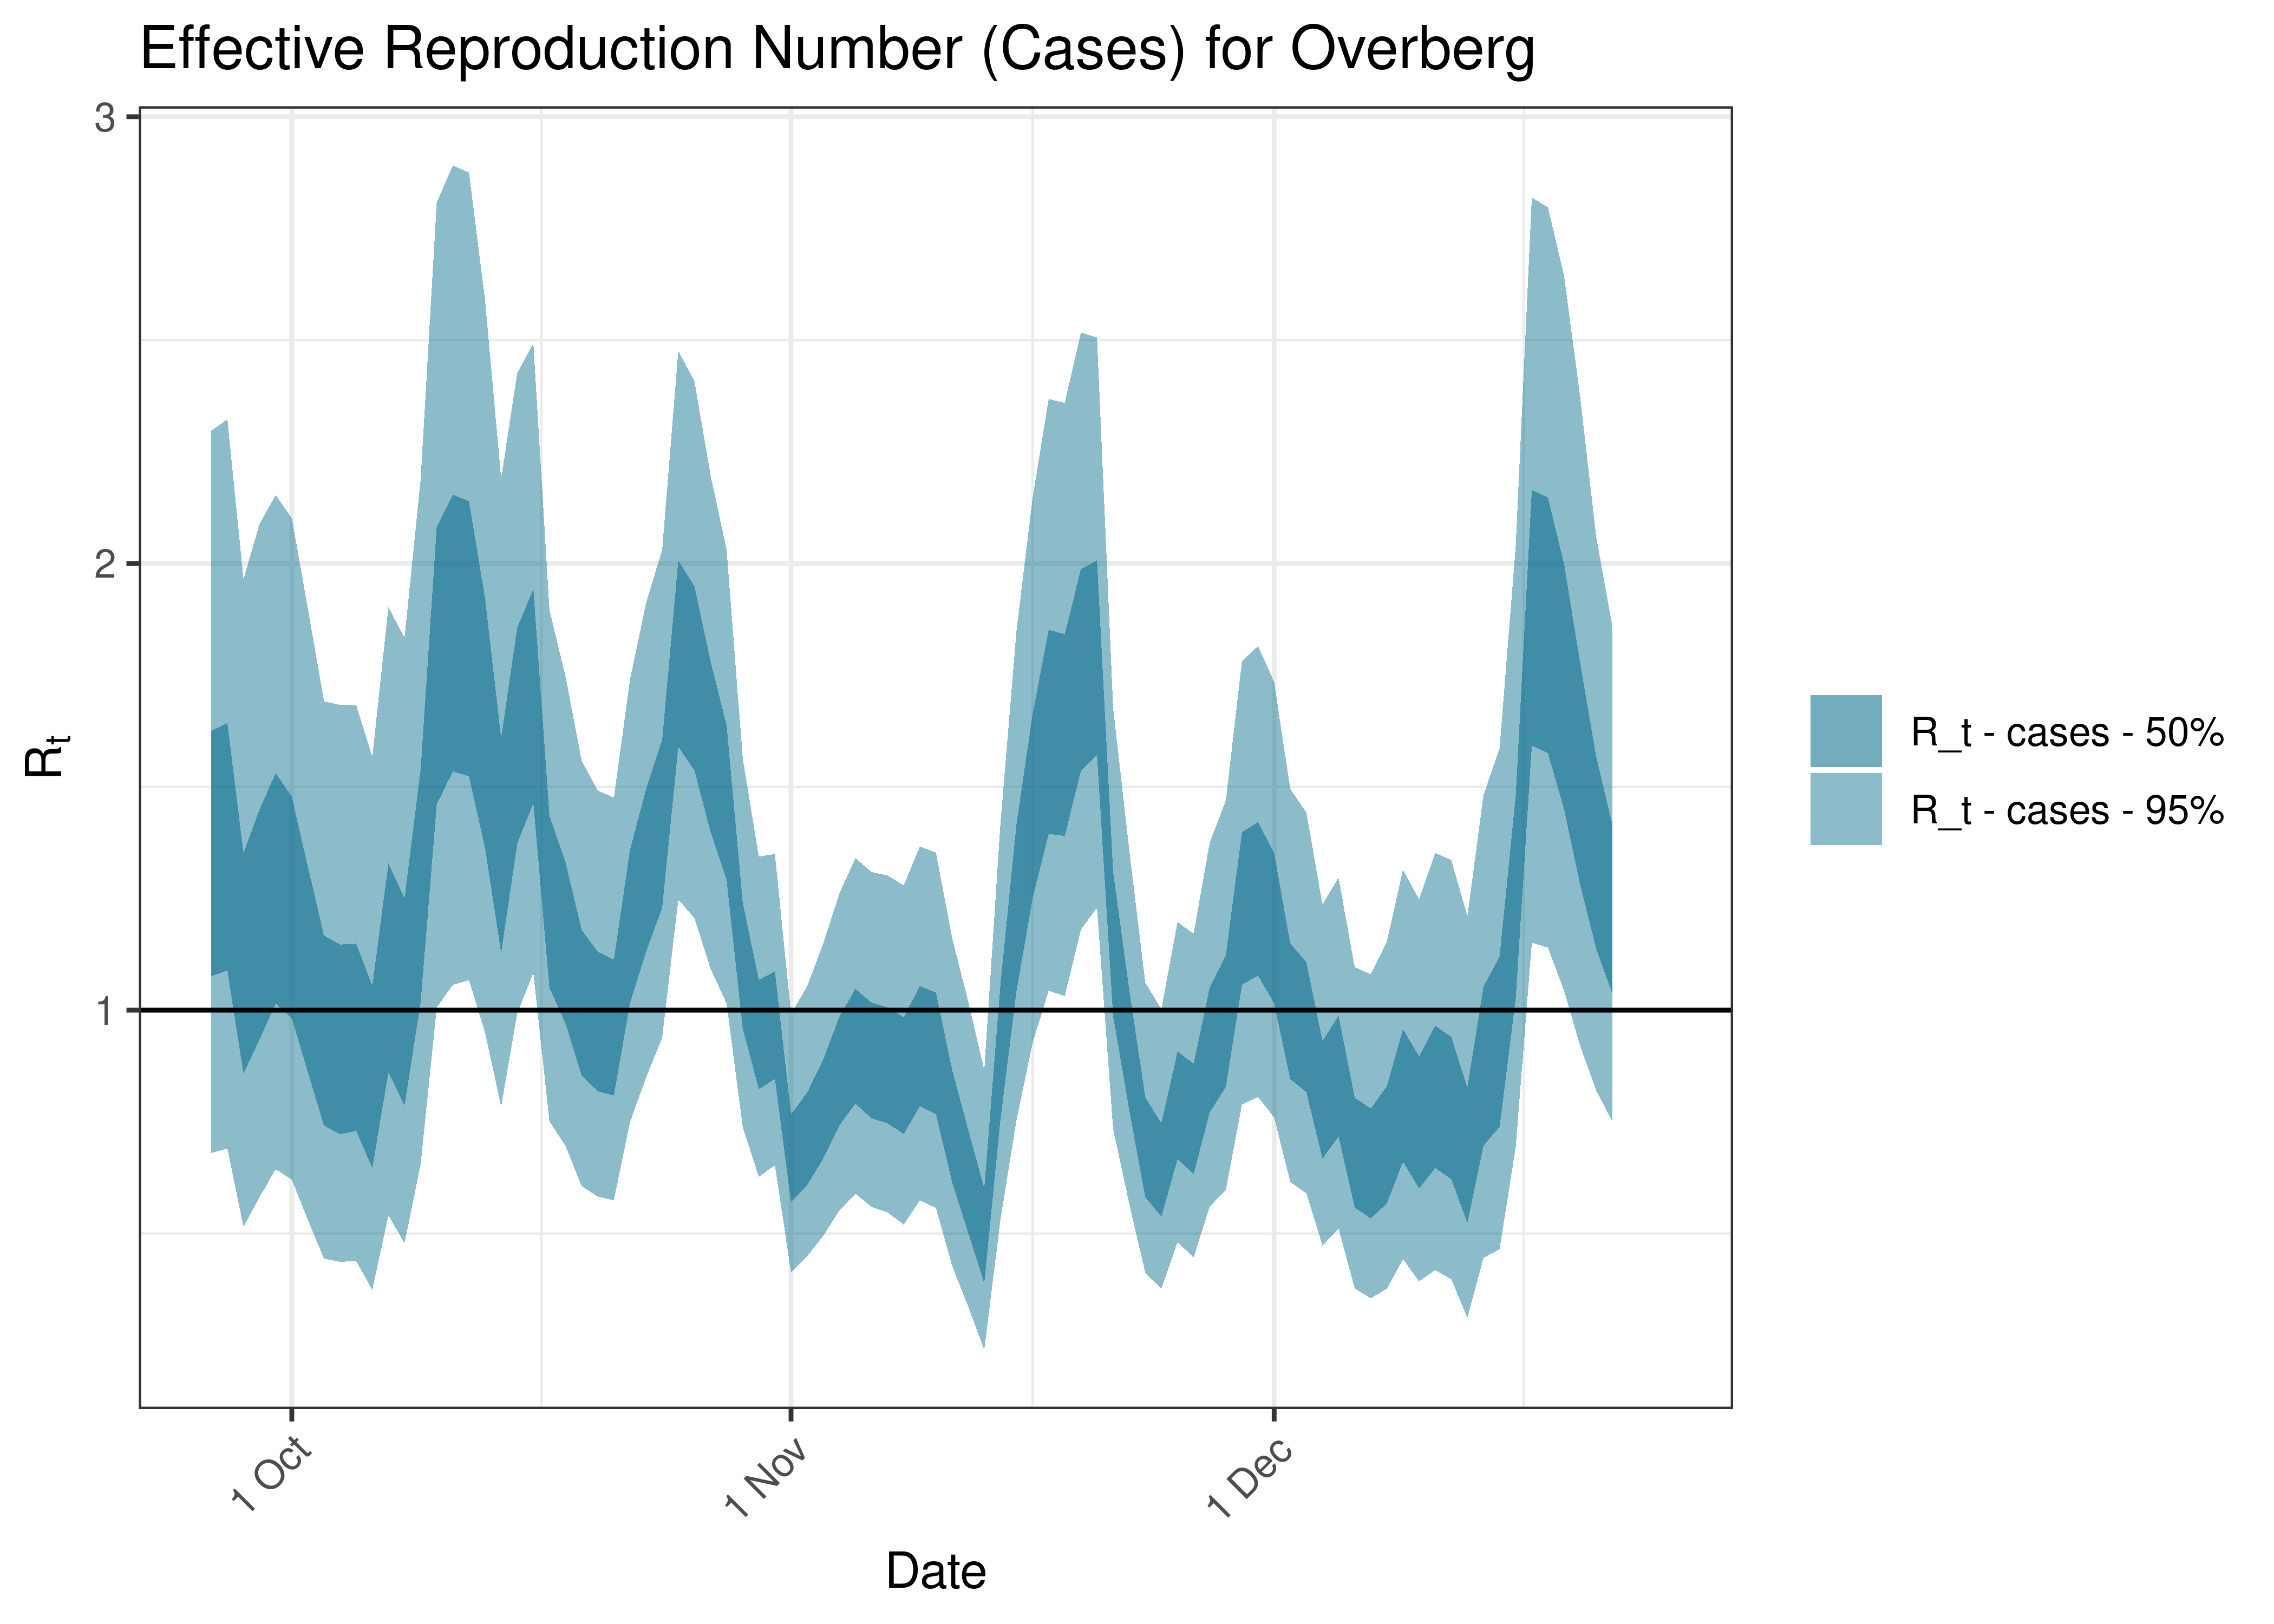
Estimated Effective Reproduction Number Based on Cases for Overberg over last 90 days
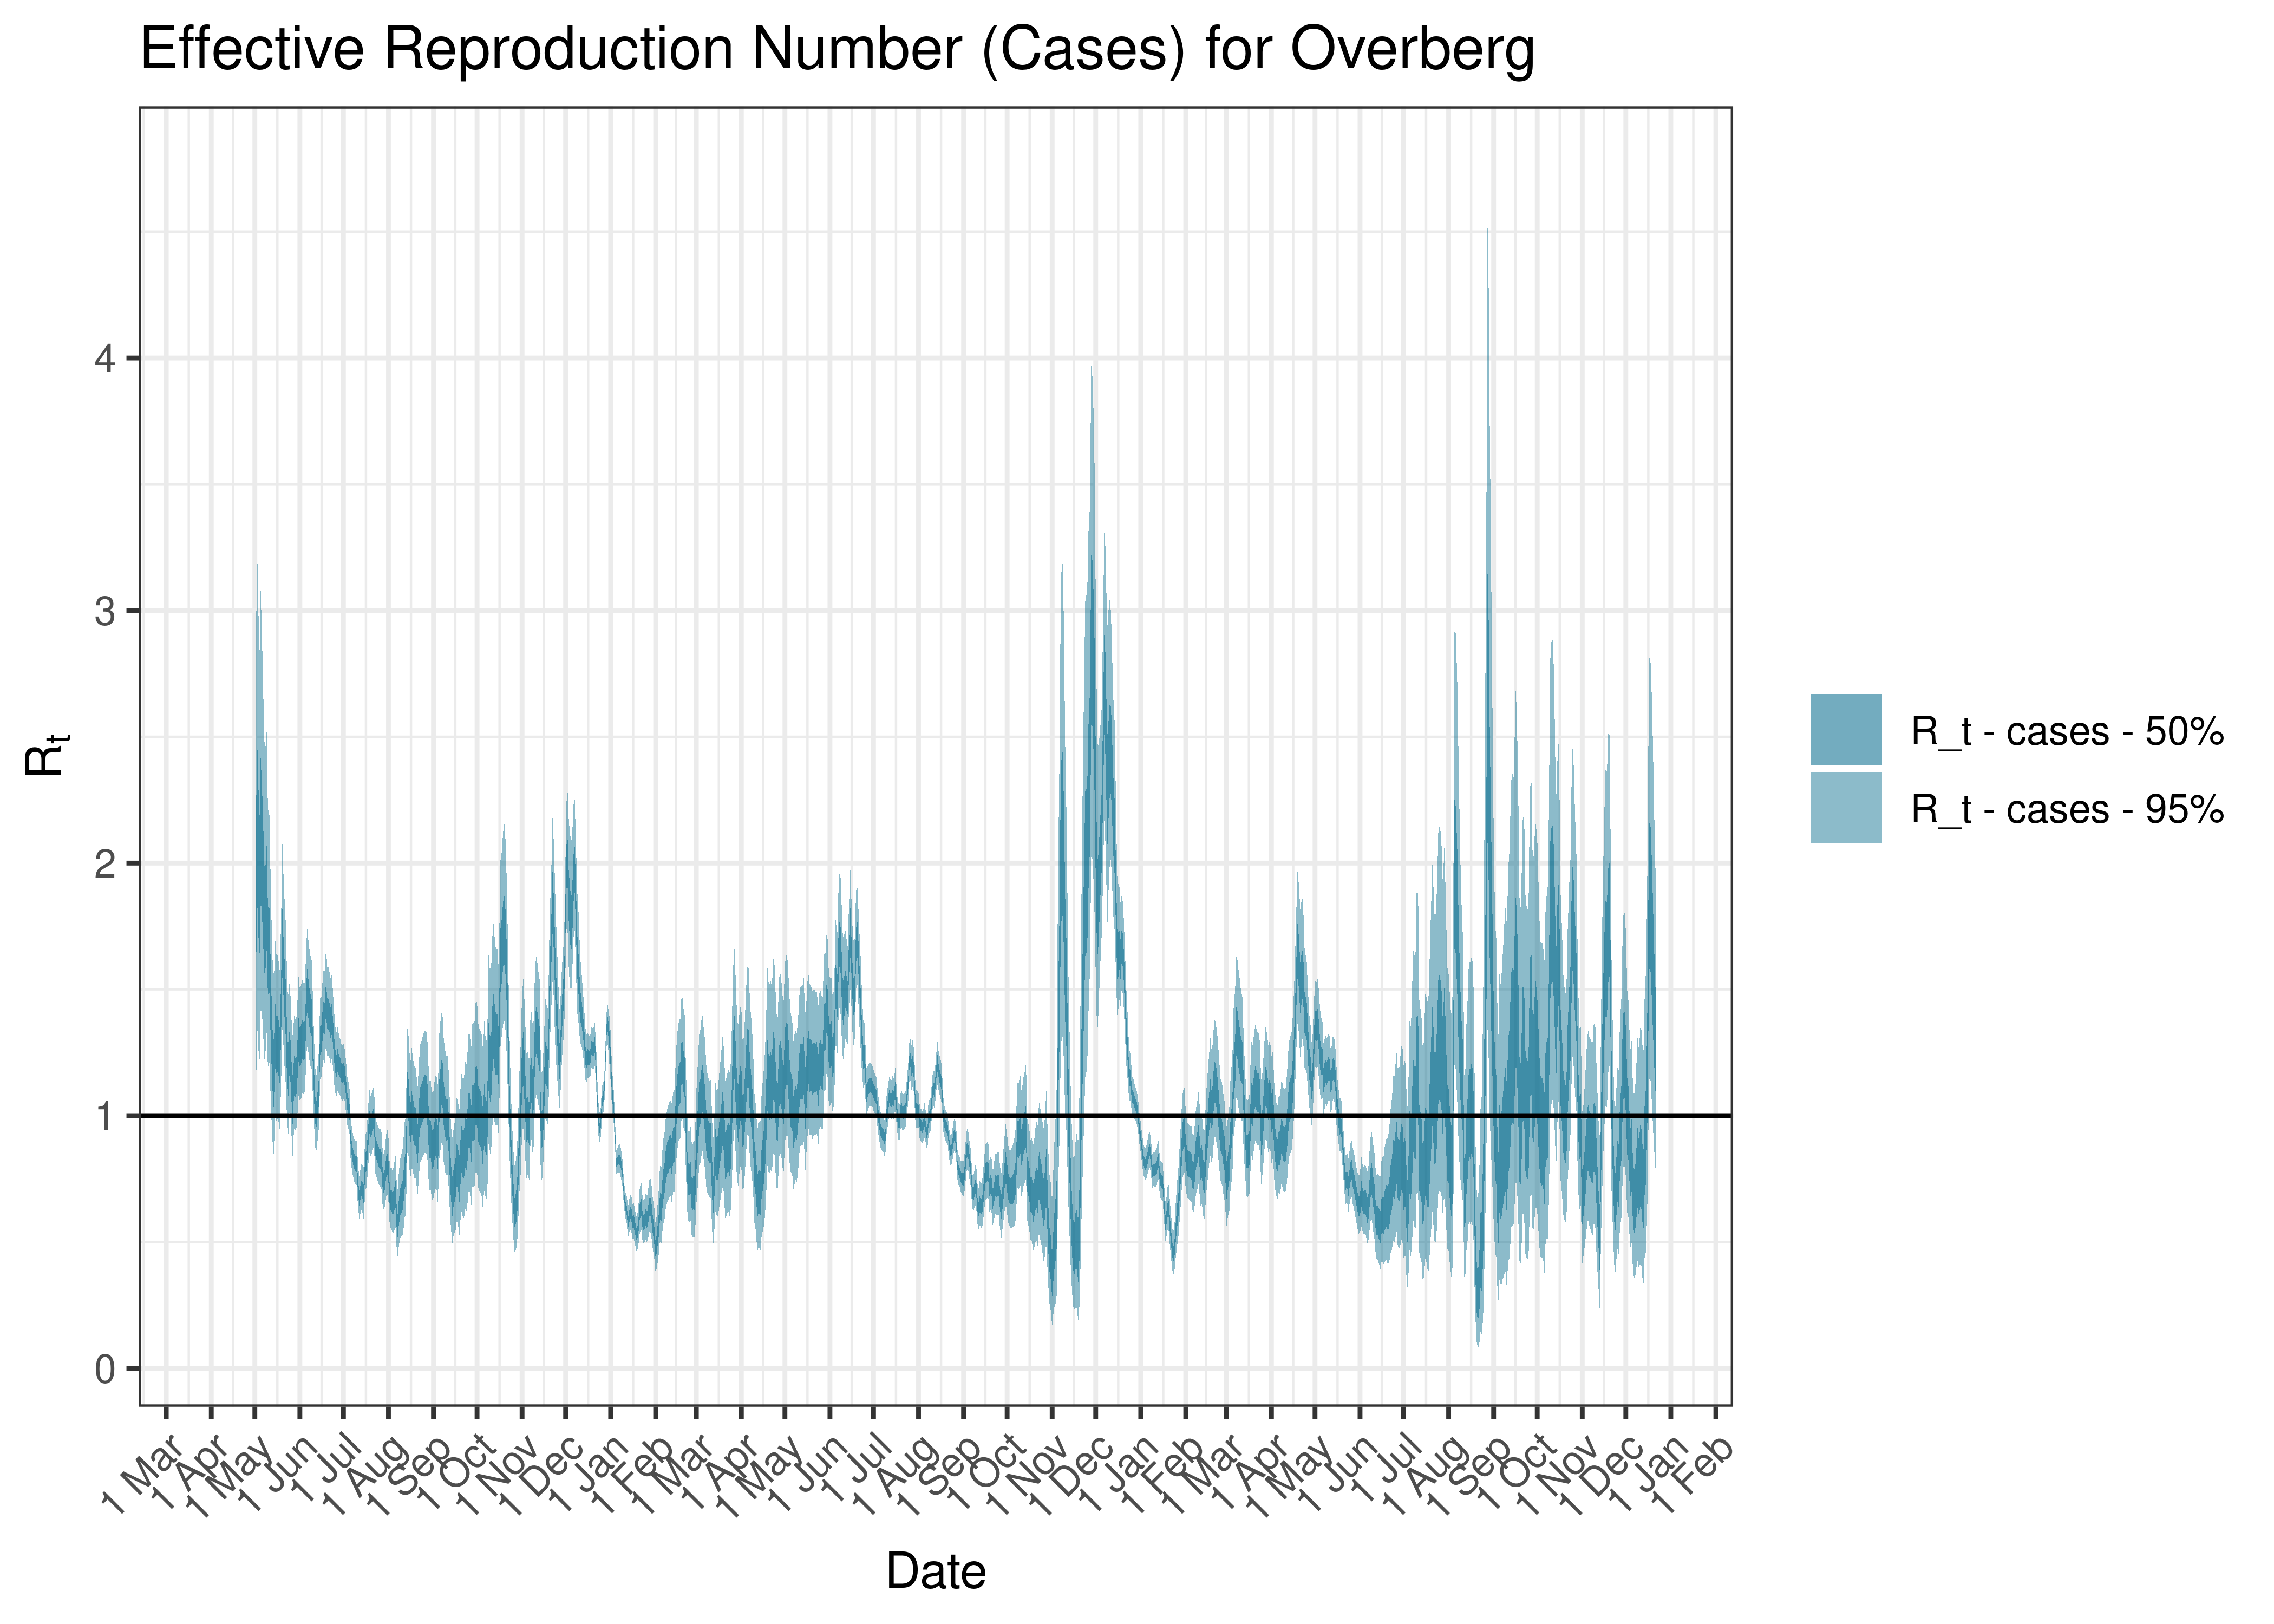
Estimated Effective Reproduction Number Based on Cases for Overberg since 1 April 2020
6.10.13 West Coast
6.10.13.1 Cases
Cases are tabulated by specimen received date below. Cases include estimates for late reporting in recent days as well as adjustments for any public holidays. A centred 7-day moving average is also shown. The peak daily cases in previous waves (as measured by the moving average) is also shown.
| Specimen Received Date | Cases | 7-day Moving Average | Comment |
|---|---|---|---|
| 2020-06-28 | 18 | 69 | Wave 1 Peak |
| 2021-01-04 | 327 | 238 | Wave 2 Peak |
| 2021-08-16 | 327 | 285 | Wave 3 Peak |
| 2022-01-04 | 223 | 144 | Wave 4 Peak |
| 2022-01-05 | 201 | 144 | Wave 4 Peak |
| 2022-05-11 | 77 | 75 | Wave 5 Peak (to date) |
| 2022-05-12 | 84 | 75 | Wave 5 Peak (to date) |
Below a 7-day moving average daily case count are plotted for West Coast on a log scale since start of the epidemic:
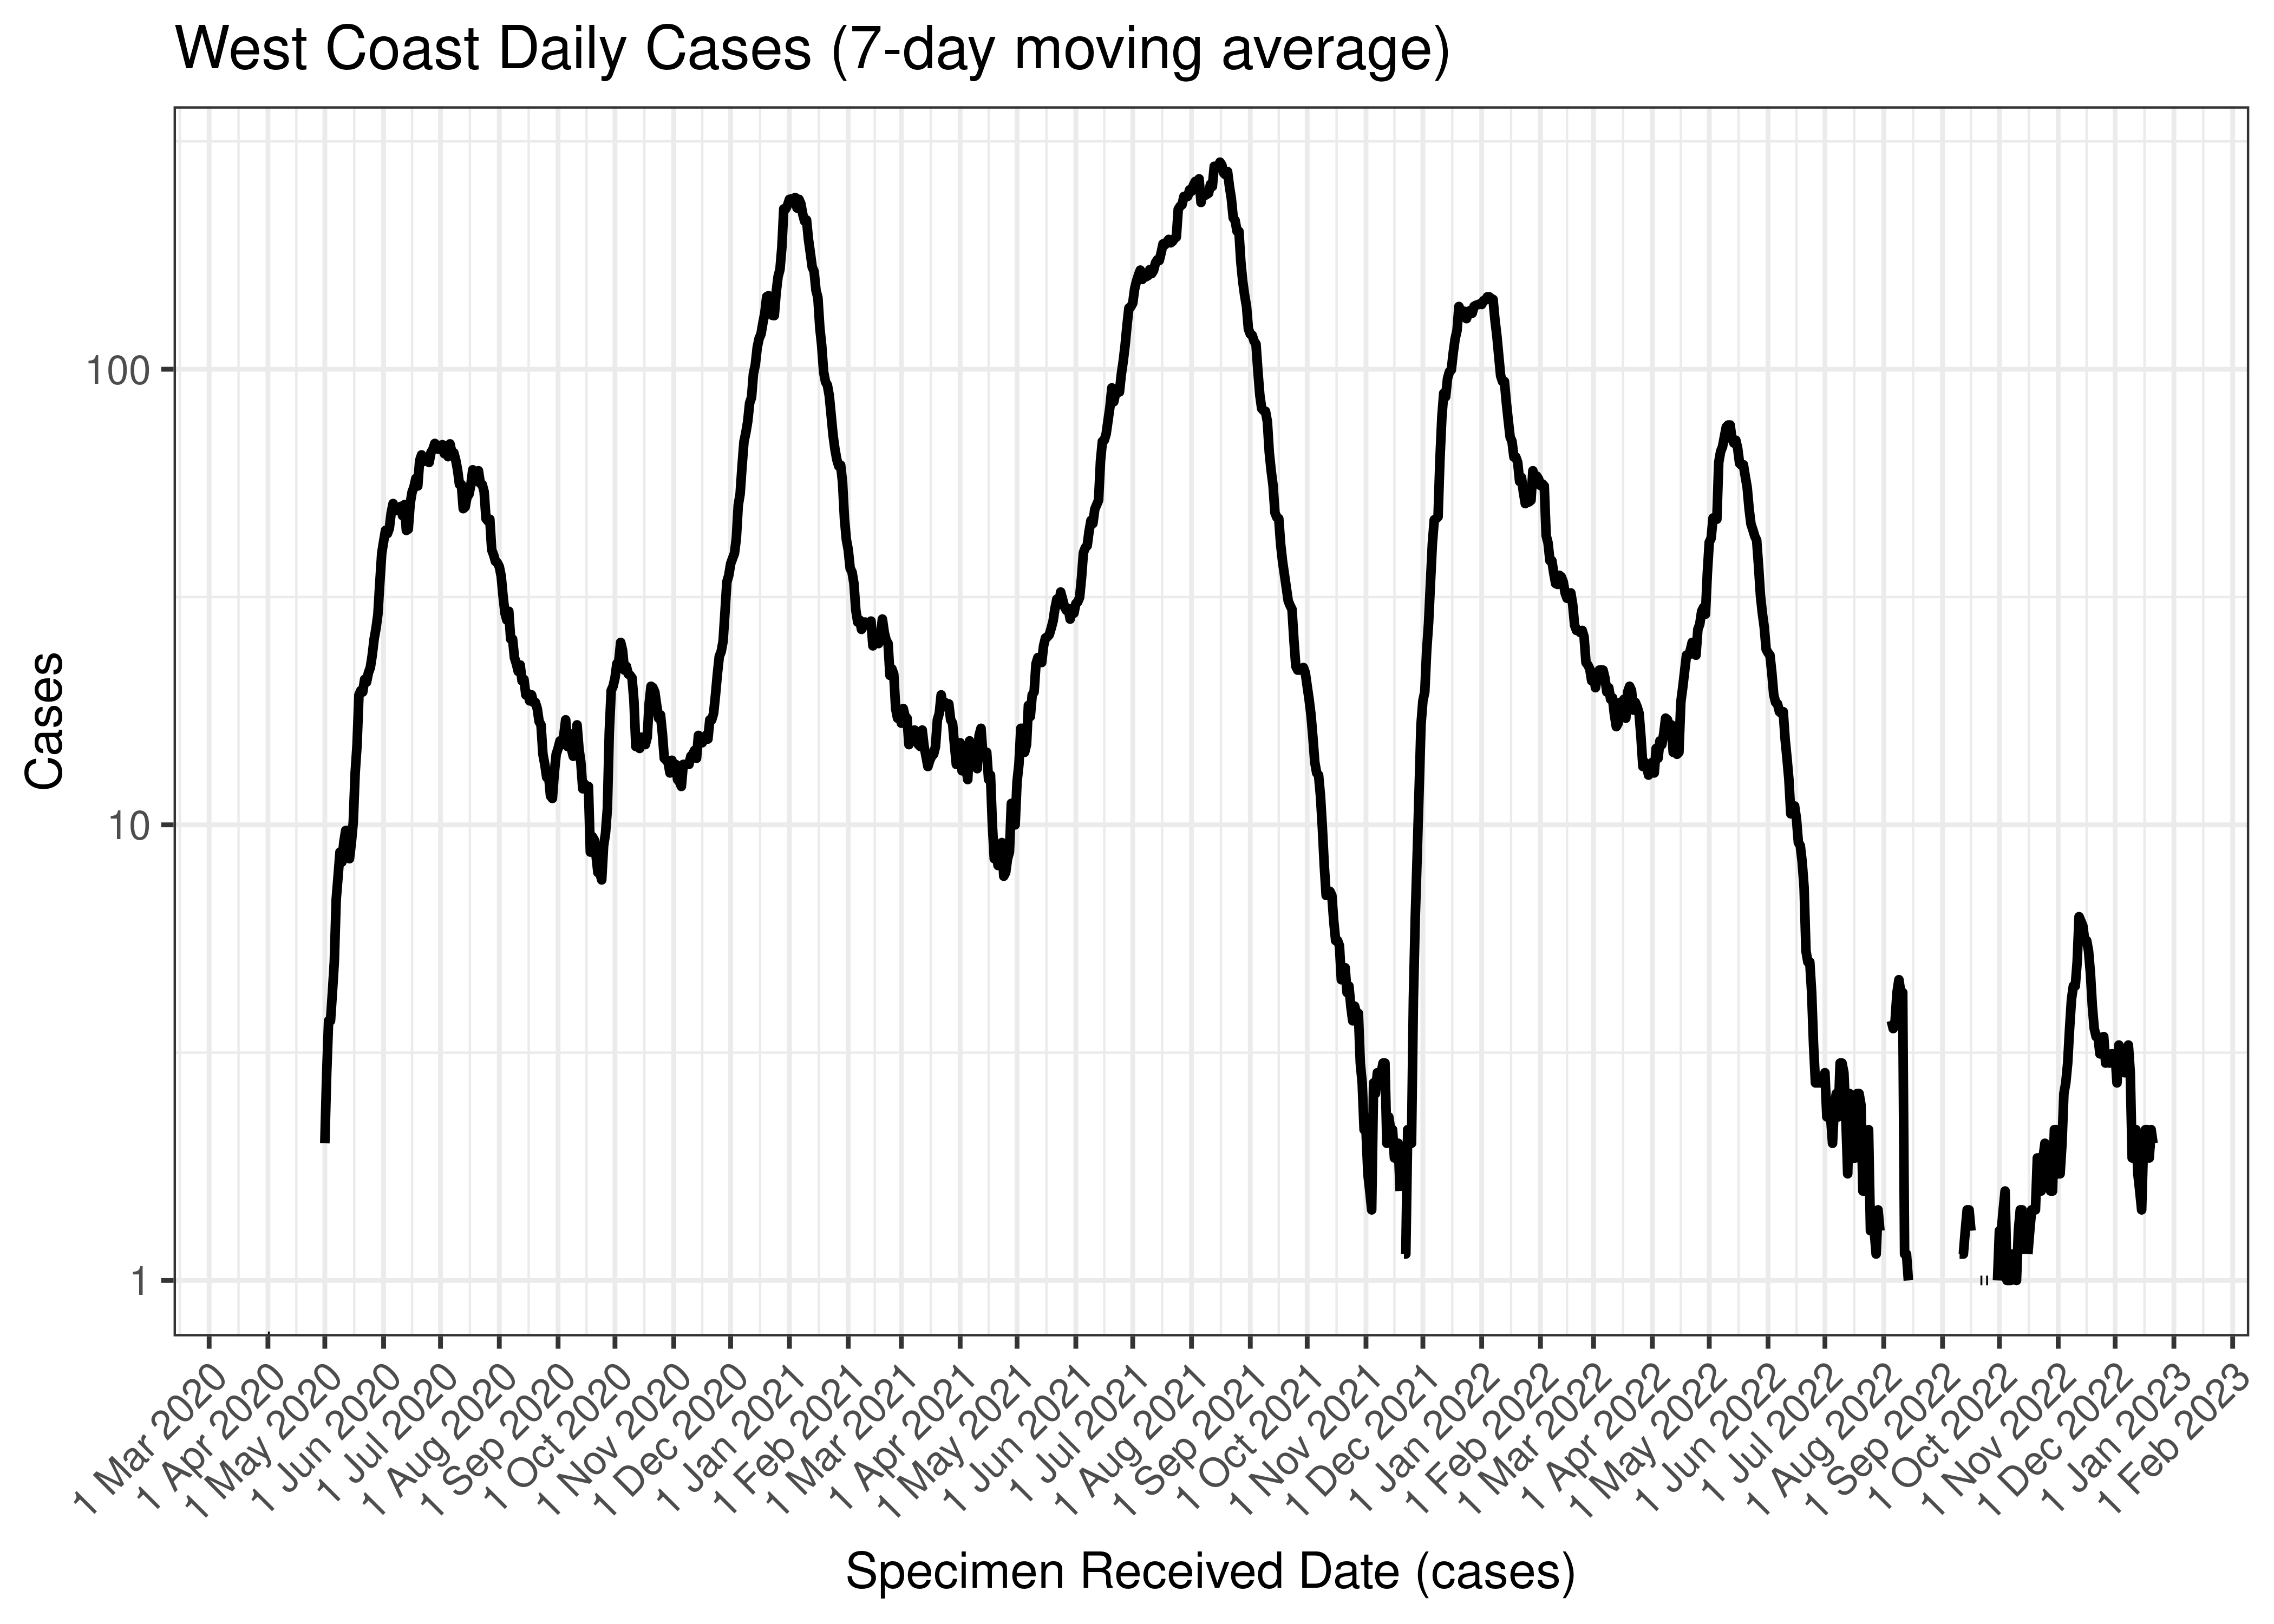
West Coast Daily Cases (7-day moving average)
Below the above chart is repeated for the last 30-days:

West Coast Daily Cases for Last 30-days (7-day moving average)
6.10.13.2 Reproduction Number
Below current (last weekly) reproduction number estimates are tabulated for West Coast.
| Count (Per Day) | Week Ending | Reproduction Number [95% Confidence Interval] | |
|---|---|---|---|
| West Coast | 2 | 2022-12-25 | 1.07 [0.60 - 1.68] |
Below the effective reproduction number for West Coast over the last 90 days are plotted together with a plot since start of the pandemic.
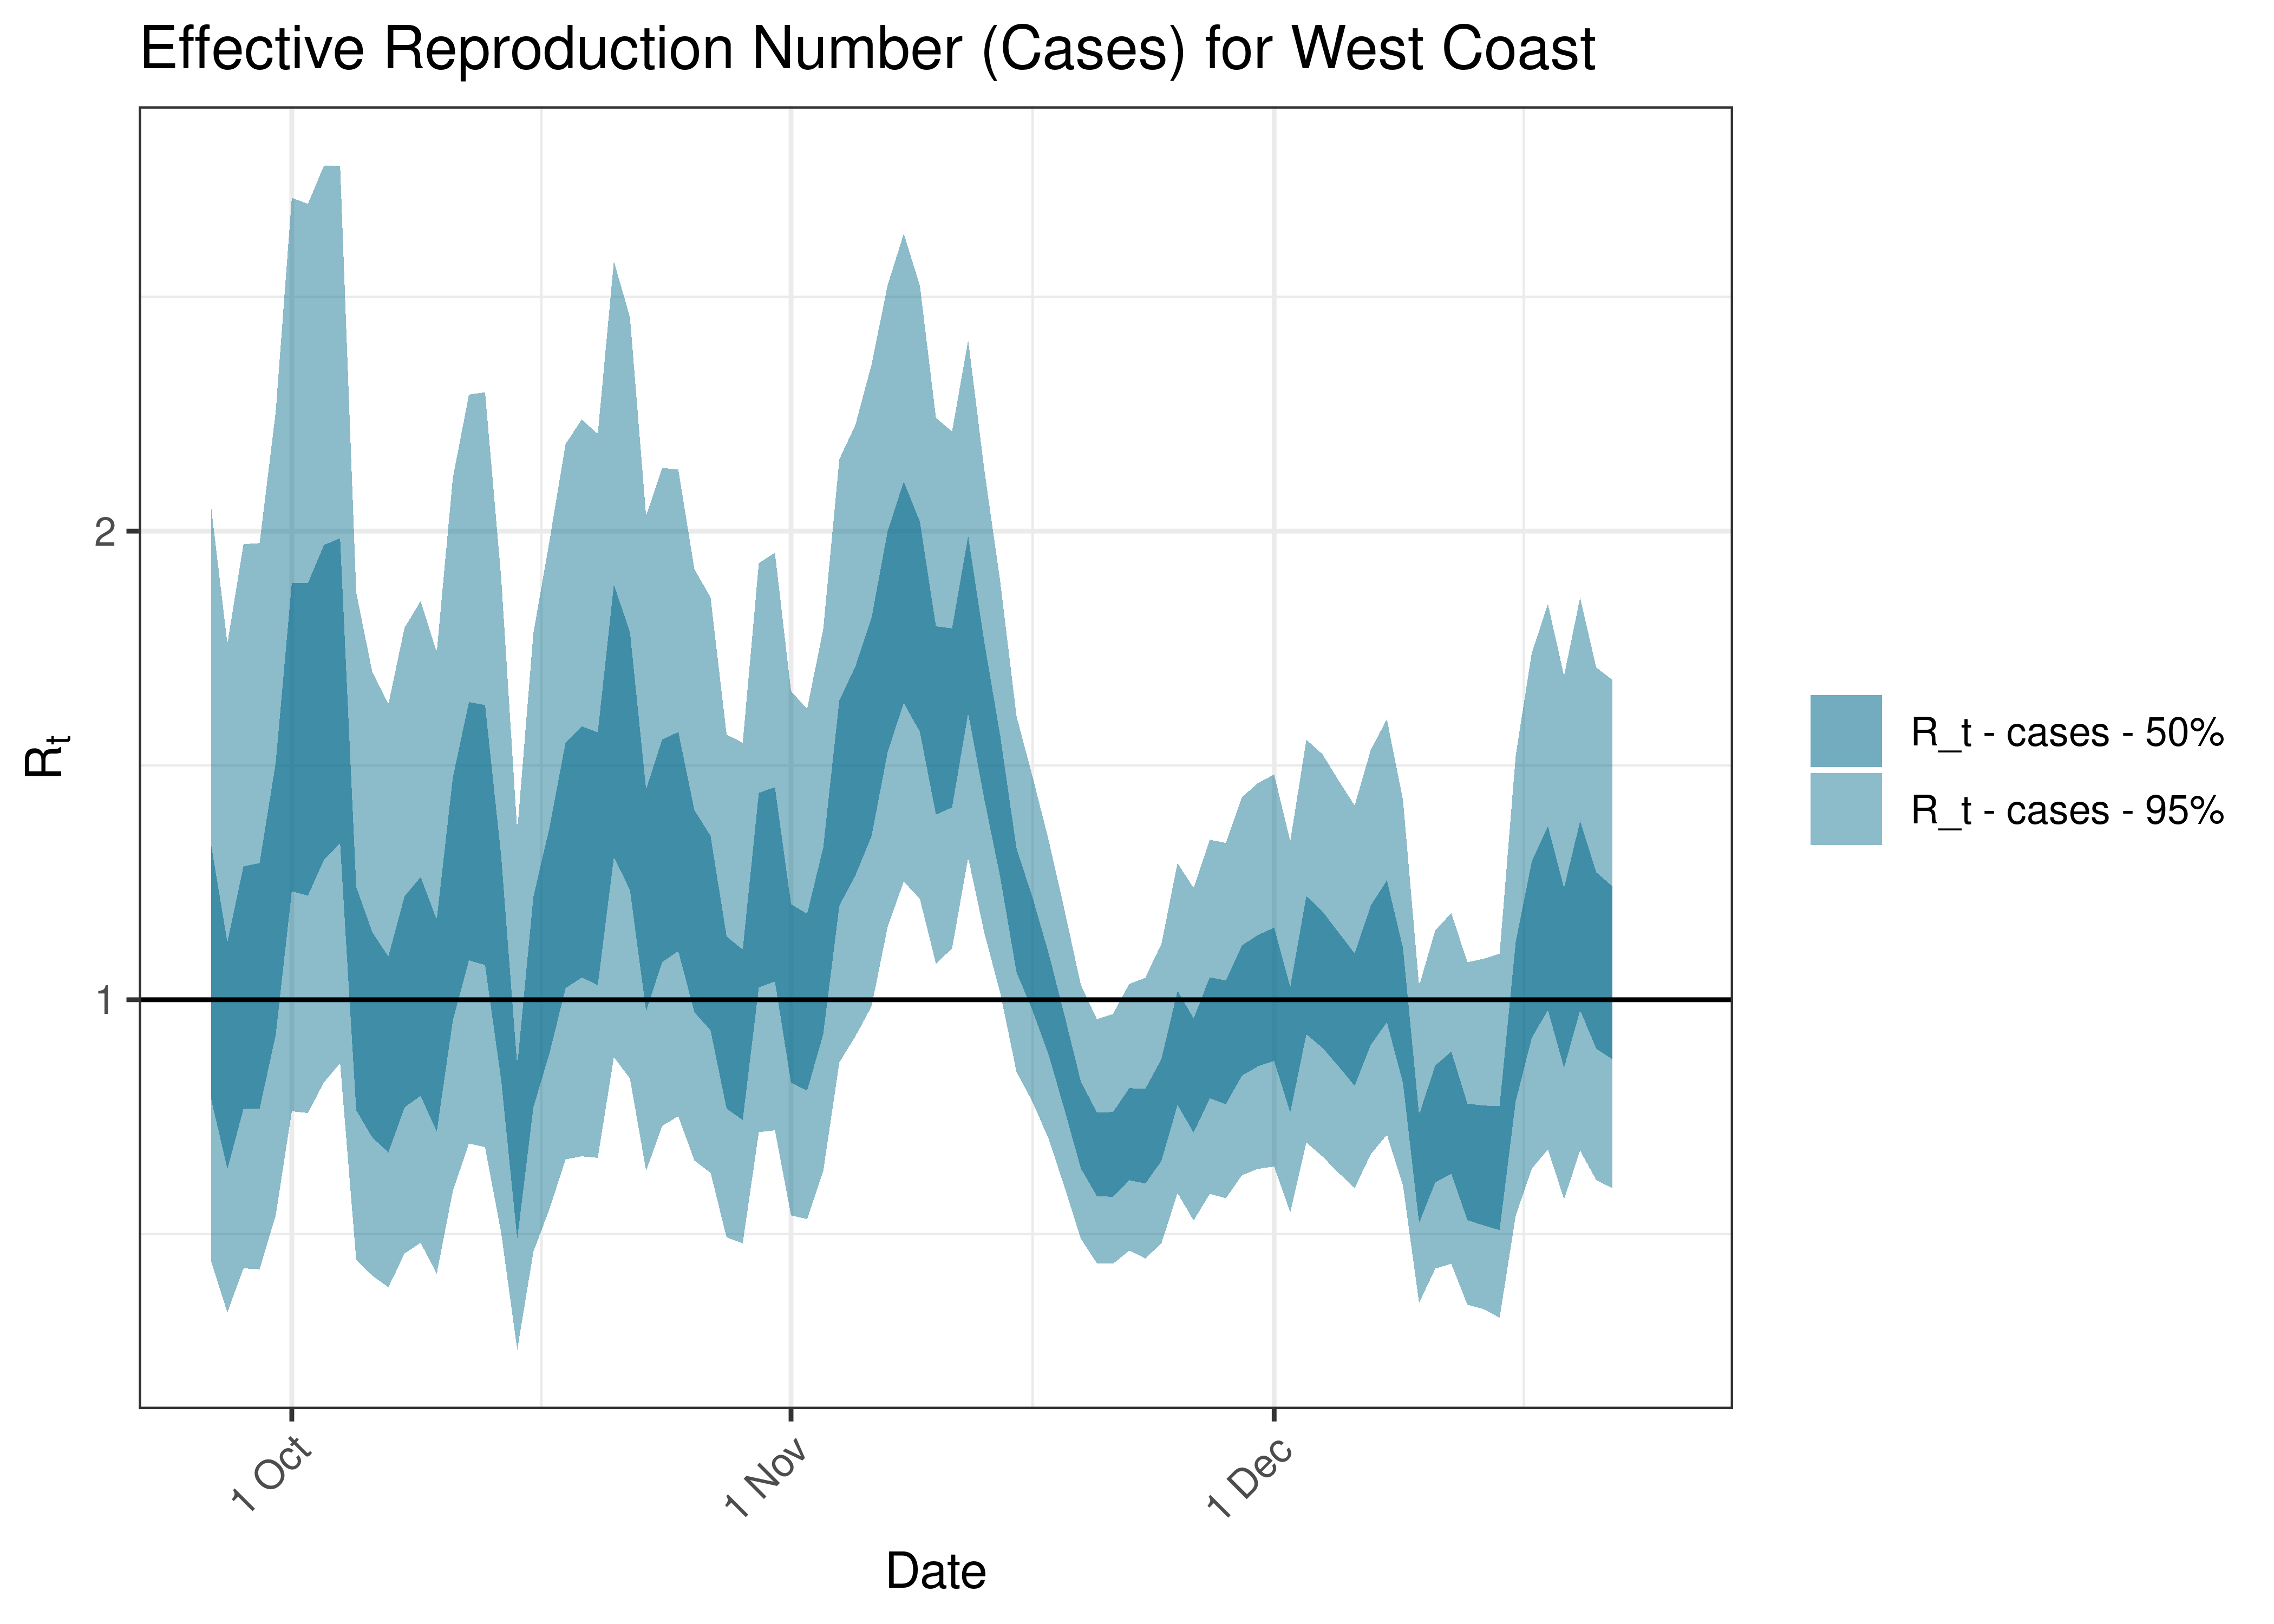
Estimated Effective Reproduction Number Based on Cases for West Coast over last 90 days
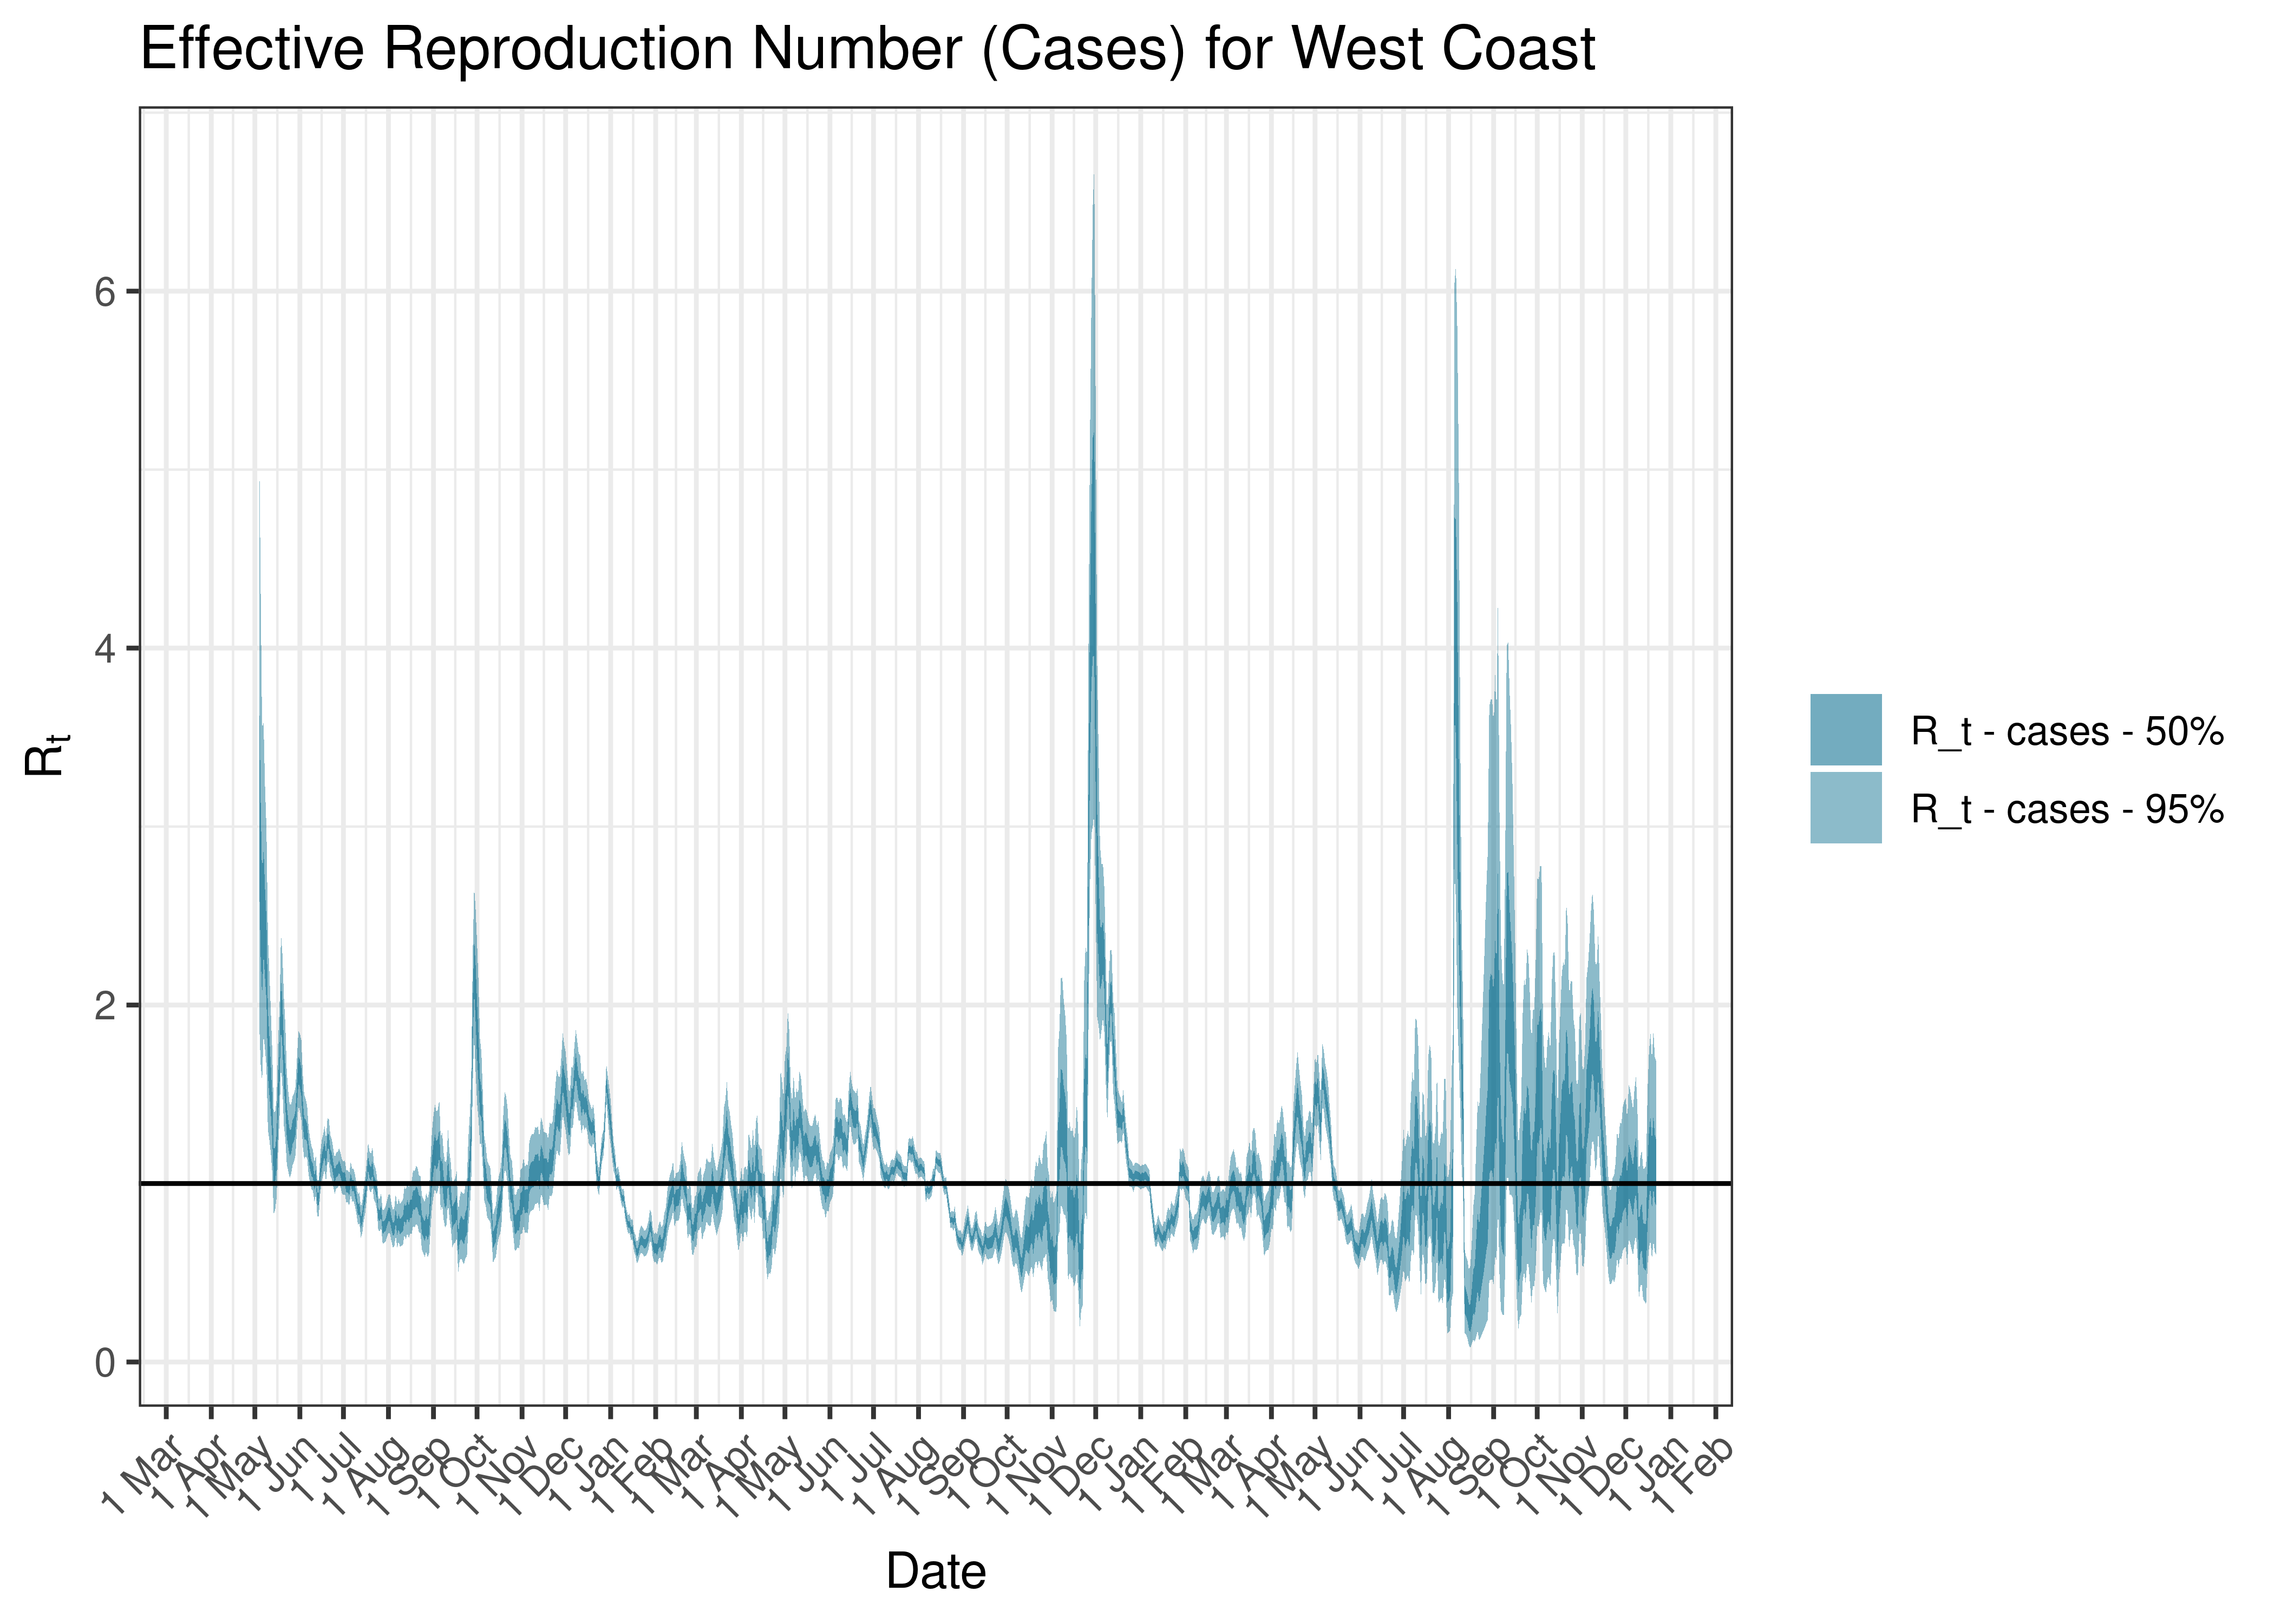
Estimated Effective Reproduction Number Based on Cases for West Coast since 1 April 2020
6.11 Detailed Results
Detailed output for all provinces are saved to a comma-separated value file. The file can be found here.
7 Discussion
Limitation of this method to estimated reproduction number are noted in [1]:
- It’s sensitive to changes in transmissibility, changes in contact patterns, depletion of the susceptible population and control measures.
- It relies on an assumed generation interval assumptions.
- The size of the time window can affect the volatility of results.
- Results are time lagged with regards to true infection.
- It’s sensitive to changes in case detection.
- The generation interval may change over time.
- Hospital admissions and hospital deaths are by date of reporting and not date of admission or date of death.
- Hospital deaths (and to some extent admissions) are reported inconsistently. Some provinces have batched reporting with unpredictable delays.
- Hospital deaths only reflect a fraction of COVID-19 deaths in South Africa.
- Crude ratios calculated do not account for timing accurately.
For example the the generation interval is based on international data and not South African data.
Further to the above the estimates are made under assumption that the cases are detected at a similar ratio to the underlying infections over time. Should this change rapidly over an interval of a few weeks the above estimates of the effective reproduction numbers would be biased. For example a rapid expansion of case detection could result in an overestimating recent effective reproduction numbers. A more practical example may be a public holiday resulting in fewer specimens received on a particular day. Or, also, changes in testing, such as using more antigen tests (with lower sensitivity) relative to PCR tests could reduce the case ascertainment rate per test for example.
A relatively simple allowance is made for public holidays so as to avoid volatile figures due to public holidays. This allowance could be refined further but should result in a more consistent estimate of the reproduction number over time. Care should still be taken when reviewing results during periods where testing could be impacted.
Estimates for the reproduction number here are plotted in time period in which the specimen was received. Ideally we would wish to capture the date the infection occurred. These figures have not been shifted back, even approximately, to the date of infection.
Many if the district municipalities may have limited cases at any particular point in time and hence reproduction numbers estimated for these may be wide. Care should be taken where confidence intervals are wide.
Despite these limitation it is believed that the ease of calculation of this method and the ability to use multiple sources makes it useful as a monitoring tool.
8 Comparison with other estimates
In [9] similar estimate of the reproduction number are made. The main differences from those estimates are:
- The estimates [9] in are based on (estimated) date of symptom onset and should, in theory, be less susceptible to issues around testing (such as public holidays for example) than basing it on specimen received date. However, it may be difficult to obtain accurate symptom onset date.
- Similarly estimates are also made based on admissions and deaths in [9]. It’s very useful to look at estimates based on multiple end points, but in this case these require data sources not accessible to the public.
- The assumed generation interval assumptions are not exactly the same, but are reasonably similar.